Abstract
The study presents an analysis of steel-Ultra-High Performance Concrete (UHPC) composite girders. Five composite girder specimens were designed and tested. Analytical strain solutions for the composite girders under asymmetric axial loading were derived using the energy variation method. Results indicate that asymmetric axial forces significantly exacerbate the shear lag effect. Decreasing the width-to-span ratio reduces the shear lag coefficient, while reducing the width-to-depth ratio increases it. The parametric analysis indicates that, under asymmetric axial loading, increasing the strength of the concrete is an effective method to reduce the shear lag effect of the composite girders. Increasing the thickness of the UHPC slab proves to be effective in reducing the shear lag effect. Furthermore, the study indicates that when the b2/b1 ratio is less than 1, it has a tiny impact on the shear lag effect; however, when the b2/b1 ratio is greater than 1, the shear lag effect becomes more pronounced with increasing b2/b1. Additionally, the thickness of the flange plate and web plate of the steel girder has no significant effect on the shear lag effect. The results of the analysis can provide references for similar designs and constructions of composite structures.
1. Introduction
Cable-stayed bridges dominate long-span bridge construction due to their superior structural performance, exceptional spanning capacity, and significant economic advantages. Steel-concrete composite girder cable-stayed bridges, as an innovative structural system, successfully address key technical challenges such as the span limitations imposed by the heavy self-weight of concrete cable-stayed bridges and fatigue cracking in orthotropic decks of steel cable-stayed bridges [1,2]. However, conventional composite girders still face development constraints due to their substantial self-weight [3]. Steel-UHPC composite girder cable-stayed bridges, utilizing UHPC decks with thicknesses reduced to approximately 50% of conventional concrete decks, achieve significant optimization of structural self-weight [4]. Field measurements confirm that this lightweight design not only enhances structural performance but also enables breakthrough improvements in spanning capacity. Notably, as China’s transportation infrastructure evolves towards multi-lane wide decks, research into the shear lag mechanism in steel-UHPC composite girder cable-stayed bridges has become a critical scientific issue impacting engineering safety.
Cable-stayed bridges are typically constructed using the cantilever erection method, where girder segments are symmetrically or asymmetrically assembled progressively from the pylon(s), accompanied by synchronized cable tensioning. During double-cantilever construction, the main girder is subjected to complex compressive-flexural stresses induced by combined loads, including self-weight and cable anchor forces. Crucially, asymmetric cable tensioning sequences may be employed during construction. Even with symmetric tensioning plans, factors such as construction tolerances, material property variability, and environmental influences make it difficult to ensure perfectly symmetric cable forces on both sides. This asymmetric cable force readily induces significant shear lag effects in the main girder during construction, potentially compromising its structural behavior and construction safety. Furthermore, the load transfer path for cable anchor forces in steel-UHPC composite girders is complex: forces are transferred from anchor plates to steel longitudinal girders, crossbeams, and stringers, then via shear connectors on their respective flanges to the UHPC deck slab. This intricate mechanism leads to non-uniform longitudinal stress distribution across the UHPC deck width, potentially causing cracking and jeopardizing overall structural safety. Therefore, analyzing the shear lag effect in steel-UHPC composite girders during the construction phase holds significant theoretical value and practical engineering importance.
Current UHPC deck forms in composite bridges mainly include flat slabs, waffle/ribbed slabs, and steel-UHPC composite slabs. Chen et al. [5] employed steel-UHPC composite girders in the design of the main bridge of the Chongqing Daxi River Bridge, a double-tower, double-cable-plane composite cable-stayed bridge with a span arrangement of (92 + 168 + 650 + 168 + 92) m. UHPC was used for the 36 precast panels at mid-span and all cast-in-place wet joints, while C60 concrete was used elsewhere. Cao et al. [6] conducted static flexural tests on UHPC flat slabs based on a hybrid composite cable-stayed bridge exceeding 1000 m. The deck model measured 3.8 m (length) × 1.0 m (width) × 0.17 m (thickness). Their tests and analysis determined the cracking moment and yield moment of the tensile reinforcement in UHPC slabs, providing valuable references for practical bridge design and application. Li et al. [7] investigated the application of UHPC in the Zhanlin Yellow River Super Large Bridge on the Shandong Zhanlin Expressway. This cable-stayed bridge, with a main span of 442 m, utilized a 17 cm thick UHPC deck. Global finite element analysis demonstrated that employing a support displacement construction method effectively reduced or eliminated negative bending moments in the composite girder at auxiliary piers compared to conventional methods, improving structural behavior in negative moment regions, with successful field application. Li et al. [8] studied a novel composite deck system for the Guangdong Foshan Fulong West River Bridge, featuring steel-UHPC composite girders. The deck consisted of a steel plate + PBL shear connectors + UHPC layer (8 mm steel plate, 22 mm diameter PBL keys @ 80 mm spacing, 15 cm UHPC). Their research clarified the structural performance under negative bending moments, showing a nominal cracking strength exceeding 8.9 MPa for the UHPC layer, far greater than the maximum longitudinal tensile stress under design loads, satisfying crack resistance requirements. Liao et al. [9], also studying the Foshan Fulong West River Bridge, conducted flexural model tests on wet joints for the steel plate + PBL + UHPC composite deck. The joint featured a dovetail groove (wider externally, narrower internally) and welded lap splices for longitudinal reinforcement. Test results indicated good ductility and stiffness, meeting structural demands. Tan et al. [10] proposed a novel composite deck structure suitable for long-span cable-stayed bridges, comprising an orthotropic steel deck, PBL shear connectors welded to it, and a UHPC layer. Utilizing segmental precast construction, the UHPC layer participates in carrying the dead load of the main girder system. This novel deck was applied in the Hubei Danjiangkou Reservoir Super Large Bridge.
Scholars worldwide have explored shear lag effects in cable-stayed bridge girders primarily through analytical methods, model tests, field tests, and numerical simulations. Analytical methods for calculating shear lag include elastic theory solutions [11], energy variational methods [12,13], finite segment methods [14], and analytical methods based on additional deflections [15].
A critical challenge in model testing for shear lag in cable-stayed bridge girders, subjected to combined axial force, bending, and shear, is the appropriate simulation of cable axial force effects under axial-flexural loading. Some researchers have addressed shear lag under combined axial and bending loads. Cheng et al. [16] conducted scaled plexiglass box girder model tests under compression-bending, pioneering the investigation of shear lag under such conditions. Li [17] studied shear lag in simply supported double-I steel, corrugated steel web, and box-section composite girders under axial-bending loads, clarifying the influence of load position and type. He established that shear lag is more pronounced in sections closer to the axial force application point. Wang et al. [18] designed five loading cases to simulate main girder forces in cable-stayed bridges, performing elastic-stage static loading tests on double-I composite girders. Li et al. [19] focused on shear lag in cantilevered steel box girder cable-stayed bridges, conducting a scaled model test (1:4.5) based on the world’s widest road-rail cable-stayed bridge, the Jinhai Bridge.
While model tests elucidate shear lag mechanisms, field tests capture the actual behavior. Consequently, researchers have conducted field studies on shear lag in cable-stayed bridge girders during both construction and service stages. Zhang [20] investigated shear lag in a PC single-pylon cable-stayed bridge, examining the influence of factors like cable spacing on the pylon, pylon-girder stiffness ratio, and pylon-span ratio on girder shear lag under construction and live loads. Chen et al. [21] conducted tests on a cable-stayed bridge during construction, finding similar shear lag effects in two distinct construction stages. Zhou et al. [22] analyzed dynamic shear lag during construction through flange stress monitoring. Using the energy variational method, they derived a warping displacement function for shear lag in double-I composite girders, developed a practical beam element considering the coupling effect of shear lag and bending stiffness, and applied it to analyze the shear lag effect in the Hekou Bridge main girder. Wang et al. [23] performed field tests on the shear lag effect in the composite girder of the Xiamen-Zhangzhou Sea-Crossing Bridge during both construction and service stages. Zhu [24] employed a hybrid finite element method to study shear lag in composite cable-stayed bridges with variable-width girders, concluding, based on field measurements, that the flange shear lag coefficient is negatively correlated with the girder width in the variable-width segment. Currently, numerical simulation of shear lag in cable-stayed bridges is well-developed. Despite computational demands, it remains a powerful tool for research and calculation.
In summary, composite girders (including steel-UHPC) are widely used in cable-stayed bridges globally. Scholars have conducted in-depth research on their girders using experiments, simulations, theoretical analysis, and field monitoring. Additionally, advanced computational frameworks [25] provide critical methodologies for simulating complex shear lag phenomena in steel-UHPC composite girders. Continuous evolution of material characterization techniques offers transferable approaches for quantifying UHPC-steel interfacial properties governing shear lag behavior [26]. System-level 3D multiscale collapse modeling [27] establishes analytical paradigms directly applicable to shear lag-induced stress redistribution in wide decks. Validated studies on composite elements’ cyclic performance [28,29] elucidate hysteretic slip effects that exacerbate shear lag under extreme loading. Research on force-transfer mechanisms in specialized connections [30] and critical joint detailing [31] informs shear lag mitigation strategies at girder-deck interfaces. Vibration fragment impact research provides vital insights into UHPC’s shear transfer integrity under impact loading—a critical consideration for shear lag models incorporating accidental load scenarios [32].
However, the potential use of asymmetric cable tensioning sequences during construction, or the inherent difficulty in achieving perfect symmetry due to various factors, means the impact of time-varying cable forces on girder shear lag remains insufficiently studied. Therefore, this paper investigates the influence of dynamic changes in cable axial force on the shear lag effect in steel-UHPC composite girders.
2. Experimental Study on Steel-UHPC Composite Girder Models for Cable-Stayed Bridges
2.1. Material Property Tests
2.1.1. UHPC Properties
Uniaxial compression tests were performed on six UHPC specimens (100 mm × 100 mm × 300 mm, Figure 1 and Figure 2). The UHPC exhibited excellent compressive deformation behavior, with a peak strain reaching 3500 με. Even after significant cracking, the specimens retained 85% of their peak strength. The elastic modulus during the ascending phase was calculated as 47.091 GPa. The average compressive strength of the UHPC specimens was 122.3 MPa (Table 1).
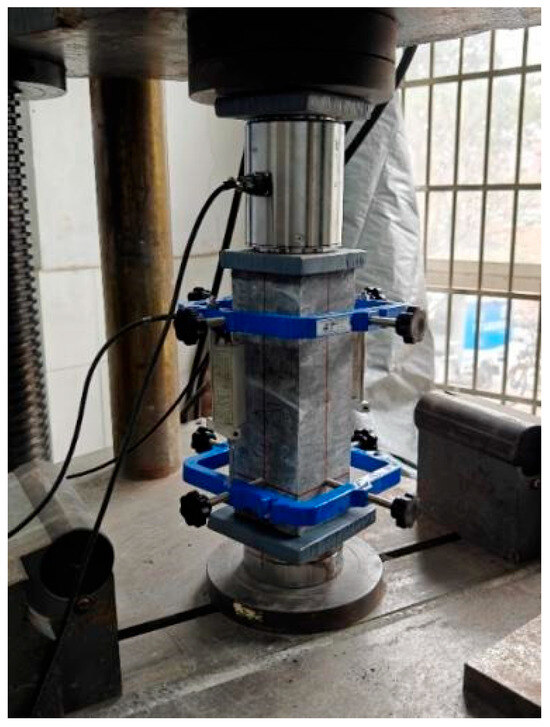
Figure 1.
Loading of the UHPC specimen.
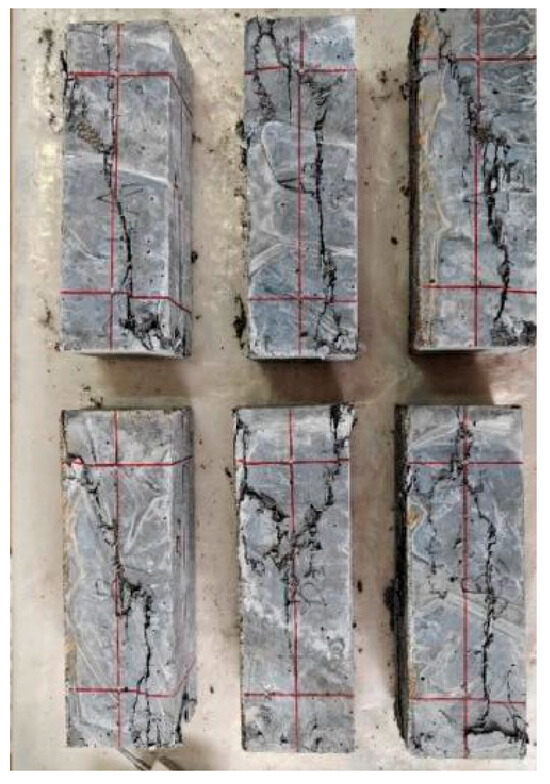
Figure 2.
Failure mode of the UHPC specimen.

Table 1.
Mechanical properties of UHPC.
2.1.2. Steel Properties
All steel girders in the test specimens used Q355B grade steel. Selection of standard coupon dimensions, machining tolerances, and uniaxial tensile testing strictly adhered to “Metallic materials-Tensile testing-Part 1: Method of test at room temperature” (GB/T 228.1-2021) [33]. Three standard coupons were tested. Dimensions and machining requirements are shown in Figure 3. Basic mechanical properties are listed in Table 2.
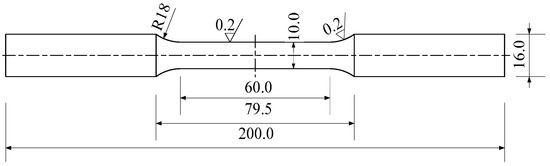
Figure 3.
Schematic diagram of standard parts for tensile test (unit: mm).
Table 2.
Mechanical properties of steel.
2.2. Composite Girder Tests
2.2.1. Specimen Design
Five straight-web box-section steel-UHPC composite girder specimens (Figure 4) were designed and fabricated. All test girders were simply supported with the following configurations:UHPCCG-1 featured a span-to-width ratio (L/b) of 1.2:1 and width-to-height ratio (b/H) of 5:1; UHPCCG-2 had a span-to-width ratio (L/b) of 1.4:1 and width-to-height ratio (b/H) of 5:1; UHPCCG-3 showed a span-to-width ratio (L/b) of 1.6:1 and width-to-height ratio (b/H) of 5:1; UHPCCG-4 demonstrated a span-to-width ratio (L/b) of 1.2:1 and width-to-height ratio (b/H) of 4:1; UHPCCG-5 exhibited a span-to-width ratio (L/b) of 1.2:1 and width-to-height ratio (b/H) of 3.2:1. Each specimen consisted of a steel box girder and a UHPC deck slab. Key structural features included: double longitudinal stiffeners on the steel bottom flange; composite action provided by headed stud shear connectors welded to the steel top flange. All studs had a diameter of 14 mm and a height after welding of 40 mm, arranged differentially: (1) Single-row layout (spacing 100 mm) in end plate and diaphragm regions; (2) Double-row layout (row spacing 80 mm, longitudinal spacing 100 mm) on the top flange over the webs. Single-row studs were used on crossbeam and diaphragm top flanges, while double-row studs were used on longitudinal girder top flanges. An axial loading fixture was welded to the outside of each web end. The fixture end was flush with the web end, with a 35 mm gap between the fixture side plate and the web to accommodate a 30 mm diameter threaded steel bar for axial loading, as shown in Figure 5. This experimental study examines how axial force asymmetry, span-to-width ratio (L/b), and width-to-height ratio (b/H) affect strain distribution patterns in the concrete flange.
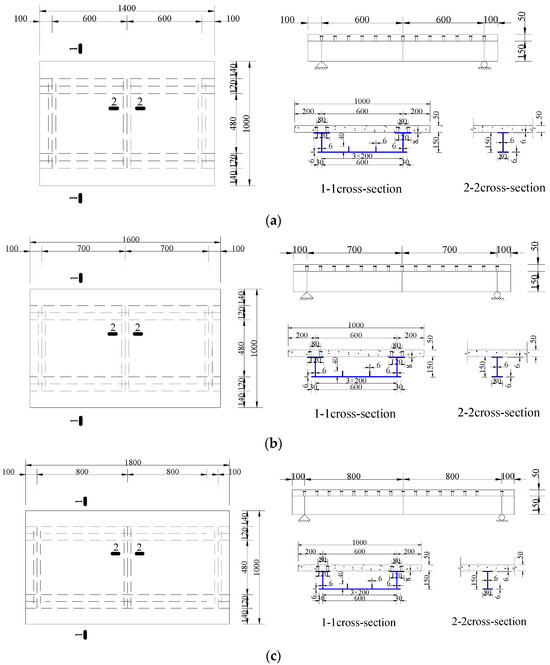
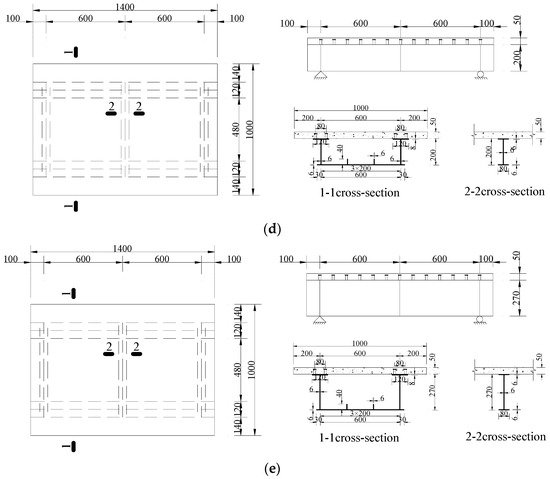
Figure 4.
Dimensions of the specimens (Unit: mm), (a). UHPCCG-1 (L/b = 1.2, b/H = 5); (b). UHPCCG-2 (L/b = 1.4, b/H = 5); (c). UHPCCG-3 (L/b = 1.6, b/H = 5); (d). UHPCCG-4 (L/b = 1.2, b/H = 4); (e). UHPCCG-5 (L/b = 1.2, b/H = 3.2).
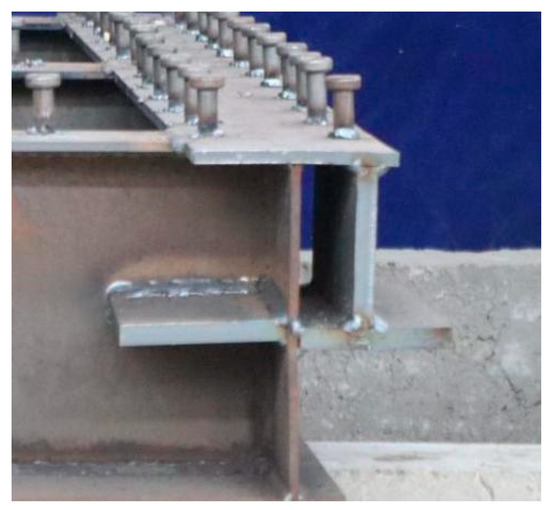
Figure 5.
Axial loading fixture.
The steel girder components were fabricated in a steel workshop. All five specimens were cast on-site. After casting, they were covered with film and watered every two hours. Upon reaching the design concrete strength, formwork was removed, latex paint was applied to the concrete surface, and specimens were moved to a secure location for loading. Specimen fabrication is shown in Figure 6. To study the shear lag effect of the UHPC slab, the transverse distribution of the normal strain was measured. Strain gauges were mounted on the UHPC slab’s upper surface at 120 mm intervals, each with a 200 mm gauge length. Strain gauges were bonded following the steps shown in Figure 7.
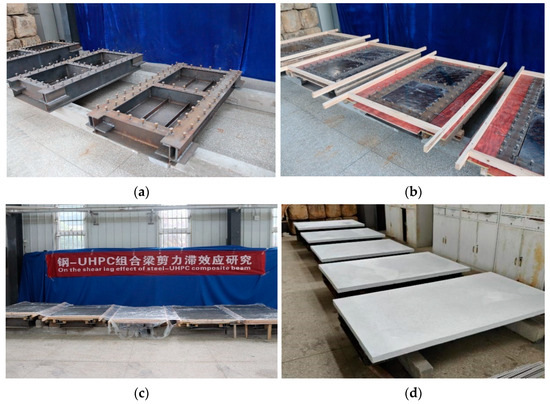
Figure 6.
Fabrication of the specimen (a). Fabrication of steel girders; (b). Placing of formwork; (c). Curing; (d). Forming of the specimen.
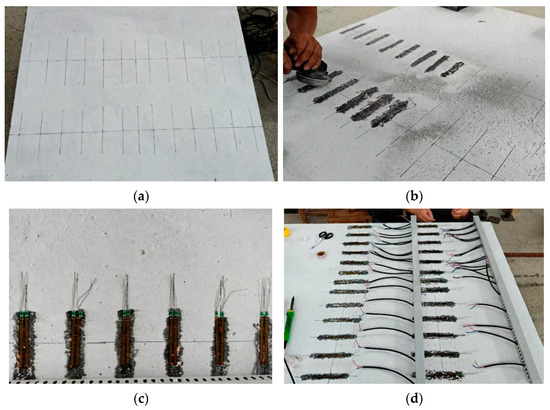
Figure 7.
Bonding steps for strain gauges, (a). Surface preparation (b). Placing of formwork; (c). Adhesive application; (d). Lead wire soldering.
The straight-web box-section composite girders were tested under simply supported conditions with one fixed hinge and one movable roller support, as shown in Figure 8. Structural testing was conducted at the Hunan Institute of Science and Technology Structures Laboratory (China). Axial load was applied by tensioning threaded steel bars positioned on both sides of the steel girder webs at a force-controlled rate of 10 N/s. The girders were subjected to a two-phase loading protocol:
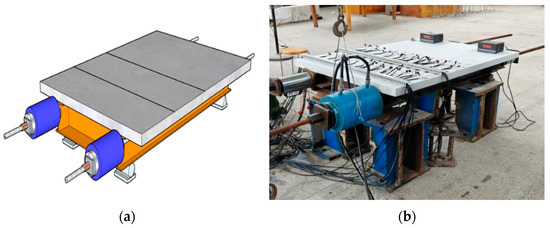
Figure 8.
Loading arrangement for the specimen, (a). Isometric view of loading; (b). Field loading.
- (1)
- Phase 1: Incremental axial loading on one side until reaching the design load level, maintained thereafter;
- (2)
- Phase 2: Progressive loading on the opposite side until achieving an identical design load magnitude.
This asymmetric sequence simulates the staged tensioning of stay cables in cable-stayed bridge construction.
2.2.2. Analysis of Test Results
Figure 9 shows the strain distribution across the transverse direction of the UHPC slab top surface at the L/2 and L/4 sections for specimen UHPCCG-1. Key observations include: Under unilateral axial loading on the north side, significant compressive strain was observed at the compression end (side A). Pronounced shear lag was evident in the compression zone of the L/4 section. When the north side load was held constant at 150 kN and the south side load was incrementally increased, the strain distribution across the UHPC slab became symmetric about the girder centerline. Significant shear lag was observed near the steel webs. Shear lag was more pronounced at the L/4 section (closer to the loading point) than at the L/2 section. Comparing Figure 9b,d clearly shows that greater asymmetry in axial loading leads to a more pronounced shear lag effect. Table 3 lists the shear lag coefficients calculated for the L/4 section under various loading stages. The coefficient ranged from 1.83 to 4.81 under unilateral loading. As load asymmetry decreased, the coefficient reduced from 4.81 to 1.18, confirming the significant impact of asymmetric axial force on shear lag.
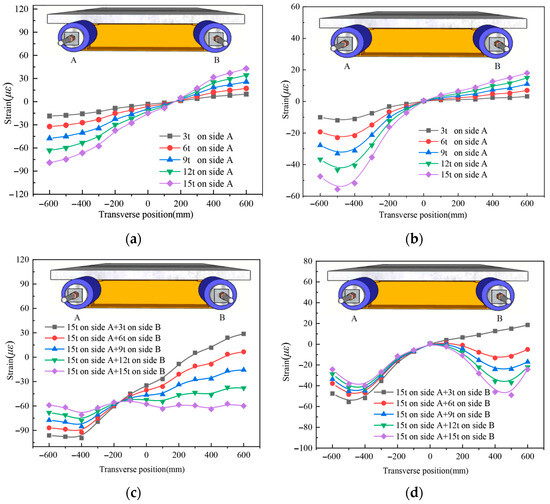
Figure 9.
The longitudinal strain distribution across the transverse direction of the UHPC slab for UHPCCG-1, (a). L/2 section; (b). L/4 section; (c). L/2 section; (d). L/4 section.
Table 3.
Shear lag coefficient at L/4 section for specimen UHPCCG-1.
Figure 10 presents strain distributions for specimen UHPCCG-2. Similar trends were observed: Unilateral loading induced compression and shear lag. Symmetric strain distribution emerged as the south side load increased under constant north side load (100 kN). Shear lag was more significant at the L/4 section and increased with load asymmetry. Shear lag coefficients (Table 4) decreased from 3.40 (unilateral) to 1.12 (symmetric), reinforcing the influence of asymmetry.
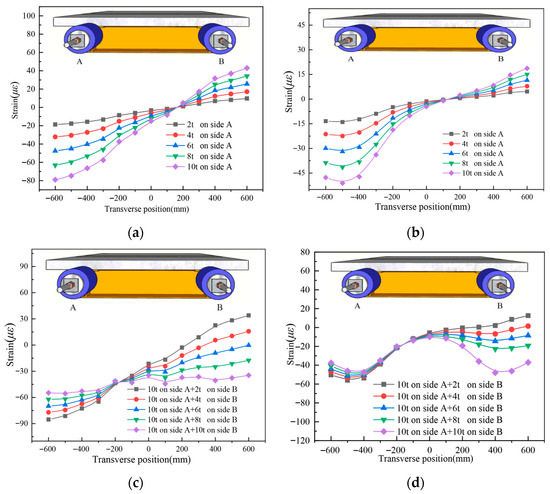
Figure 10.
The longitudinal strain distribution across the transverse direction of the UHPC slab for UHPCCG-2, (a). L/2 section; (b). L/4 section; (c). L/2 section; (d). L/4 section.
Table 4.
Shear lag coefficient at L/4 section for specimen UHPCCG-2.
Figure 11 and Table 5 show results for UHPCCG-3, confirming the same patterns: shear lag near loads, sensitivity to asymmetry (coefficient range 1.25–3.23), and reduction with increased symmetry.
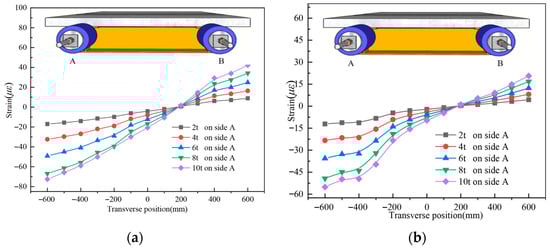
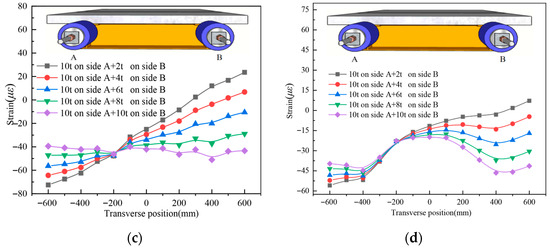
Figure 11.
The longitudinal strain distribution across the transverse direction of the UHPC slab for UHPCCG-3, (a). L/2 section; (b). L/4 section; (c). L/2 section; (d). L/4 section.
Table 5.
Shear lag coefficient at L/4 section for specimen UHPCCG-3.
Figure 12 and Figure 13 and Table 6 and Table 7 present results for specimens UHPCCG-4 and UHPCCG-5, designed with different geometric parameters (reflected in differing absolute shear lag coefficient values compared to UHPCCG-1-3). The fundamental trends observed in UHPCCG-1-3—pronounced shear lag near loading points, significant amplification by load asymmetry, and measurable reduction as symmetry increases—were consistently replicated.
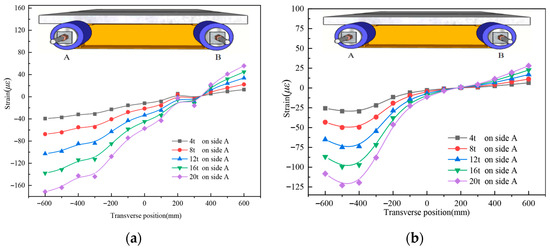
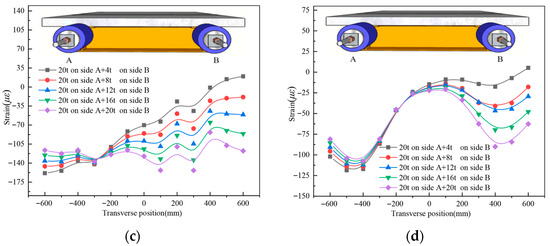
Figure 12.
The longitudinal strain distribution across the transverse direction of the UHPC slab for UHPCCG-4, (a). L/2 section; (b). L/4 section; (c). L/2 section; (d). L/4 section.
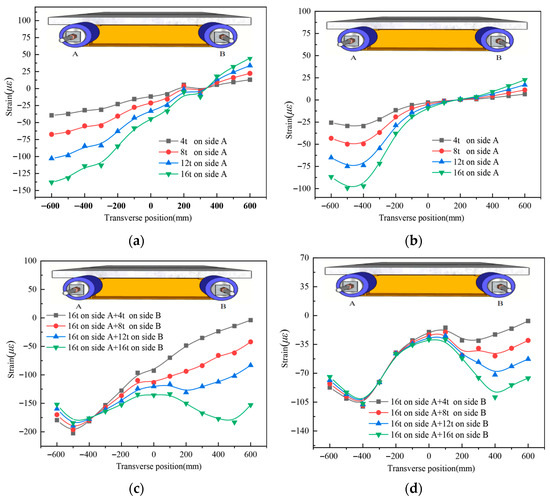
Figure 13.
The longitudinal strain distribution across the transverse direction of the UHPC slab for UHPCCG-5, (a). L/2 section; (b). L/4 section; (c). L/2 section; (d). L/4 section.
Table 6.
Shear lag coefficient at L/4 section for specimen UHPCCG-4.
Table 7.
Shear lag coefficient at L/4 section for specimen UHPCCG-5.
3. Governing Differential Equations and Analytical Solution Under Asymmetric Axial Loading
3.1. Analysis Model
This study considers a box-shaped composite girder with constant cross-sections, as shown in Figure 14. Within the linear elastic range, the behavior under symmetric axial loading follows the principle of superposition. Therefore, the longitudinal strain at any point on the UHPC slab under eccentric axial loading can be expressed as the linear superposition of the strain induced by symmetric axial force and the strain caused by the bending moment about the Z-axis resulting from the eccentricity.
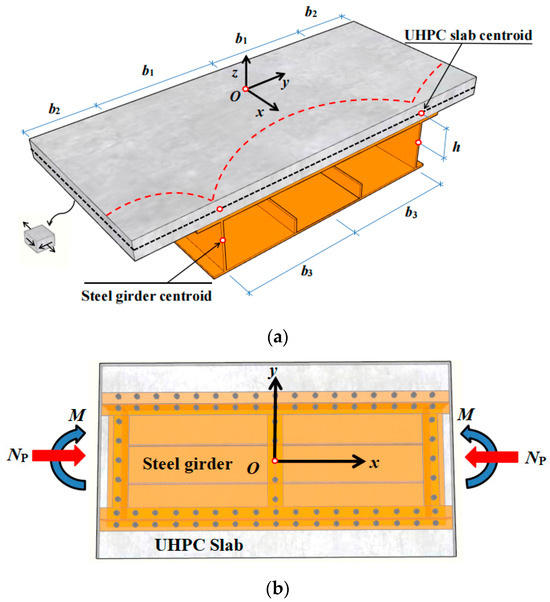
Figure 14.
Schematic for analysis of composite girder under eccentric axial loading, (a). Analysis model of shear lag effect in Steel-UHPC composite Girders; (b). Equivalent Load Diagram under Eccentric Axial Load.
Analysis of the mechanical behavior in cable anchorage zones of composite girders indicates that concentrated loads anchored to the steel girder induce significant interfacial slip between steel and UHPC. As illustrated in Figure 15a, actual deformation at the girder end shows localized separation. The force diagram for a composite girder micro-segment is shown in Figure 15b, and the interfacial shear transfer mechanism is depicted in Figure 15c. Reflecting the actual structural behavior of composite box girders, the analysis assumes: (1) identical vertical displacements between the UHPC slab and steel girder, thereby ignoring uplift of the UHPC slab; and (2) longitudinal displacement incompatibility, permitting interfacial slip.
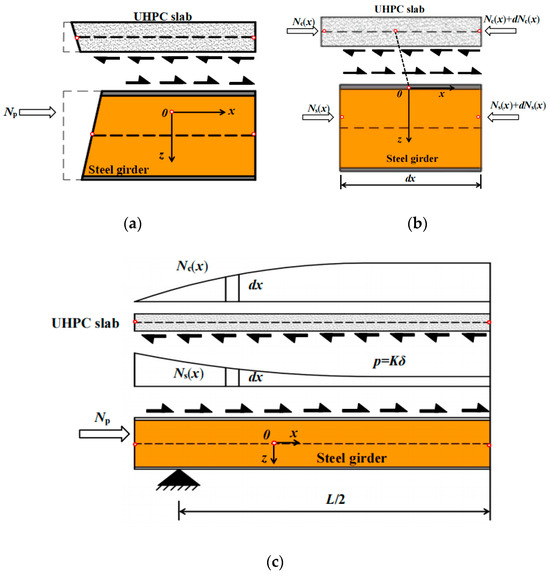
Figure 15.
Deformation and shear transfer modes in steel-UHPC composite girder under symmetric axial loading, (a). Girder end deformation; (b). Forces on composite girder micro-segmen; (c). Shear transfer mechanism in steel-UHPC composite girder.
Strains due to eccentric bending moments in the elastic stage can also be calculated using the transformed section method. The composite section comprises the UHPC slab and the steel girder, with moments of inertia Ic and Is, respectively. The elastic moduli of UHPC and steel are Ec and Es, respectively. Transforming the UHPC section to an equivalent steel section yields a homogeneous transformed section with area A0 and moment of inertia Iz.
where n = Es/Ec.
Under symmetric axial load Np, the normal strain at any point on the UHPC slab or steel girder can be expressed as Equation (2) [16]:
where is the derivative of the is the relative rotation angle function of the steel girder and the concrete slab ; hu represents the distance from the centroid of the UHPC slab to the equivalent cross-sectional centroid; hL represents the distance from the centroid of the steel girder to the equivalent cross-sectional centroid; denotes the warping shape function; and f(x) denotes the warping displacement function.
The warping displacement functions of the following components are defined as follows: the UHPC inner top slab, UHPC cantilever slabs, steel bottom slab, and steel webs:
where D represents the uniform axial displacement applied to satisfy the axial force self-balancing condition. The half-width of the UHPC top slab is denoted b1, the width of the UHPC cantilever slab b2, and the half-width of the steel bottom slab b3. The shear-lag warping amplitudes of the UHPC top slab, UHPC cantilever slab, and steel bottom slab are denoted α1, α2, and α3, respectively.
The interface relative slip displacement of the composite girder is expressed as Equation (4):
where δ represents the steel-UHPC interface relative slip, h denotes the distance between component centroids.
The elastic strain energy associated with interface slip of the composite girder can be expressed as Equation (5):
where p denotes the interfacial shear force per unit length sustained by shear connectors; K represents the longitudinal shear stiffness per unit length of the composite girder interface.
Derivation of the total potential energy function yields:
where ; ; ;
; ;
;;
.
In which Es and Ec denote the elastic modulus of the steel girder and UHPC slab, respectively, and Gs and Gc represent their corresponding shear modulus.
The moments of inertia are defined as:
: UHPC top/cantilever slab about the transformed section neutral axis;
: UHPC slab about its own neutral axis;
: Steel bottom slab about the transformed section neutral axis;
: Steel bottom slab about its own centroidal axis;
: Steel webs about the transformed section neutral axis;
: Steel web (including upper flange) about its own neutral axis.
Cross-sectional areas are given by:
: UHPC inner/cantilever slab;
: Steel bottom slab;
: Steel webs.
First moments of area:
: Concrete slab about transformed section neutral axis;
: Steel bottom slab about transformed section neutral axis;
: Steel bottom slab about its own neutral axis.
Using variational methods based on the principle of minimum potential energy, we derived the following differential equations and boundary conditions under axial load:
The strain on the surface of the UHPC slab caused by eccentric bending moment is expressed as Equation (3):
Superimposing the strain from symmetric axial loading (Equation (2)) and the strain from the eccentric moment (Equation (3)) yields the total longitudinal strain at any point on the UHPC slab under eccentric axial loading.
3.2. Validation of Theoretical Solution Against Eccentric Loading Test Data
To validate the theoretical solution for shear lag in steel-UHPC composite girders under asymmetric axial loading, the longitudinal strain distribution on the top surface of the UHPC slab for specimens UHPCCG-1-UHPCCG-3 under selected load cases was compared with theoretical predictions. Results are shown in Figure 16. The analytical solution exhibits high consistency with the experimental data, with an average deviation within 5%. The good agreement effectively verifies the correctness and applicability of the theoretical solution.
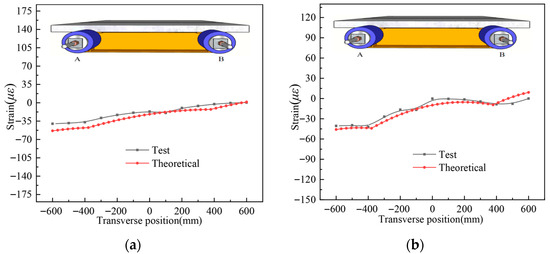
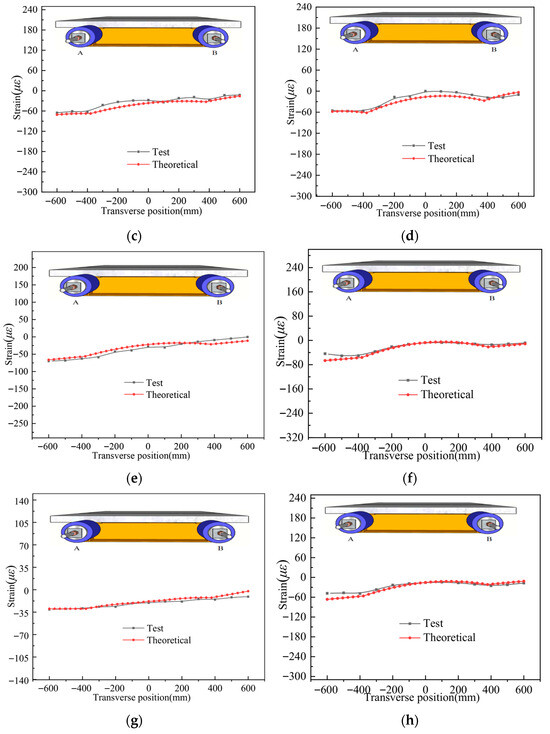
Figure 16.
Strain distribution comparison in the UHPC slab of specimen UHPCCG-1, (a). UHPCCG-1-L/2 section (6 t on side A and 3 t on side B); (b). UHPCCG-1-L/4 section (6 t on side A and 3 t on side B); (c). UHPCCG-1-L/2 section (9 t on side A and 6 t on side B); (d). UHPCCG-1-L/4 section (9 t on side A and 6 t on side B); (e). UHPCCG-2-L/2 section (10 t on side A and 6 t on side B); (f). UHPCCG-2-L/4 section (10 t on side A and 6 t on side B); (g). UHPCCG-3-L/2 section (10 t on side A and 6 t on side B); (h). UHPCCG-3-L/4 section (10 t on side A and 6 t on side B).
4. Parametric Analysis
Using the validated analytical model, parametric studies were conducted to assess the influence of key geometric and material parameters on the longitudinal strain distribution on the top surface of the UHPC slab (concrete slab). Seven parameters are considered: (1) the modulus ranging from 34.5 GPa to 50 GPa; (2) the UHPC slab thickness ranging from 60 mm to 120 mm; (3) the width-to-span ratio b/L ranging from 0.24 to 0.56; (4) the ratio of the cantilever slab width to the half-width of top slab (b2/b1) ranging from 0.5 to 1.5; (5) the thickness of steel flange plate ranging from 8 mm to 40 mm; (6) the thickness of steel web plate ranging from 6 mm to 30 mm; (7) the width-to-depth ratio b/H ranging from 1.7 to 5. In order to prevent interference between parameters, each parameter is examined while the others are kept constant. The theoretical model is used to conduct the comprehensive parametric analysis.
4.1. Influence of Concrete Elastic Modulus Ec
The elastic modulus Ec was designed as 34.5 GPa, 36 GPa, 40 GPa, 45 GPa, and 50 GPa to conduct a parametric sensitivity analysis on the shear lag effect. The resulting strain distributions are shown in Figure 17. As can be observed from the figure, a distinct shear lag effect is evident. As Ec increases, the magnitude of concrete surface strains decreases, and the shear lag effect is significantly reduced. This suggests that using higher-strength concrete is an effective way to mitigate shear lag.
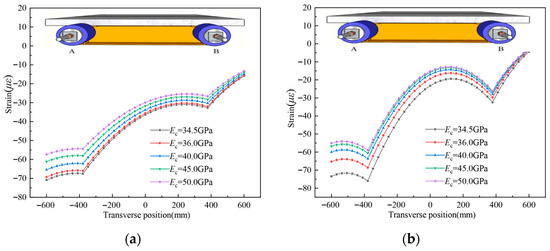
Figure 17.
Longitudinal strain distribution on the top surface of the concrete slab for different Ec, (a). L/2 section; (b). L/4 section.
4.2. Influence of UHPC Slab Thickness hc
The thickness of the UHPC slab is a critical parameter influencing the shear lag of the composite girder. The slab thicknesses are defined as 60 mm, 75 mm, 90 mm, 105 mm, and 120 mm, respectively, as shown in Figure 18. UHPC slab thickness is a key parameter influencing shear lag. Increasing slab thickness reduces the shear lag effect. This is attributed to improved interfacial stiffness uniformity and reduced relative slip between steel and UHPC. However, increasing thickness also increases girder self-weight and cost, which may be detrimental economically and structurally.
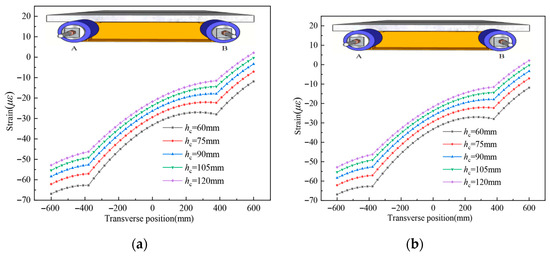
Figure 18.
Longitudinal strain distribution on the top surface of the concrete slab for different thicknesses of UHPC, (a). L/2 section; (b). L/4 section.
4.3. Influence of Girder Width-to-Span Ratio b/L
To investigate parameter sensitivity, width-to-span ratios (b/L) of 0.56, 0.42, 0.33, 0.28, and 0.24 were selected. Figure 19 presents the corresponding strain distributions. At the L/2 section (Figure 19a), strain magnitude exhibits minimal variation with decreasing b/L. Conversely, at the L/4 section (Figure 19b), decreasing b/L yields more uniform strain distributions, indicating attenuated shear lag effects. Quantitatively, the shear lag coefficient decreases by 27%—from 1.30 at b/L = 0.56 to 1.02 at b/L = 0.24. This demonstrates the substantial impact of the width-to-span ratio on shear lag behavior. The underlying mechanism is that wider flanges (higher b/L) cause greater attenuation of shear flow during transverse transmission. This reduces shear stress at the flange edges, consequently lowering longitudinal normal stress.
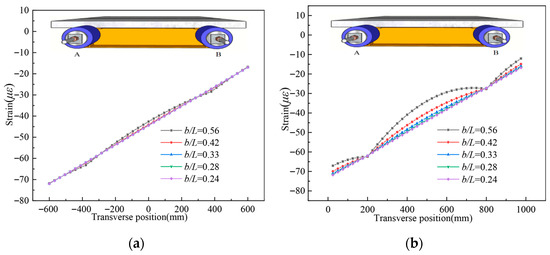
Figure 19.
Longitudinal strain distribution on the top surface of the concrete slab for different b/L, (a). L/2 section; (b). L/4 section.
4.4. Influence of b2/b1
Figure 20 depicts the longitudinal strain distribution variations on the top surface of the UHPC slab under different b2/b1 ratios. The shear lag effect at the L/2 section shows a negligible change. However, as the b2/b1 ratio exceeds 1, the shear lag effect becomes more pronounced at the L/4 section, signifying a correlation between the increasing b2/b1 ratio and the heightened shear lag effect.
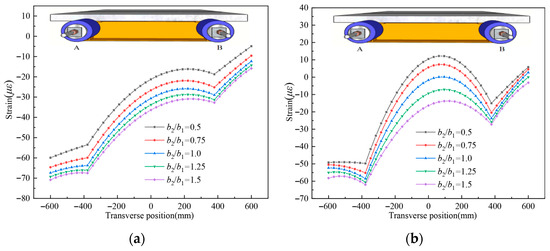
Figure 20.
Longitudinal strain distribution on the top surface of the concrete slab for different b2/b1; (a). L/2 section; (b). L/4 section.
4.5. Influence of Steel Top Flange Thickness t
Five different steel flange plate thicknesses are set as follows: 8 mm, 16 mm, 24 mm, 32 mm, and 40 mm. Calculated strain distributions are shown in Figure 21. As shown in the figure, increasing the steel top flange thickness has a minimal effect on the UHPC slab strain distribution pattern at both the L/2 section and L/4 section. This indicates that the thickness of the upper flange plates of the steel beam has a negligible effect on the shear lag effect.
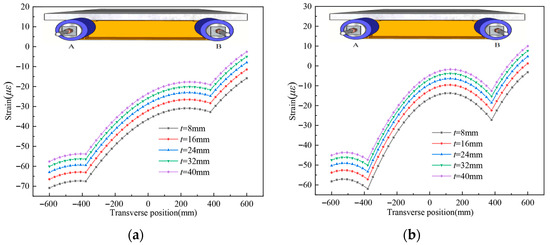
Figure 21.
Longitudinal strain distribution on the top surface of the concrete slab for different thicknesses of steel flange plate; (a). L/2 section; (b). L/4 section.
4.6. Influence of Steel Web Thickness tw
Five different steel web plate thicknesses are set as follows: 6 mm, 12 mm, 18 mm, 24 mm, and 30 mm. The influence of the thickness of the steel web plate on shear lag behavior is displayed in Figure 22. Steel web thickness exerts a measurable, albeit relatively small, influence on shear lag compared to the top flange. Doubling the web thickness reduces the maximum UHPC slab strain near the web by only about 2%, indicating limited effectiveness. On the contrary, increasing the thickness of the web plate significantly increases the self-weight and cost of the composite girder.
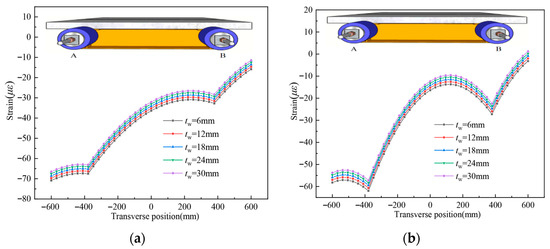
Figure 22.
Longitudinal strain distribution on the top surface of the concrete slab for different thicknesses of steel web plate; (a). L/2 section; (b). L/4 section.
4.7. Influence of Girder Width-to-Depth Ratio b/H
Holding the girder width b constant, the width-to-height ratios of the composite girder were set as 5.0, 3.3, 2.5, 2.0, and 1.7 to investigate the influence of the width-to-height ratio on the shear lag effect. Strain distributions are shown in Figure 23. As shown in the figure, decreasing the width-to-depth ratio increases the magnitude of strains on the UHPC slab surface at both the L/2 section and L/4 section under symmetric axial loading. The shear lag effect intensifies as the width-to-depth ratio decreases.
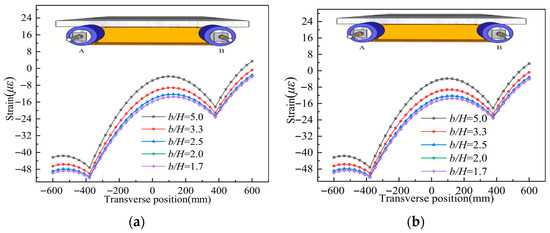
Figure 23.
Longitudinal strain distribution on the top surface of the concrete slab for different b/H; (a). L/2 section; (b). L/4 section.
5. Conclusions
This study aims to investigate the impact of varying cable forces on girder shear lag effect because of the asymmetric cable tensioning during construction in steel-UHPC composite cable-stayed bridges. The main conclusions are as follows:
- (1)
- In the experimental study, the strain distributions reveal an apparent shear lag effect in the concrete slabs of the specimen. A positive correlation between the strain values and the asymmetric axial forces is found. The characteristic of the strain distribution at the L/2 section is similar to that at the L/4 section. Particularly, the shear lag coefficient value of the UHPC slab at the L/4 section ranges from 1.83 to 7.04. These findings confirm the significant impact of asymmetric axial force on shear lag.
- (2)
- The analytical solutions for asymmetric axial loading exhibit high consistency with experimental data, with an average deviation of 5%. The good agreement validates the correctness and applicability of the theoretical models.
- (3)
- The parametric analysis indicates that, under asymmetric axial loading, increasing the strength of the concrete is an effective method to reduce the shear lag effect of the composite girders. The thickness of the UHPC slab is a critical parameter influencing the shear lag. One of the more significant findings is that the shear lag effect becomes more pronounced when the b2/b1 ratio exceeds 1; therefore, a small b2/b1 ratio should be adopted to avoid a severe shear-lag effect. Furthermore, the strain distribution at the L/4 section becomes more uniform as the span L increases, indicating a weakening of the shear lag effect with decreasing width-to-span ratio, which indicates that the width-to-span ratio has a significant influence on the shear lag effect. Additionally, the thickness of the flange plate and web plate of the steel girder has no significant effect on the shear lag effect.
In summary, this study makes critical contributions to understanding and analyzing the shear lag phenomenon in steel-UHPC composite girders because of the asymmetric cable tensioning during the construction of cable-stayed bridges. The integrated experimental testing, theoretical modeling, and numerical simulation provide robust tools for engineering design. The research enhances knowledge of shear lag behavior and demonstrates the need to properly account for its effects in the analysis and design of composite structures.
Author Contributions
Conceptualization, H.L. and Q.S.; methodology, H.L. and B.L.; software, W.W.; validation, C.Y.; investigation, Y.P.; writing—original draft preparation, H.L. and Q.S.; writing—review and editing, B.L. All authors have read and agreed to the published version of the manuscript.
Funding
This research was financially supported by the Natural Science Foundation of Hunan Province, China (Grant Nos. 2025JJ70253, and 2025JJ70276), the Program of Hunan Province Education Department (Grant Nos. 23A0496 and 23B06245), the Hunan Province Degree and Graduate Education Reform Research Project (Grant No. 2024JGZD060), the Teaching Reform Research Project of Hunan Institute of Science and Technology (Grant No. 2024A02), and the College Students’ Innovation and Entrepreneurship Training Program, China (Grant Nos. S202512658011, and S202512658012).
Data Availability Statement
For inquiries related to the availability of the original data, please contact the corresponding author.
Acknowledgments
The authors would like to thank the investigation team for supporting the research.
Conflicts of Interest
The authors declare no conflicts of interest.
References
- Luo, H.; Feng, J.; She, Q.; Li, B.; Wu, C.; Pan, M.; Zeng, Y. Analysis for Effective Flange Width Considering Slip Effect for Main Girder of Composite Cable stayed Bridges during Construction Phase. Eng. Lett. 2025, 33, 2465–2477. [Google Scholar]
- Luo, H.; Feng, J.; She, Q.; Li, B.; Wu, C.; Zeng, Y. Analysis of Shear Lag Effect of Steel-Concrete Composite Box Girders with Straight Steel Webs. IAENG Int. J. Appl. Math. 2024, 54, 507–517. [Google Scholar]
- Zhang, W.; Lin, J.; Huang, Y.; Lin, B.; Liu, X. Experimental and numerical studies on flexural performance of composite beams under cyclic loading. Structures 2024, 70, 107728. [Google Scholar] [CrossRef]
- Cao, J.; Zhang, Y.; Shao, X.; Huang, S.; Cai, W.; Zhang, X. Review of Ultra-High Performance Concrete (UHPC) Bridges Research. Munic. Eng. Technol. 2025, 43, 1–17. (In Chinese) [Google Scholar]
- Chen, F.M.; Zheng, S.B.; Xie, X.H.; Yue, W.Q.; Li, L. Design of main bridge of Chongqing Daxi RiverBridge. Bridge Constr. 2024, 54, 126–133. [Google Scholar]
- Cao, Y.G.; Xuan, Z.Y.; Liu, M.Y.; Feng, P.C.; Liu, X.H. Mechanical properties and bearing capacity calculation method of UHPC bridge deck. J. Hunan Univ. Nat. Sci. 2024, 51, 206–214. (In Chinese) [Google Scholar]
- Li, L.J.; Zhang, G.M. Analysis of mechanical property of steel-UHPC composite girder cable-stayed bridge when raising elevation of auxiliary piers to improve loading condition at negative bending moment zone. Bridge Constr. 2024, 54, 64–69. (In Chinese) [Google Scholar]
- Li, C.X.; Xiao, H.Y.; He, L.F.; Shi, Y.; Feng, H.X.; Pei, B.D. Experimental study on longitudinal negative bending performance of flat steel plate-UHPC composite bridge deck. Eng. Mech. 2024, 41, 91–105. (In Chinese) [Google Scholar]
- Liao, W.C.; Zhao, H.; An, J.H. Study on flexural behavior of wet joints of prefabricated steel-UHPC composite bridge deck. J. China Foreign Highw. 2024, 44, 102–110. (In Chinese) [Google Scholar]
- Tan, X.Y.; Fang, Z.; Li, X.K.; Liao, Y.; Ding, W.X. Mechanical properties of segmental steel-UHPC composite deck panels for long-span cablestayed bridge. Bridge Constr. 2024, 54, 102–109. (In Chinese) [Google Scholar]
- Defries-Skene, A.; Scordelis, A.C. Direct stiffens solution for folded plates. J. Struct. Div. 1964, 90, 15–47. [Google Scholar] [CrossRef]
- Li, F.; Nie, J. Elastic analytical solution for shear lag effect in steel-concrete composite beams. Eng. Mech. 2011, 28, 1–8. (In Chinese) [Google Scholar]
- Nie, J.; Li, F.; Fan, J.; Cai, Q. Practical design method for steel-concrete composite beams considering shear lag effect. Eng. Mech. 2011, 28, 45–51. (In Chinese) [Google Scholar]
- Xie, S. Finite segment method of shear lag analysis for steel-UHPC composite beams. J. Railw. Sci. Eng. 2021, 18, 440–449. (In Chinese) [Google Scholar]
- Zhang, W.T.; Duan, L.; Wang, C.S.; Ren, W.H. A theoretical model for investigating shear lag in composite cable-stayed bridges. Front. Struct. Civ. Eng. 2023, 17, 1907–1923. [Google Scholar] [CrossRef]
- Cheng, X.; Luo, Q. Shear lag in box girders under combined compression and bending loads. J. Civ. Eng. 1991, 24, 52–64. (In Chinese) [Google Scholar]
- Li, F. Spatial Structural Behavior and Time-Dependent Analysis of Composite Cable Stayed Bridge. Ph.D. Thesis, Tsinghua University, Beijing, China, 2011. (In Chinese). [Google Scholar]
- Wang, C.S.; Zhang, W.T.; Li, H.T.; Zhai, X.L.; Xin, Y.F. Shear lag effect of twin I-shaped composite girders in cable-stayed bridges. Thin-Walled Struct. 2022, 180, 109822. [Google Scholar] [CrossRef]
- Li, S.; Huang, Z.; Chen, Z.; Hua, X.; Hong, Y.; Pu, Q. Investigation of the shear lag effect of an innovative steel box girder in cable-stayed bridges: Experimental and bar simulation method analysis. J. Bridge Eng. 2024, 29, 04024006. [Google Scholar] [CrossRef]
- Zhang, B. Study on Shear Lag in Long-Span Wide-pc Single-Pylon Cable-Stayed Bridges. Master’s Thesis, Chang’an University, Xi’an, China, 2018. (In Chinese). [Google Scholar]
- Chen, Y.; Luo, Q.; Peng, A.; Wu, Z. Experimental study on shear lag effects of two-stage construction model in single cable plane cable-stayed bridges. Spat. Struct. 2018, 24, 78–85. (In Chinese) [Google Scholar]
- Zhou, S.; Song, G. Analysis of the influence of shear lag on the bending stiffness of π-shaped main girders in cable-stayed bridges. J. Civ. Eng. 2018, 51, 106–113. (In Chinese) [Google Scholar]
- Wang, C.S.; Zhang, W.T.; Yang, M.Y. Shear lag effect of composite girders in cable-stayed bridges under dead loads. Eng. Struct. 2023, 281, 115752. [Google Scholar] [CrossRef]
- Zhu, X.; Guo, J.; Fang, M.; Tan, Y. Analysis of shear lag effects in variable-width main girders of cable-stayed bridges. Eng. Mech. 2021, 38, 93–99. (In Chinese) [Google Scholar]
- Yang, Q.; Li, H.; Zhang, L.; Guo, K.; Li, K. Nonlinear flutter in a wind-excited double-deck truss girder bridge: Experimental investigation and modeling approach. Nonlinear Dyn. 2025, 113, 6427–6445. [Google Scholar] [CrossRef]
- Liu, H.; Zhang, B.; Yan, L.; Meng, X.; Zhou, J.; Cui, J.; Spence, B.F. Rebar characterization using dual-polarization GPR. NDT&E Int. 2025, 154, 103391. [Google Scholar]
- Long, X.; Iyela, P.M.; Su, Y.; Atlaw, M.M.; Kang, S. Numerical predictions of progressive collapse in reinforced concrete beam-column sub-assemblages: A focus on 3D multiscale modeling. Eng. Struct. 2024, 315, 118485. [Google Scholar] [CrossRef]
- Du, Y.; Liu, Y.; Zhou, F.; Li, Z.; Liu, K.; An, L. Investigation on Dynamic Deformation and Damage of Steel Ribbon Wound Vessel for Hydrogen Storage Under Fragment Impact Loading. J. Press. Vessel. Technol. 2025, 147, 041302. [Google Scholar] [CrossRef]
- Yao, Y.; Huang, H.; Zhang, W.; Ye, Y.; Xin, L.; Liu, Y. Seismic performance of steel-PEC spliced frame beam. J. Constr. Steel Res. 2022, 197, 107456. [Google Scholar] [CrossRef]
- Yao, Y.; Zhou, L.; Huang, H.; Chen, Z.; Ye, Y. Cyclic performance of novel composite beam-to-column connections with reduced beam section fuse elements. Structures 2023, 50, 842–858. [Google Scholar] [CrossRef]
- Yang, Y.; Lin, B.; Zhang, W. Experimental and numerical investigation of an arch–beam joint for an arch bridge. Arch. Civ. Mech. Eng. 2023, 23, 101. [Google Scholar] [CrossRef]
- Zhang, C.; Duan, C.; Sun, L. Inter-Storey Isolation Versus Base Isolation Using Friction Pendulum Systems. Int. J. Struct. Stab. Dyn. 2024, 24, 2450022. [Google Scholar] [CrossRef]
- GB/T 228.1-2021; General Code for Design of Highway Bridges and Culverts. Standards Press of China: Beijing, China, 2021.
Disclaimer/Publisher’s Note: The statements, opinions and data contained in all publications are solely those of the individual author(s) and contributor(s) and not of MDPI and/or the editor(s). MDPI and/or the editor(s) disclaim responsibility for any injury to people or property resulting from any ideas, methods, instructions or products referred to in the content. |
© 2025 by the authors. Licensee MDPI, Basel, Switzerland. This article is an open access article distributed under the terms and conditions of the Creative Commons Attribution (CC BY) license (https://creativecommons.org/licenses/by/4.0/).