Article

Damage Identification of Corroded Reinforced Concrete Beams Based on SSA-ELM

1
School of Civil Engineering, Qingdao University of Technology, Qingdao 266520, China
2
School of Civil Engineering, Tianjin Chengjian University, Tianjin 300384, China
3
School of Environmental and Municipal Engineering, Qingdao University of Technology, Qingdao 266520, China
*
Author to whom correspondence should be addressed.
Buildings 2025, 15(16), 2937; https://doi.org/10.3390/buildings15162937
Submission received: 10 July 2025 / Revised: 3 August 2025 / Accepted: 15 August 2025 / Published: 19 August 2025

Abstract

Accurately quantifying corrosion damage in reinforced concrete (RC) beams is a significant challenge for structural health monitoring. This study introduces a novel damage identification method that integrates the Sparrow Search Algorithm (SSA)-optimized Extreme Learning Machine (ELM) to address this issue. By utilizing dynamic characteristics, including natural frequencies and mode shapes, as input features, the model predicts three critical damage indicators: the mass corrosion ratio (ηs), flexural capacity reduction factor (α), and flexural stiffness reduction factor (β). Validation through ABAQUS finite element simulations demonstrated the superior performance of the SSA-ELM approach compared to conventional ELM, achieving a 60–70% reduction in mean square error (MSE). Specifically, the MSE for ηs decreased from 2.1062 to 0.3174. The experimental validation conducted on seven RC beams with corrosion levels ranging from 0% to 14.1% confirmed the method’s reliability, with prediction errors for α and β ranging from 5 to 10%. This represents a 50% improvement in accuracy compared to conventional ELM, which exhibited errors in the range of 9–20%. SSA-ELM is a novel and more effective solution to the challenges (e.g., early convergence and convergence speed) faced by existing optimized ELM methods (especially GWO-ELM and GA-ELM). Furthermore, the practical implementation of the proposed framework includes a MATLAB R2024a-based graphical user interface (GUI) with Docker containerization, enabling efficient field deployment for structural assessment. Overall, this study establishes SSA-ELM as a promising tool for post-corrosion safety evaluation of RC structures.

1. Introduction

With the rapid economic growth, the construction industry has experienced continuous expansion [1]. Although the design lifespan of building structures can extend over several decades or even a century, these structures inevitably undergo degradation in their mechanical performance during their service life, influenced by factors such as long-term loading, seismic activity, and seawater corrosion [2,3]. For reinforced concrete (RC) structures, rebar corrosion is an unavoidable and particularly significant issue [4]. Studies have shown that rebar corrosion in RC structures is primarily triggered by excessive chloride ion concentrations [5,6]. In environments with high chloride ion levels, the durability of the structure is severely compromised, making it highly susceptible to damage and even collapse, which poses a serious threat to public safety and property. Therefore, precise damage assessment during the structure’s service life is crucial.
Traditional health monitoring methods typically rely on empirical observation and damage manifestation evaluation, which are unable to detect internal damage effectively [7]. The concept of structural health monitoring (SHM) [8] was introduced as early as the last century. Damage detection methods can be broadly classified into two categories: non-destructive testing (NDT) and vibration-based methods. The former is localized and struggles to detect damage located within the structure (such as concrete cracks or rebar corrosion) or hidden by non-structural components (such as decorative elements). In contrast, vibration-based methods can more accurately capture changes in the overall dynamic characteristics of the structure, thus improving the precision of damage identification. These methods are considered global techniques and have gained significant attention over the past decades. Doubling et al. [9] and Sohn et al. [10] have provided comprehensive reviews of vibration-based damage detection methods and their applications across different structural types. Rytter et al. [11] categorized damage detection into four levels: detection of damage existence, damage localization, damage quantification, and prediction of remaining structural lifespan. Current research primarily focuses on the first three stages. For instance, Zhang et al. [12] used the acceleration response of vehicles under sinusoidal impact to approximate the modal shapes and localized damage by comparing the squared modal shape differences between undamaged and damaged structures. While this method requires certain informational support, it avoids the need for pre-installing a large number of sensors or solving eigenvectors or singular values, simplifying the process. Feng et al. [13] extracted the first modal shape from displacement responses induced by vehicle loads, using it as a damage indicator for bridge damage localization and quantitative monitoring. Zhao et al. [14] used changes in natural frequencies and modal shapes to locate and quantify damage, applying the Modal Assurance Criterion (MAC) to evaluate the sensitivity of different modal orders to damage and selecting the most sensitive modes as damage indicators. Capecchi et al. [15] used natural frequencies, modal shapes, and modal strain energy changes (MSCs) to identify damage in parabolic arches. Xiao et al. [16] proposed a damage detection method based on local models for large-span steel truss bridges. Miao et al. [17] employed a steel truss railway bridge for damage identification and optimized sensor placement based on the sensitivity of truss components to damage. In summary, vibration-based methods achieve global damage identification by analyzing changes in dynamic response characteristics (such as frequencies and modal shapes), offering advantages such as non-contact detection and global applicability. However, these methods typically rely on comprehensive structural models or dense sensor networks.
In recent years, the development of intelligent algorithms, particularly machine learning (ML) algorithms, has found wide applications in structural engineering [18,19,20]. These algorithms can uncover inherent relationships between inputs and outputs without the need for complex mechanical derivations, often achieving high precision with minimal errors [21]. They have led to significant breakthroughs in SHM damage detection. Zenzen et al. [22] utilized frequency response function data, combined with bat and genetic algorithms, to determine damage location and extent in beam-like and truss structures. Gerist et al. [23] proposed using an imperialist competitive algorithm to detect the damaged location and estimate the damage extent based on modal parameters of the damaged structure. Kim et al. [24] developed a damage identification method for planar and spatial truss structures based on force using differential evolution algorithms and vibration data. Most ML-based methods involve two core tasks: feature extraction and classification. Compared to non-ML methods, these ML techniques demonstrate superior generalization ability and advantages in vibration-based damage detection for civil structures [25]. For example, Fan et al. [26] used an SSA-optimized Extreme Learning Machine (ELM) model to analyze bond–slip failure modes of reinforced concrete (RC) structures in pull-out tests, demonstrating that the SSA-ELM model exhibited superior stability and accuracy compared to algorithms such as Grey Wolf Optimization (GWO). Overall, ML-based methods provide powerful data-driven tools for damage identification, particularly in addressing complex nonlinear relationships, but their performance heavily depends on effective feature extraction and the choice of algorithm.
In relation to corrosion damage detection in beams, Razak et al. [27] studied the modal parameters of RC beams with rebar corrosion and suggested that damping is not a reliable parameter for assessing corrosion damage, while natural frequency is a more reliable indicator for monitoring changes in structural load-bearing capacity caused by corrosion. Park et al. [28] observed that as the modal order increases, the relative rate of frequency reduction decreases, while the absolute rate of frequency reduction increases. Thus, natural frequency monitoring has been recognized as a simple and effective method for overall structural condition assessment. Jarek et al. [29] found through computational and experimental studies that sulfate had a more significant impact on the mechanical properties of concrete beams, while chloride inhibited sulfate corrosion. This method is suitable for analyzing concrete beams exposed to sulfates and identifying the frequency reduction after 240 days of exposure. Capozucca et al. [30] experimentally investigated the performance of prestressed RC beams under rebar corrosion and used frequency response changes to assess the beam’s damage state. Zhang et al. [31] studied the corrosion damage of tall steel shafts in mine hoisting systems and proposed a multi-indicator data fusion method based on parameter modeling and Dempster–Shafer evidence theory, significantly improving the accuracy of multi-location damage detection. Zeng et al. [32] investigated the rust-induced cracking of RC beams under sustained loads and proposed a multi-scale numerical model considering the mechanical characteristics of corrosion products’ porosity, revealing that external loads significantly altered crack patterns and accelerated crack propagation.
The core mechanism of the Sparrow Search Algorithm (SSA) [33] simulates the foraging behavior of sparrow populations, defining three roles—discoverers (global exploration), followers (local exploitation), and sentinels (risk avoidance)—and their collaborative strategies. Compared to Grey Wolf Optimization (GWO) [34] and the genetic algorithm (GA) [35], commonly used for optimizing ELM, SSA offers significant advantages. GWO’s strict hierarchy (α/β/δ wolves guiding) and GA’s evolutionary operators (selection, crossover, and mutation) often get trapped in local optima (premature convergence) when handling complex problems and can suffer from limited convergence speed. SSA’s unique sentinel mechanism actively detects and drives individuals to escape potential risk zones, effectively avoiding premature convergence and enhancing global optimization capabilities. Furthermore, its discoverer–follower collaboration model achieves an efficient balance between exploration and exploitation, significantly improving convergence efficiency. Consequently, SSA-ELM, through this innovative three-role collaboration mechanism, directly addresses and effectively solves the core challenges of premature convergence and slow convergence speed in existing ELM optimization methods (particularly GWO-ELM and GA-ELM), making it a more effective and robust solution in terms of accuracy, efficiency, and stability.
In conclusion, current research on algorithm-based damage identification for RC beams remains relatively limited, and existing methods still require improvements. While vibration testing technologies have been applied in RC structure damage identification, research on corrosion-damaged RC structures remains insufficient, especially in combining vibration test results with new intelligent algorithms for damage detection. To address these gaps, this paper proposes a damage identification framework for corrosion-damaged beams based on an SSA-optimized ELM approach. The core innovations of this study are as follows:
(1) 
Development of a Damage Identification Model Integrating Dynamic Characteristics: The proposed algorithm uses natural frequencies and modal shapes as input features to directly output key damage indicators, such as corrosion rate, remaining load-bearing capacity, and remaining stiffness, allowing for precise identification of corrosion-induced damage in beams.
(2) 
Innovative Integration of Dynamic and Static Feature Identification for Structural Performance Degradation: By combining dynamic (modal and frequency) with static (load-bearing capacity and stiffness) performance characteristics, this method identifies changes in load-bearing capacity and stiffness due to corrosion, offering a novel approach for non-destructive testing of RC structures.
(3) 
Development of an Integrated Application Platform: To facilitate result visualization and practical engineering applications, a supporting graphical user interface (GUI) was developed on the MATLAB R2024a platform.

2. Damage Identification Method Based on Improved Extreme Learning Machine

2.1. Extreme Learning Machine (ELM)

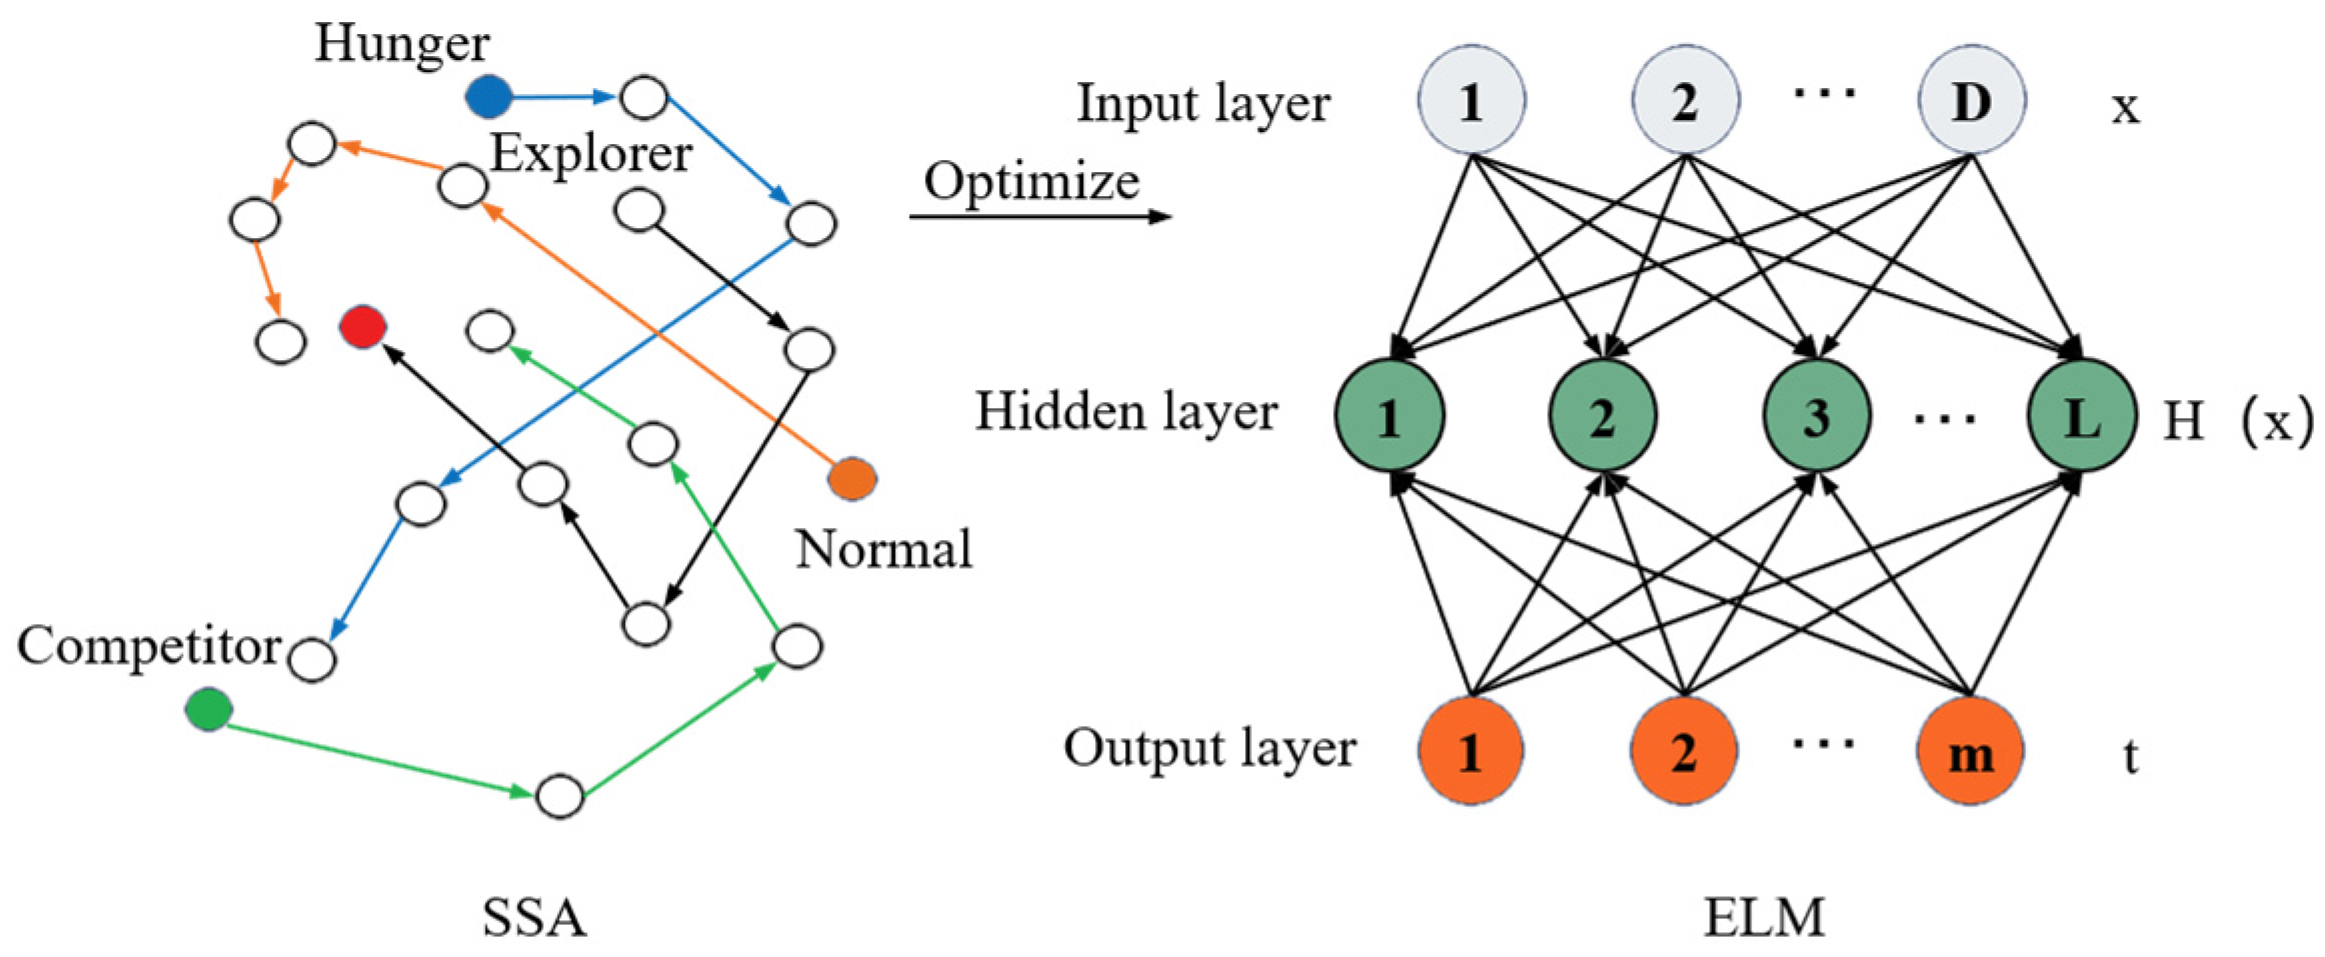
The Extreme Learning Machine (ELM) [36], a novel single-hidden-layer feedforward neural network (SLFN), offers several advantages, including reduced training parameters, faster learning speed, and enhanced generalization capabilities. Unlike traditional SLFNs, which are often slow and prone to getting trapped in local optima, ELM generates the connection weights between the input and hidden layers, as well as the thresholds for hidden layer neurons, randomly. This process does not require adjustment during training. Moreover, the connection weights (β) between the hidden and output layers remain fixed and do not require iterative optimization. Only the number of hidden layer neurons needs to be specified to achieve a unique optimal solution. The ELM algorithm proceeds as follows: (1) The number of hidden neurons (N) is determined, and random weights (ω) and thresholds (b) are generated. (2) An appropriate activation function (g(x)) is selected. (3) The output weights (β) are computed. The network structure is illustrated in Figure 1.
The ELM does not account for structural risks during computation, which affects its generalization ability and stability. While the random generation of weights and thresholds accelerates the computation process, it also introduces increased randomness into the algorithm. This heightened randomness can lead to a decrease in prediction accuracy.

2.2. Optimization Mechanism and Parameter Tuning Strategy of Sparrow Search Algorithm (SSA)

Swarm intelligence optimization algorithms have emerged as effective solutions for addressing complex optimization problems by simulating the collective behavioral patterns of organisms in nature to explore optimal solutions within a defined search space. Among these, the Sparrow Search Algorithm (SSA) [37] stands out due to its high efficiency, accuracy, and robust stability. Inspired by the vigilant foraging behavior of sparrows in response to predators, SSA demonstrates strong global optimization capabilities, enabling rapid convergence and offering a promising approach for engineering applications. The process of optimizing the Extreme Learning Machine (ELM) using SSA is illustrated in Figure 2.
The Sparrow Search Algorithm achieves global optimization by simulating the foraging and anti-predatory behavior of a sparrow population. The algorithm divides the population into three types of roles: discoverers are responsible for exploring the search space, and their position updates follow the Lévy flight mechanism shown in Equation (1); joiners acquire food resources by following the discoverers, and their positions are updated as shown in Equation (2); and vigilance monitors the safety of the population and triggers the escape strategy in Equation (3) when danger occurs. The key parameters include the proportion of discoverers (PD), the proportion of vigilantes (SD), and the safety threshold (ST), and it is recommended to set PD ∈ [0.6, 0.8], SD = 0.1, and ST ∈ [0.6, 0.8] to balance the exploration and exploitation capabilities. The algorithm adjusts the behaviors of the three types of roles through iterations and eventually approaches the global optimal solution.
x i d t + 1 = x i d t · e x p i α · T , R 2 < S T x i d t + Q · L ,                   R 2 S T
In Equation (1), t and T are the current iteration number and the maximum iteration number, respectively; α is a uniform random number between (0 and 1]; Q is a random number obeying a standard normal distribution; L denotes a matrix of size 1 × d with elements all 1; R2 ∈ [0, 1] and ST ∈ [0.5, 1] denote the warning value and safety value, respectively. When R2 < ST, the population does not detect the presence of predators or other dangers, the search environment is safe, and the discoverer can search widely, guiding the population to obtain higher fitness; when R2ST, the detecting sparrow discovers the predator and releases the danger signals immediately, and the population immediately does anti-predatory behavior, adjusts the search strategy, and rapidly approaches to the safe area.
x i d t + 1 = Q · e x p x w d t x i d t i 2 , i > n 2                                                                                                   x b d t + 1 + 1 D d = 1 D r a n d 1 , 1 · x i d t x b d t + 1 , i n 2
In Equation (2), x w d t denotes the worst position of the sparrow in the dth dimension at the tth iteration of the population; x b d t + 1 denotes the optimal position of the sparrow in the dth dimension at the tth + 1th iteration of the population; when i > n 2 , it indicates that the ith accession does not get food, is in a hungry state, and has low adaptability, and, in order to get higher energy, it needs to fly to other places to forage for food; when i n 2 , the ith joiner will find a random location near the current optimal location xb to forage.
x i d t + 1 = x b d t + β x i d t x b d t ,                                                                     f i f g         x i d t + K x i d t x w d t f i f w + e ,                                                   f i = f g
In Equation (3), β denotes the step control parameter, which is a normally distributed random number obeying a mean of 0 and a variance of 1; K is a random number between [−1 and 1], which denotes the direction in which the sparrow moves, and is also the step control parameter; e is a very small constant to avoid the situation where the denominator is 0; f i denotes the fitness value of the ith sparrow, and f g and f w are, respectively, the current sparrow population’s optimal and worst fitness values, respectively. When f i f g , it indicates that the sparrow is at the edge of the population, which is very vulnerable to predator attacks; when f i = f g , it indicates that the sparrow is in the middle of the population, and it is aware of the threat of the predator, and in order to avoid being attacked by the predator, it promptly moves closer to the other sparrows to adjust its search strategy.

2.3. Damage Identification Method Based on SSA-ELM

The frequency of a structure is a function of its overall stiffness and mass, and structural damage can be distinctly reflected in its frequency. Moreover, vibration modes are sensitive to local structural variations, and both are easily measurable but susceptible to noise contamination. To ensure the effectiveness of damage identification, a combination of frequency and vibration modes is selected as the input vector A for SSA-ELM, with the specific expression as shown in Equation (4):
A = F R 1 , F R 2 , , F R m ; M O 1 , M O 2 , , M O n
In Equation (4), m represents the order of frequencies used for damage identification, 1 ≤ m ≤ 3; n is the order of vibration modes used for damage identification,1 ≤ n ≤ 3; F R is the order frequency used for damage identification; MOi = (φi1, φi2, …, φiq) is the i-th mode parameter corresponding to q normalized mode vectors of test degrees of freedom.
Using the Sparrow Search Algorithm, the initial weights and thresholds of the Extreme Learning Machine are optimized to obtain the best values. Subsequently, these optimized values are applied to train and test the Extreme Learning Machine on both the training and testing datasets.
The output vector B for SSA-ELM consists of parameters such as mass corrosion ratio, bending capacity reduction coefficient, and bending stiffness reduction coefficient. Among these, the mass corrosion ratio serves as an indirect indicator of structural damage, laying the foundation for structural damage assessment. Meanwhile, the bending capacity reduction coefficient and bending stiffness reduction coefficient act as direct indicators of structural damage, providing a basis for post-disaster repair and reinforcement of the structure. The specific expressions are as shown in Equations (5)–(7).
B = η s , α , β
α = M η M 0
β = B η B 0
In Equation (5), ηs is the quality corrosion ratio, α is the reduction factor for flexural bearing capacity, and β is the bending stiffness reduction coefficient. In Equation (6), Mn and M0 represent the flexural bearing capacity of corroded and uncorroded concrete beams, respectively. In Equation (7), Bη and B0 are the flexural stiffness of corroded and uncorroded concrete beams, respectively.
Evaluate the prediction accuracy of the model using mean square error (MSE), as shown in Equation (8), which is negatively correlated with the model accuracy. The smaller the MSE value, the better the model’s prediction results, that is, the higher the overlap between the predicted data and the original data.
M S E = 1 n i = 1 n y i y ^ i 2
In Equation (8), y i is the actual value, y ^ i is for the predicted value, and n is the number of samples.
Design the fitness function for the Extreme Learning Machine (ELM) using the Sparrow Search Algorithm (SSA), defined as the mean squared error (MSE) of the training set error, as shown in Equation (9).
fitness   = a r g   m i n ( MSE   pridect )   fitness
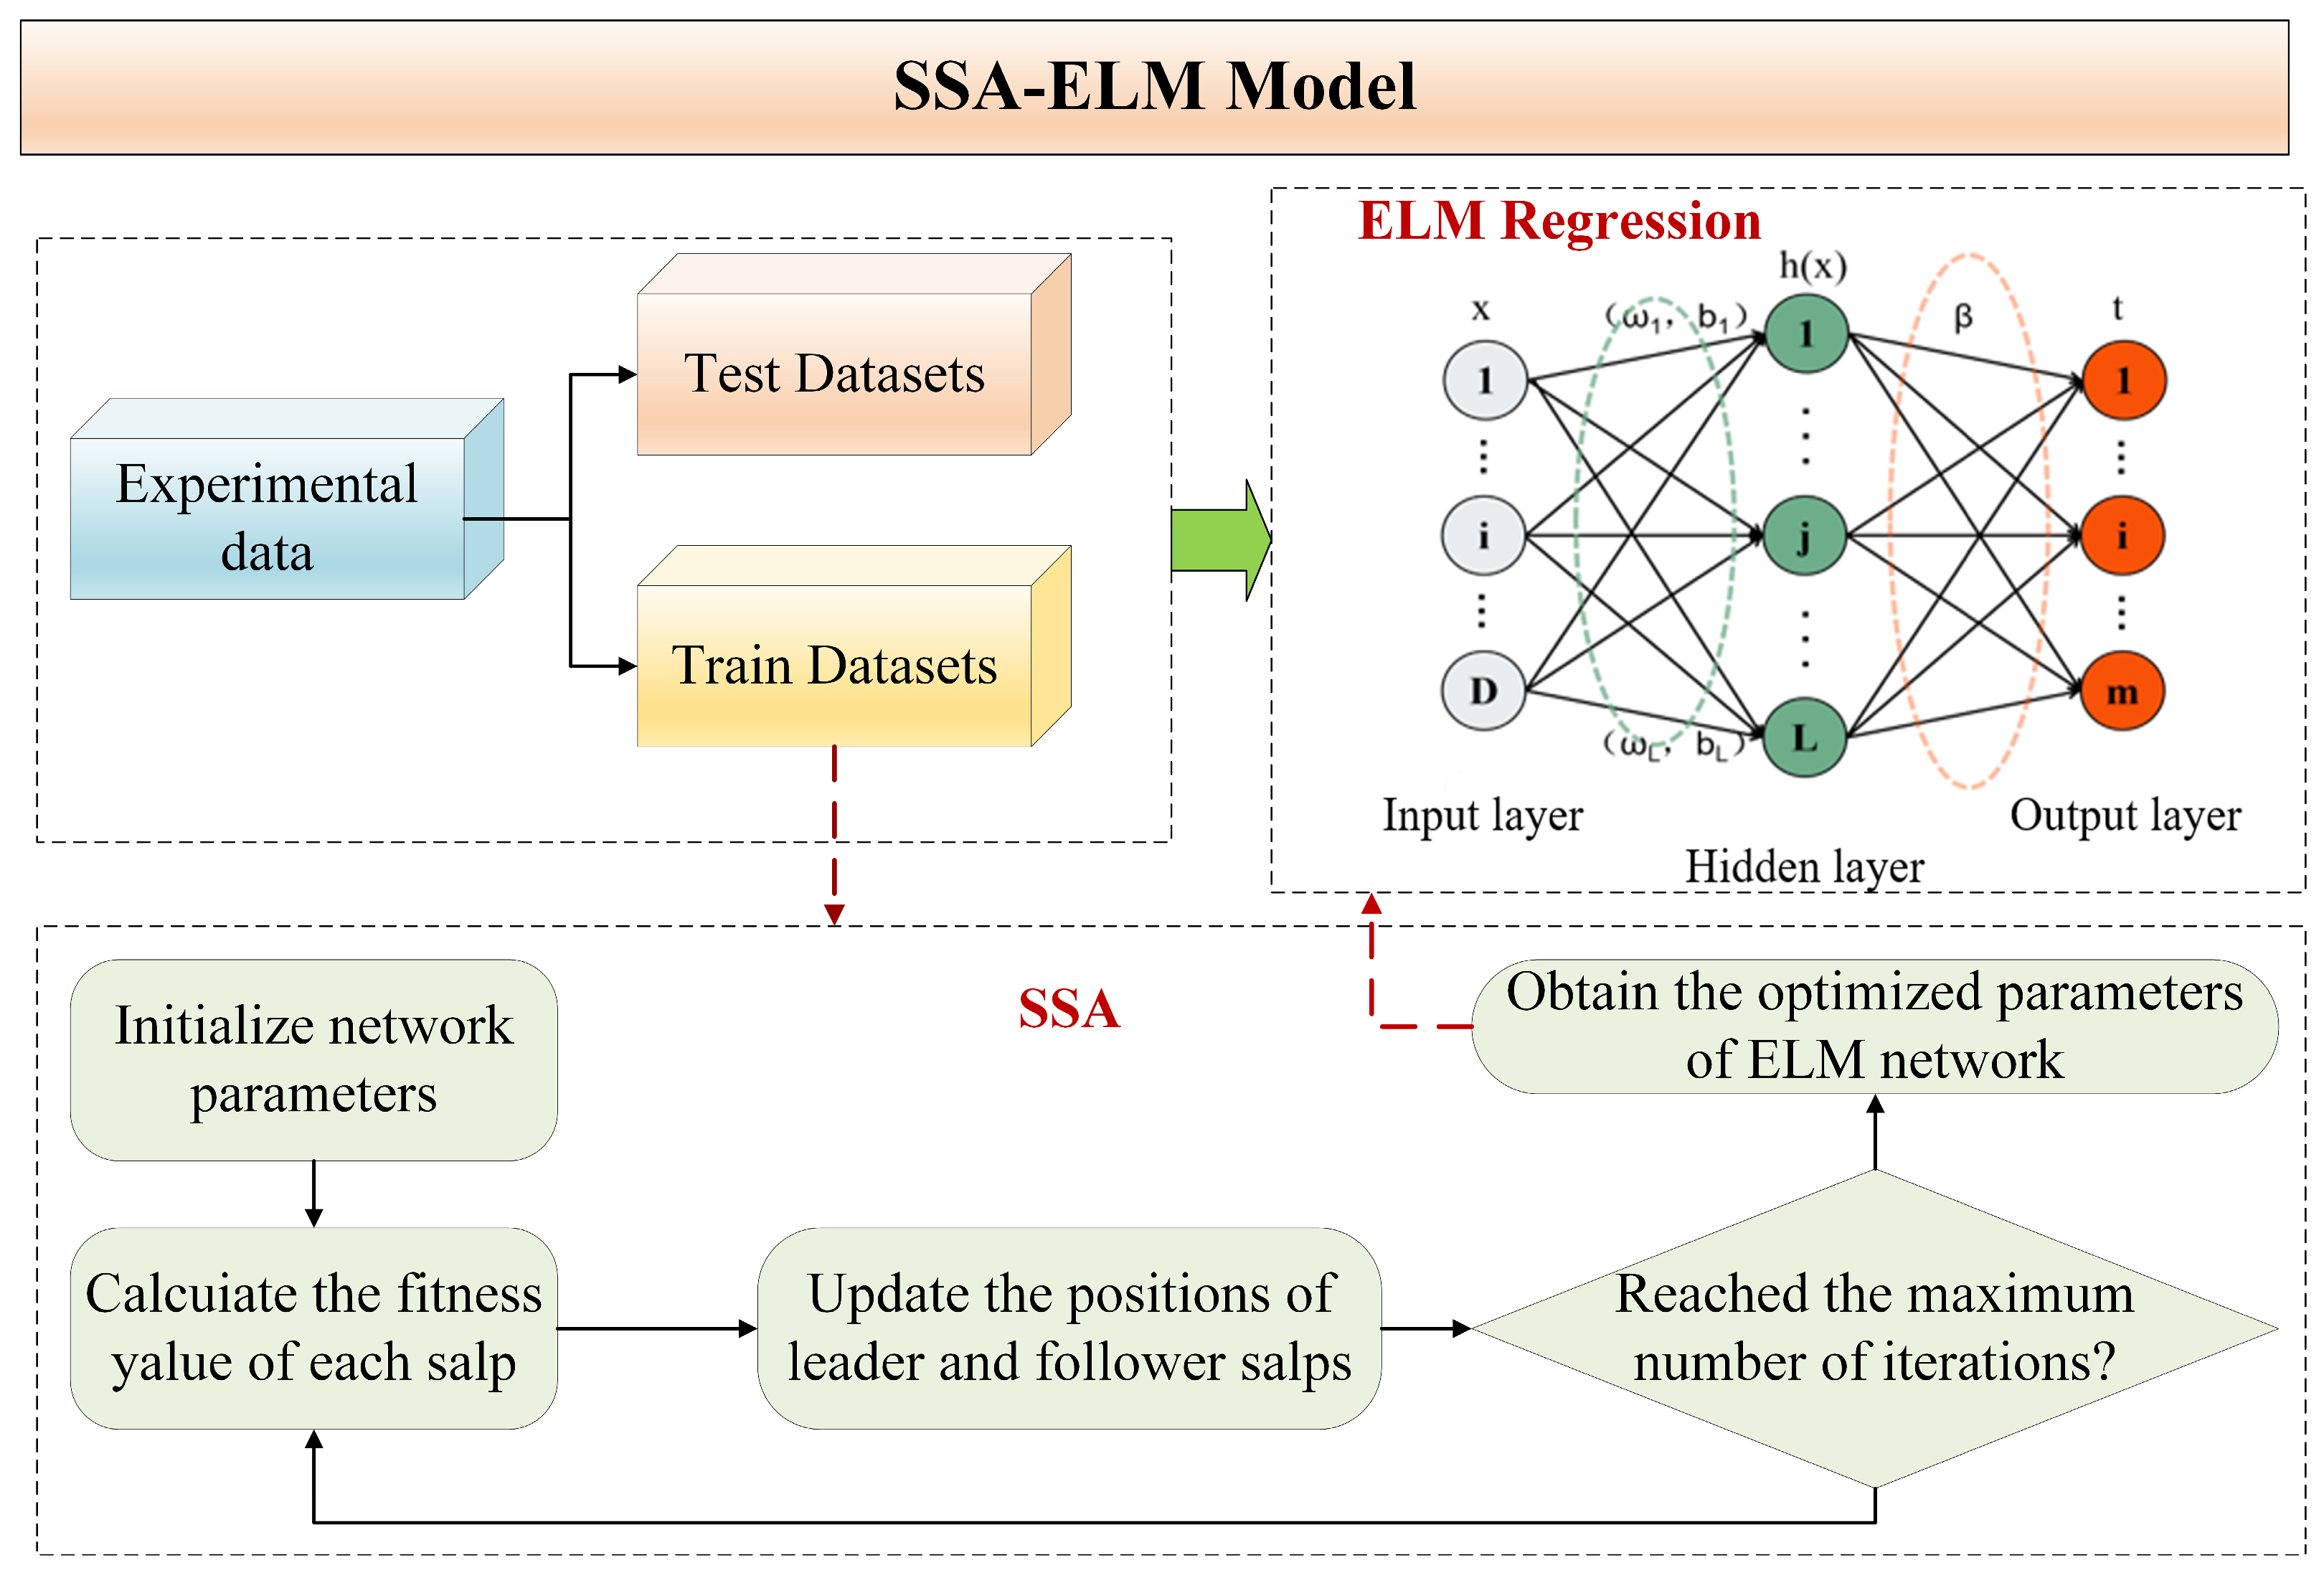
In summary, the brief steps of implementing SSA-ELM are as follows: firstly, data normalization and partitioning are performed to initialize the ELM hidden layer structure and randomly generate the input weights and biases; subsequently, parameters such as the population size and number of iterations are set by the Sparrow Search Algorithm (SSA) to iteratively optimize the input weights and hidden layer bias of the ELM with the prediction error (e.g., MSE) as the fitness function; SSA updates the global optimal parameters through the discoverer guide, follower-following, and vigilant perturbation mechanisms to update the sparrow position and finally output the global optimal parameters; substituting the optimized parameters into the ELM and calculating the output weights, and after evaluating the performance of the model by the training–validation–test set, the generalization ability is verified by visualization and comparative experiments, which forms a complete optimization framework from data pre-processing to parameter optimization, model construction, and effect validation. The brief implementation steps are presented in the form of a flowchart, as shown in Figure 3.

2.4. Practical and Scalable System Framework

To enhance the practicality and scalability of the corrosion beam damage identification system, this study presents a comprehensive technical solution across three dimensions: graphical user interface (GUI), deployment adaptation, and architectural design.
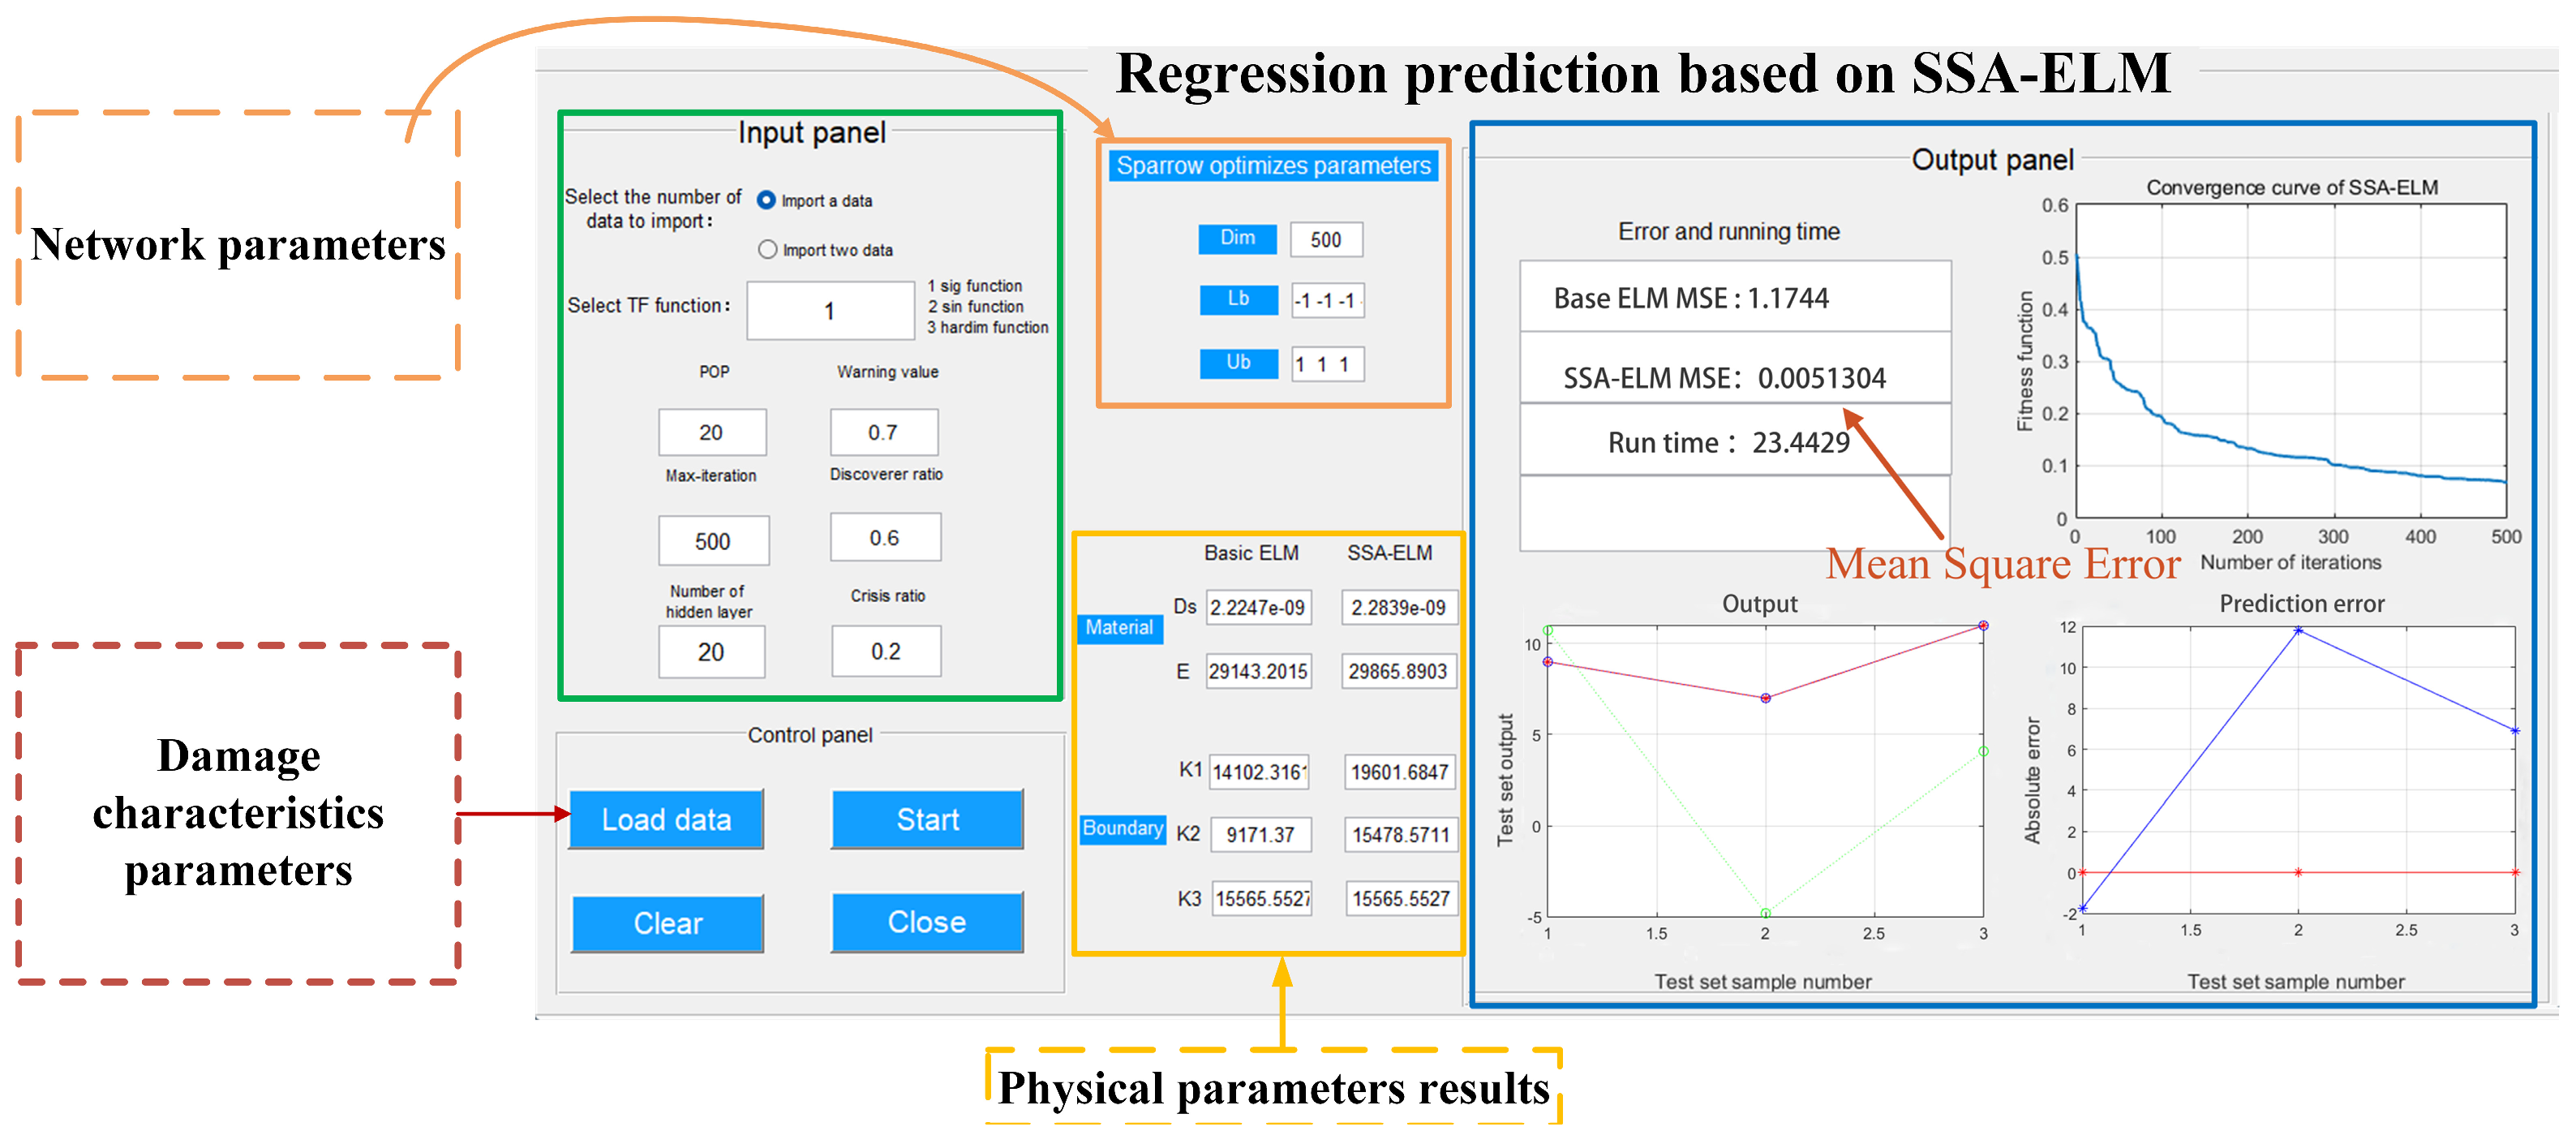
At the GUI level, a dedicated SSA-ELM interface was developed using MATLAB R2024a App Designer (as shown in Figure 4). This interface enables real-time damage identification results to be obtained through parameter configuration and data import. The system integrates template libraries for automated control generation, supplemented by API workflow diagrams, providing a multi-dimensional learning resource. In combination with robust exception handling mechanisms, this framework establishes a comprehensive quality assurance system that spans the entire development lifecycle, from implementation to maintenance.
For deployment adaptation, Docker containerization technology was employed to encapsulate the runtime environment, incorporating GPU acceleration modules compatible with CUDA 11.x architecture. Cross-platform (Windows/Linux/macOS) one-click deployment was achieved through MLPKG toolboxes and the MATLAB R2024A Add-On Explorer. Rigorous testing confirmed the binary compatibility stability, ensuring the system met industrial requirements for computational efficiency and deployment reliability.
Architecturally, a loosely coupled modular framework was constructed using MATLAB R2024A’s object-oriented system. Core functionalities were decoupled through abstract base class interfaces, with an mltoolbox.plugin.register mechanism supporting the dynamic integration of third-party algorithms. By leveraging the Parallel Computing Toolbox, algorithms such as k-means were automatically converted to SPMD parallel mode, forming a three-tier scalable architecture of “stable core—flexible plugins—elastic computing”. This design ensures a solid foundation of stability while providing extensible technical support for customized development in complex engineering scenarios.

3. Finite Element Simulation Verification

To validate the rationality of SS1A-ELM in damage identification, a finite element model was utilized to simulate the damage situation of corroded beams. The simulated frequencies and mode shapes were employed as input parameters for comparative analysis of the errors between ELM and SSA-ELM, thus validating the feasibility of SSA-ELM in damage identification.

3.1. Finite Element Model

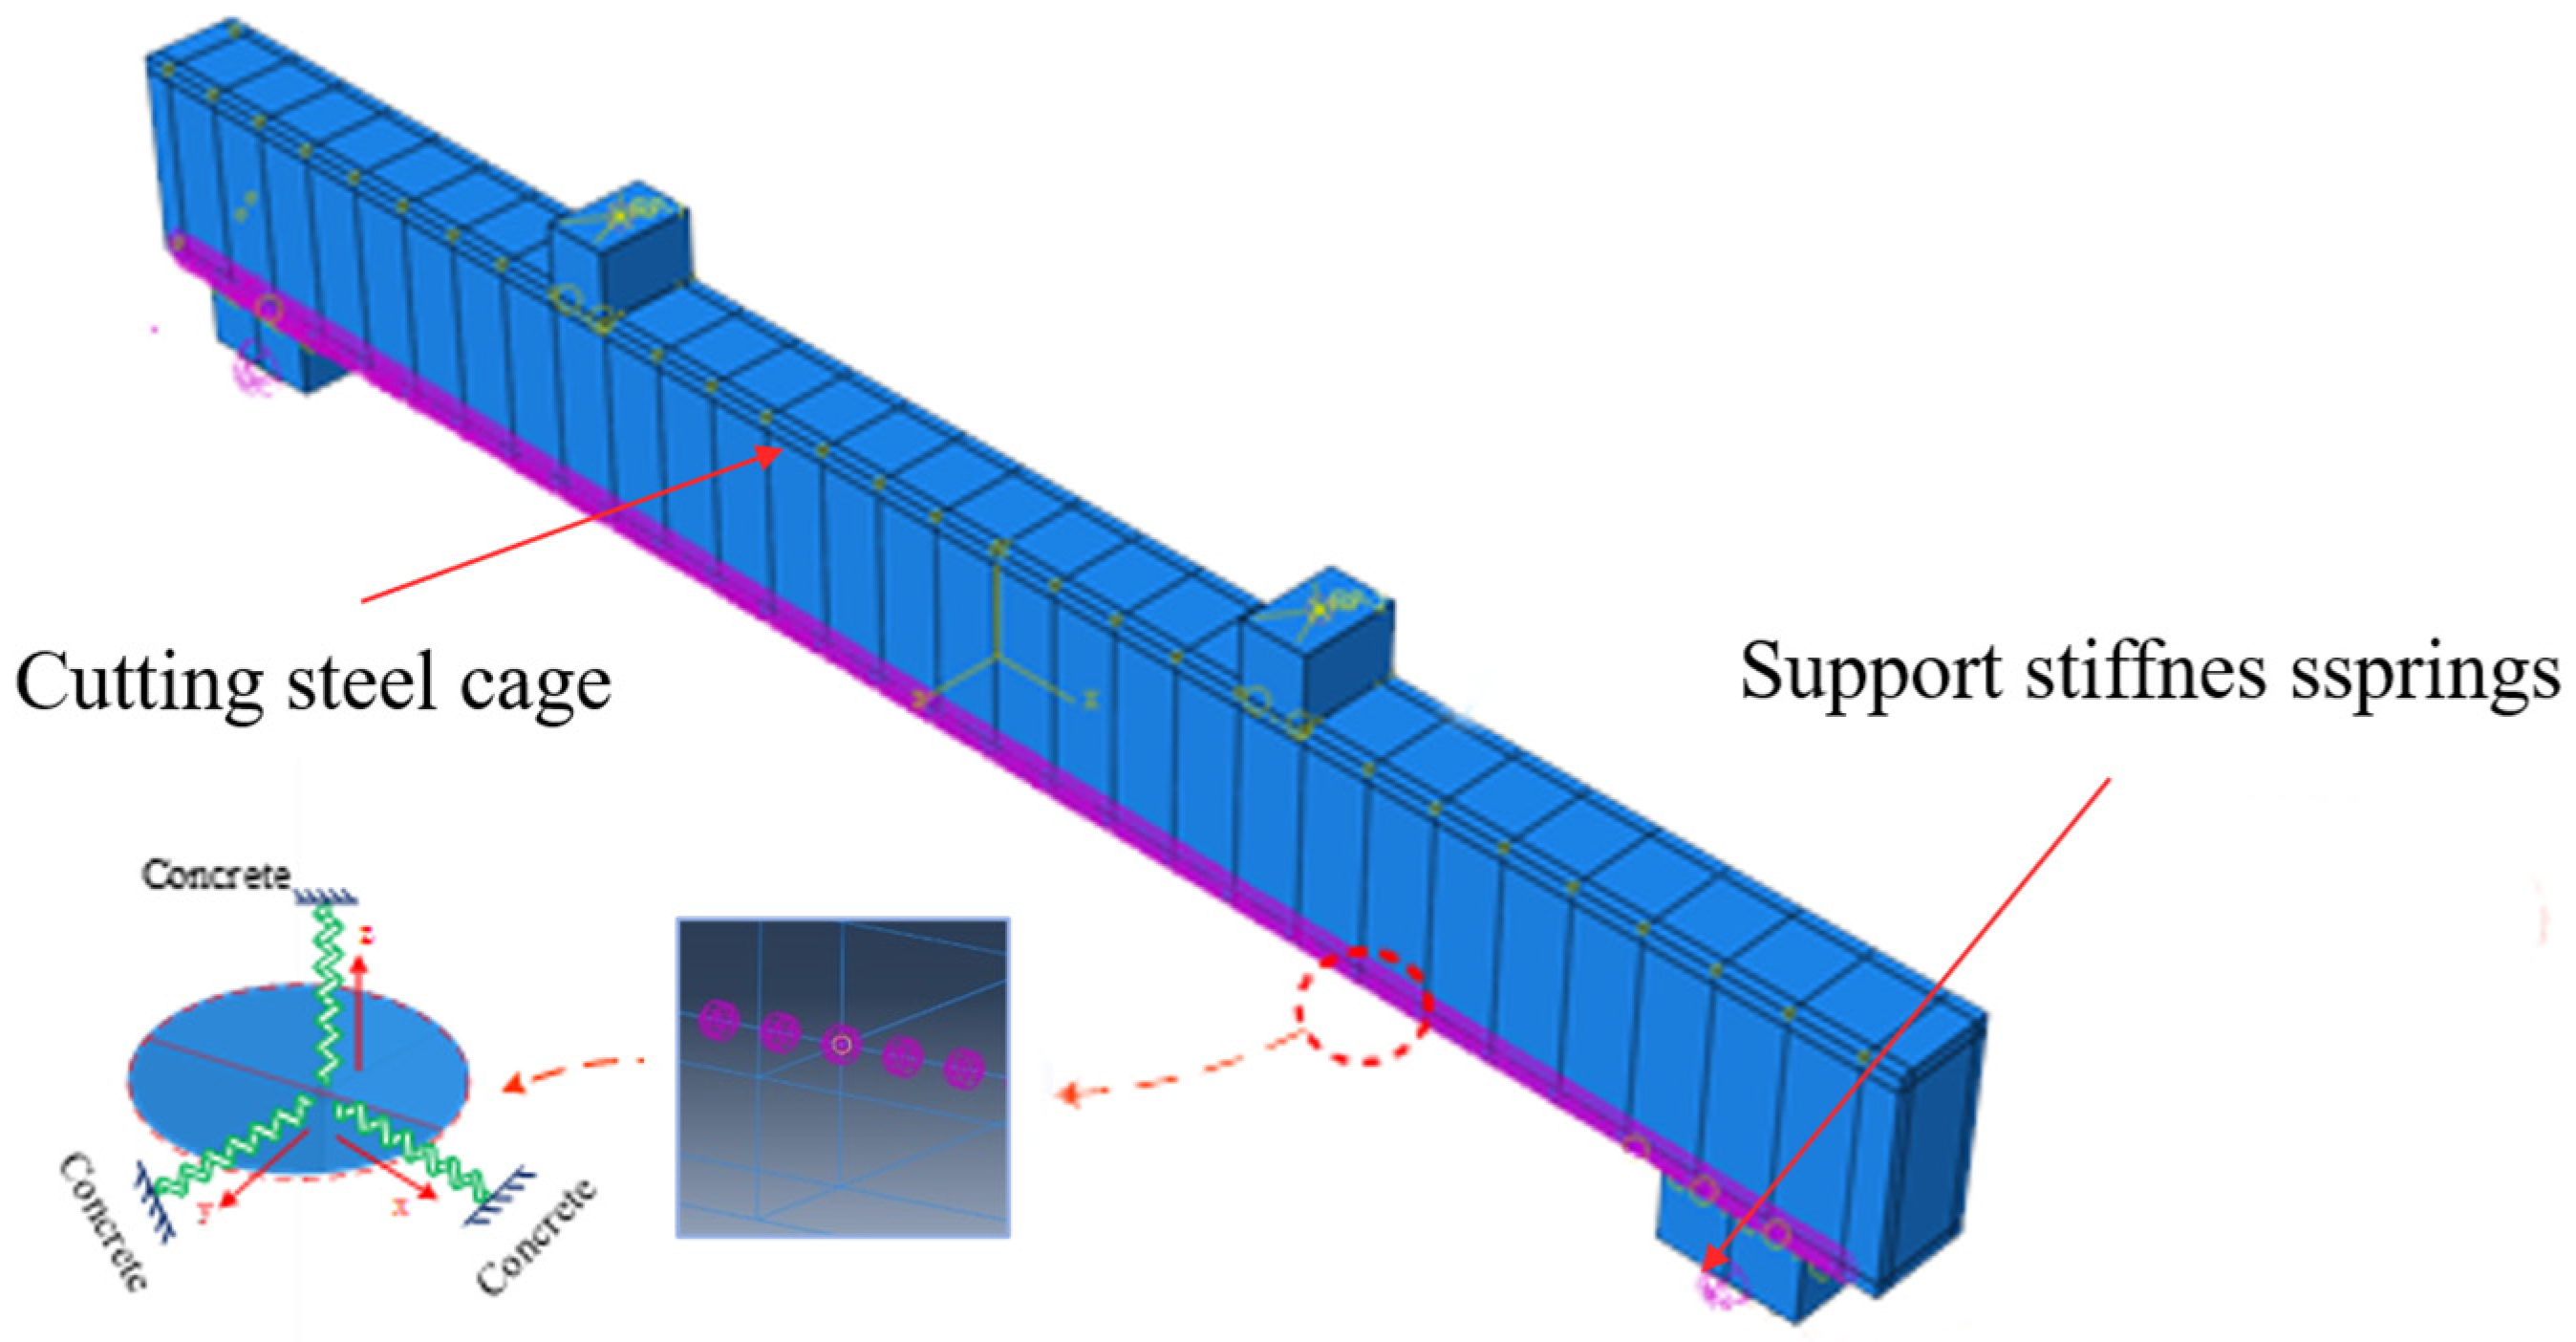
To simulate the corroded reinforced concrete beams, this study adopted ABAQUS for discrete modeling, considering both the bond between steel bars and concrete and the stiffness conditions of elastic supports. Concrete was modeled using C3D8R elements, while steel bars were represented using T3D2 elements. The C3D8R element, through reduced integration and plastic damage modeling, effectively captures the three-dimensional cracking and crushing nonlinearities in concrete. The T3D2 element, with adjusted cross-sectional area and strength parameters, accurately reflects the degradation of corroded steel reinforcement. When combined with bond–slip constitutive relationships [38], this element combination (C3D8R for concrete and T3D2 for steel) demonstrates robust capability in simulating the macroscopic mechanical behavior of corroded reinforced concrete components [39]. In order to establish three-directional springs at the junctions of steel bars and concrete in the x, y, and z directions, connectors with Cartesian attributes were used during modeling to establish the xyz triaxial springs, which were then assigned to each common node using connection assignments.
After meshing, springs were placed at the common nodes of longitudinal bars and concrete elements to simulate the bond between the steel bars and concrete. In total, 301 triaxial springs were placed on each longitudinal bar, evenly distributed along the longitudinal direction. The total number of nodes (301) is directly determined by the discretization of rebar elements along the length (300 elements), including start/end nodes and intermediate nodes. This node count arises from mesh discretization with a 10 mm interval, resulting in 301 shared nodes between rebar and concrete elements [40]. At the support locations, the connection type of triaxial springs was set to grounded, and six boundary points were selected on the support surface to sequentially add grounded springs, thereby simulating supports with vertical stiffness considered at both ends. The boundary conditions of simply supported beams, the arrangement of steel bars, and the distribution of internal springs are illustrated in Figure 5.
The stiffness of the springs simulating bond stress along the longitudinal direction of the steel bars is designated as K1. In contrast, the vertical spring stiffness of the left and right supports is designated as K2 and K3, respectively.
The spring stiffness values (K1, K2, and K3), corresponding to the stiffness components (Kx, Ky, and Kz) of the three-directional springs implemented using Cartesian connector elements at shared nodes, were determined as follows:
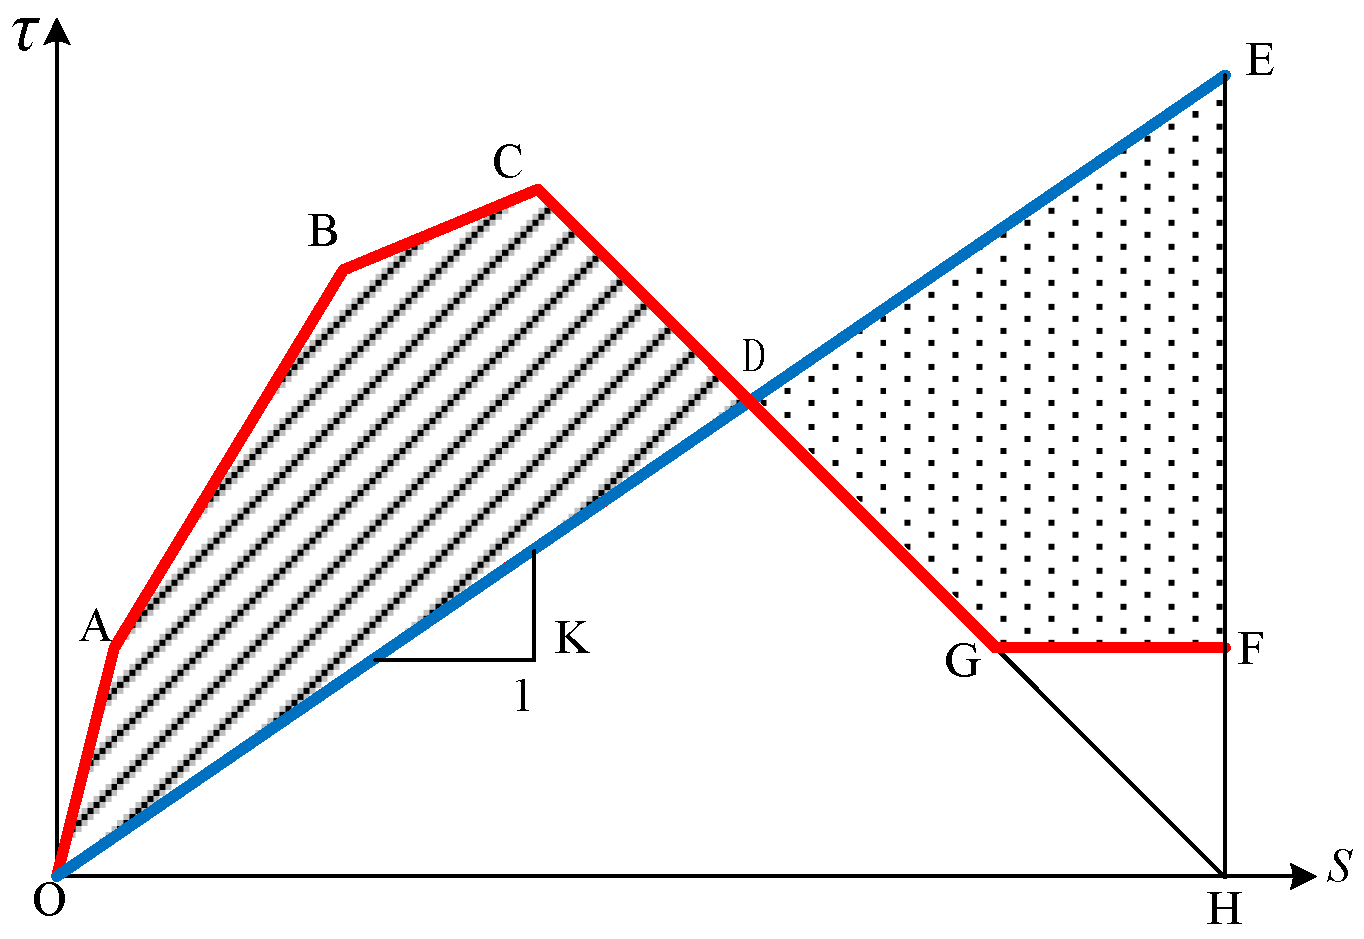
Kx (parallel to the rebar, horizontal direction): This stiffness, governing the bond–slip behavior between the corroded reinforcement and concrete, was derived from the local bond–slip constitutive model for corroded reinforced concrete. Specifically, an energy equivalence method based on existing bond–slip models is employed, as illustrated in Figure 6. This method ensures the area under the idealized curve (S-OABCD) equals that under the actual curve (S-DEFG), with the residual slip at point F defined by the intersection (point H) of the extension of segment CG with the slip axis. The slope k of the line segment ODE is obtained through integration of this equivalent model. Kx is then calculated by multiplying k by the surface area of the reinforcing bar segment within the bond zone.
Ky and Kz (perpendicular to the rebar, normal directions): These stiffnesses were assigned sufficiently large values to effectively prevent relative displacement in the directions normal to the reinforcement, thus neglecting slip in these directions. The linkage unit is specifically shown in Figure 7.
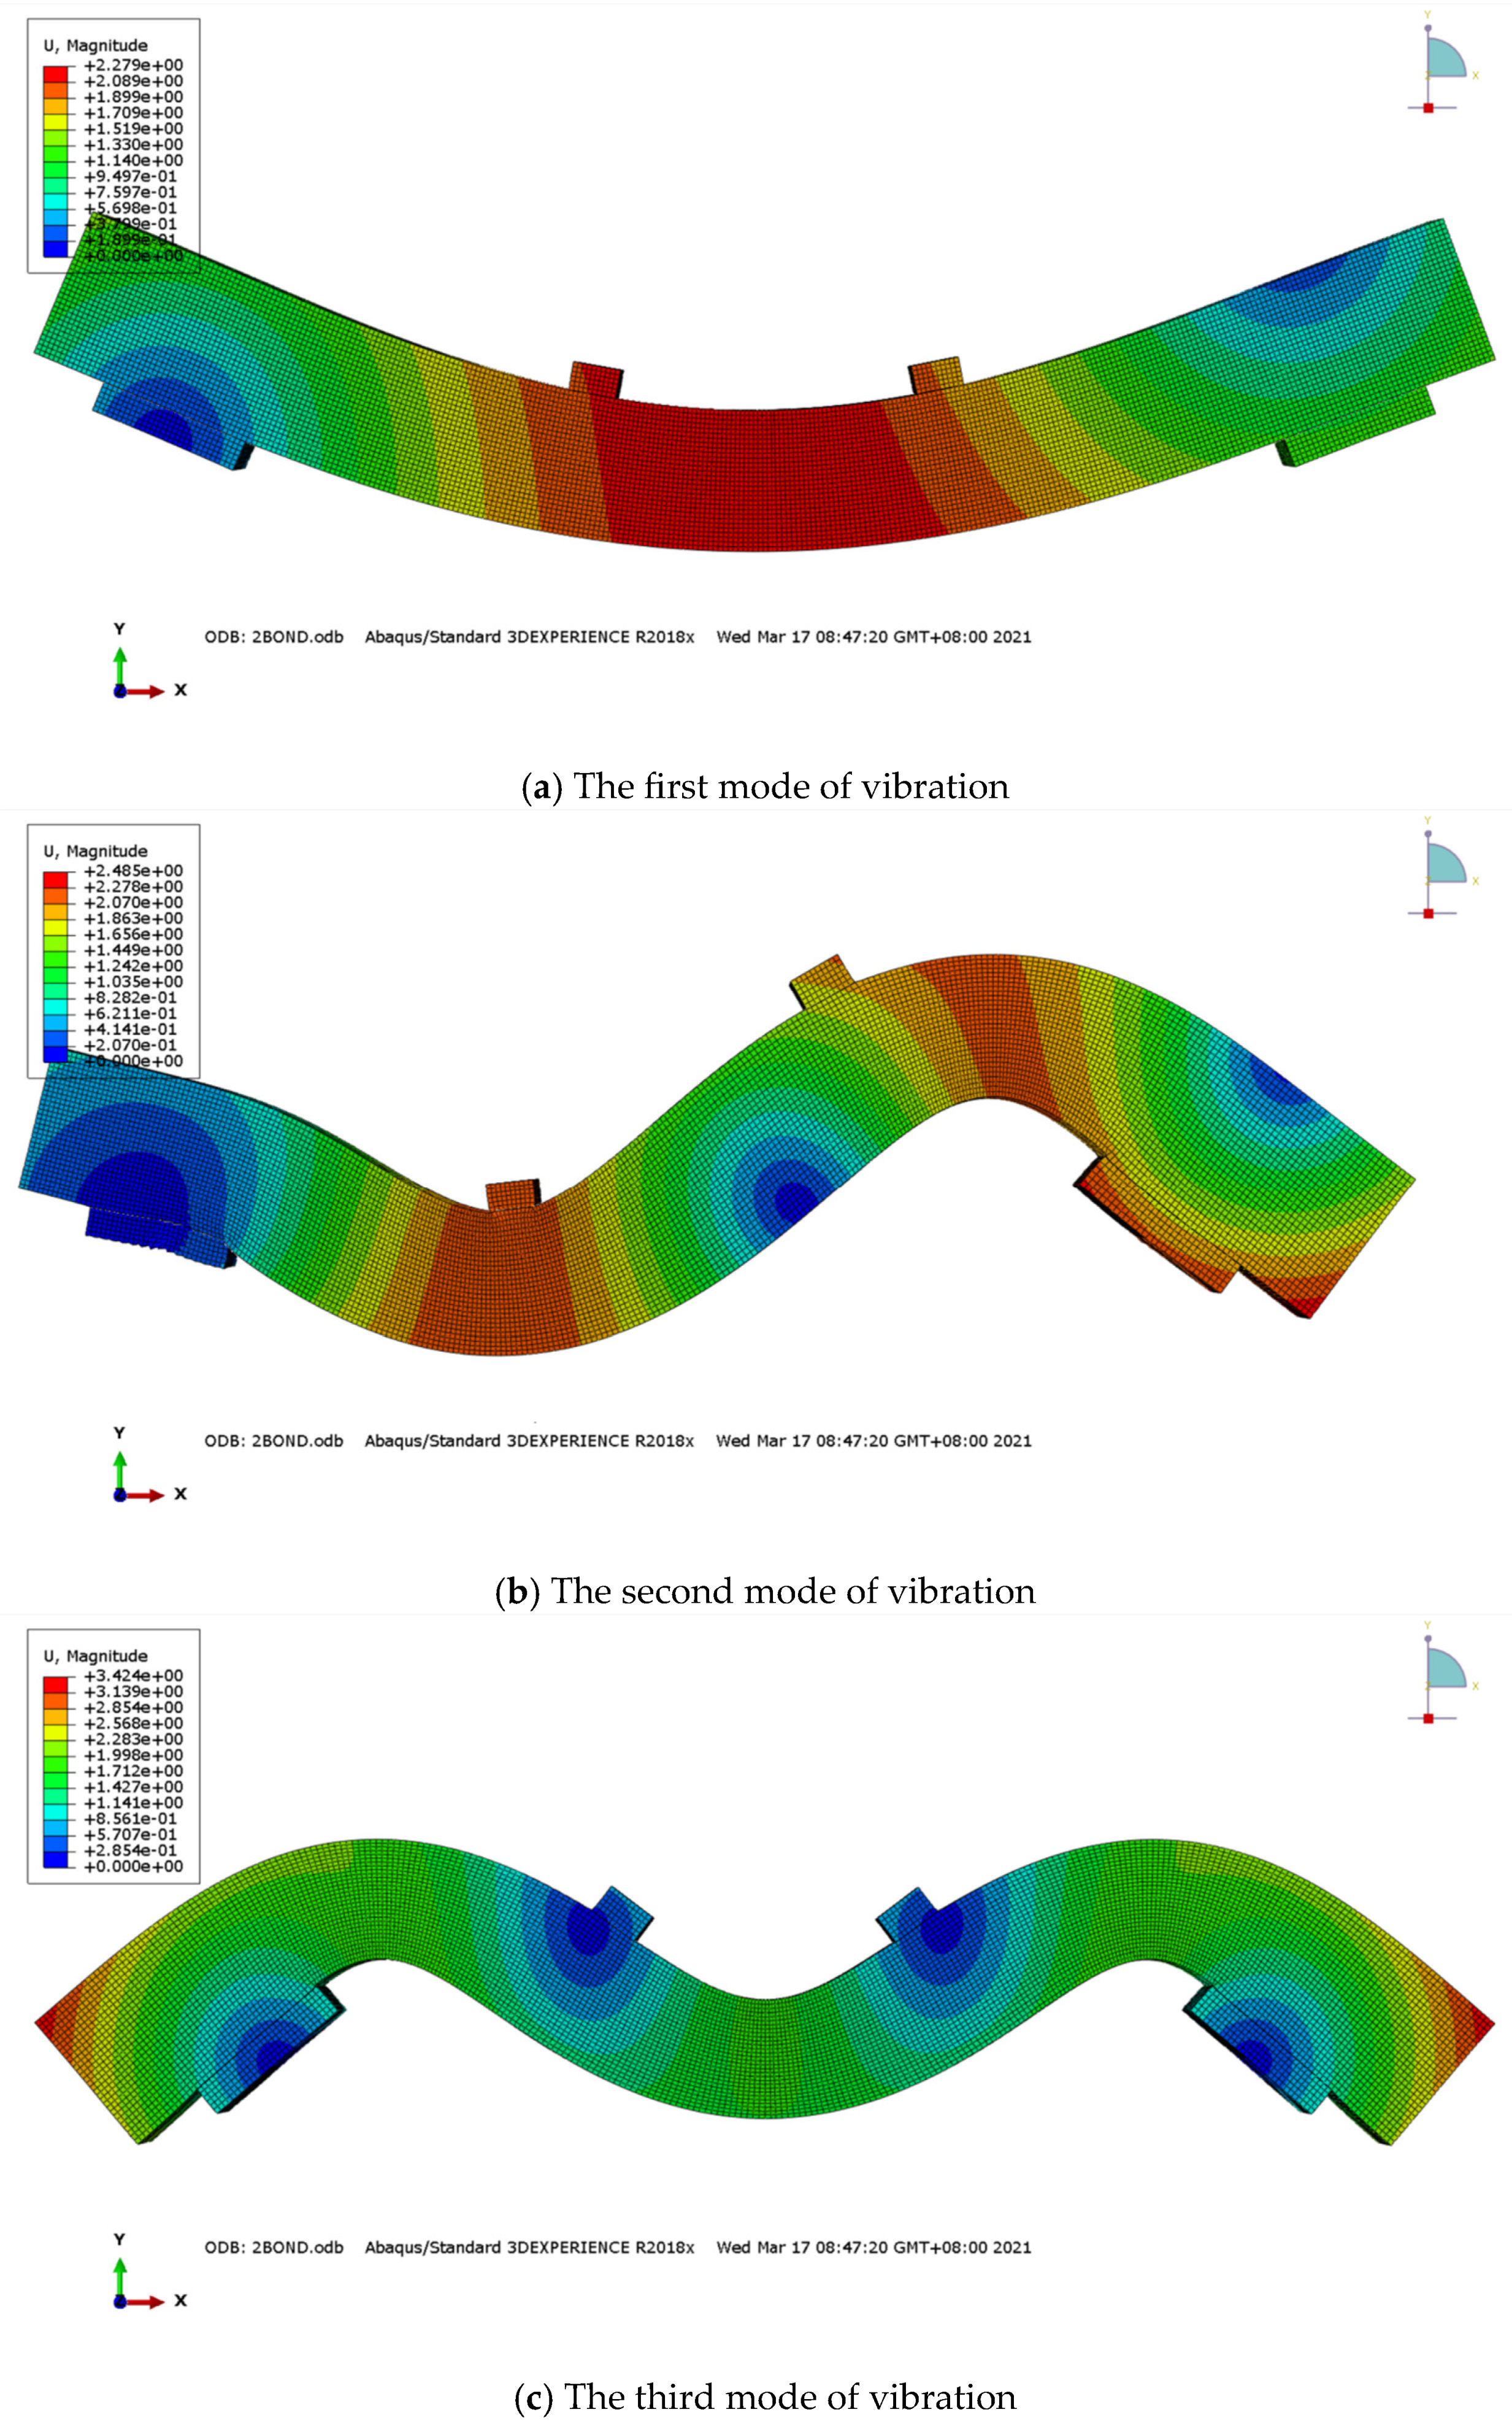
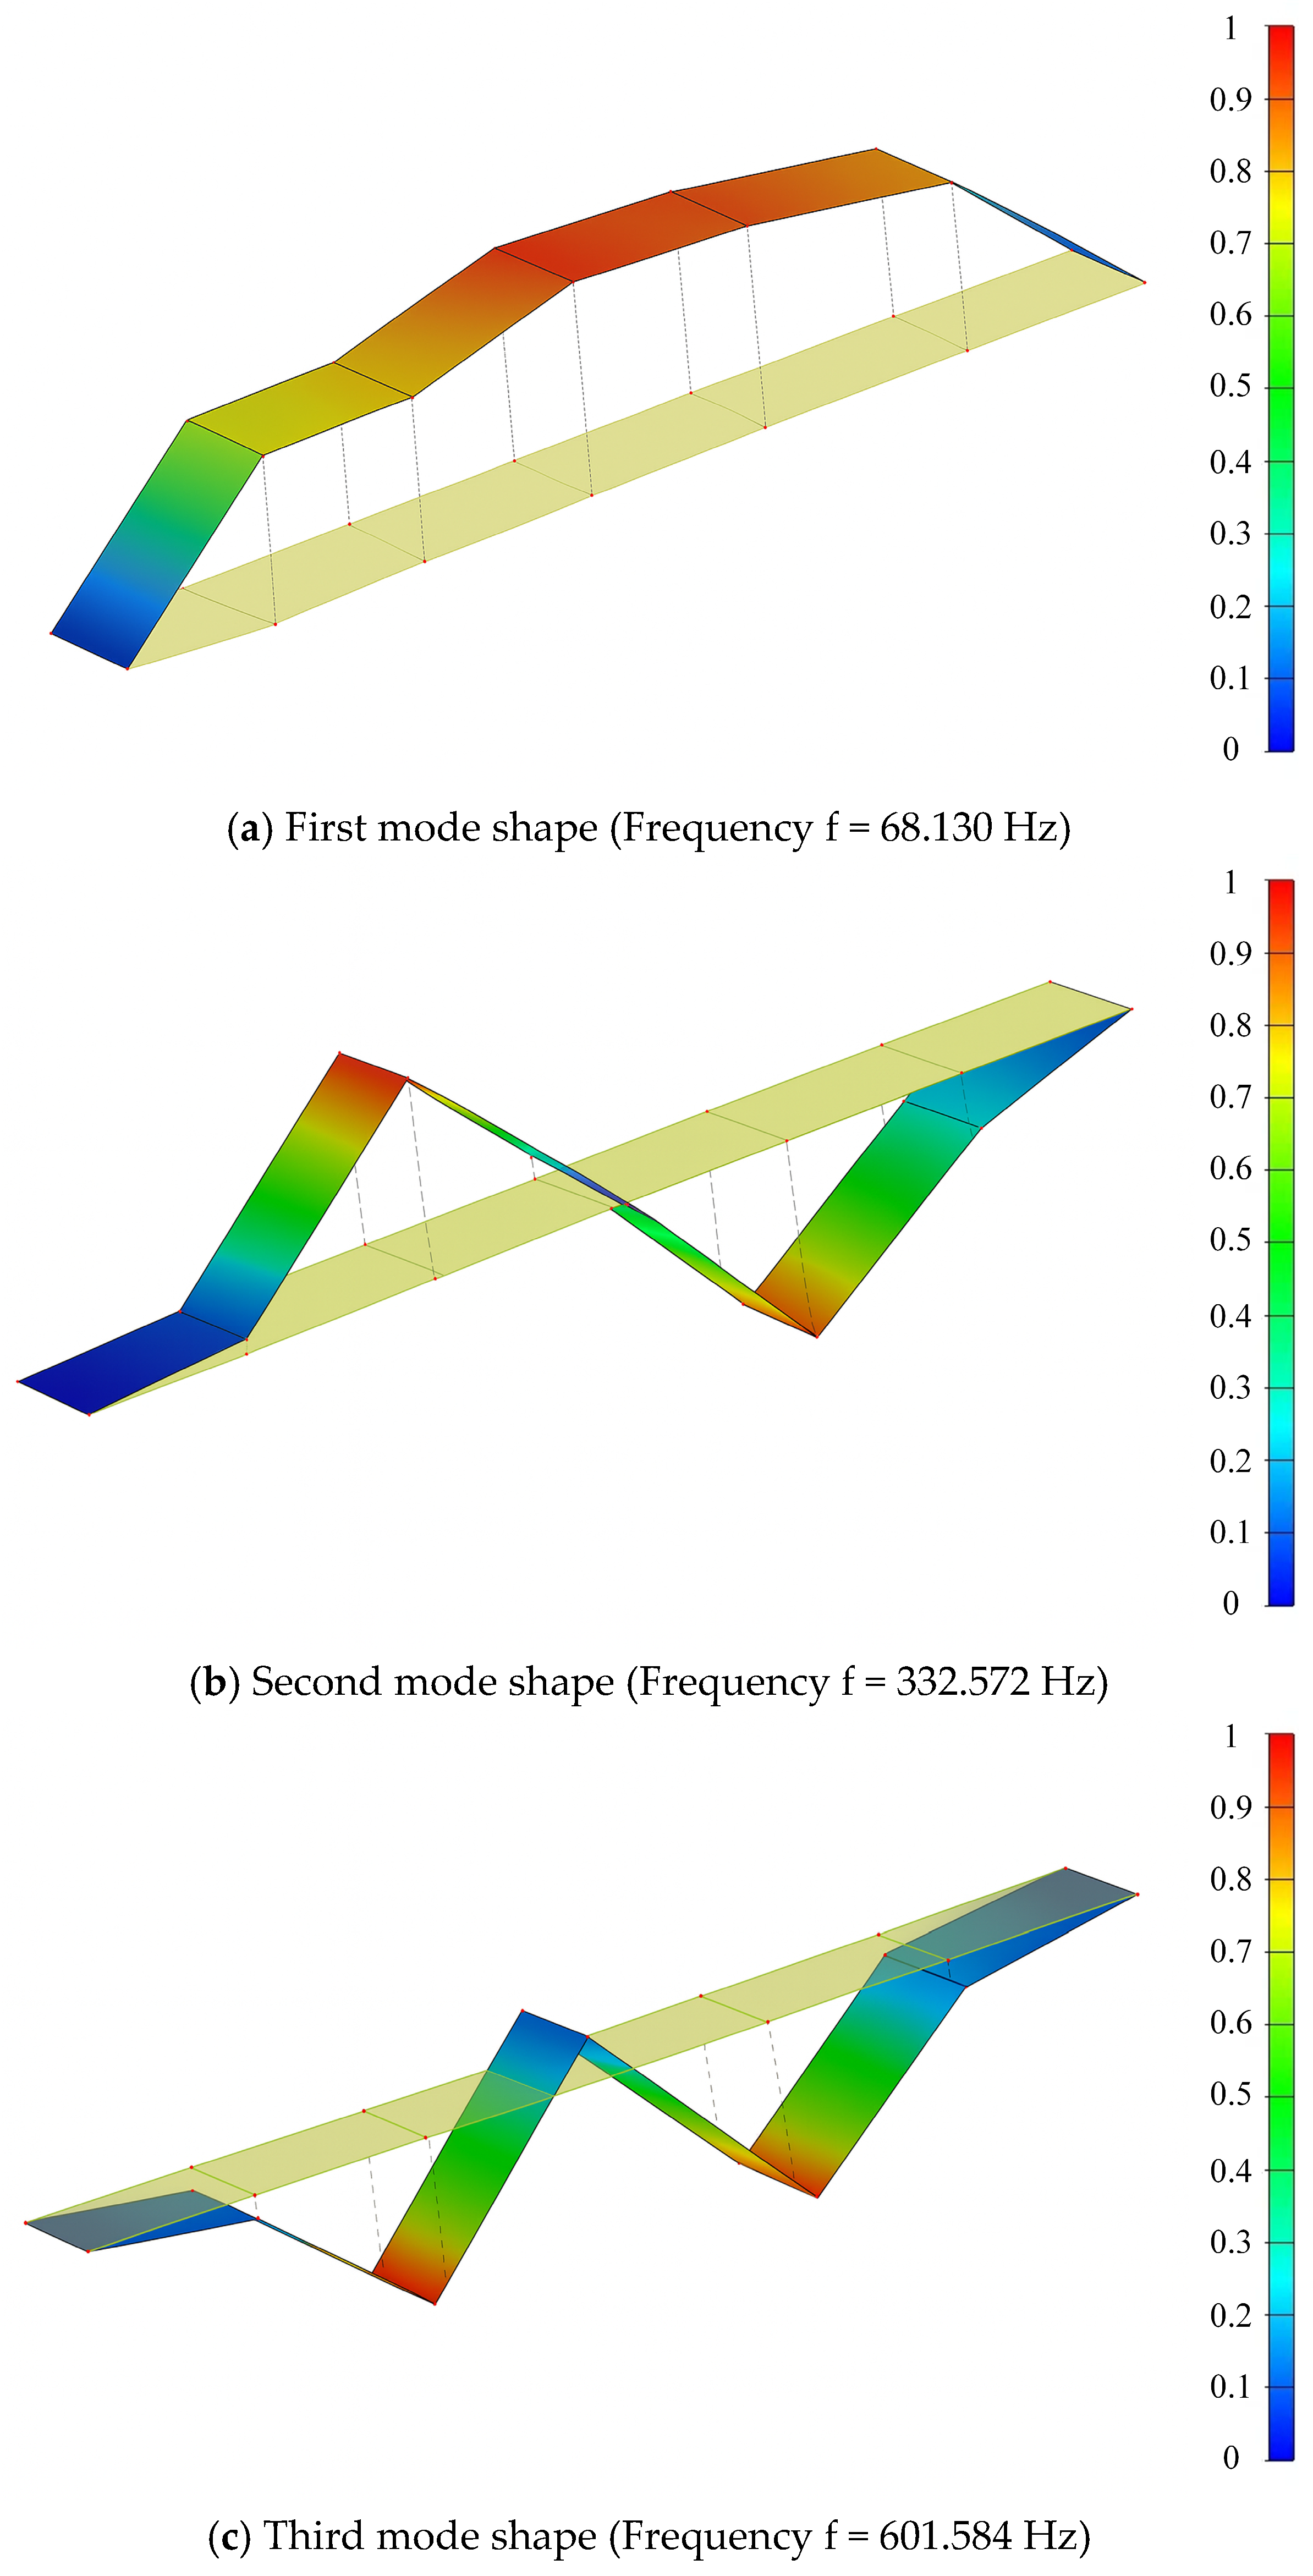
Additionally, the stiffness of the springs in the other two directions is set to the maximum value. The initial values of the parameters for the numerical “experimental” beam are listed in Table 1. Figure 8 illustrates the dynamic response of the “experimental” beam under three different modes in its undamaged state.
In order to assess the consistency and reliability, the MAC decay diagram is shown in Figure 9. The phenomenon that the modal correlation coefficient (MAC) gradually decays with the increase in corrosion rate reveals the significant influence of corrosion on the dynamic properties of the structure: corrosion leads to the degradation of the bonding performance between the reinforcement and the concrete, the uneven distribution of the local stiffness, and the deterioration of the overall dynamic properties (e.g., the frequency reduction and the vibration pattern distortion), which reduces the consistency of the modal shapes with the baseline state; the MAC, as a quantitative index, effectively captures the modal changes induced by corrosion. As a quantitative indicator, MAC effectively captures the modal changes caused by corrosion, and its attenuation trend not only verifies the reliability of the model prediction but also provides a key basis for the structural durability assessment, which indicates that corrosion can significantly weaken the stability and predictability of the structural dynamic behaviors.

3.2. Stiffness Parameter Modulation

This study employs stiffness parameter modulation to simulate corrosion severity in structural modeling. Corrosion-induced bond degradation between steel reinforcement and concrete alters global structural stiffness, subsequently affecting dynamic characteristics such as natural frequencies and mode shapes. This relationship demonstrates that corrosion parameter adjustment can effectively influence input variables for damage detection algorithms, thereby reflecting structural degradation. Specifically, spring stiffness parameters (K1, K2, and K3) in the model impact damage detection accuracy and algorithm convergence efficiency through the following mechanisms:
(1)
Impact on Detection Accuracy
Stiffness parameters directly quantify corrosion-induced bond degradation and global stiffness reduction. Proper parameter calibration enables accurate mapping of damage-sensitive features such as frequency shifts and mode shape distortions. When parameters align with actual damage patterns (e.g., K1 representing longitudinal bond degradation and K3 characterizing transverse cracking), feature extraction fidelity improves, reducing false detection rates. Conversely, parameter mismatch distorts input variables from true damage signatures, compromising model generalization capability.
(2)
Impact on Convergence Efficiency
In the SSA-ELM (Sparrow-Search-Algorithm-optimized Extreme Learning Machine) framework, stiffness parameters influence optimization efficiency by regulating feature space dimensionality and objective function complexity. Reasonable K value ranges (e.g., K2 controlling nonlinear thresholds) constrain the search space, accelerating global optimization convergence. However, parameter redundancy or insufficient sensitivity introduces solution space noise, leading to slowed convergence or local optima entrapment.
(3)
Parameter Optimization Strategy
Stiffness parameters require experimental or numerical calibration to balance precision and computational efficiency. This study optimizes parameter initialization through corrosion rate–stiffness relationship curves, significantly enhancing damage identification reliability and convergence stability. The proposed methodology establishes a systematic framework for parameter-driven structural health monitoring in corrosive environments.

3.3. Performance Evaluation of SSA-ELM Using Simulated Values

Modal analysis of corroded beams was conducted to obtain modal parameters before and after corrosion. When performing modal analysis of corroded beams, the influence of corrosion on the modes must be fully considered. After the corrosion of the steel bars, the cross-sectional area of the longitudinal bars decreases, while the accumulation of corrosion products on the surface of the steel bars leads to a continuous decrease in the bond strength between them and the concrete [41]. Hence, during modal analysis of corroded beams, adjustments should be made to reduce the cross-sectional area of the steel bars and adjust the stiffness of the springs between steel bars and concrete based on the constitutive properties of corroded steel bars.
Following the principle of energy equivalence based on the constitutive relationship of corroded steel bars, the stiffness of the springs was established. Modal analysis was subsequently conducted to obtain the modal parameters of finite element models of corroded beams at various corrosion ratios. Because the trend of bond strength is relatively complex when the corrosion ratio is between 0% and 2%, and this corrosion ratio range is not within the focus of this study, the corrosion ratio selected in this study ranges from 0% to 2~20%. The corrosion ratio was incremented by 1% intervals to construct training samples, with changes made to the cross-sectional area of the steel bars and the stiffness of the springs after corrosion. Twenty sets of corroded beam modal parameters with different corrosion ratios were calculated, and according to empirical studies in the authoritative literature in the field [40], 10% amplitude noise achieves the best balance between maintaining data fidelity and enhancing the robustness of the model, and 10% level of Gaussian white noise was added as an input for SSA-ELM damage identification. The corresponding corrosion ratio values for the 20 sets were used as outputs for SSA-ELM damage identification. Three sets of values were randomly selected as test samples, labeled as M1, M2, and M3, as shown in Table 2. The remaining values are used as training samples for model training.
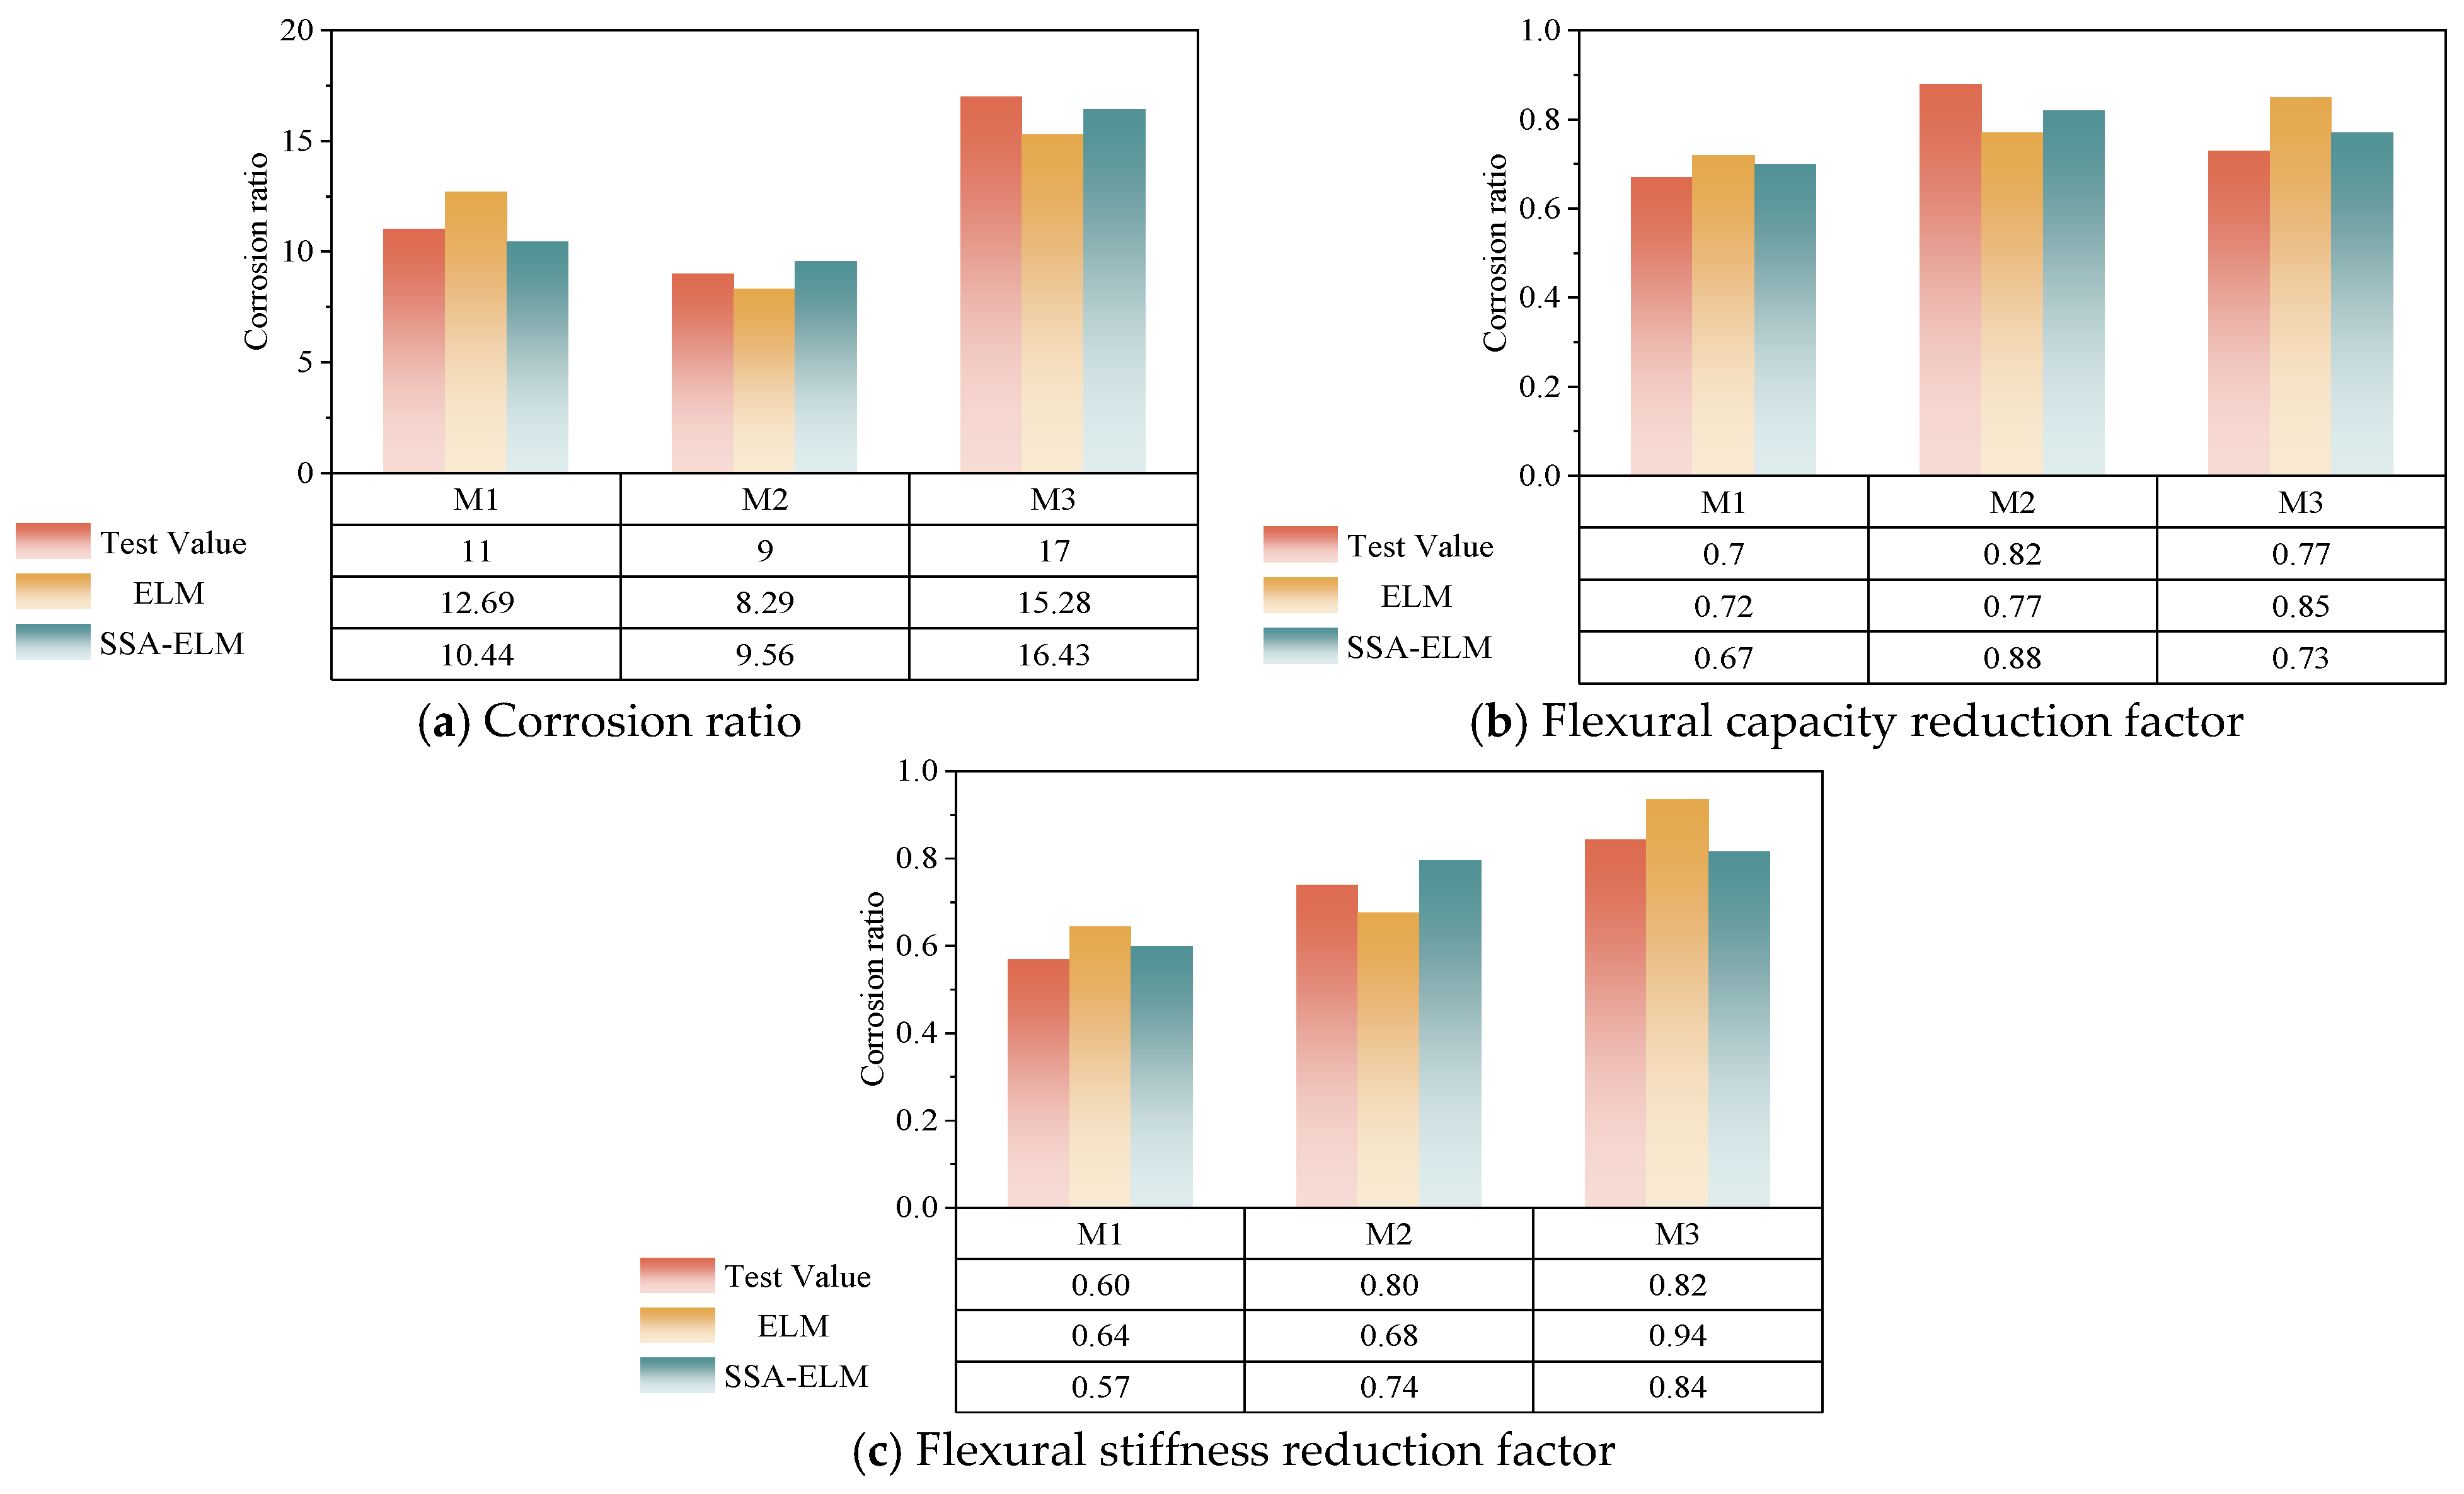
The corrosion ratio sample data were imported using the SSA-ELM interactive interface, which automatically partitioned the data into training and testing sets. Subsequently, both the SSA-ELM and the unimproved ELM algorithms were executed to perform damage identification on the data, with the results being output simultaneously. The outcomes of the damage identification are presented in Figure 10 and Figure 11.
It can be observed that the error range for corrosion damage identification using the SSA-ELM algorithm is between 3% and 6.5%, whereas the error range for the unimproved ELM algorithm spans from 7% to 16%. Taking the results of M1 as an example, the relative error decreased from 15.36% (unimproved) to −5.09% (SSA-ELM), representing a reduction in absolute error of up to 10.27%. For identifying residual bearing capacity reduction factors, the error range for SSA-ELM is between 4% and 8%, while the unimproved ELM algorithm exhibits an error range between 9% and 18%. Specifically, for the most significant error reduction in result M3, the relative error decreased from 17.61% (unimproved) to 5.94% (SSA-ELM), yielding a reduction of 11.67%. Analysis further indicates that the error range for identifying residual stiffness reduction factors with SSA-ELM is similar to that for identifying residual bearing capacity reduction factors, both ranging from 4% to 8%, while the unimproved ELM algorithm’s error range is between 9% and 14%. These results suggest that, compared to other machine learning algorithms, the SSA-ELM algorithm provides more accurate identification of the corroded beam model. MSE simulation verification is presented in Table 3.
By analyzing the identification results of the three damage indicators mentioned above, it is evident that the error of the damage identification algorithm using SSA-improved ELM remains stable within 8%. The accuracy is significantly improved compared to the unimproved traditional ELM damage identification algorithm, indicating that the SSA-ELM algorithm possesses a certain level of noise resistance. This demonstrates the feasibility and efficiency of the damage identification algorithm based on SSA-ELM, which can effectively identify the corrosion ratio, bearing capacity reduction factor, and stiffness reduction factor of corroded beams by inputting modal information under different corrosion conditions.

4. Experimental Study

To validate the accuracy of SSA-ELM in damage identification, dynamic and static tests were conducted on corroded reinforced concrete beams. Five distinct conditions, each simulating different levels of beam corrosion, were prepared. The reliability of the method was then assessed based on the experimental results.

4.1. Preparation of RC Beam Components

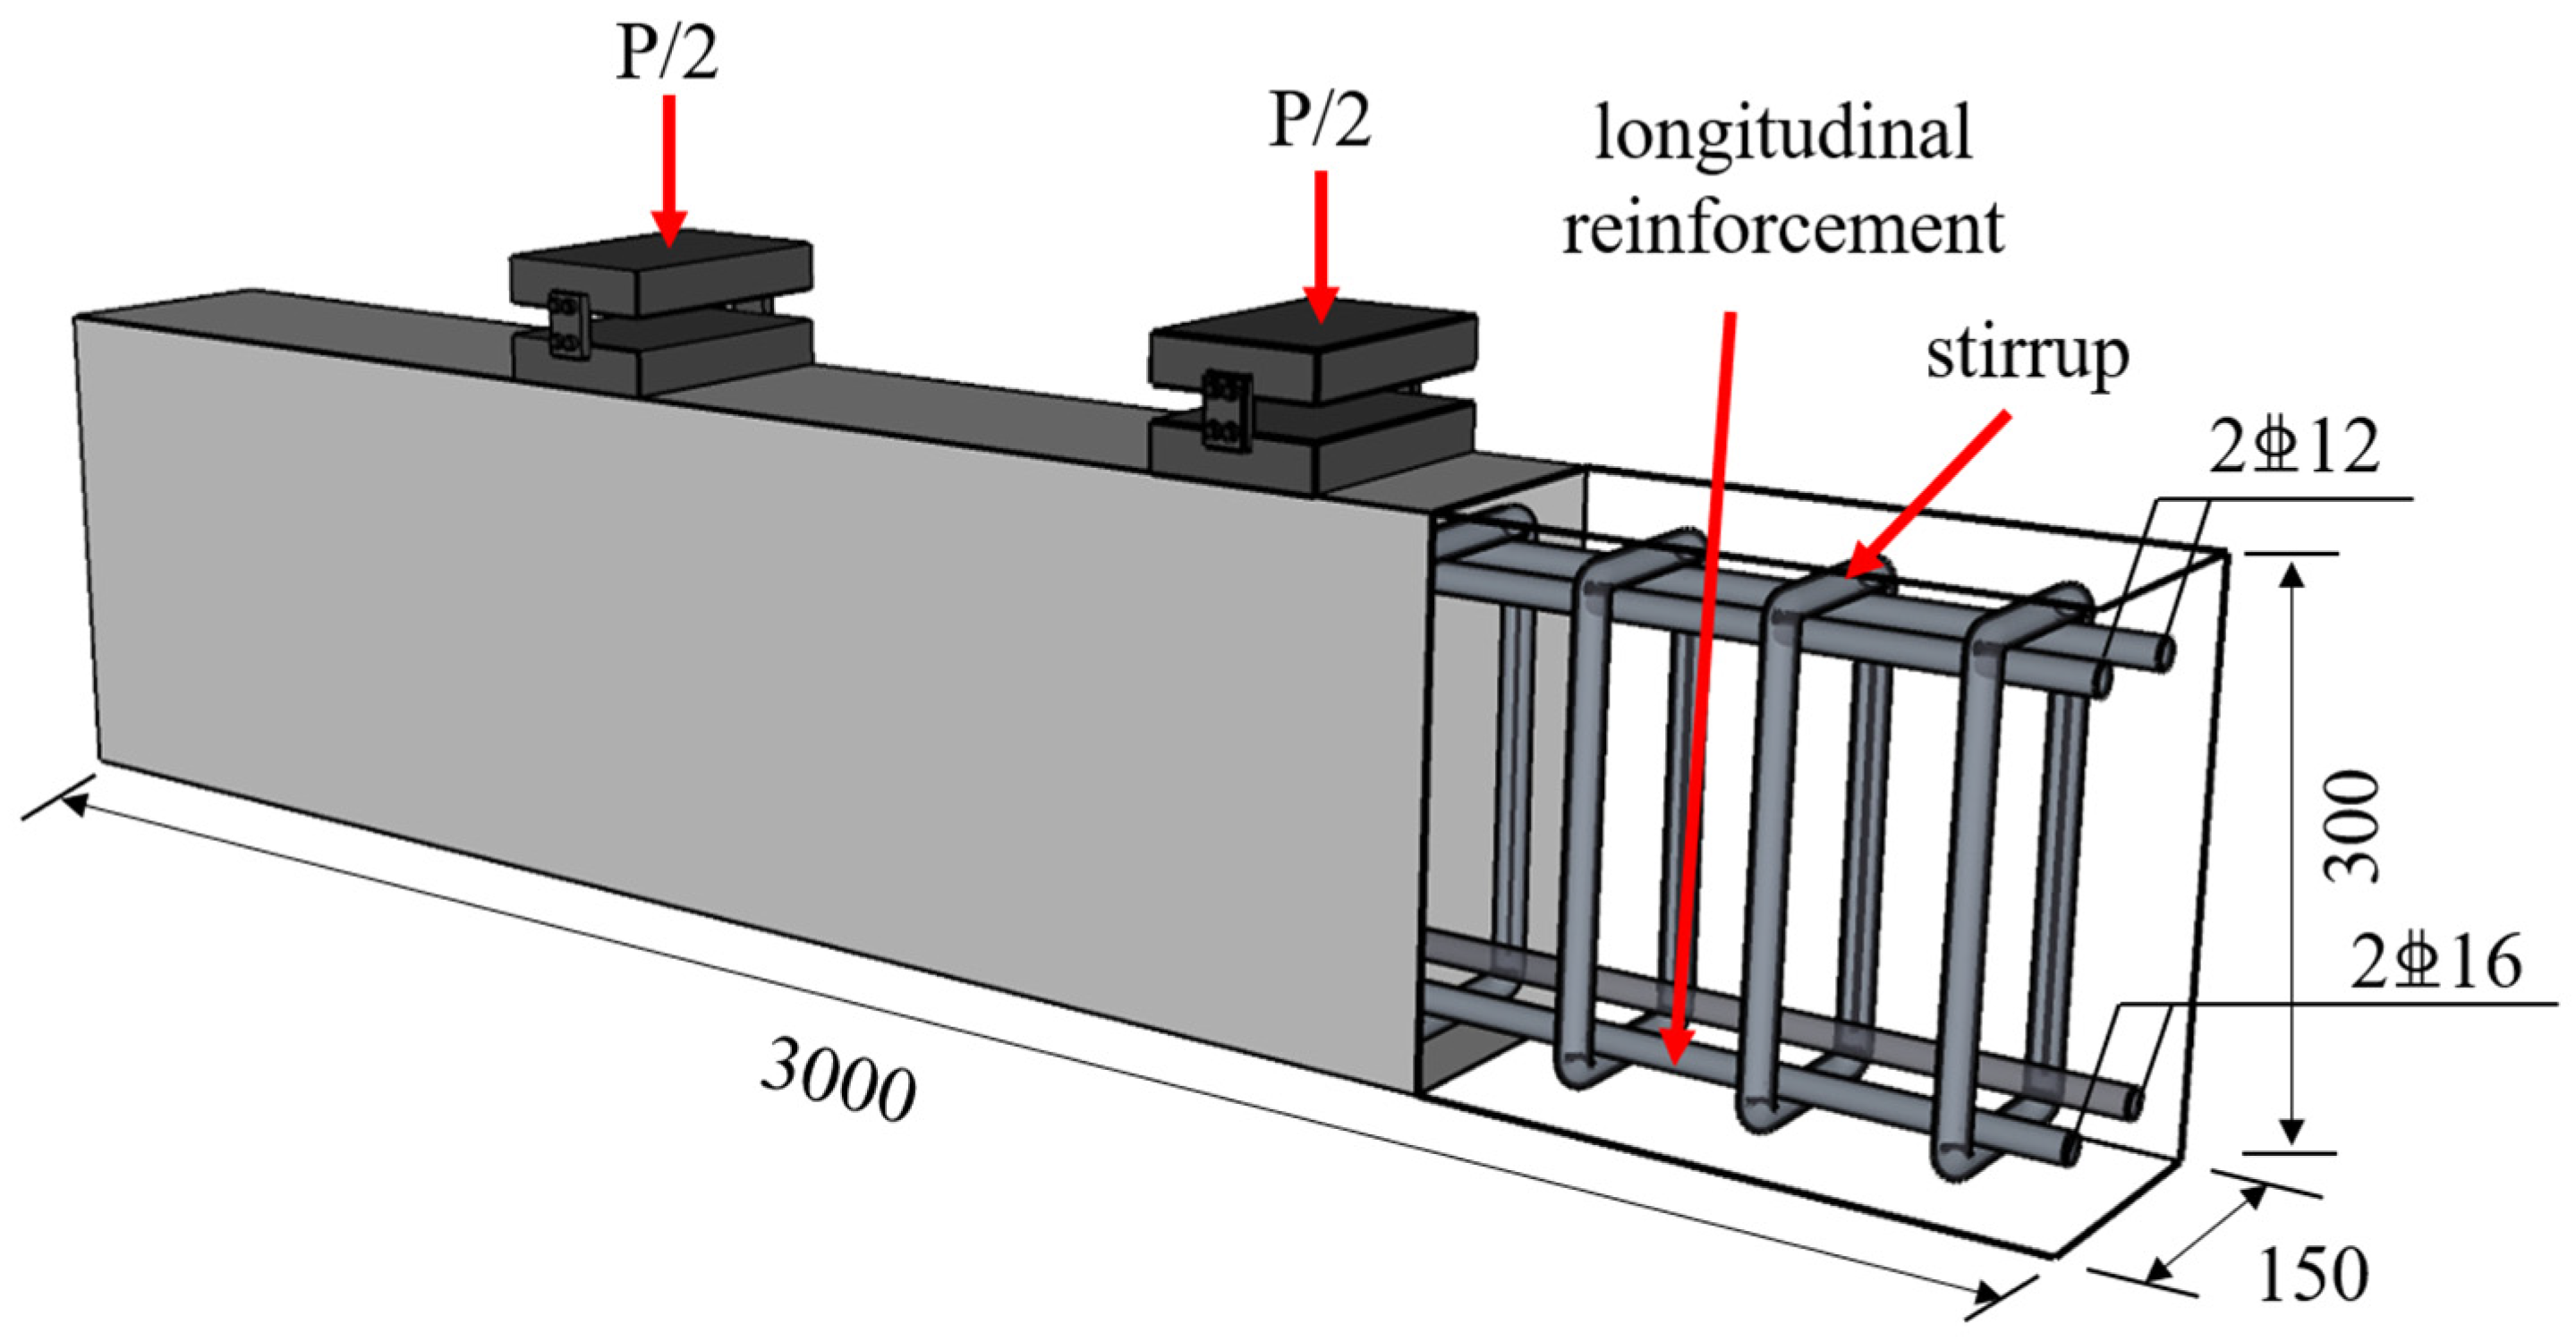
Reinforced concrete simply supported beams were designed with a total length of 3 m, including an effective length of 2.4 m, and a cross-sectional size of 150 mm × 300 mm. C40 concrete was used for casting the beams in this experiment. To investigate the impact of protective layer thickness, beams B1 to B5 were constructed with a protective layer thickness of 20 mm, while the remaining specimens had a protective layer thickness of 30 mm. The experimental design parameters are summarized in Table 4, and the detailed dimensions and reinforcement diagrams of the concrete beams are provided in Figure 12.
During the fabrication of the test specimens’ steel cages, wires were connected and extended from one end of the two tensioned steel bars for subsequent electrically accelerated corrosion. The primary focus of the corrosion study was on the longitudinal bars. To prevent corrosion of the stirrups during the electrochemical corrosion process, insulation treatment was applied to the connections between the stirrups and longitudinal bars. Insulation tape was used to wrap the corners of the stirrups and the junctions of the longitudinal bars to ensure electrical isolation.

4.2. Accelerated Corrosion Test

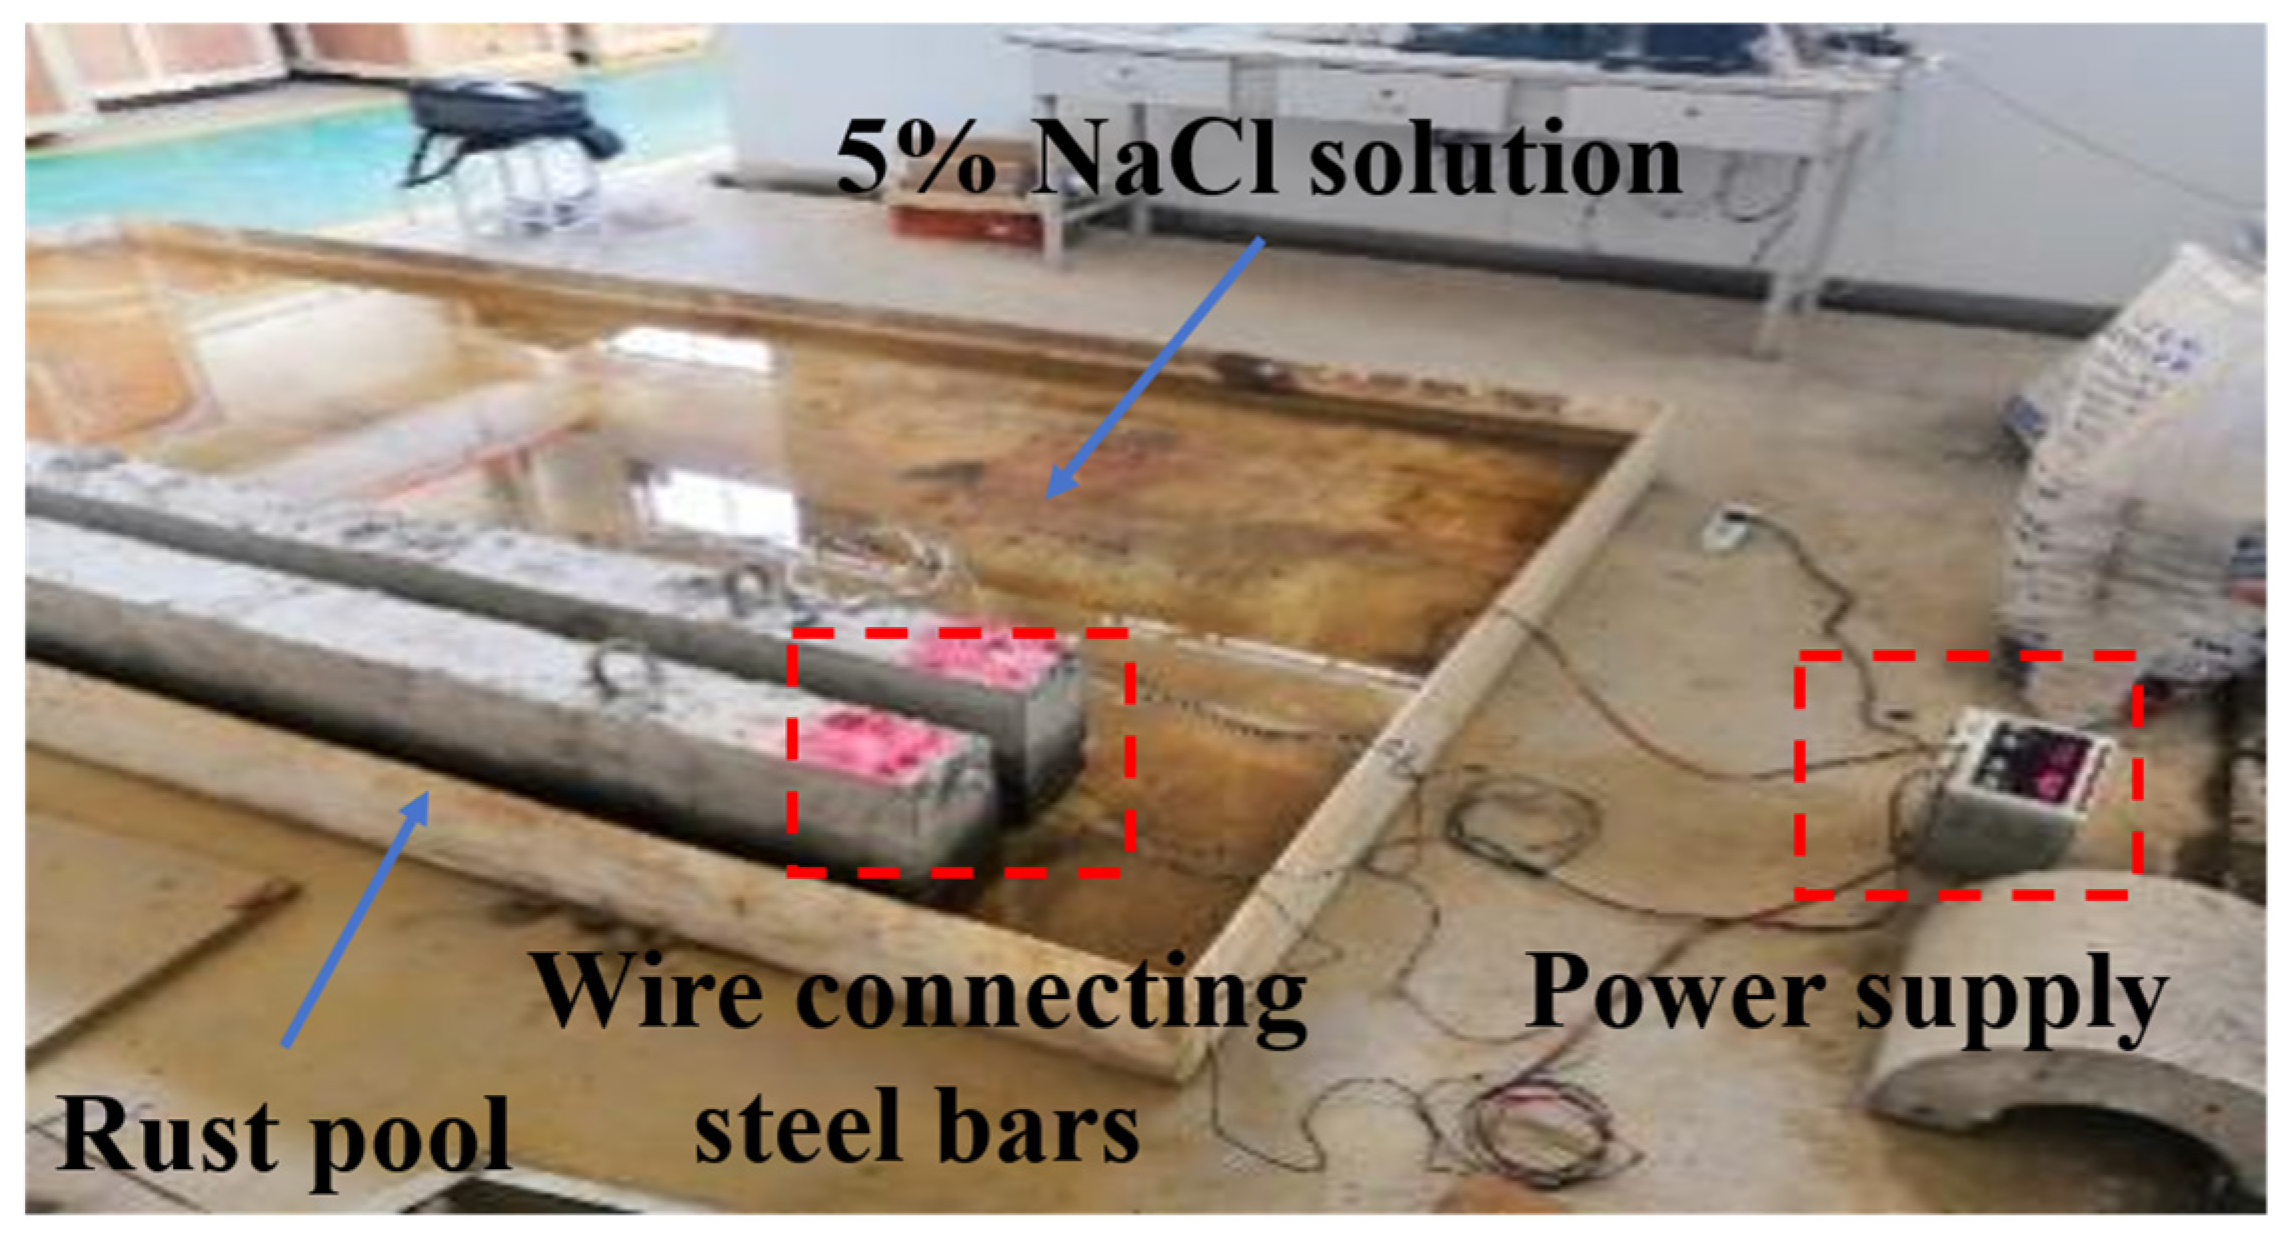
The layout of the accelerated corrosion test is depicted in Figure 13. Specimens undergoing corrosion were placed in a corrosion chamber filled with 5% NaCl solution by mass, with the liquid level maintained below the steel reinforcement. Support blocks were positioned beneath the specimens to enhance effective contact area between the concrete surface and the electrolyte. A direct current (DC) power supply with stabilized voltage and current control was employed for electrochemical acceleration, where the anode was connected to the steel reinforcement and the cathode was linked to a copper electrode. Research has shown that when the current density of electrochemical accelerated corrosion does not exceed 200 μA/cm2, there is little difference in the corrosion products and stress caused by corrosion between accelerated and natural corrosion [42]. Moreover, the mechanical degradation pattern of steel bars resulting from accelerated corrosion resembles that of natural corrosion. Therefore, the current density in this experiment was controlled to be around 200 μA/cm2. The corrosion time required for the steel bars to reach the target corrosion ratio was calculated. The corrosion time required for the rebar to reach the target corrosion rate was calculated based on Faraday’s law, as shown in Equation (10).
t = 13560 M s r i
where t is the duration of electrified accelerated corrosion (s), Ms is the mass loss of corroded reinforcement, r is the radius of corroded reinforcement (cm), and i is the current density (A/cm2).
After the static load test, segments of the steel bars were taken for actual corrosion ratio measurement. This study employed a mechanical breaking method combined with physicochemical detection techniques to ensure quantitative accuracy in corrosion ratio assessment:
(1)
After specimen fracture, longitudinal reinforcement sections were extracted at 400 mm intervals along the axial direction. Each segment was precisely positioned using a total station and systematically cataloged to maintain spatial correspondence.
(2)
Steel segments underwent multi-stage abrasion: initial treatment with 80-grit sandpaper removed concrete adherent, followed by 600-grit sandpaper for surface rust elimination. Three repeated weighings were conducted using an analytical balance with 0.1 mg precision, with the mean value recorded as post-corrosion mass (m).
(3)
Mass loss rate (ηs) was calculated using the Equation (11):
η s = m 0 m m 0 × 100 %
where m0 represents initial steel mass and m denotes post-corrosion mass.
(4)
Simultaneous electrochemical verification was performed via the Linear Polarization Resistance (LPR) method, enabling cross-validation with gravimetric results to ensure data reliability.
The results are summarized in Table 5. The corrosion durations corresponding to mass loss ratios of 0, 0.05, and 0.1 were 0, 31.5, and 63 days, respectively. the corrosion rate deviation mainly stems from the loss of current efficiency due to electrochemical side reactions (e.g., hydrogen precipitation), uneven local current distribution caused by the non-homogeneity of the reinforcement material, insufficient precision of the constant current source control, and the boundary layer effect of the mass-transfer process, which together result in the actual corrosion rate being lower than the theoretical target value.

4.3. Dynamic and Static Load Tests

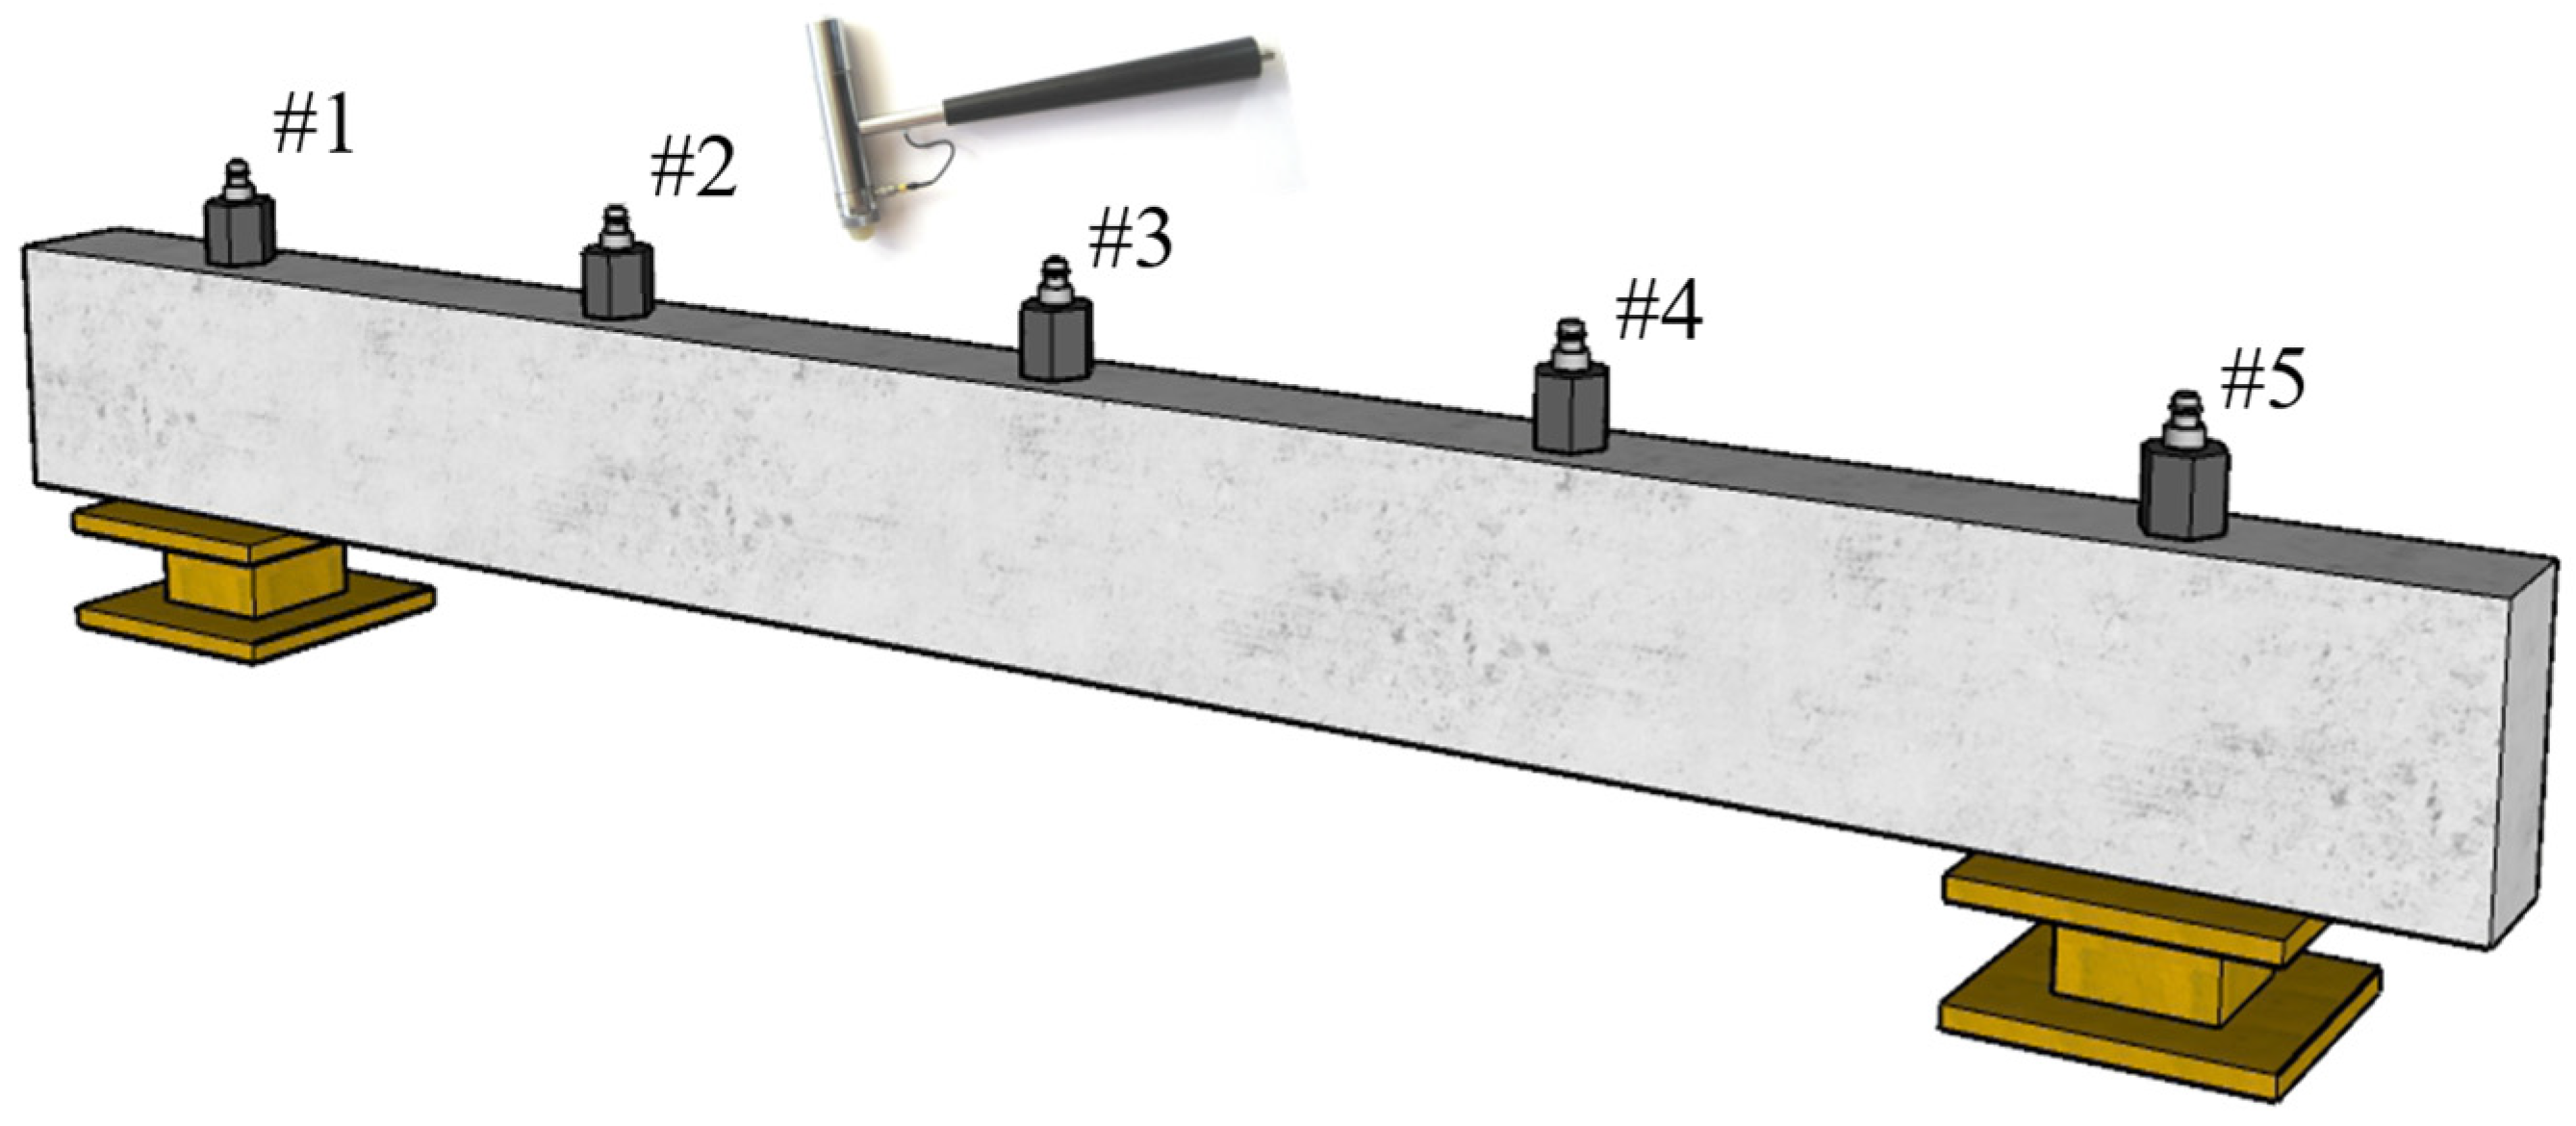
To analyze the damage evolution law of specimens based on their vibration characteristics, the test beams were placed on prefabricated supports. Medium-sized impact hammers were used to provide impact excitation for beams #2 and #3. The application of impact force inevitably causes some damage to the reinforced concrete beams. While ensuring successful excitation, the impact force should be minimized as much as possible [43]. The DH5922D dynamic signal testing and analysis system was utilized. For the first three modes, the SCF modal analysis method [44] was employed. The power test is shown in Figure 14.
Taking beam B5 as an example, the steady-state graph calculation function of the DHDAS dynamic signal acquisition and analysis system was utilized to determine the first three natural frequencies of the corroded beams under the corresponding conditions. The steady-state graph for beam B5, upon reaching the target corrosion ratio, is presented in Figure 15. Figure 16 shows the measured mode shapes of beam B5 after reaching the target corrosion ratio. The measured mode shape data are satisfactory and meet the basic requirements for damage identification.
Static loading tests were conducted using an electro-hydraulic servo universal testing machine capable of applying up to 500 kN of force. The beam static test was designed with three-point loading, where the specimen was simply supported at both ends. The upper hydraulic jack was used to distribute the load across the beam. The experimental setup is shown in Figure 17. Prior to formal testing, the specimens underwent three preload cycles to eliminate any poor contact between the supports and other connecting components. The preload control value was set at 30% of the flexural cracking load. During the formal loading process, force control was initially applied, with each increment set at 6 kN. Once the reinforcement began to yield, displacement control was switched to, with loading increments set at 3 mm of mid-span deflection until failure occurred. Data collection was performed only after the readings stabilized following each loading increment.

5. Results Analysis and Discussion

5.1. Analysis of Static Loading Test Results

The load–deflection curve for the corroded concrete beam is shown in Figure 18. By examining the load–deflection curve of the non-corroded concrete beam, it can be observed that initially, the deflection increases linearly with the load. When the load reaches approximately 30 kN, a turning point appears on the curve, typically indicating the formation of initial micro-cracks at the bottom of the beam and a sudden increase in strain in the reinforcement, signifying the onset of cracking, which is part of the linear elastic stage. As loading continues, up to 110 kN, the deflection increases linearly with the load, representing the stage where the beam operates with cracks. Once the load exceeds 110 kN, the deflection increases more significantly, while the rate of load increase slows. At this point, the reinforcement yields, and the beam enters the elastic–plastic deformation stage, with several primary cracks emerging from the micro-cracks in the pure bending zone. As loading progresses, the increase in load is restrained, but the deflection continues to escalate significantly, ultimately leading to the crushing of concrete in the compression zone.
The load–deflection curves for beams B2 and B3 closely align with that of beam B1, indicating that up to a corrosion ratio of 6.9%, the impact of corrosion on the load-bearing capacity is minimal. However, as the corrosion ratio increases, the turning point in the load–deflection curve disappears. In this case, the load–deflection curve maintains a constant slope from the onset of loading until the yielding of the reinforcement. This behavior is attributed to corrosion, which causes the development of expansive cracks in the concrete, allowing the beam to immediately enter the stage of elastic operation with cracks during loading. Subsequently, new turning points appear, signifying the onset of reinforcement yielding. At this stage, micro-cracks at the bottom of the beam gradually develop into several primary cracks. As loading continues, the deflection increases rapidly, and concrete begins to spall from the tension zone until crushing occurs in the compression zone.
The yield loads and ultimate loads obtained from the static loading tests are summarized in Table 6. Compared to non-corroded steel-reinforced concrete beams, both the yield loads and ultimate loads of the corroded beams show significant reductions. For example, for beam B4, with an actual corrosion ratio of 11.0%, the yield load and ultimate load decreased by 41.8% and 43.0%, respectively. For beam B5, with a target corrosion ratio of 14.1%, the yield load and ultimate load decreased by 48.2% and 49.6%, respectively. As the corrosion ratio increases, the rate of decrease in yield load and ultimate load initially accelerates and then slows. Specifically, compared to beams B4 and B7, the yield load and ultimate load for beam B7 decreased by 15.6% and 11.9%, respectively. Beams B3 and B4 showed reductions of 15.8% and 22.5%, respectively, while beams B4 and B5 experienced reductions of 10.9% and 11.6%, respectively. For beams B3 and B7, which have the same design corrosion ratio, beam B7 exhibited better flexural carrying capacity despite having a higher actual corrosion ratio than B3. This suggests that the protective layer effectively enhances the flexural carrying capacity of corroded beams.
In comparison to non-corroded steel-reinforced concrete beams, corroded beams exhibit varying degrees of reduction in yield and ultimate carrying capacity, with the difference in reductions decreasing as the corrosion ratio increases.
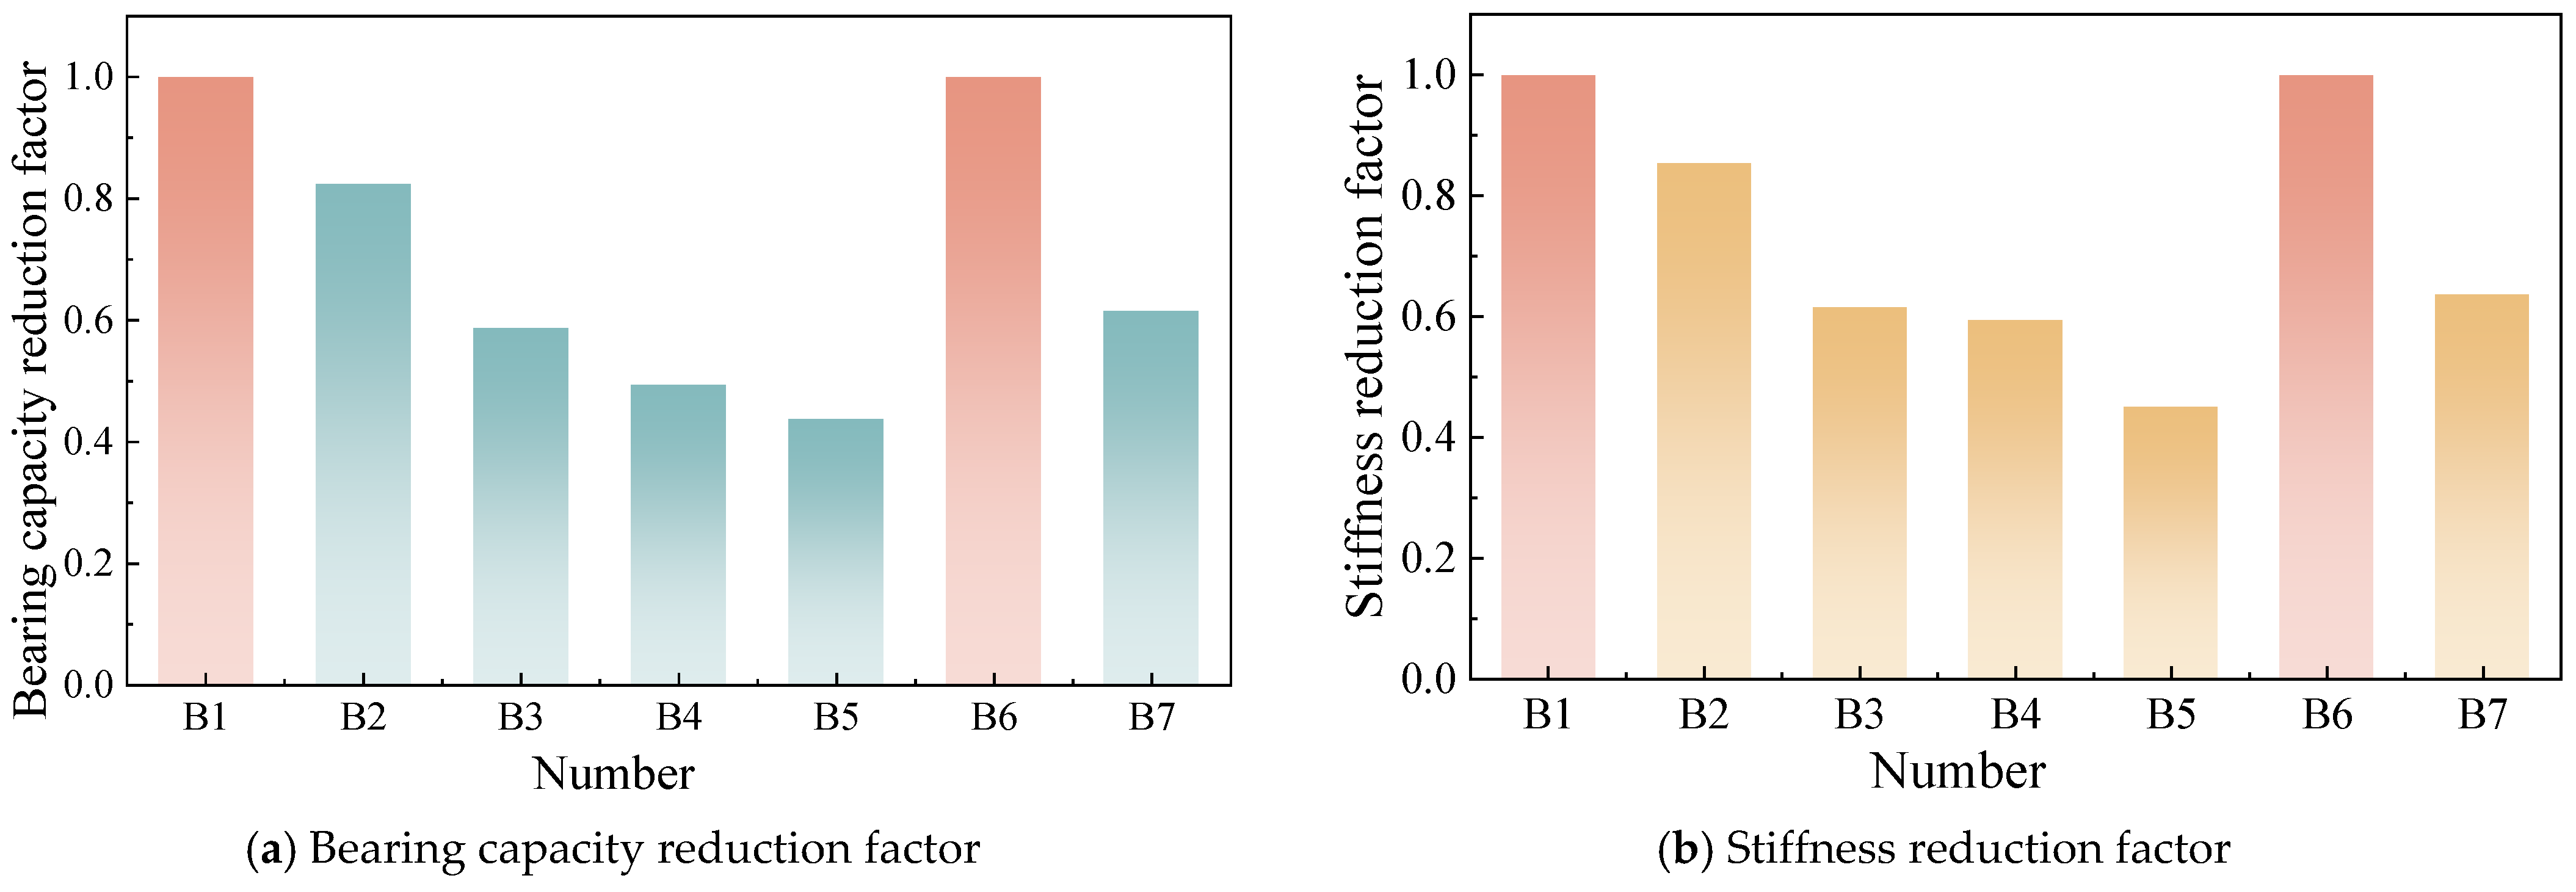
Based on managerial calculations, the reduction factors for load-carrying capacity and stiffness are illustrated in Figure 19.
Both factors exhibit a similar trend, decreasing as the corrosion ratio increases. Therefore, changes in load-carrying capacity and stiffness can effectively reflect the structural damage. By analyzing Figure 19a,b, it is evident that variations in these factors differ depending on the thickness of the protective layers. Thicker protective layers lead to smaller changes, suggesting that appropriately increasing the thickness of the protective layer enhances the damage resistance of steel-reinforced concrete beams.

5.2. Damage Identification of Three Indexes

The modal parameters collected from the dynamic tests of the seven beams after corrosion were used as input data. Similarly, numerical simulation datasets for damage identification were generated using the SSA-ELM interactive interface software proposed in this study, with these datasets serving as training samples. The modal parameters of the seven beams were used individually as test samples. The actual corrosion ratio, reduction factor for load-carrying capacity, and reduction factor for stiffness were calculated as outputs, leading to the damage identification results.
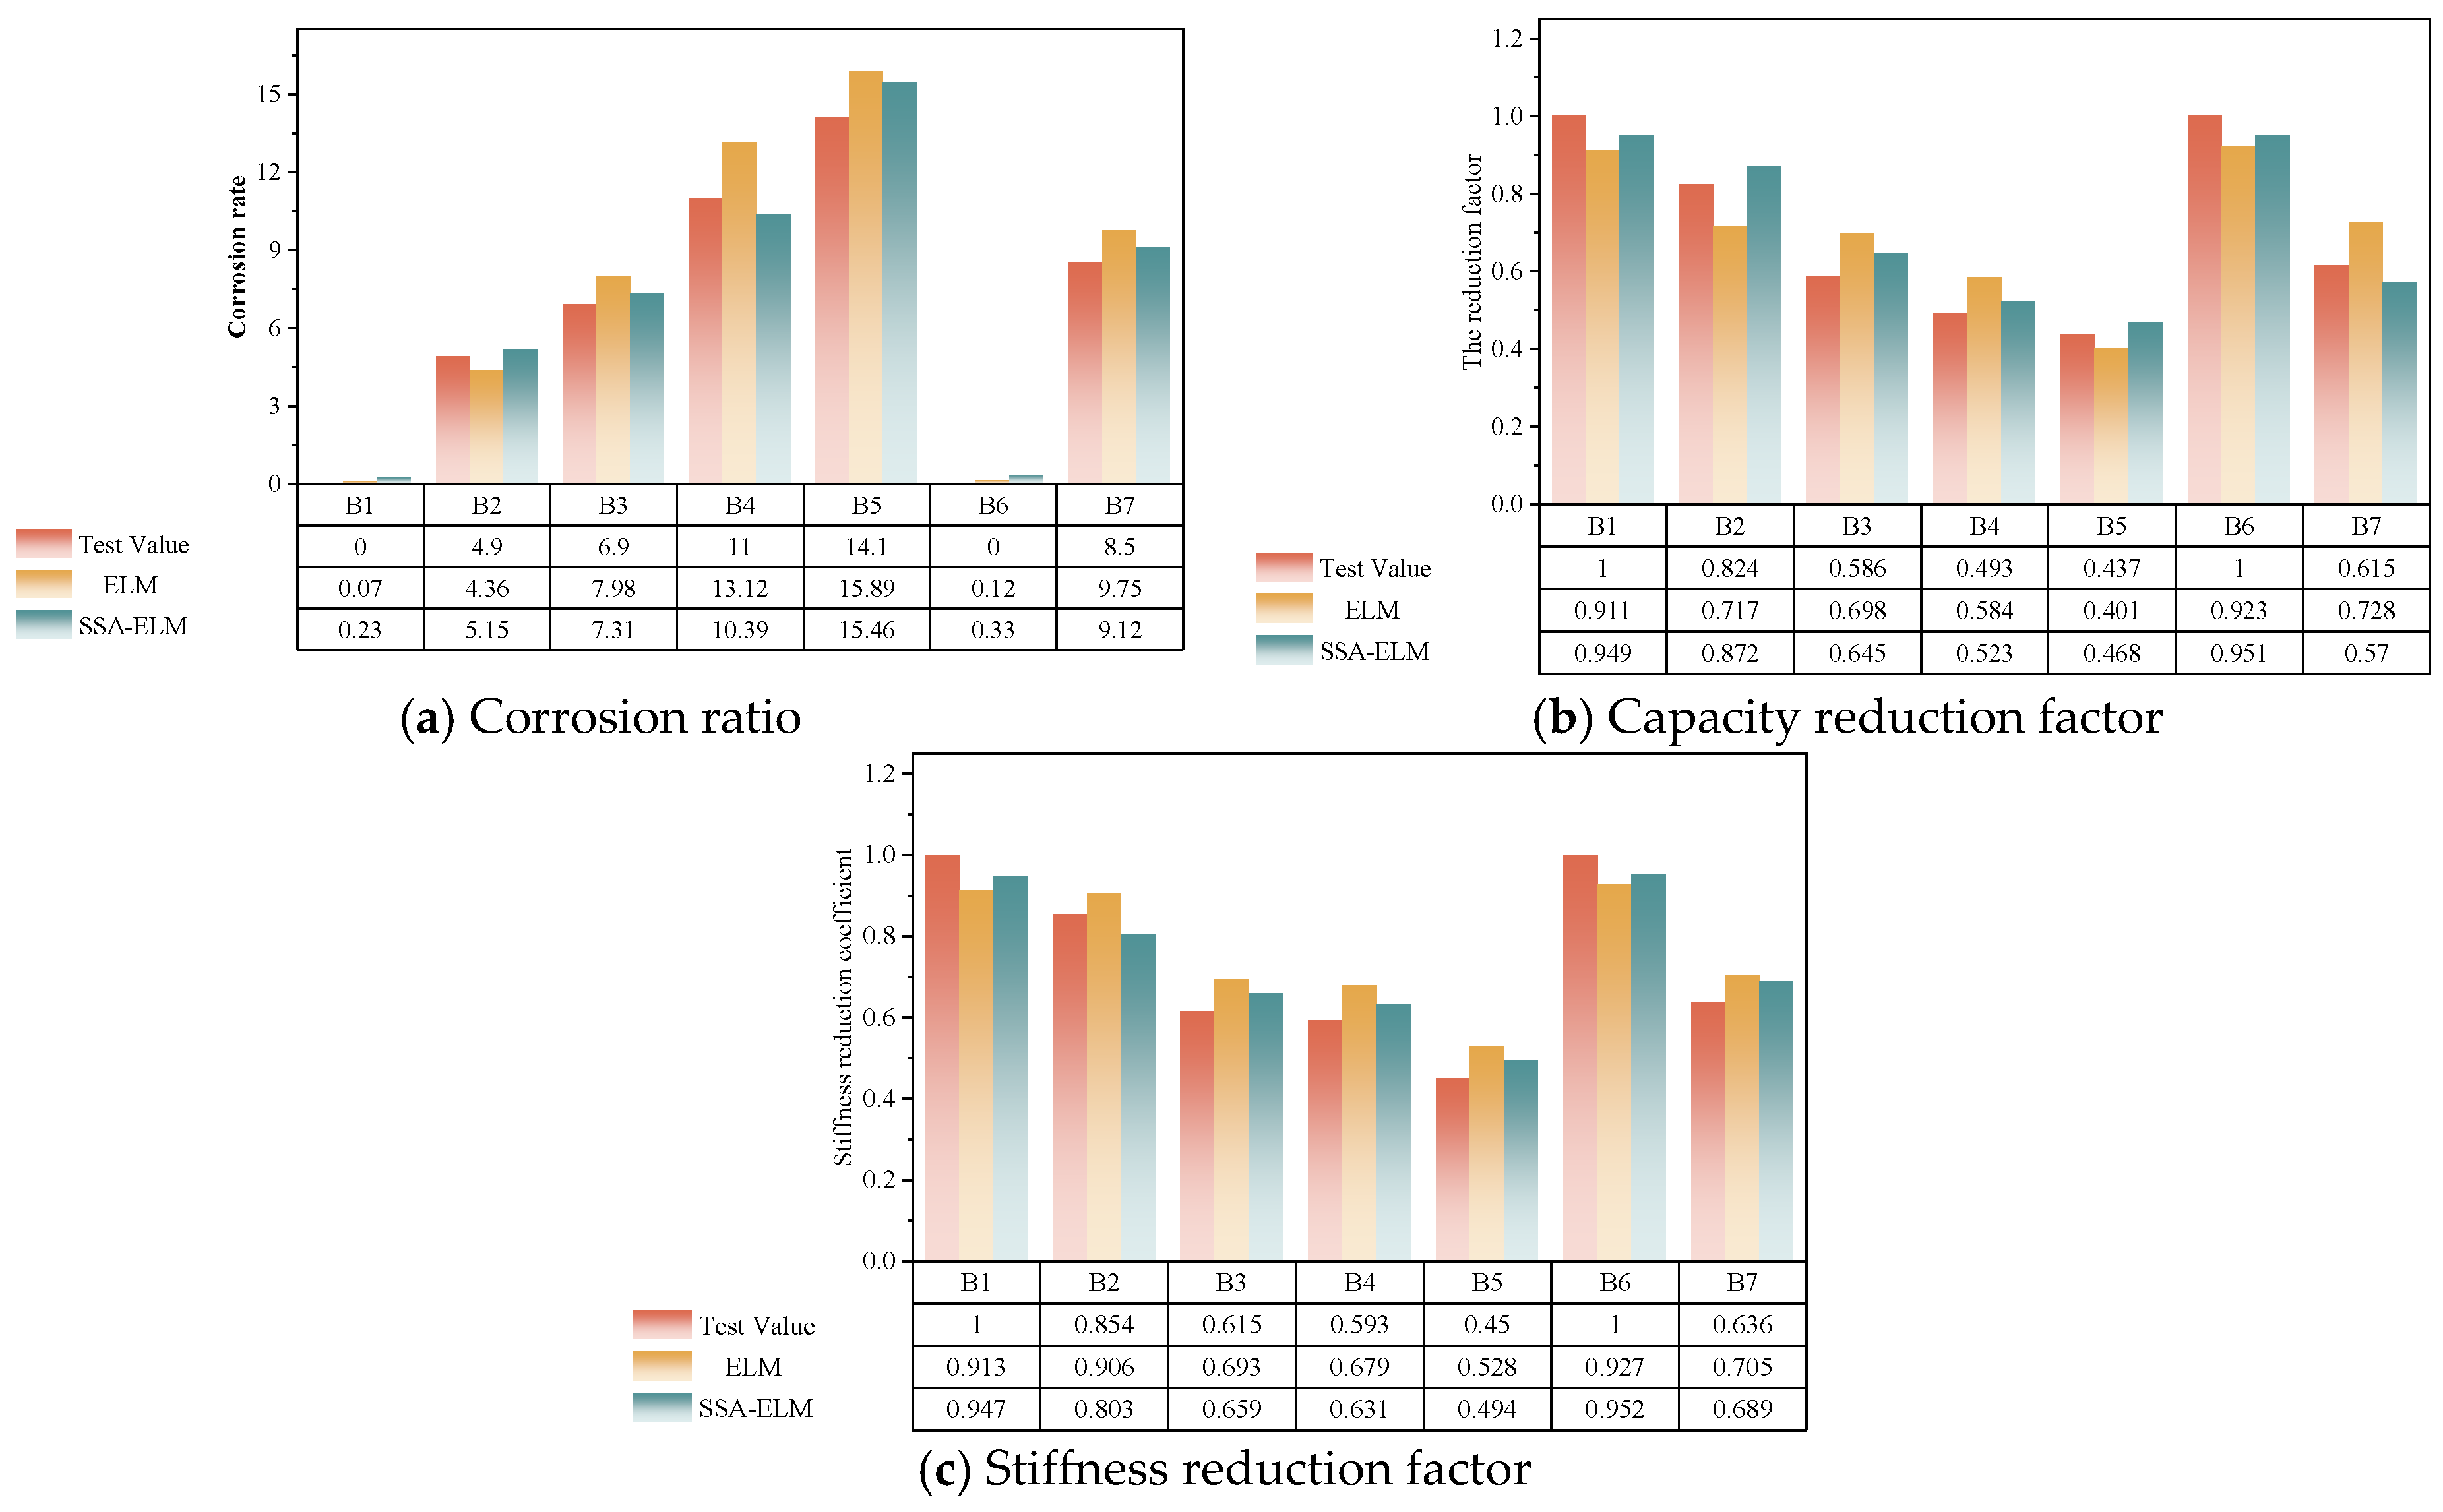
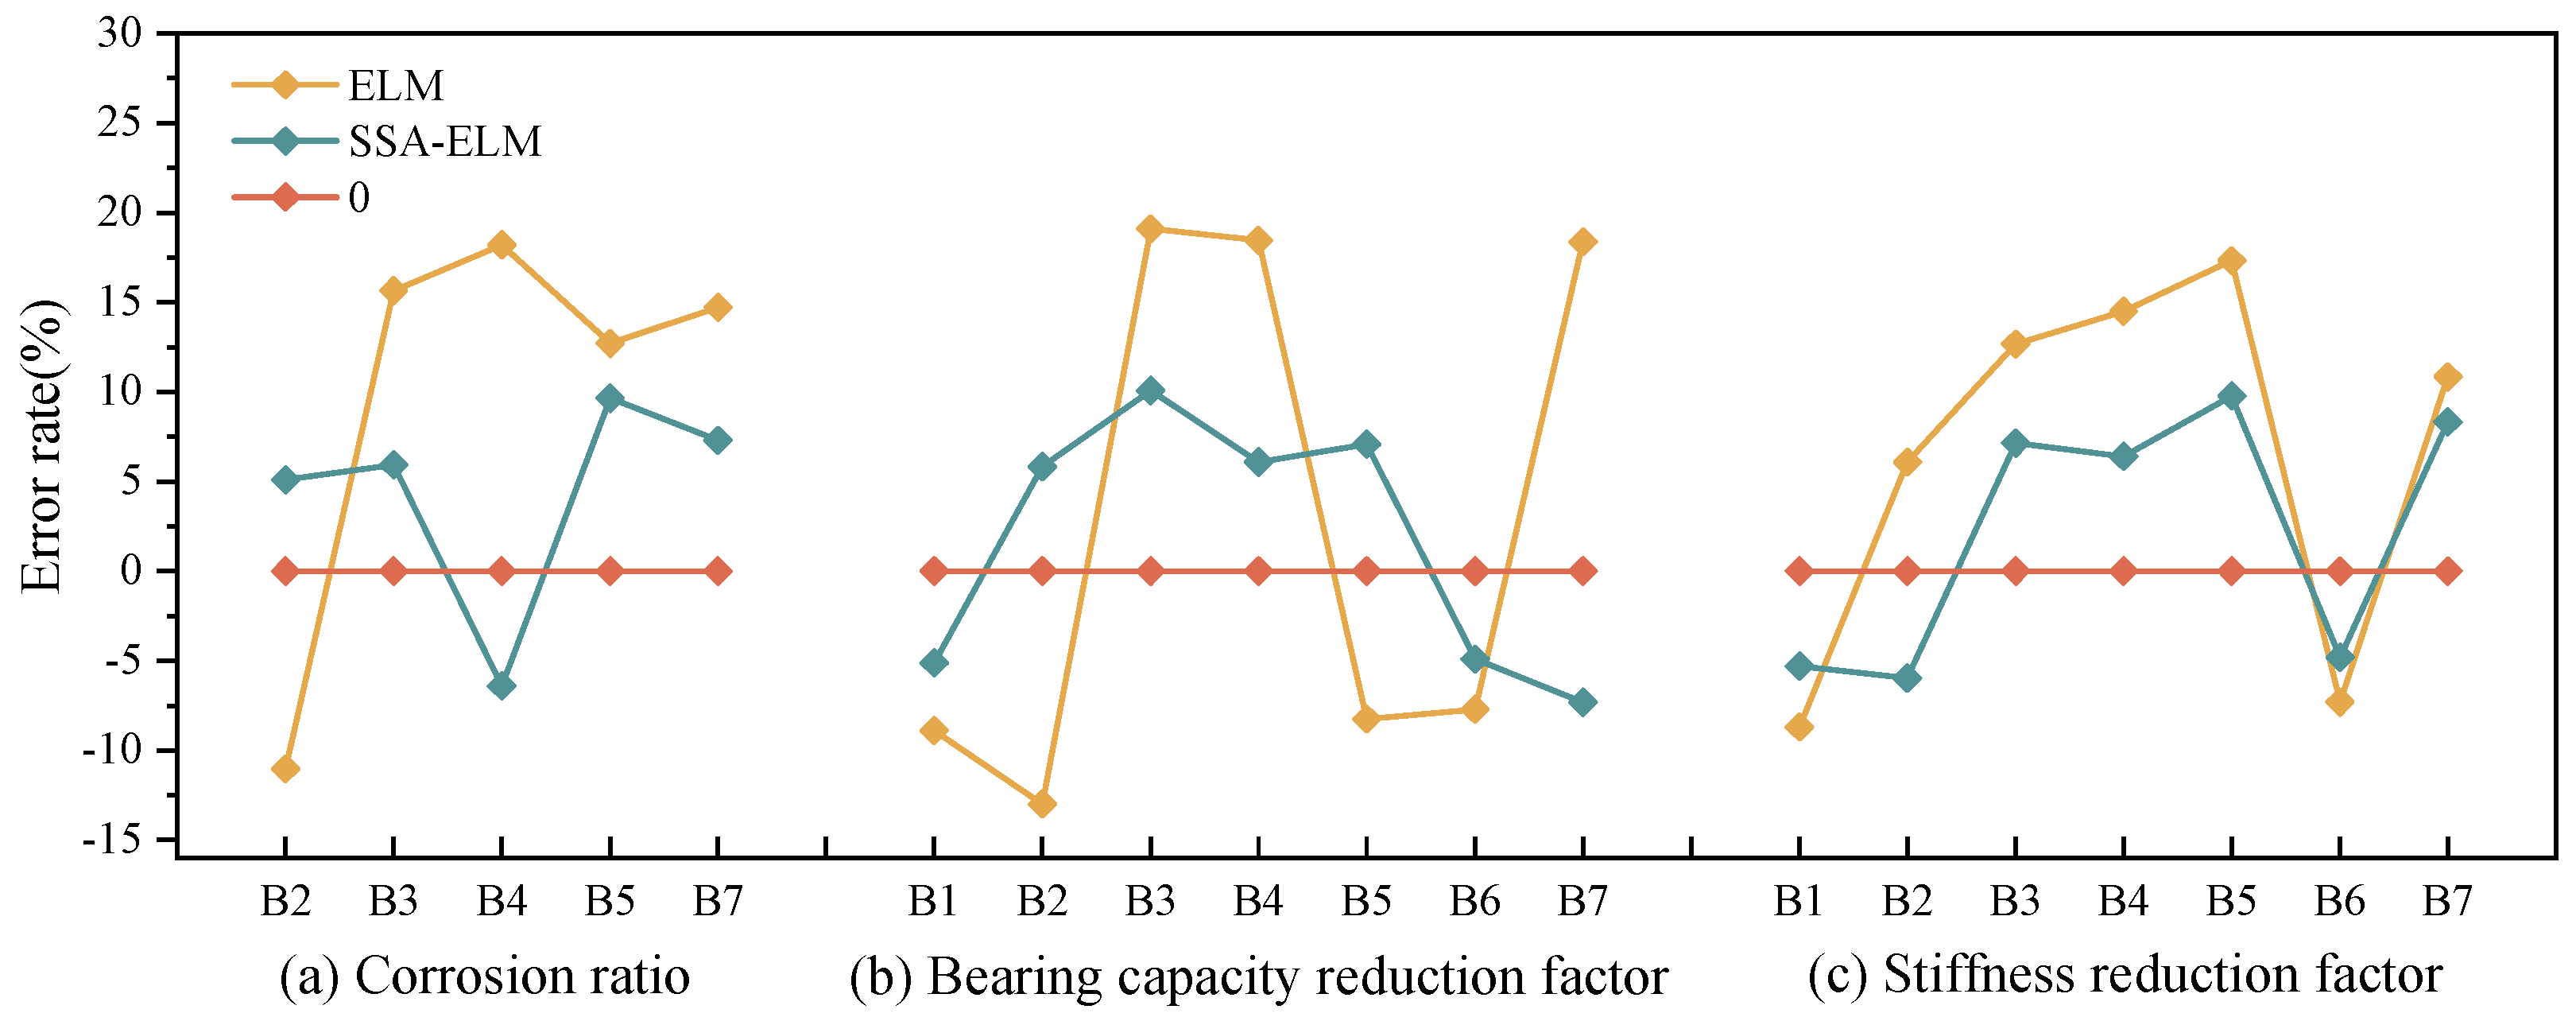
The damage identification prediction results for the corroded beams, obtained using both SSA-ELM and ELM, are shown in Figure 20 and Figure 21. From the comparison in Figure 20, it is evident that the traditional ELM damage identification algorithm exhibits an error range of 8% to 20%. After applying the SSA algorithm to improve the ELM damage identification method, the error range is reduced to between 5% and 10%, demonstrating a significant reduction in prediction error. MSE test verification results are presented in Table 7.

6. Summary

6.1. Conclusions

This study investigates the effects of corrosion on steel-reinforced concrete beams, assessing the variations in residual mechanical properties through dynamic and static tests, theoretical analysis, and numerical simulations. Additionally, damage identification was performed using a Sparrow Search Algorithm-optimized Extreme Learning Machine (SSA-ELM) based on vibration testing. A MATLAB R2024A-based software interface was developed to facilitate the implementation of this damage identification method. The main conclusions are as follows:
(1)
This study quantitatively shows that corrosion severity significantly degrades the dynamic properties of reinforced concrete beams. The experimental results indicate a decrease in natural frequencies by up to 45% at a 14.1% mass loss ratio (ηs), with the third mode exhibiting the highest sensitivity. Modal Assurance Criterion (MAC) values show a decay of over 30%, reflecting a progressive loss of vibrational coherence as corrosion intensifies.
(2)
Static load tests reveal substantial mechanical deterioration, with yield capacity dropping by 48.2% (from 110 kN to 57 kN) and ultimate load reducing by 49.6% at ηs = 14.1%. Notably, a 30 mm concrete cover enhances flexural capacity by 15–20% compared to the standard 20 mm cover, emphasizing the critical protective role of the concrete cover in mitigating corrosion effects.
(3)
The SSA-ELM algorithm demonstrated high precision in damage identification, with prediction errors for mass corrosion ratio (ηs), flexural capacity reduction (α), and stiffness reduction (β) ranging from 5 to 10%. This represents a 50% improvement in accuracy over conventional ELM, which showed errors between 9 and 20%. Quantitative validation revealed a 74–83% reduction in mean squared error (e.g., α MSE: 0.0021 vs. 0.0086 for ELM), maintaining robustness even under 10% Gaussian noise.
(4)
For practical implementation, a MATLAB-based GUI with Docker containerization enables real-time corrosion parameter identification. This deployable system offers controlled error assessment of ηs, α, and β, positioning SSA-ELM as a valuable tool for post-damage rehabilitation and structural safety management.

6.2. Limitations

(1)
Experimental dataset constrained by small sample size, low replication counts, and narrow corrosion rate range (0–14.1%). Lack of systematic investigation on protective layer thickness effects and higher corrosion grades (20–30%).
(2)
Focus on macroscopic damage identification rather than localized pitting, cross-sectional loss distribution, or multi-scale (macro–micro-electrochemical) correlation modeling.
(3)
Machine learning models (e.g., SSA-ELM) show limited nonlinear behavior capture at low corrosion rates (0–2%) and insufficient integration of physical mechanisms (e.g., stress distribution and crack propagation).
(4)
Accelerated corrosion tests lack multi-factor coupling analysis of chloride concentration, temperature–humidity cycles, and other environmental variables.

6.3. Future Works

(1)
Develop a physics-informed data-driven feature framework integrating corrosion stress distribution, electrochemical impedance, and nonlinear statistical features. Enhance low-corrosion-rate prediction accuracy through SHAP-based feature selection and orthogonal experimental design.
(2)
Establish cross-scale correlation models using SEM-EDS (nanoscale morphology), industrial CT (3D pit reconstruction), and EIS-LPR (electrochemical dynamics).
(3)
Construct a multi-physics experimental platform incorporating chloride ingress, temperature–humidity cycles, and electrochemical monitoring.
(4)
Conduct gradient tests (5–50mm) combined with COMSOL simulations to quantify chloride penetration-thickness interactions.
(5)
Optimize SSA with hybrid strategies (simulated annealing, PSO) and develop a digital twin-based SHM platform for real-time boundary condition updating.

Author Contributions

L.T.: Conceptualization, Methodology, Software, and Writing—Original Draft. X.G.: Methodology, Formal Analysis, and Writing—Review and Editing. P.B.: Methodology and Data Curation. C.Z.: Validation and Formal Analysis. C.L.: Resources and Supervision. All authors have read and agreed to the published version of the manuscript.

Funding

This research was funded by Caiwei Liu grant number 52178487 and ZR2021ME228. And The APC was funded by the National Natural Science Foundation of China (No. 52178487).

Data Availability Statement

All data generated or analyzed during this study are included in this published article.

Acknowledgments

This study was supported by the National Natural Science Foundation of China (No. 52178487) and the Shandong Provincial Natural Science Foundation of China (No. ZR2021ME228).

Conflicts of Interest

The authors declare no competing interests.

References

  1. Al-Kheetan, M.J. Properties of Lightweight Pedestrian Paving Blocks Incorporating Wheat Straw: Micro-to Macro-Scale Investigation. Results Eng. 2022, 16, 100758. [Google Scholar] [CrossRef]
  2. Seguel, F.; Meruane, V. Damage Assessment in a Sandwich Panel Based on Full-Field Vibration Measurements. J. Sound Vib. 2018, 417, 1–18. [Google Scholar] [CrossRef]
  3. Lu, J.; Liu, J.; Yang, H.; Wan, X.; Gao, J.; Zhang, J.; Li, P. Experimental Investigation on the Mechanical Properties and Pore Structure Deterioration of Fiber-Reinforced Concrete in Different Freeze-Thaw Media. Constr. Build. Mater. 2022, 350, 128887. [Google Scholar] [CrossRef]
  4. Yu, L.; Francois, R.; Dang, V.H.; L’Hostis, V.; Gagne, R. Structural Performance of RC Beams Damaged by Natural Corrosion under Sustained Loading in a Chloride Environment. Eng. Struct. 2015, 96, 30–40. [Google Scholar] [CrossRef]
  5. Jones, S.; Martys, N.; Lu, Y.; Bentz, D. Simulation Studies of Methods to Delay Corrosion and Increase Service Life for Cracked Concrete Exposed to Chlorides. Cem. Concr. Compos. 2015, 58, 59–69. [Google Scholar] [CrossRef]
  6. Ali, M.S.; Ji, C.; Mirza, M.S. Durable Design of Reinforced Concrete Elements against Corrosion—ScienceDirect. Constr. Build. Mater. 2015, 93, 317–325. [Google Scholar] [CrossRef]
  7. Feng, D.; Feng, M.Q. Computer Vision for SHM of Civil Infrastructure: From Dynamic Response Measurement to Damage Detection—A Review. Eng. Struct. 2018, 156, 105–117. [Google Scholar] [CrossRef]
  8. Kot, P.; Muradov, M.; Gkantou, M.; Kamaris, G.S.; Yeboah, D. Recent Advancements in Non-Destructive Testing Techniques for Structural Health Monitoring. Appl. Sci. 2021, 11, 2750. [Google Scholar] [CrossRef]
  9. Doebling, S.W.; Farrar, C.R.; Prime, M.B.; Shevitz, D.W. Damage Identification and Health Monitoring of Structural and Mechanical Systems from Changes in Their Vibration Characteristics: A Literature Review; Los Alamos National Laboratory Report LA-13070-MS; USDOE: Washington, DC, USA, 1996; Volume 30, pp. 2043–2049.
  10. Sohn, H.; Farrar, C.R.; Hemez, F.M.; Czarnecki, J.J. A Review of Structural Health Review of Structural Health Monitoring Literature 1996–2001; Data Acquisition; Los Alamos National Laboratory: Los Alamos, NM, USA, 2002.
  11. Rytter, A.; Brincker, R.; Pilegaard, L. Vibrational Based Inspection of Civil Engineering Structures. Ph.D. Thesis, Aalborg University, Aalborg, Denmark, 1991. [Google Scholar]
  12. Zhang, Y.; Wang, L.; Xiang, Z. Damage Detection by Mode Shape Squares Extracted from a Passing Vehicle. J. Sound Vib. 2012, 331, 291–307. [Google Scholar] [CrossRef]
  13. Dongming, F.; Feng, M.Q. Output-only Damage Detection Using Vehicle-induced Displacement Response and Mode Shape Curvature Index. Struct. Control. Health Monit. 2016, 23, 1088–1107. [Google Scholar]
  14. Zhao, J.; Zhang, L. Structural Damage Identification Based on the Modal Data Change. Int. J. Eng. Manuf. 2012, 2, 59–66. [Google Scholar] [CrossRef]
  15. Capecchi, D.; Ciambella, J.; Pau, A.; Vestroni, F. Damage Identification in a Parabolic Arch by Means of Natural Frequencies, Modal Shapes and Curvatures. Mecc. J. Ital. Assoc. Theor. Appl. Mech. 2016, 51, 2847–2859. [Google Scholar] [CrossRef]
  16. Xiao, F.; Mao, Y.; Tian, G.; Chen, G.S.; Shi, X. Partial-Model-Based Damage Identification of Long-Span Steel Truss Bridge Based on Stiffness Separation Method. Struct. Control. Health Monit. 2024, 2024, 5530300. [Google Scholar] [CrossRef]
  17. Mao, Y.; Xiao, F.; Tian, G.; Xiang, Y. Sensitivity Analysis and Sensor Placement for Damage Identification of Steel Truss Bridge. Structures 2025, 73, 108310. [Google Scholar] [CrossRef]
  18. Fan, C.; Zheng, Y.; Wang, S.; Ma, J. Prediction of Bond Strength of Reinforced Concrete Structures Based on Feature Selection and GWO-SVR Model. Constr. Build. Mater. 2023, 400, 132602. [Google Scholar] [CrossRef]
  19. Xu, J.G.; Zhang, J.; Hou, S.T.; Wu, G.; Hong, W. Seismic Performance Assessment of Corroded RC Columns Based on Data-Driven Machine-Learning Approach. Eng. Struct. 2022, 255, 113936. [Google Scholar] [CrossRef]
  20. Jiang, K.; Liang, Y.; Zhao, O. Machine-Learning-Based Design of High Strength Steel Bolted Connections. Thin-Walled Struct. 2022, 179, 109575. [Google Scholar] [CrossRef]
  21. Liu, H.; Chen, C.; Guo, Z.; Xia, Y.; Li, S. Overall Grouting Compactness Detection of Bridge Prestressed Bellows Based on RF Feature Selection and the GA-SVM Model. Constr. Build. Mater. 2021, 301, 124323. [Google Scholar] [CrossRef]
  22. Zenzen, R.; Belaidi, I.; Khatir, S.; Abdel Wahab, M. A Damage Identification Technique for Beam-like and Truss Structures Based on FRF and Bat Algorithm. Comptes Rendus Méc. 2018, 346, 1253–1266. [Google Scholar] [CrossRef]
  23. Gerist, S.; Maheri, M.R. Structural Damage Detection Using Imperialist Competitive Algorithm and Damage Function. Appl. Soft Comput. 2019, 77, 1–23. [Google Scholar] [CrossRef]
  24. Kim, N.I.; Kim, S.; Lee, J. Vibration-Based Damage Detection of Planar and Space Trusses Using Differential Evolution Algorithm. Appl. Acoust. 2019, 148, 308–321. [Google Scholar] [CrossRef]
  25. Avci, O.; Abdeljaber, O.; Kiranyaz, S.; Hussein, M.; Gabbouj, M.; Inman, D.J. A Review of Vibration-Based Damage Detection in Civil Structures: From Traditional Methods to Machine Learning and Deep Learning Applications. Mech. Syst. Signal Process. 2020, 147, 107077. [Google Scholar] [CrossRef]
  26. Fan, C.; Zheng, Y.; Wen, Y.; Sun, M. Classification and Prediction of Deformed Steel and Concrete Bond-Slip Failure Modes Based on SSA-ELM Model. Structures 2023, 57, 105131. [Google Scholar] [CrossRef]
  27. Razak, H.A.; Choi, F.C. The Effect of Corrosion on the Natural Frequency and Modal Damping of Reinforced Concrete Beams. Eng. Struct. 2001, 23, 1126–1133. [Google Scholar] [CrossRef]
  28. Park, H.W.; Lim, T. Investigating a Common Premise in Structural Health Monitoring: Are Higher Modal Frequencies More Sensitive to an Incipient Crack on a Beam than Lower Ones? Eng. Struct. 2018, 176, 385–395. [Google Scholar] [CrossRef]
  29. Jarek, A.; Dos Santos, A.T.; Bragana, M.O.G.P.; Pinkoski, I.M.; Neri, M.A.T.; Diniz, J.H.O.T.; Gomes, R.A.N. Experimental and Numerical Investigations to Evaluate the Structural Integrity of Concrete Beams Exposed to an Aggressive Coastal Environment. Structures 2022, 37, 795–806. [Google Scholar] [CrossRef]
  30. Capozucca, R. Detection of Damage Due to Corrosion in Prestressed RC Beams by Static and Dynamic Tests. Constr. Build. Mater. 2008, 22, 738–746. [Google Scholar] [CrossRef]
  31. Zhang, R.; Chang, H.; Li, Z.; Song, X.; Yang, J.; Xia, J. Corrosion Damage Identification of Towering Steel Headframe Based on Parametric Modeling and Data Fusion. Buildings 2022, 12, 1215. [Google Scholar] [CrossRef]
  32. Zeng, B.; Wang, Y.; Gong, F.; Maekawa, K. Corrosion-Induced Cracking Pattern Analysis of RC Beam under Sustained Load Considering the Poromechanical Characteristics of Corrosion Products. Buildings 2022, 12, 2256. [Google Scholar] [CrossRef]
  33. Kong, W.; Hou, P.; Liang, X.; Gao, F.; Liu, Q. An Interpretable Rockburst Prediction Model Based on SSA-CatBoost. Tunn. Undergr. Space Technol. 2025, 164, 106820. [Google Scholar] [CrossRef]
  34. Selselejoo, M.; Ahmadifar, H. DT-GWO: A Hybrid Decision Tree and GWO-Based Algorithm for Multi-Objective Task Scheduling Optimization in Cloud Computing. Sustain. Comput. Inform. Syst. 2025, 47, 101138. [Google Scholar] [CrossRef]
  35. Yang, Y.; Wang, S.; Zhang, G.; Wang, Q.; Qin, Y.; Zhai, D.; Yang, Z.; Li, P. GA-OMTL: Genetic Algorithm Optimization for Multi-Task Neural Architecture Search in NIR Spectroscopy. Expert Syst. Appl. 2025, 290, 128517. [Google Scholar] [CrossRef]
  36. Ding, S.; Zhao, H.; Zhang, Y.; Xu, X.; Nie, R. Extreme Learning Machine: Algorithm, Theory and Applications. Artif. Intell. Rev. 2015, 44, 103–115. [Google Scholar] [CrossRef]
  37. Wang, M.; Zhao, G.; Wang, S. Hybrid Random Forest Models Optimized by Sparrow Search Algorithm (SSA) and Harris Hawk Optimization Algorithm (HHO) for Slope Stability Prediction. Transp. Geotech. 2024, 48, 101305. [Google Scholar] [CrossRef]
  38. Bagheri, M.; Jamkhaneh, M.E.; Samali, B. Effect of Seismic Soil-Pile-Structure Interaction on Mid- and High-Rise Steel Buildings Resting on a Group of Pile Foundations. Int. J. Geomech. 2018, 18, 04018103.1–04018103.27. [Google Scholar] [CrossRef]
  39. Yan, L.; Liu, L.; Liu, C. Bonding Performances of Polypropylene Fiber Reinforced Concrete Beam-Type Specimen at Corrosion Conditions: Experimental and Simulation Study. J. Build. Eng. 2025, 105, 112479. [Google Scholar] [CrossRef]
  40. Liu, C.W.; Zhang, X.D.; Huang, X.H.; Sun, S.Q. Finite-Element Model Modification for Investigating the Dynamic Behavior of Fire-Exposed Reinforced Concrete Beams with Corrosion. J. Struct. Eng. 2024, 150, 04024121. [Google Scholar] [CrossRef]
  41. Kanakubo, T. Impact of Corrosion on the Bond Strength between Concrete and Rebar: A Systematic Review. Materials 2022, 15, 7016. [Google Scholar] [CrossRef]
  42. El Maaddawy, T.A.; Soudki, K.A. Effectiveness of Impressed Current Technique to Simulate Corrosion of Steel Reinforcement in Concrete. J. Mater. Civ. Eng. 2003, 15, 41–47. [Google Scholar] [CrossRef]
  43. Zhang, Y.; Cheng, Y.; Tan, G.; Lyu, X.; Yang, S. Natural Frequency Response Evaluation for RC Beams Affected by Steel Corrosion Using Acceleration Sensors. Sensors 2020, 20, 5335. [Google Scholar] [CrossRef]
  44. Asgari, A.; Bagheri, M.; Hadizadeh, M. Advanced Seismic Analysis of Soil-Foundation-Structure Interaction for Shallow and Pile Foundations in Saturated and Dry Deposits: Insights from 3D Parallel Finite Element Modeling. Structures 2024, 69, 107503. [Google Scholar] [CrossRef]
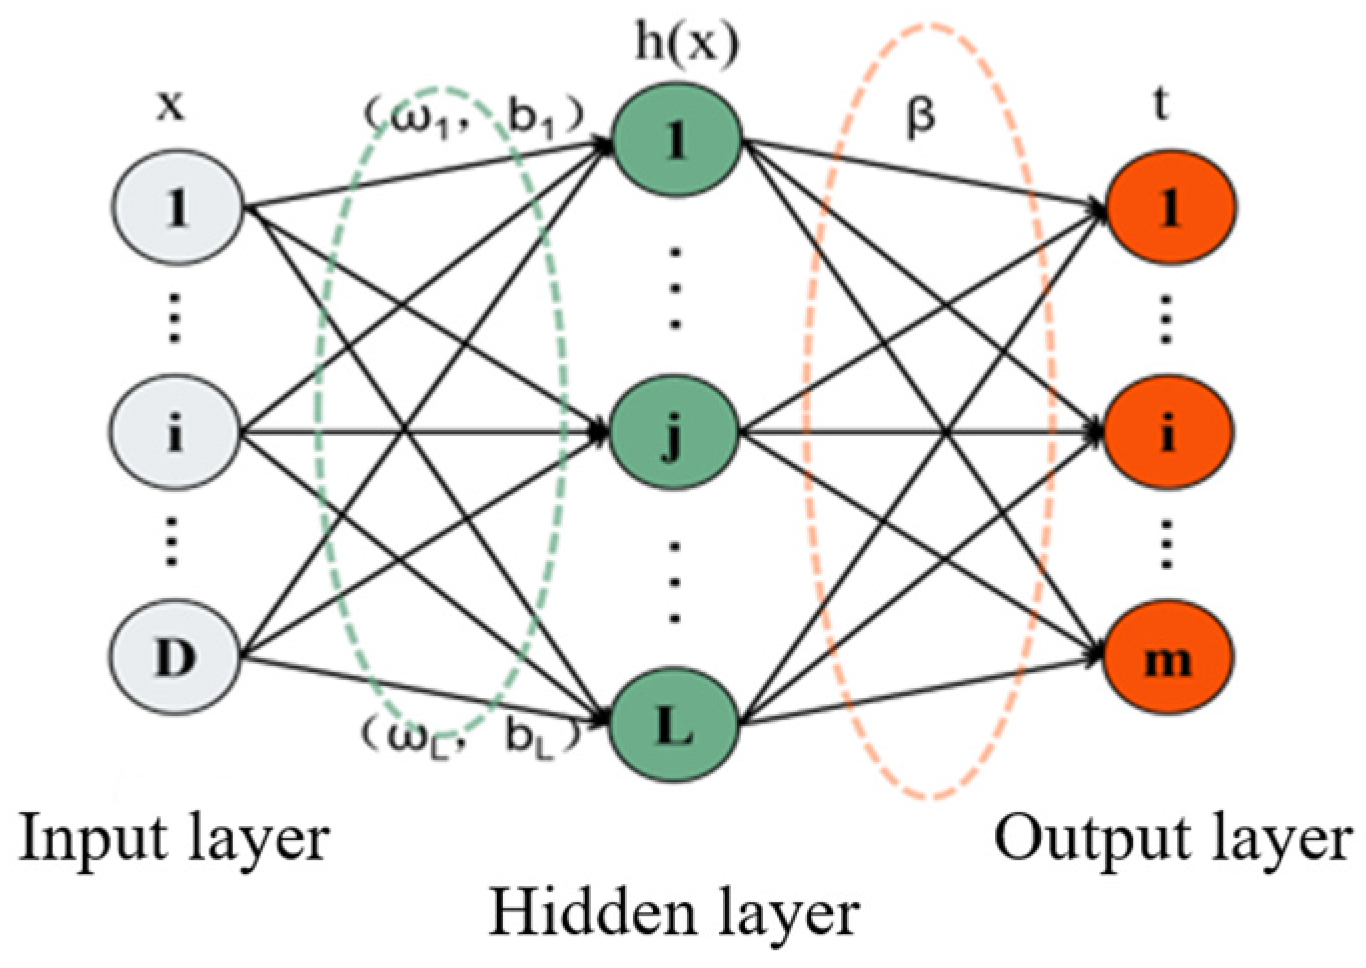
Figure 1. Network structure of Extreme Learning Machine.
Buildings 15 02937 g001
Figure 2. The process of optimizing the ELM using the SSA.
Buildings 15 02937 g002
Figure 3. SSA-ELM flowchart.
Buildings 15 02937 g003
Figure 4. SSA-ELM GUI.
Buildings 15 02937 g004
Figure 5. ABAQUS simulation.
Buildings 15 02937 g005
Figure 6. Spring element stiffness.
Buildings 15 02937 g006
Figure 7. Link element.
Buildings 15 02937 g007
Figure 8. Three mode shapes of the “test” beam.
Buildings 15 02937 g008
Figure 9. MAC attenuation diagram.
Buildings 15 02937 g009
Figure 10. Comparison of damage identification results.
Buildings 15 02937 g010
Figure 11. Comparison of error rates between SSA-ELM and ELM.
Buildings 15 02937 g011
Figure 12. Dimensions and reinforcement details of reinforced concrete beam specimens.
Buildings 15 02937 g012
Figure 13. Arrangement diagram for electrified corrosion.
Buildings 15 02937 g013
Figure 14. Experimental setup and arrangement.
Buildings 15 02937 g014
Figure 15. Steady-state plot of beam B5.
Buildings 15 02937 g015
Figure 16. Mode shape of beam B5.
Buildings 15 02937 g016
Figure 17. Schematic layout of static loading.
Buildings 15 02937 g017
Figure 18. Load–deflection curve.
Buildings 15 02937 g018
Figure 19. Test beam bearing capacity and stiffness reduction coefficient.
Buildings 15 02937 g019
Figure 20. Predicted Values of ELM and SSA-ELM.
Buildings 15 02937 g020
Figure 21. Comparison of relative errors.
Buildings 15 02937 g021
Table 1. Initial values of numerical “experimental” beam parameters.
Physical ParameterModulus of Elasticity for ConcreteConcrete
Density
Left Bearing OffsetRight Bearing OffsetBonding Spring StiffnessVertical Stiffness of Left BearingVertical Stiffness of Right Support
SymbolEDSD1D2K1K2K3
UnitN/mm2Kg/mm3mmmmN/mmN/mmN/mm
Initial value32,00025000.10.115,00015,00015,000
Note: Support displacement refers to the distance from the support to the near-end section.
Table 2. Test set theory results.
NumberCorrosion RatioFlexural Capacity Reduction FactorFlexural Stiffness Reduction Factor
M1110.66520.5996
M290.88240.7958
M3170.72580.8151
Table 3. MSE simulation verification.
Corrosion Ratio (%)Flexural Capacity Reduction FactorFlexural Stiffness Reduction Factor
ELMSSA-ELMELMSSA-ELMELMSSA-ELM
MSE2.10620.31740.01110.00240.00610.0017
Table 4. Experimental design parameters.
Specimen NumberStirrupLongitudinal ReinforcementCover Thickness (mm)Corrosion Ratio of Longitudinal Reinforcement
B1A8@1002C16200
B20.05
B30.1
B40.15
B50.2
B6A8@1002C16300
B70.1
Table 5. Results of tensile reinforcement electrified corrosion.
Specimen NumberTarget Corrosion RatioProtective Layer Thickness (mm)Rebar Diameter (mm)Duration of Electrification (day)Actual Corrosion RatioAbsolute
Error (%)
B102016000
B20.0531.50.0490.1
B30.1630.0693.1
B40.1594.50.1104
B50.21260.1415.9
B6030000
B70.1630.0851.5
Table 6. Results of beam bending test.
Beam
Number
Design Corrosion Ratio (%)Actual Corrosion Ratio (%)Absolute Error (%)Yield Load (kN)Ultimate Load (kN)
B1000110121
B254.90.190101
B3106.93.17689
B41511.046469
B52014.15.95761
B6000100126
B7108.51.595115
Table 7. MSE test verification.
Corrosion RatioFlexural Capacity Reduction FactorFlexural Stiffness Reduction Factor
ELMSSA-ELMELMSSA-ELMELMSSA-ELM
MSE1.47490.04240.00860.00210.00570.0023
Disclaimer/Publisher’s Note: The statements, opinions and data contained in all publications are solely those of the individual author(s) and contributor(s) and not of MDPI and/or the editor(s). MDPI and/or the editor(s) disclaim responsibility for any injury to people or property resulting from any ideas, methods, instructions or products referred to in the content.