Article

Comparative Study of Linear and Non-Linear ML Algorithms for Cement Mortar Strength Estimation

by
Sebghatullah Jueyendah
1,
Zeynep Yaman
1,*,
Turgay Dere
2 and
Türker Fedai Çavuş
3,4
1
Department of Civil Engineering, Sakarya University, Sakarya 54050, Türkiye
2
Department of Environmental Engineering, Adıyaman University, Adıyaman 02040, Türkiye
3
Department of Electrical and Electronics Engineering, Sakarya University, Sakarya 54050, Türkiye
4
Erkay Technology Development Services Co., Ltd., Sakarya University, Technopark Campus, Sakarya 54050, Türkiye
*
Author to whom correspondence should be addressed.
Buildings 2025, 15(16), 2932; https://doi.org/10.3390/buildings15162932
Submission received: 14 July 2025 / Revised: 8 August 2025 / Accepted: 13 August 2025 / Published: 19 August 2025
(This article belongs to the Special Issue Advanced Research on Concrete Materials in Construction)

Abstract

The compressive strength (Fc) of cement mortar (CM) is a key parameter in ensuring the mechanical reliability and durability of cement-based materials. Traditional testing methods are labor-intensive, time-consuming, and often lack predictive flexibility. With the increasing adoption of machine learning (ML) in civil engineering, data-driven approaches offer a rapid, cost-effective alternative for forecasting material properties. This study investigates a wide range of supervised linear and nonlinear ML regression models to predict the Fc of CM. The evaluated models include linear regression, ridge regression, lasso regression, decision trees, random forests, gradient boosting, k-nearest neighbors (KNN), and twelve neural network (NN) architectures, developed by combining different optimizers (L-BFGS, Adam, and SGD) with activation functions (tanh, relu, logistic, and identity). Model performance was assessed using the root mean squared error (RMSE), coefficient of determination (R2), and mean absolute error (MAE). Among all models, NN_tanh_lbfgs achieved the best results, with an almost perfect fit in training (R2 = 0.9999, RMSE = 0.0083, MAE = 0.0063) and excellent generalization in testing (R2 = 0.9946, RMSE = 1.5032, MAE = 1.2545). NN_logistic_lbfgs, gradient boosting, and NN_relu_lbfgs also exhibited high predictive accuracy and robustness. The SHAP analysis revealed that curing age and nano silica/cement ratio (NS/C) positively influence Fc, while porosity has the strongest negative impact. The main novelty of this study lies in the systematic tuning of neural networks via distinct optimizer–activation combinations, and the integration of SHAP for interpretability—bridging the gap between predictive performance and explainability in cementitious materials research. These results confirm the NN_tanh_lbfgs as a highly reliable model for estimating Fc in CM, offering a robust, interpretable, and scalable solution for data-driven strength prediction.

1. Introduction

Cement mortar (CM), composed of cement, water, sand, and additives, is vital in construction for its compressive strength (Fc), adhesion, and versatility in various applications [1]. Portland cement binds materials through the process of hydration, whereas sand contributes positively to the mixture by increasing bulk, reducing costs, and enhancing mechanical strength [2]. Additives in CM improve its workability, strength, curing, durability, crack resistance, and aesthetics [3,4]. Nano silica (NS) enhances the Fc, crack resistance, and durability of CM through accelerated hydration, while micro silica (MS) promotes early strength development, reduces shrinkage, and improves chemical resistance [5,6]. The combination of NS and MS enhances CM by boosting strength, reducing permeability, and improving durability through void filling and pozzolanic reactions, giving increasing resistance to freeze-thaw cycles and chemical exposure [7,8]. The Fc of CM, an essential parameter for evaluating quality and performance, is influenced by numerous factors, including sand/cement (S/C), water/cement (W/C), cement type, additives, and curing conditions, with nano materials playing a significant role in enhancing strength and durability [9,10]. This section examines previous studies on CM and the additives that improve its mechanical properties. Incorporating up to 10% NS by cement weight has been shown to significantly enhance the durability and strength of CM [11,12]. Oltulu and Sahin [13] found that incorporating 1.25% NS powder enhanced the Fc of CM, whereas increasing the content to 2.5% led to a reduction in strength. Qing et al. [14] performed an experimental analysis to examine the influence of NS on the properties of hardened cement paste. Jo et al. [11] investigated the impact of NS on the performance characteristics of CM, analyzing its influence on various properties. Artelt and Garcia [15] analyzed various mortar mixtures, comparing those with and without MS, and found that the incorporation of MS led to a reduction in flowability. Park et al. [16] demonstrated that the addition of MS improved the rheological properties of cement paste as its content increased. Ammar [17] investigated the influence of NS particle size on concrete Fc, finding that smaller particle sizes enhanced strength. Modeling and predicting the Fc of CM and concrete using advanced ML techniques and multi-criteria optimization are crucial for improving structural performance, reducing testing time, optimizing material use, and enabling cost-effective construction [18,19,20,21,22]. ML’s fast data processing and pattern recognition enable real-time applications, allowing industries to forecast outcomes, optimize processes, and enhance performance across sectors such as finance, healthcare, and engineering [23]. ML, a branch of artificial intelligence (AI), improves civil engineering by optimizing design, reducing costs, predicting structural behavior, and assessing risks for sustainable solutions [24,25,26,27,28,29]. ML includes unsupervised learning (USL), supervised learning (SL), and reinforcement learning (RL), with SL utilizing labeled data for regression and classification. In ML, especially in neural networks, optimizers are algorithms that adjust the model’s internal weights during training to minimize the loss function, thereby improving prediction accuracy. Examples include stochastic gradient descent (SGD), Adam, and the limited-memory Broyden–Fletcher–Goldfarb–Shanno (L-BFGS) algorithm. These optimizers determine how quickly and effectively the model converges toward an optimal solution. In contrast, activation functions define the output of each neuron and introduce non-linearity into the network, enabling it to learn complex patterns. Common activation functions include the rectified linear unit (ReLU), hyperbolic tangent (tanh), logistic sigmoid, and identity function. The choice of activation function affects the learning dynamics, expressiveness, and generalization of the neural network. Researchers have employed ML and AI techniques to predict the strength of concrete and CM, optimizing the design parameters, forecasting structural behavior, and enhancing the construction processes. Jueyendah et al. [30] demonstrated that support vector regression (SVR) with a radial basis function (RBF) kernel provides accurate and efficient predictions of CM strength, highlighting its effectiveness in performance modeling. Jueyendah and Humberto Martins [31] proposed a hybrid SVR-RBF optimization approach, presenting a robust framework for the optimal design of welded structures. Nasir Amin et al. [32] investigated the effect of waste glass powder on the Fc of mortar, employing ML techniques for this analysis. Alahmari et al. [33] utilized a hybrid ML approach to predict the Fc of fiber-reinforced self-consolidating concrete, with notable accuracy. Salah Jamal and Najah Ahmed [34] employed multiple ML techniques to predict the Fc of ultra-high-strength concrete, demonstrating their efficacy in performance prediction. Van Thi Mai et al. [35] demonstrated that XGBoost outperformed both the gradient-boosting and decision-tree models, emerging as the most accurate model for predicting the Fc of fiber-reinforced self-compacting concrete. Shafighfard et al. [36] employed a chained ML model to significantly improve prediction accuracy for the ductility and load capacity of steel fiber-reinforced concrete. Jain et al. [37] applied advanced ML techniques to significantly improve the precision of predicting the properties of construction materials. Guan et al. [38] employed ML to analyze the influence of glass powder on the Fc of self-compacting concrete, enhancing predictive accuracy. Fei et al. [39] applied ensemble ML models to predict the compressive strength of recycled powder mortar and found that stacking notably outperformed individual models, highlighting the advantage of combining multiple algorithms for improved accuracy. Wang et al. [40] utilized explainable boosting machine (EBM) techniques to predict the compressive strength of Portland cement–fly ash mortar, achieving high accuracy while providing interpretable insights into the influence of input variables. Aamir and Javed [41] applied linear and non-linear regression models to estimate the compressive strength of sodium hydroxide pre-treated crumb rubber concrete, concluding that non-linear models provided better predictive performance than linear ones. Ovačević et al. [42] employed artificial intelligence techniques to predict the compressive strength of green concrete with incorporated rice husk ash, demonstrating that AI models can effectively capture nonlinear behavior and improve prediction accuracy in sustainable concrete systems. Bin et al. [43] proposed optimized random forest models to predict the compressive strength of geopolymer composites, achieving high prediction accuracy and highlighting the effectiveness of hyperparameter tuning in enhancing model performance. The primary novelty of this work lies in the development of a comprehensive and comparative ML framework for predicting the Fc of CM. Unlike prior studies that predominantly utilize a limited number of ML techniques or fixed neural network (NN) configurations, the present study systematically investigates a broad spectrum of predictive models. Specifically, we evaluate twelve distinct NN architectures formed through the systematic combination of four activation functions (ReLU, tanh, logistic, and identity) and three optimization algorithms (L-BFGS, Adam, and SGD), alongside several well-established ML models, including linear regression, ridge, lasso, k-nearest neighbors (KNN), decision trees, random forests, and gradient boosting. Moreover, to enhance model interpretability—an aspect often overlooked in previous research—we incorporate SHAP (Shapley additive explanations) analysis. This provides a transparent and quantitative understanding of the influence of each input variable on the predicted output, thereby addressing the “black box” nature of many existing ML models. In summary, the novelty of this research is twofold: (1) the methodological integration of diverse and systematically tuned ML and NN models for the robust prediction of Fc, and (2) the application of interpretable AI techniques (SHAP) to ensure transparency and explainability of the predictive outcomes. These contributions fill critical gaps in the literature and advance the application of data-driven modeling in construction materials science. In this study, we systematically analyze the impact of key input features on the prediction of the Fc of CM using SHAP analysis. This approach not only quantifies the relative importance of variables such as curing age, NS/C, and porosity but also provides interpretability by linking these influences to the underlying physical and chemical processes governing material strength.

2. Data Description

This study utilized a dataset of 160 CM compressive strength data points detailed in [30] to enable precise estimation and comprehensive modeling. The input variables include the sand/cement (S/C), water/cement (W/C), nano silica/cement (NS/C), micro silica/cement (MS/C), cement (C), age (days), and porosity, while the output is the Fc of the CM. The dataset was partitioned into 80% for training, facilitating model learning and parameter optimization, and 20% for testing, ensuring an objective evaluation of prediction accuracy and generalization capability. The models were rigorously assessed for predictive performance, and the top-performing models were selected for comprehensive analysis. This study employs a robust set of predictive models, including decision tree, linear regression, ridge regression, lasso regression, random forest, gradient boosting, KNN, and several neural network architectures (e.g., NN_relu_adam, NN_relu_sgd, NN_relu_lbfgs, NN_tanh_adam, NN_tanh_sgd, NN_tanh_lbfgs, NN_logistic_adam, NN_logistic_sgd, NN_logistic_lbfgs, NN_identity_adam, NN_identity_sgd, and NN_identity_lbfgs) to systematically assess and model the Fc of CM. Data analysis and model development were executed in Python 3.11 using integrated development environments (IDEs) like Spyder, enabling streamlined data preprocessing, model training, and comprehensive evaluation. Python’s intuitive syntax, user-friendly interface, and robust library ecosystem make it an optimal choice for data analysis, scientific research, and ML applications. Python’s versatility and robust ecosystem efficiently address complex computational challenges across various domains. Python is extensively used in civil and structural engineering for data analysis and modeling, utilizing libraries like NumPy and Pandas for efficient optimization. As shown in Figure 1, the study methodology begins with data collection and statistical analysis, progressing to the key stages of ML model development.
As depicted in Figure 1, the study methodology begins with data collection and statistical analysis, followed by key steps in ML modeling, such as data preprocessing, data splitting, feature selection, and normalization. The process progresses with the selection of appropriate models, followed by training, evaluation, and hyperparameter optimization. Ultimately, predictions are generated, and the results are analyzed to derive the output parameter, Fc, providing insights into the model’s performance. Table 1 presents a comprehensive summary of the input and output parameters, along with their corresponding statistical characteristics.
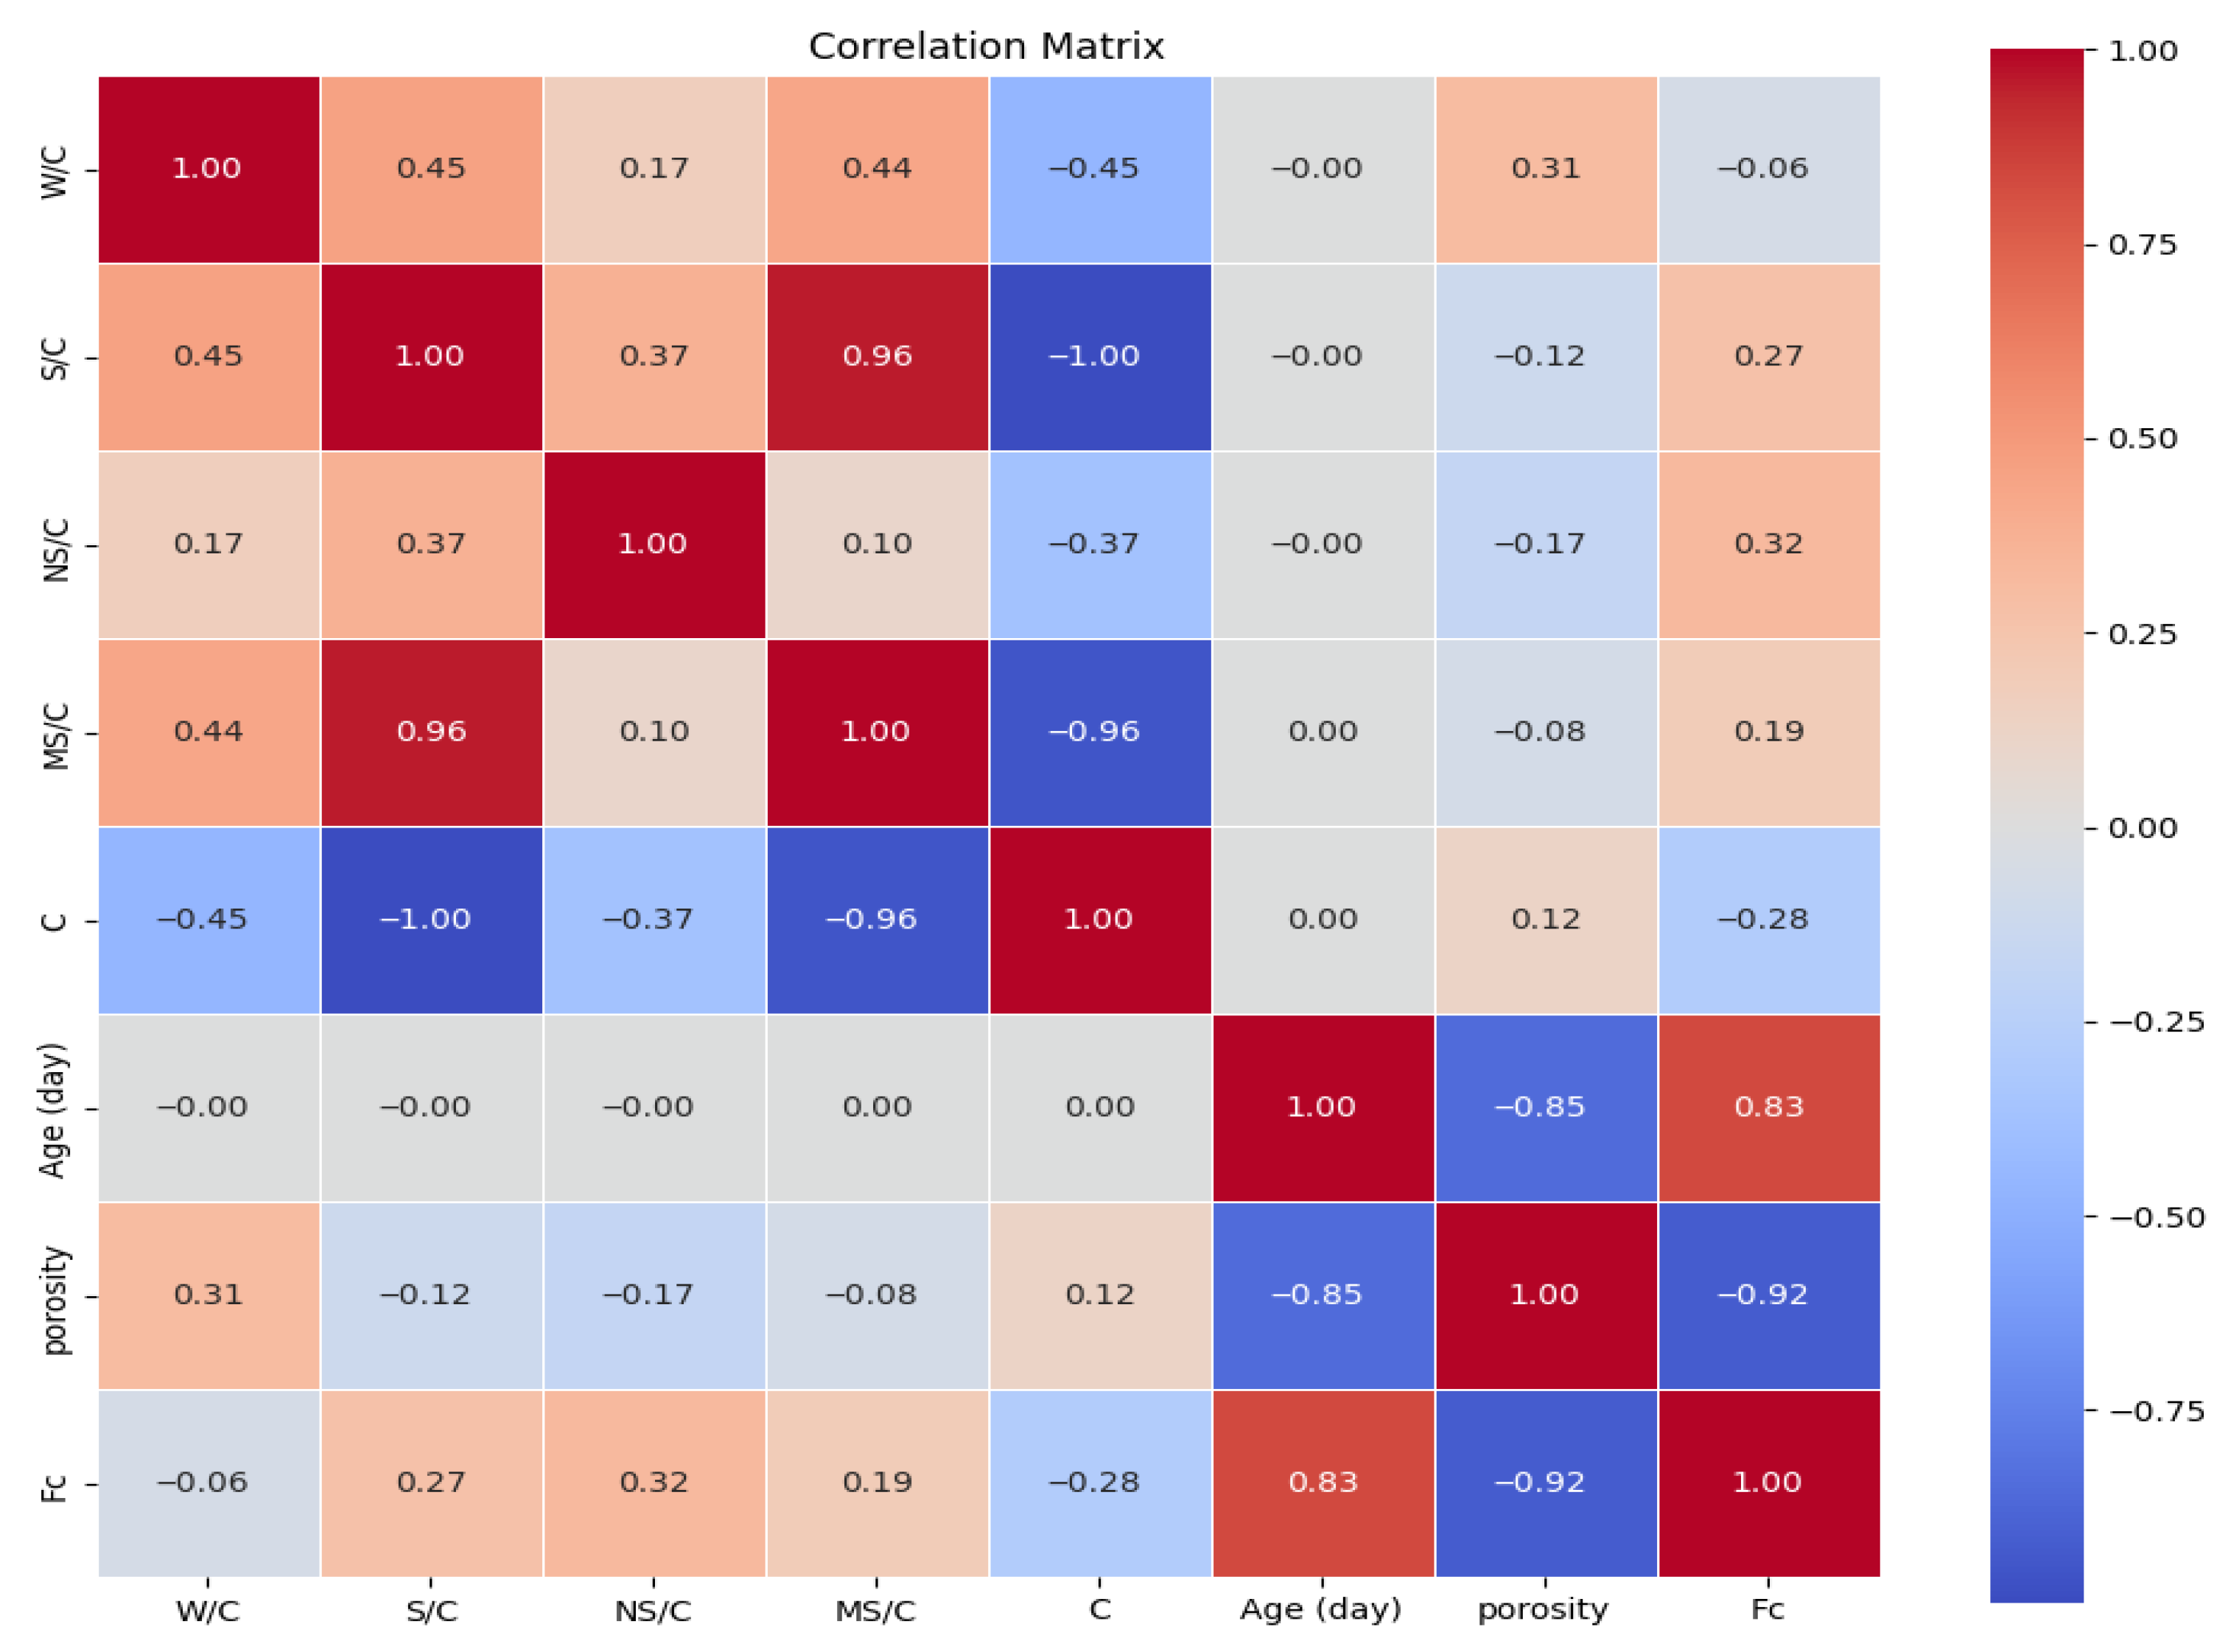
Table 1 summarizes the statistical properties of the input and output parameters for the Fc dataset. The input parameters include cement (C), age (days), porosity, water/cement (W/C), sand/cement (S/C), nano-silica/cement (NS/C), and micro-silica/cement (MS/C), while the output parameter is the Fc of the CM. The W/C ranges from 0.400% to 0.604%, with a mean of 0.494% and a standard deviation of 0.062%, indicating moderate dispersion. Similarly, the NS/C, S/C, and MS/C exhibit limited variability, with standard deviations of 0.018, 0.166%, and 0.058%, respectively. The Fc of the CM ranges from 18 Mpa to 85 Mpa, with an average value of 54.823 Mpa and a standard deviation of 14.648 Mpa, reflecting considerable variability in the material’s strength properties. Figure 2 presents the correlation matrix, depicting the relationships between input parameters (S/C, W/C, NS/C, MS/C, C, day, and porosity) and the output (Fc) through a color scale. Strong positive correlations (approaching +1) are shown in red, strong negative correlations (approaching −1) in blue, and weak or negligible correlations in lighter shades (white/gray).
Figure 2 indicates that curing age (0.83) significantly enhances Fc by advancing hydration and microstructural refinement, whereas porosity (−0.92) weakens the CM matrix, reducing Fc. S/C (0.27) and NS/C (0.32) moderately enhance Fc by improving workability, packing density, and pore refinement, although excessive sand addition may dilute the cement matrix. MS/C (0.19) marginally enhances Fc via pozzolanic reactions, while W/C (−0.06) has a minimal impact, and C (−0.28) may decrease material strength due to shrinkage and cracking. The SHAP analysis and correlation matrix provide complementary but distinct insights into the impact of input parameters on Fc. The correlation matrix captures linear relationships between variables, while SHAP analysis encompasses both linear and nonlinear dependencies, offering a more comprehensive assessment of each feature’s contribution to predictive outcomes. While some trends align, SHAP values provide a deeper understanding of feature importance, as illustrated in Figure 3.
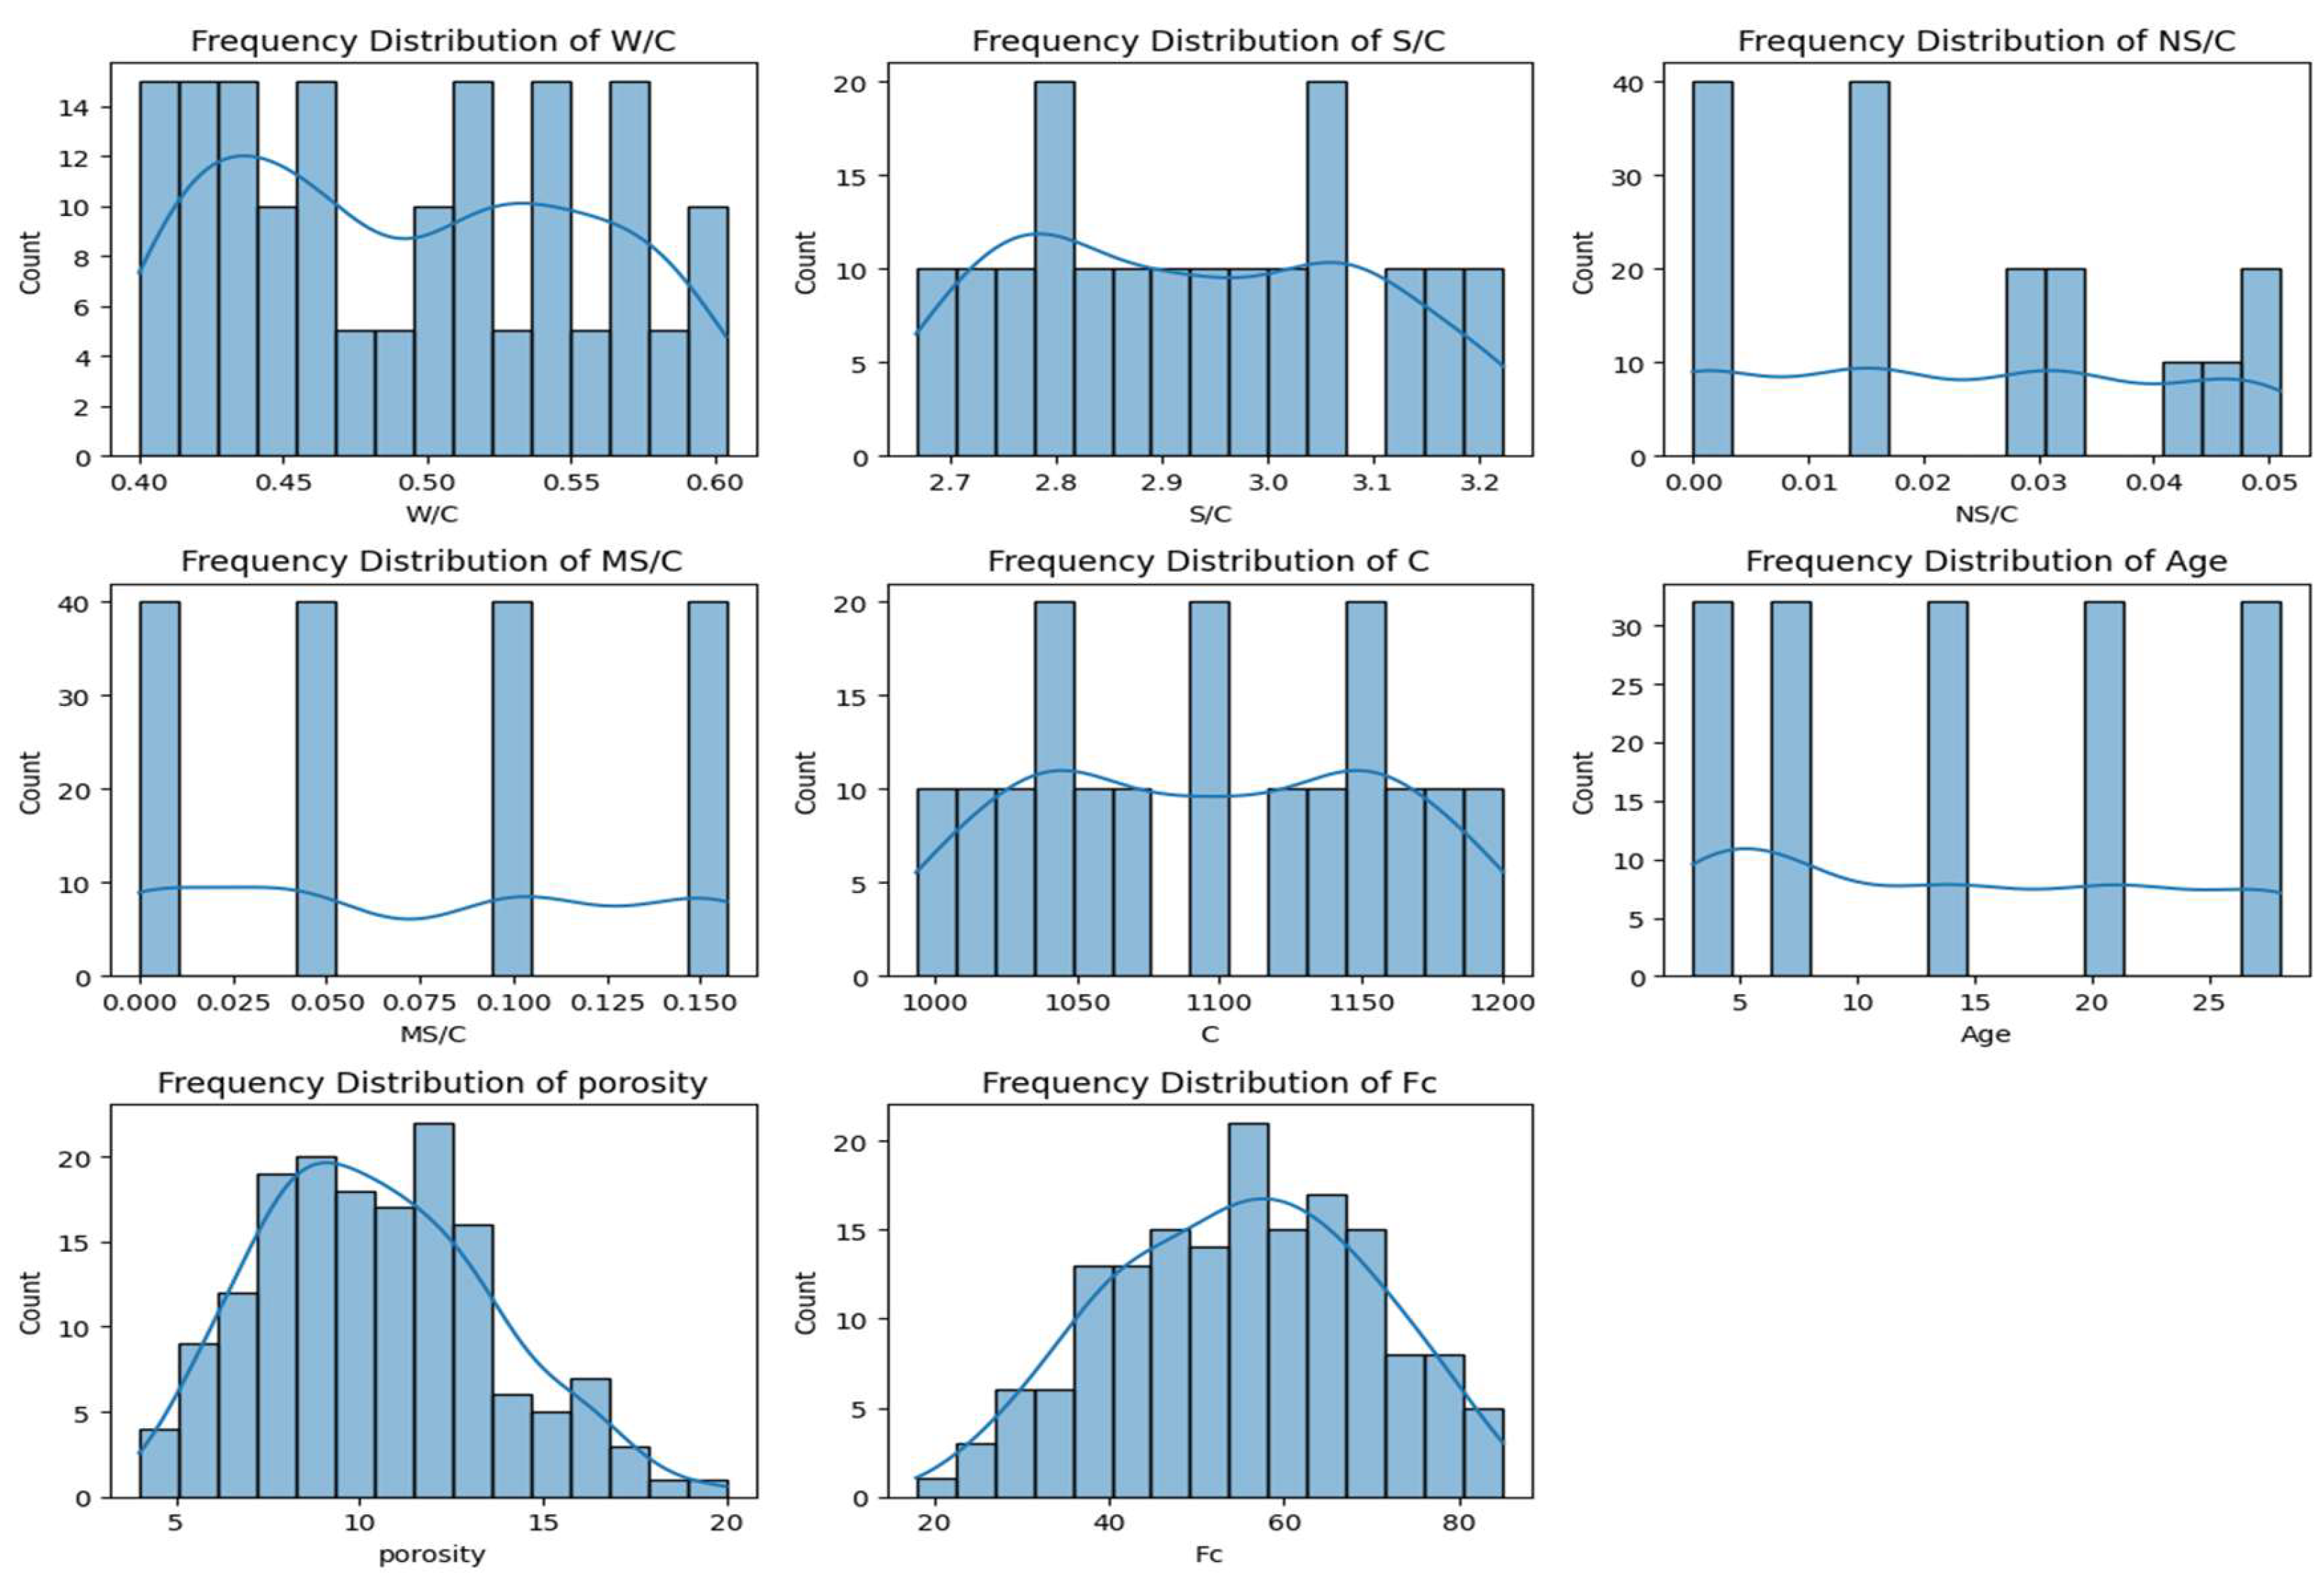
Figure 3 presents the SHAP analysis, highlighting each input parameter’s impact on predicted Fc, where positive values indicate an increase and negative values a decrease, with feature values depicted in a red-to-blue color gradient. Porosity has the most significant negative effect on Fc, where higher porosity (red) reduces strength by increasing void content, while age (days) shows a positive correlation, with extended curing times (red) enhancing Fc through improved hydration. NS/C positively influences Fc, especially at higher values (red), by refining the microstructure, whereas W/C negatively affects strength, as higher water content (red) increases porosity and decreases Fc. S/C demonstrates a mixed effect, where excessive sand content may reduce strength, while MS/C has a minor positive impact, improving strength through its pozzolanic reaction. Cement (C) content generally enhances strength at higher values (red), although its effect may be influenced by interactions with other variables. For the descriptive SHAP output in Figure 3, deeper insights were integrated by correlating the feature contributions with fundamental material behavior. Porosity, for example, showed the most negative impact on predicted Fc due to increased void content and reduced mechanical integrity. Age contributed positively through continuous hydration and microstructural densification. NS/C enhanced strength by accelerating the formation of calcium silicate hydrate (C–S–H), while a higher W/C ratio reduced strength by increasing porosity. S/C showed a nonlinear effect, possibly due to filler and dilution mechanisms. MS/C had a moderate positive effect via its pozzolanic reactivity, and cement content improved strength depending on its interaction with other constituents. These observations align with known principles of cementitious materials and validate the reliability of the SHAP-based interpretation. The frequency distributions of the input and output parameters of compressive data are illustrated in Figure 4.
Figure 4 presents the frequency distributions of the key input and output parameters used in this study, with units specified for clarity. These parameters include the water-to-cement ratio (W/C, %), sand-to-cement ratio (S/C, %), nano silica-to-cement ratio (NS/C, %), micro silica-to-cement ratio (MS/C, %), cement content (C, grams), age (days), porosity (%), and compressive strength (Fc, Mpa). The W/C ratio displays a relatively uniform distribution, fluctuating primarily between 0.40 and 0.60, while the S/C ratio shows an uneven spread with prominent peaks between 2.7 and 3.2. The NS/C ratio exhibits a highly skewed distribution, with the majority of values concentrated near 0.01, spanning from 0.00 to 0.05. The MS/C ratio shows a discretized pattern, with distinct bar-like intervals ranging from 0.00 to 0.15. Cement content follows a bimodal distribution, indicating two main concentration levels between 1000 and 1200 g. The age parameter, ranging from 3 to 27 days, reveals evenly spaced peaks consistent with systematic data collection intervals. Both porosity (0–20%) and compressive strength (18–85 Mpa) follow approximately normal distributions, reflecting natural variability. Notably, MS/C and age exhibit discrete distributions, whereas porosity and Fc are normally distributed, and NS/C is skewed toward lower values.

2.1. Linear Machine Learning Models

Linear models, such as linear, ridge, lasso, elastic net, principal component regression (PCR), partial least squares (PLS), logistic models, and stepwise regression, assume linear relationships between the variables and are computationally efficient, making them well-suited for large datasets. These models employ techniques such as regularization, dimensionality reduction, and statistical variable selection to enhance predictive accuracy, mitigate overfitting, and reduce model complexity. Linear models predict continuous outcomes, providing interpretability, regularization, and the effective management of multicollinearity, with extensions available to capture more complex data patterns [44]. Linear regression (LR) is a fundamental supervised learning (SL) method that models the linear relationship between inputs and a continuous output. Ridge regression utilizes L2 regularization to mitigate overfitting and address multicollinearity, while preserving all features without performing explicit feature selection. In contrast, lasso regression applies L1 regularization to eliminate irrelevant coefficients, enabling feature selection and model simplification, but may struggle with highly correlated predictors. Linear models are extensively utilized in civil and structural engineering to predict material properties, load capacity, and compressive strength, as well as to optimize designs, thereby improving accuracy, safety, and decision-making efficiency [45,46,47].

2.2. Non-Linear Machine Learning Models

Non-linear models, including polynomial regression, decision trees, random forest, gradient boosting, support vector regression, KNNs, and neural networks, offer enhanced flexibility and the ability to capture complex patterns and interactions, although they are computationally intensive and are often less interpretable than linear models [48]. Tree-based models, including random forests, decision trees, gradient boosting, AdaBoost, and ExtraTrees, enhance predictive accuracy, capture complex interactions, and mitigate overfitting in classification and regression tasks [49]. Tree-based models, such as decision trees, capture non-linear relationships and improve accuracy through ensemble methods like random forests and gradient boosting, although they are prone to overfitting and sensitive to data fluctuations. Random forest models aggregate decision trees with bootstrapped data and random feature subsets, enhancing accuracy and generalization while being robust against overfitting, although they are less interpretable and computationally demanding. Gradient boosting sequentially builds models to address errors, with popular implementations such as XGBoost and LightGBM enhancing performance and efficiency [50]. The KNN is a non-parametric algorithm for regression and classification, making predictions based on the nearest data points and adapting seamlessly to new data [51,52]. NNs are computational models inspired by the brain’s neural architecture, utilizing multiple layers of interconnected nodes to process and analyze data for tasks such as classification, regression, and pattern recognition. NNs excel at capturing complex, non-linear patterns in large datasets, making them ideal for tasks like image and speech recognition and predictive modeling in various fields. NNs consist of input, hidden, and output layers, learning complex patterns through weight adjustments via forward propagation and backpropagation, excelling at non-linear relationships but being computationally expensive and prone to overfitting. Non-linear models, including tree-based methods, KNN, and neural networks, are applied in civil engineering for tasks such as load prediction, material property estimation, design optimization, and infrastructure health assessment, thereby enhancing decision-making and operational efficiency [53,54,55,56].

3. Methods

This dataset was generated through comprehensive laboratory experimentation on 32 CM mixtures designed to investigate the effects of nano silica (NS) and micro silica (MS) as partial cement replacements. Ordinary Portland cement (OPC) with a strength class of 52.5 Mpa was used. The experimental program considered two water-to-binder ratios (W/B) of 0.40 and 0.50, with NS/B replacement levels of 0–4.2% and MS/B levels of 0–13%. A total of 480 cubic specimens (50 × 50 × 50 mm3) were prepared and tested for Fc at curing ages of 3, 7, 14, 21, and 28 days, in accordance with ASTM C109 standards. Porosity measurements were performed by determining the weight differences between the oven-dried, saturated, and saturated surface-dry states of specimens. To ensure data quality, all tests were performed in triplicate, and average values were reported to minimize experimental variability. Validation procedures included statistical screening to identify and exclude outliers and inconsistencies. To ensure data integrity and modeling reliability, the dataset underwent comprehensive curation, including the verification of completeness and consistency across all variables. Measurement uncertainties were estimated at approximately ±2% for Fc and porosity, in accordance with accepted experimental tolerances for cementitious materials. Although this level of noise is typical in civil engineering research, it was not explicitly propagated through formal sensitivity or error analysis techniques. Instead, model robustness was addressed via interpretability tools such as SHAP, which capture both linear and nonlinear relationships between input features and target output. While SHAP analysis provided meaningful insights into feature contributions, future work will incorporate complementary techniques such as permutation importance and drop-column methods to further evaluate feature relevance under measurement uncertainty and noise, thereby enhancing the reliability of the predictive model. To ensure a fair and reliable evaluation of model performance, the entire dataset was randomly split into 80% for training and 20% for independent testing. All performance metrics, including R2, RMSE, and MAE, were calculated based solely on the test set, which was not exposed to the model during training. This approach ensured that the reported results genuinely reflected the models’ generalization capabilities. The consistently high R2 values (above 0.99) observed for certain models, such as NN_tanh_lbfgs and gradient boosting, indicate their strong predictive power in capturing the complex relationships between input parameters and Fc. These results are supported by the quality and consistency of the experimentally obtained dataset, which contributes to the models’ stability and accuracy. In this study, porosity was incorporated as a key input parameter due to its critical role as a microstructural descriptor that directly influences the mechanical behavior of cement mortar. Unlike compositional parameters alone, porosity reflects the cumulative effects of pore volume, size distribution, connectivity, and morphology, which significantly affect load transfer and failure mechanisms. Experimental evidence from prior studies, as well as our own data, indicates that porosity strongly correlates with compressive strength and durability. Including the porosity parameter enables the machine learning model to capture complex, nonlinear interactions and latent microstructural effects, thereby enhancing its predictive accuracy beyond that achievable through mix-design variables alone.

4. Results and Discussion

This section assesses the performance and predictive accuracy of linear models (linear regression, lasso, and ridge) and non-linear models (random forest, decision tree, gradient boosting, KNNs, and neural networks) in predicting the Fc of CM. The focus is on assessing the models’ ability to capture complex relationships and provide accurate predictions, facilitating the selection of the most suitable model for this application. The accuracy of software predictions is heavily influenced by optimal parameter tuning, as effective optimization is essential for improving model performance in both forecasting and analytical applications. The choice of parameters impacts the model’s sensitivity, generalization ability, and proficiency in detecting patterns while minimizing overfitting. The software determines the optimal values within specified limits, and the performance, accuracy, and forecasting efficacy of the algorithms and models were assessed using metrics such as MAE, RMSE, and the R2. Table 2 presents the optimal hyperparameters that govern the learning process and significantly influence model performance. Proper hyperparameter tuning is essential as it influences various aspects of the model’s learning, with factors like learning rate, layer count, and regularization strength playing key roles in determining performance, accuracy, and generalization ability. Batch size and optimizer choices impact training efficiency and convergence, while hyperparameter tuning, such as by grid searches, optimizes model performance, training time, and generalization in regression tasks. Hyperparameter optimization was conducted via a systematic grid search across predefined parameter ranges tailored to each model. For tree-based algorithms, parameters such as max_depth (3–10), min_samples_split, min_samples_leaf, n_estimators (100–300), and learning_rate (0.01–0.115) were explored. KNN was tuned over n_neighbors (3–10) using the Euclidean metric. Neural networks were optimized by varying the activation functions (ReLU, tanh, logistic, and identity), solvers (Adam, SGD, and L-BFGS), learning rates (0.0001–0.001), and regularization parameters (alpha: 0.0001–0.01). Model configurations were evaluated on a validation subset (20% of training data), with the optimal hyperparameters selected based on predictive performance. The selected parameters are detailed in Table 2.
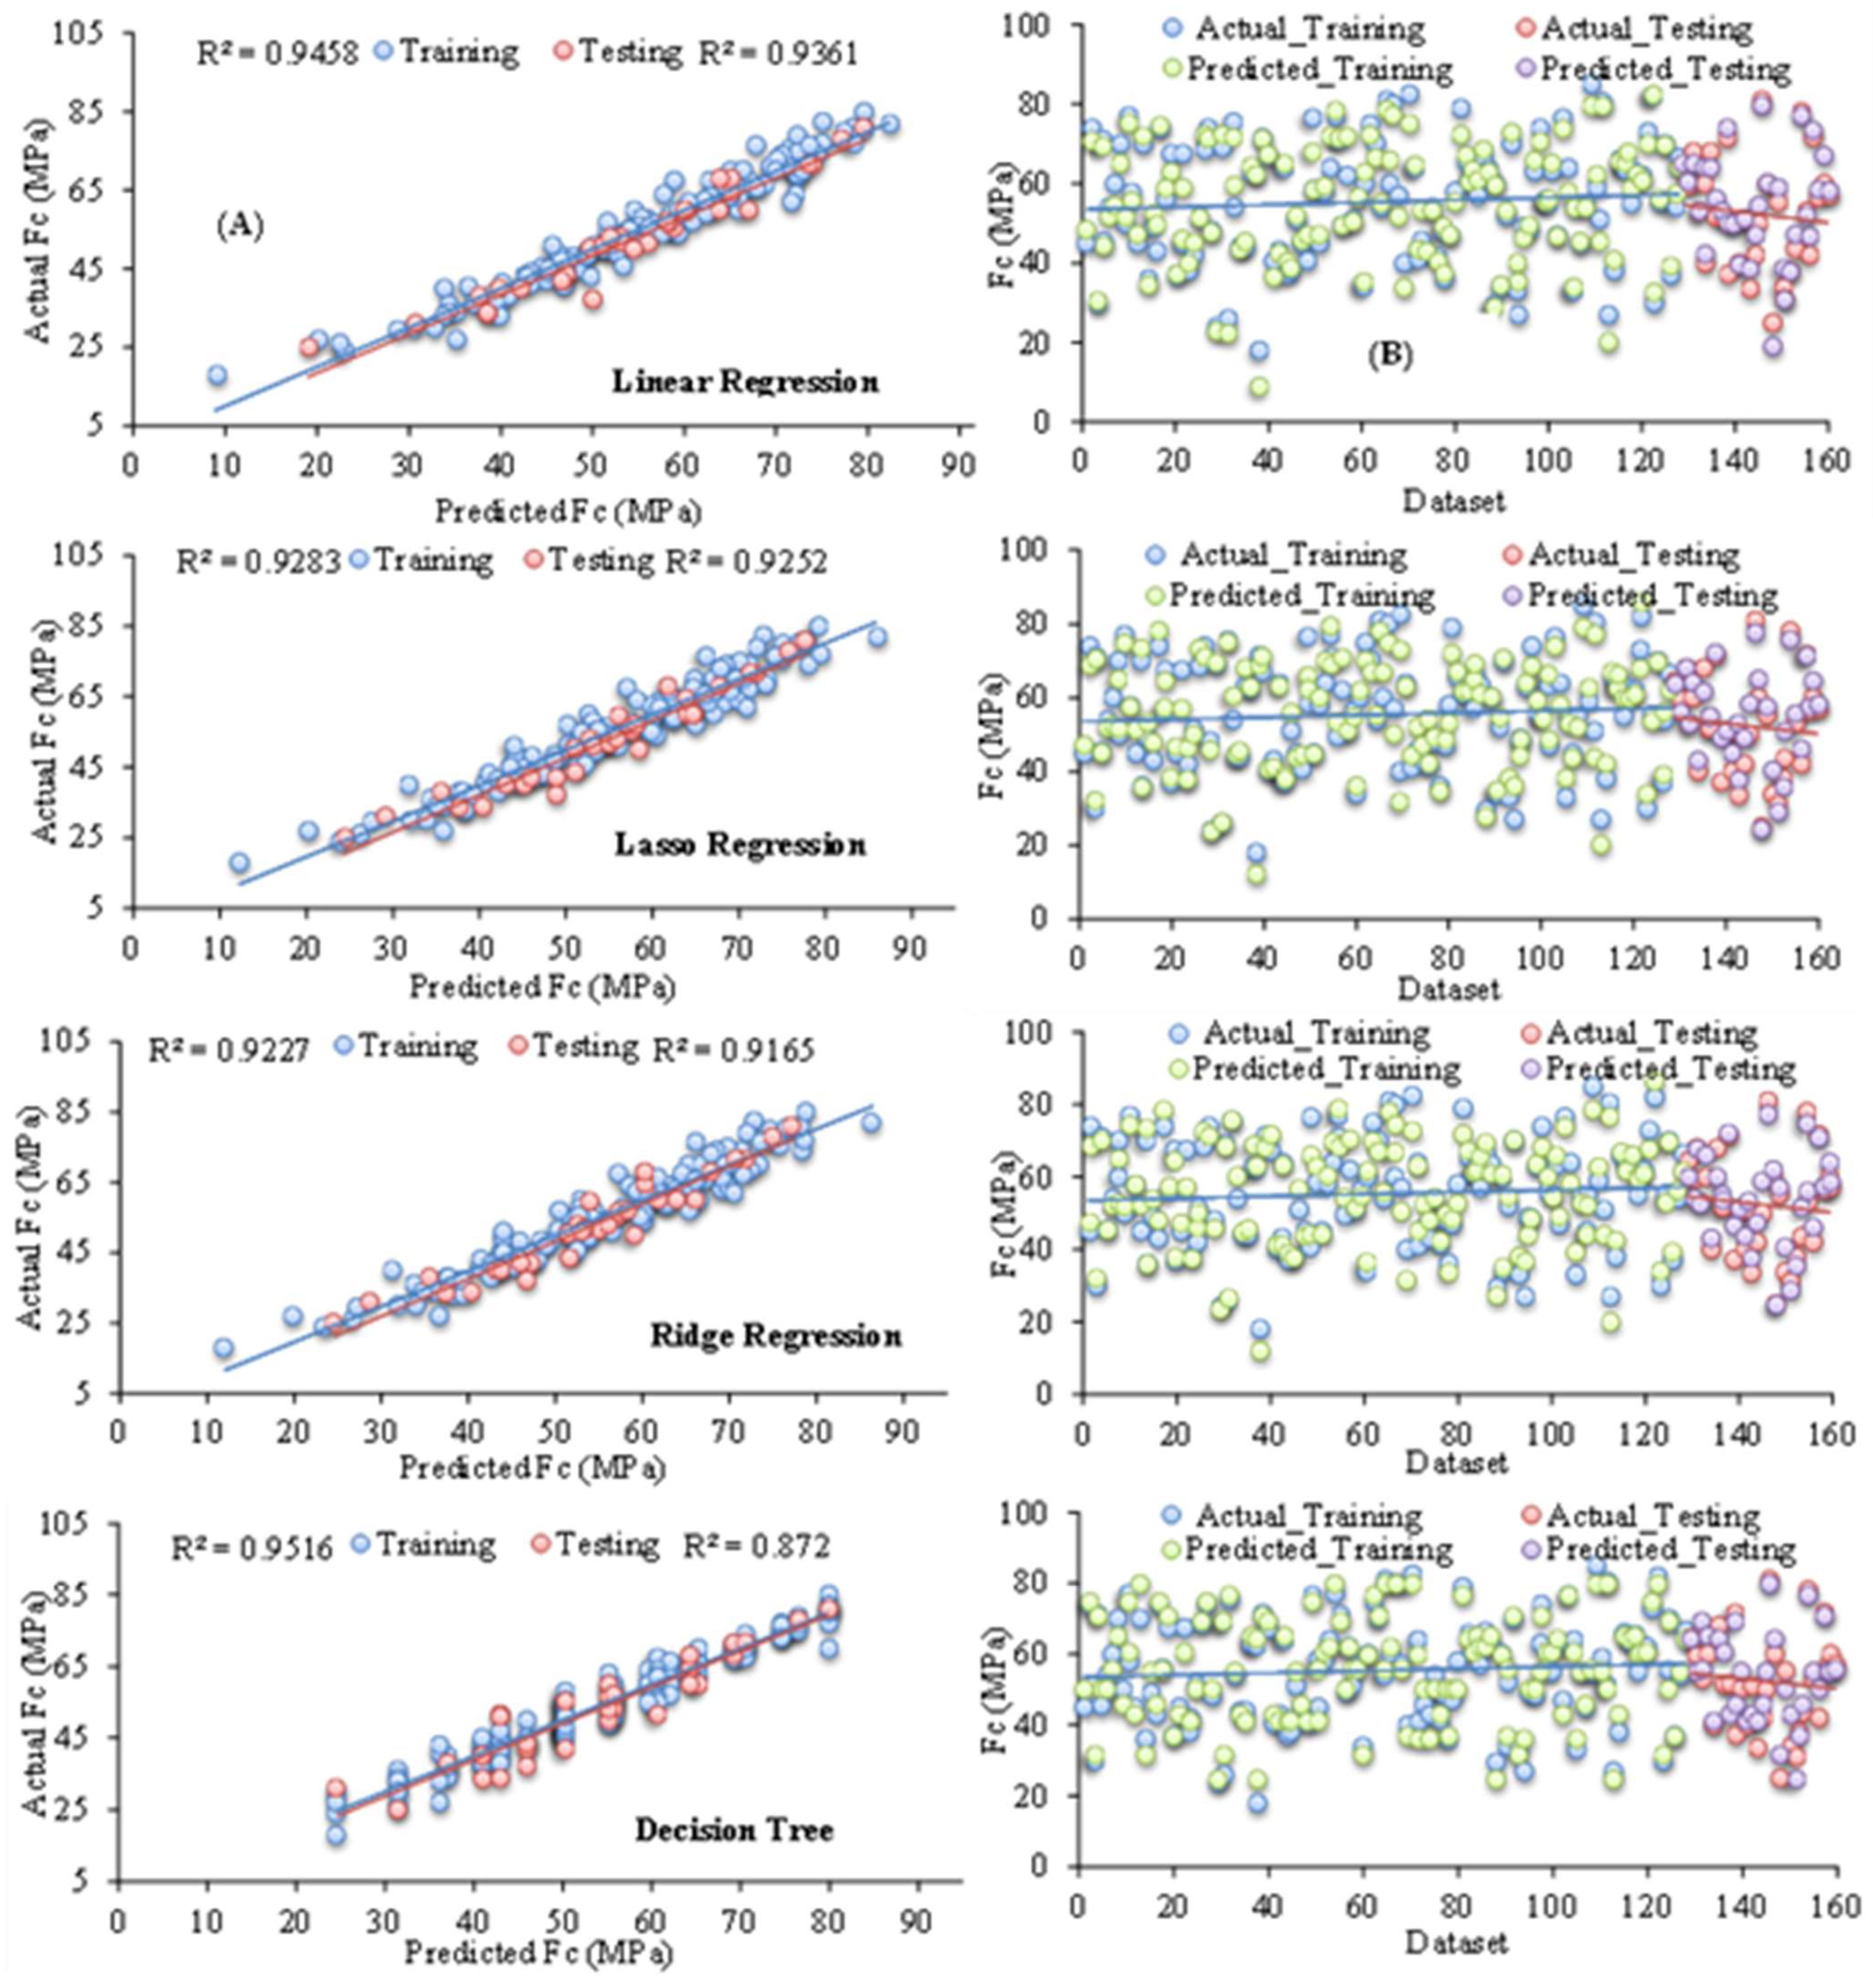
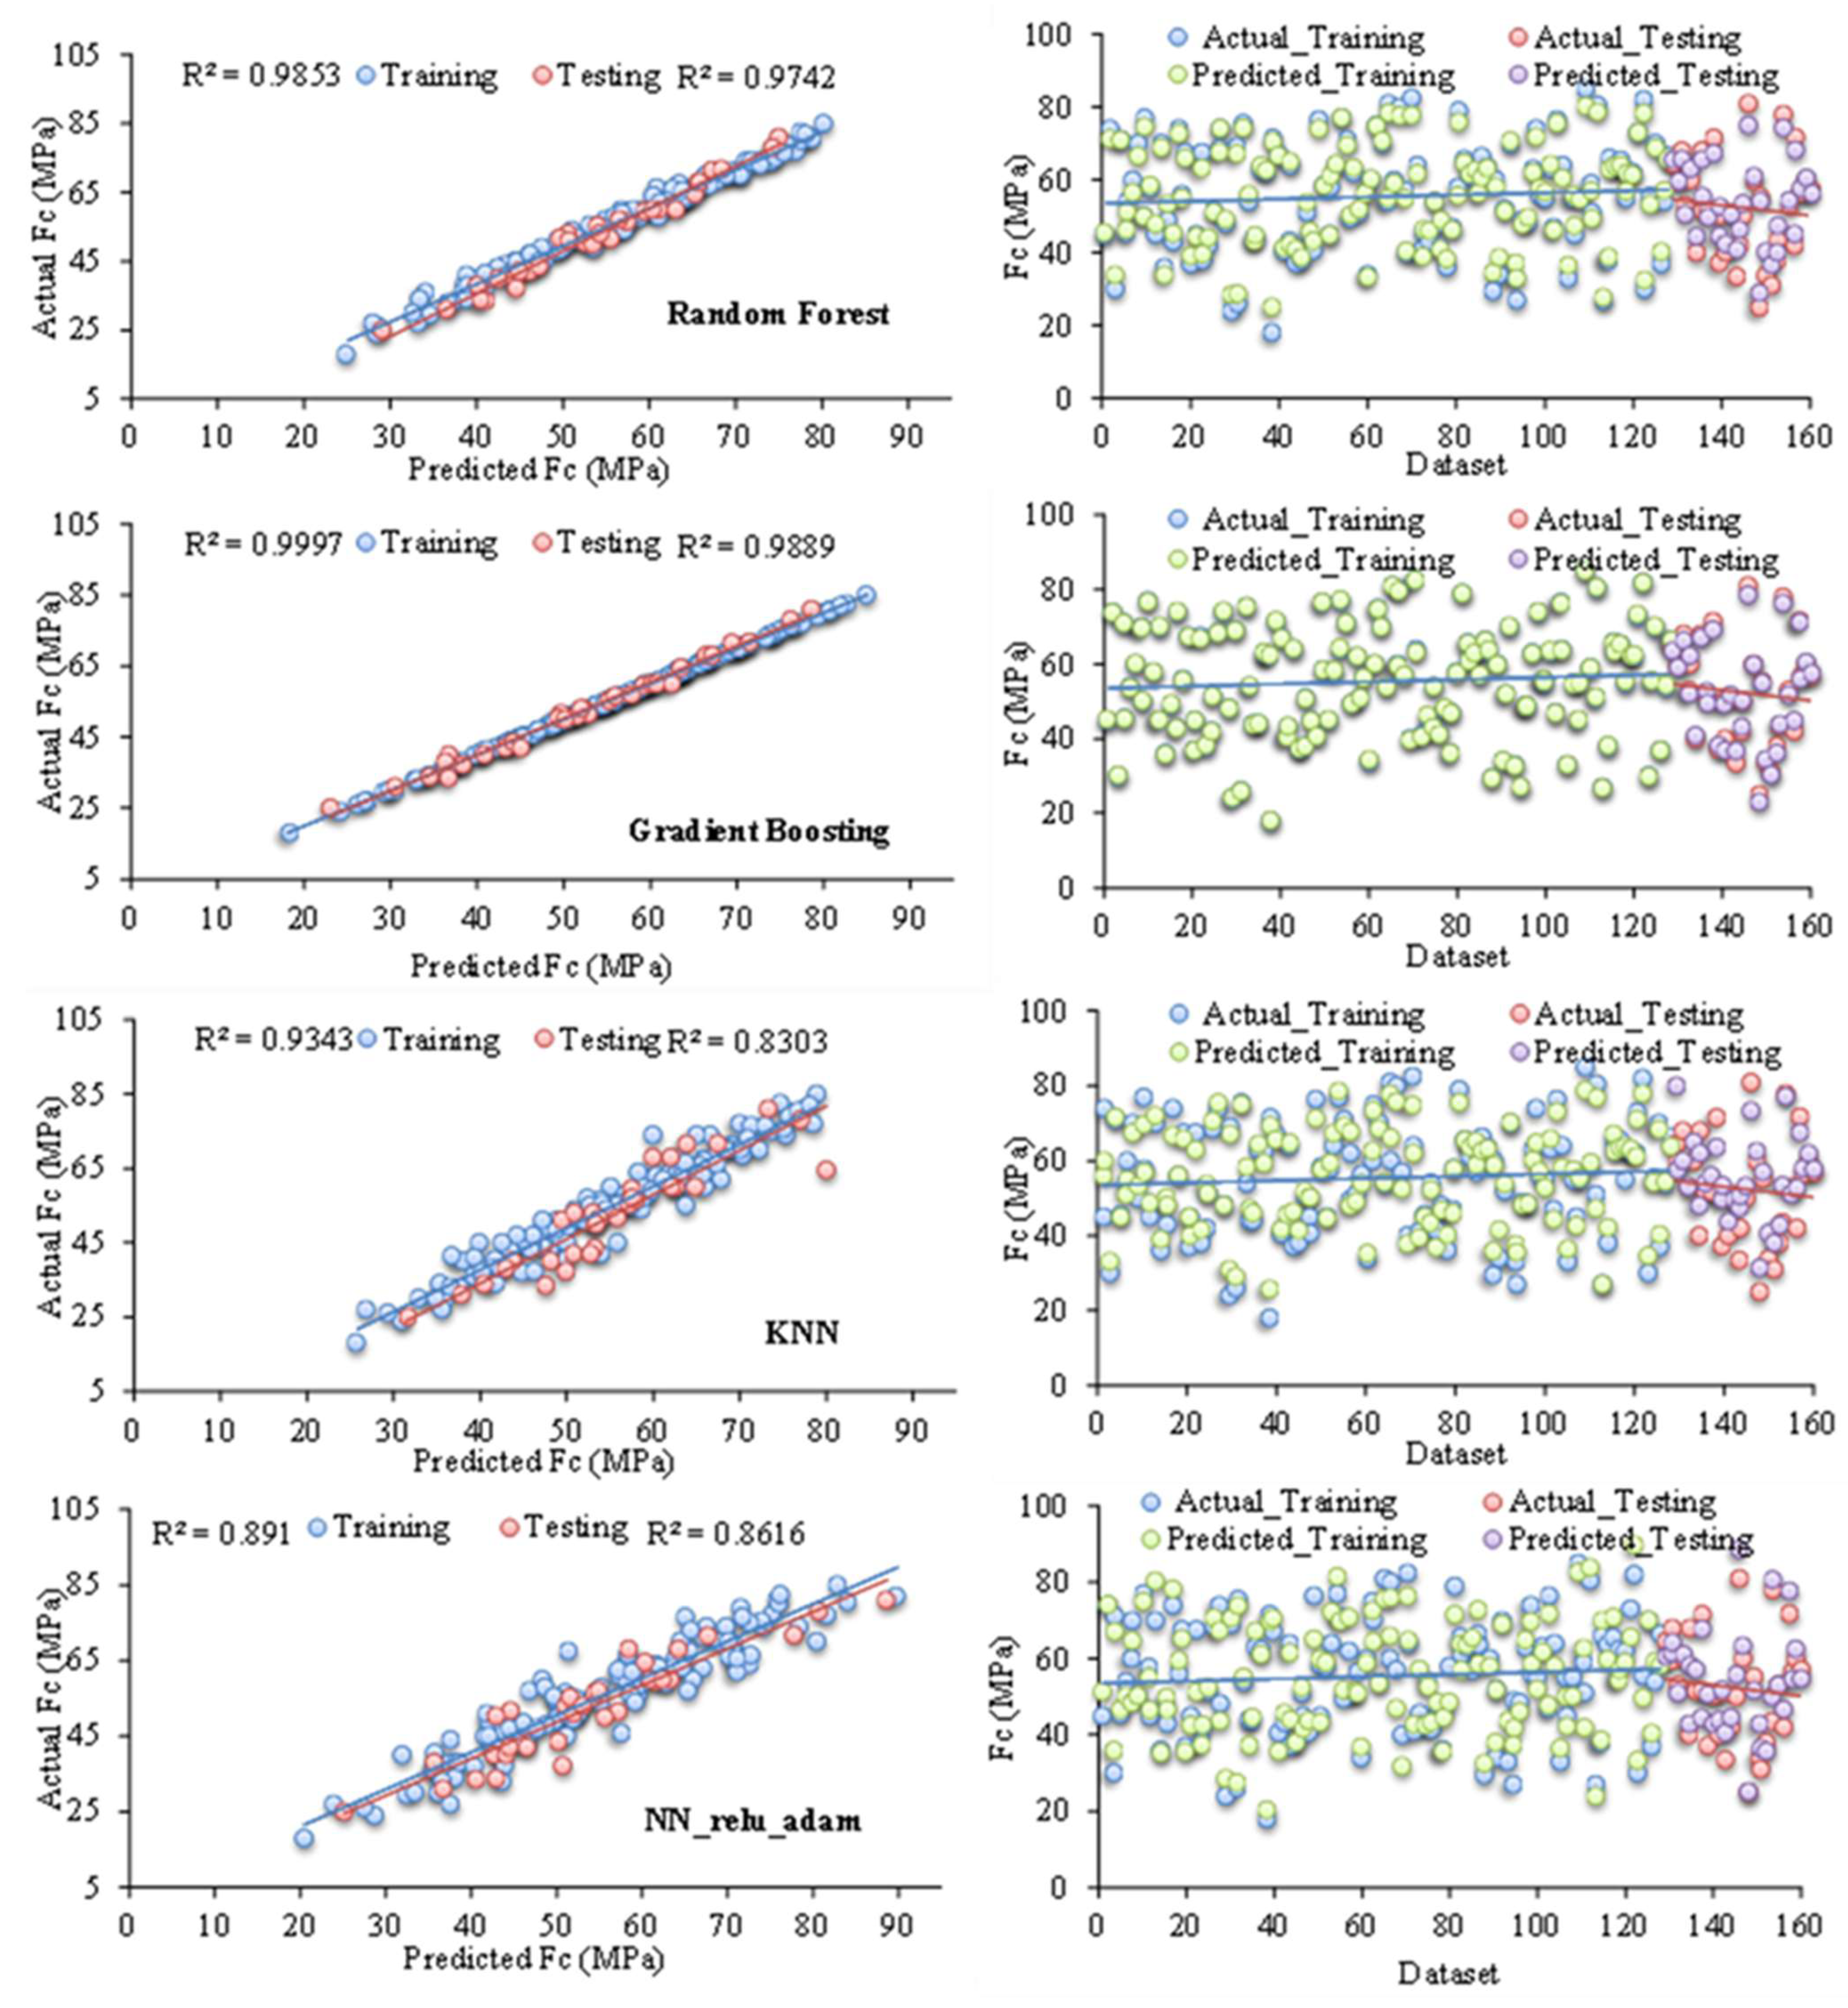
Table 2 outlines the hyperparameters for various predictive models, including linear regression, tree-based models, KNN, and NNs. Each model is configured with specific settings, such as regularization, solver type, tree depth, and estimators, to optimize performance. NNs are evaluated using various activation functions (ReLU, Tanh, Logistic, and Identity) and solvers (Adam, SGD, and LBFGS) with standard parameters, including iterations, learning rates, and hidden layer configurations. Linear regression incorporates an intercept term, ridge regression employs moderate regularization with an alpha value of 1.0, and lasso regression applies light regularization with an alpha value of 0.1, utilizing 1000 iterations for model optimization. The decision tree has max_depth = 5, min_samples_split = 2, and min_samples_leaf = 4, while random forest uses 100 trees (n_estimators = 100), max_depth = 10, and bootstrapping. Gradient boosting sets learning_rate = 0.115 and n_estimators = 300, and KNN uses 5 neighbors with Euclidean distance (p = 2). The NN models utilize an MLP regressor with 50-unit hidden layers and up to 10,000 iterations, testing various activation functions and solvers to optimize performance for consistent Fc prediction evaluation. Tuning can be performed through methods such as random search, grid search, or Bayesian optimization to identify the optimal hyperparameters. Regularization strength (alpha, λ) and L1 ratio are key in controlling model complexity, with higher regularization reducing complexity and tuning the L1 ratio, ensuring an appropriate balance. Premature stopping can hinder model performance, while robust regression uses epsilon (ε) to reduce outlier sensitivity, tree-based models adjust parameters like splitter and max_depth to manage complexity, n_estimators balances performance and computation in ensemble methods, and normalizing input features prevents scale bias in regularized models. Fc values were predicted using linear, ridge, lasso, gradient boosting, decision tree, random forest, KNN, and various NN configurations (e.g., NN_relu_adam, NN_relu_sgd, NN_relu_lbfgs, NN_tanh_adam, NN_tanh_sgd, NN_tanh_lbfgs, NN_logistic_adam, NN_logistic_sgd, NN_logistic_lbfgs, NN_identity_adam, NN_identity_sgd, and NN_identity_lbfgs) with different optimizers. Performance metrics (RMSE, R2, and MAE) for training and testing datasets are shown in Table 3 and Figure 5 and Figure 6, highlighting the top predictors for the Fc of CM.
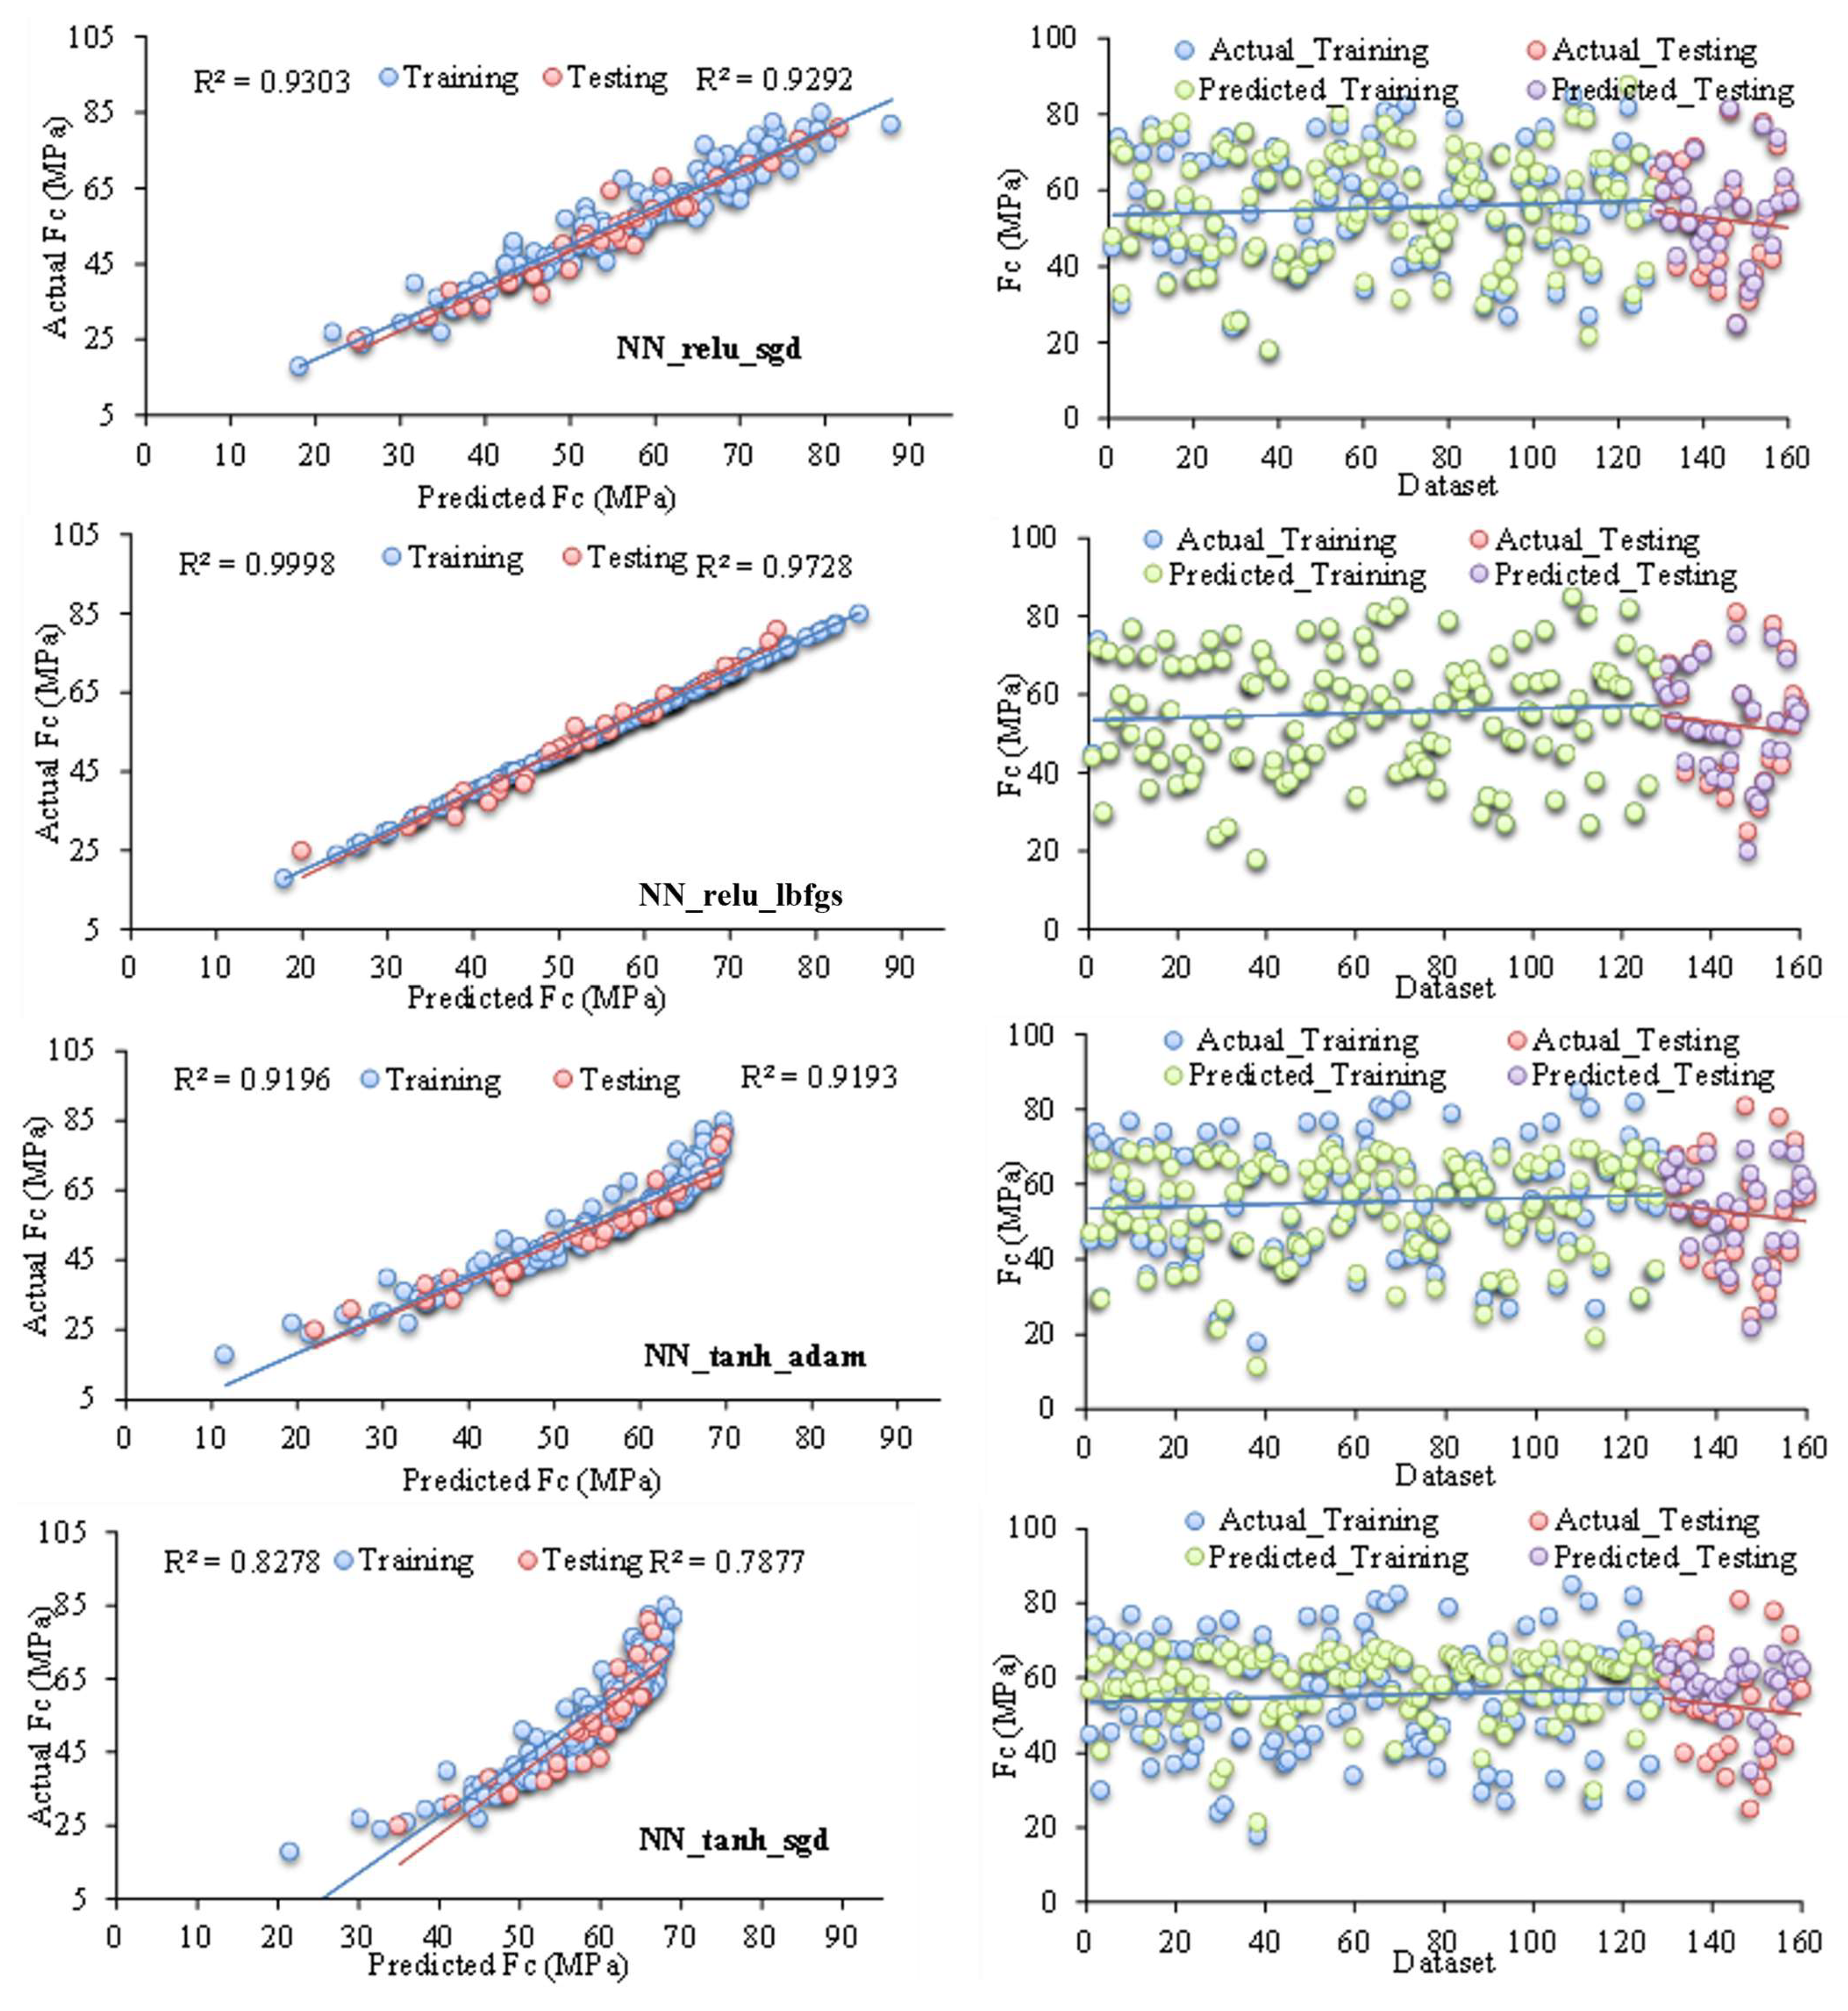
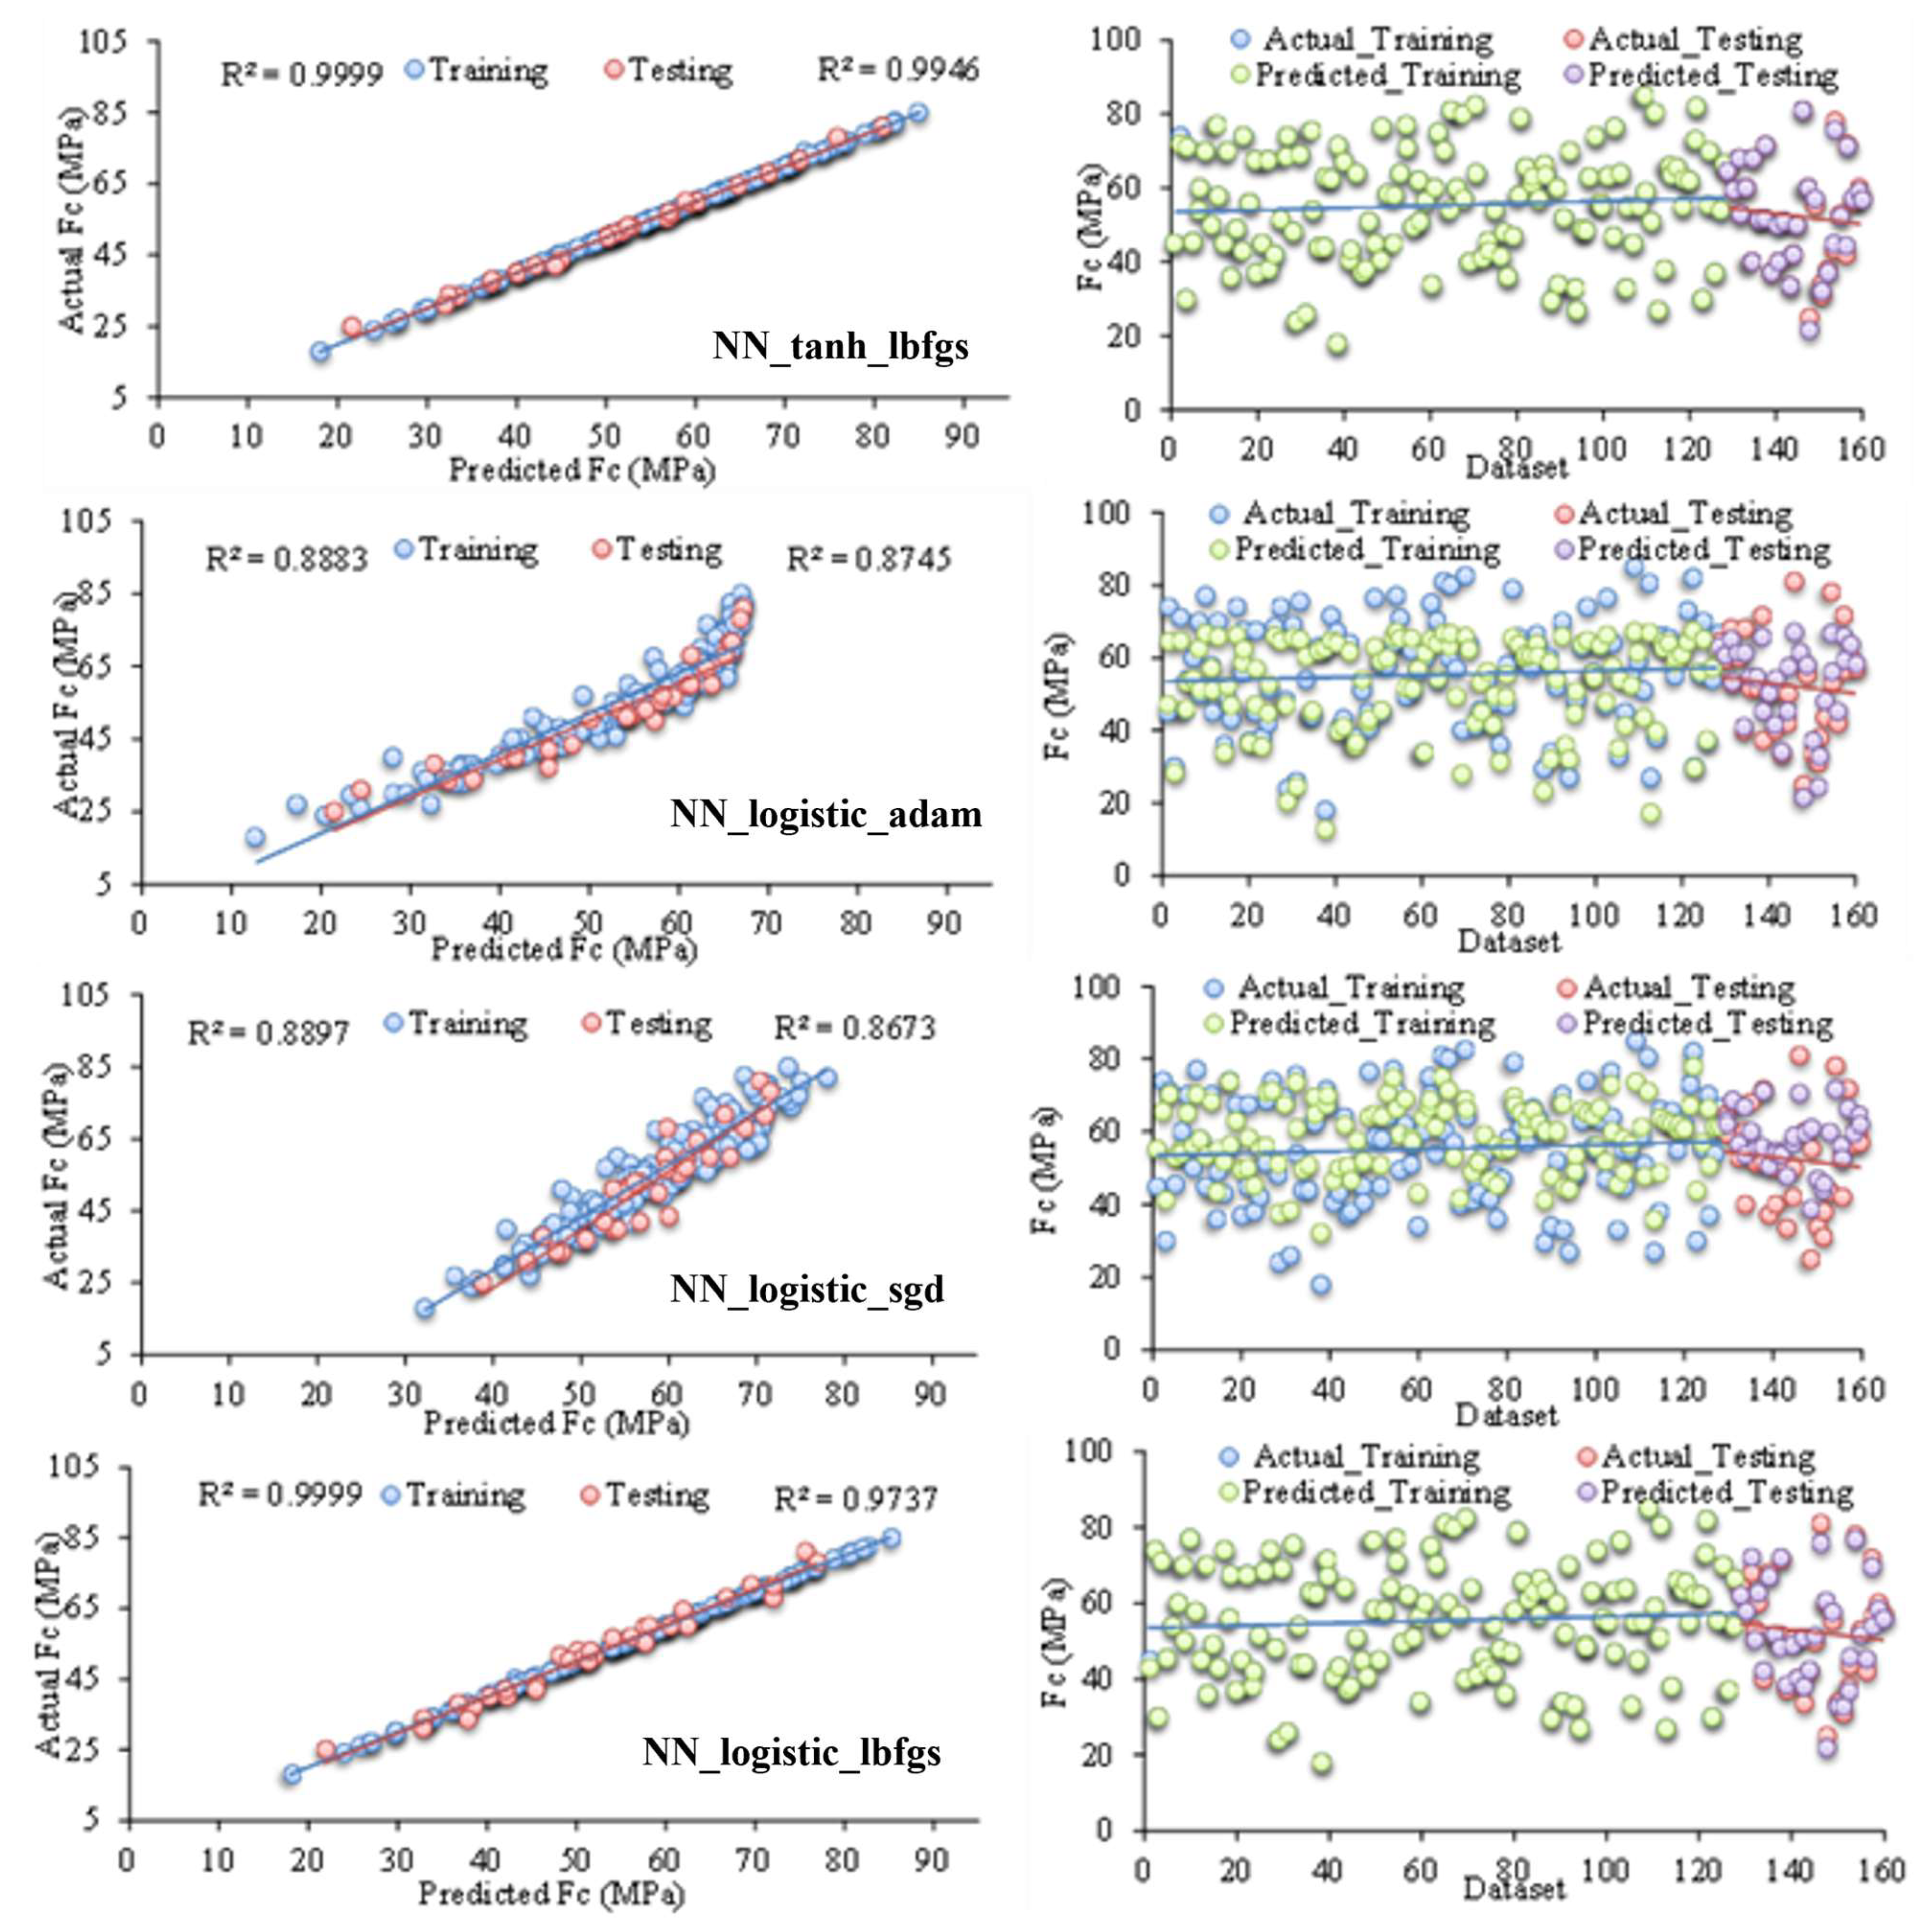
As presented in Table 3 and Figure 5 and Figure 6, the models NN_tanh_lbfgs, NN_logistic_lbfgs, gradient boosting, and NN_relu_lbfgs, which exhibited the highest R2 values and the lowest MAE and RMSE in both training and testing phases, outperformed the other models in predicting the Fc of CM. Specifically, the NN_tanh_lbfgs model achieved an R2 of 0.9999 (RMSE = 0.0083, MAE = 0.0063) during the training phase, and an R2 of 0.9946 (RMSE = 1.5032, MAE = 1.2545) during the testing phase, demonstrating exceptional accuracy and generalization capabilities. The NN_logistic_lbfgs model achieved R2 = 0.9999 (RMSE = 0.0292, MAE = 0.0215) in training and R2 = 0.9737 (RMSE = 2.1460, MAE = 1.7765) in testing, while gradient boosting reached R2 = 0.9997 (RMSE = 0.2370, MAE = 0.1878) in training and R2 = 0.9889 (RMSE = 1.5176, MAE = 1.2563) in testing, demonstrating strong accuracy and generalization. The NN_relu_lbfgs model achieved R2 = 0.9998 (RMSE = 0.0161, MAE = 0.0128) in training and R2 = 0.9728 (RMSE = 2.4332, MAE = 1.8011) in testing, demonstrating high accuracy in training and robust performance in testing. The findings underscore that nonlinear ML models, namely, NN_tanh_lbfgs, NN_logistic_lbfgs, gradient boosting, and NN_relu_lbfgs, exhibit superior predictive accuracy and robustness in forecasting the Fc of CM mix, significantly outperforming linear models in terms of both precision and performance. Models like random forest, NN_identity_lbfgs, decision tree, and linear regression showed good performance, but were outperformed by others with higher R2 and lower RMSE/MAE, while NN_tanh_sgd, NN_logistic_sgd, NN_relu_adam, and KNN exhibited significant testing performance drops. Random forest demonstrated good performance, with R2 = 0.9853 (RMSE = 2.2540, MAE = 1.7457) in training and R2 = 0.9742 (RMSE = 3.6311, MAE = 3.0649) in testing. Similarly, NN_identity_lbfgs showed good results, with R2 = 0.9458 (RMSE = 3.4445, MAE = 2.5479) in training and R2 = 0.9389 (RMSE = 3.4737, MAE = 2.5329) in testing. Decision tree (training: R2 = 0.9516, RMSE = 3.2564, MAE = 2.5564; testing: R2 = 0.8720, RMSE = 5.0196, MAE = 4.1672) and linear regression (training: R2 = 0.9458, RMSE = 3.4444, MAE = 2.5498; testing: R2 = 0.9361, RMSE = 3.4772, MAE = 2.5336) demonstrated satisfactory performance. However, these models were outperformed by others exhibiting higher R2 and lower RMSE/MAE values, indicating less optimal predictive accuracy.
Figure 5 presents the predicted results, highlighting the R2, RMSE, and MAE values for both the training and testing phases across various ML models. The top models, NN_tanh_lbfgs, NN_logistic_lbfgs, gradient boosting, and NN_relu_lbfgs, excelled with the highest R2 and lowest RMSE/MAE in both training and testing. In contrast, NN_tanh_sgd, NN_logistic_sgd, NN_relu_adam, and KNN showed significant performance drops in testing, highlighting their poor generalization performance despite good training results.
Figure 6 provides a comprehensive evaluation of model performance, with Section A illustrating the correlation between experimental and predicted Fc values, where the vertical and horizontal axes represent experimental and predicted values, respectively, while Section B visualizes the comparison of actual and predicted Fc values across data points for both training and testing phases. Figure 6 presents a comparative analysis of experimental and predicted Fc values for CM using various ML models, including decision tree, ridge regression, random forest, gradient boosting, KNN, lasso regression, linear regression, and multiple NN architectures such as NN_tanh_lbfgs, NN_tanh_sgd, NN_tanh_adam, NN_relu_lbfgs, NN_relu_sgd, NN_relu_adam, NN_logistic_lbfgs, NN_logistic_sgd, NN_logistic_adam, NN_identity_lbfgs, NN_identity_sgd, and NN_identity_adam. Strong alignment between the actual and predicted values indicates effective model generalization, while significant discrepancies highlight issues such as overfitting, underfitting, or suboptimal model selection, limiting its reliability for material property forecasting. The NN_tanh_lbfgs, NN_relu_lbfgs, gradient boosting, and NN_logistic_lbfgs models, particularly NN_tanh_lbfgs, exhibit exceptional predictive accuracy, with strong alignment between the experimental and predicted Fc values across both the testing and training phases. The NN_tanh_lbfgs model outperforms all others, achieving the highest accuracy with a training R2 of 0.9999 (RMSE = 0.0083, MAE = 0.0063) and testing R2 of 0.9946 (RMSE = 1.5032, MAE = 1.2545), demonstrating exceptional predictive accuracy and robustness, making it highly effective for real-world applications requiring precise predictions of the Fc of CM. In contrast, NN_tanh_sgd, NN_logistic_sgd, and KNN perform poorly, with NN_tanh_sgd achieving a training R2 of 0.8278 (RMSE = 8.2095, MAE = 7.0393) and testing R2 of 0.7877 (RMSE = 9.8173, MAE = 8.6113), indicating significant generalization issues and making them unsuitable for accurate material property predictions. The performance of NNs is greatly impacted by activation functions and optimizers, with models like NN_tanh_lbfgs and NN_logistic_lbfgs achieving superior accuracy, due to the efficient convergence of the tanh and logistic activations combined with the L-BFGS optimizer. Models like NN_tanh_sgd and NN_identity_sgd, with simpler activations and less efficient optimizers, underperformed, exhibiting higher discrepancies in R2, RMSE, and MAE, emphasizing the importance of optimized activation-function combinations for accurate Fc predictions. Hyperparameters, such as activation functions, optimizers, learning rate, and batch size, are pivotal in ML models as they govern convergence, weight updates, model adaptation, and training stability, thereby directly influencing the accuracy and reliability of Fc predictions.

Validation of the NN_tanh_lbfgs Model Performance

This study presents a rigorous comparative analysis of various linear and nonlinear supervised ML regression models for predicting the Fc of CM. The evaluated models comprise linear regression, ridge regression, lasso regression, decision trees, random forests, gradient boosting, k-nearest neighbors (KNN), and several neural network (NN) architectures. Each NN model was systematically tuned using distinct combinations of activation functions and optimization algorithms to enhance their predictive capability. Among these, the NN_tanh_lbfgs model—employing the hyperbolic tangent activation function and the limited-memory Broyden–Fletcher–Goldfarb–Shanno (LBFGS) optimizer—yielded the most accurate results. Specifically, it achieved near-perfect performance during training (R2 = 0.9999, RMSE = 0.0083, MAE = 0.0063) and demonstrated excellent generalization on the testing set (R2 = 0.9946, RMSE = 1.5032, MAE = 1.2545). These results underscore the model’s robustness and superior predictive performance relative to the other approaches considered in this study. To validate the effectiveness of the proposed NN_tanh_lbfgs model, its predictive performance was benchmarked against previously published models that had been identified as the most accurate in earlier studies [30,57]. As presented in Table 4, this comparison was conducted using the same dataset across all models to ensure consistency and fairness in evaluation. The previously published models were developed and tested using the identical experimental data, allowing for a direct and reliable assessment of the predictive capability and generalization performance of the proposed NN_tanh_lbfgs model relative to established approaches in the literature.
As depicted in Table 4, the proposed NN_tanh_lbfgs model demonstrates superior predictive performance compared to previously developed models. It achieved the highest accuracy, with an R2 of 0.9999 and RMSE of 0.0083 for training and an R2 of 0.9946 with an RMSE of 1.5032 for testing. In contrast, the best model from Jueyendah et al. [30] (SVM-RBF) attained a lower testing R2 of 0.9772 and a higher RMSE of 2.664, while other approaches, such as MLP, an RBF network, and GRNN, exhibited even weaker generalization. Similarly, although the ANN model by SA Emamian [52] yielded good training results (R2 = 0.9965), its testing RMSE of 3.558 was significantly higher, confirming the robustness and generalization capability of the NN_tanh_lbfgs model.

5. Conclusions

This section summarizes the conclusions from evaluating various ML models, including linear and tree-based methods, KNNs, and multiple neural network architectures with different optimizers and activation functions. Models were trained with input parameters (S/C, NS/C, W/C, MS/C, C, age, and porosity) to predict Fc and evaluated using RMSE, R2, and MAE. Higher R2 values indicate a better fit, while lower RMSE and MAE values reflect improved prediction accuracy.
The key outcomes of this study are as follows:
  • The findings reveal that nonlinear ML models significantly outperform linear models by capturing complex, nonlinear relationships within the dataset, thereby achieving superior generalization and enhanced prediction precision.
  • The NN_tanh_lbfgs model exhibits outstanding predictive performance, attaining near-perfect training metrics (R2 = 0.9999, RMSE = 0.0083, MAE = 0.0063) and maintaining excellent generalization on the testing dataset (R2 = 0.9946, RMSE = 1.5032, MAE = 1.2545), thereby underscoring its superior accuracy and robustness.
  • The NN_logistic_lbfgs, gradient boosting, and NN_relu_lbfgs models exhibit strong generalization and high accuracy, with minimal performance loss between training and testing, while NN_tanh_sgd and NN_logistic_sgd underperform due to suboptimal optimizer and activation function choices, resulting in poor generalization.
  • Key hyperparameters like the L-BFGS optimizer and activation functions (tanh, logistic, and ReLU) critically influence neural network accuracy and generalization, with advanced models such as gradient boosting and NN_tanh_lbfgs outperforming linear methods.
  • ML offers a more cost-effective, efficient, and scalable alternative to both traditional and experimental methods, significantly reducing time and resource usage in material testing.
  • Linear and nonlinear analyses show curing age and NS/C positively affect Fc, while porosity has the strongest negative impact, as further clarified by SHAP analysis.
This study shows the strong predictive performance of ML models, especially NN_tanh_lbfgs, when using key inputs. The study’s limitations include its small dataset and computational demands affecting generalizability and scalability. Future work will expand the datasets, apply transfer learning, simplify models, integrate real-time data, explore advanced deep learning, and address predictive uncertainty visualization.

Author Contributions

Conceptualization, S.J. and T.F.Ç.; methodology, S.J.; software, S.J.; validation, S.J. and Z.Y.; formal analysis, S.J.; investigation, T.D.; resources, S.J., Z.Y. and T.D.; data curation, S.J.; writing—original draft preparation, S.J., Z.Y. and T.D.; writing—review and editing, Z.Y., T.D. and T.F.Ç.; visualization, Z.Y., T.D. and T.F.Ç.; supervision, Z.Y. and T.F.Ç.; project administration, Z.Y. and T.F.Ç. All authors have read and agreed to the published version of the manuscript.

Funding

This research received no external funding.

Institutional Review Board Statement

Not applicable.

Informed Consent Statement

Not applicable.

Data Availability Statement

This dataset was originally published in Jueyendah et al. [30], ‘Predicting the Mechanical Properties of Cement Mortar Using the Support Vector Machine Approach,’ Construction and Building Materials, DOI: 10.1016/j.conbuildmat.2021.123396.

Acknowledgments

The authors have reviewed and edited the output and take full responsibility for the content of this publication.

Conflicts of Interest

Author Türker Fedai Çavuş was employed by the company Erkay Technology Development Services Co., Ltd., The remaining authors declare that the research was conducted in the absence of any commercial or financial relationships that could be construed as a potential conflict of interest.

References

  1. Li, H.; Xiao, H.-G.; Yuan, J.; Ou, J. Microstructure of cement mortar with nano-particles. Compos. Part B Eng. 2004, 35, 185–189. [Google Scholar] [CrossRef]
  2. Cho, Y.K.; Jung, S.H.; Choi, Y.C. Effects of chemical composition of fly ash on compressive strength of fly ash cement mortar. Constr. Build. Mater. 2019, 204, 255–264. [Google Scholar] [CrossRef]
  3. Brzozowski, P.; Horszczaruk, E.; Hrabiuk, K. The influence of natural and nano-additives on early strength of cement mortars. Procedia Eng. 2017, 172, 127–134. [Google Scholar] [CrossRef]
  4. Jasiczak, J.; Zielinski, K. Effect of protein additive on properties of mortar. Cem. Concr. Compos. 2006, 28, 451–457. [Google Scholar] [CrossRef]
  5. Khan, K.; Ullah, M.F.; Shahzada, K.; Amin, M.N.; Bibi, T.; Wahab, N.; Aljaafari, A. Effective use of micro-silica extracted from rice husk ash for the production of high-performance and sustainable cement mortar. Constr. Build. Mater. 2020, 258, 119589. [Google Scholar] [CrossRef]
  6. Zhang, B.; Tan, H.; Shen, W.; Xu, G.; Ma, B.; Ji, X. Nano-silica and silica fume modified cement mortar used as Surface Protection Material to enhance the impermeability. Cem. Concr. Compos. 2018, 92, 7–17. [Google Scholar] [CrossRef]
  7. Li, L.; Zhu, J.; Huang, Z.; Kwan, A.; Li, L. Combined effects of micro-silica and nano-silica on durability of mortar. Constr. Build. Mater. 2017, 157, 337–347. [Google Scholar] [CrossRef]
  8. Wang, X.; Dong, S.; Ashour, A.; Zhang, W.; Han, B. Effect and mechanisms of nanomaterials on interface between aggregates and cement mortars. Constr. Build. Mater. 2020, 240, 117942. [Google Scholar] [CrossRef]
  9. Kaplan, S.A. Factors affecting the relationship between rate of loading and measured compressive strength of concrete. Mag. Concr. Res. 1980, 32, 79–88. [Google Scholar] [CrossRef]
  10. Chen, X.; Wu, S.; Zhou, J. Influence of porosity on compressive and tensile strength of cement mortar. Constr. Build. Mater. 2013, 40, 869–874. [Google Scholar] [CrossRef]
  11. Jo, B.-W.; Kim, C.-H.; Tae, G.-H.; Park, J.-B. Characteristics of cement mortar with nano-SiO2 particles. Constr. Build. Mater. 2007, 21, 1351–1355. [Google Scholar] [CrossRef]
  12. Ltifi, M.; Guefrech, A.; Mounanga, P.; Khelidj, A. Experimental study of the effect of addition of nano-silica on the behaviour of cement mortars. Procedia Eng. 2011, 10, 900–905. [Google Scholar] [CrossRef]
  13. Oltulu, M.; Şahin, R. Energy and Buildings. Effect of nano-SiO2, nano-Al2O3 and nano-Fe2O3 powders on compressive strengths and capillary water absorption of cement mortar containing fly ash: A comparative study. Energy Build. 2013, 58, 292–301. [Google Scholar] [CrossRef]
  14. Qing, Y.; Zenan, Z.; Deyu, K.; Rongshen, C. Influence of nano-SiO2 addition on properties of hardened cement paste as compared with silica fume. Constr. Build. Mater. 2007, 21, 539–545. [Google Scholar] [CrossRef]
  15. Artelt, C.; Garcia, E. Impact of superplasticizer concentration and of ultra-fine particles on the rheological behaviour of dense mortar suspensions. Cem. Concr. Res. 2008, 38, 633–642. [Google Scholar] [CrossRef]
  16. Park, C.; Noh, M.; Park, T. Rheological properties of cementitious materials containing mineral admixtures. Cem. Concr. Res. 2005, 35, 842–849. [Google Scholar] [CrossRef]
  17. Ammar, M.M. The effect of nano-silica on the performance of Portland Cement Mortar. Master’s Thesis, American University in Cairo, Cairo Governorate, Egypt, 2013. [Google Scholar] [CrossRef]
  18. Sobuz, M.H.R.; Khatun, M.; Kabbo, M.K.I.; Sutan, N.M. An explainable machine learning model for encompassing the mechanical strength of polymer-modified concrete. Asian J. Civ. Eng. 2025, 26, 931–954. [Google Scholar] [CrossRef]
  19. Chaabene, W.B.; Flah, M.; Nehdi, M.L. Machine learning prediction of mechanical properties of concrete: Critical review. Constr. Build. Mater. 2020, 260, 119889. [Google Scholar] [CrossRef]
  20. Hosseinzadeh, M.; Dehestani, M.; Hosseinzadeh, A.J. Prediction of mechanical properties of recycled aggregate fly ash concrete employing machine learning algorithms. J. Build. Eng. 2023, 76, 107006. [Google Scholar] [CrossRef]
  21. Koya, B.P.; Aneja, S.; Gupta, R.; Valeo, C. Comparative analysis of different machine learning algorithms to predict mechanical properties of concrete. Mech. Adv. Mater. Struct. 2022, 29, 4032–4043. [Google Scholar] [CrossRef]
  22. Zhang, J.; Stang, H.; Li, V.C. Fatigue life prediction of fiber reinforced concrete under flexural load. Int. J. Fatigue 1999, 21, 1033–1049. [Google Scholar] [CrossRef]
  23. Xu, Y.; Liu, X.; Cao, X.; Huang, C.; Liu, E.; Qian, S.; Liu, X.; Wu, Y.; Dong, F.; Qiu, C.-W.; et al. Artificial intelligence: A powerful paradigm for scientific research. Innovation 2021, 2, 100179. [Google Scholar] [CrossRef] [PubMed]
  24. Kapoor, N.R.; Kumar, A.; Kumar, A.; Kumar, A.; Arora, H.C. Artificial intelligence in civil engineering: An immersive view. In Artificial Intelligence Applications for Sustainable Construction; Elsevier: Amsterdam, The Netherlands, 2024; pp. 1–74. [Google Scholar] [CrossRef]
  25. Poluektova, V.; Poluektov, M. Artificial Intelligence in Materials Science and Modern Concrete Technologies: Analysis of Possibilities and Prospects. Inorg. Mater. Appl. Res. 2024, 15, 1187–1198. [Google Scholar] [CrossRef]
  26. Kaveh, A. Applications of Artificial Neural Networks and Machine Learning in Civil Engineering; Springer: Cham, Switzerland, 2024. [Google Scholar]
  27. Mei, L.; Wang, Q. Structural optimization in civil engineering: A literature review. Buildings 2021, 11, 66. [Google Scholar] [CrossRef]
  28. Azad, M.M.; Kim, H.S. Noise robust damage detection of laminated composites using multichannel wavelet-enhanced deep learning model. Eng. Struct. 2025, 322, 119192. [Google Scholar] [CrossRef]
  29. Kongala, S.G.R. Explainable Structural Health Monitoring (SHM) for Damage Classification Based on Vibration. Master’s Thesis, University of Twente, Enschede, The Netherlands, 2024. [Google Scholar]
  30. Jueyendah, S.; Lezgy-Nazargah, M.; Eskandari-Naddaf, H.; Emamian, S. Predicting the mechanical properties of cement mortar using the support vector machine approach. Constr. Build. Mater. 2021, 291, 123396. [Google Scholar] [CrossRef]
  31. Jueyendah, S.; Martins, C.H. Optimal Design of Welded Structure Using SVM. Computational Engineering and Physical Modeling. Comput. Eng. Phys. Model. 2024, 7, 84–107. [Google Scholar] [CrossRef]
  32. Amin, M.N.; Alkadhim, H.A.; Ahmad, W.; Khan, K.; Alabduljabbar, H.; Mohamed, A. Experimental and machine learning approaches to investigate the effect of waste glass powder on the flexural strength of cement mortar. PLoS ONE 2023, 18, e0280761. [Google Scholar] [CrossRef]
  33. Alahmari, T.S.; Ashraf, J.; Sobuz, M.H.R.; Uddin, M.A. Predicting the compressive strength of fiber-reinforced self-consolidating concrete using a hybrid machine learning approach. Innov. Infrastruct. Solut. 2024, 9, 446. [Google Scholar] [CrossRef]
  34. Jamal, A.S.; Ahmed, A.N. Estimating compressive strength of high-performance concrete using different machine learning approaches. Alex. Eng. J. 2025, 114, 256–265. [Google Scholar] [CrossRef]
  35. Nguyen, M.H.; Ly, H.-B. Development of machine learning methods to predict the compressive strength of fiber-reinforced self-compacting concrete and sensitivity analysis. Constr. Build. Mater. 2023, 367, 130339. [Google Scholar] [CrossRef]
  36. Shafighfard, T.; Kazemi, F.; Bagherzadeh, F.; Mieloszyk, M.; Yoo, D.Y. Chained machine learning model for predicting load capacity and ductility of steel fiber–reinforced concrete beams. Comput.-Aided Civ. Infrastruct. Eng. 2024, 39, 3573–3594. [Google Scholar] [CrossRef]
  37. Jain, D.; Bhadauria, S.S.; Kushwah, S.S. Analysis and prediction of plastic waste composite construction material properties using machine learning techniques. Environ. Prog. Sustain. Energy 2023, 42, e14094. [Google Scholar] [CrossRef]
  38. Guan, Q.T.; Tong, Z.L.; Amin, M.N.; Iftikhar, B.; Qadir, M.T.; Khan, K. Analyzing the efficacy of waste marble and glass powder for the compressive strength of self-compacting concrete using machine learning strategies. Rev. Adv. Mater. Sci. 2024, 63, 20240043. [Google Scholar] [CrossRef]
  39. Fei, Z.; Liang, S.; Cai, Y.; Shen, Y. Ensemble machine-learning-based prediction models for the compressive strength of recycled powder mortar. Materials 2023, 16, 583. [Google Scholar] [CrossRef] [PubMed]
  40. Wang, H.; Ding, Y.; Kong, Y.; Sun, D.; Shi, Y.; Cai, X. Predicting the Compressive Strength of Sustainable Portland Cement–Fly Ash Mortar Using Explainable Boosting Machine Learning Techniques. Materials 2024, 17, 4744. [Google Scholar] [CrossRef] [PubMed]
  41. Aamir, H.; Aamir, K.; Javed, M.F. Linear and Non-Linear Regression Analysis on the Prediction of Compressive Strength of Sodium Hydroxide Pre-Treated Crumb Rubber Concrete. Eng. Proc. 2023, 44, 5. [Google Scholar] [CrossRef]
  42. Kovačević, M.; Hadzima-Nyarko, M.; Grubeša, I.N.; Radu, D.; Lozančić, S. Application of artificial intelligence methods for predicting the compressive strength of green concretes with rice husk ash. Mathematics 2023, 12, 66. [Google Scholar] [CrossRef]
  43. Bin, F.; Hosseini, S.; Chen, J.; Samui, P.; Fattahi, H.; Jahed Armaghani, D. Proposing optimized random forest models for predicting compressive strength of geopolymer composites. Infrastructures 2024, 9, 181. [Google Scholar] [CrossRef]
  44. Maulud, D.; Abdulazeez, A.M. A review on linear regression comprehensive in machine learning. J. Appl. Sci. Technol. Trends 2020, 1, 140–147. [Google Scholar] [CrossRef]
  45. Sinnakaudan, S.; Ghani, A.A.; Ahmad, M.; Zakaria, N. Multiple linear regression model for total bed material load prediction. J. Hydraul. Eng. 2006, 132, 521–528. [Google Scholar] [CrossRef]
  46. Esmaeili, B.; Hallowell, M.R.; Rajagopalan, B. Attribute-based safety risk assessment. II: Predicting safety outcomes using generalized linear models. J. Constr. Eng. Manag. 2015, 141, 04015022. [Google Scholar] [CrossRef]
  47. Myers, R.H.; Montgomery, D.C.; Vining, G.G.; Robinson, T.J. Generalized Linear Models: With Applications in Engineering and the Sciences; John Wiley & Sons: Hoboken, NJ, USA, 2012. [Google Scholar]
  48. Kouvaritakis, B.; Cannon, M. Non-Linear Predictive Control: Theory and Practice; IET: Hertfordshire, UK, 2001. [Google Scholar] [CrossRef]
  49. Clark, L.A.; Pregibon, D. Tree-based models. In Statistical Models in S; Routledge: Oxfordshire, UK, 2017; pp. 377–419. [Google Scholar]
  50. Natekin, A.; Knoll, A. Gradient boosting machines, a tutorial. Front. Neurorobot. 2013, 7, 21. [Google Scholar] [CrossRef] [PubMed]
  51. Kramer, O.; Kramer, O. K-Nearest Neighbors. Dimensionality Reduction with Unsupervised Nearest Neighbors; Springer: Berlin/Heidelberg, Germany, 2013; pp. 13–23. [Google Scholar] [CrossRef]
  52. Rhodes, C.; Morari, M. The false nearest neighbors algorithm: An overview. Comput. Chem. Eng. 1997, 21, S1149–S1154. [Google Scholar] [CrossRef]
  53. Deepa, C.; Sathiya Kumari, K.; Pream Sudha, V. A tree based model for high performance concrete mix design. Int. J. Eng. Sci. Technol. 2010, 2, 4640–4646. [Google Scholar]
  54. Dabiri, H.; Farhangi, V.; Moradi, M.J.; Zadehmohamad, M.; Karakouzian, M. Applications of decision tree and random forest as tree-based machine learning techniques for analyzing the ultimate strain of spliced and non-spliced reinforcement bars. Appl. Sci. 2022, 12, 4851. [Google Scholar] [CrossRef]
  55. Alzubi, Y.; Alqawasmeh, H.; Al-Kharabsheh, B.; Abed, D. Applications of nearest neighbor search algorithm toward efficient rubber-based solid waste management in concrete. Civ. Eng. J. 2022, 8, 695–709. [Google Scholar] [CrossRef]
  56. Adeli, H. Neural networks in civil engineering: 1989–2000. Comput.-Aided Civ. Infrastruct. Eng. 2001, 16, 126–142. [Google Scholar] [CrossRef]
  57. Emamian, S.A.; Eskandari-Naddaf, H. Effect of porosity on predicting compressive and flexural strength of cement mortar containing micro and nano-silica by ANN and GEP. Constr. Build. Mater. 2019, 218, 8–27. [Google Scholar] [CrossRef]
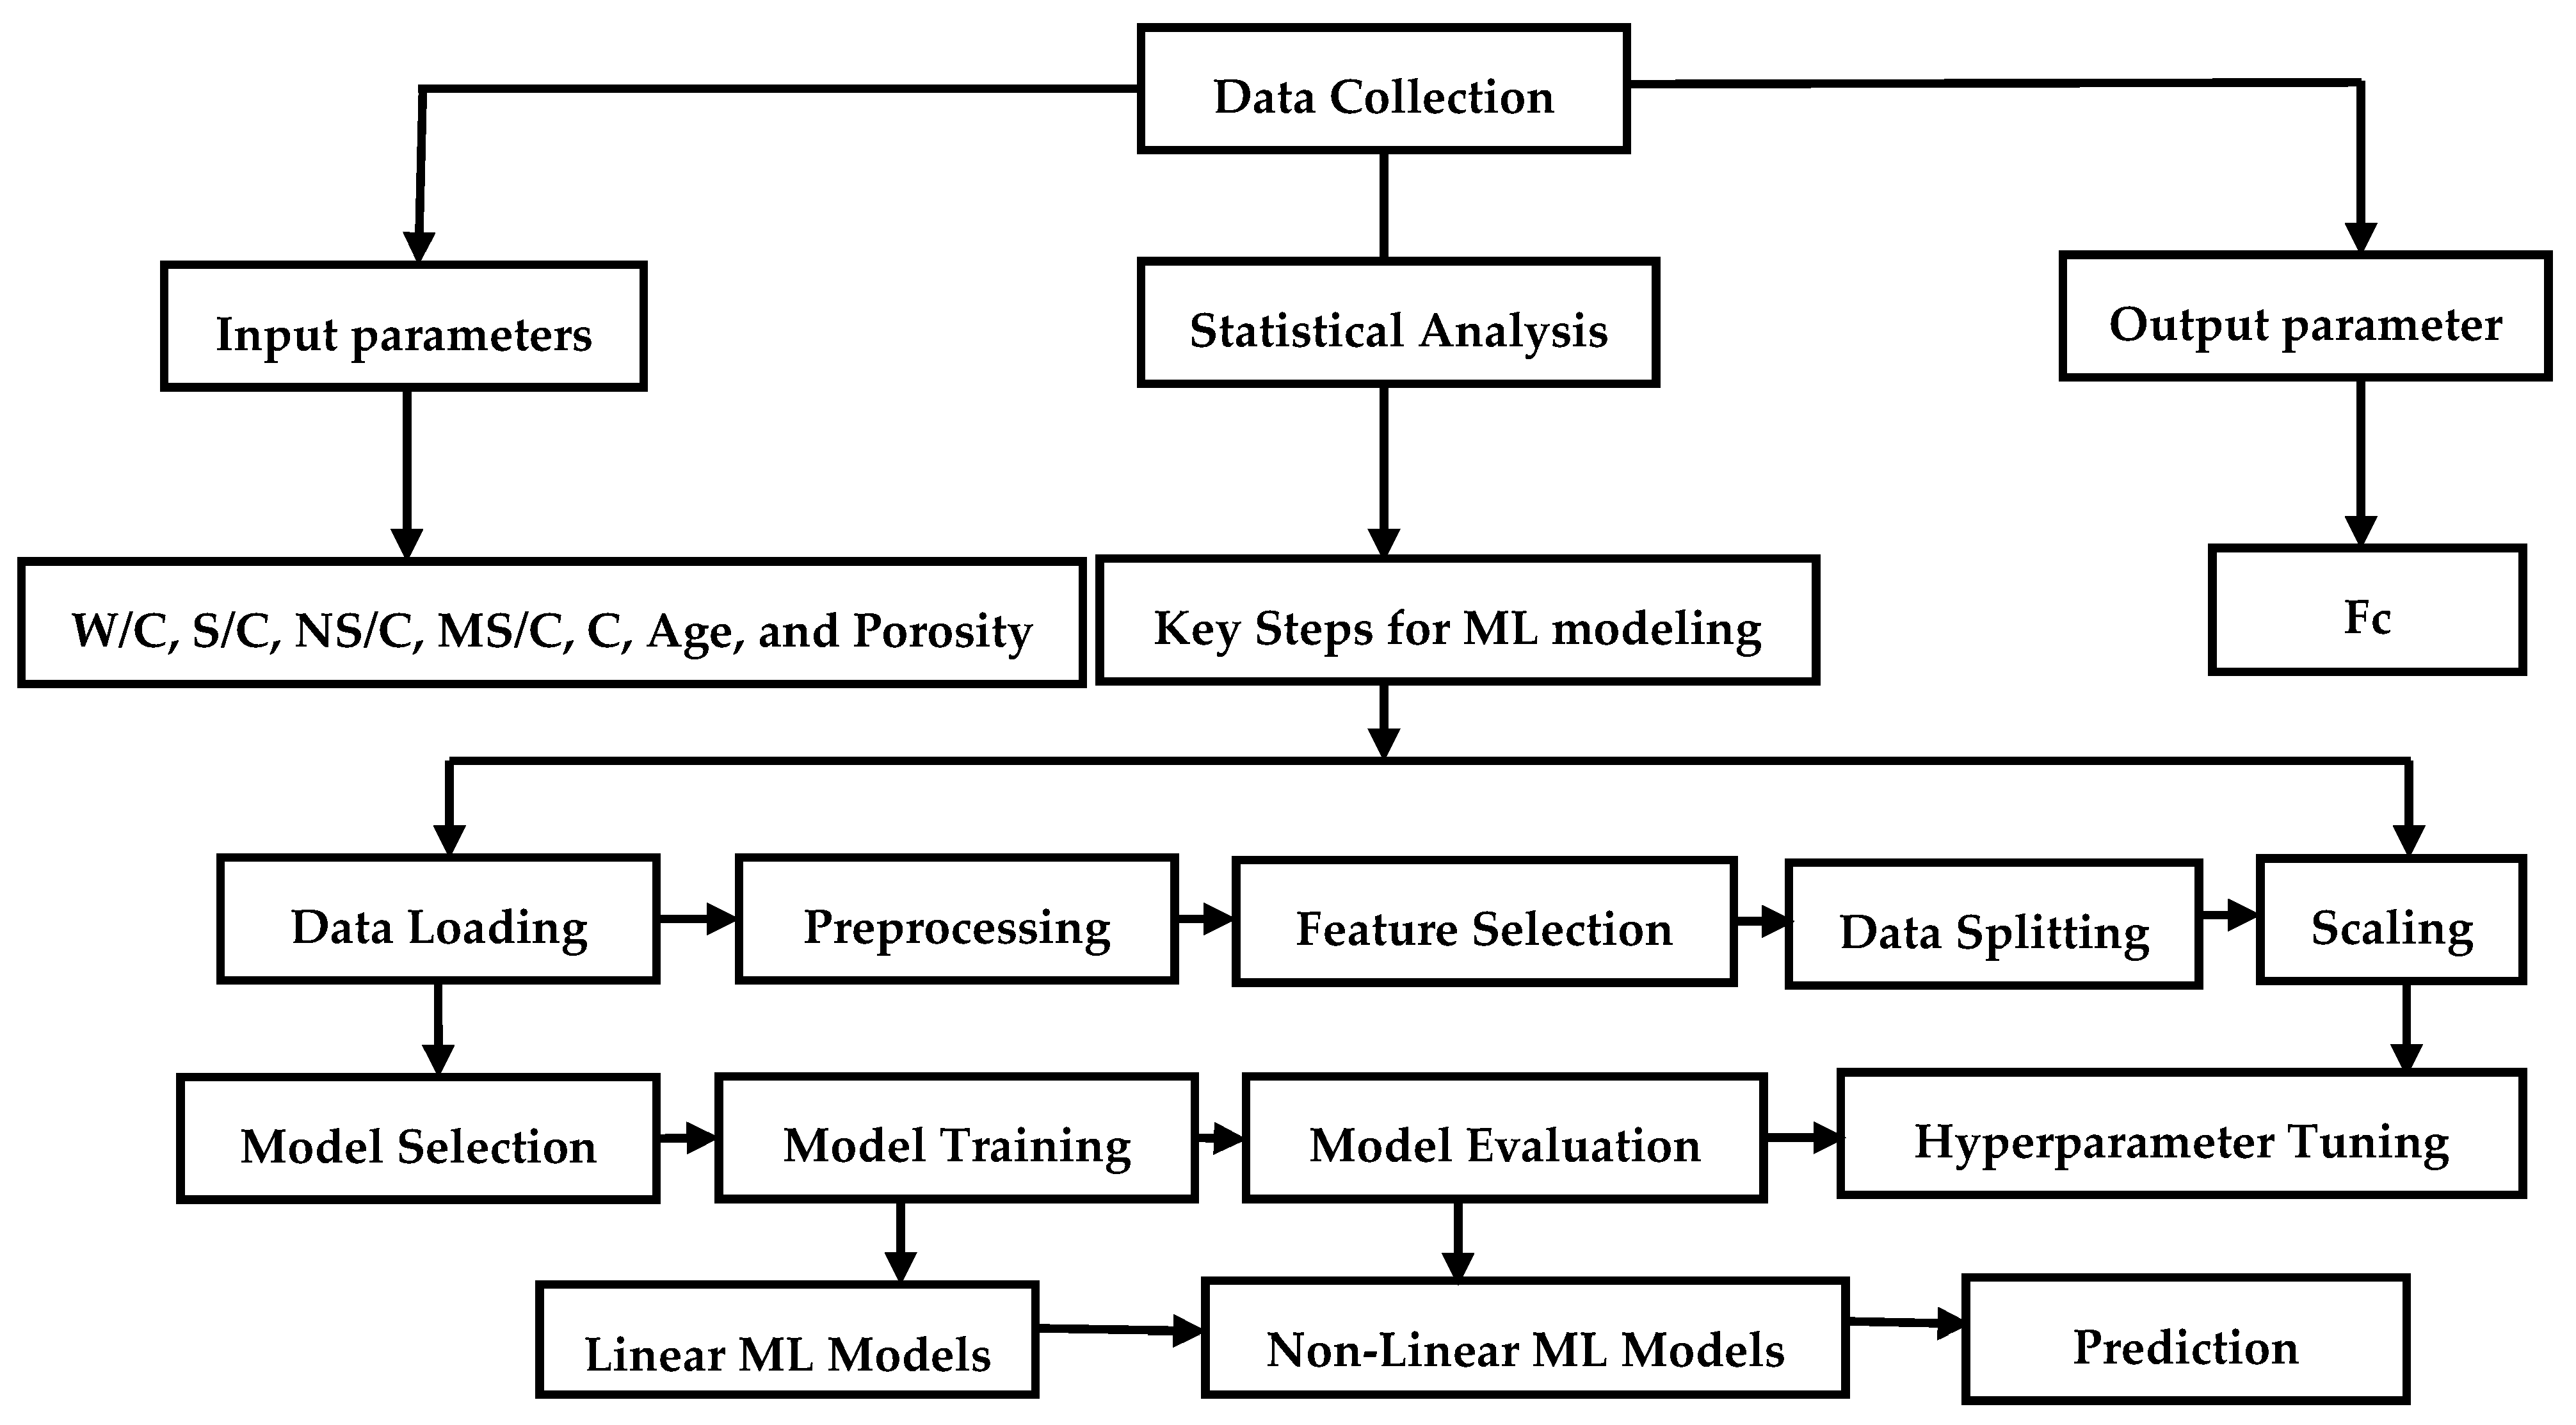
Figure 1. Methodology of the present study.
Buildings 15 02932 g001
Figure 2. Correlation matrix representing the relationships between input variables and Fc.
Buildings 15 02932 g002
Figure 3. SHAP analysis of the input and output parameters.
Buildings 15 02932 g003
Figure 4. Frequency distribution of input and output parameters.
Buildings 15 02932 g004
Figure 5. (a) R2, (b) RMSE, (c) MAE, and (d) general results for predicting Fc using different ML models.
Buildings 15 02932 g005aBuildings 15 02932 g005b
Figure 6. Comparison between experimental and predicted Fc values from various ML models.
Buildings 15 02932 g006aBuildings 15 02932 g006bBuildings 15 02932 g006cBuildings 15 02932 g006d
Table 1. Input and output parameters used in the statistical analysis.
VariableMinimumMaximumMeanStd. Dev.
W/C (%)0.4000.6040.4940.062
S/C (%)2.6673.2222.9270.166
NS/C (%)0.0000.0510.0230.018
MS/C (%)0.0000.1570.0740.058
C (grams)993.3001200.0001096.72562.037
Age (day)3.00028.00014.6009.091
Porosity (%)4.00020.00010.4563.160
Fc (MPa)18.00085.00054.82314.648
Table 2. Hyperparameters of the linear, tree-based, KNN, and neural network models.
ModelHyperparameter
Linear Regressionfit intercept = TRUE
Ridge Regressionfit intercept = TRUE, Solver = auto, alpha = 1.0
Lasso Regressionfit intercept = TRUE, alpha = 0.1, max_iter = 1000, selection = cyclic
Decision Treemax_depth = 5, min_samples_split = 2, min_samples_leaf = 4, criterion = squared error, random state = 42
Random Forestn_estimators = 100, min_samples_split = 4, max_depth = 10, min_samples_leaf = 2, max_features = sqrt, random state = 42, bootstrap = True
Gradient Boostingn_estimators = 300, learning_rate = 0.115, max_depth = 3, min_samples_split = 2, random state = 42, subsample = 0.8,
KNNn_neighbors = 5, metric = Mankowski, p = 2, leaf size = 30
NN_relu_adamNN_model = MLP Regressor
hidden_layer_sizes
(50,)
max_iter = 10000
alpha = 0.01
learning_rate_init = 0.0005
validation fraction = 0.2
n_iter_no_change = 10
random state = 42
activation
(relu)
solver = adam
solver = sgd
solver = lbfgs
NN_relu_sgd
NN_relu_lbfgs
NN_tanh_adamactivation
(tanh)
solver = adam
solver = sgd
solver = lbfgs
NN_tanh_sgd
NN_tanh_lbfgs
NN_logistic_adamactivation
(logistic)
solver = adam
solver = sgd
solver = lbfgs
NN_logistic_sgd
NN_logistic_lbfgs
NN_identity_adamactivation
(identity)
solver = adam
solver = sgd
solver = lbfgs
NN_identity_sgd
NN_identity_lbfgs
Table 3. Results of various linear and non-linear ML models for predicting the Fc.
ModelTrainingTesting
R2RMSEMAER2RMSEMAE
Linear Regression0.94583.44442.54980.93613.47722.5336
Ridge Regression0.92833.96313.11180.92523.83962.9846
Lasso Regression0.92274.11433.26870.91654.01913.1724
Decision Tree0.95163.25642.55640.87205.01964.1672
Random Forest0.98532.25401.74570.97423.63113.0649
Gradient Boosting0.99970.23700.18780.98891.51761.2563
KNN0.93433.79022.94630.83035.68284.4394
NN_relu_adam0.8914.91263.84370.86165.32294.4137
NN_relu_sgd0.93033.91133.04070.92923.61762.7816
NN_relu_lbfgs0.99980.01610.01280.97282.43321.8011
NN_tanh_adam0.91964.71763.27970.91933.99133.1923
NN_tanh_sgd0.82788.20957.03930.78779.81738.6113
NN_tanh_lbfgs0.99990.00830.00630.99461.50321.2545
NN_logistic_adam0.88835.67884.08140.87454.93203.8481
NN_logistic_sgd0.88977.17996.02620.86738.82477.3645
NN_logistic_lbfgs0.99990.02920.02150.97372.14601.7765
NN_identity_adam0.93284.05343.09600.92553.29702.6260
NN_identity_sgd0.91864.31133.50190.90994.47973.5332
NN_identity_lbfgs0.94583.44452.54790.93893.47372.5329
Table 4. Comparison of R2 and RMSE values between the current study and previous studies.
Data SetMethodTrainingTesting
R2RMSER2RMSE
Current studyNN_tanh_lbfgs0.99990.00830.99461.5032
Jueyendah et al. [30]SVM-RBF0.99871.2970.97722.664
MLP0.97332.3500.96213.327
RBF Network0.97722.1720.9473.800
GRNN0.98082.4310.91984.830
SA Emamian [52]ANN0.99650.8620.94673.558
GEP0.96012.9670.94293.386
Disclaimer/Publisher’s Note: The statements, opinions and data contained in all publications are solely those of the individual author(s) and contributor(s) and not of MDPI and/or the editor(s). MDPI and/or the editor(s) disclaim responsibility for any injury to people or property resulting from any ideas, methods, instructions or products referred to in the content.