Abstract
Evaluating the restoration quality of university outdoor spaces is often constrained by subjective surveys and manual assessment, limiting scalability and objectivity. This study addresses this gap by applying explainable machine learning to predict restorative quality from campus imagery, enabling large-scale, data-driven evaluation and capturing complex nonlinear relationships that traditional methods may overlook. Using Fujian Agriculture and Forestry University as a case study, this study extracted road network data, generated 297 coordinates at 50-m intervals, and collected 1197 images. Surveys were conducted to obtain restorative quality scores. The Mask2Former model was used to extract landscape features, and decision tree algorithms (RF, XGBoost, GBR) were selected based on MAE, MSE, and EVS metrics. The combination of optimal algorithms and SHAP was employed to predict restoration quality and identify key features. This research also used a multivariate linear regression model to identify features with significant statistical impact but lower features importance ranking. Finally, the study also analyzed heterogeneity in scores for three restoration indicators and five campus zones using k-means clustering. Empirical results show that natural elements like vegetation and water positively affect psychological perception, while structural components like walls and fences have negative or nonlinear effects. On this basis, this study proposes spatial optimization strategies for different campus areas, offering a foundation for creating high-quality outdoor environments with restorative and social functions.
1. Introduction
University campuses, as the physical carriers of higher education, bear the core mission of knowledge dissemination, value guidance, and character development. Their environmental attributes profoundly shape students’ cognitive development, social behavior, and cultural identity [1]. A growing body of empirical research reveals that campus outdoor spaces, which include dynamic networks connecting the built environment, such as street systems, blue-green infrastructure, and multifunctional areas, hold substantial restorative potential [2,3]. These spaces can effectively alleviate academic stress, social anxiety, and psychological fatigue commonly experienced by university students [4]. Beyond serving as everyday settings for commuting, informal interactions, and contemplation, campus outdoor spaces function as essential containers of public life, carrying symbolic cultural significance that transcends their utilitarian roles. Moreover, the efficacy of outdoor spaces arises from the complex interplay between their physical attributes (e.g., vegetation coverage, facility layout) and user characteristics (e.g., behavioral patterns, psychological expectations) [5,6,7,8]. This systemic “people–scene–activity” relationship makes optimizing outdoor space experiences a key strategy for enhancing the overall quality of university education. Quantifying the coupling mechanisms between campus spatial features and students’ multidimensional perceptions and identifying the psychological effects of natural elements embedded in outdoor environments can provide a robust empirical foundation for campus design.
While existing literature has begun to uncover the positive psychological effects of campus outdoor spaces, several notable gaps remain in current research perspectives [9,10,11,12,13]. First, many studies are based on universities with generalized academic profiles, failing to examine the unique spatial-psychological interaction patterns demanded by students from discipline-specific institutions. Second, methodological limitations persist. Traditional approaches often struggle to capture the nonlinear and dynamic associations between the complex visual features of campus environments and students’ multidimensional perceptions. They are also insufficient for identifying threshold effects and changes in the influence strength of specific visual features. Third, previous studies have largely overlooked the spatial drivers underlying both high and low psychological ratings and have paid little attention to the internal functional heterogeneity of campus outdoor spaces. Consequently, the differentiated psychological impacts of functional zones, such as academic areas, core leisure spaces, and sports facilities, have not yet been systematically explored. These research limitations hinder the development of tailored and adaptive landscape planning practices for specific types of university campuses.
Conventional approaches to evaluating campus outdoor spaces rely heavily on small-scale, subjective surveys and manual observations, limiting scalability and overlooking complex nonlinear relationships between environmental features and psychological outcomes. This study applied machine learning (ML) to overcome these limitations, leveraging its ability to process large volumes of visual data, detect hidden patterns, and provide interpretable results through SHAP (Shapley additive explanations), thereby supporting both accurate prediction and actionable design insights. Focusing on a forestry university in China, we integrated Mask2Former-based image semantic segmentation, SHAP-based interpretable decision trees, and multivariate linear regression to examine how spatial features influence students’ emotional uplift, social interaction, and psychological restoration. Landscape features were extracted from campus images, and survey-based psychological scores were collected. Decision tree models (RF, XGBoost, GBR) combined with SHAP identified key features and threshold effects, while regression analysis detected statistically significant but lower-salience elements. Psychological scores were then categorized into high, medium, and low groups, and k-means clustering was used to define functional zones, enabling the analysis of heterogeneous effects across campus areas.
This study integrated multiple methods to support the optimization of campus landscapes in forestry universities, tailored to students’ psychological and social well-being. First, the geographic coordinates of selected campus locations were manually collected, and original landscape images were obtained via web-crawling techniques. The advanced Mask2former model was then used to extract semantic features from the images. Unlike previous studies that focused solely on building high-accuracy prediction models for psychological outcomes, our approach innovatively combines SHAP-based interpretable decision tree methods with multivariate linear regression analysis. While the former identifies the most influential semantic features, the latter uncovers additional variables with significant psychological impacts that machine learning models may have omitted. Our focus was not merely on prediction accuracy, but on understanding the role of critical landscape features in shaping students’ psychological experiences.
Furthermore, the complementary use of SHAP-based decision trees and multivariate regression enhances analytical robustness. While interpretable decision trees can highlight key visual elements associated with the students’ psychological outcomes, they often prioritize visually prominent features and may ignore subtler yet impactful landscape components. Multivariate linear regression compensates for this limitation by statistically identifying additional features with significant psychological relevance.
Our analytical perspective is also more comprehensive. Compared with single-dimensional measures of restoration, the selected psychological indicators, including emotional uplift (reflecting positive and negative affect), social interaction (indicating campus social networks), and psychological restoration (representing recovery from stress and fatigue), collectively offer a holistic view of the students’ mental health. The heterogeneity analyses in this study contribute novel insights by identifying both positively and negatively associated landscape features across different score groups. Additionally, the functional zone-based clustering approach provides further guidance for spatial optimization strategies tailored to forestry universities.
In summary, this study offers empirical evidence to support the refined design of campus outdoor spaces in forestry universities. It breaks through the limitations of homogenized planning, reinforces the educational function of the environment, and provides both theoretical and practical references for building sustainable campuses that integrate pedagogical, ecological, and health objectives.
The remainder of this paper is structured as follows. Section 2 reviews relevant literature and theoretical foundations; Section 3 outlines the research framework; Section 4 presents the empirical results on how campus landscape features influence three psychological dimensions; Section 5 discusses the findings; and Section 6 concludes with key implications for campus design and future research directions.
2. Literature Review and Theory
2.1. Literature Review
2.1.1. Campus Outdoor Spaces and Student Mental Health
Campus outdoor spaces are composed of both fixed and semi-fixed elements and are widely recognized as key determinants of campus life quality [5]. Studies have shown that well-designed spatial environments can encourage students to linger and engage in social interaction, thereby enhancing their quality of life and mental well-being [1,14]. The environmental attributes of outdoor spaces are closely associated with the students’ sense of satisfaction, well-being, and creativity [15,16].
Among these spaces, green areas offer distinct advantages in addressing common mental health challenges faced by students, such as alleviating academic stress and improving sleep quality [17], while also enhancing the campus’s overall restorative potential [3,4,18]. In forestry universities, the diversity of green spaces not only meets the heterogeneous needs of students, but also strengthens ecological awareness and practical engagement. A diverse layout of green infrastructure facilitates the integration of educational, psychological, and cultural functions on campus [19]. Existing research has preliminarily confirmed the positive effects of plant systems on the students’ psychological performance [3,20,21].
2.1.2. Assessing the Restorative Quality of Campus Spaces Using Street View Images
Quantifying the built environment of campuses alongside public perception is essential for improving the quality of street spaces. As a critical component of the campus environment, the assessment of street quality involves not only physical attributes, but also human perception [22]. Vision, as the dominant sensory modality, has been widely employed in evaluating street landscapes [23,24]. Consequently, many studies have advocated for analyzing street space quality from the perspective of visual perception.
In recent years, an increasing number of studies have applied street view imagery to evaluate spatial perception within campus environments. For instance, Meng et al. (2023) explored the relationship between visual aesthetics and physical elements in street views [25]. Qin et al. (2025) assessed the perceived quality and spatial distribution of campus walkability [26]. Ma et al. (2023) integrated street view images with the PRS-11 scale to develop a high-resolution predictive model of restorative quality [27]. Wu et al. (2025), using image-extracted features, constructed a framework for evaluating restorative benefits, identified areas for spatial optimization, and proposed corresponding improvement strategies [28].
2.1.3. Application of Image Semantic Segmentation in Landscape Feature Extraction
Deep learning has been widely applied in the fields of image segmentation and spatial perception, significantly improving the accuracy and efficiency of image interpretation [29]. It has demonstrated notable effectiveness in studies of subjective perception in urban environments [30]. Semantic segmentation techniques enable the precise delineation of urban landscape elements through pixel-level classification, leveraging neural networks to enhance feature extraction capabilities [31]. The application of this technique in landscape feature quantification has become increasingly prevalent. For example, Garré et al. (2009) employed semantic segmentation on street view images to quantify indicators such as field of view and sky visibility [32]. Xia et al. (2021) developed a sky visibility assessment method based on DeepLabV3+ [33]. Moreover, Li et al. (2023) combined UAV data with deep learning to extract multidimensional features including color, texture, and geometry [34].
However, existing studies have tended to focus primarily on either physical attributes or a single dimension of subjective perception, lacking a comprehensive analysis of multidimensional psychological indicators such as psychological restoration, emotional uplift, and social interaction. Moreover, current models often overlook visually inconspicuous elements that may nonetheless have significant psychological effects, thereby limiting the comprehensiveness of landscape evaluation.
2.2. Theoretical Framework
In recent years, the advancement of environmental psychology and cognitive behavioral science has brought increasing scholarly attention to the psychological impacts of campus spatial environments, positioning this topic as a critical intersection of urban planning, public health, and higher education research [35,36]. Natural elements and spatial configurations play essential roles in emotion regulation, attentional restoration, and social facilitation [37,38]. Building on classical theories, this study proposes three core psychological indicators: psychological restoration, emotional uplift, and social interaction, and constructs an evaluation framework to assess the effects of outdoor campus spaces. Figure 1 illustrates the theoretical foundations underlying the three psychological indicators.
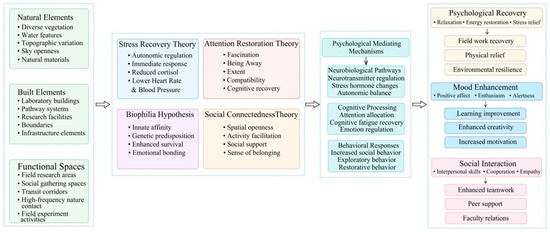
Figure 1.
The theoretical foundations of this study.
The psychological restoration dimension is grounded in stress recovery theory (SRT), which posits that natural environments can reduce physiological arousal, regulate emotions, and alleviate psychological stress [38,39]. Students at forestry universities often face high cognitive loads due to demanding academic tasks and thus rely more heavily on natural settings as psychological recovery resources. Their sensitivity to restorative environmental features is correspondingly heightened [40,41].
The emotional uplift dimension is based on attention restoration theory (ART), which emphasizes the roles of “soft fascination” and “extent” in natural environments in replenishing attentional capacity, enhancing emotional states, and improving cognitive performance [37]. Studies have shown that even brief exposure to natural scenes can significantly enhance positive emotions and cognitive function [42]. Highly green and open spaces, in particular, are effective in supporting emotional recovery and relieving mental fatigue [43]. For students in forestry universities, the need for emotional regulation tends to be continuous and is especially susceptible to environmental influences.
The social interaction dimension integrates the biophilia hypothesis and social cohesion theory, highlighting how natural elements such as vegetation and water bodies can evoke feelings of safety and foster social connectedness [44,45]. Additionally, spatial openness and accessibility have a substantial influence on the frequency and quality of social interactions. Well-designed natural open spaces can facilitate communication between faculty and students, encourage peer engagement, and strengthen feelings of social belonging and support [36,46]. Evidence also suggests that group activities in natural environments enhance the students’ teamwork skills and social adaptability [47]. This dimension is particularly salient for students in forestry universities, who frequently engage with nature and demonstrate strong social needs.
Collectively, these three psychological dimensions not only reveal the differentiated spatial-psychological needs of forestry university students, but also provide a robust theoretical foundation for designing targeted interventions in campus outdoor spaces.
3. Materials and Methods
This study utilized campus street view images retrieved from Baidu Maps and applied a Mask2former-based image semantic segmentation method to extract landscape features. Simultaneously, a questionnaire survey was conducted to obtain student scores on three psychological indicators: psychological restoration, emotional uplift, and social interaction. Subsequently, a decision tree algorithm integrated with the SHAP (Shapley additive explanations) mechanism was employed to identify key landscape features significantly influencing each psychological outcome and analyze their influence patterns and threshold effects.
Next, multivariate linear regression was used to uncover additional landscape features that contained limited semantic information and were potentially overlooked by interpretable machine learning models, assessing their statistical significance regarding student well-being. Finally, a heterogeneity analysis was performed by grouping participants based on high, medium, and low scores for the three psychological indicators and by applying k-means clustering to delineate functional zones within the campus. Figure 2 presents the technical framework of this study. The main research steps are detailed in Section 3.1.
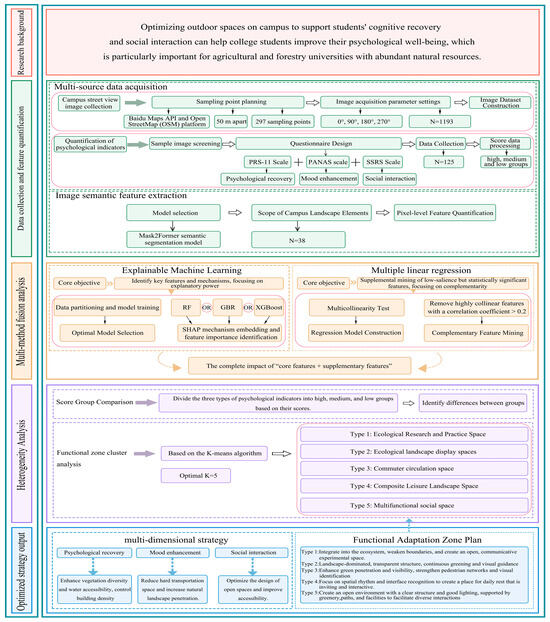
Figure 2.
The technical framework of the study.
3.1. Data Collection and Feature Quantification
- Collection of campus street view images
Fujian Agriculture and Forestry University (FAFU), a provincially key university founded in 1936, served as the research site for this study. Its geographic coordinates can be found at https://www.openstreetmap.org/#map=16/26.08711/119.23287 (accessed on 18 July 2025). The campus spans over 2560 mu (approximately 170 hectares) and is functionally divided into five main zones: teaching, residential life, sports, faculty housing, and supporting facilities. Geographically situated between the Youxi Bridge and the Min River, the campus benefits from favorable natural and transportation conditions. Notable landscape features include the Wetland Park, the China National Botanical Garden (Fujian branch), and Guanyin Lake.
Street view images from a human-eye perspective were collected using the Baidu Maps API and OpenStreetMap (OSM). Road network data were first extracted from OSM, and a total of 297 sampling points were generated in ArcGIS at 50-m intervals. The geographic coordinates (latitude and longitude) of each point were recorded. At each sampling point, four street view images were captured facing four cardinal directions (0°, 90°, 180°, and 270°) with a pitch angle of 0°, resulting in a total of 1193 images. These images provide near-complete 360° visual coverage for each point, forming a robust dataset for subsequent semantic segmentation and psychological modeling. The process of street view data acquisition is illustrated in Figure 3.
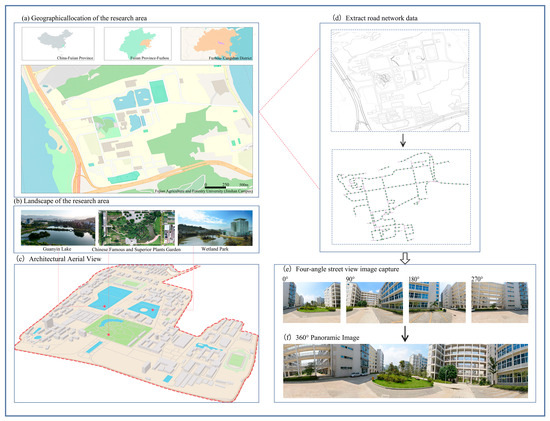
Figure 3.
The area location analysis and street view data collection.
- Quantification of psychological indicators
To obtain perceptual scores for the street view images across three psychological dimensions, a subjective evaluation questionnaire was developed based on three validated scales: the Perceived Restorativeness Scale (PRS-11) [48], the Positive and Negative Affect Schedule (PANAS) [49], and the Social Support Rating Scale (SSRS) [50]. An online image rating experiment was conducted accordingly. Given that this study focused on visual perception rather than traditional self-report surveys, we adapted the original scale structures by selecting 3–4 representative semantic items from each instrument. Table 1 presents examples of the semantic judgment statements that were rephrased for image-based evaluation.

Table 1.
The rating statements and scoring criteria for the three psychological indicators in the Image-Based Semantic Perception Questionnaire.
Using stratified random sampling, a subset of 200 representative images was selected from the Jinshan campus street view image library of Fujian Agriculture and Forestry University. A total of 125 undergraduate students (63 females and 62 males), aged between 20 and 25, were recruited to participate in the rating task. Each image received approximately 50 independent evaluations. Participants rated each image on the three psychological indicators using a 7-point Likert scale (1 = strongly disagree, 7 = strongly agree), based on the presented semantic judgment statements. This study ensures that the image-based ratings reflect the on-site experience as accurately as possible from two aspects. First, almost all participants had visited the locations shown in the photos and were very familiar with the campus environment. Second, following the principles of environmental psychology, the street-view images were captured at eye level and under consistent lighting and weather conditions, minimizing external variations and enhancing the ecological validity of the ratings.
The final score for each image was calculated as the average rating across all participants. Based on these scores, the images were categorized into three groups: high, medium, and low for each psychological dimension including psychological restoration, emotional uplift, and social interaction. These grouped scores served as the foundation for subsequent modeling and stratified analysis.
- Extraction of semantic features from images
Street view imagery, with its rich visual content and extensive spatial coverage, serves as a vital data source for perceiving and analyzing spatial environments [51]. In this study, we employed the Mask2Former model, which is built on a Transformer-based architecture, for semantic feature extraction from images [52,53]. Figure 4 illustrates the computational principle of the Mask2Former model. The model integrates a convolutional backbone with a set prediction mechanism and is designed to optimize panoptic segmentation performance in a unified manner. It enables accurate pixel-level identification of typical campus semantic elements such as vegetation, walkable areas, sky openness, and building structures.
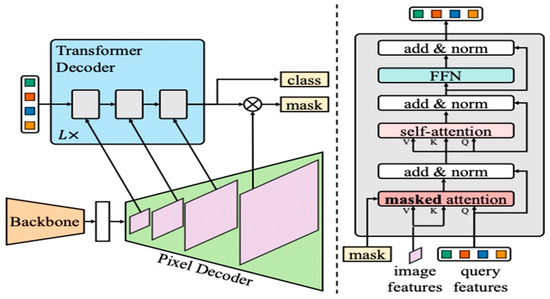
Figure 4.
Computational principle of the Mask2Former model. Note: This figure was adapted from Reference [52].
For Mask2Former training on the Mapillary Vistas dataset [54], panoptic and semantic segmentation were trained separately with identical settings using an ImageNet-22K pre-trained backbone. Data augmentation included random scale jittering (0.5–2.0), horizontal flip, 1024 × 1024 cropping, and color perturbation to match the dataset’s resolution and scene diversity [52]. A polynomial learning rate schedule ensured stable convergence (batch size 16, 300k iterations). At inference, images were resized so the long side was 2048 px. The number of queries depends on the task complexity and backbone (200 for Swin-L panoptic, otherwise 100) to balance capacity and stability.
Figure 5 illustrates the semantic segmentation results of campus panoramic images using the Mask2Former model. Using a model pretrained on the Mapillary Vistas dataset, which supports recognition of a wide range of objects, we selected 38 key semantic categories closely related to psychological perception for further analysis. These selected features reflect critical visual components hypothesized to influence students’ emotional, social, and cognitive responses to the campus environment. Table 2 presents 38 semantic feature classes.
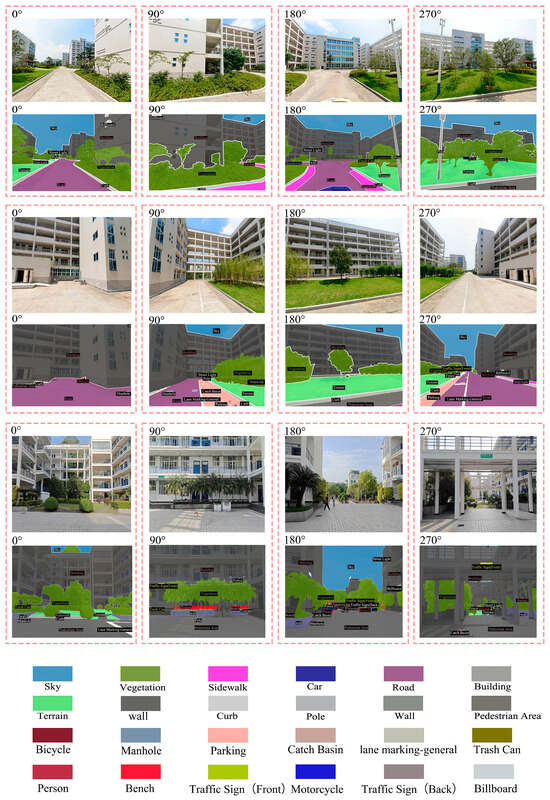
Figure 5.
Semantic segmentation results of the campus panoramic images using the Mask2Former model.

Table 2.
The 38 semantic feature classes.
3.2. Machine Learning and Multivariate Linear Regression Methods
- Decision tree modeling with SHAP interpretation
To evaluate the importance of landscape features on the students’ psychological outcomes, this study employed three decision tree-based algorithms: random forest (RF), gradient boosting regression (GBR), and extreme gradient boosting (XGBoost) [55,56,57], each offering distinct advantages in nonlinear modeling and feature importance ranking. Image semantic features were used as input variables and psychological indicator scores as output variables. After dividing the dataset into training, validation, and test sets, model performance was evaluated using the mean squared error (MSE), mean absolute error (MAE), and explained variance score (EVS) on the validation set. The model with the best performance was selected for final feature importance analysis and prediction. To enhance interpretability, the optimal model was combined with the SHAP (Shapley additive explanations) mechanism [58,59], which reveals the most influential features affecting psychological scores, along with their impact directions and threshold boundaries.
In this study, SHAP analysis was performed based on the final selected model (e.g., XGBoost) trained on the training set. The “TreeExplainer” module from the Python “shap” library (version 0.47.2) was employed to compute SHAP values for each input feature. For the test set, SHAP values were calculated for every sample to quantify the local contribution of each feature to the predicted psychological scores. The mean absolute SHAP value across all samples was then used to derive the global feature importance ranking. To enhance the robustness of the results, the calculation was repeated 50 times with random resampling, and the average SHAP importance was reported.
The SHAP-based analysis of the interpretable machine learning algorithms focused only on the top six features ranked by importance, potentially overlooking semantically meaningful image features that ranked lower but may still exert significant effects on the three psychological indicators. To address this limitation, multivariate linear regression analysis was conducted further to explore the impact of additional image-based semantic features. First, a Pearson correlation matrix was used to assess multicollinearity among features. Features with high collinearity were removed while retaining as much semantic information as possible. The remaining semantic features were then used as independent variables, with the three psychological indicators as dependent variables in a multivariate linear regression model.
3.3. Heterogeneity Analysis
In addition to modeling the overall relationships between campus landscape features and psychological indicators at a forestry university, this study further addressed two key questions: (1) Which landscape features exert significant influence on high versus low psychological scores across the three psychological indicators? and (2) do such influences vary across different functional zones within the campus? To explore these questions, a heterogeneity analysis was conducted.
First, participants were grouped into high, medium, and low score categories for each psychological indicator, based on tertile (top 1/3, middle 1/3, bottom 1/3) segmentation. Separate SHAP-based decision tree analyses and multivariate regression models were applied to each subgroup. The focus was placed on identifying features that exerted significantly positive effects in the high-score groups and significantly adverse effects in the low-score groups.
Second, the study applied k-means clustering to classify the campus into five distinct functional zones. Within each zone, machine learning and multivariate regression analyses were performed separately. This functional-zone-based heterogeneity analysis provided targeted insights to support future strategies related to ecological research, leisure activities, and transportation planning within forestry university campuses.
4. Empirical Results
4.1. Optimal Decision Tree Algorithm Selection for Campus Space Optimization
In this study, three decision tree-based machine learning algorithms, random forest (RF), gradient boosting regression (GBR), and extreme gradient boosting (XGBoost), were employed to model and predict the restorative effects of campus outdoor spaces. The dataset was split into training, validation, and test sets in a 70:20:10 ratio. Model performance was evaluated using metrics such as the mean squared error (MSE), mean absolute error (MAE), and explained variance score (EVS) [60].
The strategies employed to prevent overfitting in the three decision tree algorithms were as follows: for RF, the maximum depth of individual trees was limited, the minimum number of samples per leaf node was set, and a random subset of features was introduced during node splitting. For GBR, a small learning rate was used, the number and depth of trees were restricted, and a subsampling strategy was applied. For XGBoost, both L1 and L2 regularization terms were incorporated to penalize overly complex model structures.
For each psychological indicator and campus space type, the model with the best performance on the validation set was selected as the optimal algorithm. The final selection of optimal decision tree algorithms for different tasks is presented in Appendix A Table A1, Table A2 and Table A3. For example, on the full-sample dataset, the XGBoost model outperformed others in predicting all three psychological indicators: psychological restoration, emotional uplift, and social interaction.
4.2. Image Semantic Influence Analysis of Campus Outdoor Spaces
4.2.1. Visualization of Influential Semantic Features Across the Study Area
Figure 6 illustrates the spatial distribution of semantic features across the study area based on the full sample. The top six semantic features most influential to the three psychological indicators were selected, with duplicates removed to highlight the most representative factors.
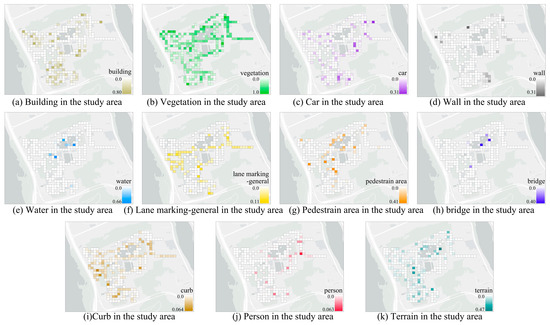
Figure 6.
Grid-based spatial visualization of the image semantic features.
4.2.2. SHAP-Based Feature Importance Analysis
- Key semantic image features influencing psychological restoration
Figure 7 presents the SHAP analysis results for semantic image features on the psychological restoration indicator based on the full sample. The left panel displays the ranking of feature importance based on the absolute SHAP values, while the right panel shows the SHAP value distribution across individual samples. A notable pattern was observed: image features with higher importance tended to exhibit more polarized SHAP value distributions, whereas those with lower importance showed SHAP values more concentrated near the center.
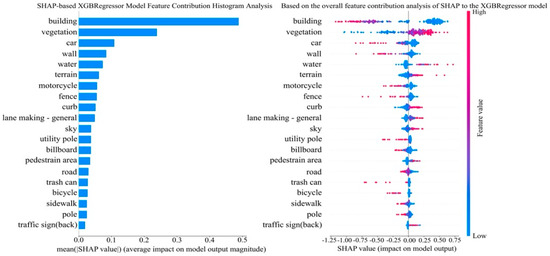
Figure 7.
SHAP value analysis of the image semantic features for the psychological restoration indicator (full sample).
The SHAP analysis, utilizing the XGBRegressor model, revealed that buildings and vegetation were the two most influential semantic features in the psychological restoration of outdoor campus spaces. While buildings, though significant, had a negative impact on psychological well-being, vegetation stood out as a key positive factor. Other notable features, such as water bodies and sky visibility, also played an important role, demonstrating measurable effects on the overall quality of campus space optimization.
Figure 8 presents the influence patterns of the top six image semantic features contributing to psychological restoration, based on the full-sample SHAP analysis. As the values of these features varied, the direction and magnitude of their effects on the psychological restoration indicator also changed. Specifically, the building feature showed a positive impact when its value ranged from 0 to 0.08, but shifted to a negative influence beyond 0.08. The vegetation feature exerted an adverse effect at values below 0.3, and became a positive contributor when the value exceeded 0.3. Both car and wall features positively affected psychological restoration when their values were within 0 to 0.02, but their influence turned negative once they surpassed this threshold. The water feature consistently exerted a positive effect as long as its value was greater than zero. Finally, the terrain feature had a negative impact when its value was below 0.03, transitioning to a positive influence when it exceeded that level. These findings underscore the nonlinear and threshold-based nature of semantic landscape features in shaping students’ restorative experiences in campus outdoor spaces, emphasizing their role in campus space optimization.
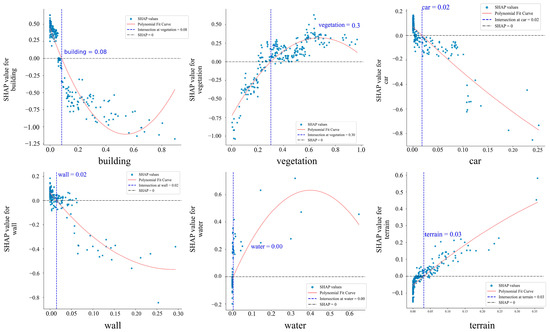
Figure 8.
The influence patterns of the top-ranked semantic features contributing to psychological restoration in the full sample.
- Key semantic image features influencing emotional uplift
Figure 9 presents the SHAP analysis of image semantic features associated with the emotional uplift indicator based on the full-sample dataset. The results showed that hardscape elements, such as buildings, lane markings, vehicles, pedestrian areas, and bridges, exerted the most significant influence on the students’ emotional uplift. Overall, these features tended to have a negative impact, indicating that environments dominated by rigid infrastructural elements are less likely to enhance the students’ emotional states. These findings highlight the importance of balancing hardscape and softscape elements in campus space optimization to foster a more emotionally supportive and restorative environment.
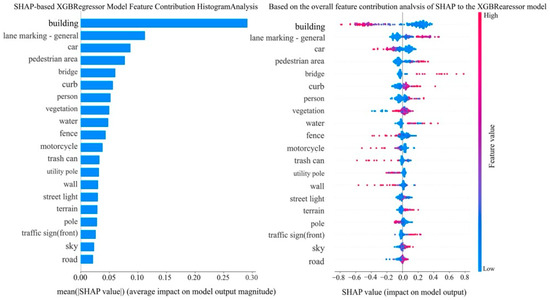
Figure 9.
SHAP value analysis of the image semantic features for the emotional uplift indicator (full sample).
Figure 10 illustrates the influence patterns of the top semantic features contributing to emotional enhancement in the full-sample analysis, further elucidating the mechanisms by which these key features affect the emotional enhancement scores. Building features exerted a positive effect when their values ranged from 0 to 0.09, but became detrimental beyond 0.09. The lane marking—general feature had a negative impact below 0 and a positive impact above this threshold. Car features showed a negative effect between 0 and 0.02, turning positive when exceeding 0.02. Pedestrian area features negatively influenced emotional enhancement from 0 to 0.02, but shifted to a positive effect beyond 0.02. Bridge features were negative below 0 and positive above 0. Finally, curb features negatively affected emotional enhancement when below 0.01, but became positive when exceeding this value.
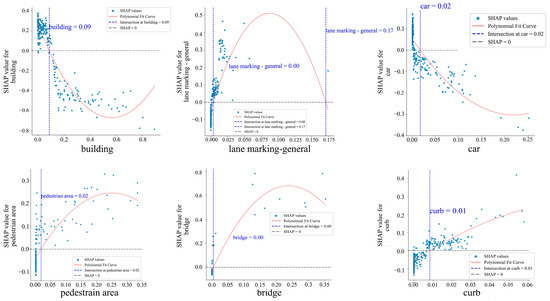
Figure 10.
Influence patterns of the top-ranked semantic features contributing to emotional uplift in the full sample.
- Key semantic image features influencing social interaction
Figure 11 presents the SHAP analysis of image semantic features associated with the social interaction indicator based on the full-sample dataset. The results indicate that “person” was the most influential semantic feature in identifying high-social-interaction scenarios. In addition, open environmental elements such as “water” and “pedestrian area”, along with structural features like “wall”, “vegetation”, and “sidewalk”, also made notable positive contributions to the prediction of social interaction scores. In contrast, features such as “sky”, “curb”, and “car” demonstrated relatively limited predictive importance in the model.
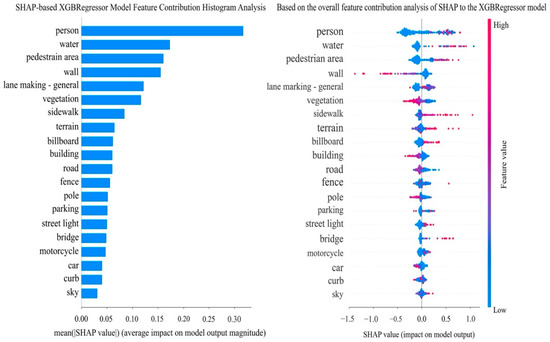
Figure 11.
SHAP value analysis of the image semantic features for the social interaction indicator (full sample).
Figure 12 presents the influence patterns of the top-ranked semantic features contributing to social interaction in the full sample. A detailed analysis of the top six features ranked by SHAP values revealed distinct nonlinear influence trends. The person feature exhibited a consistently positive effect as long as its value was greater than zero. The water feature began to exert a positive influence when its value exceeded 0.0. The pedestrian area feature showed a positive effect once its value surpassed 0.01. The wall feature had a positive influence in the range of 0 to 0.01 but shifted to an adverse effect when the value exceeded 0.01. The lane marking—general feature was positively associated with social interaction when its value was greater than 0.0, but turned negative beyond 0.14. Finally, the vegetation feature positively affected social interaction within the 0–0.35 range but exhibited an adverse effect when it exceeded 0.35. Maintaining campus landscapes that have a positive impact and optimizing those that have a negative impact can foster better social interaction among students.
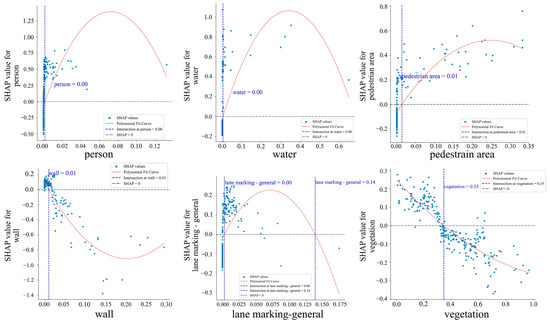
Figure 12.
Influence patterns of the top-ranked semantic features contributing to social interaction in the full sample.
4.2.3. Semantic Feature Heterogeneity Analysis in Campus Outdoor Spaces Using Multivariate Linear Regression (Full Sample)
Figure 13 presents a heatmap of the Pearson correlation coefficients among the 38 semantic features extracted from campus outdoor spaces. The results showed that most features exhibited weak pairwise correlations, with the overall heatmap displaying light blue tones, indicating a high degree of independence among the image semantic features. To prevent multicollinearity in the subsequent multivariate linear regression analysis, feature pairs with Pearson correlation coefficients exceeding 0.2 were processed by preferentially removing the less important feature based on its importance ranking in the interpretable machine learning models while aiming to retain as many semantic variables as possible as explanatory factors. Some feature pairs, such as curb and lane marking—general, or mountain and utility pole, demonstrated relatively strong positive correlations. In contrast, building, sky, and vegetation showed weak negative correlations. These findings underscore the importance of carefully balancing natural and built elements in campus space optimization to foster a psychologically restorative environment for students.
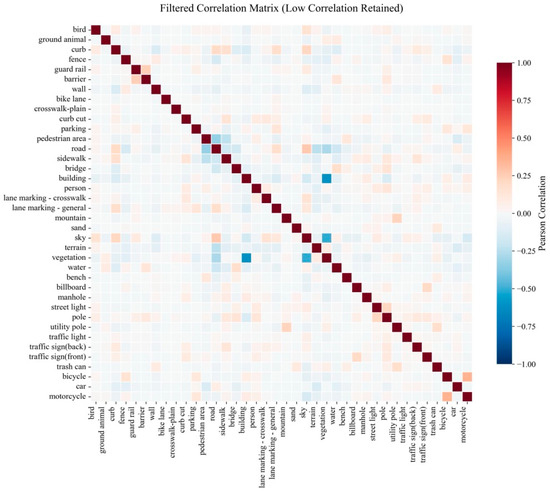
Figure 13.
Heatmap of the Pearson correlation coefficients among the 38 semantic features in university outdoor spaces.
The multivariate linear regression results for the psychological restoration indicator in the full sample, as presented in Table 3, revealed that several semantic features not identified as significant in the SHAP analysis exhibited statistically significant effects. For example, an increase in one unit in the fence feature was associated with a significant decrease of 3.34 units in psychological restoration scores, with the coefficient significant at the 1% level. Other features with significant adverse effects included lane marking—crosswalk (−2.92), sand (−15.78), manhole (−29.61), pole (−11.13), utility pole (−35.78), trash can (−10.04), and motorcycle (−4.98). In contrast, lane marking—general and bench demonstrated significant positive effects, with coefficients of 6.89 and 8.17, respectively, both significant at the 1% level. The adjusted R2 of the regression model for the psychological restoration indicator was 0.43, and the F-statistic was 33.4, indicating a relatively good model fit.

Table 3.
Multivariate linear regression results for the full sample.
For the emotional uplift indicator, the regression results in Table 3 show that the fence feature again exerted a significant adverse effect, with a coefficient of −1.72 (p < 0.01). In contrast, the water feature had a significant positive effect on emotional uplift, with a coefficient of 2.08, also significant at the 1% level. The adjusted R2 for this model was 0.24, and the F-statistic was 13.6, suggesting a moderate explanatory power. Regarding the social interaction indicator, the regression results in Table 3 revealed that the sand feature significantly decreased interaction scores, with a coefficient of −15.55 (p < 0.01). In contrast, seven features demonstrated significant positive associations with social interaction: curb cut (60.73), bridge (5.51), terrain (1.53), billboard (3.58), street light (97.76), traffic sign (back) (164.03), and motorcycle (5.62), all significant at the 1% level. These results further highlight the complementary value of multivariate regression in identifying features that may be underestimated in machine learning-based importance rankings.
4.3. Heterogeneity Analysis Based on Psychological Score Groups
4.3.1. Semantic Feature Comparison Across High, Medium, and Low Perception Score Groups
One representative outdoor campus image was randomly selected from each of the high, medium, and low score groups. Figure 14 presents these images along with their corresponding semantic feature distributions, aiming to highlight the compositional differences across different perceptual score levels.
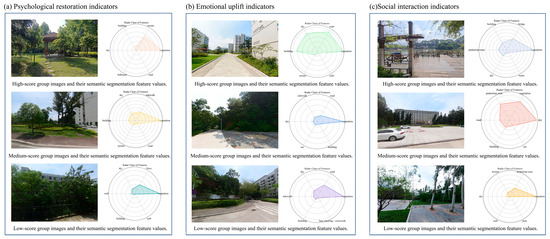
Figure 14.
Semantic feature distributions across different score groups.
4.3.2. Modeling Results of Interpretable Machine Learning Across Score-Based Subgroups
- Psychological restoration indicator
In the SHAP value analysis for the psychological restoration indicator, vegetation and building consistently appeared among the top six features across the high-, medium-, and low-score subgroups. The billboard feature appeared in the top six only in the medium-score group; in contrast, sand, wall, and lane marking—general ranked among the top six features exclusively in the low-score group. These variations suggest that different semantic elements may be more salient in influencing psychological restoration depending on the perceived restoration level of the space.
Analysis of the influence patterns of the top-ranked semantic features contributing to psychological restoration across the high-, medium-, and low-score groups revealed that in the high-score group, features such as road (SHAP values: 0–0.07), car (0–0.01), building (0–0.04), sky (0–0.09), and water (positive SHAP values) were associated with positive effects on psychological restoration. In the medium-score group, building (0–0.07), vegetation (0.35–0.97), water (>0), road (0–0.11), billboard (>0), and sky (0–0.22) also showed positive influences. In contrast, within the low-score group, vegetation (0.0–0.21) and lane marking—general (values < 0) were associated with adverse effects on psychological restoration. These findings suggest that the impact of specific landscape features varies notably across different levels of perceived psychological restoration.
- Emotional uplift indicator
In the SHAP value analysis for the emotional uplift indicator, vegetation consistently appeared among the top six most important features in all three subgroups: high-, medium-, and low-score. In the high-score group, bridge, wall, and water also appeared among the top six features contributing to emotional uplift. In contrast, car and pole ranked within the top six features in the low-score group, suggesting that these elements may be more salient in lower-rated emotional environments.
In the analysis of influence patterns for the top-ranked semantic features contributing to emotional uplift across all score groups, the high-score group showed that curb (SHAP values: 0–0.01), fence (0–0.14), and water (positive SHAP values) were associated with positive effects on emotional uplift. In contrast, in the low-score group, features including vegetation (0–0.3), lane marking—general (values < 0), curb (values < 0), and car (0–0.02) showed adverse effects. These results highlight the differentiated roles that environmental features play in shaping emotional responses across perceptual levels.
- Social interaction indicator
In the SHAP value analysis for the social interaction indicator, the building feature consistently appeared among the top six features in all three subgroups: high-, medium-, and low-score. In the high-score group, sand, water, and pole were also among the top six features contributing to higher perceived social interaction. In contrast, in the low-score group, features such as curb, wall, sidewalk, and lane marking—general appeared in the top six, suggesting their relevance in lower-rated social interaction environments.
In the analysis of top-ranked semantic features for social interaction, the high-score group was characterized by positive associations for road (SHAP values: 0–0.08), building (0–0.11), and water (positive SHAP values), whereas the low-score group showed negative associations for curb (0–0.3), sidewalk (0–0.04), lane marking—general (negative SHAP values), car (0–0.01), and building (0–0.01). These results indicate that features beneficial to social interaction in well-designed settings may have the opposite effect in less favorable spatial configurations.
4.3.3. Multivariate Linear Regression Results Across Score-Based Subgroups
Following a similar procedure to the full-sample multivariate linear regression analysis, this section removed redundant features within each high-, medium-, and low-score group for the three psychological indicators to ensure the absence of multicollinearity among the input variables. This empirical analysis aimed to identify influential semantic features that the interpretable machine learning approach in Section 4.3.1 may have overlooked. Table 4 presents the multivariate linear regression results for the psychological restoration indicator across the three score groups. The results revealed that several semantic features not identified as necessary in the SHAP analysis nonetheless exhibited statistically significant effects, highlighting secondary yet critical visual elements that influence psychological restoration. For example, in the high-score group, each unit increase in the terrain feature was associated with a 1.05-unit increase in the psychological restoration score. Similarly, the bench feature showed a strong positive effect, with a coefficient of 6.50. Both coefficients were statistically significant. The adjusted R2 of this regression model was 0.21, and the F-statistic was 4.94, indicating a reasonably good model fit.

Table 4.
Multivariate linear regression results for the psychological restoration indicator across the high-, medium-, and low-score groups.
Table 5 presents the multivariate linear regression results for the emotional uplift indicator across the high-, medium-, and low-score groups. The findings show that several semantic features not identified as significant in the SHAP analysis nonetheless had statistically significant effects on emotional uplift, revealing additional factors relevant to the students’ affective perceptions. For example, in the high-score group, a one-unit increase in the parking feature was associated with a 0.5-unit increase in emotional uplift. In addition, vegetation (coefficient = 0.87), water (6.89), and pole (6.04) all showed significant positive effects. The adjusted R2 of the regression model for this group was 0.08, and the F-statistic was 2.20, indicating a good model fit.

Table 5.
Multivariate linear regression results for the emotional uplift indicator across the high-, medium-, and low-score groups.
Table 6 presents the multivariate linear regression results for the social interaction indicator across the high-, medium-, and low-score groups. The analysis revealed that several semantic features not highlighted in the SHAP analysis nonetheless exhibited statistically significant effects on social interaction, uncovering additional explanatory variables. For instance, in the high-score group, a one-unit increase in the bike lane feature corresponded to a 34.58-unit increase in the social interaction score. In addition, the bridge (coefficient = 1.59) and the utility pole (19.55) also showed significant positive effects. The adjusted R2 for this regression model was 0.18, and the F-statistic was 4.16, indicating a modest but acceptable model fit.

Table 6.
Multivariate linear regression results for the social interaction indicator across the high-, medium-, and low-score groups.
4.4. Functional Zoning and Semantic Feature Analysis of Campus Outdoor Spaces
4.4.1. Functional Zoning of Campus Outdoor Spaces
Figure 15 illustrates the classification results of campus outdoor spaces based on k-means clustering. The inertia of clustering showed a sharp decline when the number of clusters was fewer than five, after which the rate of decrease stabilized. This pattern indicates that selecting five clusters is an appropriate choice for segmenting campus outdoor spaces [61].
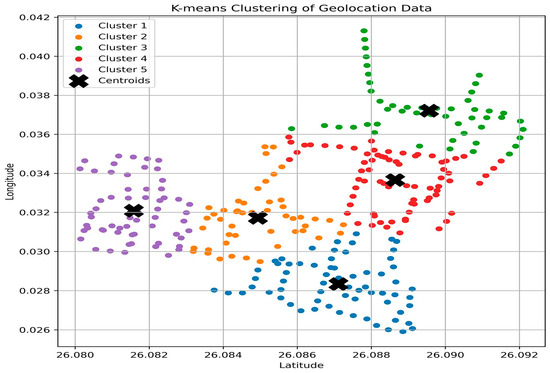
Figure 15.
Classification results of the campus outdoor spaces based on k-means clustering analysis.
Based on the k-means clustering analysis, the outdoor spaces of the Fujian Agriculture and Forestry University (Jinshan Campus) were categorized into five functional zones. As shown in Figure 16, representative image semantics for each zone are illustrated. The first zone, the Ecological Research and Practice Zone, is primarily located around the Forestry Building and the Sugarcane Research Center in the northern part of the campus. This area is characterized by strong academic functions, supporting activities such as plant observation, crop experimentation, and field-based practical training for agriculture and forestry disciplines. The second zone, the Ecological Landscape Exhibition Zone, is centered in the Zhonghuayuan area and integrates botanical gardens, water features, and horticultural landscapes, highlighting ecological education and campus image presentation. The third zone, the Commuting and Circulation Zone, runs linearly along the eastern edge of the campus, connecting teaching, residential, and entrance nodes. It is marked by high pedestrian flow and strong spatial accessibility. The fourth zone, the Integrated Leisure Landscape Zone, surrounds Guanyin Lake and combines ecological, leisure, and social functions, serving as a core area for campus activities and landscape appreciation. Finally, the fifth zone, the Multifunctional Social Interaction Zone, includes areas such as the Research Institute Plaza, the library forecourt, the Innovation Building, and the dormitory surroundings. This zone integrates academic exchange, recreational activities, and daily services, acting as a key node for campus social engagement.
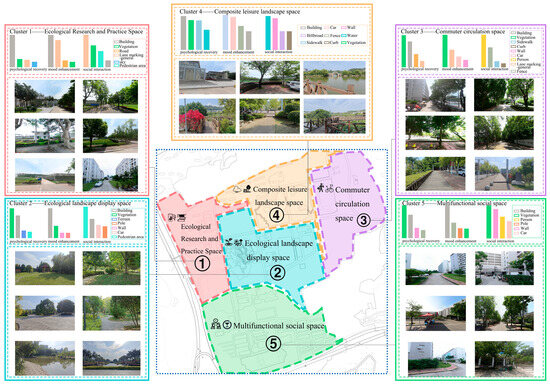
Figure 16.
Semantic examples of image features across the five campus functional zones.
4.4.2. Semantic Feature Analysis of Different Campus Outdoor Spaces
- Cluster 1: Ecological Research and Practice Zone
Appendix A Figure A1 presents the SHAP value analysis of semantic image features for the three psychological indicators in the first cluster. At the same time, Appendix A Figure A2 illustrates the impact patterns of the top contributing features. In the Ecological Research and Practice Zone, the feature building showed a consistently positive effect across all three psychological dimensions. Additionally, billboards and cars contributed positively to psychological restoration, pole enhanced emotional uplift, and both vegetation and walls facilitated social interaction. In contrast, traffic-related features such as lane marking—general, road, and pedestrian area generally exerted adverse effects. Notably, sidewalk and vegetation also showed suppressive effects on psychological restoration and emotional uplift in specific models.
- Cluster 2: Ecological Landscape Display Spaces
In the Ecological Landscape Display Spaces, Appendix A Figure A3 presents the SHAP value analysis of semantic image features across the three psychological dimensions. At the same time, Appendix A Figure A4 illustrates the impact patterns of the top contributing features. The feature building consistently exerted a positive influence on all three psychological indicators. Specifically, bicycle contributed to psychological restoration, while the motorcycle, fence, and pole positively affected emotional uplift. Features such as car, vegetation, and a curb enhanced social interaction. Conversely, elements like vegetation and pedestrian area showed adverse effects across multiple dimensions, and features such as terrain, mountain, and wall also appeared to have adverse effects on specific psychological outcomes.
- Cluster3: Commuting and Circulation Spaces
In the Commuting and Circulation Spaces, Appendix A Figure A5 presents the SHAP value analysis of semantic image features across the three psychological dimensions. At the same time, Appendix A Figure A6 illustrates the impact patterns of the top-ranked features. Results showed that building and pole positively contributed to psychological restoration, car and billboard enhanced emotional uplift, and wall facilitated social interaction. In contrast, multiple features, including vegetation, lane marking (general), and fences, demonstrated adverse effects across dimensions. Additionally, people and curbs tended to suppress social interaction functionality.
- Cluster4: Composite Leisure Landscape Spaces
In the Composite Leisure Landscape Spaces, Figure A7 and Figure A8 in the Appendix A illustrate the SHAP value analysis and the impact patterns of top-ranked semantic features across the three psychological dimensions, respectively. The results indicate that buildings and cars exhibited positive effects across multiple dimensions. Sidewalk contributed positively to psychological restoration, while motorcycle enhanced emotional uplift. Additionally, walls and billboards played supportive roles in promoting social interaction. Conversely, several natural and circulation-related elements, including vegetation, water, terrain, and specific traffic-related components, showed negative associations across dimensions, suggesting that they may diminish the restorative, emotional, or social benefits of the space.
- Cluster5: Multi-Functional Social Interaction Spaces
In the Multi-Functional Social Interaction Spaces, Appendix A Figure A9 presents the SHAP value analysis of image semantic features under the three psychological indicators. At the same time, Appendix A Figure A10 illustrates the impact patterns of the top-ranked semantic features. Within this space category, “building” demonstrated consistently strong positive effects across all psychological outcomes. Features such as “wall”, “fence”, and “motorcycle” were positively associated with psychological restoration and emotional uplift, whereas “car” contributed positively to social interaction. In contrast, elements such as “vegetation”, “curb”, and several infrastructure-related features exhibited predominantly adverse effects, indicating a potential weakening of the space’s overall psychological functionality.
4.4.3. Heterogeneity Analysis Based on Multiple Linear Regression
To further investigate the spatial heterogeneity across the five functional zones, this section employed multiple linear regression to identify semantic features that were not globally important in the SHAP analysis but demonstrated statistically significant effects within specific spatial contexts. The k-means clustering results revealed that these features exerted notable influence on the perceived psychological scores across different zones, highlighting their context-dependent value and potential for targeted spatial interventions. Appendix A Table A4 presents the regression results for the first functional zone, the Ecological Scientific Practice Space. In this zone, the psychological restoration dimension was negatively affected by features such as fence, wall, sand, and utility pole. For the emotional uplift dimension, wall, sand, and billboard exhibited adverse effects, whereas water showed a significant positive contribution. In the social interaction dimension, mountain was a negative factor, while person, lane marking, crosswalk, and traffic light were positively associated with enhanced social perceptions. Notably, wall and sand consistently appeared as negative contributors across multiple psychological dimensions.
In the Ecological Landscape Exhibition Space, Appendix A Table A5 presents the multiple linear regression results for the second spatial cluster. For the psychological restoration dimension, bike lane, terrain, utility pole, and bicycle exhibited significant negative associations, whereas water showed a significant positive effect. Regarding the emotional uplift dimension, bike lane was negatively associated, while terrain and traffic sign (front) exerted positive influences. In terms of social interaction, wall, terrain, traffic sign (front), and bench contributed positively, whereas bike lane, utility pole, bicycle, and curb showed adverse effects. These results highlight both supportive and inhibitory roles of various landscape elements across different psychological dimensions, suggesting the context-dependent significance of these features within the ecological landscape exhibition space.
In the Commuting Circulation Space, as shown in Appendix A Table A6, the multivariate linear regression results for the third type of space indicate that the psychological restoration dimension was negatively affected by the presence of barriers, trash cans, and cars. At the same time, terrain was a positive influencing factor. In the emotional uplift dimension, manholes and cars had a negative impact, whereas lane marking—general had a positive effect. For the social interaction dimension, fence, sidewalk, person, and traffic sign (back) were positive influencing factors, while wall and utility pole had an adverse effect. The presence of cars consistently showed a negative impact on both psychological restoration and emotional uplift.
In the Composite Leisure Landscape Space, the multiple linear regression results presented in Appendix A Table A7 revealed distinct semantic feature influences across the three psychological dimensions. For psychological restoration, features such as wall, billboard, utility pole, car, and motorcycle exerted significant adverse effects. In the emotional uplift dimension, wall, utility pole, and traffic sign (front) were also associated with negative impacts, whereas bird showed a positive association with emotional uplift. Regarding social interaction, wall and sand demonstrated adverse effects, while bridge and pole contributed positively. Notably, the wall feature consistently exerted a negative influence across all three psychological indicators, suggesting that it may hinder the restoration of students’ psychological health in terms of restorative, emotional, and social experiences.
In the Multi-functional Social Interaction Space, as presented in Appendix A Table A8, several semantic features exhibited significant associations with psychological outcomes. For the psychological restoration dimension, the presence of a manhole showed a significant adverse effect, suggesting that it may detract from the perceived restorative quality, while lane marking—general was positively associated with restoration, indicating its potential to provide spatial order or perceived navigability that enhances psychological comfort. In terms of emotional uplift, both building and water demonstrated significant adverse impacts, implying that within this multifunctional context, dense built-up elements and nearby water bodies may reduce emotional vitality, possibly due to crowding or perceived inaccessibility. For social interaction, bike lanes and street lights positively influenced perceptions of sociability, reflecting their roles in promoting accessibility and safety, which facilitate interaction. In contrast, traffic lights and ground animals were negatively associated with social interaction, potentially due to their links with traffic stress or unpredictability in the space. These findings emphasize the nuanced and context-specific effects of landscape features, highlighting the value of fine-grained spatial analysis in supporting well-being-oriented campus design.
Based on the results of the SHAP-based machine learning and multiple linear regression analyses, the functional characteristics of campus outdoor spaces can be summarized as follows. In the first clustered space, Ecological Research and Practice Spaces, buildings serve as the central semantic element, comprehensively supporting psychological restoration, emotional uplift, and social interaction. This reflects a spatial character marked by structural stability and multifunctionality. Features such as billboards, cars, and poles enhance environmental legibility and emotional vitality. While vegetation and walls positively contributed to social interaction, they showed mixed effects on the psychological and emotional dimensions. Conversely, lane marking—general, sand, and walls exerted adverse effects across multiple dimensions, indicating strong traffic-oriented and spatially enclosed characteristics. Overall, this space type demonstrates a dual nature of research-focused functionality and limited social exchange.
In the second clustered space, Ecological Landscape Display Spaces, buildings again functioned as a positive core element, supporting both psychological and social outcomes. This space exhibited clear structural organization and multifunctional performance. Features such as motorcycles, fences, and poles enhanced emotional vitality, while cars and interface elements promoted social interaction. However, bike lanes and bicycles were predominantly negative, suggesting that a slow-traffic system may weaken restorative and interactive experiences. The effect of terrain was differentiated across psychological dimensions, while walls and traffic signs positively supported social functionality. Overall, this space type has a dual nature, combining research-focused functionality with limited opportunities for social interaction, emphasizing the creation of a campus environment conducive to both academic and social well-being.
In the third clustered space, Commuting and Circulation Spaces, buildings and poles contributed to psychological order and stability, while billboards and lane marking generally aided in emotional uplift. Cars exerted consistent adverse effects across models, indicating that vehicular interference impairs restorative potential. The role of walls in social interaction is context-dependent, while fences, sidewalks, and persons enhance social engagement. The characteristics of this space type are structural clarity and high circulation efficiency, which are conducive to promoting short-term social interactions and enhancing both the practicality and restorative potential of the campus environment.
In the fourth clustered space, Composite Leisure Landscape Spaces, buildings and cars served as stabilizing elements supporting multi-dimensional functions. Sidewalks and motorcycles contributed to psychological restoration and emotional uplift, while billboards fostered social interaction. Walls consistently showed adverse effects across all three indicators, implying that spatial enclosure diminishes environmental experience. Natural and mobility-related features also tended to exert negative impacts. This space type reflects an atmosphere of openness and functional diversity, though spatial boundaries require moderate control. These insights highlight the need for a balanced approach to campus space optimization, where openness is encouraged without compromising the quality of interaction and restoration.
In the fifth clustered space, Multi-functional Social Interaction Spaces, buildings remained a core component, although their effects varied slightly across dimensions. Walls, fences, and motorcycles enhanced both psychological restoration and emotional uplift, while cars, bike lanes, and street lights strengthened social interaction. On the other hand, features such as vegetation, curbs, and traffic lights showed predominantly adverse effects, suggesting that while this space type is oriented toward social engagement and structural clarity, certain elements may hinder its integrated performance.
5. Robustness Check
The first robustness check in this study was an ablation experiment that examined whether the conclusions changed when multiple linear regression was replaced with the weighted least squares (WLS) method. Compared with multiple linear regression, WLS is more appropriate when image semantic features exhibit heteroscedasticity. The WLS results indicate that the directions and relative magnitudes of the significant semantic coefficients reported in Table 3, Table 4, Table 5 and Table 6 and Appendix A Table A4, Table A5, Table A6, Table A7 and Table A8 remained unchanged, confirming the robustness of the conclusions. For example, in Table 2, for the full sample with the psychological restoration indicator as the dependent variable, the positive coefficients for lane marking—general (6.89) and bench (8.17) in the multiple linear regression became 7.43 and 9.52, respectively, in the WLS results. The negative coefficients for sand (−15.78), billboard (−5.41), and manhole (−29.61) changed to −15.87, −6.56, and −22.11, respectively. Similarly, in Table 4, for the high-score group of the emotional uplift indicator, the coefficients of parking, vegetation, water, and pole were 0.50, 0.87, 6.89, and 6.04, respectively, in the multiple linear regression, and 0.21, 0.96, 4.90, and 2.70, respectively, in the WLS results.
The second robustness check in this study involved replacing the image semantic segmentation method used in the main analysis. In the main text, the Mask2Former model trained on the Mapillary Vistas dataset was adopted. For this robustness test, the DeepLabv3+ model was used instead, with partial hyperparameters set as follows: AdamW optimizer, learning rate of 1 × 10⁻⁴, weight decay of 0.05, and the same Mapillary Vistas dataset for training. During fine-tuning, the backbone’s layer-wise learning rate decay was maintained at 0.95. After replacing the image segmentation method, the feature importance rankings obtained through the interpretable decision tree algorithm remained largely consistent with the main results. For example, in the low-score group of the social interaction indicator, the top six features remained unchanged, except that the feature importance of “car” surpassed that of “sidewalk.” Similarly, for the psychological restoration indicator in the second cluster type, the top five features remained the same, while the previously sixth-ranked “mountain” feature was replaced by “fence.”
6. Discussion
Table 7, Panel A compares the research method used in this study with those employed in previous studies. From the methodological perspective, this study integrated advanced approaches including Mask2Former-based image semantic segmentation, interpretable machine learning models combining decision tree algorithms with SHAP, and multivariate linear regression analysis. While previous research has employed subsets of these methods, most have focused primarily on developing predictive models for assessing the restorative quality of campus landscapes [9,25,28,62]. In contrast, this study emphasized identifying specific landscape features that significantly influence students’ psychological restoration, emotional uplift, and social interaction. By examining both the direction and magnitude of these effects, the study aimed to provide actionable insights for landscape optimization. The integration of decision tree algorithms with SHAP enabled the interpretable identification of landscape elements most influential to the three psychological indicators. At the same time, SHAP also facilitated the detection of threshold effects in the influence of these features. Furthermore, multivariate linear regression supplemented this analysis by revealing statistically significant landscape elements that may be under-valued in feature importance rankings but still exert substantial influence. Together, these methodological innovations enhance the ability to identify key intervention points for optimizing, improving, or maintaining campus outdoor environments, particularly in forestry universities, ultimately advancing the field of campus space optimization.
Figure 17 presents a knowledge tree outlining the mainstream technological trends in this field. First, in image feature recognition, previous studies have used models such as DeepLabV3+ [33], Mask2Former [52], and object detection models like YOLO [63]. This study employed the Mask2Former model, which offers advantages over the other two models in terms of feature recognition accuracy and multitask processing capability. Second, in machine learning algorithms, the main approaches include neural network models [64] and interpretable decision tree algorithms [55,56,57]. This study used the latter, as it provides advantages in computational efficiency, preventing overfitting and interpretability, making it more suitable for the image feature importance analysis in this research. Third, regarding statistical analysis methods, including structural equation modeling [65], multiple linear regression [28], and weighted least squares (WLS) regression [66], this study used multiple linear regression in the main analysis and WLS for the robustness check. Overall, the research applied Mask2Former for pixel-level feature extraction, combined with SHAP for interpretable learning and multiple regression to identify feature importance, thresholds, and intergroup differences. The results were translated into heterogeneous group analysis and functional zoning optimization suggestions, providing a more integrated approach in terms of interpretability, heterogeneity characterization, and implementability.
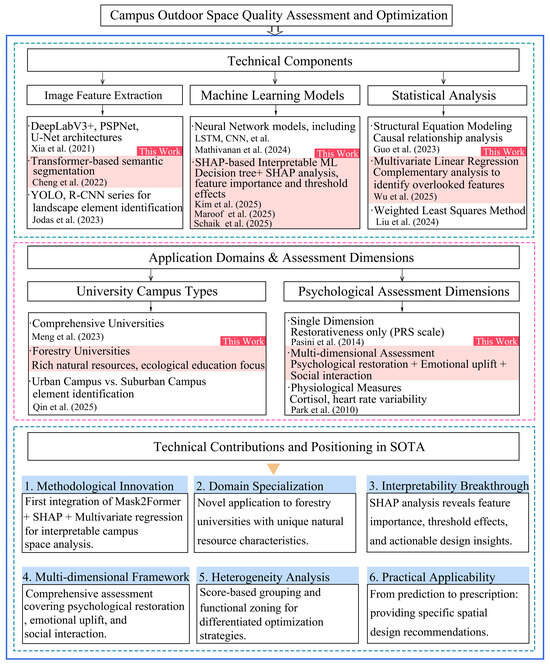
Figure 17.
Knowledge tree of campus outdoor space quality assessment and optimization [25,26,28,33,40,48,52,55,56,57,63,64,65,66].
Table 7, Panel B compares the research findings of this study with those of previous studies. From the finding perspective, in the full-sample analysis, natural elements such as vegetation, water, and terrain consistently exhibited positive effects across all three psychological dimensions: psychological restoration, emotional uplift, and social interaction. This confirms the critical role of natural environments in cognitive regulation and emotional stability [42,67]. In contrast, structural features such as walls, fences, and dense buildings generally showed nonlinear or adverse effects, underscoring the importance of careful spatial boundary design and structural scale considerations. Although these findings align with prior studies on green space in higher education environments [10,11,68,69,70], the present study extends this knowledge by revealing deeper heterogeneity through score-based stratification and spatial clustering. The results suggest that outdoor space optimization should be conducted through stratified interventions based on perceptual differences [71]. Furthermore, the functional zoning analysis identified five distinct campus space types, each exhibiting unique response patterns to psychological indicators. This led to the development of a multidimensional optimization pathway characterized by “natural embedding–order orientation–moderate boundary”. This framework, which links semantic features with psychological perceptions while accounting for both spatial typologies and individual heterogeneity, makes a novel contribution to the literature on outdoor spaces in forestry universities, offering valuable insights for campus space optimization.

Table 7.
Comparisons with previous research.
Table 7.
Comparisons with previous research.
| Panel A. Comparative Analysis of Research Methods | ||||
| Author (Year) | Research Background | Research Method | Limitations | Supplement of This Study |
| Meng et al. (2023) [25] | Campus landscape quality affects user experience; traditional methods are subjective and limited in coverage. | Collected campus street-view images; DeepLabV3+ extracted spatial element proportions; Place Pulse 2.0 calculated visual aesthetics. | Relied on cross-cultural dataset, risking adaptability bias; no validation with subjective or behavioral data. | Uses high-precision Mask2Former features, combined with multiple regression and SHAP to verify nonlinear effects and significance, improving transferability and practical value across contexts. |
| Zhang et al. (2023) [9] | COVID-19 lockdown made outdoor campus space the only contact with nature; need to identify emotional drivers. | Collected 7092 student facial photos and ECG (24 participants) over two weeks; FaceReader 9.0 created GIS emotion maps; extracted 12 panoramic visual indicators; regression tested spatial effects. | Single university; small sample; single HRV metric; no microclimate or multisensory control; linear models missed nonlinear thresholds. | |
| Wu et al. (2025) [28] | Rising mental health needs; campus public spaces lack restorative design. | PSPNet segmentation of street-view images; PRS-11 survey trained XGBoost to predict restorative scores; overlaid with sDNA walking accessibility for optimization. | Small PRS-11 sample; black-box model without interpretability; sDNA lacked real-time pedestrian flow and multimodal access. | |
| Panel B. Comparative Analysis of Research Findings | ||||
| Author (Year) | Research Background | Main Findings | Limitations | Supplement of This Study |
| Alserry et al. (2024) [10] | Universities influence student social life and well-being; outdoor spaces often neglected. | Observations, interviews, and surveys showed seating quantity, layout, and maintenance determine gathering vs. solitude; UK university rated highest for flexible furniture and spatial hierarchy; all lacked quiet focus areas. | Only 50 samples from three Egyptian universities; subjective green space quality; cross-sectional design limits causality. | Psychological restoration, emotional uplift, and social interaction respond differently to the same features; propose “nature integration–order guidance–moderate boundaries” and targeted interventions by zone; call for dynamic behavioral data to improve causal inference. |
| Hasan et al. (2024) [11] | Few quantitative studies on campus outdoor space; An-Najah campus offers diverse spatial structure. | High-integration and visible areas attract more people; students prefer shaded seating, using steps when lacking; deficiencies include insufficient seating, missing landmarks, and poor facilities. | Single site; limited temporal and seasonal coverage; manual observation; no control for user attributes. | |
| Liu et al. (2022) [69] | Depression rates higher among university students, especially in China; unclear role of green space and gender differences. | Green space improves mental health partly via academic achievement; stronger effect for males; females report higher depression. | Subjective measures; causality disorder; uncontrolled confounders. | |
The method proposed in this study can be applied to other universities. By integrating online street-view image acquisition, survey-based scoring, interpretable machine learning, and econometric analysis, it is possible to identify landscape features that influence psychological health indicators among students in other institutions. However, the conclusions of this study are unique and may only be replicated in environments similar to the forestry and agricultural university examined here, particularly those with comparable landscape characteristics. As noted in Section 4.4.1, the study site features distinct ecological functional zones including an ecological research area characterized by a sugarcane research center and greenhouse cultivation, an ecological landscape zone centered on a botanical garden, and a recreational landscape zone defined by lakeside scenery. Such specific ecological and landscape zones are not present in every university, and therefore the conclusions drawn in this study are unique.
7. Conclusions
This study investigated the influence of outdoor spatial features on emotional uplift, social interaction, and psychological restoration among students at a forestry university in China. Employing a comprehensive methodological framework that integrated image semantic segmentation (Mask2Former), SHAP-based interpretable machine learning, and multivariate linear regression, the study provides a data-driven understanding of how campus environments shape student well-being. Semantic features were extracted using the Mask2Former model and quantified, while psychological indicators were collected via questionnaires. SHAP analysis based on decision tree models was employed to examine the impact and threshold effects of spatial features. Subsequently, multivariate regression was applied to uncover additional features with statistical significance that were overlooked by SHAP analysis. Furthermore, psychological indicators were stratified into high-, medium-, and low-score groups to examine heterogeneity, and k-means clustering was used to analyze the functional spatial zones. The main findings are as follows:
- In the full-sample analysis, interpretable machine learning revealed that vegetation significantly promoted psychological restoration, whereas buildings generally exerted an adverse effect. Multivariate regression further highlighted that bench, water, street light, and bridge positively contributed to specific psychological indicators, while artificial features such as fence, sand, motorcycle, pole, utility pole, and trash can tend to have adverse effects. These findings suggest several design implications. First, prioritize increasing green coverage and biodiversity to enhance the natural continuity of the environment. Second, incorporate water features and terrain to support emotional regulation and foster social engagement. Finally, reduce the scale and visual dominance of built structures such as walls and fences, particularly for users with low perceptual sensitivity, to create a more balanced and restorative campus environment.
- The stratified analysis by psychological score groups revealed heterogeneity in spatial sensitivity. For psychological restoration, features such as road and terrain had positive effects in the high-score group, while sand showed adverse effects. Regarding emotional uplift, elements like the bridge and water were beneficial to specific groups, whereas the curb and sand were detrimental. For social interaction, features like road and bike lanes were positively associated, while curb and wall had negative associations. Collectively, individuals with higher psychological scores favored environments with open views, natural continuity, and walkability, while those with lower scores were more susceptible to noise, visual obstruction, and redundant infrastructure. Design strategies should thus focus on creating legible, walkable systems in academic and residential zones while incorporating water features, seating, and lighting at social nodes to enhance adaptability and user experience.
- The five spatial clusters derived from k-means clustering exhibited distinct psychological perception patterns and functional orientations. Ecological Research and Practice Spaces were centered on buildings and benefited from enhanced ecological integration and openness. Ecological Landscape Display Spaces emphasized visual appeal and interaction, requiring improved greenery continuity and sightline guidance. Commuting and Circulation Spaces focused on connectivity and order, requiring clearer pathways to facilitate movement. Composite Leisure Landscape Spaces merged multiple functions and required careful boundary management and spatial rhythm. Multi-Functional Social Interaction Spaces demanded a clear structure and strong social support elements. In conclusion, spatial optimization should adopt a context-sensitive approach, balancing ecological, mobility, and social needs to enhance psychological well-being and support campus community interaction.
In summary, the optimization of outdoor campus spaces in forestry universities should adhere to the overarching principles of “nature-led, structurally ordered, functionally integrated, and socially inclusive”. This approach involves systematically strengthening the ecological foundation, strategically incorporating built elements, and creating open, connected, and accessible spatial configurations. By integrating ecological, cognitive, and social dimensions, the goal is to enhance the overall campus environment, better supporting both educational activities and daily life.
This study had several limitations that should be addressed in future research. First, the k-means clustering method may be limited by the dimensionality and coverage of the dataset, potentially leading to ambiguous classifications. Incorporating behavioral trajectory data could enhance clustering accuracy and provide more nuanced insights into spatial preferences. Second, all participants in this study were from a single university, which may limit the external validity of the findings. Future studies should broaden the sample to include students from other universities and diverse tourist groups to enhance generalizability. Third, the linear assumptions of multivariate regression may not fully capture the nonlinear relationships between spatial features and psychological indicators.
Future research should explore methods such as generalized additive models (GAMs) or structural equation modeling (SEM) to uncover deeper causal insights. Additionally, integrating multi-source dynamic data and conducting cross-regional validations with nonlinear modeling would enhance the adaptability and theoretical robustness of campus space optimization strategies.
Author Contributions
Conceptualization, X.Z.; Methodology, X.Z., Z.T. and Z.D.; Software, Z.T., S.L. and Z.D.; Writing—original draft preparation, X.Z.; Writing—review and editing, S.L. and Z.D.; Supervision, Visualization, S.L. and Z.D.; Funding acquisition, Z.T. All authors have read and agreed to the published version of the manuscript.
Funding
This research work was supported by the National Natural Science Foundation of China under grant No. 72341030, and the Special Funding Project of the China Agricultural and Forestry University Design Art Alliance under grant No. 111900050.
Data Availability Statement
The raw data supporting the conclusions of this article will be made available by the authors on request.
Conflicts of Interest
The authors declare no conflicts of interest.
Correction Statement
This article has been republished with a minor correction to the Data Availability Statement. This change does not affect the scientific content of the article.
Appendix A

Table A1.
Performance of the decision tree algorithms on the validation set using the full sample.
Table A1.
Performance of the decision tree algorithms on the validation set using the full sample.
| Full Sample Psychological Recovery Indicators | Complete Sample Sentiment Improvement Index | Full Sample Social Interaction Indicators | |||||||||
|---|---|---|---|---|---|---|---|---|---|---|---|
| RF | GBR | XGBOOST | RF | GBR | XGBOOST | RF | GBR | XGBOOST | |||
| MSE | 0.9874 | 0.9677 | 0.9504 | MSE | 1.0319 | 1.0271 | 1.0125 | MSE | 1.2258 | 1.2343 | 1.1783 |
| MAE | 0.7771 | 0.7847 | 0.7771 | MAE | 0.8323 | 0.8383 | 0.8244 | MAE | 0.9189 | 0.9067 | 0.8766 |
| EVS | 0.4181 | 0.4301 | 0.4410 | EVS | 0.2570 | 0.2628 | 0.2725 | EVS | 0.3518 | 0.3468 | 0.3763 |
Note: In Table A1, Table A2 and Table A3, RF, GBR, and XGBoost are the abbreviations for random forest, gradient boosting regression, and extreme gradient boosting, respectively. MSE, MAE, and EVS are the abbreviations for mean squared error, mean absolute error, and explained variance score, respectively.

Table A2.
Performance of the decision tree algorithms across different psychological score groups.
Table A2.
Performance of the decision tree algorithms across different psychological score groups.
| High-Scoring Group Psychological Recovery Indicators | Middle Group Psychological Recovery Index | Low-Scoring Group Psychological Recovery Indicators | |||||||||
| RF | GBR | XGBOOST | RF | GBR | XGBOOST | RF | GBR | XGBOOST | |||
| MSE | 0.2278 | 0.2418 | 0.2452 | MSE | 0.1479 | 0.1436 | 0.1447 | MSE | 0.2485 | 0.2524 | 0.2810 |
| MAE | 0.3661 | 0.3925 | 0.3925 | MAE | 0.3096 | 0.3012 | 0.3028 | MAE | 0.4100 | 0.4094 | 0.4291 |
| EVS | 0.3120 | 0.2697 | 0.2596 | EVS | 0.3950 | 0.4145 | 0.4095 | EVS | 0.4178 | 0.4141 | 0.3391 |
| High-Scoring Group Emotional Enhancement Indicators | Emotional Uplift Index for the Middle Group | Low-Scoring Group Emotional Uplift Indicator | |||||||||
| RF | GBR | XGBOOST | RF | GBR | XGBOOST | RF | GBR | XGBOOST | |||
| MSE | 0.2881 | 0.2930 | 0.2832 | MSE | 0.2231 | 0.2345 | 0.2438 | MSE | 0.3311 | 0.3286 | 0.3540 |
| MAE | 0.4392 | 0.4486 | 0.4446 | MAE | 0.3894 | 0.4010 | 0.4127 | MAE | 0.4512 | 0.4596 | 0.4771 |
| EVS | 0.0154 | 0.0029 | 0.0328 | EVS | 0.3040 | 0.2522 | 0.2343 | EVS | 0.0936 | 0.0997 | 0.0310 |
| High-Scoring Social Interaction Indicators | Social Interaction Indicators for the Middle Group | Low Social Interaction Score | |||||||||
| RF | GBR | XGBOOST | RF | GBR | XGBOOST | RF | GBR | XGBOOST | |||
| MSE | 0.2214 | 0.2313 | 0.2345 | MSE | 0.2127 | 0.2185 | 0.2194 | MSE | 0.3482 | 0.3805 | 0.3789 |
| MAE | 0.3566 | 0.3782 | 0.3801 | MAE | 0.4392 | 0.4498 | 0.4512 | MAE | 0.4572 | 0.4841 | 0.4891 |
| EVS | 0.3188 | 0.2901 | 0.2810 | EVS | 0.1067 | 0.0820 | 0.0774 | EVS | 0.0699 | 0.0323 | 0.0121 |

Table A3.
Performance of the decision tree algorithms across the five clustered spatial zones.
Table A3.
Performance of the decision tree algorithms across the five clustered spatial zones.
| Psychological Recovery Indicators in the First Cluster Space | Emotional Uplift Index in the First Cluster Space | Social Interaction Indicators in the First Cluster Space | |||||||||
| RF | GBR | XGBOOST | RF | GBR | XGBOOST | RF | GBR | XGBOOST | |||
| MSE | 1.6998 | 1.4832 | 1.5388 | MSE | 0.7963 | 0.8457 | 0.7491 | MSE | 0.5517 | 0.5577 | 0.6107 |
| MAE | 0.9296 | 0.9014 | 0.9056 | MAE | 0.7070 | 0.7224 | 0.6758 | MAE | 0.5940 | 0.5952 | 0.6269 |
| EVS | 0.2624 | 0.3460 | 0.3249 | EVS | 0.3735 | 0.3215 | 0.3950 | EVS | 0.5714 | 0.5667 | 0.5271 |
| Psychological Recovery Indicators in the Second Cluster Space | Emotional Uplift Index for the Second Cluster Space | Social Interaction Indicators in the Second Cluster Space | |||||||||
| RF | GBR | XGBOOST | RF | GBR | XGBOOST | RF | GBR | XGBOOST | |||
| MSE | 0.5840 | 0.5052 | 0.5200 | MSE | 0.8979 | 0.9816 | 0.9907 | MSE | 0.7278 | 0.7502 | 0.6861 |
| MAE | 0.5771 | 0.5339 | 0.5345 | MAE | 0.7662 | 0.8108 | 0.8225 | MAE | 0.6907 | 0.7006 | 0.6601 |
| EVS | 0.3362 | 0.4336 | 0.4142 | EVS | 0.2224 | 0.1461 | 0.6540 | EVS | 0.3803 | 0.3551 | 0.4008 |
| Spatial Psychological Recovery Indicators for the Third Cluster | Emotional Uplift Indicators in the Third Cluster Space | Social Interaction Indicators in the Third Cluster Space | |||||||||
| RF | GBR | XGBOOST | RF | GBR | XGBOOST | RF | GBR | XGBOOST | |||
| MSE | 0.8536 | 0.8160 | 0.8264 | MSE | 1.8100 | 1.1136 | 2.0084 | MSE | 1.0347 | 1.0429 | 1.0637 |
| MAE | 0.7229 | 0.6859 | 0.6899 | MAE | 1.1481 | 1.0970 | 1.2264 | MAE | 0.7102 | 0.7126 | 0.7206 |
| EVS | 0.5772 | 0.6175 | 0.5864 | EVS | 0.2593 | 0.3033 | 0.1832 | EVS | 0.4113 | 0.4233 | 0.4094 |
| Psychological Recovery Indicators in the Fourth Cluster Space | Emotional Uplift Indicators in the Fourth Cluster Space | Social Interaction Indicators in the Fourth Cluster Space | |||||||||
| RF | GBR | XGBOOST | RF | GBR | XGBOOST | RF | GBR | XGBOOST | |||
| MSE | 0.7840 | 0.7780 | 0.8003 | MSE | 1.0621 | 1.1955 | 1.2770 | MSE | 0.9014 | 1.0674 | 1.0196 |
| MAE | 0.6603 | 0.6613 | 0.6680 | MAE | 0.8152 | 0.8670 | 0.8859 | MAE | 0.7860 | 0.8200 | 0.7709 |
| EVS | 0.5468 | 0.5565 | 0.5413 | EVS | 0.2065 | 0.1152 | 0.0484 | EVS | 0.3548 | 0.2368 | 0.2694 |
| Psychological Recovery Indicators in the Fifth Cluster Space | Emotional Uplift Index for the Fifth Cluster Space | Social Interaction Indicators in the Fifth Cluster Space | |||||||||
| RF | GBR | XGBOOST | RF | GBR | XGBOOST | RF | GBR | XGBOOST | |||
| MSE | 0.7541 | 0.8328 | 0.8158 | MSE | 0.7957 | 0.8381 | 0.8471 | MSE | 1.0303 | 0.8879 | 0.8781 |
| MAE | 0.7072 | 0.7297 | 0.7342 | MAE | 0.7114 | 0.7229 | 0.7225 | MAE | 0.8566 | 0.7599 | 0.7483 |
| EVS | 0.4681 | 0.4127 | 0.4227 | EVS | 0.2428 | 0.1935 | 0.1843 | EVS | 0.2732 | 0.3577 | 0.3663 |
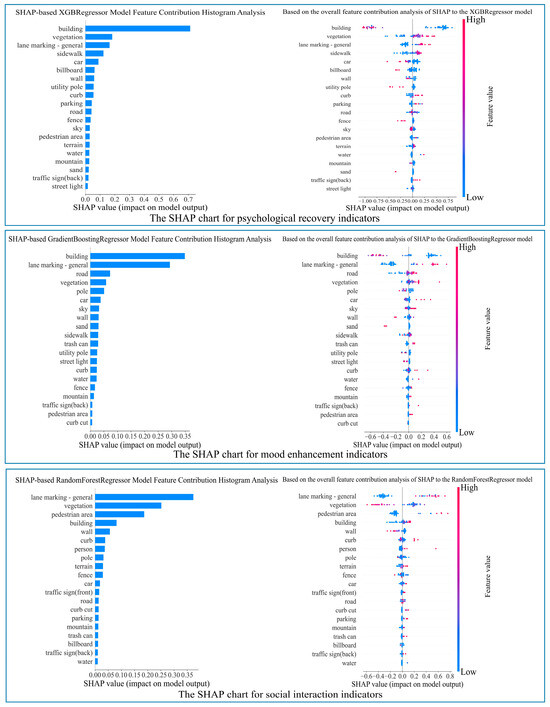
Figure A1.
SHAP value analysis of the semantic image features for the three psychological dimensions in the first clustered space.
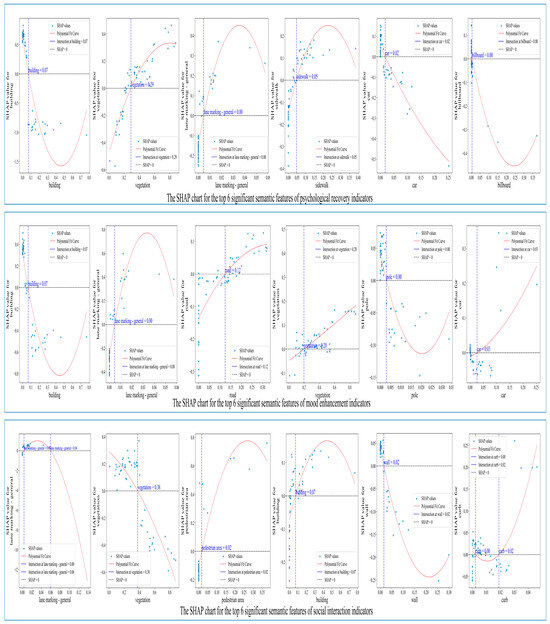
Figure A2.
Impact patterns of the top-ranked semantic features for the three psychological dimensions in the first clustered space.
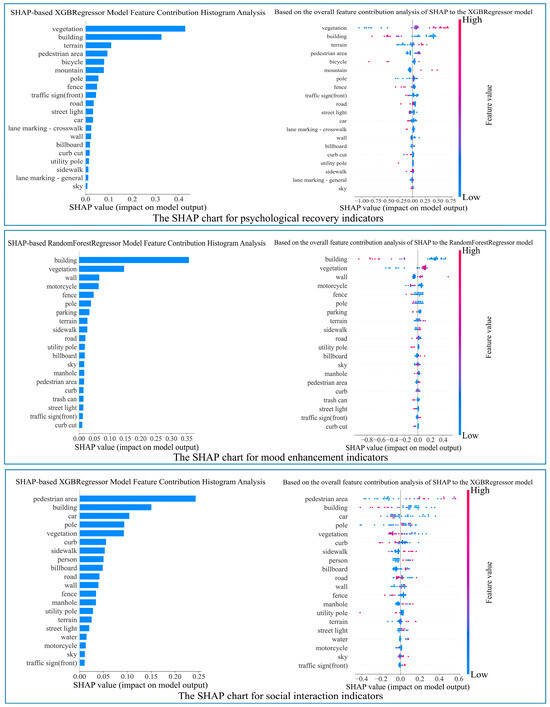
Figure A3.
SHAP value analysis of the semantic image features for the three psychological dimensions in the second clustered space.
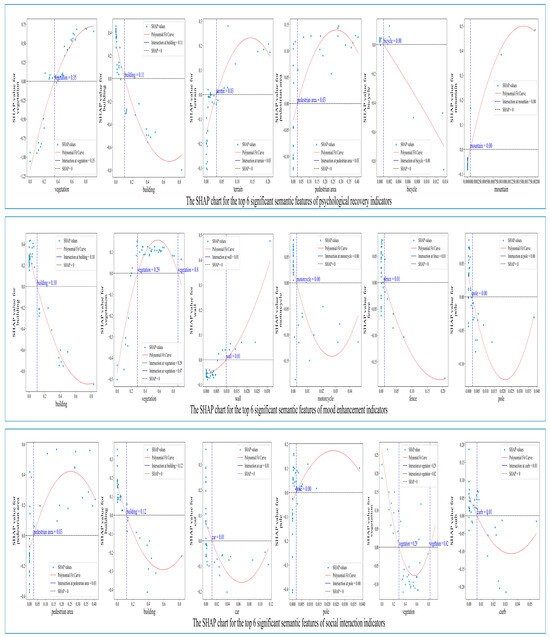
Figure A4.
Impact patterns of the top-ranked semantic features for the three psychological dimensions in the second clustered space.
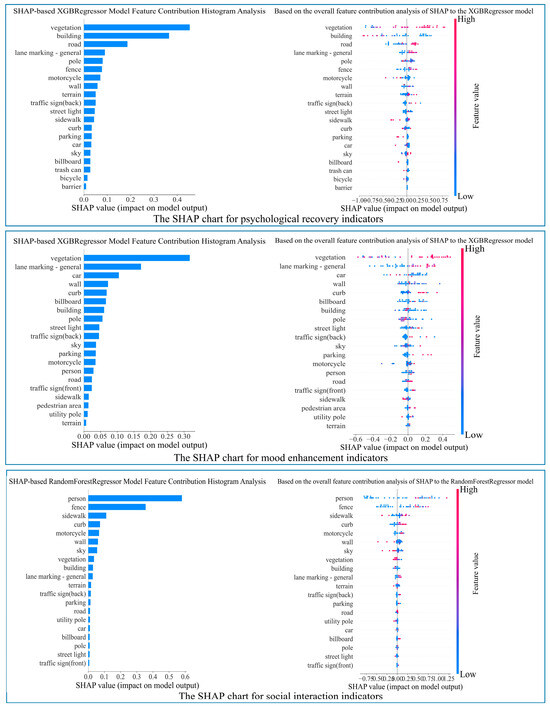
Figure A5.
SHAP value analysis of the semantic image features for the three psychological dimensions in the third clustered space.
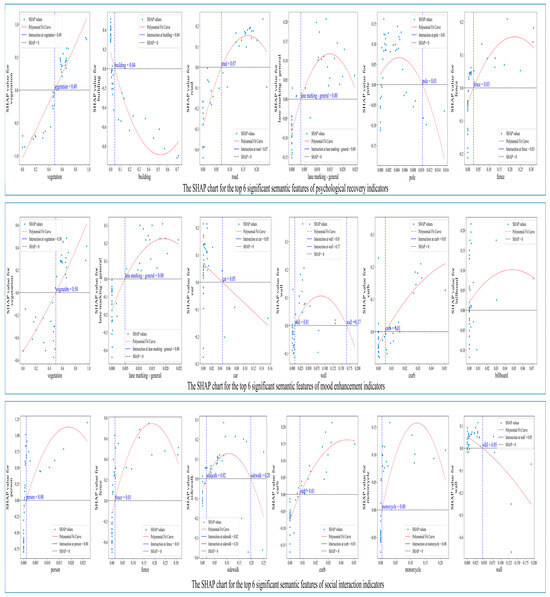
Figure A6.
Impact patterns of the top-ranked semantic features for the three psychological dimensions in the third clustered space.
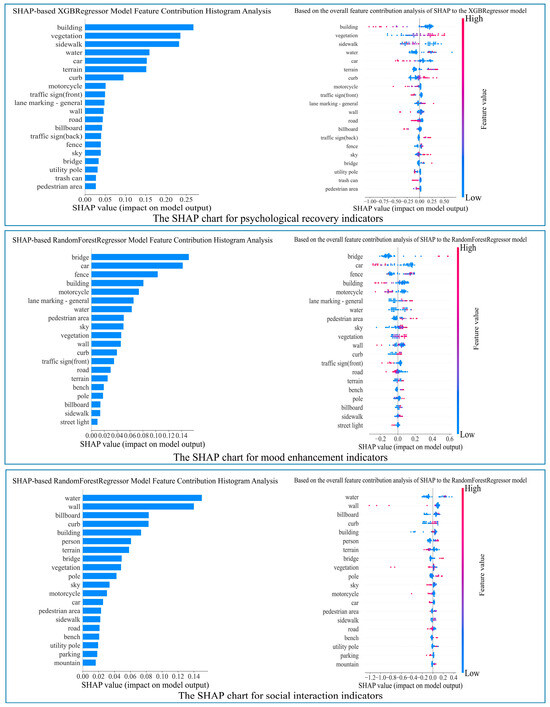
Figure A7.
SHAP value analysis of the image semantic features under the three psychological indicators in the fourth clustered space.
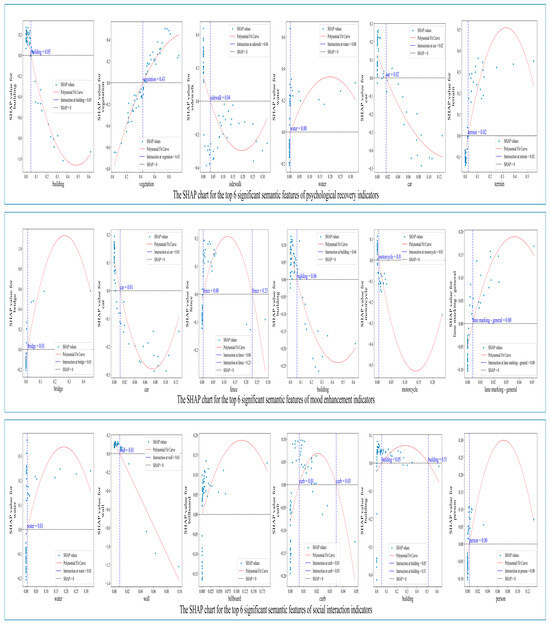
Figure A8.
Impact patterns of the top-ranked semantic features for the three psychological dimensions in the fourth clustered space.
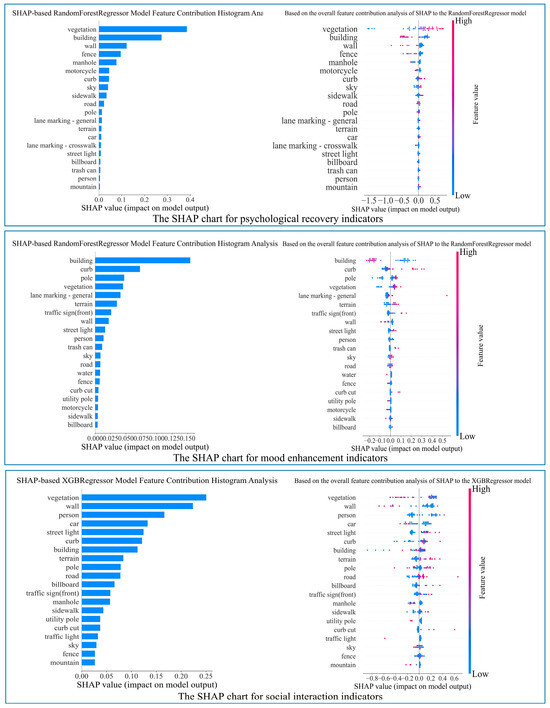
Figure A9.
SHAP value analysis of the image semantic features under the three psychological indicators in the fifth clustered space.
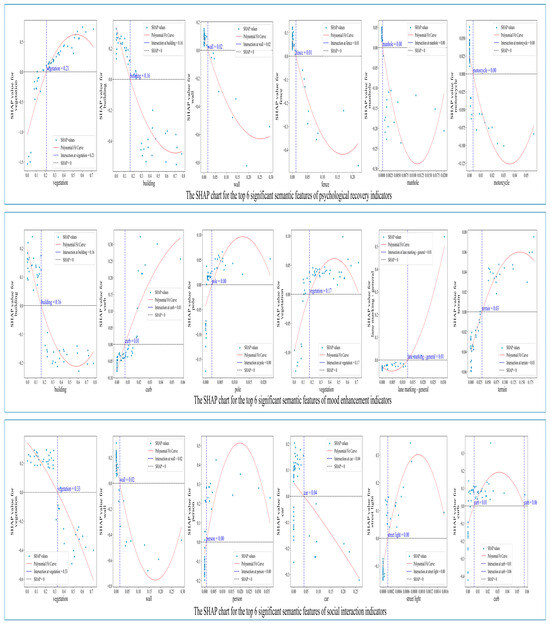
Figure A10.
Influence patterns of the top-ranked semantic features under the three psychological indicators in the fifth clustered space.

Table A4.
Multiple linear regression results for the first spatial cluster (Ecological Scientific Practice Space).
Table A4.
Multiple linear regression results for the first spatial cluster (Ecological Scientific Practice Space).
| Psychological Recovery | Mood Improvement | Social Interaction | |||
|---|---|---|---|---|---|
| Fence | −3.3268 *** (0.000552) | Wall | −5.369 *** (0.0016) | Person | 73.3060 *** (0.000577) |
| Wall | −6.9987 *** (0.000109) | Sand | −14.2 *** (0.0002) | Lane marking— Crosswalk | 6.7824 *** (0.00968) |
| Sand | −15.8654 *** (0.000114) | Water | 4.9 ** (0.0445) | Mountain | −4.6514 ** (0.0156) |
| Utility pole | −52.4433 *** (0.004206) | Billboard | −4.611 ** (0.0437) | Traffic light | 225.5039 ** (0.0283) |
| Adjusted R-squared | 0.467 | Adjusted R-squared | 0.284 | Adjusted R-squared | 0.387 |
| F-statistic | 12.7 | F-statistic | 7.232 | F-statistic | 9.427 |
Note: *** indicates significance at the 1% significance level, ** indicates significance at the 5% significance level.

Table A5.
Multiple linear regression results for the second spatial cluster (Ecological Landscape Exhibition Space).
Table A5.
Multiple linear regression results for the second spatial cluster (Ecological Landscape Exhibition Space).
| Psychological Recovery | Mood Improvement | Social Interaction | |||
|---|---|---|---|---|---|
| Bike lane | −10.405 *** (0.043) | Bike lane | −13.6983 ** (0.0076135) | Wall | 7.026 ** (0.027) |
| Terrain | 3.969 *** (5.54 × 10⁻⁵) | Terrain | 1.9371 *** (0.0462826) | Bike lane | −13.698 *** (0.008) |
| Vegetation | 3.594 *** (1.13 × 10⁻¹⁸) | Traffic sign (front) | 92.7601 *** (0.0188831) | Terrain | 1.937 ** (0.046) |
| Water | 1.788 ** (0.0496) | Utility pole | −90.562 ** (0.033) | ||
| Utility pole | −90.563 ** (0.0331) | Bicycle | −26.103 *** (0.007) | ||
| Bicycle | −26.103 *** (0.00704) | Traffic sign (front) | 92.76 ** (0.019) | ||
| Bench | 137.322 ** (0.041) | ||||
| Curb | −22.034 ** (0.017) | ||||
| Adjusted R-squared | 0.459 | Adjusted R-squared | 0.296 | Adjusted R-squared | 0.163 |
| F-statistic: | 9.098 | F-statistic: | 5.006 | F-statistic: | 2.858 |
Note: *** indicates significance at the 1% significance level, ** indicates significance at the 5% significance level.

Table A6.
Multiple linear regression results for the third spatial cluster (Commuting Circulation Space).
Table A6.
Multiple linear regression results for the third spatial cluster (Commuting Circulation Space).
| Psychological Recovery | Mood Improvement | Social Interaction | |||
|---|---|---|---|---|---|
| Barrier | −167.8697 *** (0.0091) | Lane marking— General | 40.2382 *** (7.94 × 10⁻⁵) | Fence | 5.6208 ** (1.78 × 10⁻⁵) |
| Terrain | 5.2990 *** (0.0009) | Manhole | −127.0590 ** (0.0117765) | Wall | −4.9034 *** (0.007509) |
| Trash can | −15.8654 *** (0.0373) | Car | −4.7413 ** (0.0105782) | Sidewalk | 3.7862 ** (0.014283) |
| Car | −52.4433 *** (0.0083) | Person | 47.3537 ** (6.26 × 10⁻⁵) | ||
| Utility pole | −38.2084 *** (0.022986) | ||||
| Traffic sign (back) | 425.1233 ** (0.028697) | ||||
| Adjusted R-squared | 0.459 | Adjusted R-squared | 0.223 | Adjusted R-squared | 0.389 |
| F-statistic: | 9.271 | F-statistic: | 3.790 | F-statistic: | 4.752 |
Note: *** indicates significance at the 1% significance level, ** indicates significance at the 5% significance level.

Table A7.
Multiple linear regression results for the fourth clustered space (Composite Leisure Landscape Space).
Table A7.
Multiple linear regression results for the fourth clustered space (Composite Leisure Landscape Space).
| Psychological Recovery | Mood Improvement | Social Interaction | |||
|---|---|---|---|---|---|
| Wall | −6.741 ** (0.0047) | Bird | 10898.9500 ** (0.0223) | Wall | −13.0500 *** (0.0) |
| Billboard | −7.363 *** (0.0155) | Wall | −7.2868 *** (0.0060) | Bridge | 2.3327 *** (0.008) |
| Utility pole | −45.488 *** (0.0039) | Utility pole | −40.5835 ** (0.0189) | Sand | −101.3829 ** (0.0189) |
| Car | −10.098 ** (9.43 × 10⁻¹⁴) | Traffic sign (front) | −69.1259 ** (0.0292) | Pole | 12.6919 ** (0.0454) |
| Motorcycle | −5.972 * (0.0419) | ||||
| Adjusted R-squared | 0.406 | Adjusted R-squared | 0.161 | Adjusted R-squared | 0.195 |
| F-statistic | 8.766 | F-statistic | 2.885 | F-statistic | 3.458 |
Note: *** indicates significance at the 1% significance level, ** indicates significance at the 5% significance level, * indicates significance at the 10% significance level.

Table A8.
Multiple linear regression results for the fifth clustered space (Multi-Functional Social Interaction Space).
Table A8.
Multiple linear regression results for the fifth clustered space (Multi-Functional Social Interaction Space).
| Psychological Recovery | Mood Improvement | Social Interaction | |||
|---|---|---|---|---|---|
| Lane marking—general | 17.8247 *** (0.0033) | Building | −1.2294 ** (0.0110) | Bike lane | 2.96 × 10⁻¹² ** (0.0070) |
| Manhole | −54.8303 *** (0.0019) | Water | −12.8585 ** (0.0256) | Street light | 383.5750 *** (0.0213) |
| Traffic light | −1206.2617 ** (0.0056) | ||||
| Ground animal | −1.65 × 10⁻¹¹ ** (0.0341) | ||||
| Adjusted R-squared | 0.427 | Adjusted R-squared | 0.154 | Adjusted R-squared | 0.236 |
| F-statistic | 9.888 | F-statistic | 2.895 | F-statistic | 4.074 |
Note: *** indicates significance at the 1% significance level, ** indicates significance at the 5% significance level.
References
- Hajrasouliha, A. Campus score: Measuring university campus qualities. Landsc. Urban Plan. 2017, 158, 166–176. [Google Scholar] [CrossRef]
- Soares, I.; Weitkamp, G.; Yamu, C. Public spaces as knowledge-scapes: Understanding the relationship between the built environment and creative encounters at Dutch university campuses and science parks. Int. J. Environ. Res. Public Health 2020, 17, 7421. [Google Scholar] [CrossRef]
- Van den Berg, A.E.; Jorgensen, A.; Wilson, E.R. Evaluating restoration in urban green spaces: Does setting type make a difference? Landsc. Urban Plan. 2014, 127, 173–181. [Google Scholar] [CrossRef]
- Hipp, J.A.; Gulwadi, G.B.; Alves, S.; Sequeira, S. The relationship between perceived greenness and perceived restorativeness of university campuses and student-reported quality of life. Environ. Behav. 2016, 48, 1292–1308. [Google Scholar] [CrossRef]
- Rapoport, A. Culture, Architecture, and Design, 1st ed.; Locke Science Publishing Company: New York, NY, USA, 2005; pp. 154–196. [Google Scholar]
- Aydin, D.; Ter, U. Outdoor space quality: Case study of a university campus plaza. Archnet-IJAR Int. J. Archit. Res. 2008, 2, 189–203. [Google Scholar]
- Abu-Ghazzeh, T.M. Communicating behavioral research to campus design: Factors affecting the perception and use of outdoor spaces at the University of Jordan. Environ. Behav. 1999, 31, 764–804. [Google Scholar] [CrossRef]
- Kaplan, R.; Kaplan, S.; Ryan, R.L. People Places: Design Guidelines for Urban Open Space, 1st ed.; John Wiley & Sons: New York, NY, USA, 1997; pp. 154–196. [Google Scholar]
- Zhang, J.; Li, Y. The impact of campus outdoor space features on students’ emotions based on the emotion map. Int. J. Environ. Res. Public Health 2023, 20, 4277. [Google Scholar] [CrossRef]
- Alserry, S.T.; ElGohary, A.S. The impact of campus sustainable outdoor spaces quality on students’ social needs, behavior, and satisfaction. Int. J. Eng. Mod. Sci. 2024, 3, 24014. [Google Scholar]
- Hasan, N.; Hijazi, I.; Enab, D.; Qanazi, S.; Shahrour, I.; Al-Qadi, H.; Qamhieh, K. Influence of campus outdoor spaces on students’ behavior: Enhancing social interaction and learning at An-Najah University. An-Najah Univ. J. Res. A (Nat. Sci.) 2024, 39, 125–136. [Google Scholar] [CrossRef]
- Kim, W. Effects of students’ perceived safety of public outdoor environment on academic achievement at university campus. Archit. Res. 2015, 17, 13–20. [Google Scholar] [CrossRef]
- Peker, E.; Ataöv, A. Exploring how campus open space design influences students’ learning experiences. Landsc. Res. 2020, 45, 310–326. [Google Scholar] [CrossRef]
- Coulson, J.; Roberts, P.; Taylor, I. University Planning and Architecture: The Search for Perfection, 1st ed.; Routledge: London, UK, 2015; pp. 154–196. [Google Scholar]
- Williams, D.R.; Patterson, M.E. Place, Leisure, and Well-Being, in Sense of Place, Health and Quality of Life; Routledge: London, UK, 2016; pp. 125–140. [Google Scholar]
- Dolan, P.; Metcalfe, R. The relationship between innovation and subjective well-being. Res. Policy 2012, 41, 1489–1498. [Google Scholar] [CrossRef]
- Sheldon, E.; Simmonds-Buckley, M.; Bone, C.; Mascarenhas, T.; Chan, N.; Wincott, M.; Gleeson, H.; Sow, K.; Hind, D.; Barkham, M. Prevalence and risk factors for mental health problems in university undergraduate students: A systematic review with meta-analysis. J. Affect. Disord. 2021, 287, 282–292. [Google Scholar] [CrossRef]
- Gulwadi, G.B.; Mishchenko, E.D.; Hallowell, G.; Alves, S.; Kennedy, M. The restorative potential of a university campus: Objective greenness and student perceptions in Turkey and the United States. Landsc. Urban Plan. 2019, 187, 36–46. [Google Scholar] [CrossRef]
- Speake, J.; Edmondson, S.; Nawaz, H. Everyday encounters with nature: Students’ perceptions and use of university campus green spaces. Hum. Geogr.-J. Stud. Res. Hum. Geogr. 2013, 7, 21–31. [Google Scholar] [CrossRef]
- Guo, L.N.; Zhao, R.L.; Ren, A.H.; Niu, L.-X.; Zhang, Y.-L. Stress recovery of campus street trees as visual stimuli on graduate students in autumn. Int. J. Environ. Res. Public Health 2020, 17, 148. [Google Scholar] [CrossRef] [PubMed]
- Hami, A.; Abdi, B. Students’ landscaping preferences for open spaces for their campus environment. Indoor Built Environ. 2021, 30, 87–98. [Google Scholar] [CrossRef]
- Lee, J.; Kim, D.; Park, J. A machine learning and computer vision study of the environmental characteristics of streetscapes that affect pedestrian satisfaction. Sustainability 2022, 14, 5730. [Google Scholar] [CrossRef]
- Zhou, H.; He, S.; Cai, Y.; Wang, M.; Su, S. Social inequalities in neighborhood visual walkability: Using street view imagery and deep learning technologies to facilitate healthy city planning. Sustain. Cities Soc. 2019, 50, 101605. [Google Scholar] [CrossRef]
- Zhao, Y.; Liu, J.H.; Zheng, Y.L. Preservation and renewal: A study on visual evaluation of urban historical and cultural street landscape in Quanzhou. Sustainability 2022, 14, 8775. [Google Scholar] [CrossRef]
- Meng, Y.; Li, Q.; Ji, X.; Yu, Y.; Yue, D.; Gan, M.; Wang, S.; Niu, J.; Fukuda, H. Research on campus space features and visual quality based on street view images: A case study on the Chongshan campus of Liaoning University. Buildings 2023, 13, 1332. [Google Scholar] [CrossRef]
- Qin, Y.; Wu, X.; Yu, T.; Jiang, S.; Zhu, B. Enhancing student-centered walking environments on university campuses through street view imagery and machine learning. PLoS ONE 2025, 20, e0321028. [Google Scholar] [CrossRef]
- Ma, H.; Xu, Q.; Zhang, Y. High or low? Exploring the restorative effects of visual levels on campus spaces using machine learning and street view imagery. Urban For. Urban Green. 2023, 88, 128087. [Google Scholar] [CrossRef]
- Wu, T.; Lin, D.; Chen, Y.; Wu, J. Integrating street view images, deep learning, and sDNA for evaluating university campus outdoor public spaces: A focus on restorative benefits and accessibility. Land 2025, 14, 610. [Google Scholar] [CrossRef]
- Zhang, J.; Hu, A. Analyzing green view index and green view index best path using Google street view and deep learning. J. Comput. Des. Eng. 2022, 9, 2010–2023. [Google Scholar] [CrossRef]
- Wei, J.; Yue, W.; Li, M.; Gao, J. Mapping Human Perception of Urban Landscape from Street-View Images: A Deep-Learning Approach. Int. J. Appl. Earth Obs. Geoinf. 2022, 112, 102886. [Google Scholar] [CrossRef]
- He, Y.Y. Overview of image semantic segmentation based on deep learning. Chang. Inf. Commun. 2023, 36, 77–79. [Google Scholar]
- Garré, S.; Meeus, S.; Gulinck, H. The dual role of roads in the visual landscape: A case-study in the area around Mechelen (Belgium). Landsc. Urban Plan. 2009, 92, 125–135. [Google Scholar] [CrossRef]
- Xia, Y.; Yabuki, N.; Fukuda, T. Sky view factor estimation from street view images based on semantic segmentation. Urban Clim. 2021, 40, 100999. [Google Scholar] [CrossRef]
- Li, P.; Khan, J. Feature extraction and analysis of landscape imaging using drones and machine vision. Soft Comput. 2023, 27, 18529–18547. [Google Scholar] [CrossRef]
- Koning, M.; Kim, J.H.; Saeidi-Rizi, F.; Durst, N. The role of the campus outdoor environment on university student mental health. J. People Plants Environ. 2022, 25, 263–272. [Google Scholar] [CrossRef]
- Pretty, J.; Peacock, J.; Sellens, M.; Griffin, M. The mental and physical health outcomes of green exercise. Int. J. Environ. Health Res. 2005, 15, 319–337. [Google Scholar] [CrossRef]
- Kaplan, R.; Kaplan, S. The Experience of Nature: A Psychological Perspective, 1st ed.; Cambridge University Press: Cambridge, UK, 1989; pp. 154–196. [Google Scholar]
- Ulrich, R.S. Aesthetic and Affective Response to Natural Environment. In Behavior and the Natural Environment; Altman, I., Wohlwill, J.F., Eds.; Springer: Boston, MA, USA, 1983; pp. 85–125. [Google Scholar]
- Ulrich, R.S.; Simons, R.F.; Losito, B.D.; Fiorito, E.; Miles, M.A.; Zelson, M. Stress recovery during exposure to natural and urban environments. J. Environ. Psychol. 1991, 11, 201–230. [Google Scholar] [CrossRef]
- Park, B.J.; Tsunetsugu, Y.; Kasetani, T.; Miyazaki, Y. The physiological effects of Shinrin-yoku (taking in the forest atmosphere or forest bathing): Evidence from field experiments in 24 forests across Japan. Environ. Health Prev. Med. 2010, 15, 18–26. [Google Scholar] [CrossRef]
- Antonelli, M.; Barbieri, G.; Donelli, D. Effects of forest bathing (shinrin-yoku) on levels of cortisol as a stress biomarker: A systematic review and meta-analysis. Int. J. Biometeorol. 2019, 63, 1117–1134. [Google Scholar] [CrossRef] [PubMed]
- Berman, M.G.; Jonides, J.; Kaplan, S. The cognitive benefits of interacting with nature. Psychol. Sci. 2008, 19, 1207–1212. [Google Scholar] [CrossRef]
- Tyrväinen, L.; Ojala, A.; Korpela, K.; Lanki, T.; Tsunetsugu, Y.; Kagawa, T. The influence of urban green environments on stress relief measures: A field experiment. J. Environ. Psychol. 2014, 38, 1–9. [Google Scholar] [CrossRef]
- Wilson, E.O. Biophilia, 1st ed.; Harvard University Press: Cambridge, MA, USA, 1986; pp. 154–196. [Google Scholar]
- Fischer, C.S. Widespread Likings: The Biophilia Hypothesis. Science 1994, 263, 1161–1162. [Google Scholar] [CrossRef]
- Kweon, B.S.; Sullivan, W.C.; Wiley, A.R. Green common spaces and the social integration of inner-city older adults. Environ. Behav. 1998, 30, 832–858. [Google Scholar] [CrossRef]
- Hattie, J.; Marsh, H.W.; Neill, J.T.; Richards, G.E. Adventure education and Outward Bound: Out-of-class experiences that make a lasting difference. Rev. Educ. Res. 1997, 67, 43–87. [Google Scholar] [CrossRef]
- Pasini, M.; Berto, R.; Brondino, M.; Hall, R.; Ortner, C. How to Measure the Restorative Quality of Environments: The PRS-11. Procedia Soc. Behav. Sci. 2014, 159, 293–297. [Google Scholar] [CrossRef]
- Watson, D.; Clark, L.A.; Tellegen, A. Development and validation of brief measures of positive and negative affect: The PANAS scales. J. Pers. Soc. Psychol. 1988, 54, 1063. [Google Scholar] [CrossRef]
- Xiao, S. Theoretical basis and research application of social support rating scale. J. Clin. Psychiatry 1994, 4, 98. [Google Scholar]
- Biljecki, F.; Ito, K. Street view imagery in urban analytics and GIS: A review. Landsc. Urban Plan. 2021, 215, 104217. [Google Scholar] [CrossRef]
- Cheng, B.; Misra, I.; Schwing, A.G.; Kirillov, A.; Girdhar, R. Masked-attention mask transformer for universal image segmentation. In Proceedings of the 2022 IEEE/CVF Conference on Computer Vision and Pattern Recognition (CVPR), New Orleans, LA, USA, 18–24 June 2022; pp. 1290–1299. [Google Scholar]
- Zhou, B.; Zhao, H.; Puig, X.; Xiao, T.; Fidler, S.; Barriuso, A.; Torralba, A. Semantic understanding of scenes through the ADE20K dataset. Int. J. Comput. Vis. 2019, 127, 302–321. [Google Scholar] [CrossRef]
- Neuhold, G.; Ollmann, T.; Rota Bulo, S.; Kontschieder, P. The mapillary vistas dataset for semantic understanding of street scenes. In Proceedings of the IEEE International Conference on Computer Vision, Venice, Italy, 22–29 October 2017; pp. 4990–4999. [Google Scholar]
- Kim, J.; Lee, D. Comparative Study on Hyperparameter Tuning for Predicting Concrete Compressive Strength. Buildings 2025, 15, 2173. [Google Scholar] [CrossRef]
- Maroof, A.; Karballaeezadeh, N.; Mohammadzadeh, S.D.; Mirzaei, H. Prediction of the wetting-induced compression of collapsible soils using ensemble machine learning. Indian Geotech. J. 2025. [Google Scholar] [CrossRef]
- Schaik, P.v.; Clements, H.; Karayaneva, Y.; Imani, E.; Knowles, M.; Vall, N.; Cotton, M. Using Machine Learning to Model the Acceptance of Domestic Low-Carbon Technologies. Sustainability 2025, 17, 6668. [Google Scholar] [CrossRef]
- Lundberg, S.M.; Lee, S.-I. A Unified Approach to Interpreting Model Predictions. In Proceedings of the Advances in Neural Information Processing Systems, Long Beach, CA, USA, 4–9 December 2017; Volume 30. [Google Scholar]
- Lundberg, S.M.; Erion, G.; Chen, H.; DeGrave, A.; Prutkin, J.M.; Nair, B.; Katz, R.; Himmelfarb, J.; Bansal, N.; Lee, S.-I. From local explanations to global understanding with explainable AI for trees. Nat. Mach. Intell. 2020, 2, 56–67. [Google Scholar] [CrossRef]
- Chai, T.; Draxler, R.R. Root mean square error (RMSE) or mean absolute error (MAE)?—Arguments against avoiding RMSE in the literature. Geosci. Model Dev. 2014, 7, 1247–1250. [Google Scholar] [CrossRef]
- MacQueen, J. Some Methods for Classification and Analysis of Multivariate Observations. In Proceedings of the Berkeley Symposium on Mathematical Statistics and Probability, Berkeley, CA, USA, 21 June–18 July 1965; pp. 281–297. [Google Scholar]
- Chen, S.; Chen, Z.; Hong, J.; Zhuang, X.; Su, C.; Ding, Z. Exploring the Relationship Between Audio-Visual Perception in Fuzhou Universities and College Students’ Attention Restoration Quality Using Machine Learning. Front. Psychol. 2023, 16, 1572426. [Google Scholar] [CrossRef]
- Jodas, D.S.; Pierezan, J.; Lima, M.; Nakamura, R.Y.M.; Papa, J.P. Detection of Trees on Street-View Images Using a Convolutional Neural Network. Int. J. Neural Syst. 2022, 32, 2150042. [Google Scholar] [CrossRef] [PubMed]
- Mathivanan, S.K.; Rajadurai, H.; Cho, J.; Kim, M.; Gwak, J.; Rho, S. A Multi-Modal Geospatial–Temporal LSTM Based Deep Learning Framework for Predictive Modeling of Urban Mobility Patterns. Sci. Rep. 2024, 14, 31579. [Google Scholar]
- Guo, W.; Wen, H.; Liu, X. Research on the psychologically restorative effects of campus common spaces from the perspective of health. Front. Public Health 2023, 11, 1131180. [Google Scholar] [CrossRef]
- Liu, K.; Zhang, L.; Tsou, S.; Wang, L.; Hu, Y.; Yang, K. Exploring the complex association between urban built environment, sociodemographic characteristics and crime: Evidence from Washington, DC. Land 2024, 13, 1886. [Google Scholar] [CrossRef]
- Bratman, G.N.; Hamilton, J.P.; Hahn, K.S.; Daily, G.C.; Gross, J.J. Nature Experience Reduces Rumination and Subgenual Prefrontal Cortex Activation. Proc. Natl. Acad. Sci. USA 2015, 112, 8567–8572. [Google Scholar] [CrossRef] [PubMed]
- Foellmer, J.; Kistemann, T.; Anthonj, C. Academic greenspace and well-being—Can campus landscape be therapeutic? Evidence from a German university. Wellbeing Space Soc. 2021, 2, 100003. [Google Scholar] [CrossRef]
- Liu, W.; Sun, N.; Guo, J.; Zheng, Z. Campus green spaces, academic achievement and mental health of college students. Int. J. Environ. Res. Public Health 2022, 19, 8618. [Google Scholar] [CrossRef]
- Liprini, R.M. Students’ Perceptions of Green Space on a University Campus: An Attention Restoration Theory Perspective, 1st ed.; University of Pretoria: Pretoria, South Africa, 2014; pp. 154–196. [Google Scholar]
- Bonell, C.; Parry, W.; Wells, H.; Jamal, F.; Fletcher, A.; Harden, A.; Thomas, J.; Campbell, R.; Petticrew, M.; Murphy, S.; et al. The effects of the school environment on student health: A systematic review of multi-level studies. Health Place 2013, 21, 180–191. [Google Scholar] [CrossRef]
Disclaimer/Publisher’s Note: The statements, opinions and data contained in all publications are solely those of the individual author(s) and contributor(s) and not of MDPI and/or the editor(s). MDPI and/or the editor(s) disclaim responsibility for any injury to people or property resulting from any ideas, methods, instructions or products referred to in the content. |
© 2025 by the authors. Licensee MDPI, Basel, Switzerland. This article is an open access article distributed under the terms and conditions of the Creative Commons Attribution (CC BY) license (https://creativecommons.org/licenses/by/4.0/).