Article

Mechanical Properties of EGC Incorporating Ternary Precursors

1
Key Laboratory of Special Environment Road Engineering of Hunan Province, Changsha University of Science & Technology, Changsha 410114, China
2
School of Transportation, Changsha University of Science & Technology, Changsha 410114, China
3
College of Civil and Transportation Engineering, Hohai University, Nanjing 210024, China
*
Author to whom correspondence should be addressed.
Buildings 2025, 15(16), 2919; https://doi.org/10.3390/buildings15162919
Submission received: 30 June 2025 / Revised: 1 August 2025 / Accepted: 7 August 2025 / Published: 18 August 2025

Abstract

This study investigates the composition–property relationships in ternary engineered geopolymer composites (EGCs) using a simplex centroid design method to optimize the synergy between ground granulated blast furnace slag (GGBS), fly ash (FA), and metakaolin (MK). Mechanical testing revealed that compressive strength (>85 MPa) peaked at 75% GGBS/25% MK, demonstrating MK’s dominant role in enhancing densification, while flexural strength showed a negative correlation with GGBS content but consistent improvement with MK addition. Strain-hardening behavior was most pronounced in 75% GGBS/25% MK and 83% GGBS/8% FA/8% MK mixtures, with the latter achieving optimal precursor synergy. Fiber dispersion uniformity showed a strong linear correlation (R2 = 0.98) with tensile strain capacity, confirming its critical role in strain-hardening performance. Mercury intrusion porosimetry analysis demonstrated that the G83F8M8 mixture exhibited the lowest porosity (<10%) and finest pore size distribution (50–100 nm dominant), directly linking pore refinement to superior mechanical properties.

1. Introduction

Engineered cementitious composites (ECCs), also known as strain-hardening cementitious composites (SHCCs) or ultra-high-toughness cementitious composites (UHTCCs), represent a class of high-performance fiber-reinforced cementitious materials. Developed by V.C. Li in the 1990s based on micromechanics and fracture mechanics principles, an ECC is designed by optimizing the interactions between fibers, the matrix, and the fiber/matrix interface [1,2]. ECCs exhibit strain-hardening behavior and high tensile ductility, along with exceptional crack control capabilities. When subjected to tensile strain reaching 1%, the crack width stabilizes and remains below 100 µm, preventing the ingress of water and chloride ions, thereby significantly enhancing its durability. However, the cement content in ECC typically ranges between 900 kg/m3 and 1500 kg/m3, which is approximately two to five times higher than that of conventional concrete [3,4,5]. Given that the cement industry accounts for approximately 8% of global CO2 emissions [6], the high carbon footprint of ECCs poses a major sustainability challenge. Consequently, the development of greener binder alternatives is essential for the continued advancement of ECC technology.
Engineered geopolymer composites (EGCs), also referred to as strain-hardening geopolymer composites (SHGCs), have emerged as a promising sustainable alternative to ECCs. EGCs are synthesized from aluminosilicate precursors activated by an alkaline solution and exhibit strain-hardening behavior and multiple microcracking patterns similar to ECCs. Ohno et al. [7] developed an EGC using fly ash as the precursor and polyvinyl alcohol (PVA) fibers, achieving a compressive strength of 27.6 MPa and a tensile strain capacity exceeding 4%, thereby demonstrating the feasibility of strain-hardening geopolymer composites. Huy et al. [8] utilized ground granulated blast furnace slag (GGBS) as the precursor and produced an eco-friendly ultra-high-ductility fiber-reinforced composite using a single type of activator, conducting compressive strength tests, uniaxial tensile tests, and self-healing assessments. The results indicated superior tensile performance and self-healing capabilities. Cai et al. [9] investigated the tensile and compressive properties of EGCs using metakaolin with different particle sizes as the precursor and reported a compressive strength of 35.7 MPa and a tensile strain capacity of 8%. In addition, they found that the use of fine and coarse MK powders was beneficial for tensile behavior. Lao et al. [10] designed a strain-hardening alkali-activated fly ash/slag composite (SH-AAFSC) with ultra-high compressive strength (94.4–180.7 MPa) and tensile strain capacity (8.1–9.9%) by using a high slag/FA ratio (8:2) and PE fiber. Kan et al. [11] examined the performance of fly ash-based EGC incorporating metakaolin and reinforced with PVA fibers. Their findings confirmed that the designed EGC met the energy and strength criteria required for tensile strain-hardening behavior. The differences in the mechanical properties of EGCs prepared with different types of precursors were attributed to the differences in the microstructures of the EGC mixes. For example, EGCs incorporating typical slag showed higher chemical bond strength compared to gypsum-free slag due to different geopolymer chemistry [12].
Despite the extensive research on EGCs, most studies have focused on the mechanical properties of one or two geopolymer precursors, with limited investigations on the synergetic effect of ternary geopolymer systems. This study aims to address this gap by employing the simplex centroid design method [13] to systematically evaluate the effects of different precursor compositions within a GGBS-FA-MK ternary system on the mechanical performance of EGCs. Additionally, fiber dispersion tests are conducted to analyze fiber distribution in various matrices and establish correlations with tensile strain capacity. Furthermore, mercury intrusion porosimetry (MIP) is utilized to examine the porosity and pore size distribution of different mixtures, providing insights into the influence of material composition on the microstructural and mechanical properties of EGCs.

2. Materials and Methods

2.1. Raw Materials

In this study, engineered geopolymer composites (EGCs) were synthesized using ground granulated blast furnace slag (GGBS) which was obtained from Henan Jiewei Environmental Protection Materials Co., Ltd., Jiaozuo, China, fly ash (FA) which was obtained from Henan Borun Foundry Materials Co., Ltd., Zhengzhou, China, and metakaolin (MK) which was obtained from Inner Mongolia Chaopai New Materials Co., Ltd., Hohhot, China as precursors. The chemical composition of the precursors is provided in Table 1. Quartz sand, which was produced by Henan Yixinglong Environmental Technology Co., Ltd., Zhengzhou, China, with a bulk density of 1.8 g/cm3 and a specific gravity of 2.75 g/cm3 was used as the fine aggregate. The average particle size of the quartz sand was 110 µm, with a maximum particle size of 250 µm. The mean particle sizes (D50) of MK, GGBS, and FA were 4.702 µm, 15.034 µm, and 16.669 µm, respectively. The specific surface areas of these materials were 2271 m2/kg, 731 m2/kg, and 493 m2/kg. The particle size distributions of the precursors and quartz sand are illustrated in Figure 1.
An analytical-grade sodium silicate (Na2SiO3·9H2O) produced in Tianjin Beichen Fangzheng Reagent Factory, Tianjin, China, was used as the alkaline activator. This activator had a modulus of 1.0 and a Na2O content of 21.05%. The particle size was less than 0.833 mm. Polyethylene (PE) fibers with a length of 18 mm and a diameter of 25 µm were incorporated into the mix. It was produced by Ningbo Shike New Materials Technology Co., Ltd., Ningbo, China. These fibers exhibited a tensile strength of 3.1 GPa, an elastic modulus of 122 GPa, and a density of 0.97 g/cm3.

2.2. Mixture Design

The mix proportions were designed using the simplex centroid design method [14,15,16]. The simplex centroid projection method is a mathematical technique for optimizing mixtures by systematically exploring the composition space defined by the vertices of a simplex. It projects the centroid of experimental data points onto a lower-dimensional space to identify optimal ratios, ensuring balanced interactions between components. Unlike exhaustive trial-and-error approaches, this method reduces the number of required experiments by 40–60% while maintaining accuracy, as demonstrated in stabilizer optimization studies. It quantifies the synergistic/antagonistic effects between components.
For a three-component system consisting of x1, x2, and x3, the response Y can be expressed as
Y = β1 x1 + β2 x2 + β3 x3 + β12 x1 x2 + β13 x1 x3 + β23 x2 x3 + β123 x1 x2 x3
where Y represents the response variable, βi comprises the regression coefficients, and x1, x2, and x3 denote the proportions of GGBS, FA, and MK, respectively, constrained such that x1 + x2 + x3 = 1.
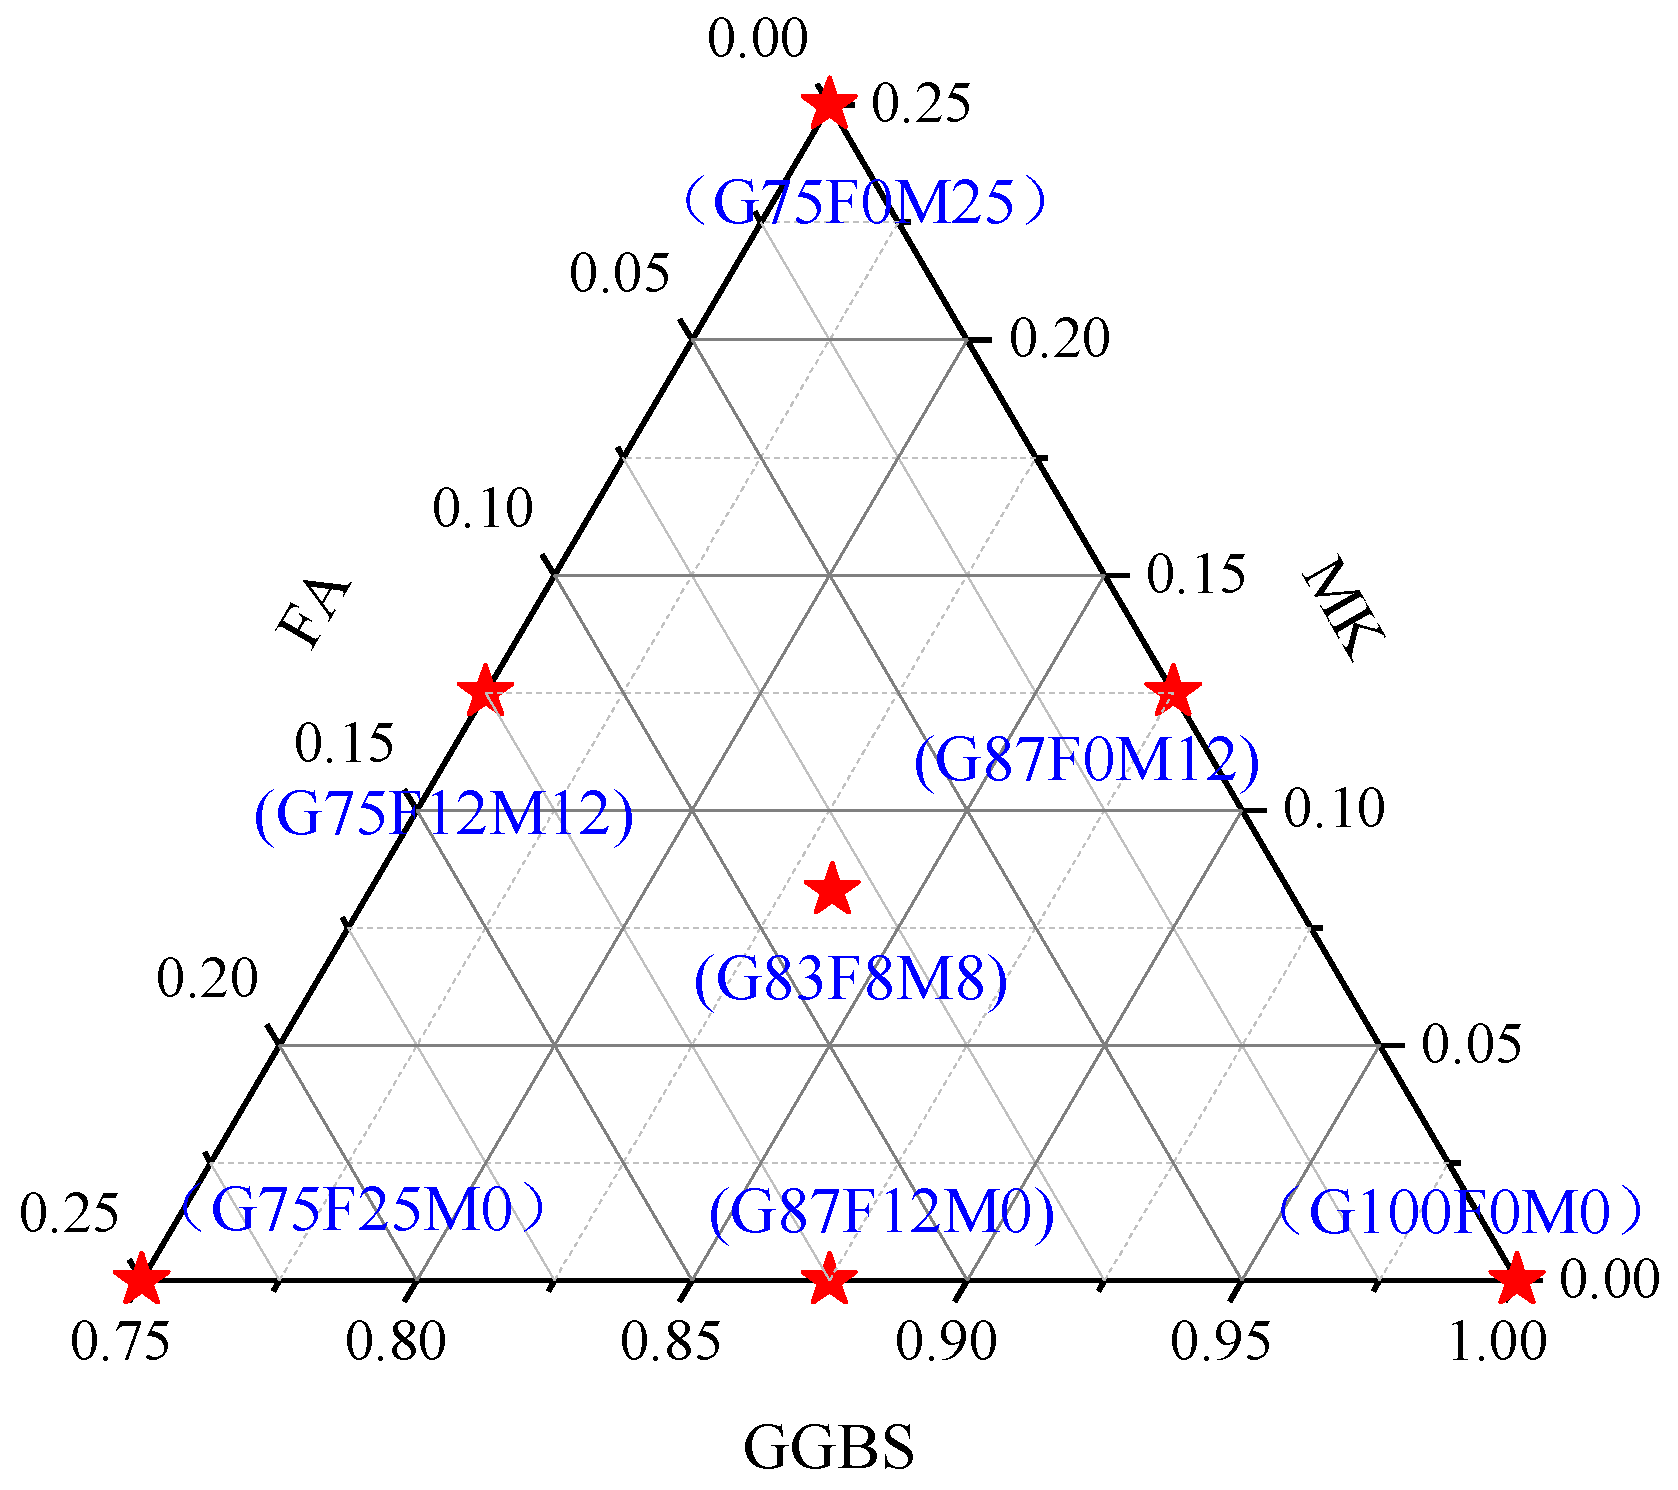
Based on preliminary investigations and pre-experiments, the GGBS content varied between 75% and 100%, while FA and MK ranged from 0% to 25%. The fine aggregate-to-precursor ratio was maintained at 0.36, and the activator dosage was controlled at an alkali equivalent of 6% (mass ratio of Na2O in the activator to the precursor mass). The value of water (0.35) represents the mass ratio of total water to the precursor, where total water includes both free water added during mixing and water molecules from Na2SiO3•9H2O. The seven mix proportions designed using this approach are listed in Table 2 and depicted in the ternary diagram in Figure 2.

2.3. Specimen Preparation

The mixing process followed a sequential approach to ensure a homogeneous dispersion of fibers. Initially, the precursors, activator, fine aggregates, and two-thirds of the PE fibers were added to a mixer and blended at a low speed for 2 min. Water was then introduced, and the mixture was stirred at high speed for an additional 3 min. Finally, the remaining one-third of the PE fibers was gradually incorporated while continuing high-speed mixing for 5 min, ensuring uniform fiber distribution without segregation or bleeding.
The fresh mixtures were cast into molds and immediately covered with plastic film. The specimens were cured at ambient temperature (20 °C ± 5 °C) for 24 h before demolding. Subsequently, they were subjected to steam curing at 80 °C for 48 h prior to testing.

2.4. Methodology

2.4.1. Compressive and Flexural Strength

Compressive and flexural strength tests were conducted in accordance with the GB/T 17671-2021 [17]. A universal testing machine was used to perform both compressive and flexural strength tests. Three prismatic specimens (40 mm × 40 mm × 160 mm) were prepared for flexural strength tests. For the compressive strength test, the size of specimens was 40 mm × 40 mm× 40 mm. The loading rate for the compressive strength test was set to 2400 N/s ± 200 N/s, while the flexural strength test was conducted at a loading rate of 50 N/s ± 10 N/s.

2.4.2. Uniaxial Tensile Strength

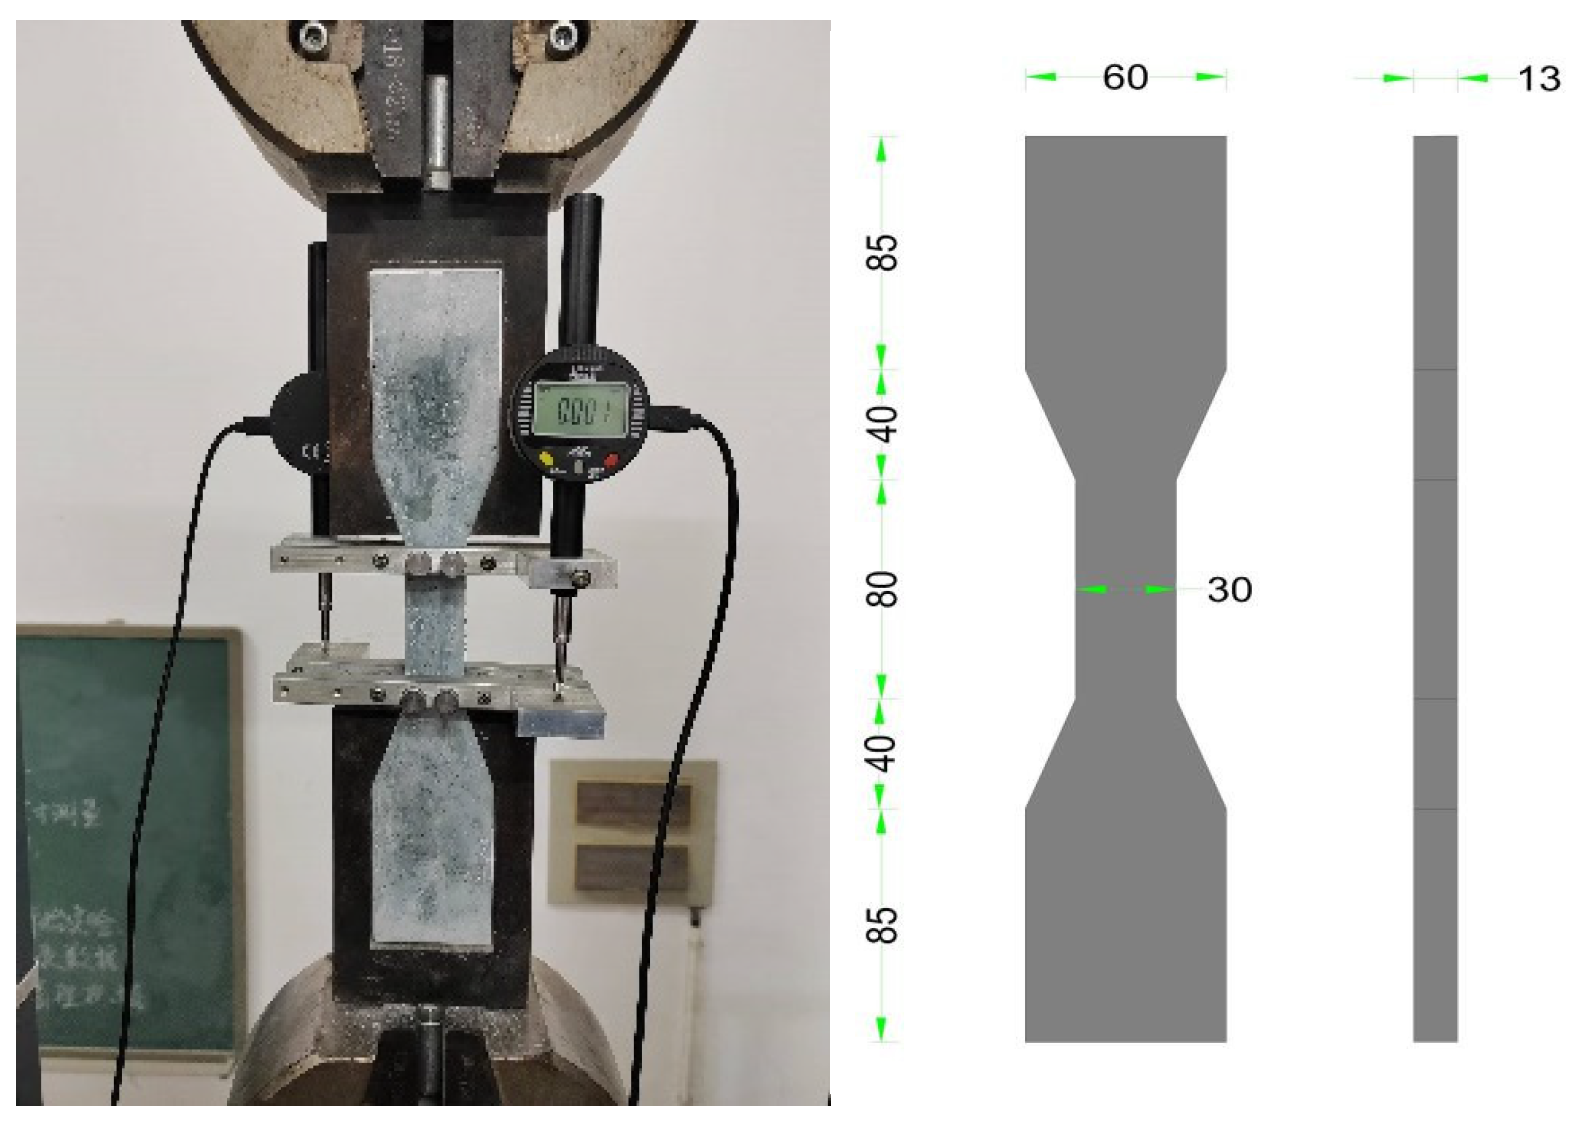
The tensile behavior of the EGC was evaluated through uniaxial tensile testing, following the Japanese Society of Civil Engineers (JSCE) recommendation for “dog bone”-shaped specimens. Figure 3 shows the dimension of the dog bone-shaped specimens and the test-set-up for uniaxial tensile strength. The tensile strength and strain capacity of the specimens are primarily governed by the core tensile zone, defined by the 80 mm gauge length. A universal tensile testing machine was used, applying displacement-controlled loading at a rate of 0.5 mm/min. Two dial gauges were attached parallel to the specimen’s lateral surfaces to measure displacement within the gauge length.

2.4.3. Fiber Dispersion Analysis

Fluorescence microscopy was employed to analyze fiber dispersion. The PE fiber showed a green point. After uniaxial tensile testing, a 5 mm thick cross-section was cut near the fracture zone perpendicular to the loading direction. The cross-section was polished using sandpaper and imaged under a fluorescence microscope equipped with an ultraviolet light source at 5× magnification. Image-Pro Plus was used to convert the fluorescence image into a binary image. Twenty images were captured for each cross-section, and the fiber dispersion coefficient (α) was calculated using Equation (2) [18,19]:
α = exp X i X a v e r a g e 1 2 N
where α represents the fiber dispersion coefficient (ranging from 0 to 1, with higher values indicating more uniform dispersion), N is the number of images, Xi is the fiber count in the i-th image, and Xaverage is the average fiber count per image.

2.4.4. Mercury Intrusion Porosimetry (MIP)

The pore structure of the EGC matrix was analyzed using MIP. A Quantachrome mercury porosimeter (Quantachrome Instruments Corporation, Boynton Beach, FL, USA) was used for testing at a pressure range of 5–30,000 PSI. The cured specimens were crushed into approximately 5 mm sized fragments and soaked in ethanol to terminate hydration. Prior to testing, the samples were oven-dried in a vacuum chamber until a constant weight was achieved.

3. Results and Discussion

3.1. Compressive Strength

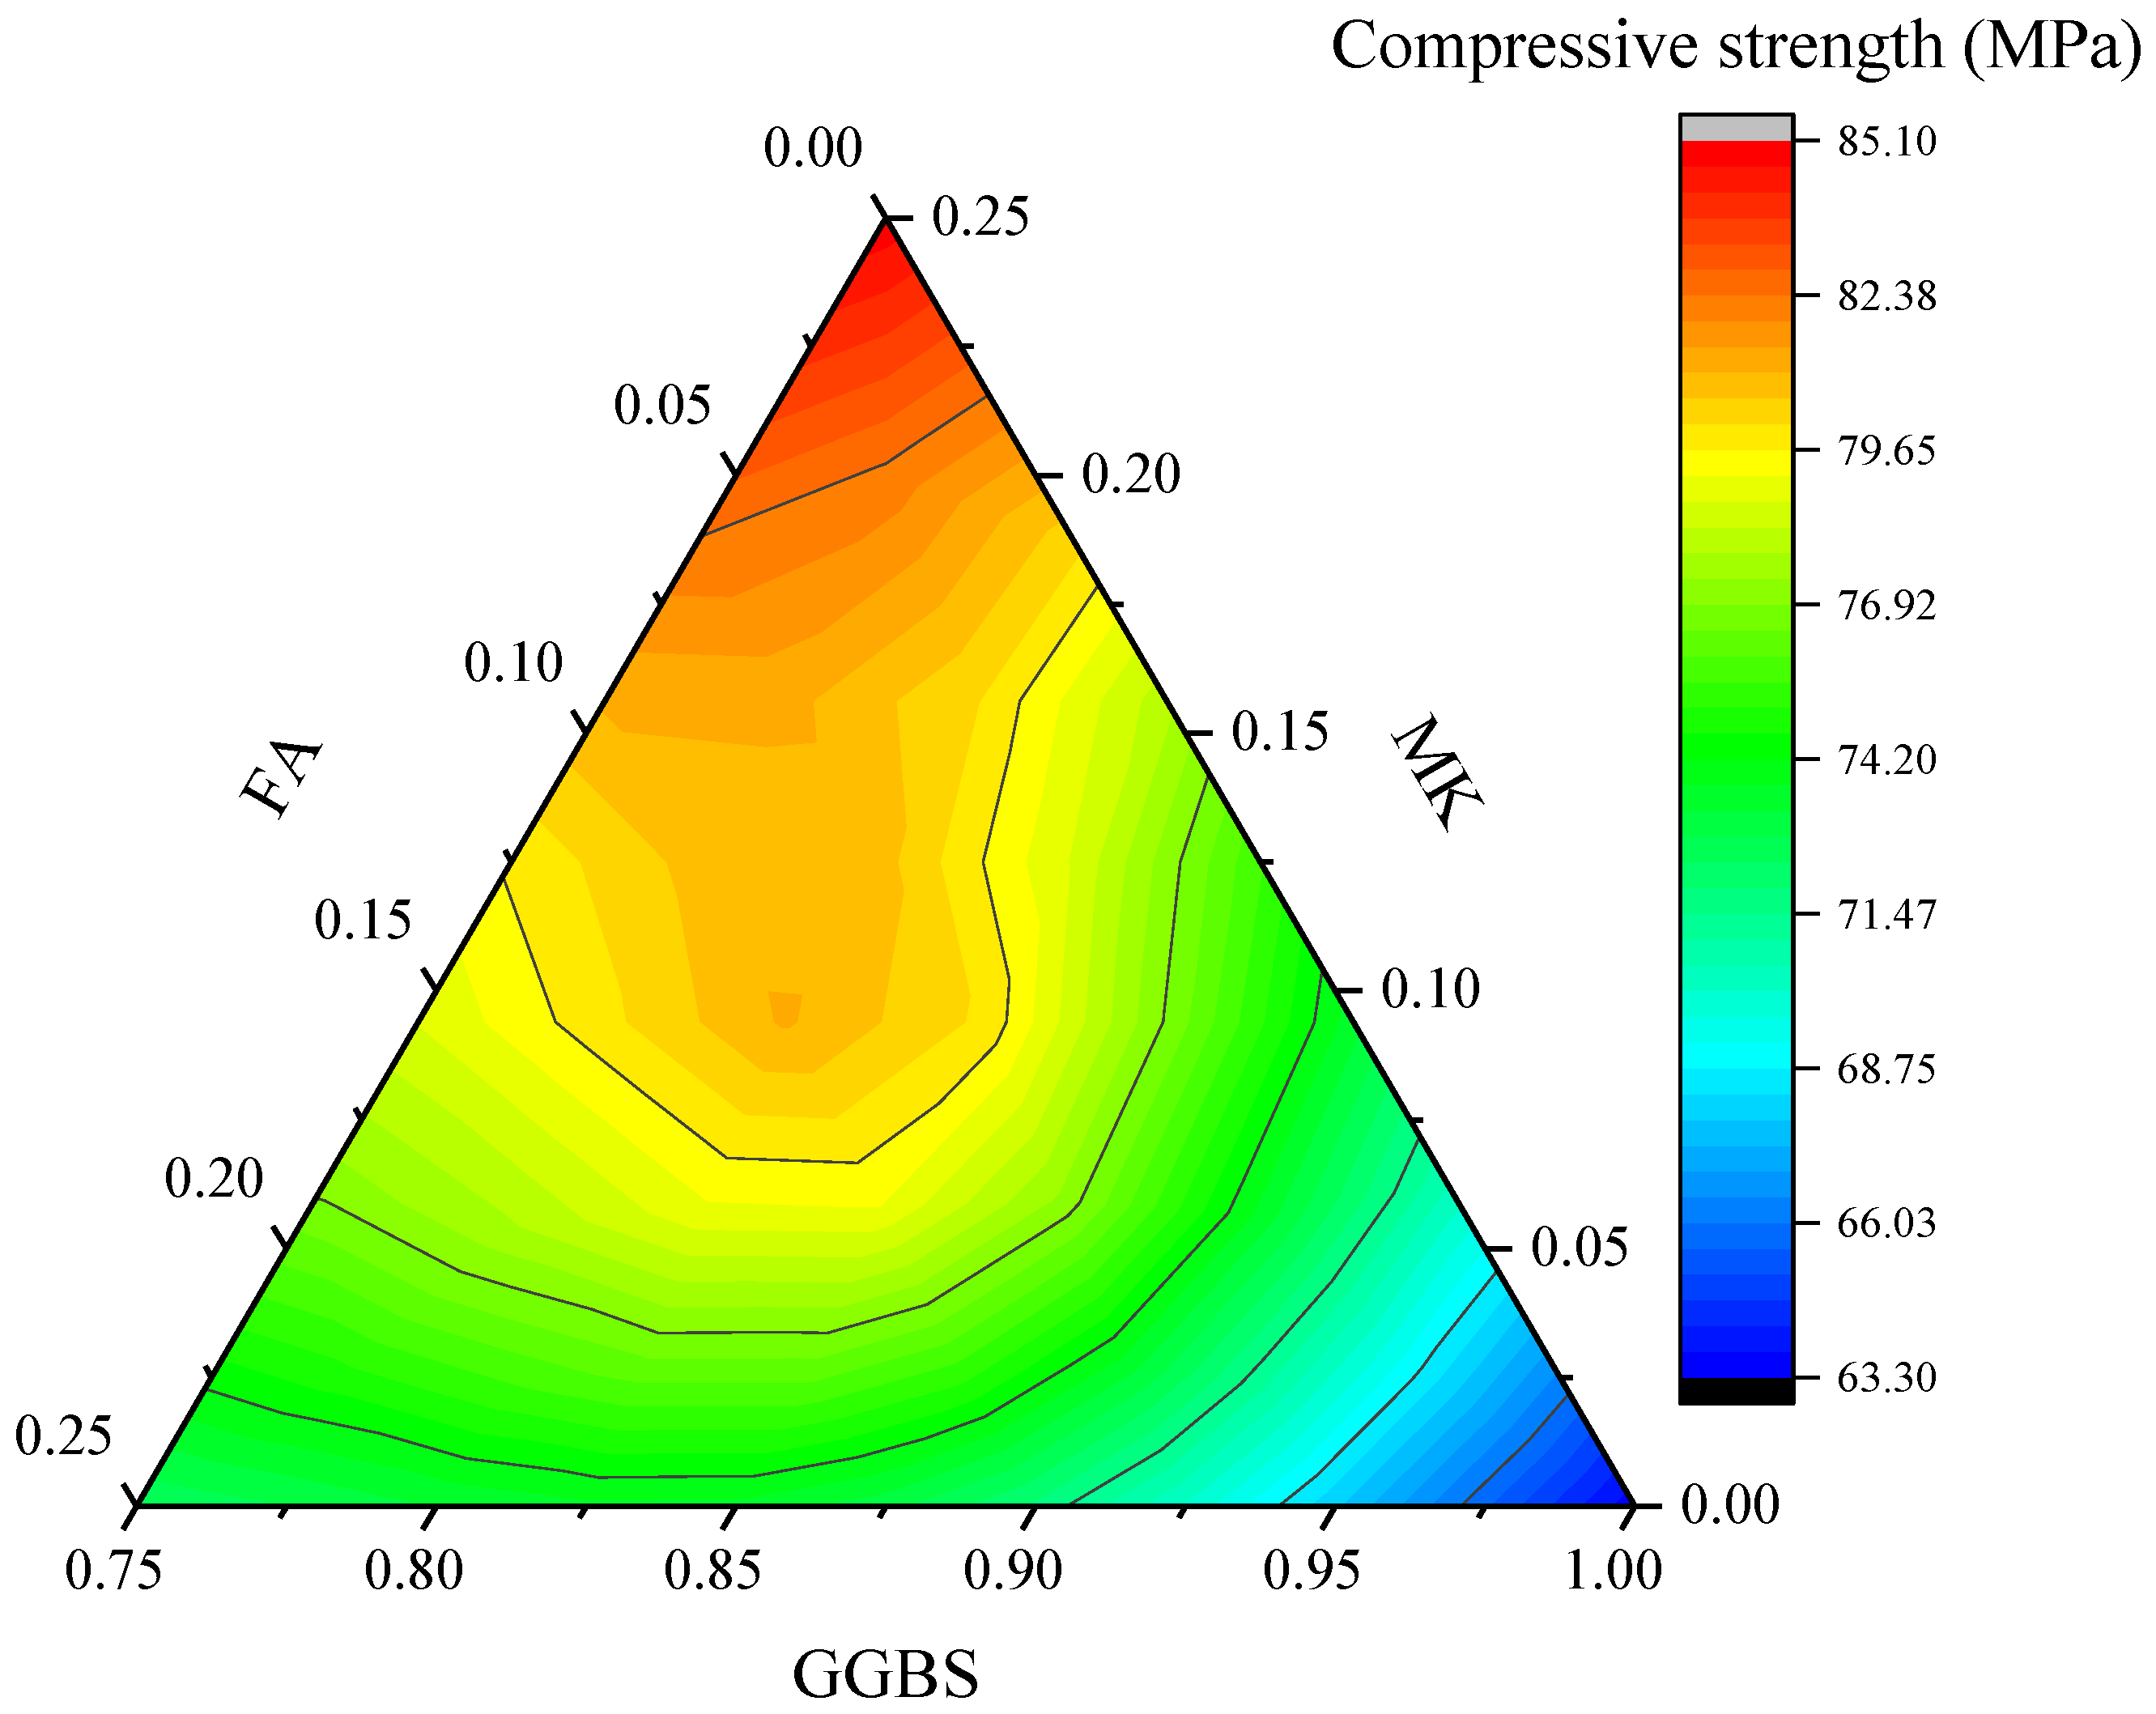
Table 3 shows the mechanical properties and porosity results of all mixtures. The contour plot of compressive strength is shown in Figure 4. Figure 4 demonstrates the intricate relationship between precursor composition (GGBS/FA/MK) and mechanical performance in ternary EGC systems. Within the tested compositional range, the highest compressive strength (>85 MPa) was achieved with 75% GGBS and 25% MK, while the lowest (63.3 MPa) occurred at 100% GGBS content. This divergence stems from MK’s superior reactivity (92% combined SiO2 + Al2O3 content) [20] and finer particle size (~2271 m2/kg specific surface area), which accelerate alkali activation and promote dense C-A-S-H/N-A-S-H gel formation, thereby enhancing matrix cohesion [21]. Conversely, GGBS-rich mixtures exhibit incomplete reactions due to coarser particle distribution, while FA’ low Ca/Si ratio (<0.5) reduces gel polymerization efficiency [10], exacerbating porosity.
When GGBS content is fixed at 75–85%, compressive strength inversely correlates with FA addition but positively responds to MK incorporation. However, beyond 85% GGBS, its dilution effect dominates, suppressing contributions from other precursors. At low FA (<15%), MK’s strength-enhancing effect counteracts GGBS-induced reduction, whereas FA > 15% introduces competitive inhibition—FA’s aluminosilicate glass competes with MK for alkali activators, slowing reaction kinetics.

3.2. Flexural Strength

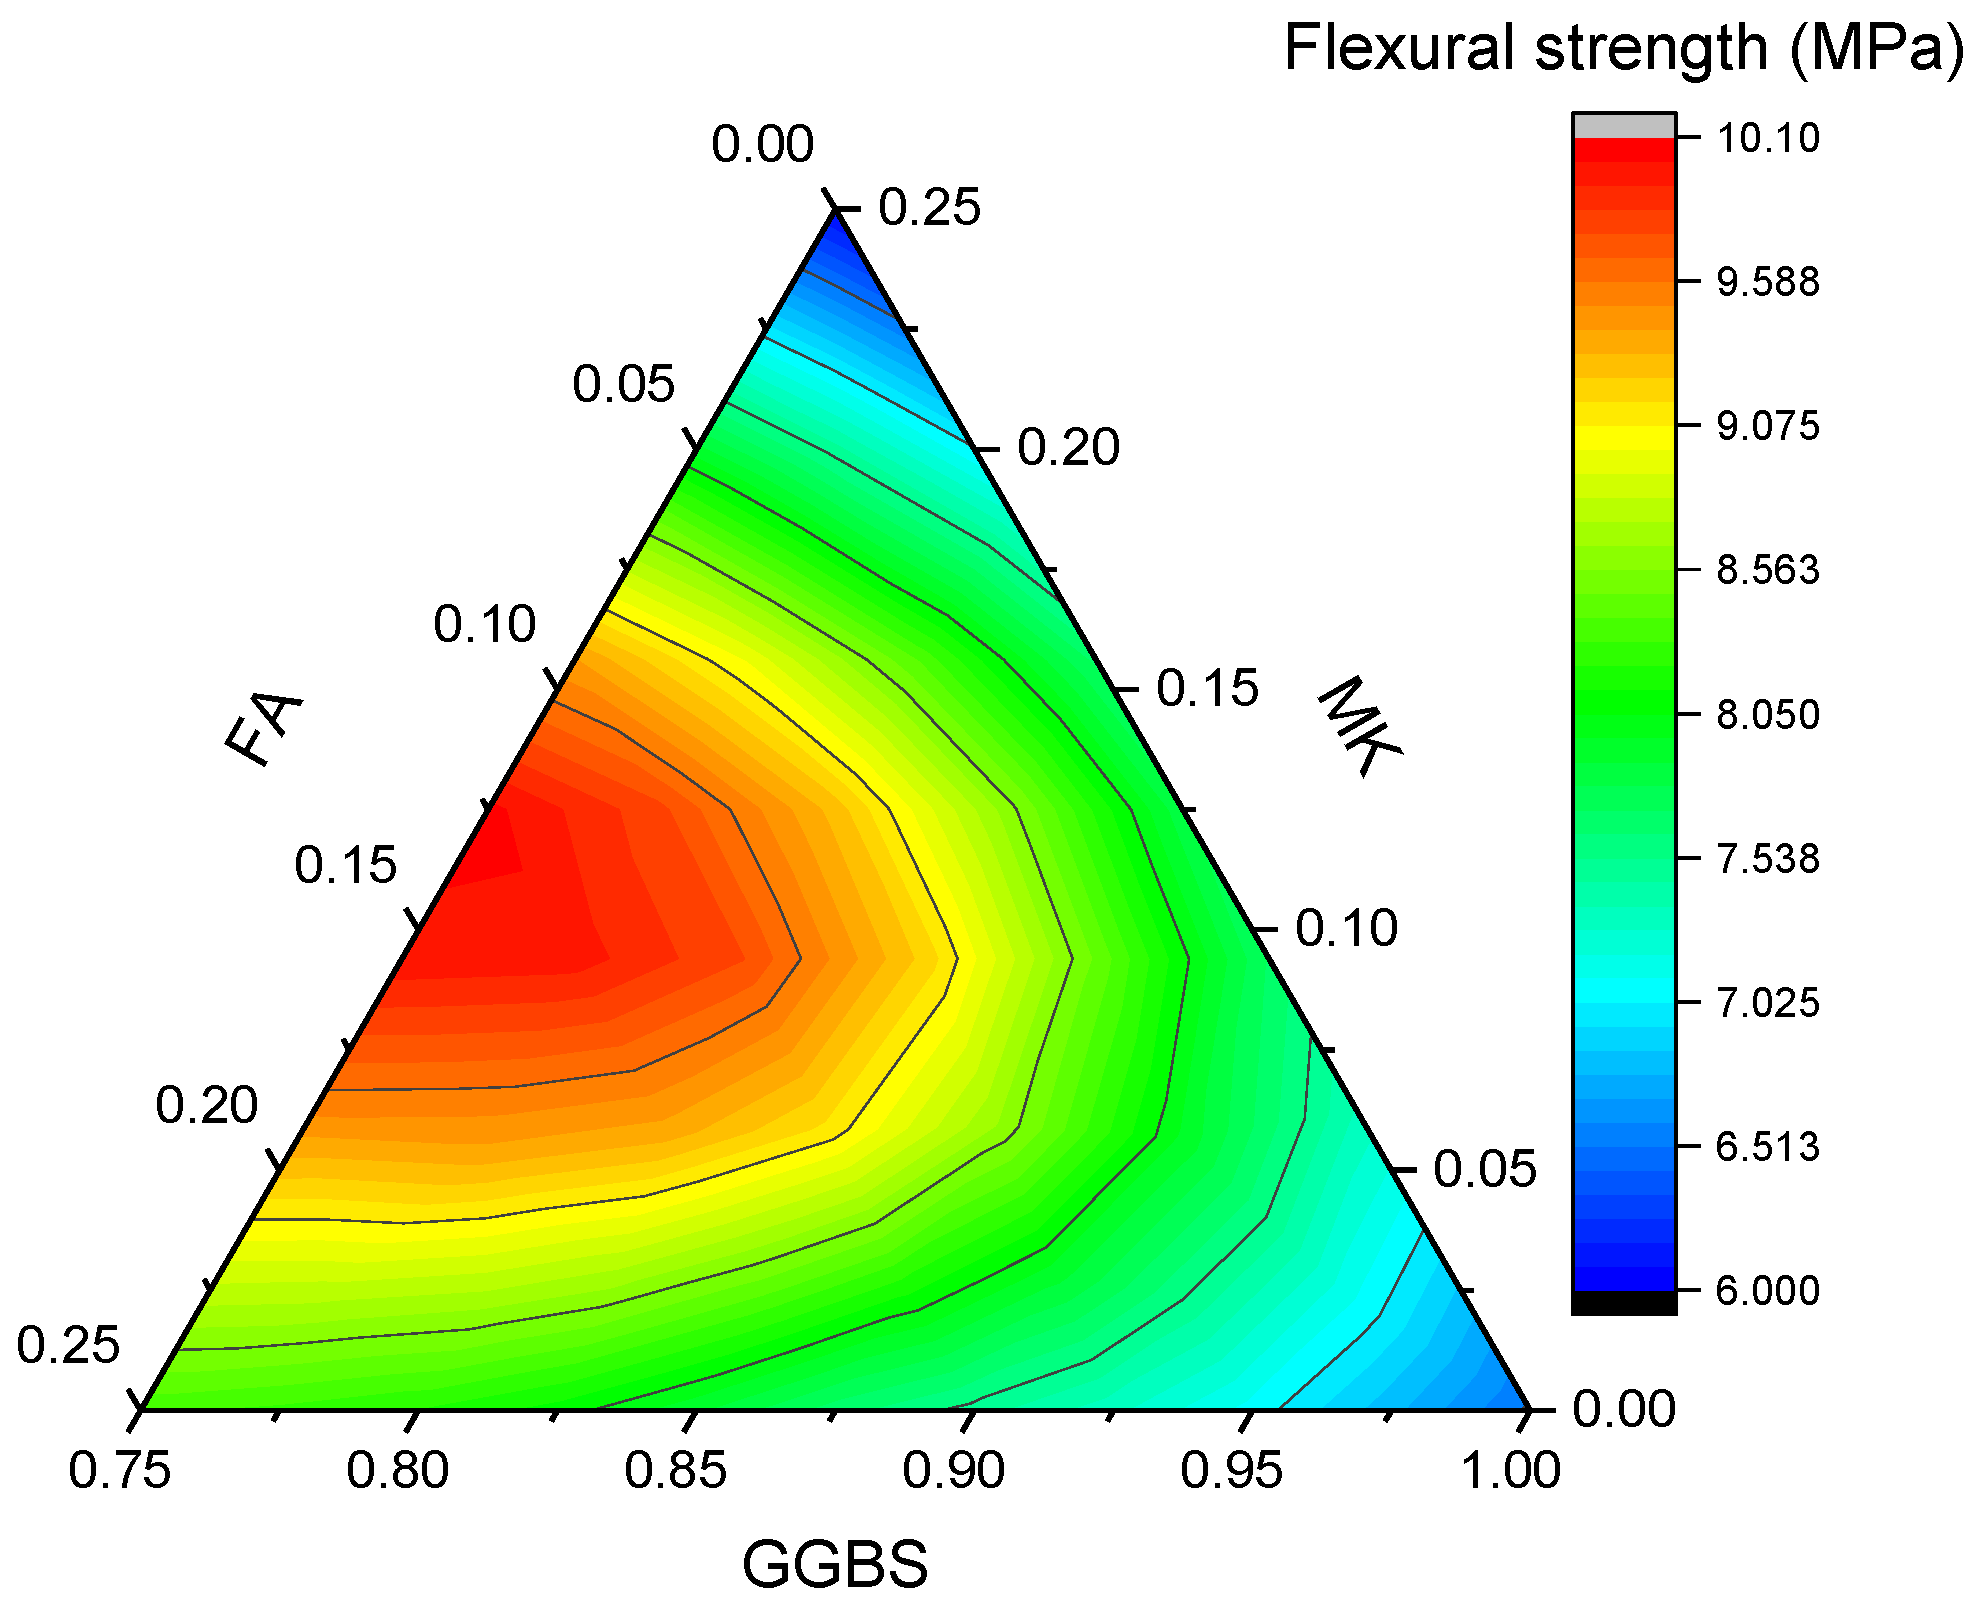
The flexural strength contour plot of ternary GGBS-FA-MK engineered geopolymer composites (EGCs) in Figure 5 reveals a complex relationship between precursor composition and mechanical performance. The lowest flexural strength (~6 MPa) occurs at two extreme compositions, at 100% GGBS and the 75% GGBS/25% MK blend, while the peak strength (10 MPa) emerges at a balanced ratio of 75% GGBS with 12.5% FA and 12.5% MK. This non-monotonic behavior stems from competing mechanisms: GGBS exhibits rapid reaction kinetics [22] that initially enhance strength but lead to incomplete hydration and residual unreacted particles at high concentrations, compromising matrix integrity. FA demonstrates a dual role—moderate additions (10–15%) improve packing density and void filling, yet excessive content dilutes reactive components and depletes alkaline activators, mirroring trends observed in alkali-activated systems where CaO/SiO2 imbalance reduces gel formation.
MK consistently enhances flexural strength due to its high pozzolanic activity and fine particle size, which accelerates the formation of dense C-A-S-H/N-A-S-H gels. When MK content is fixed, strength increases with FA but decreases with GGBS, reflecting FA’s superior particle packing versus GGBS’s dilution effect. Notably, the 75–85% GGBS range shows an initial rise in strength with FA (up to 10%) followed by a decline, attributed to FA’s delayed reactivity competing with MK for alkali activators [23]. Beyond 85% GGBS, precursor effects diminish as the system becomes dominated by GGBS’s coarse particles and incomplete reaction products, corroborating findings in slag fly ash systems where excessive slag content reduces pore refinement.

3.3. Tensile Stress–Strain Behavior

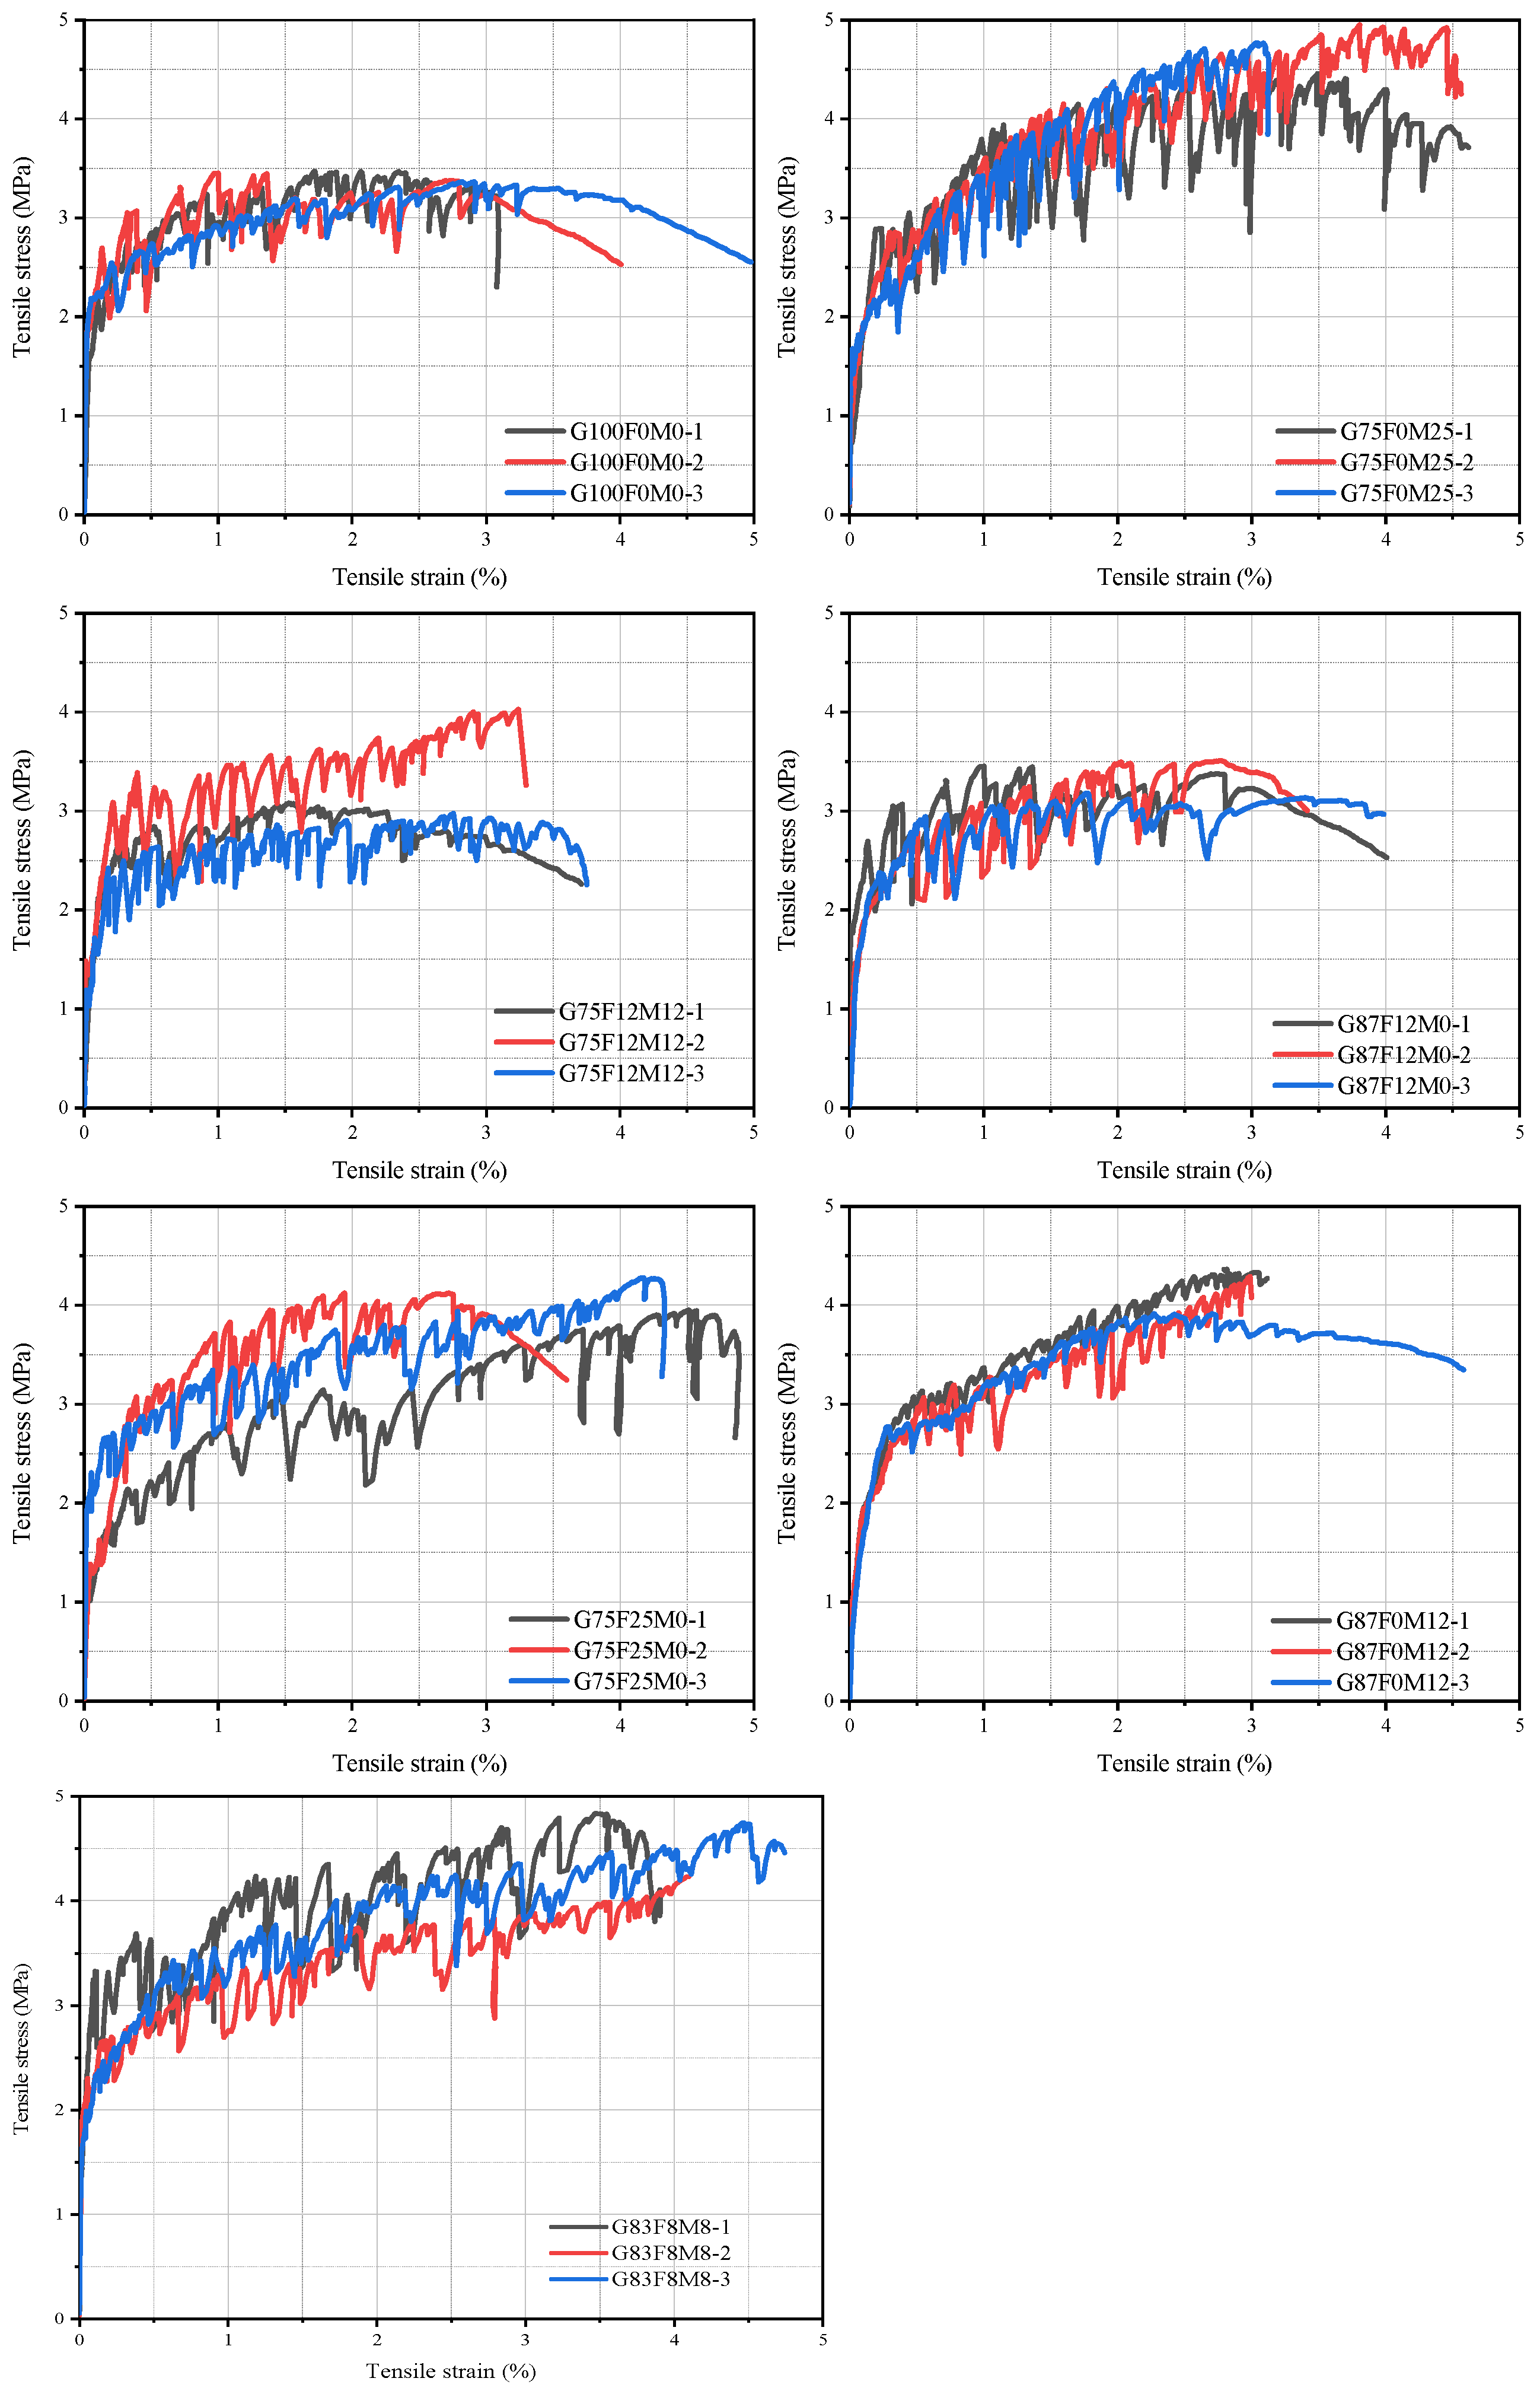
The tensile stress–strain curves for EGC mixtures are presented in Figure 6. Key tensile properties, including initial cracking strength, ultimate tensile strength, and ultimate tensile strain, were extracted from these curves. These parameters are defined as the stress at the first observed drop, the maximum recorded tensile stress, and the corresponding strain, respectively. Additionally, the number of cracks, crack width, and crack spacing were evaluated using optical microscopy. Table 3 summarizes these tensile performance parameters.
From the stress–strain curves, it is evident that different mixtures exhibit varying degrees of multiple cracking and strain-hardening behavior. The ultimate tensile strength ranges from 3.36 MPa to 4.71 MPa, while the ultimate tensile strain varies between 1.88% and 4.01%. Despite variations in magnitude, all mixtures demonstrate similar tensile behavior: tensile stress increases linearly under load until reaching the initial cracking strength, at which point microcracks begin to propagate along the weakest interfaces. Due to fiber bridging, the ECC undergoes stable crack development under continuous loading, with the ultimate tensile stress exceeding the initial cracking strength. Final failure occurs once the tensile stress surpasses the fiber bridging capacity.
Crack width plays a crucial role in determining EGC durability, including water permeability and chloride ion resistance. Generally, narrower cracks are preferred, since permeability is proportional to the cube of crack width. Crack width measurements followed the JC/T 2461-2018 standard [24]. Microscopic analysis was performed on tensile specimens, and the average crack width was calculated using the displacement gauge measurement range divided by the number of cracks. The results in Table 3 indicate that all mixtures exhibit crack widths below 100 µm, even at ultimate tensile strain, demonstrating excellent crack control. The maximum recorded crack width of 86.9 µm is well below the 0.2 mm limit prescribed by Chinese standards for concrete elements exposed to severe environmental conditions, confirming the superior durability of these EGC mixtures. The incorporation of FA further reduces crack width.
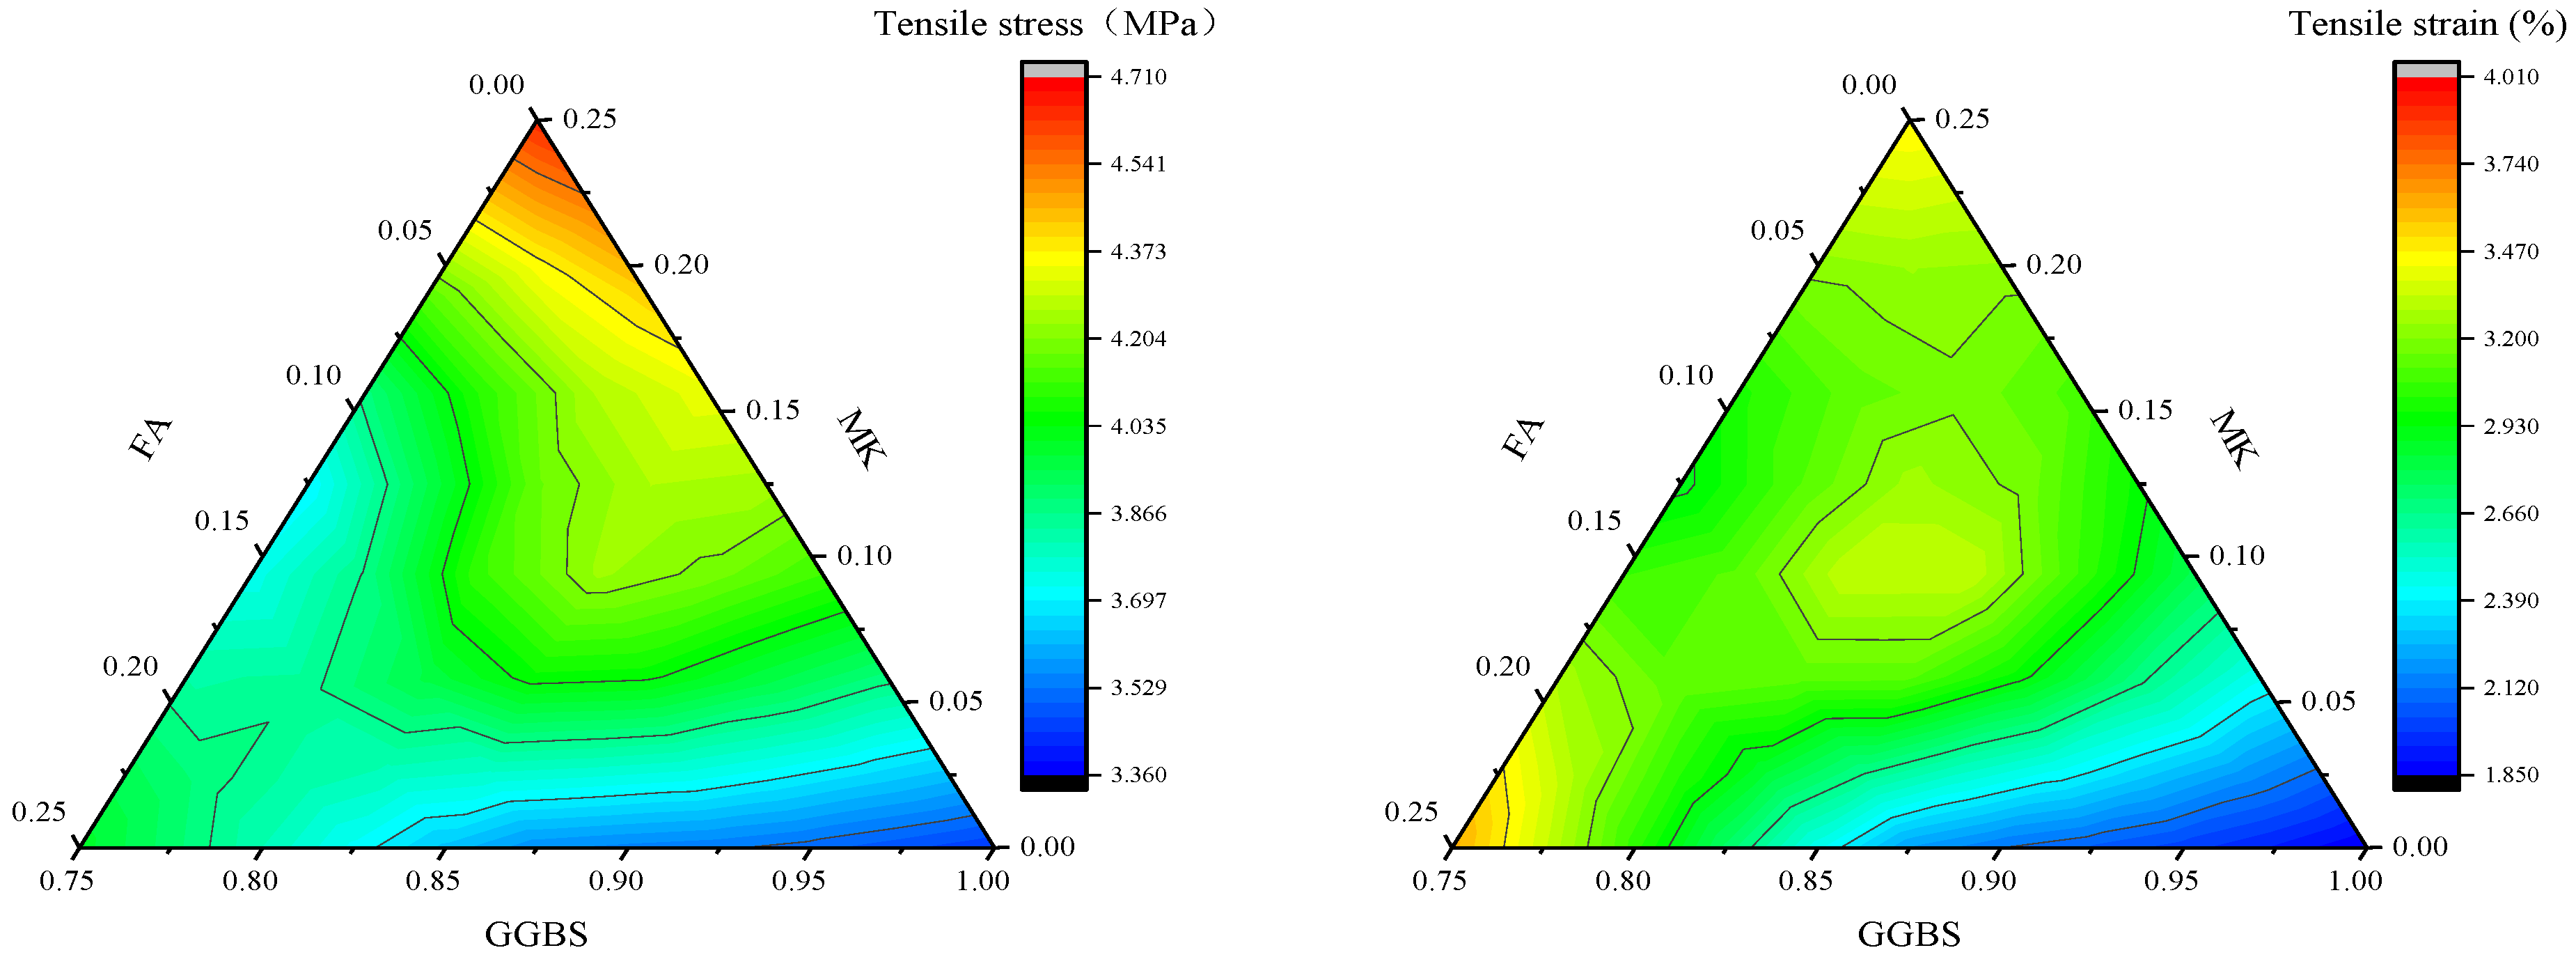
The contour plot of tensile stress–strain behavior (Figure 7) reveals that all EGC mixtures exhibit varying degrees of strain-hardening behavior. The most pronounced strain-hardening effect is observed in mixtures with 75% GGBS and 25% MK, as well as those with 83% GGBS, 8% FA, and 8% MK, where the ultimate tensile stress exceeds 4 MPa. Generally, as GGBS content increases, tensile stress tends to decrease. Similarly, increasing FA content leads to a gradual reduction in tensile stress, while MK content has a relatively positive impact. This agreed with the results in previous studies that FA showed lower reactivity [25], while MK showed higher reactivity [20].
In most cases, increasing GGBS content results in a reduction in tensile strain. When GGBS reaches 100%, the tensile strain falls below 2%, indicating limited ductility. This agreed with a previous study that incorporating GGBS as a replacement for FA lowered the ductility of EGCs [25]. However, for a fixed content of GGBS and FA, increasing MK content leads to an improvement in tensile strain capacity due to its high reactivity [26]. In the composition range of 75–85% GGBS and 15–25% MK, an increase in FA initially reduces tensile strain before subsequently enhancing it. When GGBS content exceeds 85% and MK content is below 15%, the variation in tensile strain becomes less pronounced.

3.4. Fiber Dispersion

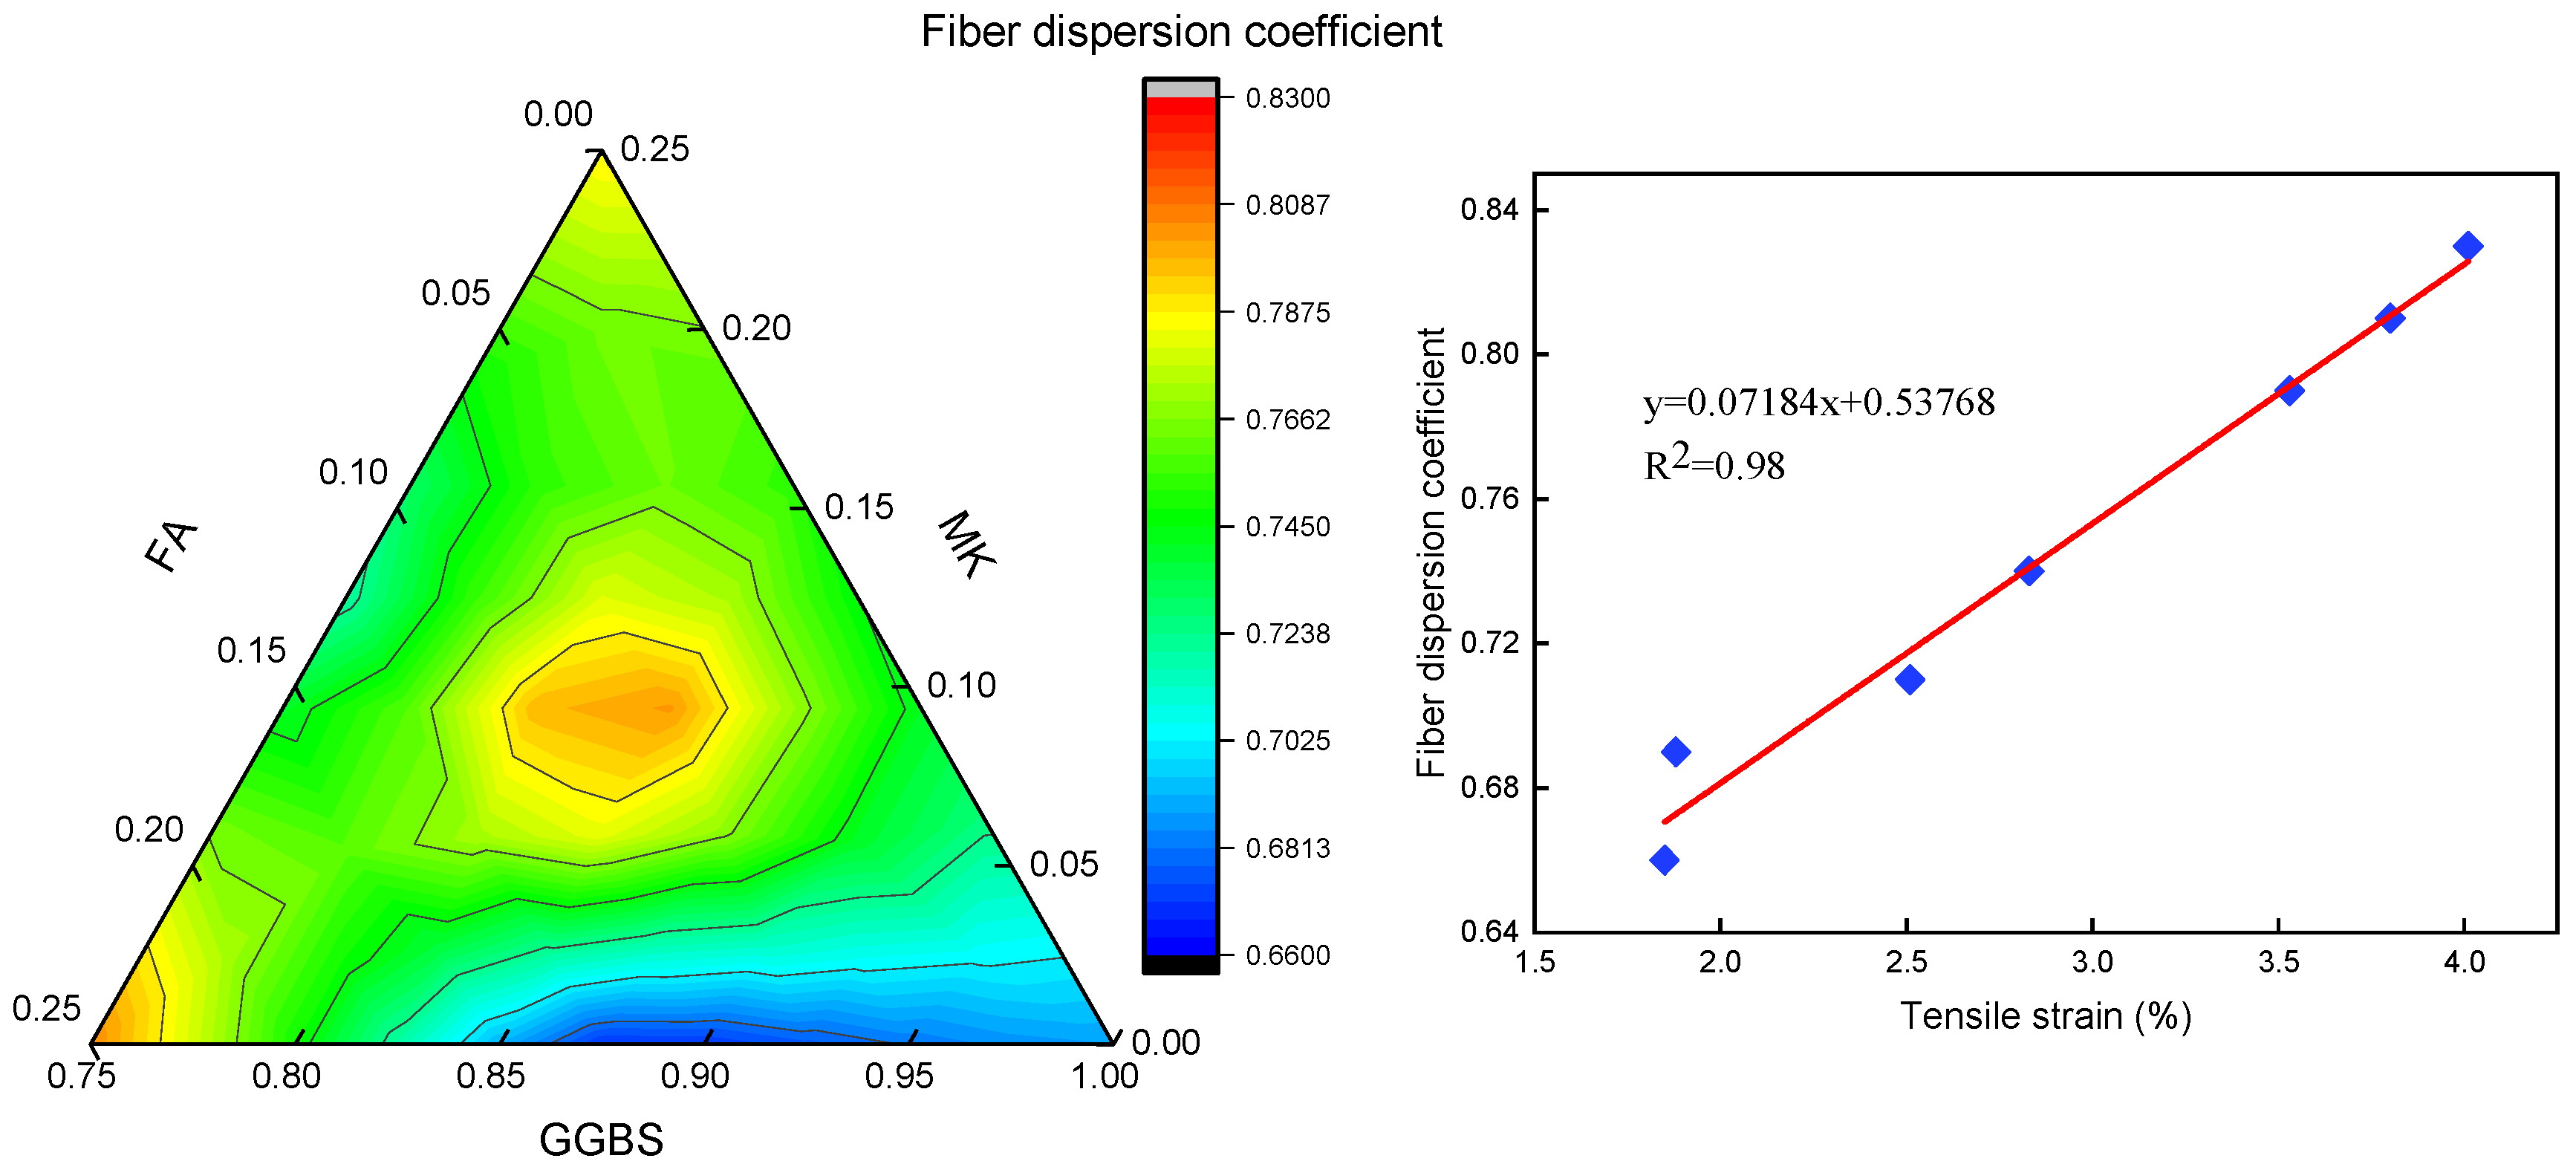
Figure 8 presents the ternary contour plot of fiber dispersion coefficients for different EGC mixtures. The results indicate that fiber dispersion is influenced by precursor composition. When GGBS content is between 75% and 80%, fiber dispersion decreases and then increases as MK content rises (with a corresponding decrease in FA). When GGBS is between 80% and 90%, fiber dispersion initially increases and then decreases with increasing MK content. When GGBS content exceeds 90%, fiber dispersion improves with MK content. These trends suggest that fiber dispersion is significantly affected by matrix viscosity. Research indicates that matrix viscosity influences fiber dispersion, with an optimal viscosity range enhancing fiber separation while preventing fiber clustering [27,28].
Due to the ability of fibers to bridge micro-cracks, their spatial distribution (dispersion) directly governs the composite’s mechanical performance, particularly in strain-hardening behavior [29]. Therefore, the fiber dispersion coefficient could be used to explain a variety of tensile strains of mixtures. The correlation between fiber dispersion and tensile strain is evident in Figure 8. Mixtures with higher fiber dispersion coefficients tend to exhibit superior strain-hardening behavior, as a uniform fiber network facilitates stress transfer, preventing localized stress concentrations.

3.5. Pore Distribution

The pore structure plays a crucial role in determining the strength and durability of composite materials. It is important to note that the reported compressive strength values include fiber reinforcement, whereas the MIP tests were conducted on fiber-free matrices. The difference in sample preparation for compressive strength and MIP tests stems from the following technical considerations: First, the MIP test requires small, intact specimens (typically <1 cm3) to ensure accurate pore structure measurement. However, the fiber-reinforced composite blocks exhibited strong interfacial bonding between fibers and the matrix, making it mechanically difficult to extract small, fiber-containing samples without causing fragmentation or pore structure damage during cutting. In addition, fibers may also interfere with mercury intrusion measurements by blocking pore access or creating artificial voids during sample extraction, leading to biased porosity results.
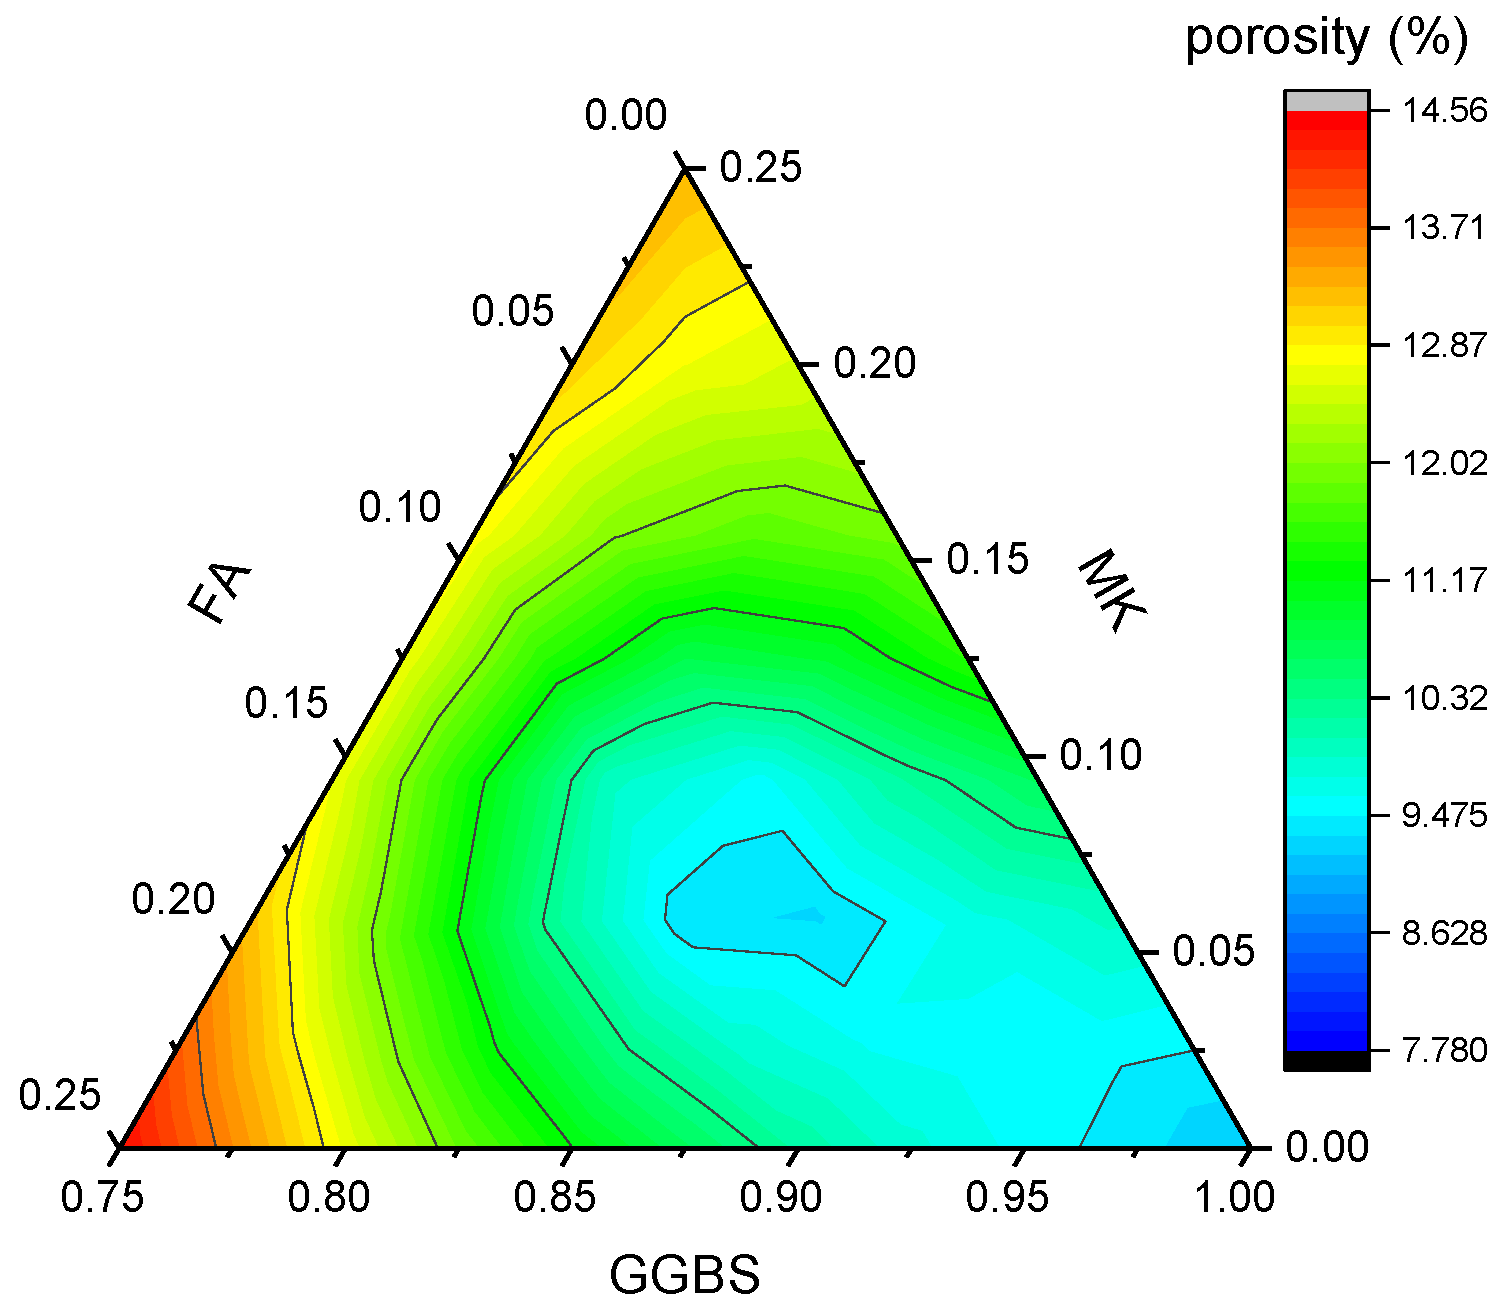
The porosity values of the different mixtures are summarized in Table 3, with porosity ranging from 7.79% to 14.56%. Figure 9 presents the contour plot of EGC porosity distribution. The highest porosity (14.56%) occurs when the mixture consists of 75% GGBS and 25% FA, while the lowest porosity (7.78%) is recorded in the G83F8M8 composition (83% GGBS, 8% FA, 8% MK). The G83F8M8 composition achieves the lowest porosity due to a synergistic optimization of material properties and pore structure dynamics. GGBS dominates the system with its high reactivity (CaO and SiO2 content) [22], generating dense low-calcium C-S-H gel that fills capillary pores, reducing the porosity. MK (8%) provides nano-filling via its high surface area and Al2O3 content as mentioned before, sealing gel pores through C-A-S-H formation without causing agglomeration, while low FA (8%) enhances particle mobility (“ball-bearing effect”) without increasing pore connectivity [30]. This composition lies in the area, where GGBS’s rapid hydration and MK/FA’s pozzolanic reactions reach kinetic equilibrium, avoiding shrinkage cracks. In contrast, high-MK (>15%) or high-FA (>15%) mixes exhibit higher porosity due to anhydrate clusters or interconnected pores, while pure GGBS lacks nano-fillers.
For a fixed GGBS content, porosity initially decreases and then increases with increasing FA and MK content. When FA content is constant, porosity decreases with increasing GGBS content but increases with MK content. Similarly, when MK content is fixed, increasing GGBS reduces porosity, while increasing FA results in a gradual increase in porosity.
However, these trends do not exhibit a direct correlation with the mechanical properties of EGC. That is because mechanical performance is also influenced by the hydration products of geopolymer precursors and the fiber–matrix interfacial bonding.
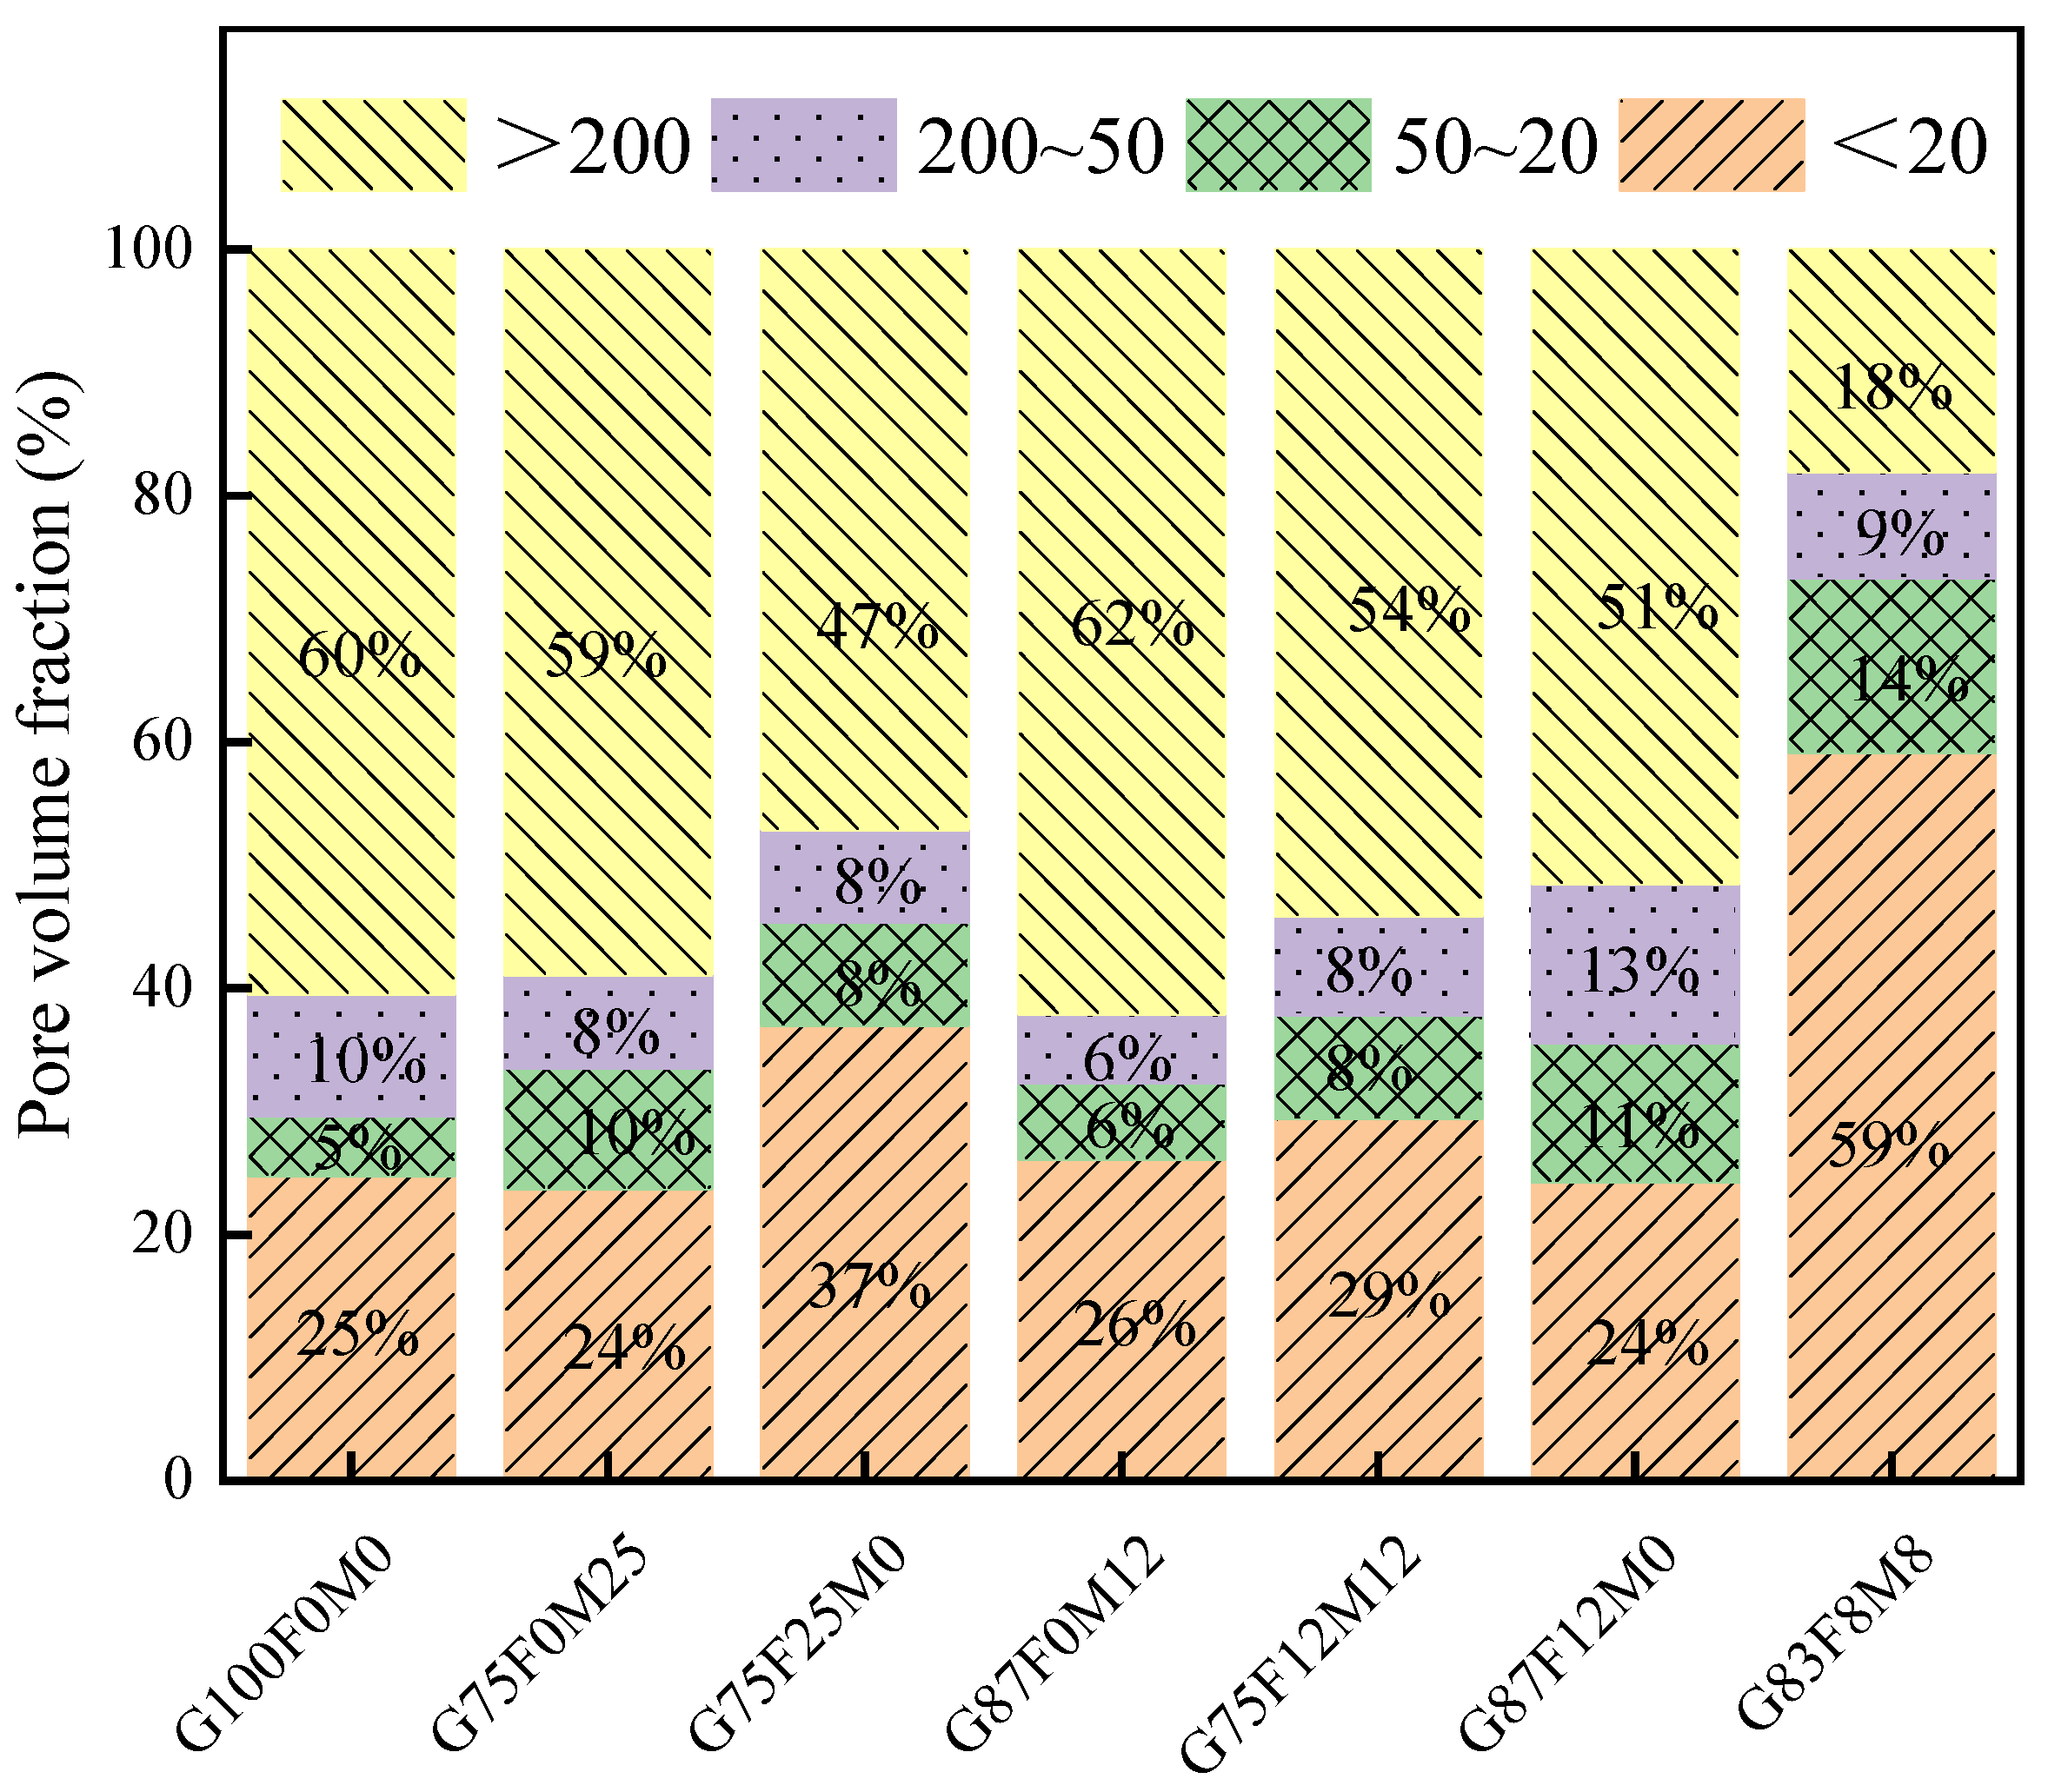
Apart from porosity, pore size distribution significantly affects EGC performance. Based on their impact on mechanical properties, pores are categorized into four groups as follows:
  • Nanopores (<20 nm);
  • Mesopores (20–50 nm);
  • Macropores (50–200 nm);
  • Large macropores (>200 nm) [31].
To facilitate analysis, the pore volume fraction was classified into these four categories, and the distribution results are illustrated in Figure 10. Except for the G83F8M8 mixture, the pore size distribution trends among the remaining mixtures are relatively similar. Large macropores (>200 nm) constitute the largest proportion (47–62%), followed by nanopores (<20 nm), which account for 24–37%. Mesopores (20–50 nm) and macropores (50–200 nm) contribute the least (12–24%).
The G83F8M8 mixture exhibits a predominantly nanopore structure, with 59% of the total porosity falling within the <20 nm range, significantly higher than other mixtures. The proportions of macropores and large macropores are only 9% and 18%, respectively, which are notably lower than in other compositions. This refined pore structure suggests that in the G83F8M8 mixture, coarse pores are progressively converted into finer ones, leading to enhanced mechanical performance. As a result, this composition demonstrates lower porosity and superior mechanical properties.

4. Conclusions

This study employed the simplex centroid design method to investigate the mechanical performance variations in EGC with ternary precursors (GGBS, FA, MK). Based on the experimental results and analysis, the following conclusions can be drawn:
(1)
GGBS and FA content are inversely correlated with compressive strength, while MK content exhibits a positive correlation. The highest compressive strength (>85 MPa) is achieved when GGBS is 75% and MK is 25%.
(2)
Flexural strength generally decreases with increasing GGBS content. FA content initially enhances flexural strength but reduces it at higher concentrations. MK content positively influences flexural strength. The highest flexural strength (10 MPa) is observed at 75% GGBS, 12.5% FA, and 12.5% MK.
(3)
The most pronounced strain-hardening effect is observed in mixtures with 75% GGBS and 25% MK, as well as 83% GGBS, 8% FA, and 8% MK, where tensile strain exceeds 4% and tensile stress exceeds 4 MPa.
(4)
A strong positive correlation is observed between fiber dispersion and tensile strain capacity. More uniform fiber distribution leads to improved strain-hardening behavior.
(5)
FA and MK contribute to pore refinement, reducing the presence of coarse pores. The G83F8M8 mixture exhibits the lowest porosity and the most refined pore structure, resulting in superior mechanical performance. The compressive strength, flexural strength, tensile strength, and tensile strain of this mixture were 81.59MPa, 9.6 MPa, 4.61 MPa, and 4.01%, respectively. Therefore, the G83F8M8 mixture was identified as the optimal ternary composite.

Author Contributions

Conceptualization, methodology, writing—original draft preparation, review and editing—P.H.; software, data curation, formal analysis—L.W.; supervision, funding acquisition, editing—X.Y.; software, data curation—L.F.; writing-review & editing—Y.L. and C.C. All authors have read and agreed to the published version of the manuscript.

Funding

This research was funded by the National Natural Science Foundation of China, grant number 52408459, the Natural Science Foundation of Hunan, grant number 2024JJ6040, and the Open Fund of the Key Laboratory of Special Environment Road Engineering of Hunan Province (Changsha University of Science & Technology), grant number kfj230603.

Data Availability Statement

The original contributions presented in the study are included in the article; further inquiries can be directed to the first author.

Acknowledgments

We sincerely express our gratitude to the peer reviewers and editors for their professional comments to improving the manuscript.

Conflicts of Interest

All authors declare that the research was conducted in the absence of any commercial or financial relationships that could be construed as a potential conflict of interest.

References

  1. Li, V.C.; Leung, C.K.Y. Steady-State and Multiple Cracking of Short Random Fiber Composites. J. Eng. Mech. 1992, 118, 2246–2264. [Google Scholar] [CrossRef]
  2. Li, V.C. From Micromechanics To Structural Engineering. Doboku Gakkai Ronbunshu 1993, 1993, 1–12. [Google Scholar] [CrossRef] [PubMed]
  3. Ranade, R.; Li, V.C.; Heard, W.F.; Williams, B.A. Impact resistance of high strength-high ductility concrete. Cem. Concr. Res. 2017, 98, 24–35. [Google Scholar] [CrossRef]
  4. Curosu, I.; Liebscher, M.; Mechtcherine, V.; Bellmann, C.; Michel, S. Tensile behavior of high-strength strain-hardening cement-based composites (HS-SHCC) made with high-performance polyethylene, aramid and PBO fibers. Cem. Concr. Res. 2017, 98, 71–81. [Google Scholar] [CrossRef]
  5. Chen, Y.; Yu, J.; Leung, C.K.Y. Use of high strength strain-hardening cementitious composites for flexural repair of concrete structures with significant steel corrosion. Constr. Build. Mater. 2018, 167, 325–337. [Google Scholar] [CrossRef]
  6. Andrew, R.M. Global CO2 emissions from cement production, 1928–2017. Earth Syst. Sci. Data 2018, 10, 2213–2239. [Google Scholar] [CrossRef]
  7. Ohno, M.; Li, V.C. A feasibility study of strain hardening fiber reinforced fly ash-based geopolymer composites. Constr. Build. Mater. 2014, 57, 163–168. [Google Scholar] [CrossRef]
  8. Nguyễn, H.H.; Choi, J.-I.; Kim, H.-K.; Lee, B.Y. Mechanical properties and self-healing capacity of eco-friendly ultra-high ductile fiber-reinforced slag-based composites. Compos. Struct. 2019, 229, 111401. [Google Scholar] [CrossRef]
  9. Cai, J.; Pan, J.; Han, J.; Wang, X. Mechanical Behaviors of Metakaolin-Based Engineered Geopolymer Composite under Ambient Curing Condition. J. Mater. Civ. Eng. 2022, 34, 04022152. [Google Scholar] [CrossRef]
  10. Lao, J.-C.; Huang, B.-T.; Xu, L.-Y.; Khan, M.; Fang, Y.; Dai, J.-G. Seawater sea-sand Engineered Geopolymer Composites (EGC) with high strength and high ductility. Cem. Concr. Compos. 2023, 138, 104998. [Google Scholar] [CrossRef]
  11. Kan, L.-l.; Wang, W.-S.; Liu, W.-D.; Wu, M. Development and characterization of fly ash based PVA fiber reinforced Engineered Geopolymer Composites incorporating metakaolin. Cem. Concr. Compos. 2020, 108, 103521. [Google Scholar] [CrossRef]
  12. Nematollahi, B.; Sanjayan, J.; Qiu, J.; Yang, E.-H. Micromechanics-based investigation of a sustainable ambient temperature cured one-part strain hardening geopolymer composite. Constr. Build. Mater. 2017, 131, 552–563. [Google Scholar] [CrossRef]
  13. He, P.; Drissi, S.; Hu, X.; Liu, J.; Shi, C. Properties of CO2-cured cement incorporating fly ash and slag subjected to further water curing. Cem. Concr. Compos. 2024, 152, 105633. [Google Scholar] [CrossRef]
  14. He, P.; Zhang, B.; Lu, J.-X.; Poon, C.S. A ternary optimization of alkali-activated cement mortars incorporating glass powder, slag and calcium aluminate cement. Constr. Build. Mater. 2020, 240, 117983. [Google Scholar] [CrossRef]
  15. Wang, D.; Chen, Z. On predicting compressive strengths of mortars with ternary blends of cement, ggbfs and fly ash. Cem. Concr. Res. 1997, 27, 487–493. [Google Scholar] [CrossRef]
  16. Douglas, E.; Pouskouleli, G. Prediction of compressive strength of mortars made with portland cement-blast-furnace slag-fly ash blends. Cem. Concr. Res. 1991, 21, 523–534. [Google Scholar] [CrossRef]
  17. GB/T 17671-2021; Method of Testing Cements—Determination of Strength (ISO Method). Standardization Administration of China (SAC): Beijing, China, 2021.
  18. Huang, X.; Ranade, R.; Ni, W.; Li, V.C. Development of green engineered cementitious composites using iron ore tailings as aggregates. Constr. Build. Mater. 2013, 44, 757–764. [Google Scholar] [CrossRef]
  19. Lee, B.Y.; Kim, J.-K.; Kim, J.-S.; Kim, Y.Y. Quantitative evaluation technique of Polyvinyl Alcohol (PVA) fiber dispersion in engineered cementitious composites. Cem. Concr. Compos. 2009, 31, 408–417. [Google Scholar] [CrossRef]
  20. Kamath, M.; Prashant, S.; Kumar, M. Micro-characterisation of alkali activated paste with fly ash-GGBS-metakaolin binder system with ambient setting characteristics. Constr. Build. Mater. 2021, 277, 122323. [Google Scholar] [CrossRef]
  21. Ismail, I.; Bernal, S.A.; Provis, J.L.; San Nicolas, R.; Hamdan, S.; van Deventer, J.S.J. Modification of phase evolution in alkali-activated blast furnace slag by the incorporation of fly ash. Cem. Concr. Compos. 2014, 45, 125–135. [Google Scholar] [CrossRef]
  22. Nagajothi, S.; Elavenil, S. Effect of GGBS addition on reactivity and microstructure properties of ambient cured fly ash based geopolymer concrete. Silicon 2021, 13, 507–516. [Google Scholar] [CrossRef]
  23. Swanepoel, J.; Strydom, C. Utilisation of fly ash in a geopolymeric material. Appl. Geochem. 2002, 17, 1143–1148. [Google Scholar] [CrossRef]
  24. JC/T 2461-2018; Test Methods for Mechanical Properties of High Ductility Fiber-Reinforced Cementitious Composites. China Building Materials Press: Beijing, China, 2018.
  25. Ling, Y.; Wang, K.; Li, W.; Shi, G.; Lu, P. Effect of slag on the mechanical properties and bond strength of fly ash-based engineered geopolymer composites. Compos. Part B Eng. 2019, 164, 747–757. [Google Scholar] [CrossRef]
  26. Babanajad, S.K.; Farnam, Y.; Shekarchi, M. Failure criteria and triaxial behaviour of HPFRC containing high reactivity metakaolin and silica fume. Constr. Build. Mater. 2012, 29, 215–229. [Google Scholar] [CrossRef]
  27. Li, M.; Li, V.C. Rheology, fiber dispersion, and robust properties of engineered cementitious composites. Mater. Struct. 2013, 46, 405–420. [Google Scholar] [CrossRef]
  28. Lei, D. Design and Key Performance of Eco-Nano Ultra-High Strength and Ultra-High Ductility Cementitious Composites. Ph.D. Thesis, Southeast University, Nanjing, China, 2019. (In Chinese). [Google Scholar]
  29. Torigoe, S.-I.; Horikoshi, T.; Ogawa, A.; Saito, T.; Hamada, T. Study on Evaluation Method for PVA Fiber Distribution in Engineered Cementitious Composite. J. Adv. Concr. Technol. 2003, 1, 265–268. [Google Scholar] [CrossRef]
  30. Ma, J.; Wang, D.; Zhao, S.; Duan, P.; Yang, S. Influence of particle morphology of ground fly ash on the fluidity and strength of cement paste. Materials 2021, 14, 283. [Google Scholar] [CrossRef]
  31. Sang, G.; Liu, S.; Zhang, R.; Elsworth, D.; He, L. Nanopore characterization of mine roof shales by SANS, nitrogen adsorption, and mercury intrusion: Impact on water adsorption/retention behavior. Int. J. Coal Geol. 2018, 200, 173–185. [Google Scholar] [CrossRef]
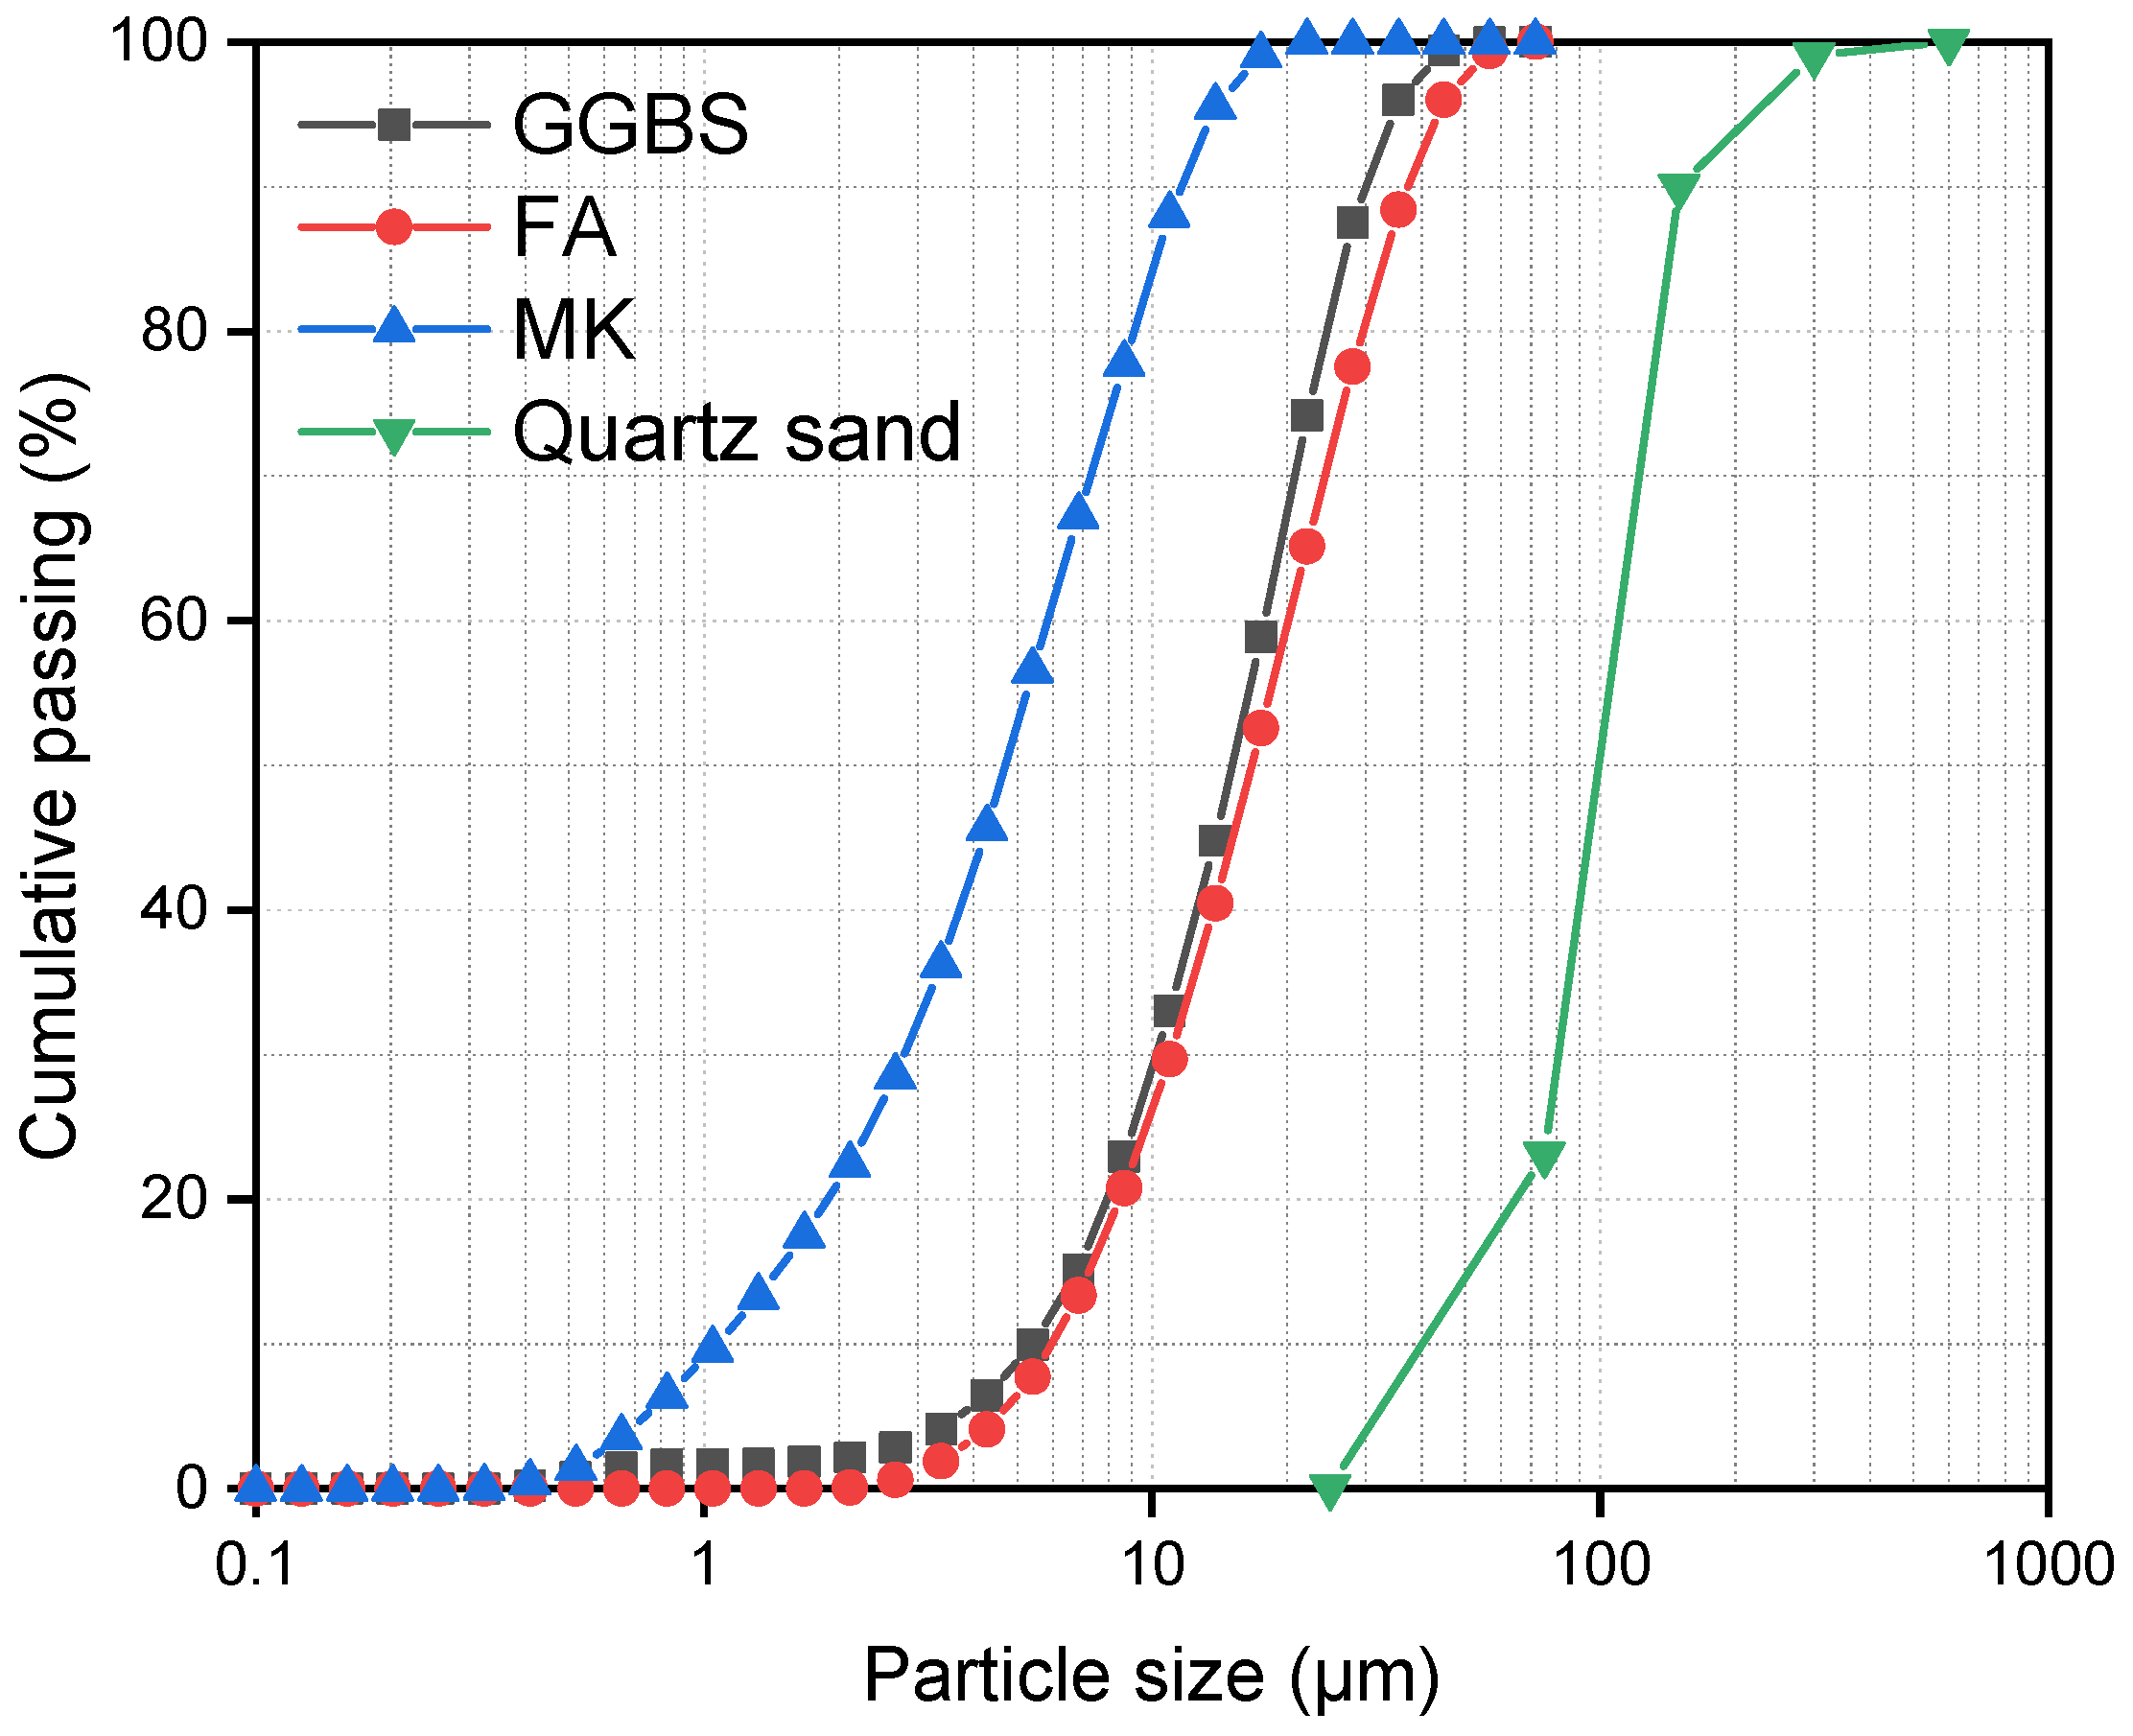
Figure 1. Particle size distribution of raw materials.
Buildings 15 02919 g001
Figure 2. GGBS-FA-MK ternary EGC composition design.
Buildings 15 02919 g002
Figure 3. Set-up of uniaxial tensile test and dimension of dog bone-shaped specimen.
Buildings 15 02919 g003
Figure 4. GGBS-FA-MK ternary EGC compressive strength contour map.
Buildings 15 02919 g004
Figure 5. GGBS-FA-MK ternary EGC flexural strength contour map.
Buildings 15 02919 g005
Figure 6. Tensile stress–strain curves of EGC with different mixtures.
Buildings 15 02919 g006
Figure 7. GGBS-FA-MK ternary EGC tensile stress and strain contour map.
Buildings 15 02919 g007
Figure 8. GGBS-FA-MK ternary EGC fiber dispersion contour map, fiber dispersion, and tensile strain fitting map.
Buildings 15 02919 g008
Figure 9. GGBS-FA-MK ternary EGC porosity contour map.
Buildings 15 02919 g009
Figure 10. Pore volume distribution of EGC matrix.
Buildings 15 02919 g010
Table 1. Chemical compositions of precursors (%).
MaterialSiO2Al2O3CaOMgOFe2O3Na2OSO3
FA45.1036.804.500.952.500.541.20
GGBS34.2017.6034.006.211.01-1.62
MK53.0039.000.170.901.760.30-
Table 2. Mix proportion of EGC mixtures.
MixturePrecursorsQuartz SandWaterSodium SilicatePE Fiber (by Volume)
GGBSFAMK
G100F0M01000.360.350.2852%
G75F0M250.7500.25
G75F25M00.750.250
G87F0M120.87500.125
G75F12M120.750.1250.125
G87F12M00.8750.1250
G83F8M80.8340.0830.083
Table 3. Summary of EGC properties.
MixtureG100
F0M0
G75
F0M25
G75
F25M0
G87
F0M12
G75
F12M12
G87
F12M0
G83
F8M8
Compressive strength (MPa)63.3585.0472.3475.3179.4272.9981.59
Flexural strength (MPa)6.56.08.37.810.17.69.6
Initial stress (MPa)2.372.692.382.822.442.592.38
Ultimate stress (MPa)3.434.714.124.193.363.384.61
Ultimate strain (%)1.883.533.802.832.511.854.01
Crack width (µm)86.975.551.984.464.865.770.5
Fiber dispersion0.690.790.810.740.710.660.83
Porosity (%)9.1313.1714.5612.2313.1811.07.79
Disclaimer/Publisher’s Note: The statements, opinions and data contained in all publications are solely those of the individual author(s) and contributor(s) and not of MDPI and/or the editor(s). MDPI and/or the editor(s) disclaim responsibility for any injury to people or property resulting from any ideas, methods, instructions or products referred to in the content.