Article

Investigation into the Impact of Enclosure Retrofit on Thermal Comfort in Semi-Open University Space

College of Civil Engineering and Architecture, Zhejiang University, Hangzhou 310058, China
*
Author to whom correspondence should be addressed.
Buildings 2025, 15(16), 2883; https://doi.org/10.3390/buildings15162883
Submission received: 21 July 2025 / Revised: 11 August 2025 / Accepted: 13 August 2025 / Published: 14 August 2025
(This article belongs to the Section Building Materials, and Repair & Renovation)

Abstract

The retrofit of semi-open transitional spaces in university buildings is essential for enhancing both thermal comfort and energy efficiency. However, most studies have focused on conventional indoor environments, overlooking the unique thermal characteristics of semi-open spaces and their impact on occupant comfort. This study integrated field measurements, occupant surveys, and AirPak simulations to develop a three-tier evaluation framework covering environmental parameters, subjective thermal perception, and simulation-based validation. Focusing on teaching buildings at Zhejiang University’s Zijingang Campus, the analysis revealed that the retrofit increased the daily mean air temperature by 2.1 °C and decreased the relative humidity by 3.6% in winter. The peak thermal comfort indices PET and PMV improved by 4.4 °C and 0.98, respectively, with a neutral PET identified at 13.3 °C. PMV showed a stronger correlation with TSV (p = 0.94, R2 = 0.81) than PET. Simulations further validated the retrofit’s effectiveness in stabilizing the indoor thermal environment and reducing airflow discomfort. These findings provide both theoretical insights and practical guidance for the climate-responsive, energy-efficient retrofitting of campus buildings in hot summer and cold winter (HSCW) zones.

1. Introduction

With the growing emphasis on building energy conservation and the increasing demand for healthy indoor environments, thermal comfort has emerged as a critical topic in the field of building environmental studies [1]. As the primary interface for heat exchange between indoor and outdoor spaces, the building envelope plays a key role in determining both energy efficiency and the quality of the indoor thermal environment [2,3].
Thermal comfort, defined as a psychological state reflecting human satisfaction with the thermal environment, is influenced by the combined effects of multiple environmental parameters, including air temperature, relative humidity, air velocity, and mean radiant temperature [4,5]. Extensive research has been conducted on thermal comfort evaluation methods and their application scenarios. Among various evaluation indicators, the predicted mean vote (PMV) [6], physiological equivalent temperature (PET), and standard effective temperature (SET*) [7] have been widely applied to assess the thermal comfort performance of diverse building types, including residential buildings [6], office buildings [8], and gymnasiums [9]. These studies have contributed to a deeper understanding of the thermal environment characteristics and their influence on human thermal sensation in different indoor spaces.
In recent years, substantial progress has been made in outdoor thermal comfort research, with a particular focus on the influence mechanisms of factors such as solar radiation [10,11], the thermal properties of surface materials [11], vegetation coverage [10,12,13], and local wind environments [10,14]. Nevertheless, given that indoor spaces continue to serve as the primary settings for human activity [15], their direct and profound impact on thermal comfort warrants sustained research attention [16]. This need is particularly pressing in the context of climate change and the increasing frequency of extreme heat events [17,18,19], which pose new challenges for optimizing indoor thermal environments to improve occupant comfort and health.
University buildings, in particular, present unique challenges for thermal environment regulation due to long occupancy durations and high occupant densities [20]. Consequently, these buildings must balance the dual goals of reducing energy consumption and maintaining thermal comfort. Considerable efforts have been devoted to the thermal comfort assessment of campus buildings in various climatic regions. For instance, Liu et al. [21] conducted field measurements in the classrooms of a university in Northwestern China and reported a neutral temperature of 20.6 °C, a comfort range of 19.5–21.8 °C, and a preferred temperature of 22.8 °C. In Spain, De La Hoz-Torres et al. [22] identified a neutral temperature of 23 °C in a university campus setting, while Aghniaey et al. [23] used the PMV index to evaluate indoor thermal comfort at the University of Georgia (USA) and found 23.5 °C to be the most preferred and comfortable temperature for occupants.
Many university buildings in China were constructed in the 1980s and 1990s. Although these buildings are not very old in terms of their structural age, their outdated spatial design often fails to adequately address thermal comfort [24]. Among the various spatial challenges, issues related to semi-open spaces are particularly prominent. Semi-open spaces refer to areas that lie between fully enclosed indoor environments and the outdoors. Functioning as buffer zones, these spaces help mediate external climatic influences. They are commonly represented by covered walkways, overhead corridors, and eaves. In campus buildings, semi-open spaces are widely used to connect classrooms, offices, and other functional zones, and they are frequently accessed by students and staff. However, despite their prevalence, the thermal performance of such spaces has received limited attention in both architectural practice and academic research. Due to their partially enclosed nature, these spaces often suffer from significant thermal discomfort: cold air infiltration in winter and excessive solar heat gain in summer [25]. These conditions not only undermine users’ thermal comfort but also increase the fluctuation of indoor thermal loads, thereby intensifying the energy demand for air conditioning.
In university buildings, heating, ventilation, and air conditioning (HVAC) systems are essential for maintaining indoor thermal comfort, especially in climates with pronounced seasonal variations such as the hot summer and cold winter (HSCW) zone. Recent studies have shown that HVAC retrofits in university buildings can improve energy efficiency while addressing both public and private interests [26]. However, in many Chinese universities—including the West Teaching Building at Zhejiang University—semi-open transitional spaces such as corridors and overhead walkways are not equipped with HVAC systems. These areas mainly rely on passive design, so deficiencies in the building envelope can significantly affect adjacent air-conditioned rooms by increasing heat gains in summer and heat losses in winter. This not only reduces comfort in both spaces but also causes fluctuations in HVAC loads, leading to higher energy consumption and lower system efficiency.
Although envelope retrofitting has made significant progress in optimizing thermal comfort for residential and office buildings, adaptive research targeting specific building types remains insufficient. In particular, in university campus buildings, the thermal optimization of the building envelope not only impacts overall energy consumption but also directly affects the learning and working comfort of students and faculty members [20]. Semi-open spaces, in particular, present unique spatial and thermal characteristics, and relevant research still exhibits notable gaps, specifically in the following areas: First, thermal environment optimization studies tend to focus on energy consumption simulations, while coupling analyses involving field measurements and occupant subjective feedback are often neglected. Second, the existing studies mainly concentrate on standard classrooms and other conventional functional spaces, with limited research addressing the thermal performance of semi-open transitional public spaces and a lack of systematic evaluation. Third, in the domain of numerical simulation, steady-state or simplified models are often adopted, with limited calibration and validation based on field measurements, thereby reducing the accuracy and applicability of simulation results.
In response to the above issues, this study investigates the semi-open transition space of the West Teaching Building at the Zijingang Campus of Zhejiang University, with a focus on the enclosure retrofit of its building envelope. The site was selected because it is located in Hangzhou, a representative city in China’s hot summer and cold winter (HSCW) climate zone, where pronounced seasonal temperature variations pose considerable challenges to maintaining thermal comfort, especially in semi-open spaces. In addition, the space has undergone an actual envelope retrofit, offering a valuable opportunity to examine the thermal environment under real-world renovation conditions. Unlike most previous studies that rely solely on field measurements, this research combines the on-site monitoring of environmental parameters, occupant thermal comfort surveys, and CFD simulations calibrated with measured data, integrating them into a comprehensive evaluation framework to systematically assess the retrofit’s impact on the thermal environment. The findings offer both theoretical insights and practical guidance for the climate-responsive renovation of university buildings in regions characterized by hot summers and cold winters.

2. Methodology

2.1. Study Area and Retrofit Strategy

The study was conducted at the Zijingang Campus of Zhejiang University, located in Xihu District, Hangzhou, Zhejiang Province, China (120.08° E, 30.30° N). Figure 1 provides an overview of the study site. According to the national classification for building thermal design, Hangzhou is categorized as a typical hot summer and cold winter (HSCW) climate zone [27]. The local climate is characterized by hot and humid conditions in summer, cold and rainy conditions in winter, and significant annual temperature fluctuations. The mean air temperature in January, the coldest month, is recorded at 5.1 °C, whereas in July, the hottest month, it reaches 28.8 °C. Throughout the year, relative humidity remains consistently high, typically ranging between 70% and 85%. These climatic features have been shown to exert a significant influence on indoor thermal comfort, making both summer cooling and winter heat retention key concerns for building design and human thermal environment research in this region.
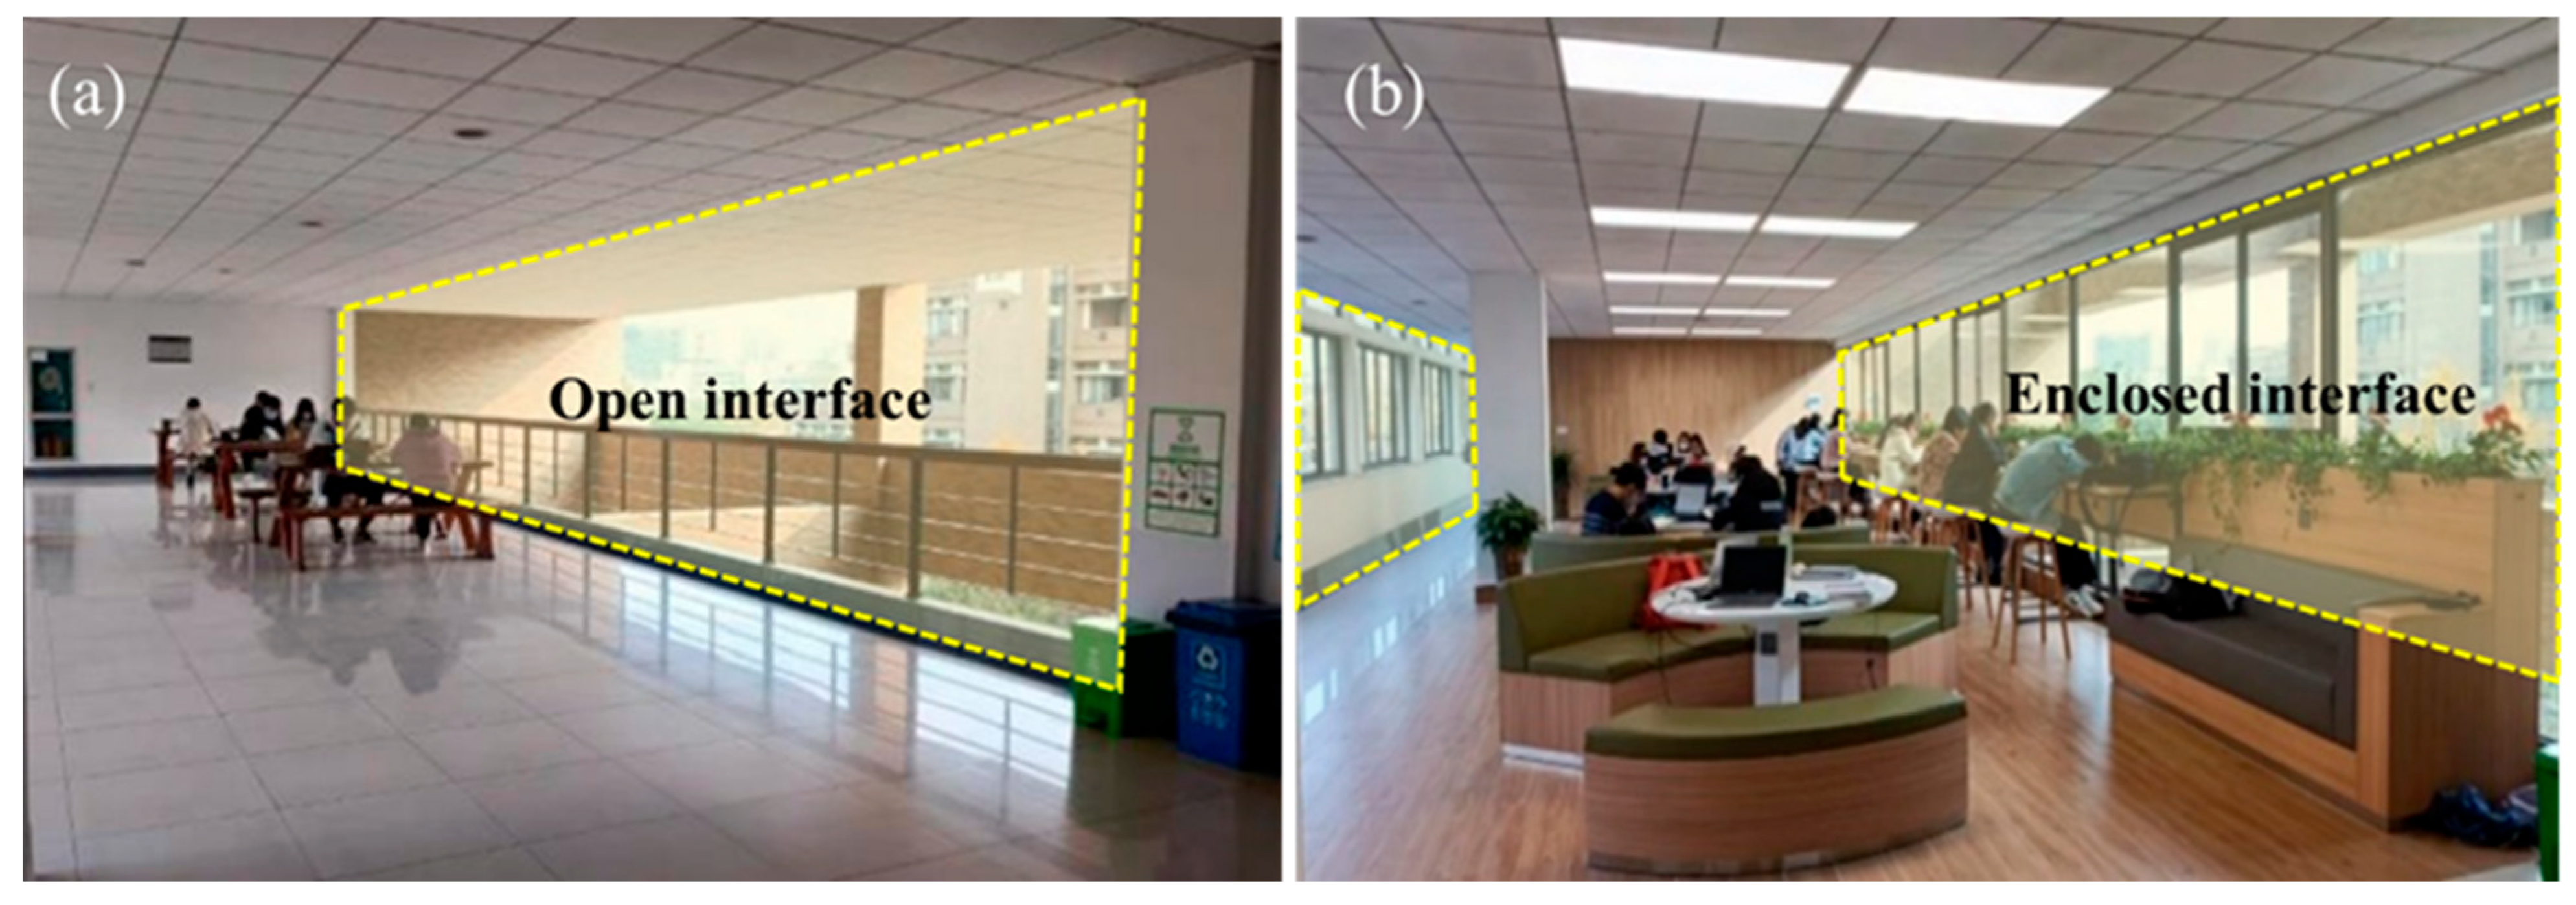
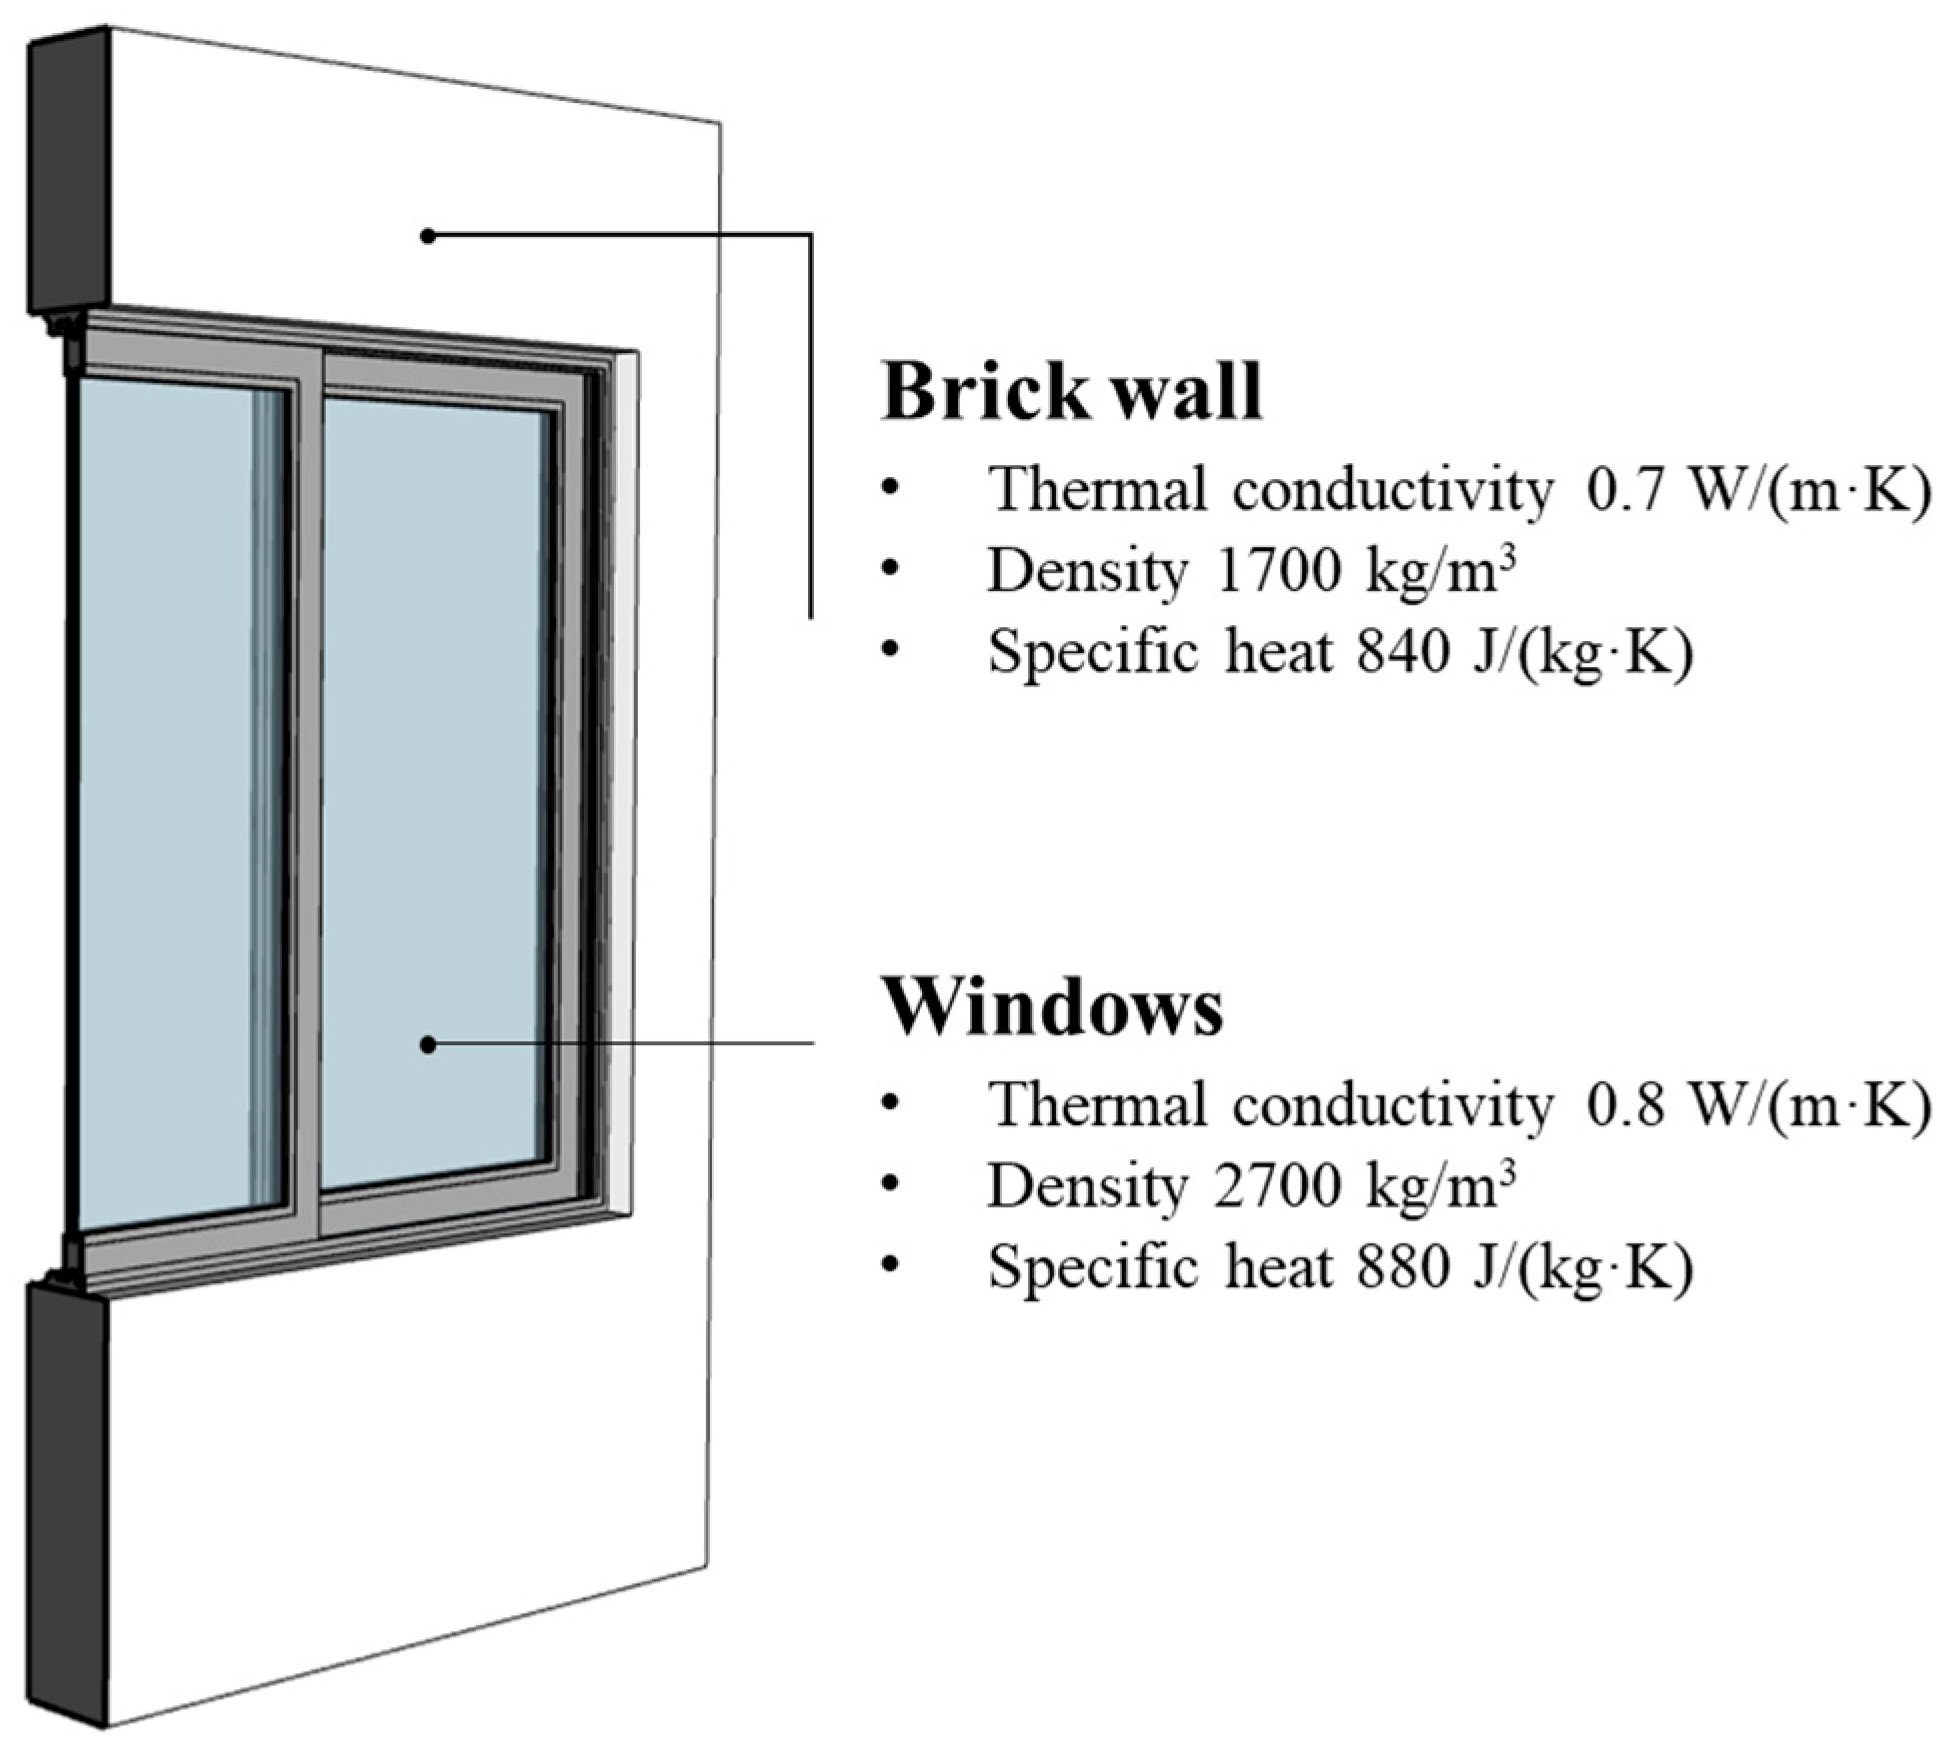
This study focused on a transitional space located on the second and third floors of the West Teaching Building at the Zijingang Campus of Zhejiang University. The selected area features a rectangular layout measuring 14 m × 5 m, with a clear ceiling height of 3 m (see Figure 2a). For comparative analysis, an unretrofitted space on the fourth floor was used as a reference, retaining the original open façade with a southern balustrade (Figure 2a). Through envelope retrofitting and indoor environment optimization, the transitional space was functionally upgraded (see Figure 2b). The retrofitted envelope components are shown in Figure 3. Operable single-glazed windows were installed on both the northern and southern façades to enable cross-ventilation. In summer, the windows could be opened to enhance airflow and mitigate stuffiness; in winter, they remained closed in conjunction with the existing solid walls, forming a thermal buffer that helped reduce heat loss. Further improvements included repainting interior surfaces with light-colored coatings to enhance daylight reflectance and installing evenly distributed LED panel lights on the ceiling. The thermal experience of the space was also enriched through the use of warm-toned wooden furniture and fabric-based soft furnishings.

2.2. Data Collection

A combination of field measurements and questionnaire surveys was employed to capture both physical environmental parameters and subjective thermal perceptions before and after the envelope retrofit. This approach provided a comprehensive and balanced assessment of the retrofit’s impact on the thermal environment. Data collection was conducted on two representative winter days: a sunny day (13 December 2021) and an overcast, rainy day (24 December 2021). The measurement scheme and equipment deployment were carried out in strict accordance with the national Standard for Thermal Environment Test Methods of Buildings [28] and the ISO 7726:1998 standard [29].
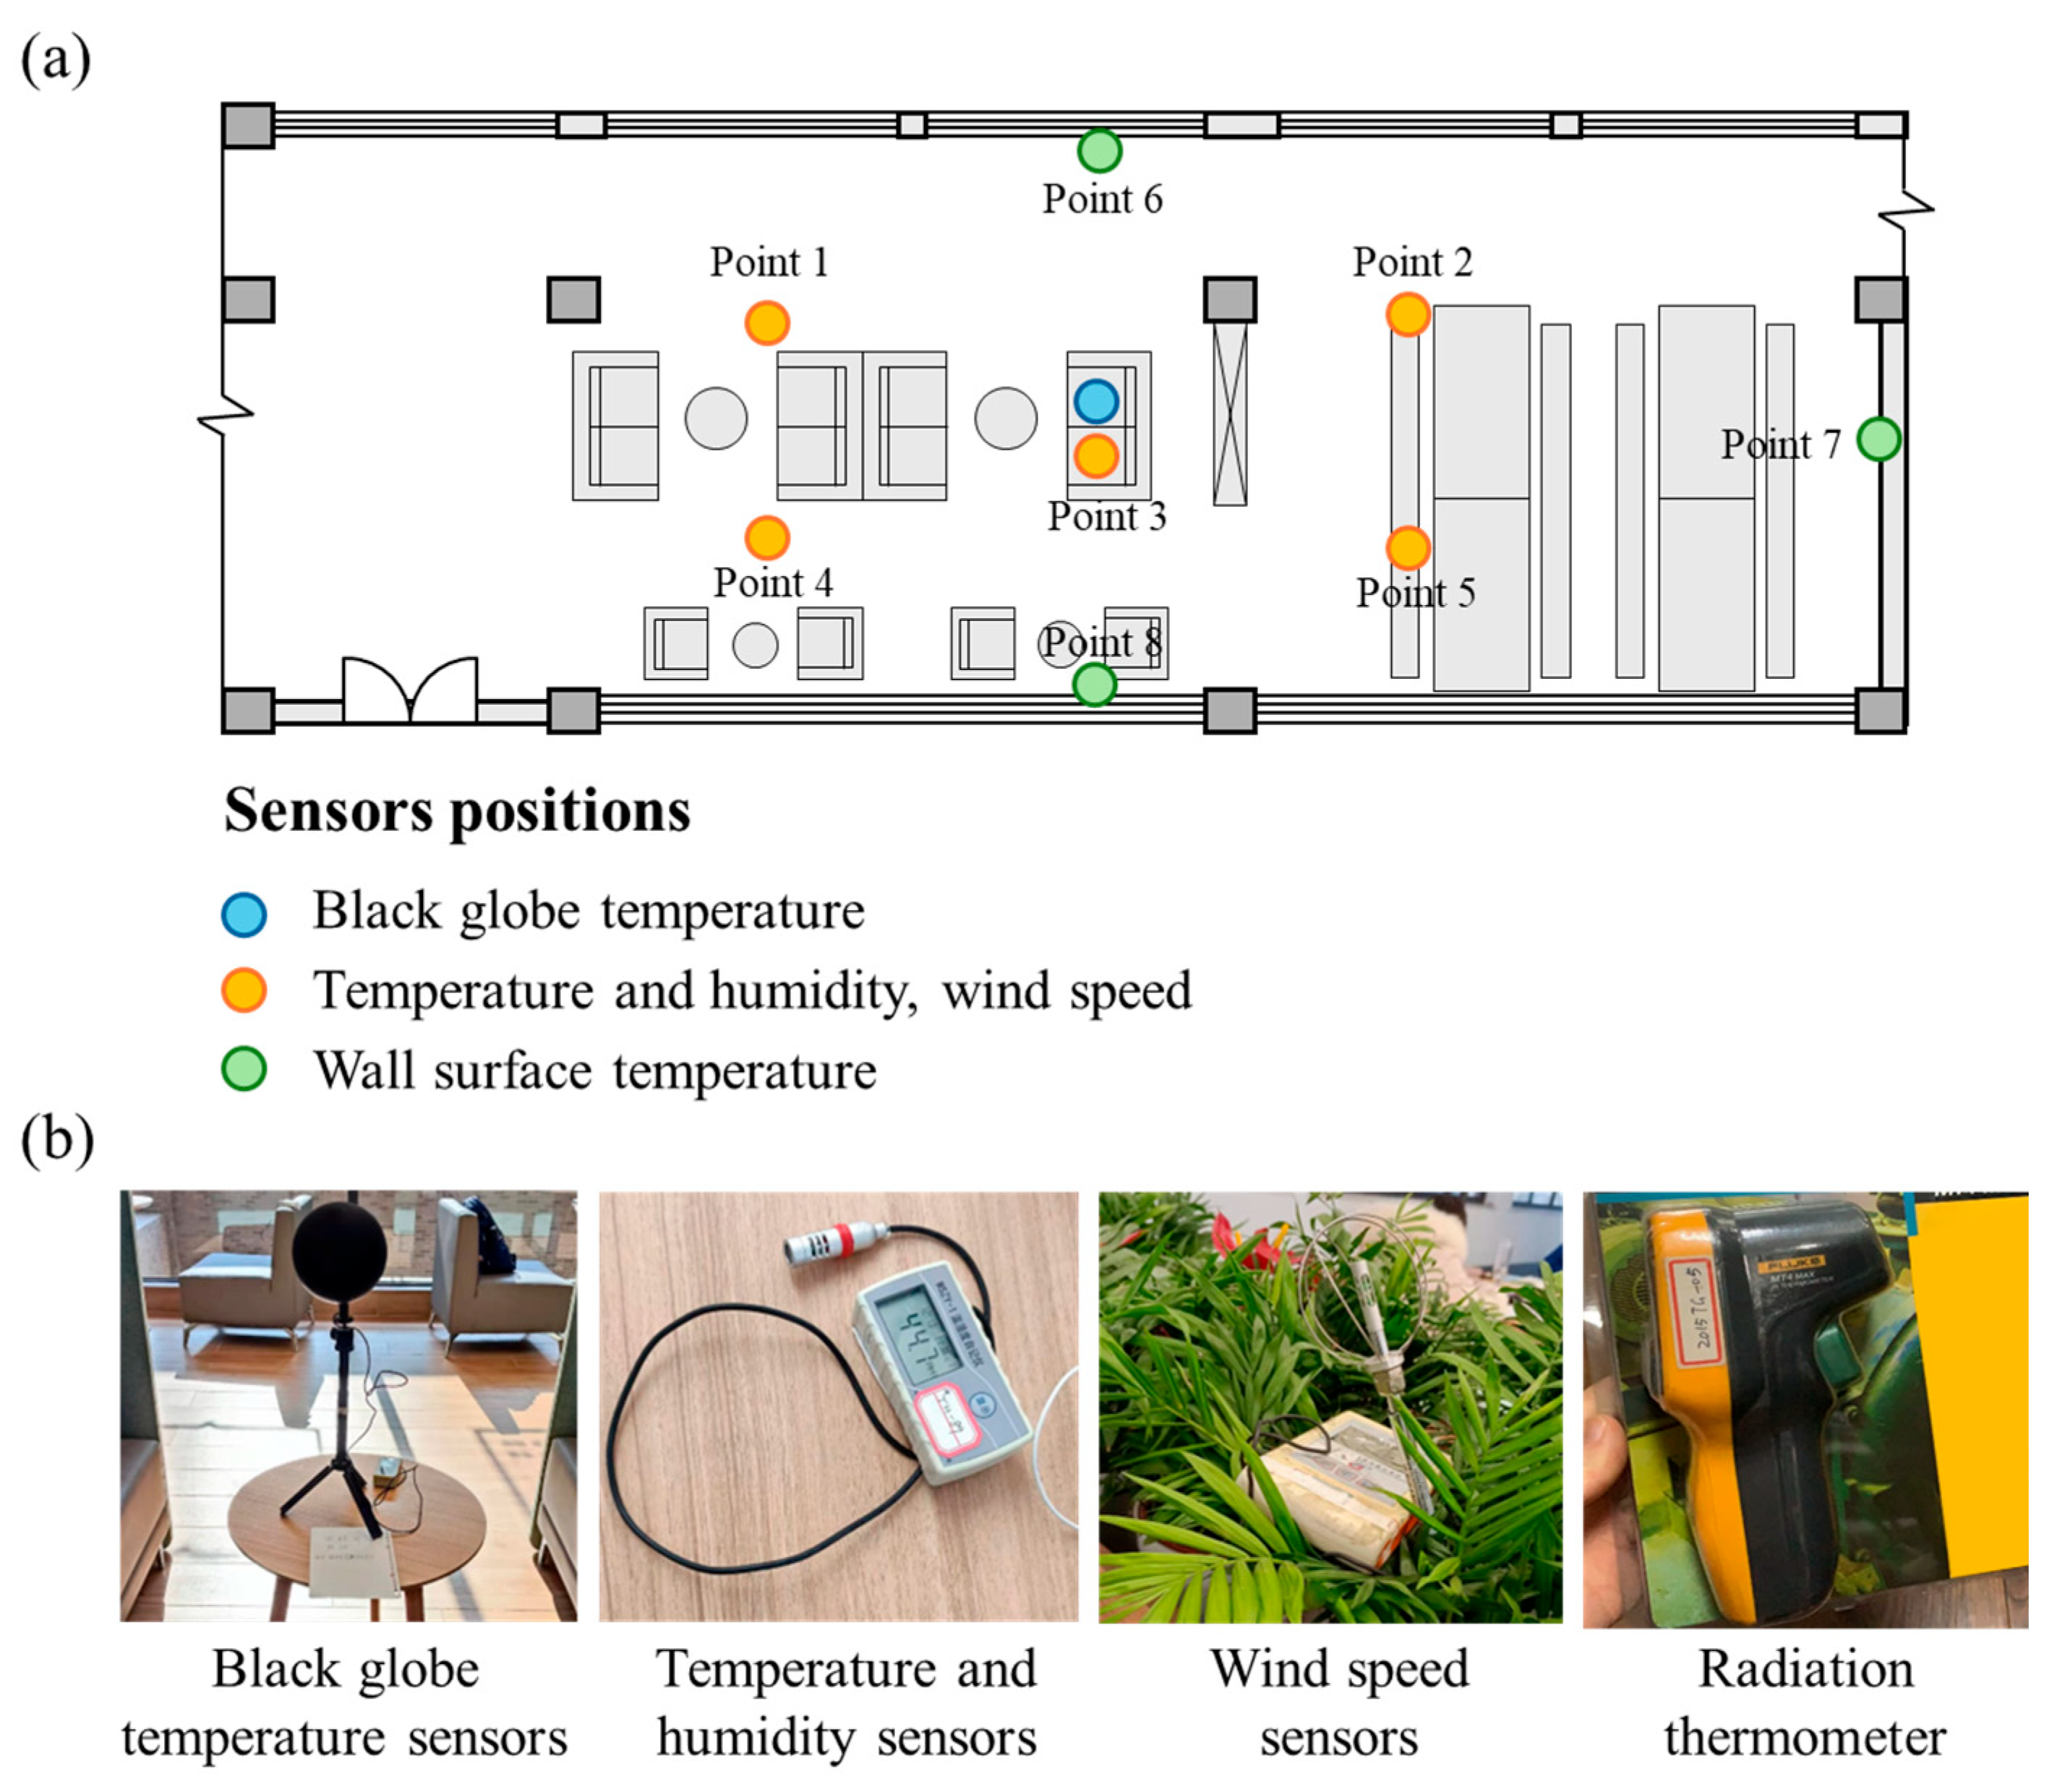
In this study, eight measurement points were arranged on each of the three test floors, including the pre-retrofit fourth floor and the post-retrofit second and third floors (see Figure 4a). The measurement points were functionally divided as follows: Points 1–5 were positioned at a height of 0.6 m, corresponding to the sensitive zone for seated occupants’ thermal perception, where air temperature, relative humidity, and air velocity were continuously recorded. At Point 3, a globe thermometer was additionally deployed to allow for the calculation of mean radiant temperature. Points 6–8 were specifically assigned for monitoring the surface radiant temperatures of interior walls.
All monitoring activities were conducted continuously for a 12 h period, from 08:00 to 20:00, covering the entire typical occupancy schedule. Six environmental parameters were recorded at one-minute intervals, including air velocity, dry-bulb temperature, globe temperature, relative humidity, and wall surface radiant temperature. The instruments used in the measurements are listed in Table 1. Prior to deployment, all equipment was calibrated to ensure the accuracy and reliability of the multi-parameter dataset.

2.3. Thermal Comfort Indices

2.3.1. Calculation of Physical Indices

The physiological equivalent temperature (PET) is a thermal comfort index proposed in 1999 based on the MEMI human energy balance model [30]. PET is defined as the air temperature at which, in a typical indoor environment, a human being would experience the same core and skin temperatures as under a given set of complex outdoor conditions. PET integrates air temperature, relative humidity, wind speed, mean radiant temperature, clothing insulation, and metabolic rate, all of which are closely related to the human thermal sensation [31]. Compared to traditional indices, PET more comprehensively accounts for human physiological responses, thereby significantly improving the prediction accuracy of thermal perception. In this study, PET was calculated using the Rayman Pro model, with the mean radiant temperature (Tmrt) derived from Equation (1).
T mrt = T g + 273.15 4 + 1.335 × 10 8 × v 0.71 ε g × D 0.4 T g T a 1 4 273.15
where Tmrt is the mean radiant temperature, °C, Tg is the black globe temperature, °C, v is the wind speed, m/s, εg is the emissivity of the globe, which is 0.95 for a matte black globe, D is the diameter of a black globe, which is 0.05 m, and Ta is the air temperature, °C.
Given that the transitional space in the academic building exhibits both indoor and outdoor thermal characteristics and is significantly affected by dynamic factors such as solar radiation and wind, no single index can fully characterize its thermal environment. Therefore, this study employed both PET and PMV to enable a complementary evaluation. PET is well suited to outdoor and semi-outdoor environments due to its sensitivity to meteorological variables such as solar radiation and wind speed, as well as its integration of human physiological parameters like metabolic rate and clothing insulation. Its output in degrees Celsius makes it intuitive and easily comparable to air temperature, which facilitates result interpretation. PET has also been widely validated and applied in outdoor and semi-outdoor thermal comfort studies, making it a mature and robust index for evaluating transitional spaces. PMV, on the other hand, remains the most widely accepted indicator for steady-state indoor environments and is endorsed in major thermal comfort standards such as ASHRAE 55.
The predicted mean vote (PMV) index was developed based on Fanger’s steady-state heat transfer model [32] and has since been refined into the seven-point thermal sensation scale defined in ASHRAE Standard 55-2017 [33]: +3 (Hot), +2 (Warm), +1 (Slightly Warm), 0 (Neutral), −1 (Slightly Cool), −2 (Cool), −3 (Cold). PMV is a function of various environmental parameters and is calculated using Equation (2).
P M V = f ( T a , T mrt , v , p a , M , I cl )
where the following applies: Ta is air temperature, °C; Tmrt is mean radiant temperature, °C; v is relative air velocity, m/s; pa is vapor pressure, kPa; M is metabolic rate, W/m2; and Icl is clothing insulation, clo.

2.3.2. Subjective Surveys

Subjective thermal comfort surveys were conducted in parallel with the physical measurements, targeting the occupants of the self-study space. A total of 123 valid questionnaires were collected, including 63 male respondents and 60 female respondents. The surveys were randomly distributed, and the content neither involved personal privacy nor posed any physical or psychological risks to the participants. The questionnaire was divided into three sections:
(1)
Basic demographic information, including gender and age;
(2)
Evaluation of thermal comfort and clothing insulation prior to the envelope retrofit, quantified using the Thermal Sensation Vote (TSV) and Thermal Comfort Vote (TCV);
(3)
Assessment of thermal comfort and clothing insulation after the retrofit, as well as participants’ expectations, preferences, and acceptability of the thermal environment.
The questionnaire design followed the ASHRAE Standard 55-2017 [33], ASHRAE 55-2013 [34], and ISO 7730:2005 guidelines [35] to ensure methodological rigor and consistency. As it follows internationally recognized standards and has been widely applied in previous thermal comfort studies, no additional reliability analysis (e.g., Cronbach’s alpha) was conducted. The detailed questionnaire can be found in Appendix A.1, and for transparency, the distribution of valid survey responses across two-hour bins is presented in Appendix A.2.

2.4. Numerical Simulation

Airpak 3.0 software was employed for simulating the indoor thermal environment. And it is commercial computational fluid dynamics (CFD) software specifically developed for HVAC applications. Built upon the robust and extensively validated Ansys Fluent solver, AirPak ensures high numerical accuracy while offering a more streamlined and application-specific workflow tailored to building physics. Based on the finite volume method and equipped with an automatic meshing module optimized for indoor spaces, it offers a more user-friendly operation compared to general-purpose CFD software. As such, it is considered one of the most effective tools for simulating indoor airflow and thermal conditions [36]. Compared to Ansys Fluent and OpenFOAM, which are general-purpose CFD solvers requiring extensive customization and pre-/post-processing efforts, AirPak 3.0 provides a more efficient and accessible platform for building-related thermal comfort simulations, especially when the focus is on indoor airflow and HVAC performance.

2.5. Data Analysis

Three analytical methods were applied: the Wilcoxon signed-rank test, Spearman correlation analysis, and linear regression. The Wilcoxon signed-rank test was used to assess the significance of changes in the thermal environment before and after the retrofit. Correlation analysis was performed to explore the relationship between subjective mean thermal sensation vote (MTSV) and objective indices (PMV, PET), as well as physical environmental parameters. Linear regression was used to establish quantitative relationships between TSV, PMV, and PET, thereby validating the reliability of the physical indices in evaluating thermal comfort.

3. Results

3.1. Changes in Thermal Environment Before and After the Retrofit

Figure 5 illustrates the variation in air temperature (Ta), relative humidity (RH), and mean radiant temperature (Tmrt) at five measurement points before and after the envelope retrofit. For the retrofitted condition, thermal environmental parameters were calculated as the average values from both the second and third floors.
The results indicate that the envelope retrofit significantly improved both air temperature and relative humidity within the semi-enclosed space. The Wilcoxon signed-rank test confirmed the statistical significance of these changes. On clear days, the average air temperature increased from 12.5 °C (pre-retrofit) to 14.6 °C (post-retrofit), with the daily peak temperature rising from 13.7 °C to 18.4 °C. Meanwhile, the average relative humidity decreased from 49.4% to 45.8%, corresponding to a reduction of 3.6%.
Notably, although both air temperature and humidity increased, the average Tmrt decreased from 13.5 °C to 12.3 °C. This reduction can be attributed to the newly installed envelope components, which blocked part of the incoming solar radiation and thus reduced the net radiative heat input.
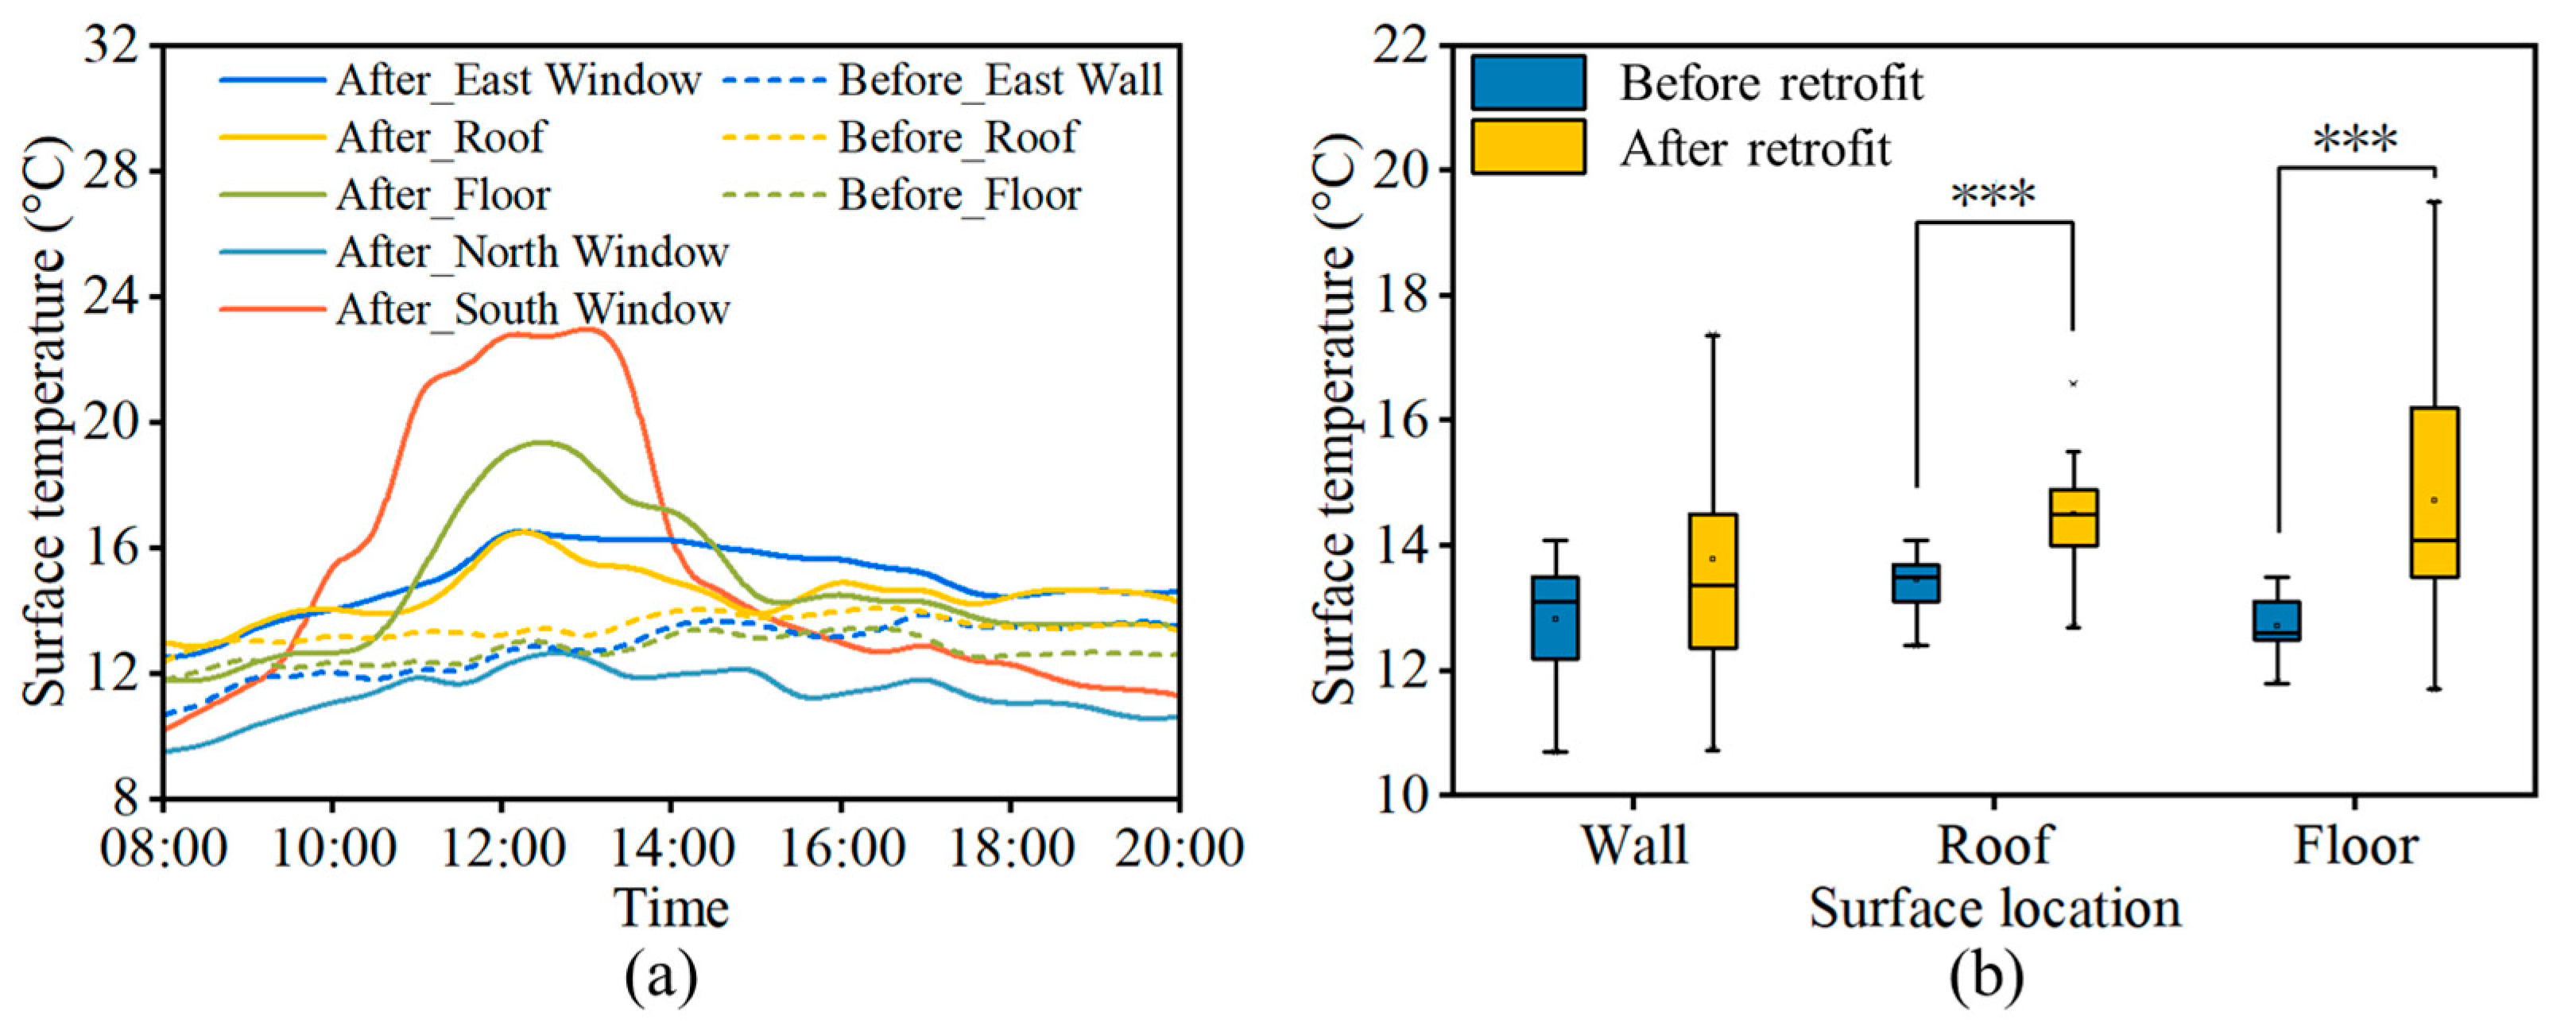
Figure 6 presents the surface temperature distribution characteristics of the floor, walls, ceiling, and windows before and after renovation. The results show that the south-facing windows exhibited the largest temperature fluctuations after renovation due to direct solar radiation. Other envelope surfaces also experienced varying degrees of temperature increase. The Wilcoxon signed-rank test was employed to assess the statistical significance of these differences. Wall surface temperatures did not exhibit significant changes (p > 0.05), while both the roof and floor temperatures showed highly significant increases (p < 0.001). Specifically, the mean roof temperature rose by 1.04 °C, and the mean floor temperature increased by 2.08 °C compared to the pre-renovation condition. These results indicate that the envelope retrofit effectively enhanced the insulation performance of the building, reducing heat loss, particularly at locations with high thermal exchange intensity, such as the floor. Furthermore, the more uniform and elevated surface temperatures also reflect the improved stability of the indoor thermal environment, which is conducive to enhancing occupants’ thermal comfort.

3.2. Impact of Renovation on Indoor Thermal Comfort

3.2.1. Objective Evaluation

Due to the semi-open characteristics of the transition space in the teaching building, its thermal environment was highly influenced by outdoor dynamic conditions before window installation. After window installation, the space exhibited more stable indoor thermal conditions. Therefore, both the physiological equivalent temperature (PET) and the predicted mean vote (PMV) were adopted in this study to comprehensively assess thermal comfort under various meteorological conditions.
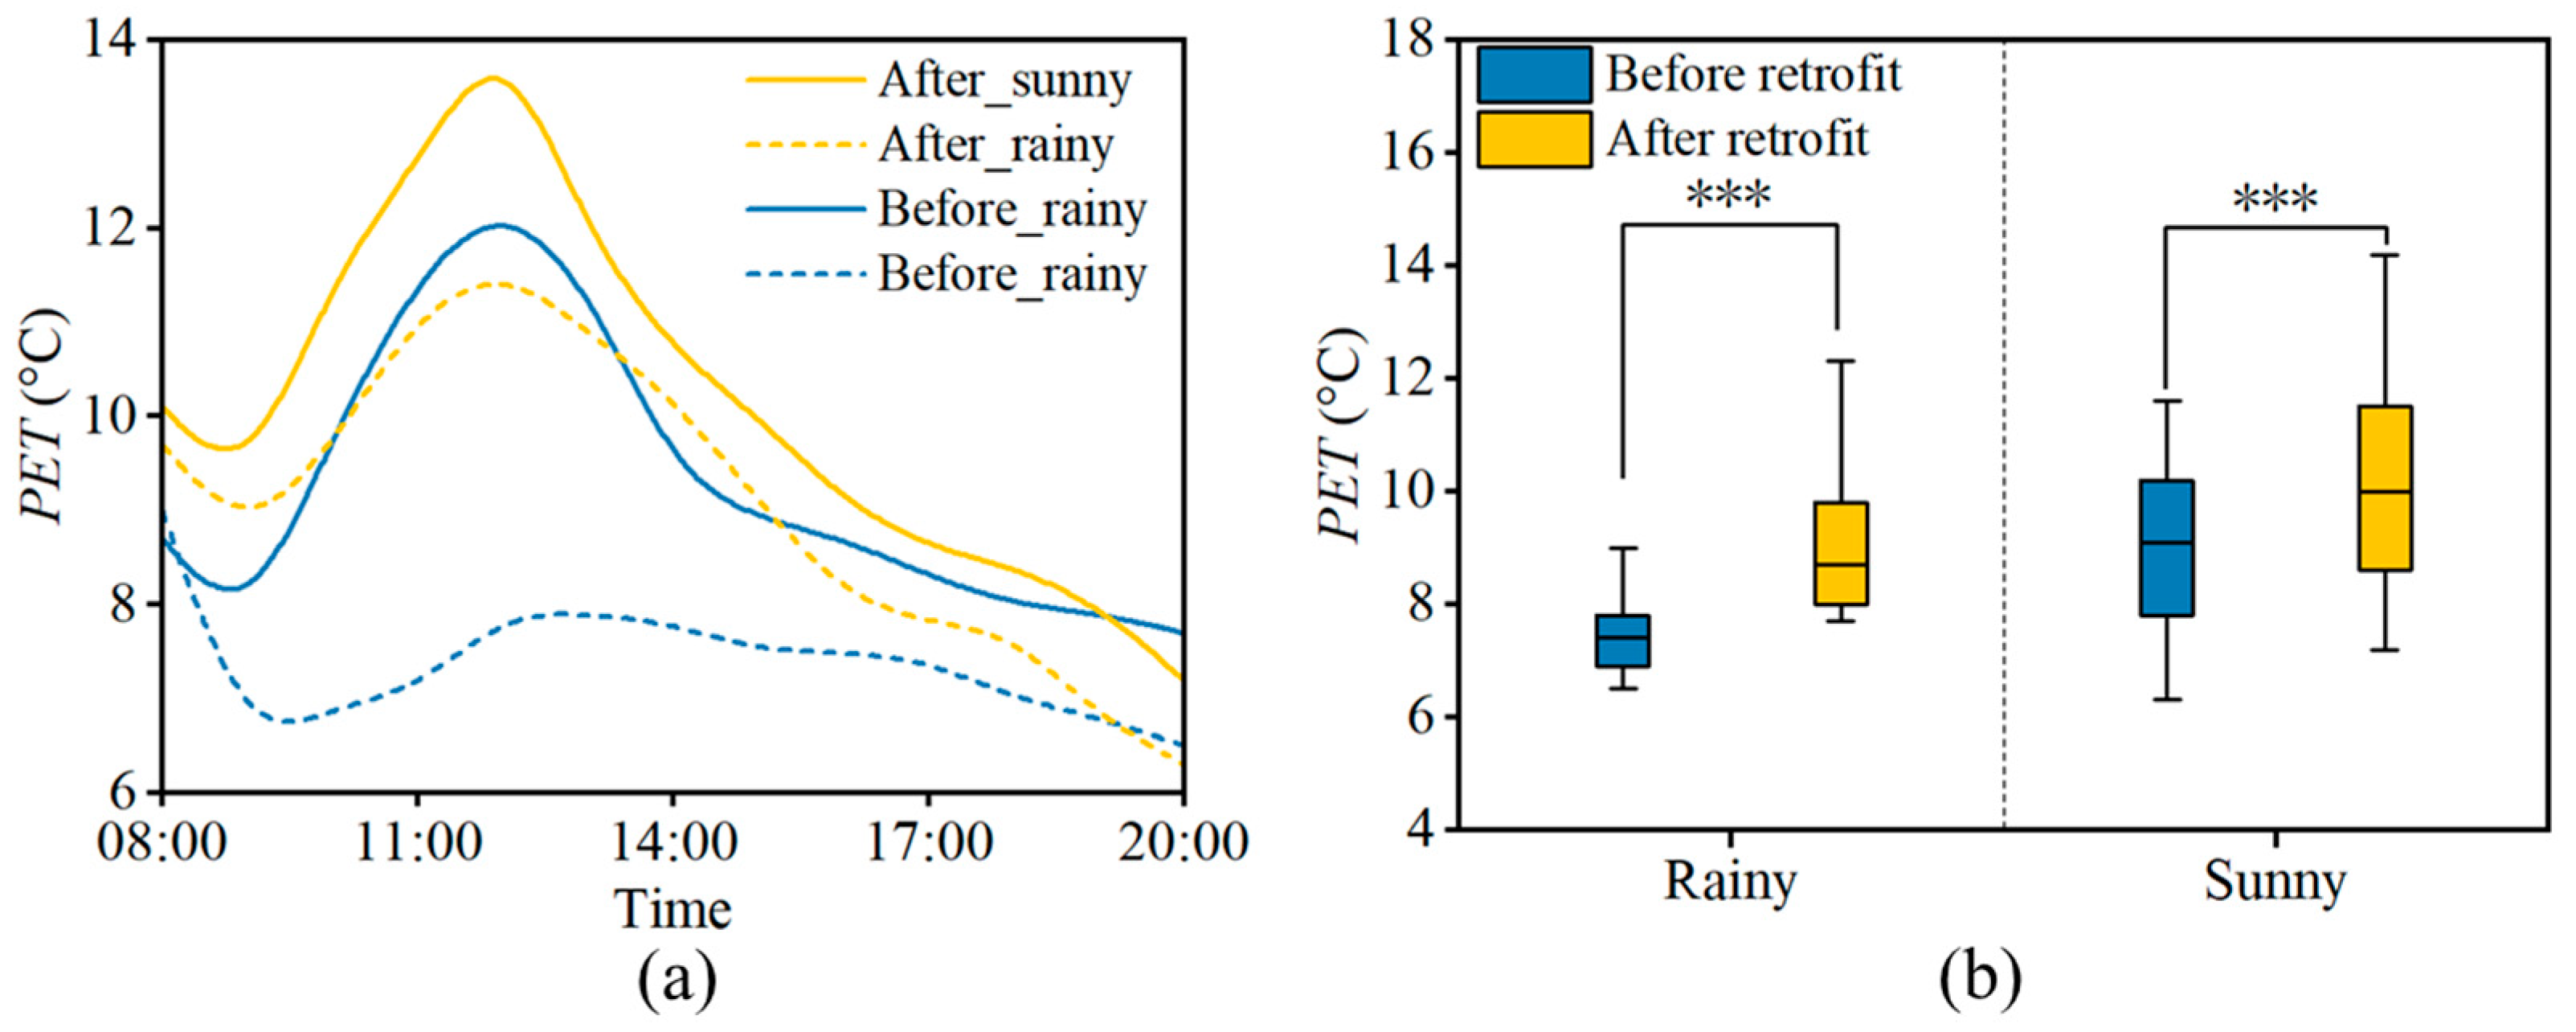
The window retrofit significantly enhanced the thermal comfort of the transitional space in the teaching building by bringing PET values closer to the comfort range, with particularly notable improvements under rainy conditions. As illustrated in Figure 7, PET values before and after the envelope retrofit showed clear differences. Under sunny conditions, the daily mean PET increased from 9.1 °C before the retrofit to 10.1 °C after the retrofit, with a peak daytime rise of 2.6 °C. While under rainy conditions, the daily mean PET rose from 7.4 °C to 9.3 °C, with a peak increase of 4.4 °C. These changes indicate a marked reduction in cold stress and a substantial improvement in overall thermal comfort.
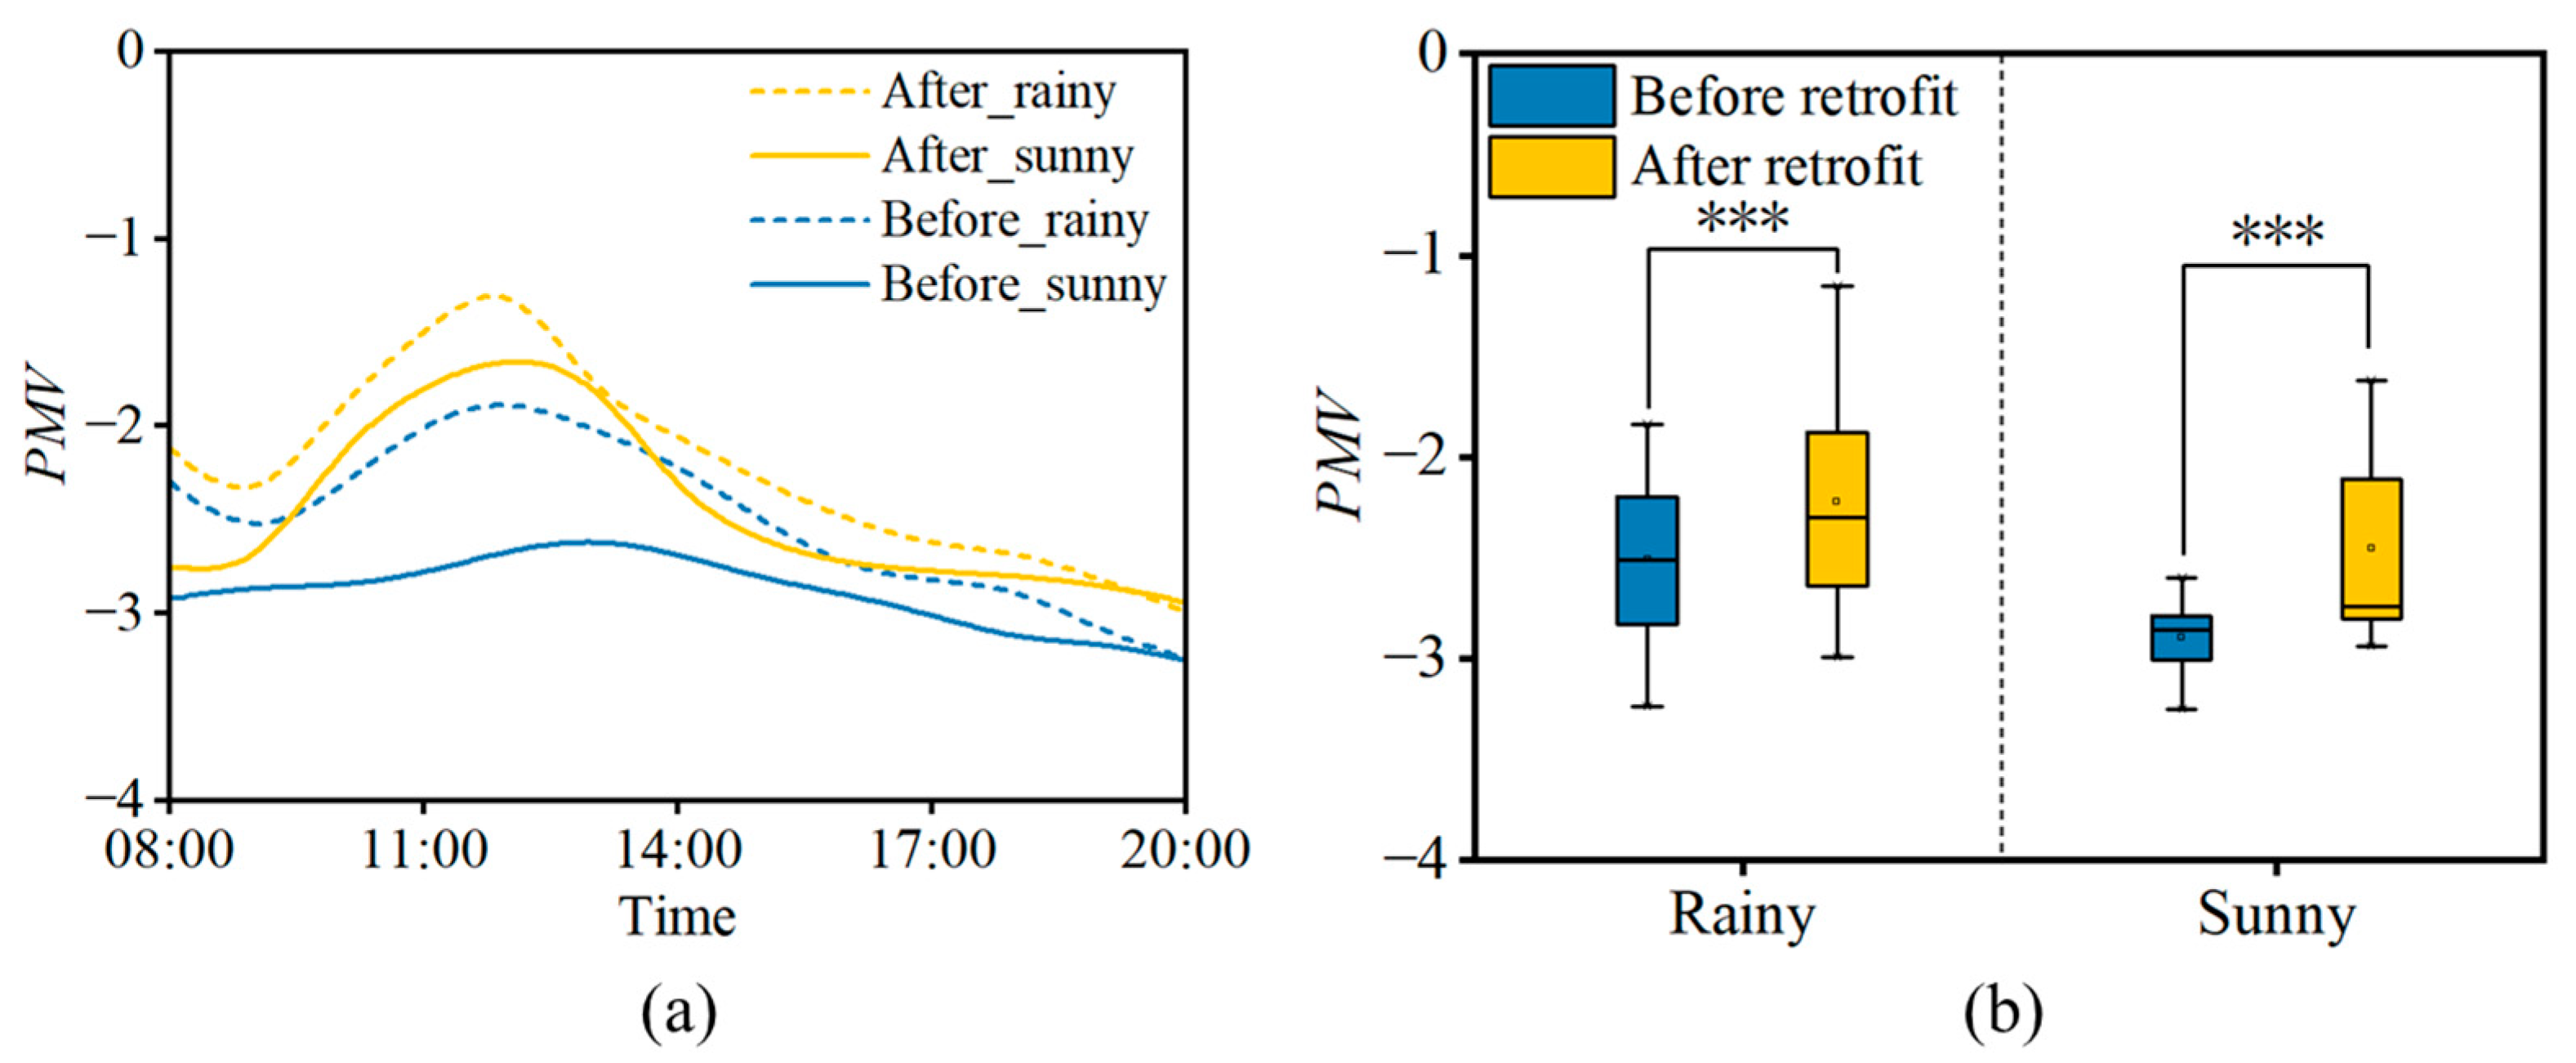
Figure 8 presents PMV as another objective thermal comfort index, reflecting the thermal comfort conditions of the indoor environment. Similar to PET, the envelope retrofit significantly improved the PMV in the transitional space, bringing it closer to the comfort range. Under sunny conditions, the daily mean PMV before the retrofit was −2.90, corresponding to a “very cold” state and indicating considerable cold stress. After the retrofit, the daily mean PMV increased to −2.45, with a mean rise of 0.45 and a peak increase of 0.98, reflecting a noticeable alleviation in cold stress. Under rainy conditions, the daily mean PMV increased from −2.48 before the retrofit to −2.15 after the retrofit, with a mean rise of 0.33 and a peak increase of 0.69.

3.2.2. Subjective Evaluation

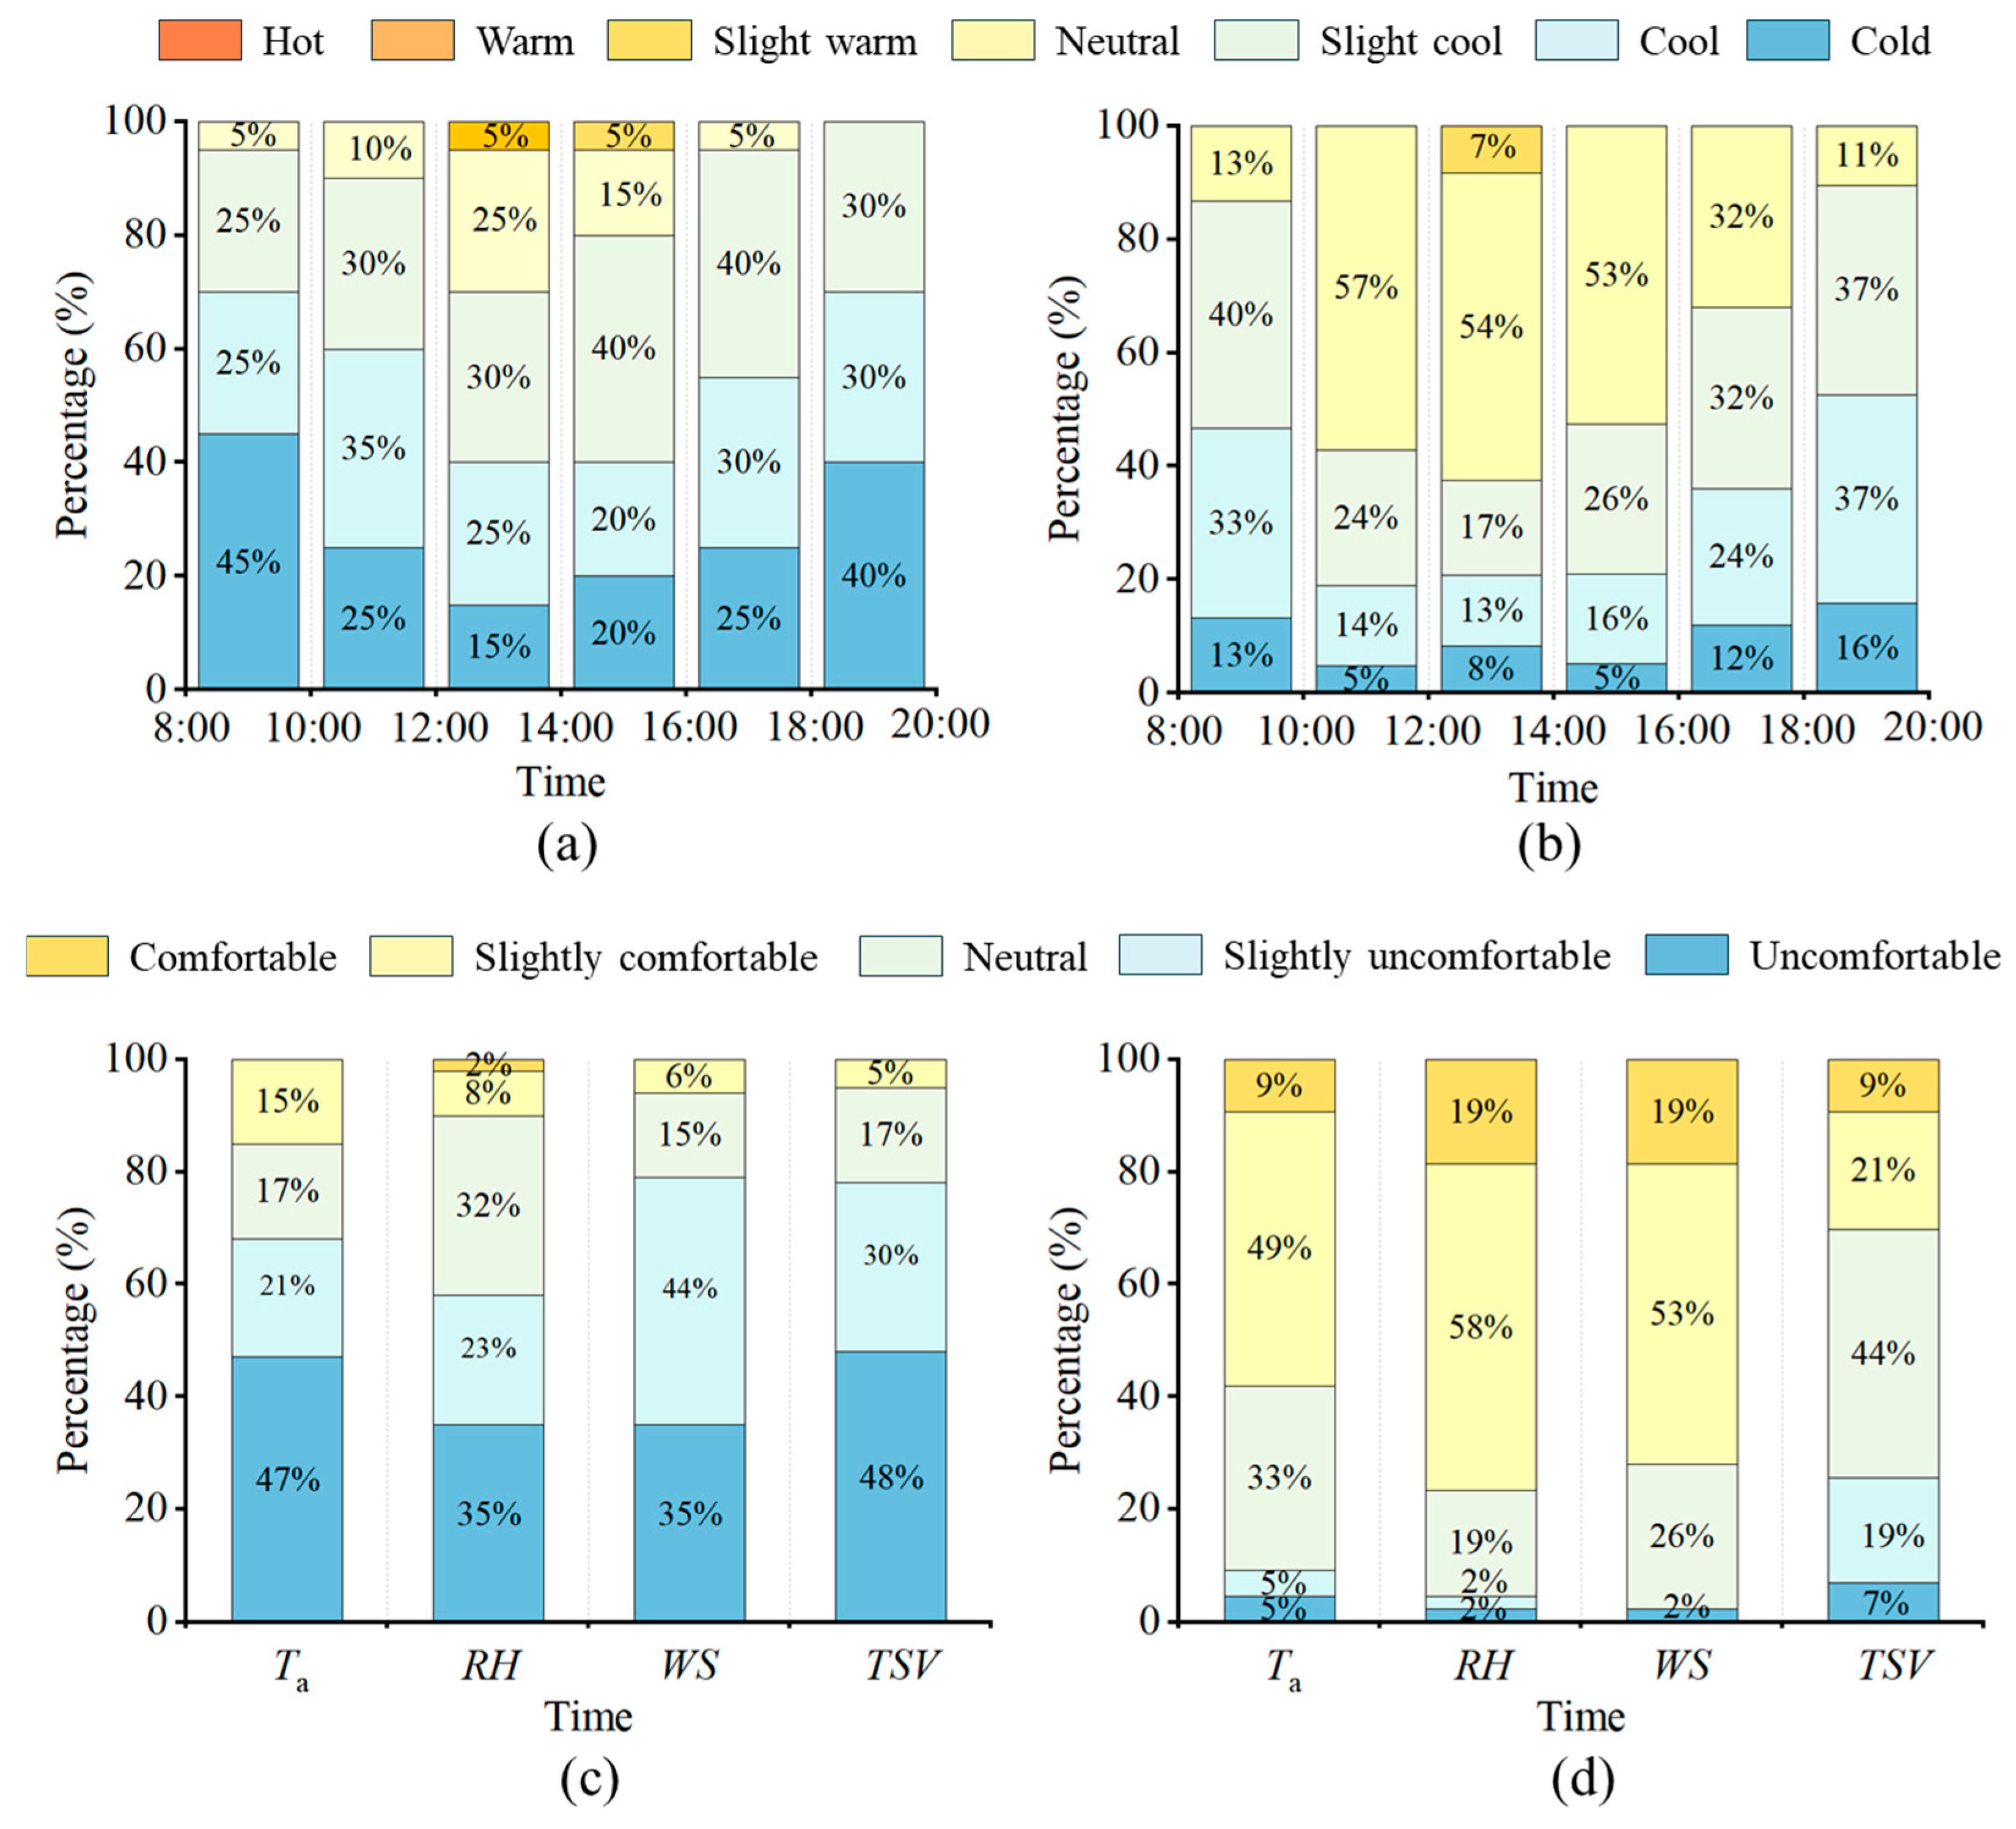
Figure 9a,b illustrate the distribution of thermal sensation votes (TSVs) from users across different time periods (08:00–20:00) before and after the envelope retrofit during winter. Before the retrofit, TSVs were predominantly in the “cold” (15–45%) and “slightly cold” (25–35%) categories, while the proportion of “neutral” votes was only 5–25%. After the retrofit, the percentage of “cold” votes dropped to 5–16%, and the proportion of “neutral” votes increased significantly to 13–57%, with the most notable improvement occurring between 10:00 and 16:00.
Figure 9c,d show the distribution of thermal comfort votes (TCVs) related to different environmental parameters before and after the retrofit. Similar to the TSV results, the users’ perception of the cooling effects of Ta, relative humidity RH, and wind speed (WS) showed a substantial reduction in discomfort. The proportion of “cold” votes for these parameters decreased from 47%, 35%, and 48%, respectively, to below 10%. Meanwhile, the proportion of “comfortable” votes increased from below 15% to 21–58%, with the greatest improvements observed in response to air temperature and relative humidity. These findings further confirm that the envelope retrofit significantly enhanced thermal comfort and improved the stability of thermal sensation.

3.2.3. Correlation Between Subjective and Objective Indicators

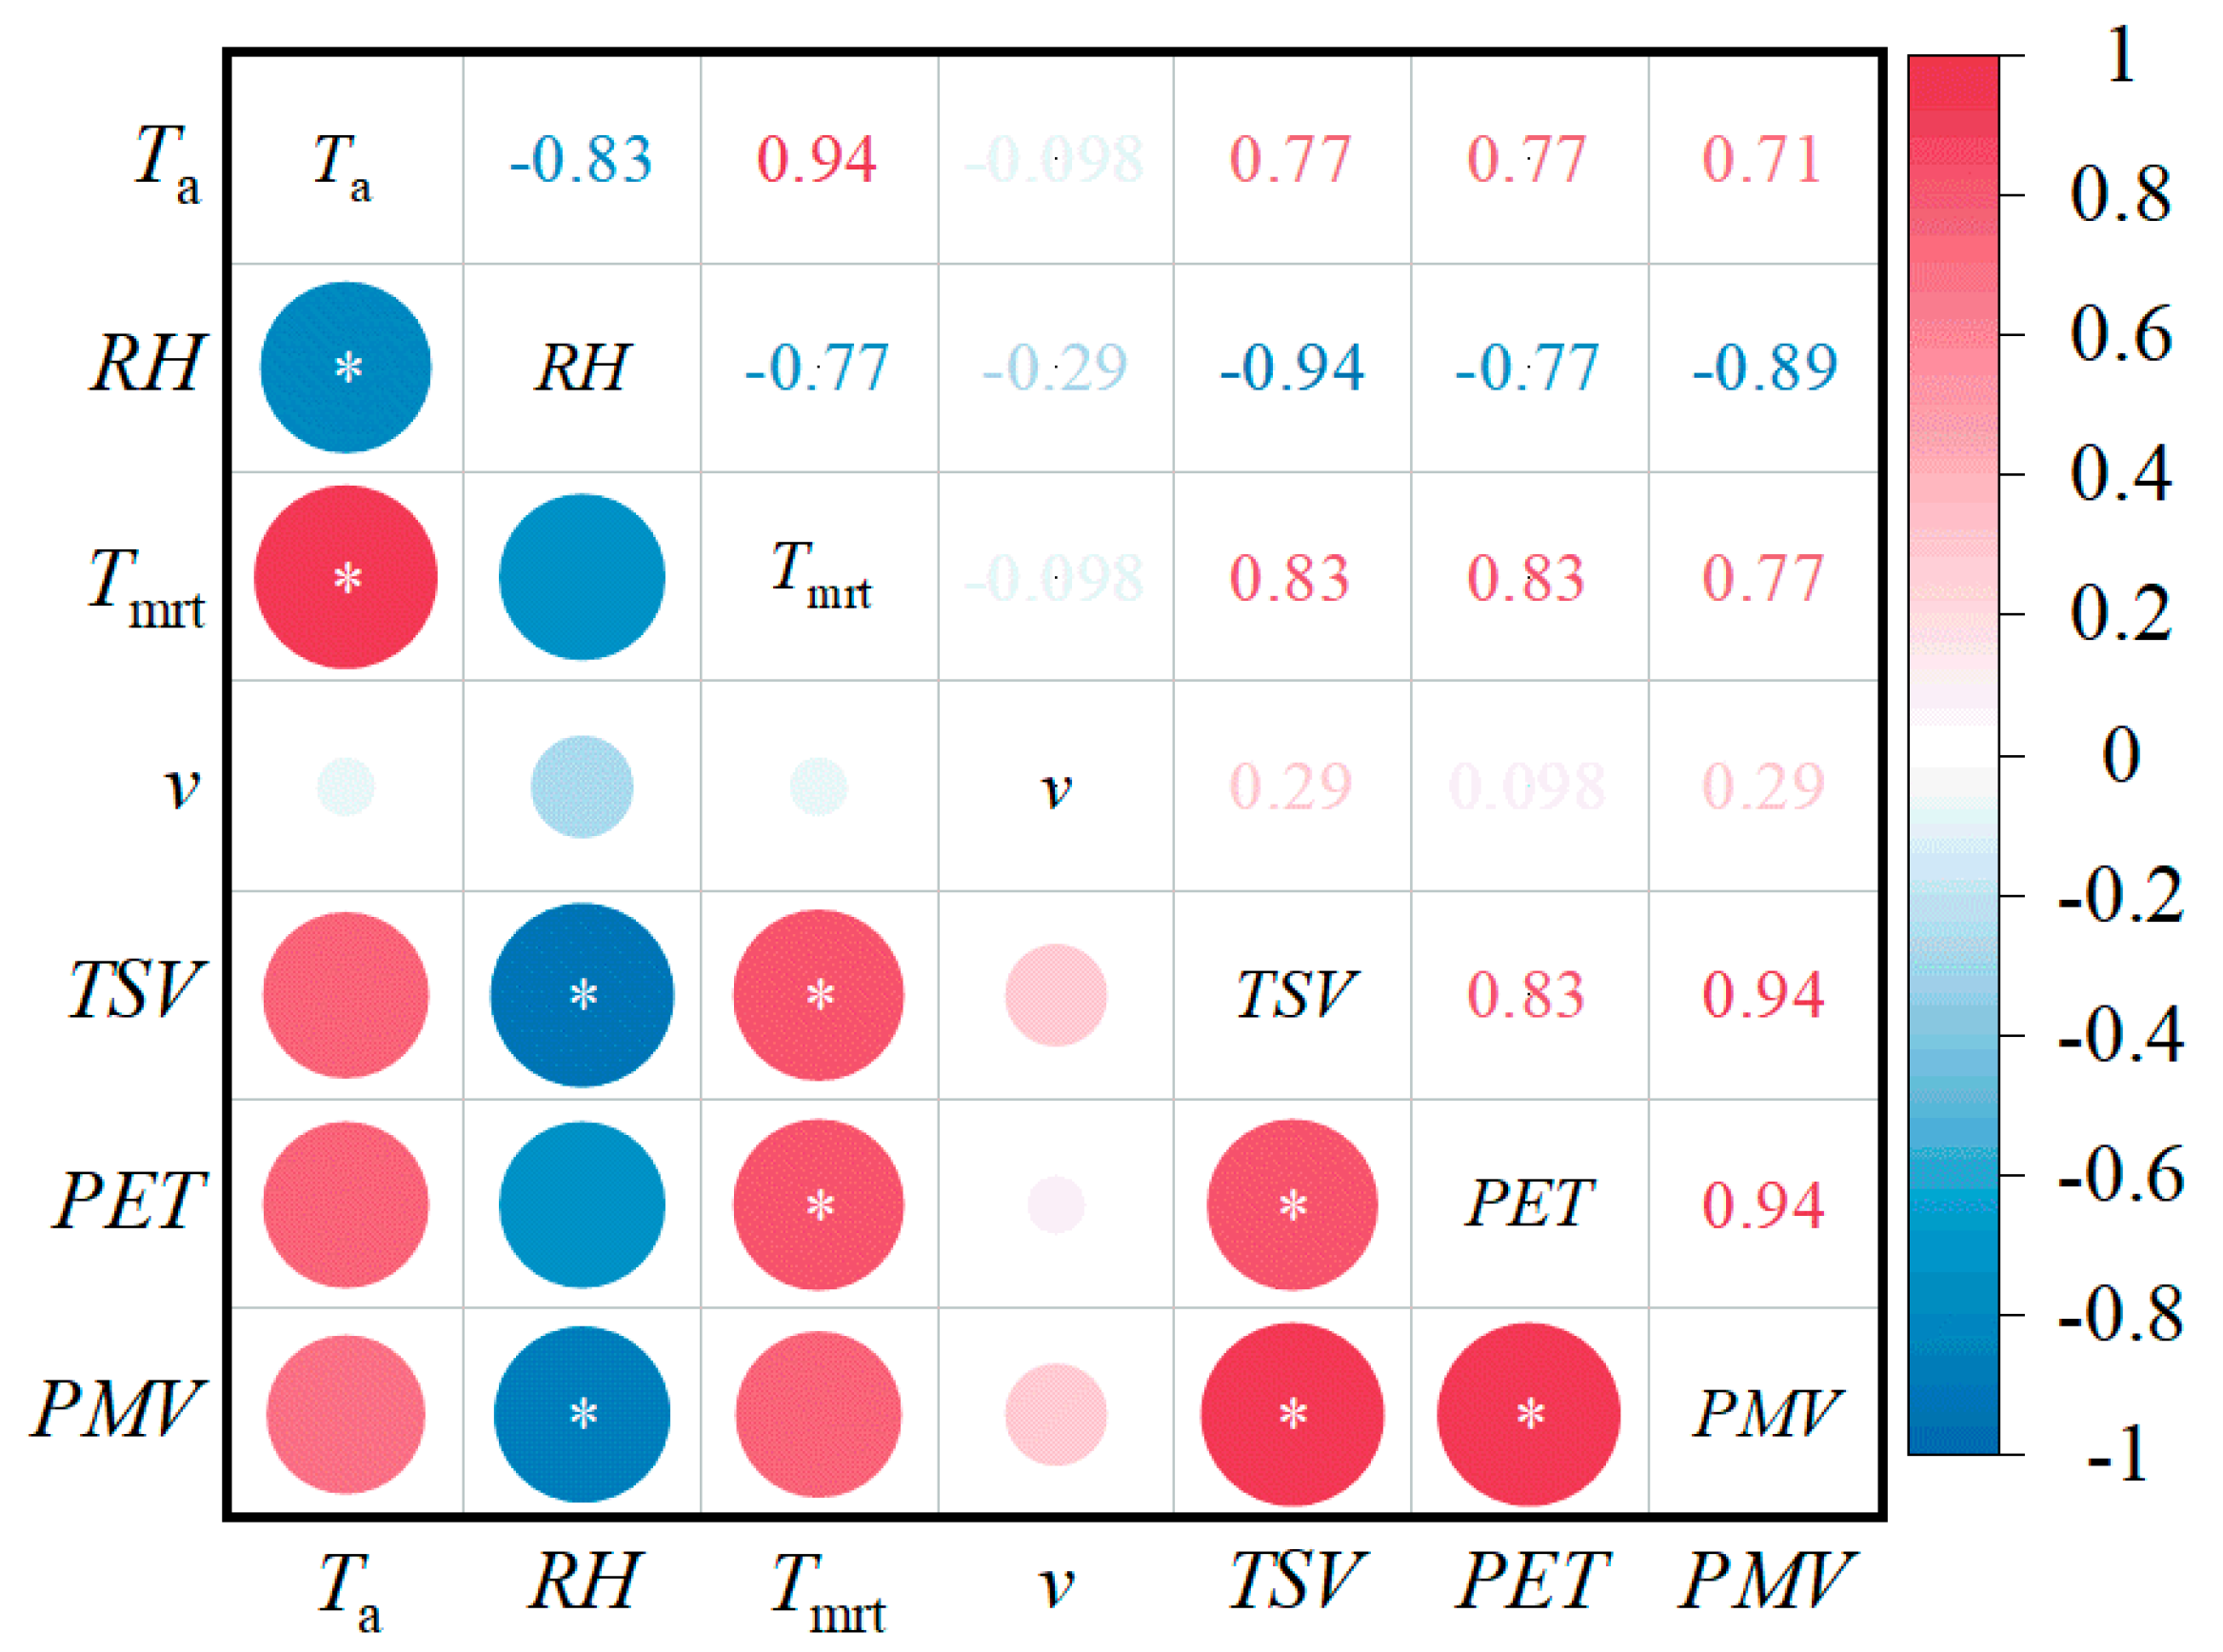
A Spearman correlation analysis was used to examine the relationships between thermal comfort indices (TSV, PET, PMV) and objective physical environmental parameters (Ta, RH, v, Tmrt), in order to identify the key factors influencing thermal comfort. Figure 10 presents the corresponding correlation matrix.
Regarding the relationship with objective thermal environmental parameters, TSV exhibited the strongest correlations with Ta, RH, and Tmrt. Specifically, increases in air temperature and Tmrt were directly associated with higher thermal sensation, thereby exerting a positive influence on thermal comfort. However, TSV showed a strong negative correlation with RH, indicating that high humidity levels tend to intensify cold sensations and significantly reduce thermal comfort. In contrast, the correlation between TSV and v was weak and statistically insignificant. This is likely because, after the retrofit, the indoor environment consistently maintained a low wind speed, with no significant fluctuations observed, thereby limiting the impact of wind on thermal comfort.
In terms of the relationship with objective thermal comfort indices, TSV exhibited a very strong positive correlation with PMV (p < 0.05, Spearman’s correlation coefficient ρ = 0.94), indicating a high level of consistency between subjective thermal sensation and the predicted mean vote. Similarly, TSV was also significantly positively correlated with PET, though the correlation was slightly weaker p = 0.83). These results suggest that both objective indices demonstrate a high degree of agreement in evaluating the thermal environment of the retrofitted space.
However, despite the high correlations among TSV, PMV, and PET, it is important to note that TSV, as a subjective indicator, may be influenced by individual differences such as psychological expectations or adaptive behaviors. In contrast, PMV and PET are primarily derived from standardized calculations based on physical parameters. Therefore, in practical applications, TSV can serve as an important reference for validating the predictive accuracy of PMV and PET.

3.3. Comparison of the Accuracy of PET and PMV in Predicting TSV

Given that the thermal environment of the semi-open space in the teaching building exhibits characteristics of both indoor and outdoor conditions, it is significantly influenced by dynamic outdoor factors such as solar radiation and wind fluctuations when windows are open. After window enclosure, however, the thermal environment becomes more stable and resembles typical indoor conditions. Therefore, it is necessary to validate the accuracy of PET and PMV in predicting TSV under both pre- and post-retrofit scenarios.
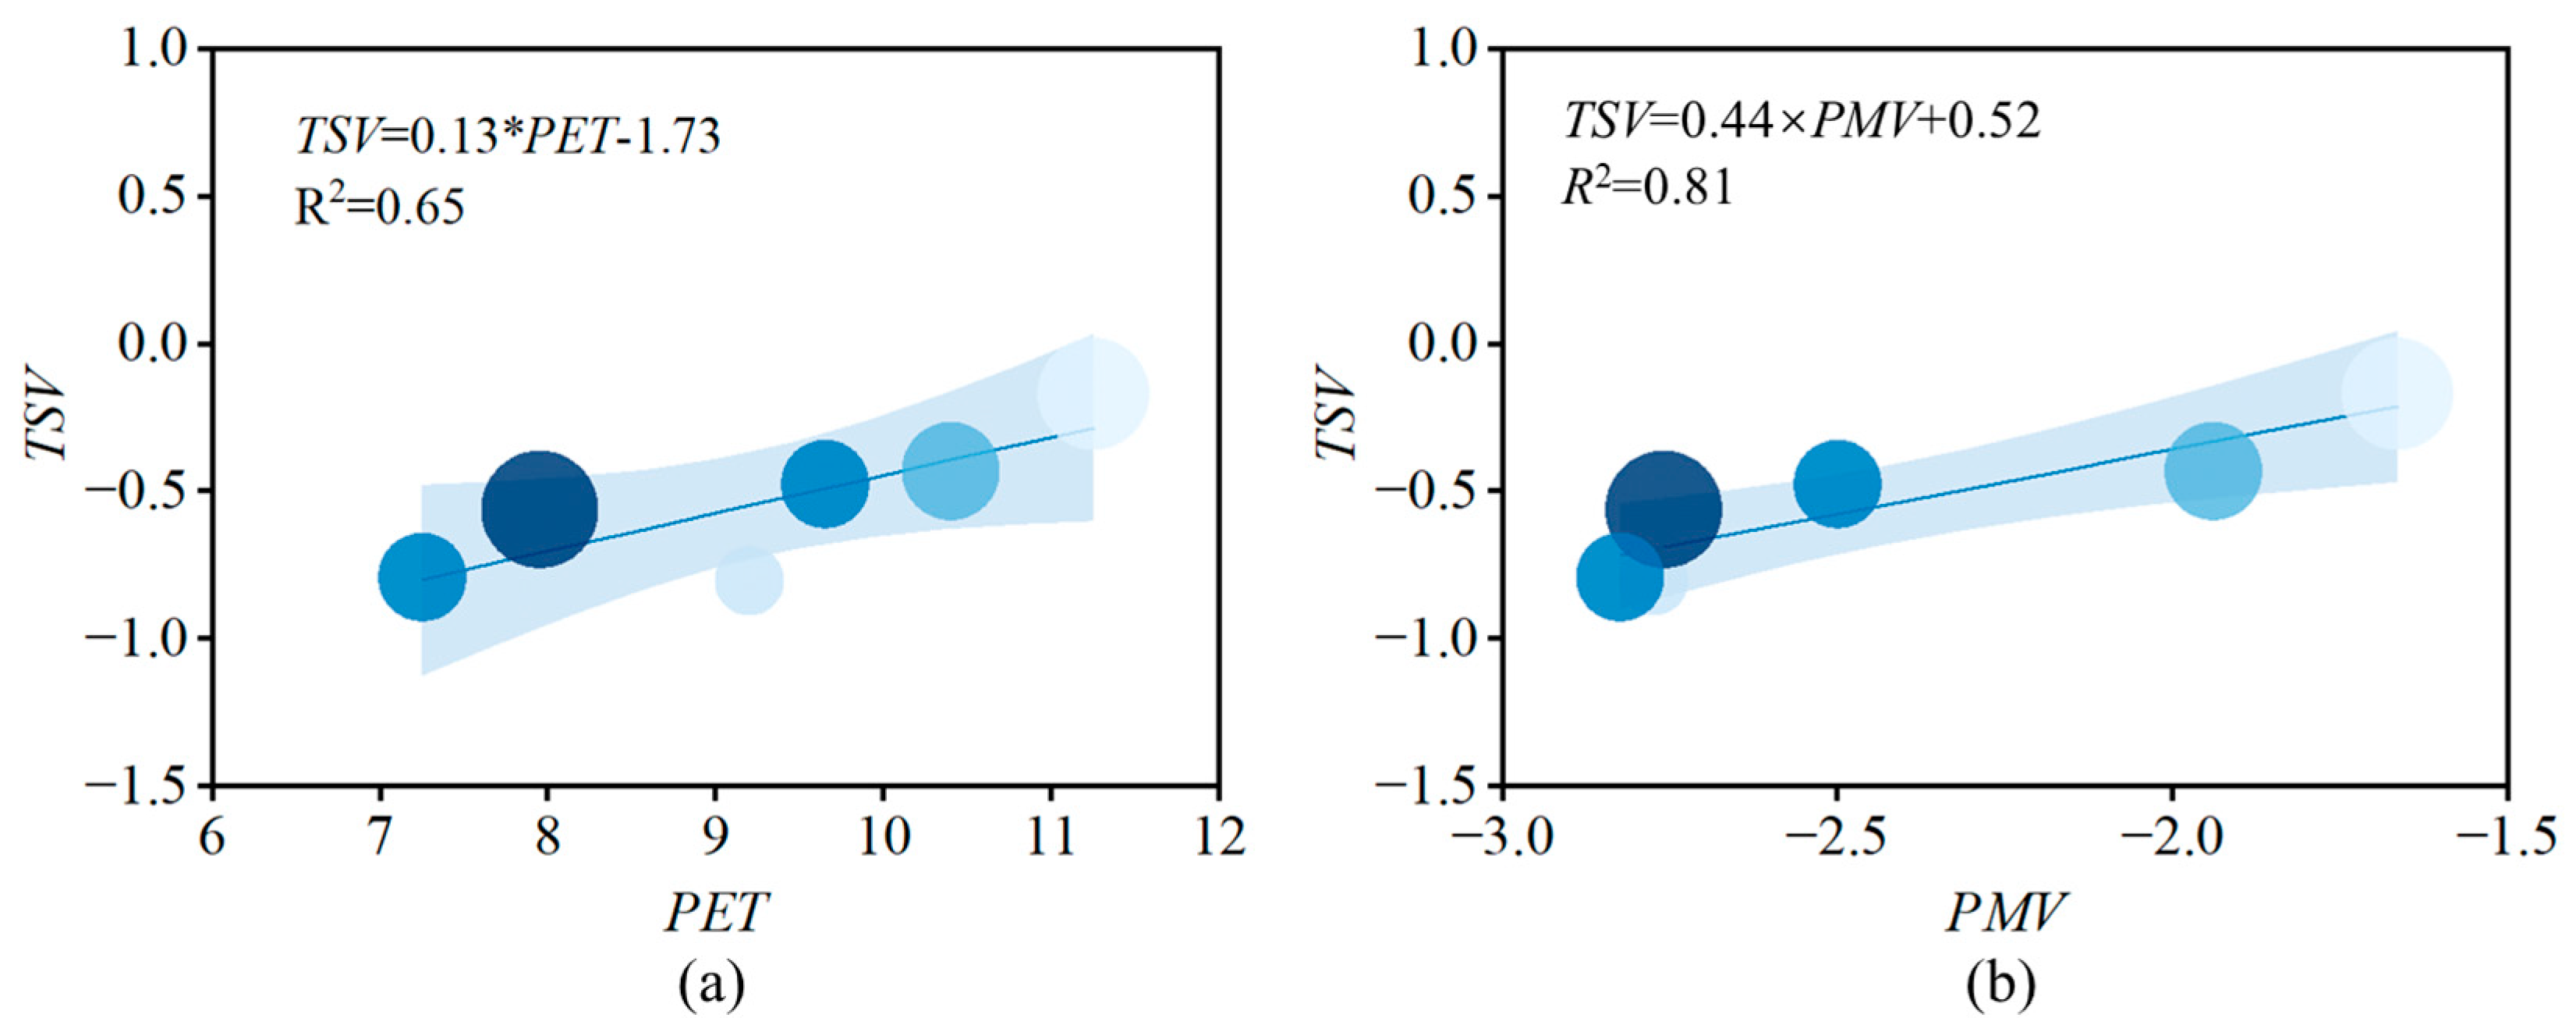
In this study, linear regression analysis was employed to establish the relationships between PET, PMV, and TSV in order to assess the accuracy of PET and PMV in environmental evaluation. The analysis was conducted using the mean thermal sensation vote (MTSV) for linear fitting, resulting in regression lines and corresponding equations, as illustrated in Figure 11 and presented in Equations (3) and (4).
T S V = 0.13 × P E T 1.73
T S V = 0.44 × P M V + 0.52
In the regression analysis with MTSV, PMV demonstrated a higher fitting accuracy than PET, with an R2 value reaching 0.81. Moreover, as shown in Figure 10 of Section 3.2.3, PMV also exhibited a higher Spearman rank correlation coefficient (p = 0.94) compared to PET. These results suggest that, within the transitional space of the teaching building, PMV provides a more accurate representation of thermal comfort and is, therefore, more suitable as an evaluation index for the thermal environment.
A further regression analysis between MTSV and PET revealed that the thermal neutral PET for subjects in this study was 13.3 °C. In comparable winter and semi-open settings, neutral PET values are commonly observed between 10 °C and 18 °C, which are generally lower than those reported for annual or typical conditions. For example, field measurements and surveys in factory areas in Haining, China, indicated a neutral PET of 14.3 °C with a neutral range of 10.7–17.8 °C [37], while a winter field study in public spaces in Beijing reported a neutral PET of 14.3 °C [38]. These similarities indicate that our result is reasonable for the given seasonal and spatial context. The relatively low value can be attributed to the semi-open spatial characteristics of the test area, the subjects’ winter acclimatization, and local clothing habits [39], which increase cold tolerance and shift the neutrality point downward. This seasonal reduction in neutral PET is consistent with the general understanding that thermal neutrality adapts to prevailing climatic conditions.

3.4. Numerical Simulation and Validation

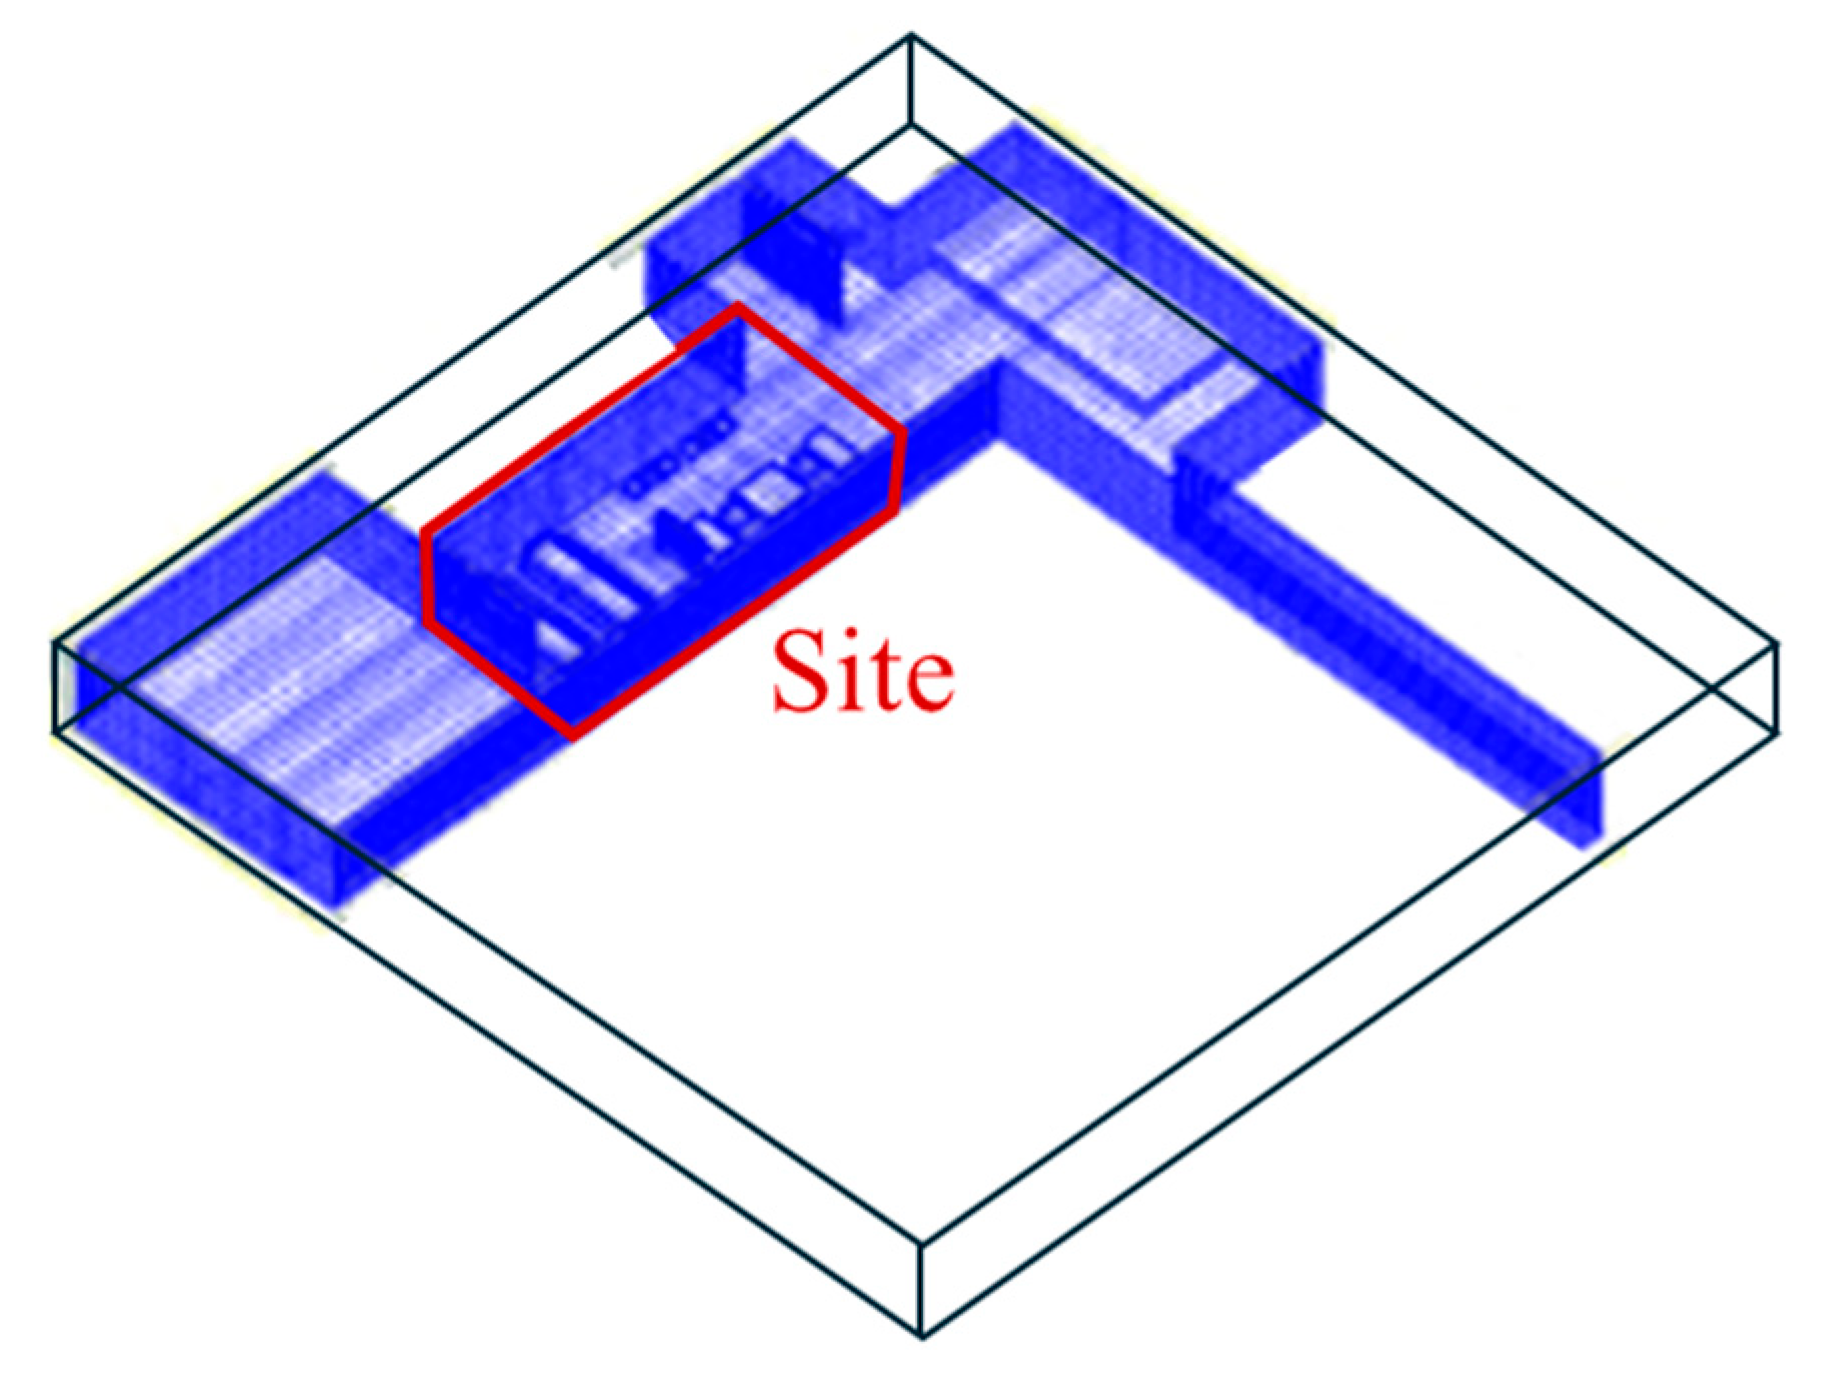
Due to limitations in on-site measurement conditions, the field study could not fully capture the year-round climatic variations and the spatial heterogeneity of the indoor thermal environment. To address these limitations, this study employed simulation modeling using AirPak (version 3.0.16) to supplement the temporal and spatial constraints of the measured data. Figure 12 presents the physical model, which corresponds to the retrofitted space used in the experimental study. To better approximate real-world conditions, the model also incorporates the surrounding spatial environment.
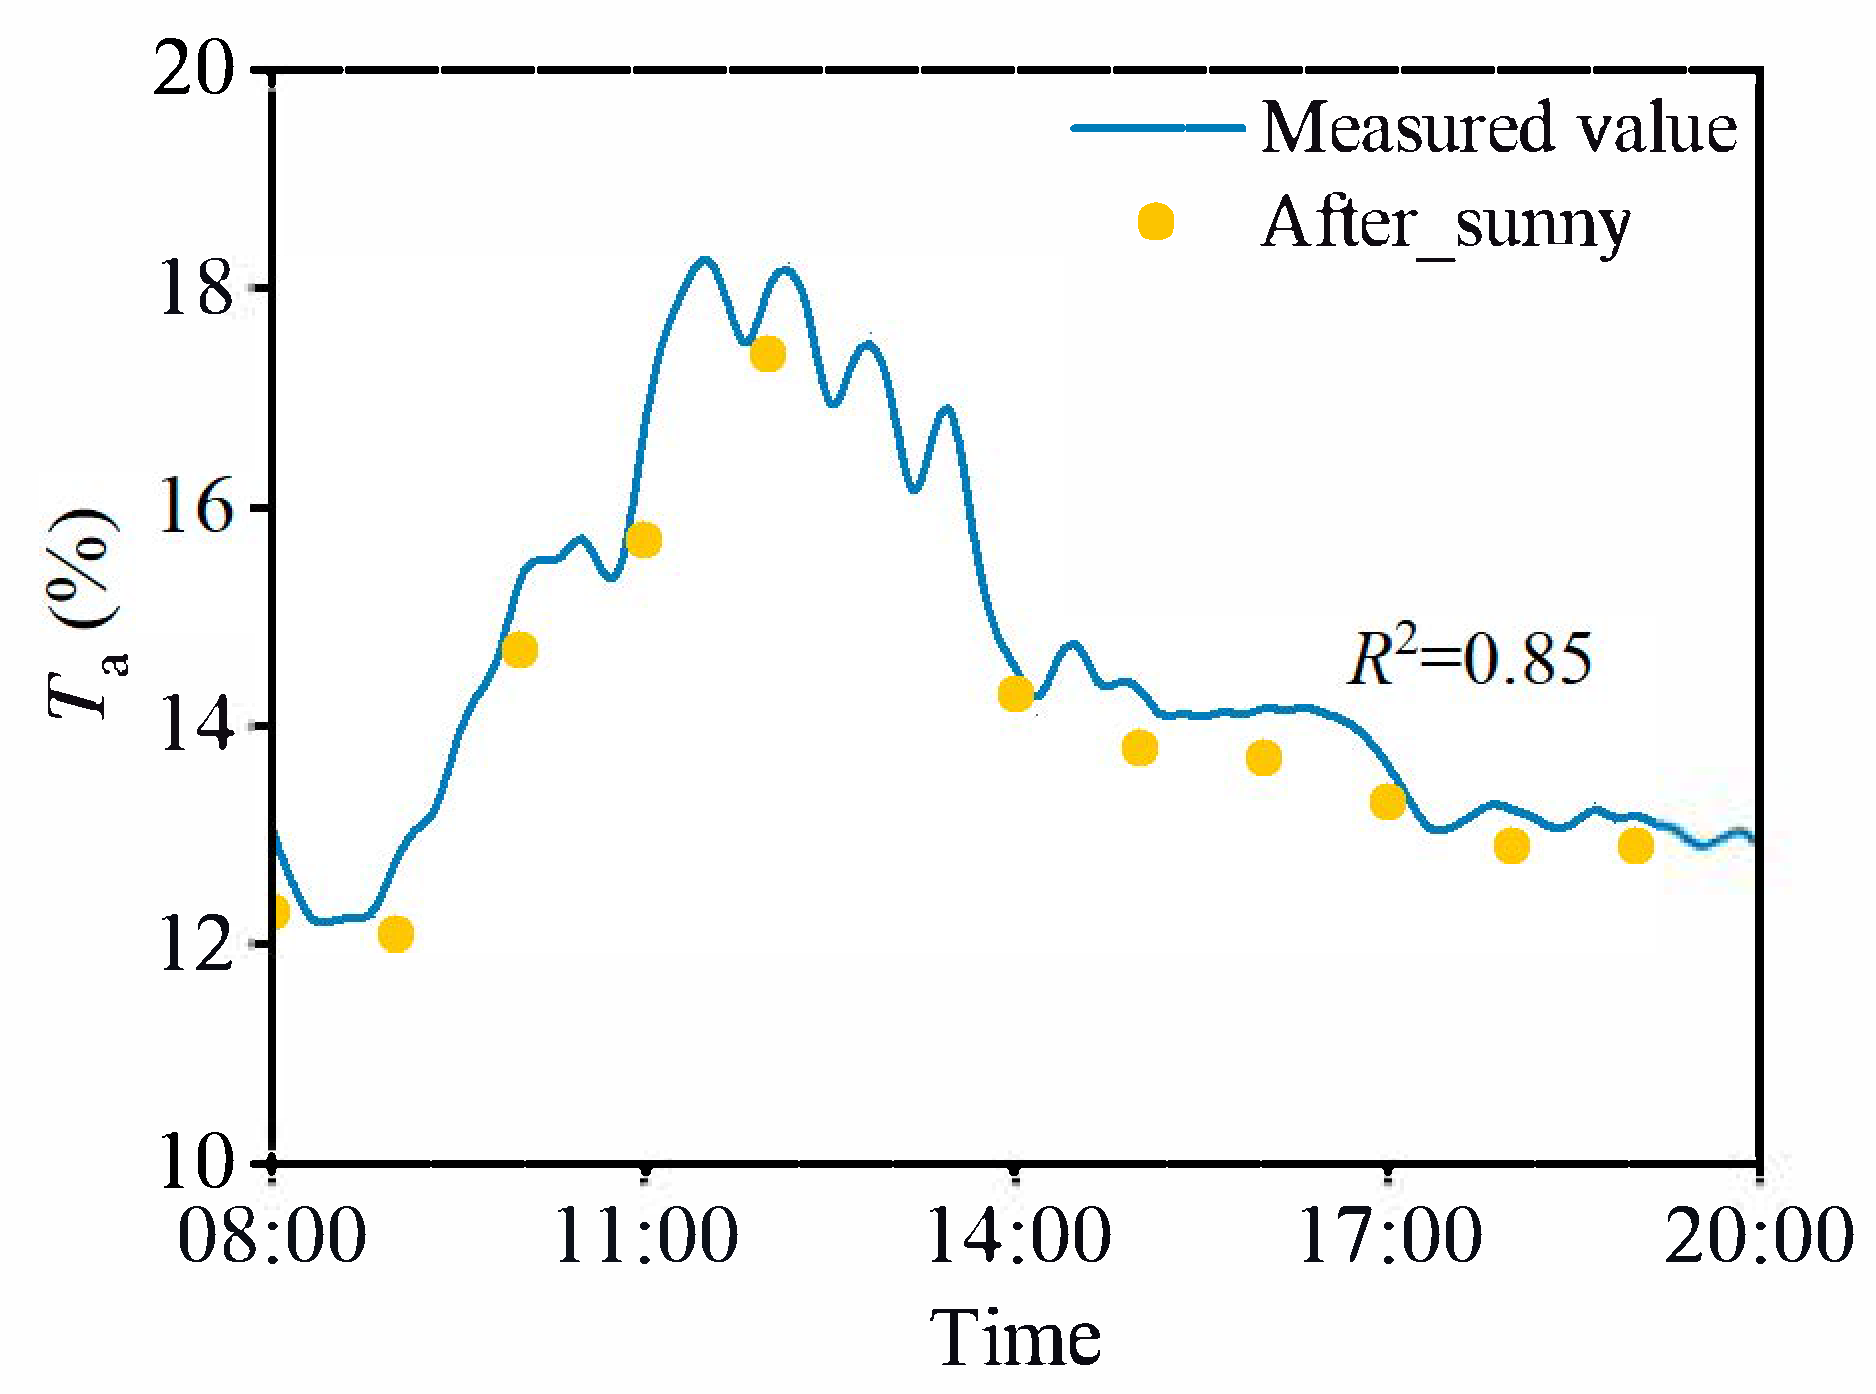
To validate the reliability of the simulation model, this study conducted model verification based on experimental data obtained under winter conditions. The validation results are shown in Figure 13. The results show that the maximum relative error between simulated and measured air temperatures did not exceed 6.6%, and the coefficient of determination (R2) reached 0.86. These error margins and fitting accuracy indicators demonstrate that the simulation model meets the precision requirements for practical engineering applications.
This study conducted a comparative thermal comfort simulation under both summer and winter conditions for the retrofitted area. It is important to clarify that the simulation’s primary objective was to analyze the thermal and airflow environment (temperature and velocity), which were identified as the main drivers of occupant discomfort. In the simulation setup, the window openings were defined using the opening boundary condition. The summer inlet air temperature was set to 32.3 °C, and the winter inlet temperature to 4.3 °C, with a uniform ventilation speed of 2.4 m/s. This speed was not arbitrary; it was purposefully chosen, as it represents the actual problematic draft speed measured on-site before the retrofit, thus serving as a critical baseline to evaluate the intervention’s effectiveness. Considering the thermal environment characteristics of public spaces in the teaching building, the sensible heat load generated by occupants was equivalently distributed over the seating areas using a constant heat flux boundary condition. For sedentary adults at an indoor temperature of 26 °C, the individual sensible heat dissipation was set to 80 W/person. For the pre-retrofit condition, the total sensible cooling load was calculated based on the experimentally observed maximum occupancy of 15 people, resulting in a total of 1200 W. Given a seating area of 4.32 m2, the corresponding heat flux density was determined to be 277.8 W/m2. In the post-retrofit condition, a key outcome of the intervention was that the improved spatial quality and thermal comfort made the area more attractive to users. Consequently, the on-site measured peak occupancy increased to 24 people, leading to a total sensible cooling load of 1920 W. Correspondingly, the seating area was expanded to 7.55 m2. The resulting heat flux density of 254.3 W/m2 was, therefore, calculated for this new operational state, reflecting the higher thermal load distributed after retrofit.
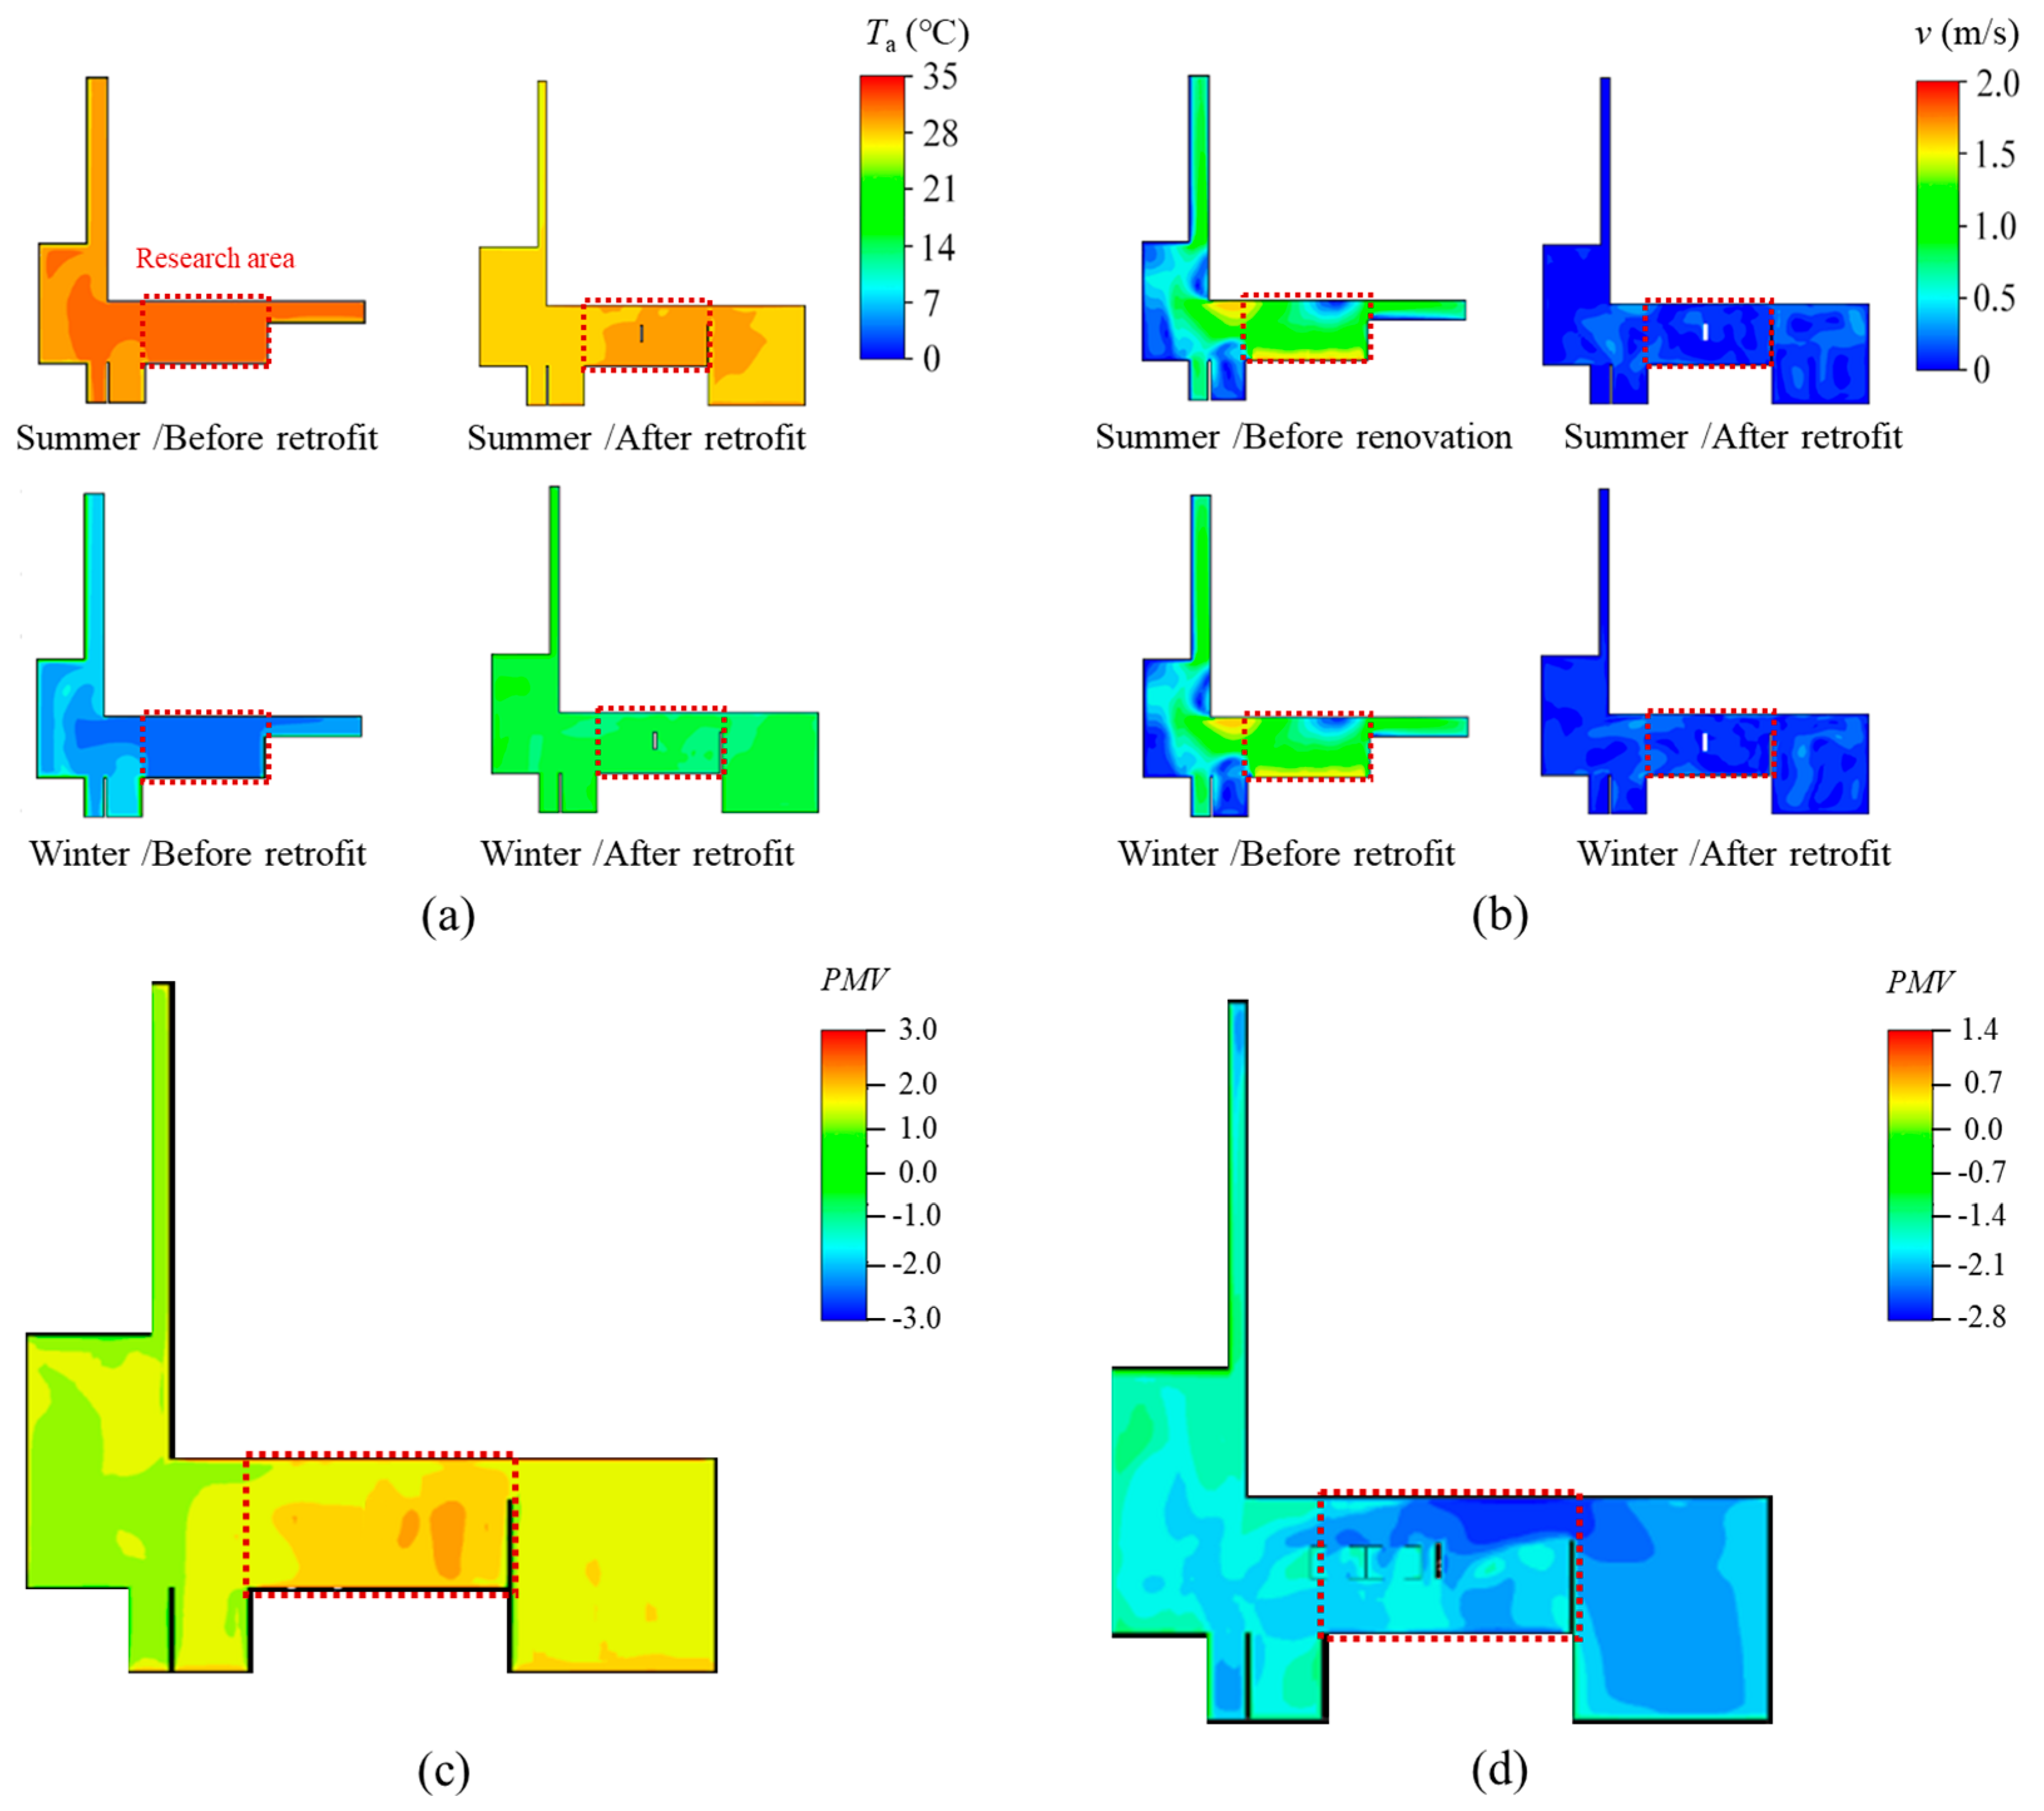
Figure 14 presents the distribution characteristics of indoor air temperature, wind speed, and thermal sensation index (PMV) under typical summer and winter conditions before and after the retrofit. The results indicate that the envelope retrofit effectively controlled indoor wind speed levels. Prior to the retrofit in summer, wind speeds in some areas exceeded 1.5 m/s, leading to noticeable airflow discomfort. After the retrofit, the average indoor wind speed was significantly reduced and stabilized below 0.5 m/s, indicating a clear improvement in the overall wind environment. In terms of thermal comfort, the average indoor PMV value in summer after the retrofit was approximately 1.3, suggesting a “slightly warm” thermal sensation. Thermal comfort was relatively better in central areas near the corridor. In winter, the average PMV was about −1.9, indicating a “cool” condition, with relatively improved thermal comfort in central areas away from the corridor. To further enhance indoor thermal comfort, adjustments such as optimizing the operation strategy of the heating, ventilation, and air conditioning (HVAC) operational strategies, incorporating localized shading designs, or adopting adjustable ventilation schemes could be considered. These approaches would allow for flexible adaptation of the indoor thermal environment according to seasonal variations and occupant activity patterns, thereby better meeting higher comfort expectations.

4. Discussion

This study employed field measurements, questionnaire surveys, and numerical simulations to analyze the impact of envelope retrofit on indoor thermal comfort. The results indicate that the retrofitted building exhibited improvements in air temperature, relative humidity, and thermal comfort indices (PET and PMV).
The study found that PMV exhibited significantly higher goodness of fit and correlation with TSV compared to PET, aligning with previous conclusions that PMV is more suitable for indoor thermal comfort assessment [40]. This discrepancy may be attributed to the PET model’s higher sensitivity to outdoor meteorological parameters, such as wind speed and radiation. In the post-retrofit transitional space, increased enclosure reduced direct exposure to outdoor climatic influences, making the steady-state PMV model more applicable. However, a study by Li et al. [41] on a semi-enclosed sports stadium revealed a strong correlation between PET and TSV, while the PMV model tended to underestimate spectators’ thermal sensation. This divergence may stem from the space’s dynamic ventilation conditions and the variability of occupant activity levels.
Moreover, the retrofit of the building envelope should be integrated with the design of indoor seating layouts. Although the retrofit significantly improved overall indoor thermal comfort, spatial variations in temperature and wind speed persisted. The degree of spatial enclosure was identified as a key driver of this phenomenon. In this study, seating areas enclosed by high-backed sofas exhibited better thermal comfort compared to areas adjacent to ventilated corridors, as the enclosures reduced the impact of cold air infiltration. Additionally, orientation differences further intensified the heterogeneity of the indoor thermal environment. The size and orientation of windows, as well as the distance between occupants and windows, significantly affected solar heat gains, which in turn influenced human thermal sensation [42]. In the absence of active heating or cooling sources, the indoor thermal environment was jointly driven by solar radiation and metabolic heat generation from occupants [43], and maintained a dynamic balance through heat loss via the building envelope and air exchange [44,45]. Therefore, focusing solely on improvements to the building envelope is insufficient for comprehensive design optimization. It is recommended that, during the retrofit design phase, simulation tools be used to evaluate seating-area thermal comfort conditions, thereby enhancing the overall usability and comfort of the space.
It should be noted that this study faced several limitations. First, the research focused primarily on the West Teaching Building of Zhejiang University, and the field investigation was confined to a single 14 m × 5 m semi-open zone within the building. This narrow spatial scope results in a relatively homogeneous and limited sample, which may not be representative of other types of campus buildings or semi-open spaces with different architectural forms and orientations. Second, the field measurements mainly reflect winter conditions, while the summer conditions were evaluated through simulation. This may introduce seasonal bias and limit the accuracy of warm-season results, indicating the need for year-round monitoring to enrich the dataset. Additionally, the numerical simulations adopted fixed ventilation rates and standard metabolic rates, which did not fully account for the randomness of occupant behavior, such as changes in ventilation rates due to window opening. Finally, the pre- and post-retrofit subjective surveys were conducted with different occupants during the same period of the day, which avoids potential recall bias but may introduce inter-respondent variability, as differences in thermal comfort evaluations could partly reflect individual characteristics rather than solely environmental changes.
Although the primary focus of this study was on thermal comfort, rather than energy performance, the measured winter air temperature increase in the retrofitted semi-open space implies a potential reduction in winter heating loads for adjacent conditioned rooms. The actual magnitude of such energy savings would depend on multiple factors, including HVAC system characteristics, operational schedules, and occupancy patterns, which were beyond the scope of the present work. Future studies could incorporate long-term energy monitoring or coupled building energy simulations to quantify these impacts, providing a more comprehensive evaluation of retrofit benefits.
Despite the limited measurement scope, the selected space represents a typical semi-open public area found in many Chinese university buildings, especially in hot summer and cold winter regions. The integrated research framework and findings regarding enclosure retrofit in semi-open spaces are applicable to similar intervention scenarios, contributing to broader efforts in improving thermal resilience and occupant comfort in educational buildings under climate stress. Future research could expand to campus buildings located in different climatic regions and aim to establish a coupled climate–space–behavior model, thereby promoting the evolution of thermal comfort optimization from static design strategies toward dynamic adaptive approaches.

5. Conclusions

This study integrated field measurements, subjective surveys, and numerical simulations to systematically evaluate the impact of building envelope retrofitting on indoor thermal comfort in the transitional space of the West Teaching Building at Zijingang Campus of Zhejiang University. The key findings are summarized as follows:
(1)
The envelope retrofit significantly enhanced the thermal environment of the semi-open space. After the retrofit, the indoor air temperature increased notably, particularly under clear winter conditions, with the daily average rising from 12.5 °C to 14.6 °C—an improvement of 2.1 °C. Meanwhile, the average relative humidity decreased from 49.4% to 45.8%, a reduction of 3.6%.
(2)
Thermal comfort indices (PET and PMV) further confirmed the effectiveness of the retrofit, with greater improvements observed under rainy conditions. Under clear skies, the daily mean PET increased by 2.6 °C, while under rainy conditions, it rose by 4.4 °C, significantly alleviating cold stress. Similarly, PMV improved as well: under clear skies, the daily mean PMV increased from −2.90 (“very cold”) to −2.45, with a peak increase of 0.98; under rainy conditions, PMV rose from −2.48 to −2.15, with a peak increase of 0.69, indicating substantial relief from cold discomfort.
(3)
Subjective survey results demonstrated a significant improvement in occupant thermal satisfaction after the retrofit. The proportion of occupants reporting a “cold” sensation dropped from 15–45% before the retrofit to 5–16% after, while the proportion of “neutral” sensations increased from 5–25% to 13–57%. Over 70% of respondents considered the indoor temperature appropriate, indicating a substantial shift toward the comfort zone.
(4)
Following the retrofit, the neutral PET was identified as 13.3 °C. PMV showed a significantly stronger correlation and fitting accuracy in predicting TSV compared to PET, with a Spearman’s rank correlation coefficient of 0.94 and an R2 value of 0.81. This suggests that, after the retrofit, the indoor thermal environment’s reduced exposure to outdoor climatic fluctuations made the steady-state PMV model more suitable for evaluating thermal comfort.

Author Contributions

Conceptualization, J.Z.; methodology, J.Z.; validation, Z.W.; formal analysis, J.Z. and Z.W.; investigation, J.Z.; resources, not applicable; data curation, J.Z. and Z.W.; writing—original draft preparation, J.Z. and Z.W.; writing—review and editing, J.G., J.Z., Z.W. and H.Z.; visualization, J.Z. and Z.W.; supervision, J.G. and H.Z.; project administration, H.Z. All authors have read and agreed to the published version of the manuscript.

Funding

This research received no external funding.

Institutional Review Board Statement

This study is a non-interventional questionnaire survey aimed at evaluating indoor thermal comfort and collecting participants’ subjective feedback. During the study, no personal identifying information was collected. Participants were fully informed about the purpose of the research, how their data would be used, and their rights, ensuring their voluntary participation. The survey design did not involve any physiological or psychological risks, and participants were not required to bear any physical or mental burden. Furthermore, the questionnaire content did not include sensitive information or privacy-related issues. Based on the Ethical Review Measures for Human Life Sciences and Medical Research (2023) in China, this study met the exemption criteria outlined in Article 32. As a result, ethical approval was not required for this study.

Informed Consent Statement

An informed consent form was distributed to all participants before data collection. All participants read and signed the form prior to completing the questionnaire.

Data Availability Statement

The data presented in this study are available upon request from the corresponding author.

Conflicts of Interest

The authors declare no conflicts of interest.

Appendix A

Appendix A.1

This questionnaire was designed to collect occupants’ subjective thermal comfort responses.
Table A1. Thermal comfort subjective assessment questionnaire for spatial renovation.
Survey ItemsDetails
IBasic InformationYour Gender: □ Male □ Female
Age: ______ (years)
IIPre-Renovation Thermal Comfort SurveyBased on your actual experience in the renovated space, please check (√) the appropriate options.
08:00–10:00 AM □ −3 □ −2 □ −1 □ 0 □ +1 □ +2 □ +3
10:00–12:00 AM □ −3 □ −2 □ −1 □ 0 □ +1 □ +2 □ +3
12:00–14:00 PM □ −3 □ −2 □ −1 □ 0 □ +1 □ +2 □ +3
14:00–16:00 PM □ −3 □ −2 □ −1 □ 0 □ +1 □ +2 □ +3
16:00–18:00 PM □ −3 □ −2 □ −1 □ 0 □ +1 □ +2 □ +3
18:00–20:00 PM □ −3 □ −2 □ −1 □ 0 □ +1 □ +2 □ +3
Additional Comfort Perceptions
Overall Comfort □ −2 (Uncomfortable) □ −1 (Slightly Uncomfortable) □ 0 (Neutral) □ +1 (Slightly Comfortable) □ +2 (Comfortable)
Wind Speed □ −2 (Very Strong) □ −1 (Strong) □ 0 (Moderate) □ +1 (Slightly Weak) □ +2 (Very Weak)
Air Freshness □ −2 (Very Stale) □ −1 (Stale) □ 0 (Neutral) □ +1 (Not Fresh) □ +2 (Very Fresh)
Humidity Level □ −2 (Humid) □ −1 (Slightly Humid) □ 0 (Moderate) □ +1 (Slightly Dry) □ +2 (Dry)
Clothing Insulation Value (clo)1. Upper Garments:□ Short-sleeve/T-shirt □ Lightweight long-sleeve/Shirt □ Dress □ Light Jacket (Casual Wear) □ Thermal Wear/Undershirt □ Sweater (□ Thin □ Thick) □ Down Jacket (□ Thick Short □ Thick Long) □ Cotton Padded Jacket □ Long Coat2. Lower Garments:□ Short Skirt □ Long Skirt □ Socks (□ Ankle Socks □ Mid-calf Socks □ Stockings) □ Thermal Pants □ Cotton Padded Pants □ Sports Pants □ Jeans3. Shoes:□ Leather Shoes □ Cotton Padded Shoes □ Leather Boots □ Sports Shoes4. Hats:□ Fabric Hat/Cotton Hat (□ Thin □ Thick) □ Fur Hat □ Knitted Hat □ Others5. Gloves:□ Plush Gloves □ Fabric Gloves □ Leather Gloves □ Others
IIIPost-Renovation Thermal Comfort SurveyBased on your actual experience in the renovated space, please check (√) the appropriate options.
08:00–10:00 AM □ −3 □ −2 □ −1 □ 0 □ +1 □ +2 □ +3
10:00–12:00 AM □ −3 □ −2 □ −1 □ 0 □ +1 □ +2 □ +3
12:00–14:00 PM □ −3 □ −2 □ −1 □ 0 □ +1 □ +2 □ +3
14:00–16:00 PM □ −3 □ −2 □ −1 □ 0 □ +1 □ +2 □ +3
16:00–18:00 PM □ −3 □ −2 □ −1 □ 0 □ +1 □ +2 □ +3
18:00–20:00 PM □ −3 □ −2 □ −1 □ 0 □ +1 □ +2 □ +3
Clothing Insulation Value (clo)1. Upper Garments:
□ Short-sleeve/T-shirt □ Lightweight long-sleeve/Shirt □ Dress □ Light Jacket (Casual Wear) □ Thermal Wear/Undershirt □ Sweater (□ Thin □ Thick) □ Down Jacket (□ Thick Short □ Thick Long) □ Cotton Padded Jacket □ Long Coat
2. Lower Garments:
□ Short Skirt □ Long Skirt □ Socks (□ Ankle Socks □ Mid-calf Socks □ Stockings) □ Thermal Pants □ Cotton Padded Pants □ Sports Pants □ Jeans
3. Shoes:
□ Leather Shoes □ Cotton Padded Shoes □ Leather Boots □ Sports Shoes
4. Hats:
□ Fabric Hat/Cotton Hat (□ Thin □ Thick) □ Fur Hat □ Knitted Hat □ Others
5. Gloves:
□ Plush Gloves □ Fabric Gloves □ Leather Gloves □ Others
Adaptive Comfort SurveyYour Expectation for the Current Thermal Environment:
Preferred Temperature:
□ +1 (Slightly Warmer) □ 0 (No Change) □ −1 (Slightly Cooler)
Preferred Humidity
□ +1 (Drier) □ 0 (No Change) □ −1 (More Humid)
Preferred Wind Speed:
□ +1 (Stronger) □ 0 (No Change) □ −1 (Weaker)
Is the Current Thermal Environment Acceptable to You?
□ Fully Acceptable □ Just Acceptable □ Just Unacceptable □ Completely Unacceptable
Satisfaction SurveyAre You Satisfied with the Indoor Temperature?
□ Very Satisfied □ Fairly Satisfied □ Neutral □ Slightly Dissatisfied □ Very Dissatisfied
Are You Satisfied with the Indoor Humidity?
□ Very Satisfied □ Fairly Satisfied □ Neutral □ Slightly Dissatisfied □ Very Dissatisfied
Are You Satisfied with the Indoor Wind Speed?
□ Very Satisfied □ Fairly Satisfied □ Neutral □ Slightly Dissatisfied □ Very Dissatisfied

Appendix A.2. Number of Valid Survey Responses per Two-Hour Bin

Table A2. The distribution of valid survey responses across two-hour bins.
Time IntervalNumber of Responses
08:00–10:0015
10:00–12:0021
12:00–14:0024
14:00–16:0019
16:00–18:0025
18:00–20:0019

References

  1. Vellei, M.; Herrera, M.; Fosas, D.; Natarajan, S. The influence of relative humidity on adaptive thermal comfort. Build. Environ. 2017, 124, 171–185. [Google Scholar] [CrossRef]
  2. Paraschiv, L.S.; Acomi, N.; Serban, A.; Paraschiv, S. A web application for analysis of heat transfer through building walls and calculation of optimal insulation thickness. Energy Rep. 2020, 6, 343–353. [Google Scholar] [CrossRef]
  3. Liu, Z.; Zhang, L.; Gong, G.; Li, H.; Tang, G. Review of solar thermoelectric cooling technologies for use in zero energy buildings. Energy Build. 2015, 102, 207–216. [Google Scholar] [CrossRef]
  4. Sookchaiya, T.; Monyakul, V.; Thepa, S. Assessment of the thermal environment effects on human comfort and health for the development of novel air conditioning system in tropical regions. Energy Build. 2010, 42, 1692–1702. [Google Scholar] [CrossRef]
  5. Tyubee, B.T.; Iorpev, P.S.; Oche, C.Y. Assessment of perceived and observed occupants’ thermal comfort in residential buildings in Agan, Makurdi, Northcentral Nigeria. Urban Clim. 2020, 33, 100633. [Google Scholar] [CrossRef]
  6. Hou, C.; Gao, W.; Gao, Y. Winter indoor thermal environment and livability analysis of traditional residential houses in northeast Sichuan, China. Case Stud. Therm. Eng. 2024, 60, 104636. [Google Scholar] [CrossRef]
  7. Heidari, A.; Davtalab, J. Effect of Kharkhona on thermal comfort in the indoor space: A case study of Sistan region in Iran. Energy Build. 2024, 318, 114431. [Google Scholar] [CrossRef]
  8. Wang, H.; Yang, J.; Hu, Y.; Gao, Z.; Meng, F.; Xu, F. A simulation study on the indoor thermal environment of an office building with transparent radiative cooling (T-RC) film in Nanjing, China. Energy Built Environ. 2024, in press. [Google Scholar] [CrossRef]
  9. Liu, L.; Ma, Y.; Huang, R.; Jia, M.; Liu, G.; Zheng, W. Field measurement study of indoor thermal environment of badminton halls in a hot summer and cold winter region in different seasons in China. Heliyon 2024, 10, e34883. [Google Scholar] [CrossRef] [PubMed]
  10. Li, Z.; Feng, X.; Fan, X.; Sun, J.; Fang, Z. Effect of direct solar projected area factor on outdoor thermal comfort evaluation: A case study in Shanghai, China. Urban Clim. 2022, 41, 101033. [Google Scholar] [CrossRef]
  11. Fang, Z.; He, H.; Guo, Z.; Zheng, Z.; Feng, X. Daily variation of ground radiation in unshaded and shaded environments and the effect on mean radiant temperature. Case Stud. Therm. Eng. 2023, 43, 102791. [Google Scholar] [CrossRef]
  12. Ji, Y.; Song, J.; Shen, P. A data-driven model on human thermos physiological and psychological responses under dynamic solar radiation. Build. Environ. 2024, 248, 111098. [Google Scholar] [CrossRef]
  13. Chen, L.; Zhang, Y.; Han, J.; Li, X. An investigation of the influence of ground surface properties and shading on outdoor thermal comfort in a high-altitude residential area. Front. Archit. Res. 2021, 10, 432–446. [Google Scholar] [CrossRef]
  14. Liu, S.; Cao, B.; Zhu, Y. Experimental study on comparison of indoor and multiple outdoor thermal environments excluding visual and acoustic interference. Sustain. Cities Soc. 2023, 94, 104564. [Google Scholar] [CrossRef]
  15. Delfani, S.; Pasdarshahri, H.; Karami, M. Experimental investigation of heat recovery system for building air conditioning in hot and humid areas. Energy Build. 2012, 49, 62–68. [Google Scholar] [CrossRef]
  16. Nguyen, C.T.; Nguyen, H.; Sakti, A.D. Seasonal characteristics of outdoor thermal comfort and residential electricity consumption: A snapshot in Bangkok Metropolitan Area. Remote Sens. Appl. Soc. Environ. 2024, 33, 101106. [Google Scholar] [CrossRef]
  17. Liang, C.; Yuan, J. The evolving distribution of humidity conditional on temperature and implications for compound heat extremes across China in a warming world. Atmos. Ocean. Sci. Lett. 2025, 100596. [Google Scholar] [CrossRef]
  18. Hamed, M.M.; Al-Hasani, A.A.J.; Nashwan, M.S.; Sa’adi, Z.; Shahid, S. Assessing the growing threat of heat stress in the North Africa and Arabian Peninsula region connected to climate change. J. Clean. Prod. 2024, 447, 141639. [Google Scholar] [CrossRef]
  19. Boudreault, J.; Campagna, C.; Chebana, F. Machine and deep learning for modelling heat-health relationships. Sci. Total Environ. 2023, 892, 164660. [Google Scholar] [CrossRef]
  20. Alghamdi, S.; Tang, W.; Kanjanabootra, S.; Alterman, D. Effect of architectural building design parameters on thermal comfort and energy consumption in higher education buildings. Buildings 2022, 12, 329. [Google Scholar] [CrossRef]
  21. Liu, J.; Yang, X.; Jiang, Q.; Qiu, J.; Liu, Y. Occupants’ thermal comfort and perceived air quality in natural ventilated classrooms during cold days. Build. Environ. 2019, 158, 73–82. [Google Scholar] [CrossRef]
  22. De La Hoz-Torres, M.L.; Aguilar, A.J.; Ruiz, D.P.; Martínez-Aires, M.D. An investigation of indoor thermal environments and thermal comfort in naturally ventilated educational buildings. J. Build. Eng. 2024, 84, 108677. [Google Scholar] [CrossRef]
  23. Aghniaey, S.; Lawrence, T.M.; Sharpton, T.N.; Douglass, S.P.; Oliver, T.; Sutter, M. Thermal comfort evaluation in campus classrooms during room temperature adjustment corresponding to demand response. Build. Environ. 2019, 148, 488–497. [Google Scholar] [CrossRef]
  24. Weng, J.; Zhang, Y.; Chen, Z.; Ying, X.; Zhu, W.; Sun, Y. Field measurements and analysis of indoor environment, occupant satisfaction, and sick building syndrome in university buildings in hot summer and cold winter regions in China. Int. J. Environ. Res. Public Health 2022, 20, 554. [Google Scholar] [CrossRef]
  25. Hou, G.; Zhai, X.; Kuai, Y.; Shu, P.; Zhang, P.; Wei, S. A systematic review on studies of thermal comfort in building transitional space. J. Build. Eng. 2024, 89, 109280. [Google Scholar] [CrossRef]
  26. D’Agostino, D.; Minelli, F.; Minichiello, F. HVAC System Energy Retrofit for a University Lecture Room Considering Private and Public Interests. Energies 2025, 18, 1526. [Google Scholar] [CrossRef]
  27. GB 50176-2016; Design Standard for Energy Efficiency of Residential Buildings in Hot Summer and Cold Winter Zone. Ministry of Housing and Urban-Rural Development of the People’s Republic of China: Beijing, China, 2016. (In Chinese)
  28. JGJ/T 347-2014; Standard of Test Methods for Thermal Environment of Building. Ministry of Housing Urban and Rural Development, China Architecture & Building Press: Beijing, China, 2012. (In Chinese)
  29. ISO 7726:1998; Ergonomics of the Thermal Environment—Instruments for Measuring Physical Quantities. International Organization for Standardization: Geneva, Switzerland, 1998.
  30. Mayer, H.; Höppe, P. Thermal comfort of man in different urban environments. Theor. Appl. Climatol. 1987, 38, 43–49. [Google Scholar] [CrossRef]
  31. Höppe, P. The physiological equivalent temperature—A universal index for the biometeorological assessment of the thermal environment. Int. J. Biometeorol. 1999, 43, 71–75. [Google Scholar] [CrossRef]
  32. Carlucci, S. Thermal Comfort Assessment of Buildings; Springer: Berlin/Heidelberg, Germany, 2013. [Google Scholar] [CrossRef]
  33. ASHRAE Standard 55-2017; Thermal Environmental Conditions for Human Occupancy. American Society of Heating, Refrigerating and Air-Conditioning Engineers: Atlanta, GA, USA, 2017.
  34. ASHRAE Standard 55-2013; Thermal Environmental Conditions for Human Occupancy. American Society of Heating, Refrigerating and Air-Conditioning Engineers: Atlanta, GA, USA, 2013.
  35. ISO 7730:2005; Ergonomics of the Thermal Environment—Analytical Determination and Interpretation of Thermal Comfort Using Calculation of the PMV and PPD Indices and Local Thermal Comfort Criteria. International Standard Organization: Genève, Switzerland, 2005.
  36. Gao, S.; Li, Y.; Wang, Y.A.; Meng, X.Z.; Zhang, L.Y.; Yang, C.; Jin, L.W. A human thermal balance based evaluation of thermal comfort subject to radiant cooling system and sedentary status. Appl. Therm. Eng. 2017, 122, 461–472. [Google Scholar] [CrossRef]
  37. He, X.; Gao, W.; Wang, R.; Yan, D. Study on outdoor thermal comfort of factory areas during winter in hot summer and cold winter zone of China. Build. Environ. 2023, 228, 109883. [Google Scholar] [CrossRef]
  38. Ma, T.; Zhang, J. Integrating Thermal Perception and Public Space Use–An Experimental Outdoor Thermal Comfort Study in Cold Winter-Hot Summer Zone: Beijing, China. Urban Clim. 2024, 58, 102138. [Google Scholar] [CrossRef]
  39. Wu, P.; Zhang, Y.; Fang, Z.; Gao, Y. Comparison of thermal comfort in different kinds of building spaces: Field study in Guangzhou, China. Indoor Built Environ. 2022, 31, 186–202. [Google Scholar] [CrossRef]
  40. Yan, H.; Yang, L.; Dong, M.; Hu, B.; Sun, Z.; Shi, F.; Yuan, G.; Bi, X. Thermal comfort in residential buildings using bimetal radiator heating vs. floor heating terminals. J. Build. Eng. 2022, 45, 103501. [Google Scholar] [CrossRef]
  41. Li, Z.; Zhang, Q.; Zhang, G.; Song, G.; Fan, F. Insight of environmental quality of a semi-enclosed large-scale stadium during football matches: A case study in Harbin, China. Build. Environ. 2022, 217, 109103. [Google Scholar] [CrossRef]
  42. Gong, P.; Cai, Y.; Zhou, Z.; Zhang, C.; Chen, B.; Sharples, S. Investigating spatial impact on indoor personal thermal comfort. J. Build. Eng. 2022, 45, 103536. [Google Scholar] [CrossRef]
  43. Liu, Y.; Grimmond, S.; Luo, Z.; Hertwig, D.; McGrory, M.; Piano, S.L.; Smith, S.T. Dwelling conversion and energy retrofit modify building anthropogenic heat emission under past and future climates: A case study of London terraced houses. Energy Build. 2024, 322, 114668. [Google Scholar] [CrossRef]
  44. Tian, G.; Fan, Y.; Gao, M.; Wang, H.; Zheng, H.; Liu, J.; Liu, C. Indoor thermal environment of thin membrane structure buildings: A review. Energy Build. 2021, 234, 110704. [Google Scholar] [CrossRef]
  45. Hou, Y.; Cao, B.; Zhu, Y.; Zhang, H.; Yang, L.; Duanmu, L.; Lian, Z.; Zhang, Y.; Zhai, Y.; Wang, Z.; et al. Temporal and spatial heterogeneity of indoor and outdoor temperatures and their relationship with thermal sensation from a global perspective. Environ. Int. 2023, 179, 108174. [Google Scholar] [CrossRef] [PubMed]
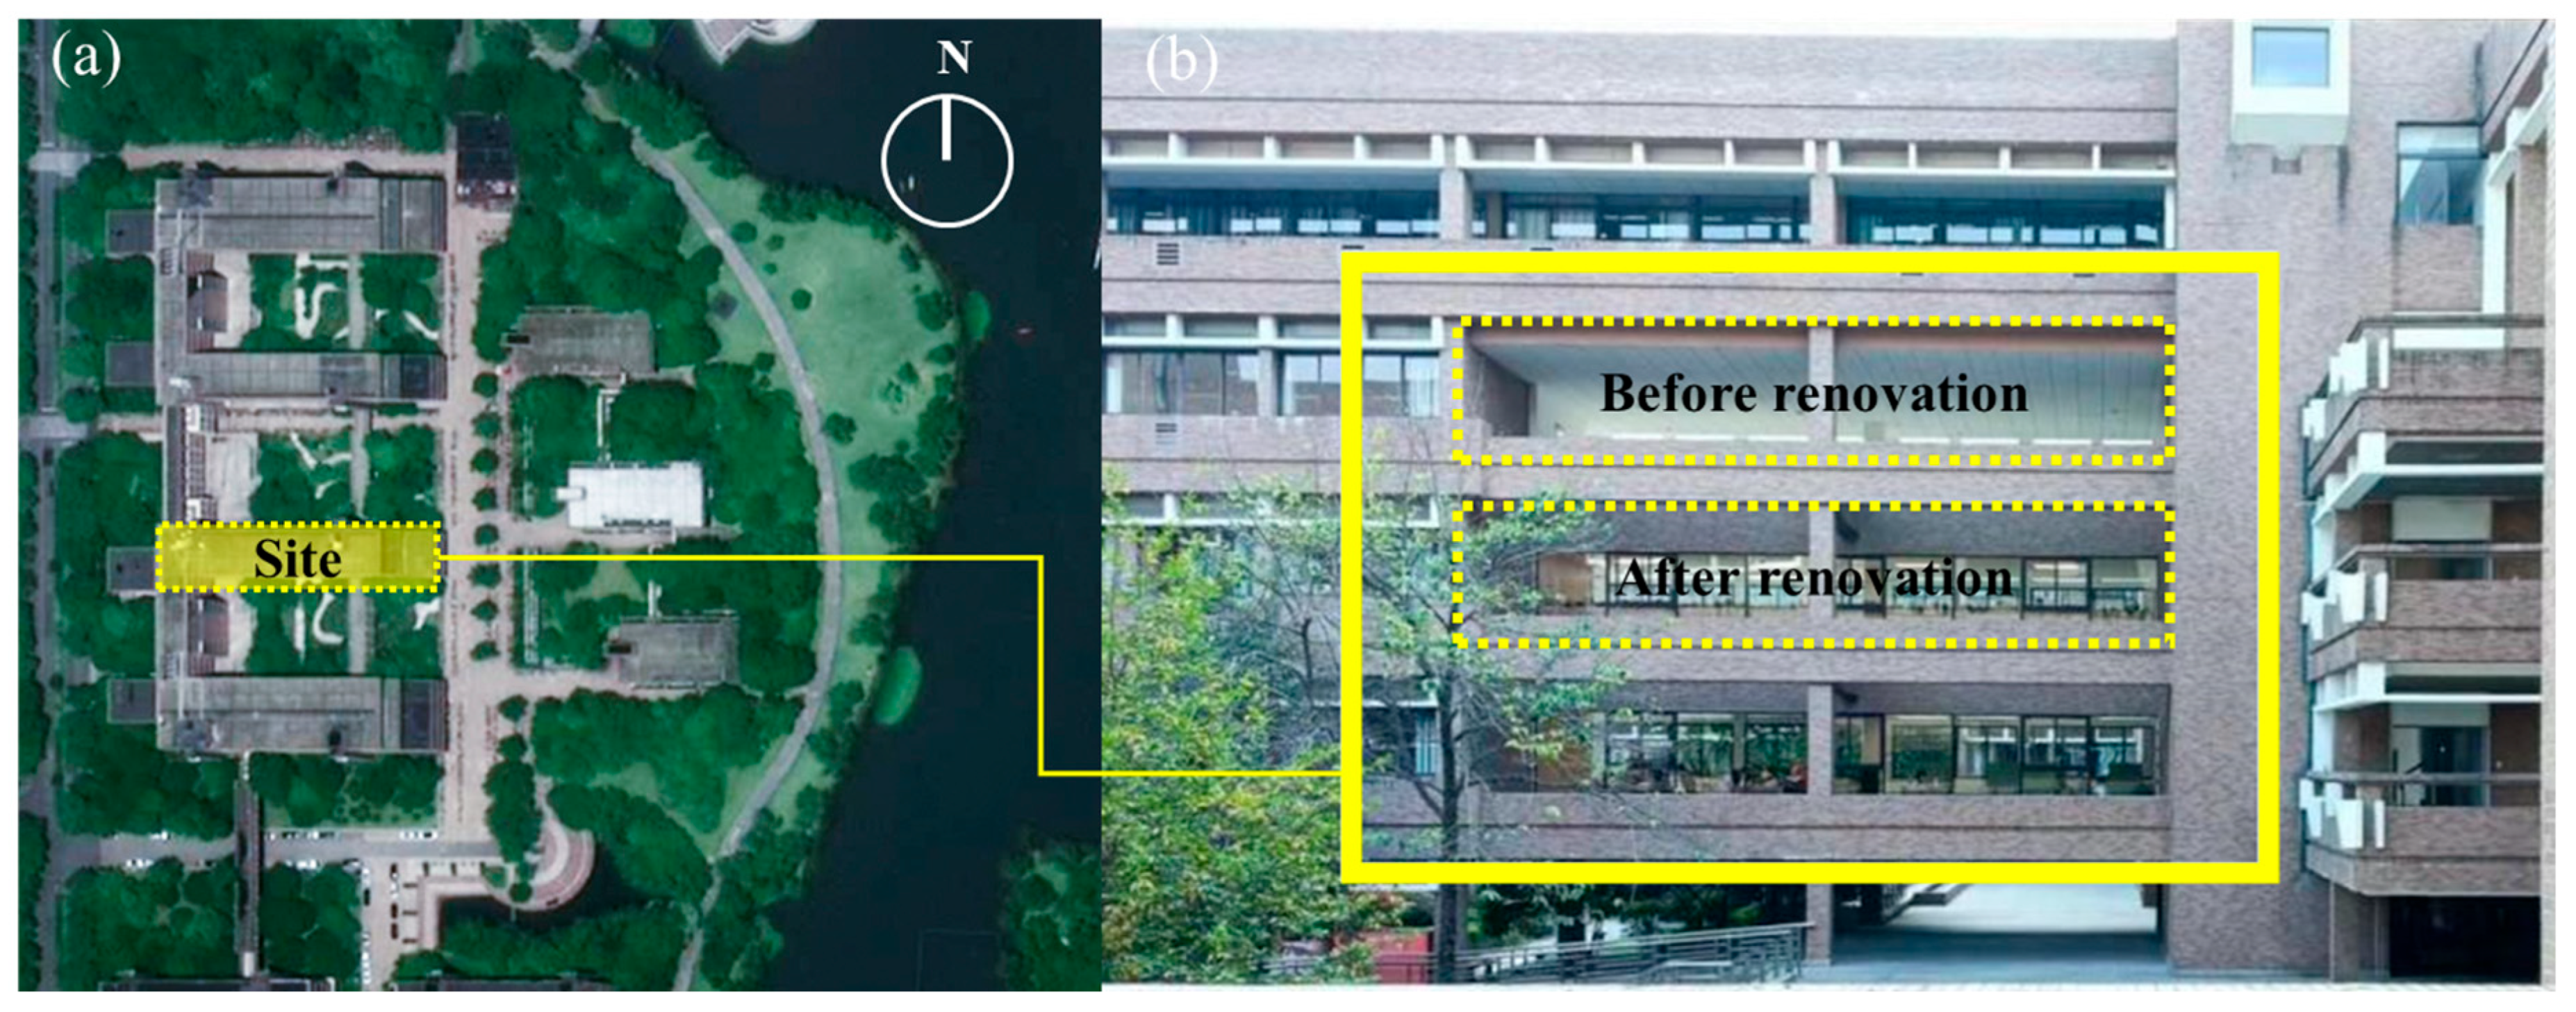
Figure 1. Overview of the study site. (a) Site plan showing the location of West Teaching Building 2 and (b) its architectural elevation.
Buildings 15 02883 g001
Figure 2. Space of the west teaching building before and after envelope retrofit: (a) pre-retrofit with open interface; (b) post-retrofit with closed interface.
Buildings 15 02883 g002
Figure 3. Schematic of the retrofitted envelope, showing the wall and window structure, along with their thermal and material properties.
Buildings 15 02883 g003
Figure 4. Distribution of measurement points for thermal environment parameters: (a) sensors positions; (b) test sensor photograph.
Buildings 15 02883 g004
Figure 5. Variations in indoor Ta, RH, and Tmrt before and after the envelope retrofit: (a) Ta; (b) RH; (c) Tmrt; (d) box plots of the thermal environmental parameters. Note: data were collected on a sunny day (13 December) and a rainy day (24 December) in winter. “Before retrofit” refers to measurements on the second and third floors, and “after retrofit” refers to the fourth floor. Note: **** p < 0.0001 and *** p < 0.001.
Buildings 15 02883 g005
Figure 6. Surface temperature of floor, walls, ceiling, and windows before and after retrofit: (a) temperature variations over time; (b) comparison of temperatures using boxplots. Note: *** p < 0.001.
Buildings 15 02883 g006
Figure 7. Variation in PET before and after the enclosure retrofit: (a) Temporal variations of PET; (b) distribution characteristics of PET before and after the retrofit under different weather conditions. Note: *** p < 0.001.
Buildings 15 02883 g007
Figure 8. Variations in PMV before and after the enclosure retrofit: (a) PMV variation over time; (b) distribution characteristics of PMV before and after the retrofit under different weather conditions. Note: *** p < 0.001.
Buildings 15 02883 g008
Figure 9. Distribution of thermal sensation votes (TSVs) and thermal comfort votes (TCVs), (a) TSV before retrofit; (b) TSV after retrofit; (c) TCV before retrofit; (d) TCV after retrofit.
Buildings 15 02883 g009
Figure 10. Correlation matrix of thermal comfort indices and objective environmental parameters. Note: * indicates significance at p < 0.05.
Buildings 15 02883 g010
Figure 11. Linear regression fitting of MTSV with PET and PMV: (a) fitting of MTSV with PET; (b) fitting of MTSV with PMV.
Buildings 15 02883 g011
Figure 12. Validation model of the retrofitted space.
Buildings 15 02883 g012
Figure 13. Validation results of the retrofitted space.
Buildings 15 02883 g013
Figure 14. Indoor thermal environment distribution before and after retrofit under typical summer and winter conditions, (a) air temperature distribution, (b) wind speed distribution, (c) PMV distribution in summer (after retrofit), (d) PMV distribution in winter (after retrofit).
Buildings 15 02883 g014
Table 1. Measurement instruments and their specifications.
ParameterInstrument NameManufacturerModelResolutionMeasurement Range
TemperatureTemperature and humidity loggerTianjian Huayi Instrument Technology Co., Ltd. (Beijing, China)WSZY-10.1 °C−40~100 °C
Humidity 0.1%0~100%
Wind speedAnemometerTianjian Huayi Instrument Technology Co., Ltd. (Beijing, China)WFWZY-10.01 m/s0.05~30 m/s
Globe temperatureGlobe thermometerTianjian Huayi Instrument Technology Co., Ltd. (Beijing, China)HQZY-10.3 °C−20~80 °C
Radiant temperatureInfrared thermometerFluke Corporation (Everett, WA, USA)MT4 MAX0.1 °C−30~400 °C
Disclaimer/Publisher’s Note: The statements, opinions and data contained in all publications are solely those of the individual author(s) and contributor(s) and not of MDPI and/or the editor(s). MDPI and/or the editor(s) disclaim responsibility for any injury to people or property resulting from any ideas, methods, instructions or products referred to in the content.