Article

Research on Working and Mechanical Properties of Self-Compacting Steel-Fiber-Reinforced High-Strength Concrete

College of Architecture Engineering, North China Institute of Aerospace Engineering, Langfang 065000, China
*
Author to whom correspondence should be addressed.
Buildings 2025, 15(16), 2875; https://doi.org/10.3390/buildings15162875
Submission received: 17 July 2025 / Revised: 4 August 2025 / Accepted: 11 August 2025 / Published: 14 August 2025

Abstract

This paper discusses the potential of using steel fiber to produce self-compacting high-strength concrete. The effects of water–binder ratio and mortar and steel fiber content on the workability and mechanical properties of high-performance concrete were studied. The working performance of cementitious materials was evaluated by a slump expansion test, T500, L-shaped instrument, U-shaped instrument, and V-shaped funnel. The mechanical properties were evaluated by compressive strength and flexural strength. The results show that when the compressive strength of self-compacting high-strength concrete with steel fiber is 90 MPa, the optimum mix ratio is a water–binder ratio of 0.22, sand ratio of 46%, and steel fiber content of 0.3%. When the steel fiber content is 0.3%, the compressive strength of the time can be increased by more than 4%, and the flexural strength can be increased by more than 5%. When the steel fiber content is 0.6% to 0.9%, the compressive strength of the specimen can be increased by more than 10%, and the flexural strength can be increased by more than 7%. However, with the increase in steel fiber content, self-compacting concrete becomes less and less dense, and the bond strength becomes lower and lower. When the water–binder ratio is 0.20, the fluidity of self-compacting concrete is poor, and the forming effect is not good. When the water–binder ratio is 0.24, the working performance of self-compacting concrete is better, but the cohesion is poor, and it can easily produce segregation. When the water–binder ratio is 0.22, the working performance of self-compacting concrete can be the best, and the strength of concrete is higher and more stable. The optimum sand ratio is 46%. At this time, the compressive strength and flexural strength of self-compacting concrete are the largest, and the working performance is also the best. When the sand ratio is lower than the optimum sand ratio, the self-compacting concrete will produce segregation. When the sand ratio is higher than the optimum sand ratio, the fluidity of self-compacting concrete is poor. This study provides insights into the potential for large-scale and high-value utilization of steel fibers and the development of cost-effective ways to reduce the carbon footprint of self-compacting concrete production.

1. Introduction

Self-compacting high-strength concrete mixed with steel fiber is a new type of high-performance cementitious composite material, which is mainly composed of steel fiber, cement, cementitious material, water, coarse aggregate, fine aggregate, and superplasticizer. Compared with conventional concrete, it has the advantages of high fluidity, anti-segregation, gap passing type, good uniformity, and stability [1,2,3,4,5,6,7,8]. It can better adapt to the construction of large-span, ultra-high buildings and complex construction projects and can improve the quality of concrete, save cement, reduce noise, improve productivity, speed up the progress of the project, and improve the working environment [9,10,11,12,13,14,15,16,17,18].
The practical application of steel fiber in concrete engineering began in the 1970s. After the Battelle company in the United States developed melt-extracted steel fiber technology, it was also rapidly studied in Japan, Britain, Sweden, and Canada. In terms of working performance, R., Deeb, A., Ghanbari et al. compared and analyzed the working performance of self-compacting high-performance concrete with and without steel fiber. Studies have shown that steel fiber can enhance its working performance, but it will lead to fiber segregation [19]. Frazao, Cristina et al. studied self-compacting concrete mixed with steel fiber, and its compressive strength can reach 63.85 MPa [20]. A Khaloo, EM Raisi et al. found that with the increase in steel fiber content, the compressive strength of concrete with a strength of 40 MPa or 60 MPa will decrease [21]. Ding Y, Liu S et al. have shown that the shear strength of steel-fiber-reinforced self-compacting concrete with a compressive strength of 39.3 MPa has been improved [22]. B Akcay, MA Tasdemir et al. found that adding steel fiber to self-compacting concrete will reduce its fluidity, and its splitting tensile strength will not change with the increase in content [23]. R Siddique, G Kaur et al. mixed fly ash and hooked steel fiber into self-compacting concrete. The results showed that the compressive strength of self-compacting concrete increased from 34.6 MPa to 38.5 MPa [24]. Alabduljabbar, Hisham et al. found that the 28-day compressive strength of self-compacting concrete with 2% steel fiber can reach 75.1 MPa [25]. X Liu, X Wang et al. optimized the mix ratio of manufactured sand high-strength self-compacting concrete with compressive strength of 40 MPa, 60 Mpa, and 80 MPa, respectively, and found that the sand ratio had little effect on its performance [26]. RK Xi, GX Fang et al. used fly ash, slag, and silica fume as equivalent substitutes for cement to prepare high-strength self-compacting concrete with a compressive strength of 70 MPa [27,28].
The above research mainly focuses on steel-fiber-reinforced self-compacting concrete with a compressive strength of 40 MPa ~ 80 MPa. The synergistic effect mechanism of key parameters such as steel fiber content, water–binder ratio, and sand ratio on the workability and mechanical properties of self-compacting steel-fiber-reinforced concrete is unknown. Therefore, this experiment studied the working and mechanical properties of steel-fiber-reinforced self-compacting high-strength concrete with a compressive strength of 90 MPa. Through the synergy of mineral admixture substitution and low water–binder ratio design, the amount of cement is directly reduced to achieve carbon emission reduction, and the material redundancy consumption is reduced by optimizing the structural compactness. This study is in line with the industrial trend of energy conservation and emission reduction and can bring better economic and environmental benefits.

2. Materials and Methods

2.1. Materials

2.1.1. Cement

The cement is 42.5 grade ordinary Portland cement of Chongqing Lafarge Cement Co., Ltd. (Chongqing, China), and its chemical composition and technical properties are shown in Table 1 and Table 2, respectively.

2.1.2. Mineral Admixtures

① Silica fume: The specific surface area of semi-aggregated silicon powder produced by the Norwegian Eken Company is about 20,000 m2/kg, the density is 2.5 g/cm3, and the loose bulk density is 300 kg/m3. The chemical composition is shown in Table 3.
② Slag: S95 grade slag was produced by Chongqing Tenghui New Building Materials Co., Ltd. (Chongqing, China), with a specific surface area of 430 m2/kg and a density of 2.80 g/cm3. Its chemical composition is shown in Table 3.
Table 3. The chemical components and surface area of mineral admixtures.
ClassChemical Composition (%)
CaOSiO2Al2O3MgOFe2O3TiO2SO3Na2OMnOIgnition Loss
silica fume/95.19/0.800.13//1.050.501.90
slag40.033.3612.696.752.80///0.56/

2.1.3. Coarse Aggregate

Geloshan limestone gravel was used in the process, with a particle size range of 5–10 mm and 10–20 mm mixed in a ratio of 4:6. The technical performance indicators are shown in Table 4. The particle size distribution is shown in Figure 1.

2.1.4. Fine Aggregate

Medium sand produced in Yueyang is used, the fineness modulus is 2.8, and its performance technical indicators are shown in Table 5.

2.1.5. High Efficiency Water Reducing Agent

Polycarboxylate superplasticizer was used, and its solid content was 30%. In use, it is mixed according to the mass percentage of the total amount of cementitious materials. Its performance indicators are shown in Table 6.

2.1.6. Steel Fiber

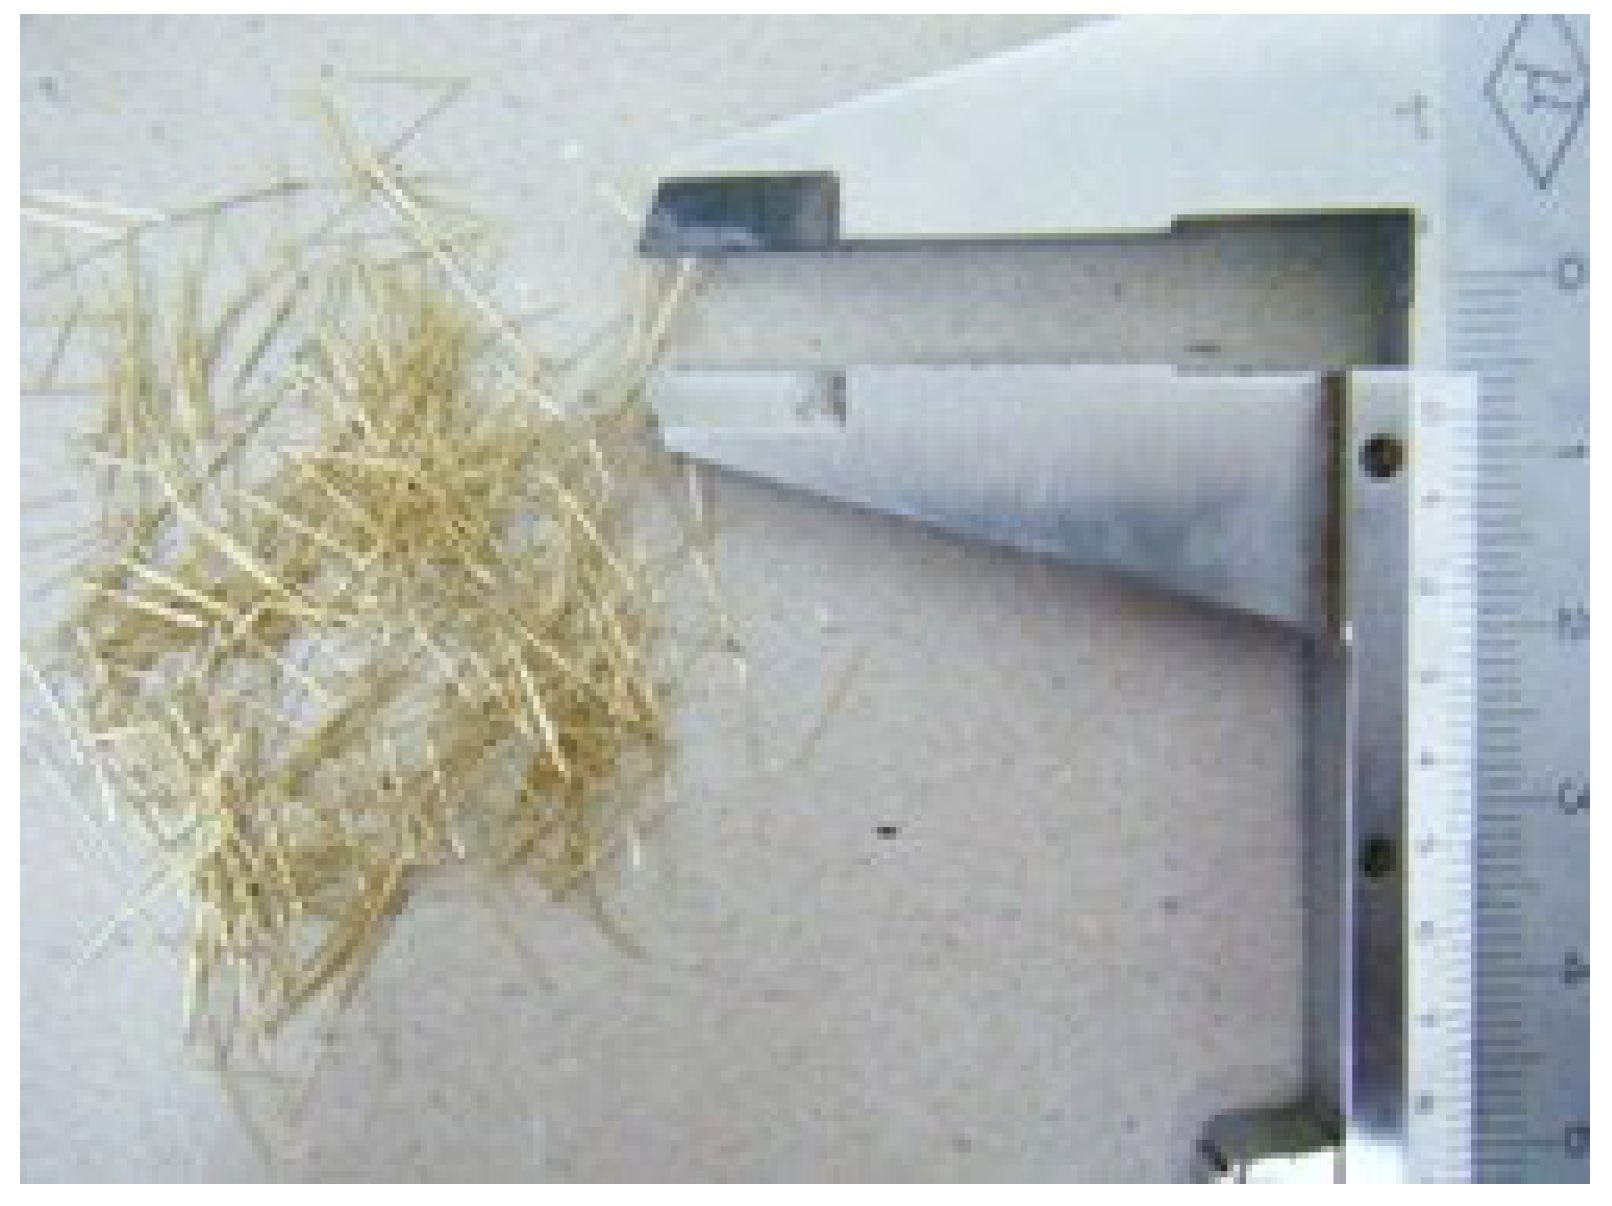
The copper-plated micro-steel fiber produced by Chongqing Yizhu Engineering Fiber Manufacturing Co., Ltd. (Chongqing, China) was adopted, as shown in Figure 2. The performance index is shown in Table 7. Steel fiber is added to the mixture by volume percentage.

2.1.7. Mixing Water

Chongqing tap water is used as concrete mixing water.

2.2. Proportion of Mixture and Sample Preparation

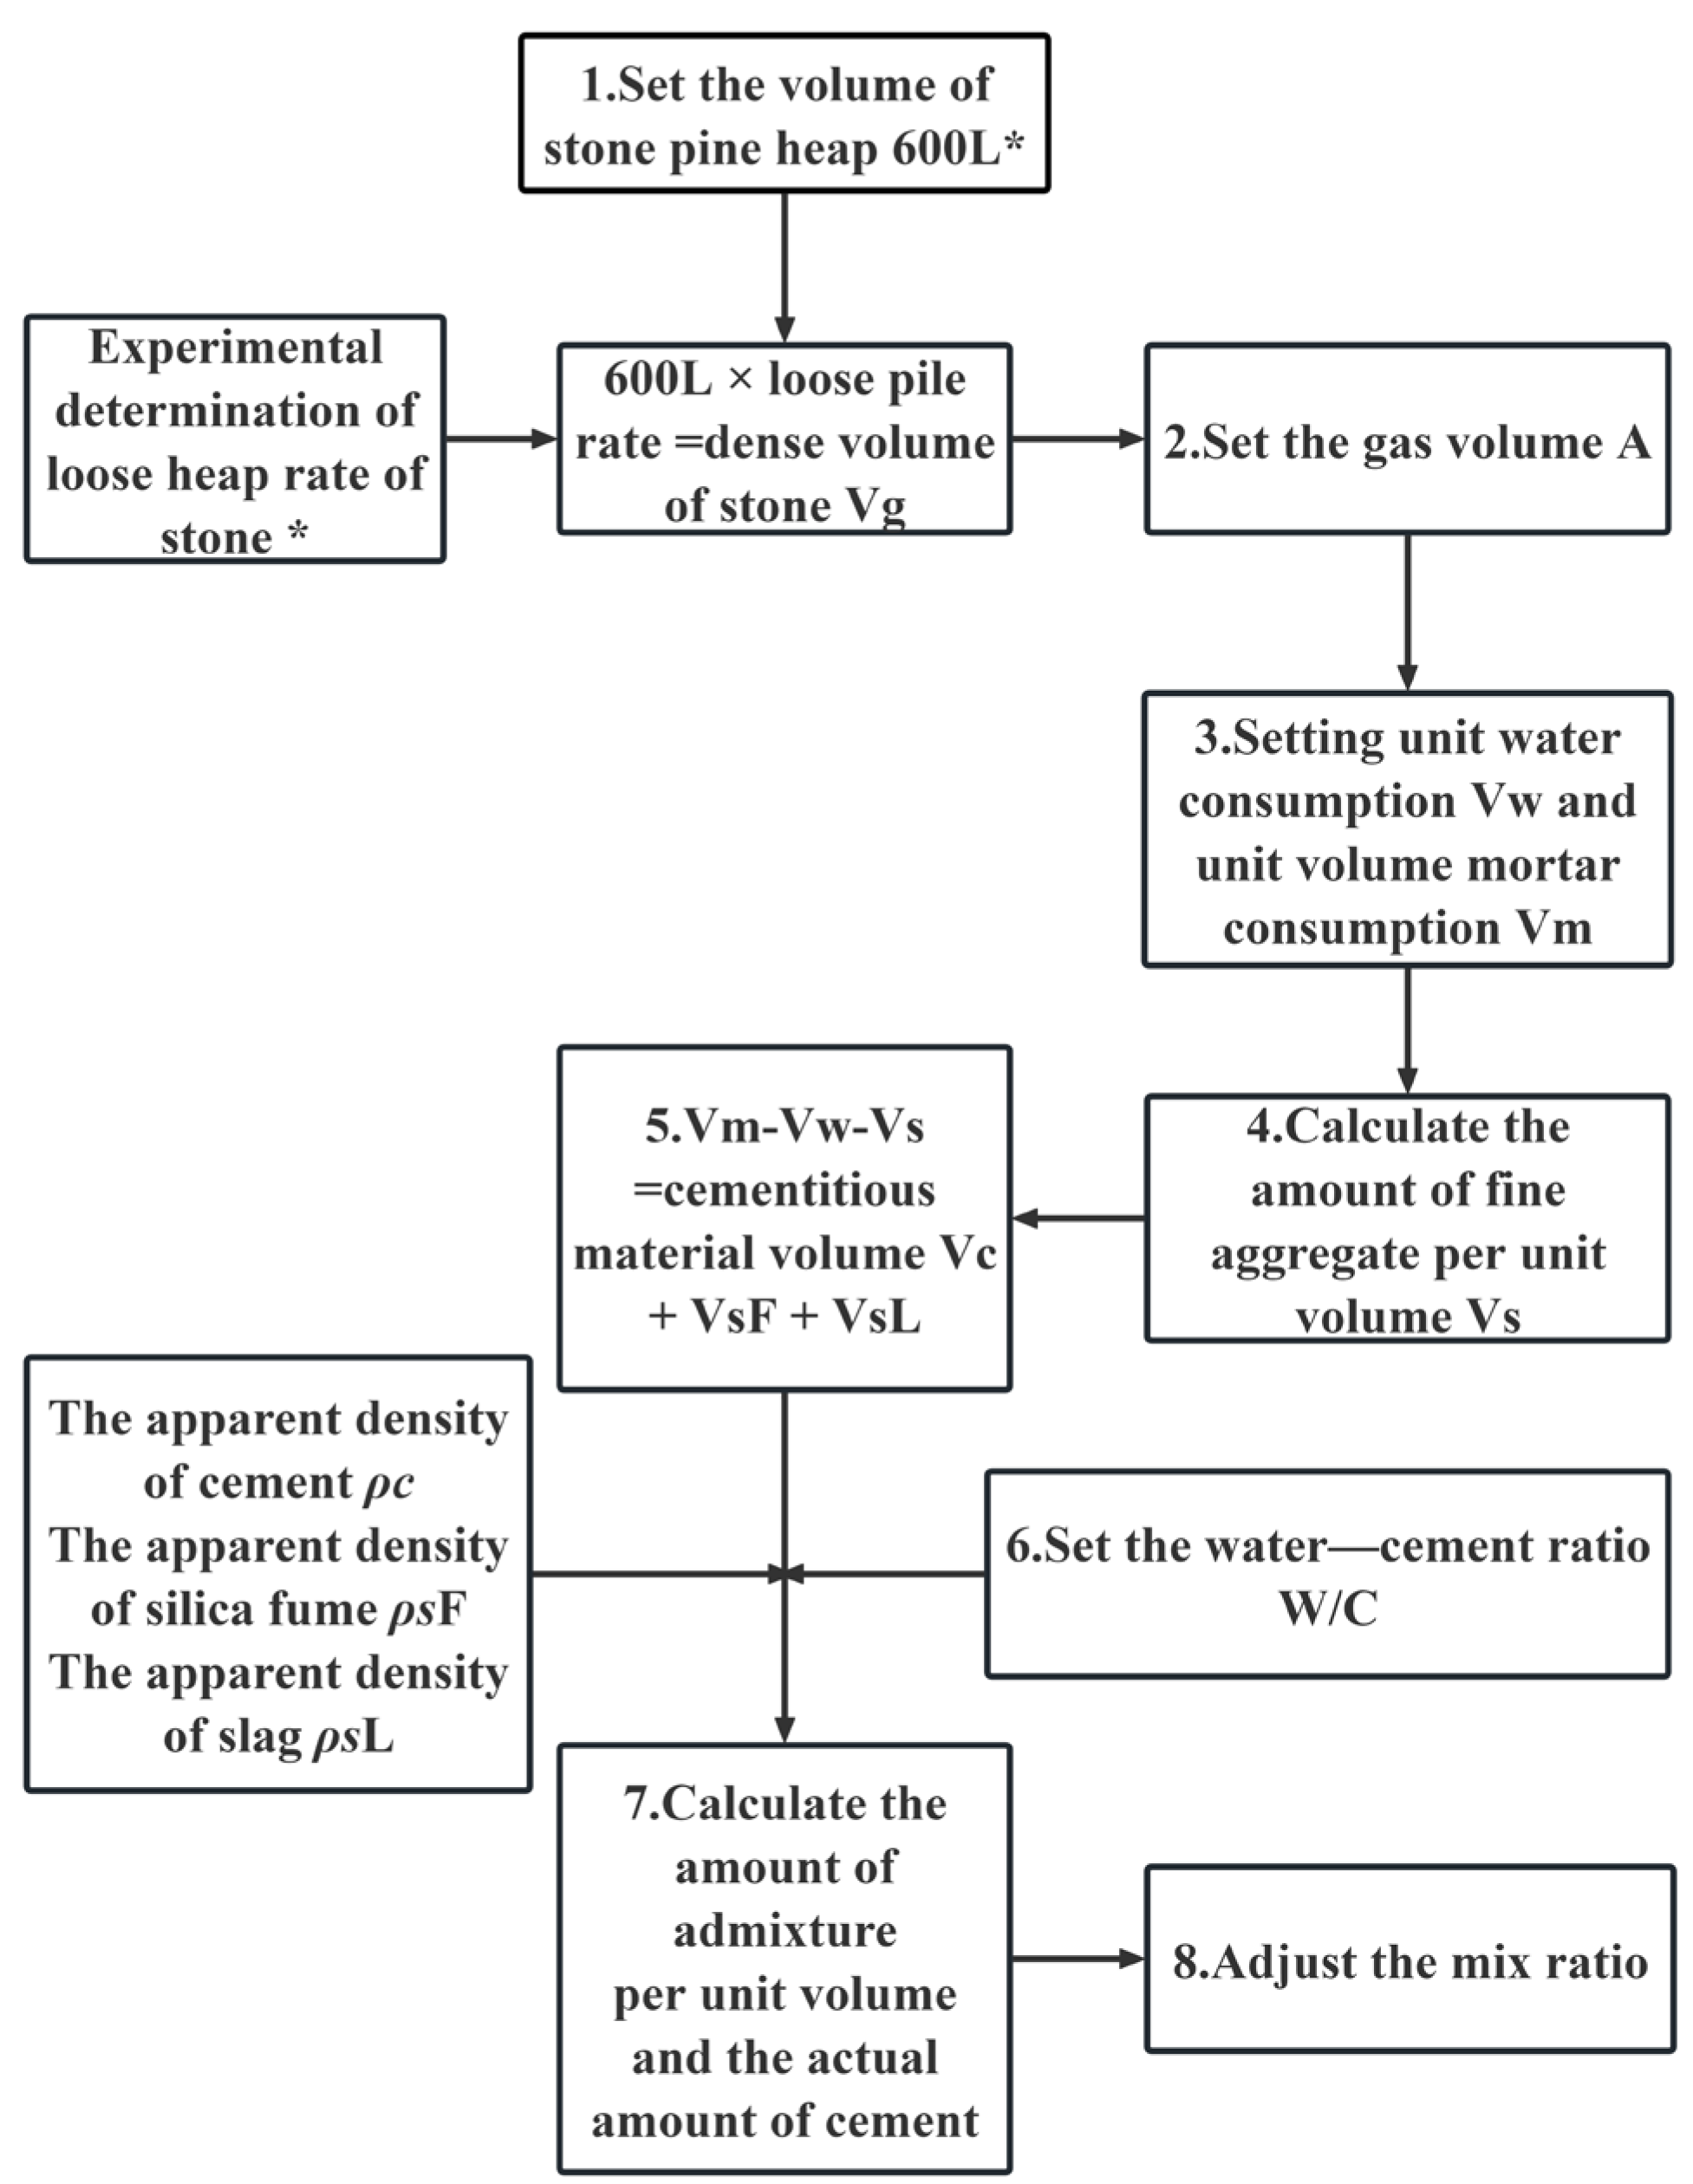
The purpose of this study is to prepare C90 steel fiber self-compacting high-strength concrete. According to the previous experimental experience of steel-fiber-reinforced concrete, the benchmark self-compacting high-strength concrete in this experiment is designed according to the C80 strength grade. According to the requirements of the specified indicators of self-compacting concrete, with reference to the (CECS203: 2006) “self-compacting concrete technical manual”, the mix ratio of self-compacting concrete in this test is designed by the absolute volume method. In CCECS02-2004, the loose volume of coarse aggregate is recommended to be 500 ~ 600 L, and the specific dosage is set according to the experimental conditions. After many tests, the loose volume of coarse aggregate was 600 L, as shown in Figure 3.
After repeated trial fitting and experimental testing of the theoretical mix ratio, the benchmark mix ratio of C80 self-compacted high-strength concrete is shown in Table 8.

2.3. Self-Compacting Concrete Mix Design Adjustment

Based on the benchmark mix ratio, this study investigates the water–binder ratio, sand ratio, and steel fiber content, respectively. The mix ratios are listed in Table 9, Table 10, and Table 11, respectively. Referring to the “Technical specification for application of self-compacting concrete” [29], the water–binder ratio of high-strength self-compacting concrete usually needs to be controlled at 0.20–0.28. According to multiple tests, this study selected a water–binder ratio of 0.20–0.24. According to the research of Ba Hengjing et al. [30], the reasonable sand ratio should make the fine aggregate slightly surplus after filling the coarse aggregate gap, and the fluidity and cohesion are the best. According to many tests, the sand ratio of 44–50% is selected in this study. Alabduljabbar et al. showed that when the steel fiber content was 0–1.0%, the strength was significantly improved, but more than 1.0% would destroy the self-compacting property [25]. According to many experiments, the steel fiber content was selected to be 0–0.9% in this study to avoid excessive agglomeration.

2.4. Test Method

2.4.1. Working Performance Test

The test was carried out according to the standard of “Technical Specification for Application of Self-compacting Concrete” (CECS203: 2006) of the China Engineering Construction Standardization Association and the standard of “Design and Construction Guide for Self-compacting Concrete” (CCES02-2004) of the China Civil Engineering Society. The test indexes include slump expansion, T500 flow time, L-shaped instrument index, and U-shaped instrument index test.
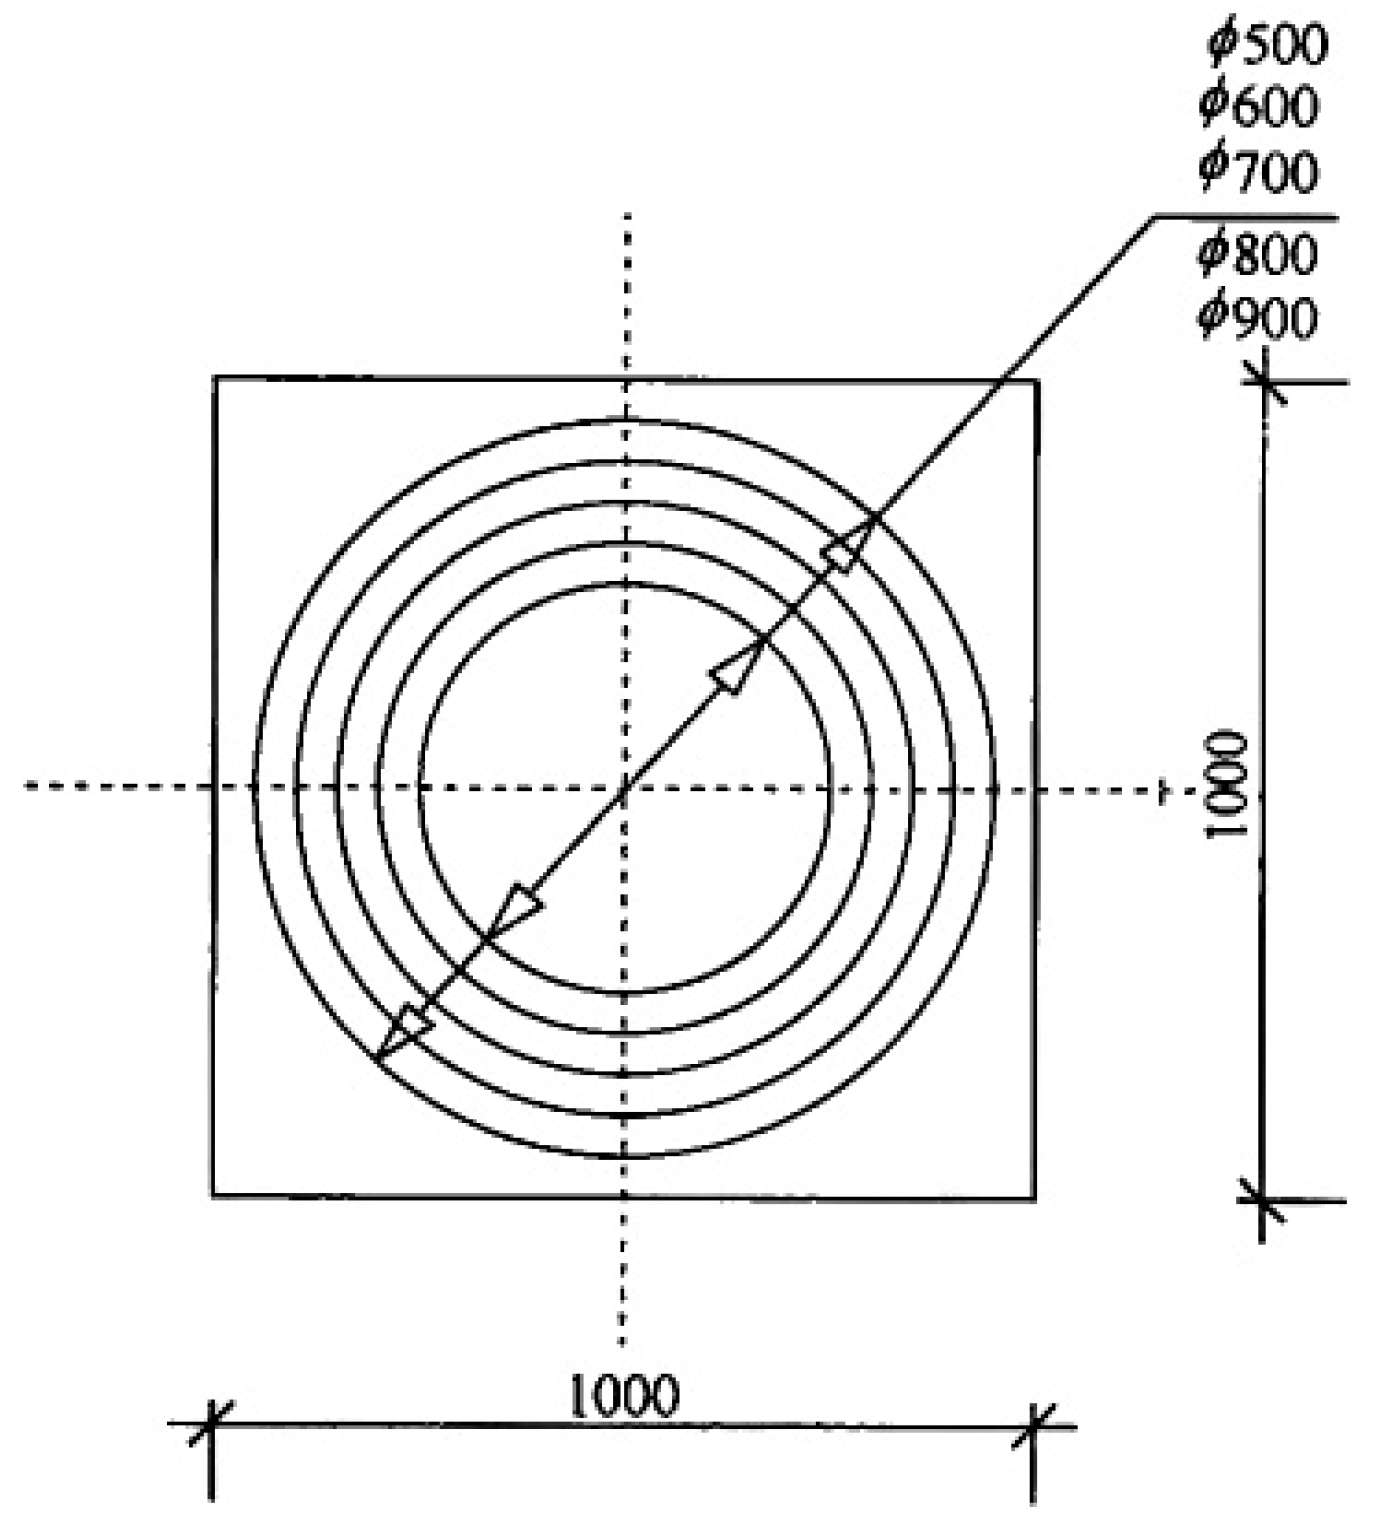
Slump extension and T500 time are shown in Figure 4. The test method is shown in Figure 5.

2.4.2. U-Shaped Instrument Test

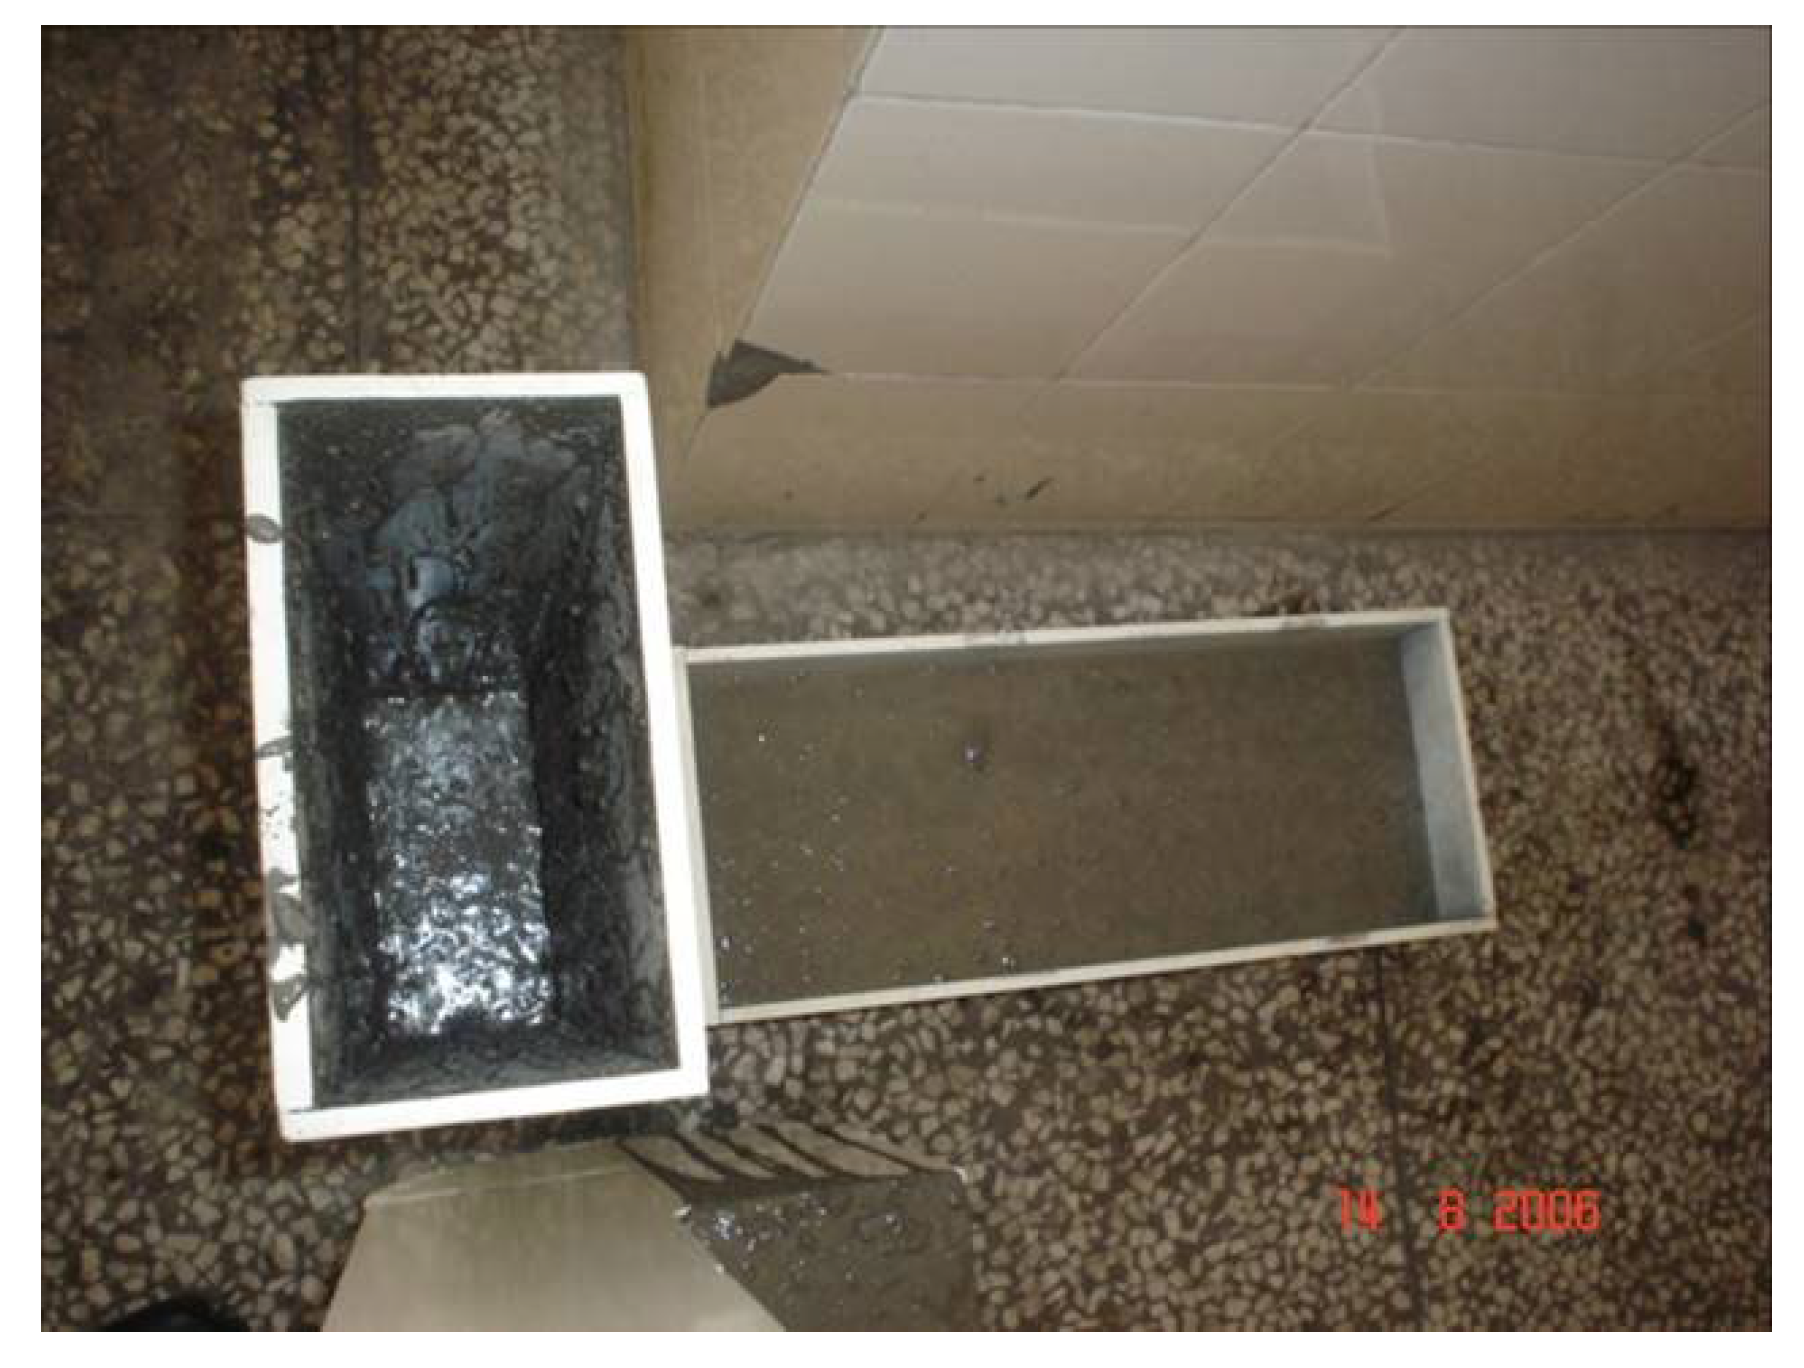
The U-shaped instrument is divided into left and right chambers, and the middle is separated by a partition plate at a certain distance from the bottom plate. During the test, the gap is blocked with a baffle, the concrete is loaded into the left box, and the baffle is lifted after being filled. The concrete mixture flows through the gap at the bottom, and the height difference ΔH of the concrete in the two chambers is measured. The suitable range of ΔH is 0 ~ 30 mm, as shown in Figure 6 and Figure 7.

2.4.3. L-Shaped Instrument

The test device is shown in Figure 8 and Figure 9. During the test, the test material is filled in two layers from part A, and each layer is inserted 5 times. The partition is pulled up, and the concrete sample flows to part B. Infrared ultrasonic sensors are set up at 5 cm and 10 cm from the opening, respectively, to measure the time between the two points and calculate the flow velocity of the test material. After the flow stops, the sinking value of part A and the flow spreading value of the side end of the horizontal part B are measured, which are slump (Ls) and fluidity (Lf), respectively.

2.4.4. Test Method of Concrete Microstructure

The pore structure of self-compacting high-strength concrete was tested by the nitrogen adsorption method. The interface structure between steel fiber and concrete was analyzed by SEM.
Sample preparation of hole structure: The coarse aggregate in concrete is sieved and the mortar is molded, followed by curing to the specified age under standard curing conditions, and then mashing, selecting the size of 5 cm particles. The sample is immersed in anhydrous ethanol for 24 h to terminate hydration. Then it is removed and dried in the oven until constant weight. Sample delivery detection is then undertaken.
SEM scanning electron microscope sample preparation: The concrete specimen is destroyed, the large particles with steel fiber are selected, and then the particles are slightly scraped with a scraper; the steel fiber must not be touched and collided with during the scraping process. Finally, particles of 5 cm size are obtained and immersed in anhydrous ethanol for 24 h to terminate hydration. Then they are subjected to oven-drying to constant weight and sent for sample detection.

2.4.5. Shrinkage and Mechanical Properties Test

Shrinkage performance test: The experimental instruments and methods used in the shrinkage performance test of concrete were carried out according to the national standard of the People’s Republic of China’s national standard “Standard for long-term performance and durability of ordinary concrete” (GB/T 50082-2009). The number of specimens in each group was 3, and the average value was taken.
Mechanical performance test: The experimental instruments and methods used in the basic performance test of concrete were carried out according to the national standard of the People’s Republic of China’s “Experimental method for mechanical properties of ordinary concrete” (GB/T50081-2002). The number of specimens in each group was 3, and the average value was taken.

3. Results

3.1. Effect of Steel Fiber

Adding randomly distributed steel fibers to concrete will affect the working performance of self-compacting high-strength concrete to a certain extent. In order to study and analyze the influence of steel fiber content on the working performance and mechanical properties of self-compacting high-strength concrete, three different steel fiber contents of 0.3%, 0.6%, and 0.9% were determined according to multiple tests. Compared with self-compacting high-strength concrete without any fiber, the test results are as follows.

3.1.1. Effect of Steel Fiber on Working Performance

Through analysis of Table 12, it can be concluded that when steel fiber is not added, the slump expansion of self-compacting high-strength concrete is up to 700 mm. After adding steel fiber, the slump expansion, T500, U-type, and L-type experimental results of concrete become worse. This is consistent with the research of Akcay et al. [23]. With the increase in steel fiber content, the fluidity of concrete becomes worse and worse. When the content exceeds a certain proportion, the steel fiber appears “agglomeration” phenomenon, and the self-compacting concrete cannot even meet the self-compacting requirements. In this experiment, when the water–binder ratio is 0.22, the sand ratio is 46%, and the steel fiber content is 0.3%, the working performance of the steel fiber self-compacting high-strength concrete mixture meets the self-compacting requirements.

3.1.2. Effect of Steel Fiber on Shrinkage

Through analysis of Figure 10, when the steel fiber content is less than 0.6%, with the increase in steel fiber content, the autogenous shrinkage of self-compacting high-strength concrete decreases. This is because the incorporation of steel fiber plays a role in the internal tensile stress of concrete and can inhibit the autogenous shrinkage of concrete. When the steel fiber content increases from 0.6% to 0.9%, the autogenous shrinkage of self-compacting high-strength concrete does not decrease, but increases.
Through analysis of Figure 11, in the range of 0–0.6%, with the increase in steel fiber content, the drying shrinkage of self-compacting high-strength concrete decreases, but when the steel fiber content increases to more than 0.6%, it is found that the inhibition effect of steel fiber on drying shrinkage increases little, and excessive content may even accelerate the drying shrinkage of self-compacting high-strength concrete. The reasons are as follows: ① The incorporation of steel fiber can produce tensile stress in concrete and reduce the drying shrinkage of concrete. ② With the increase in steel fiber content, the cohesion of self-compacting high-strength concrete will increase, which makes it difficult to form self-compacting concrete and not fully dense, resulting in the increase in concrete mesopores and easier water loss of concrete, resulting in increased drying shrinkage.

3.1.3. Effect of Steel Fiber on Mechanical Properties

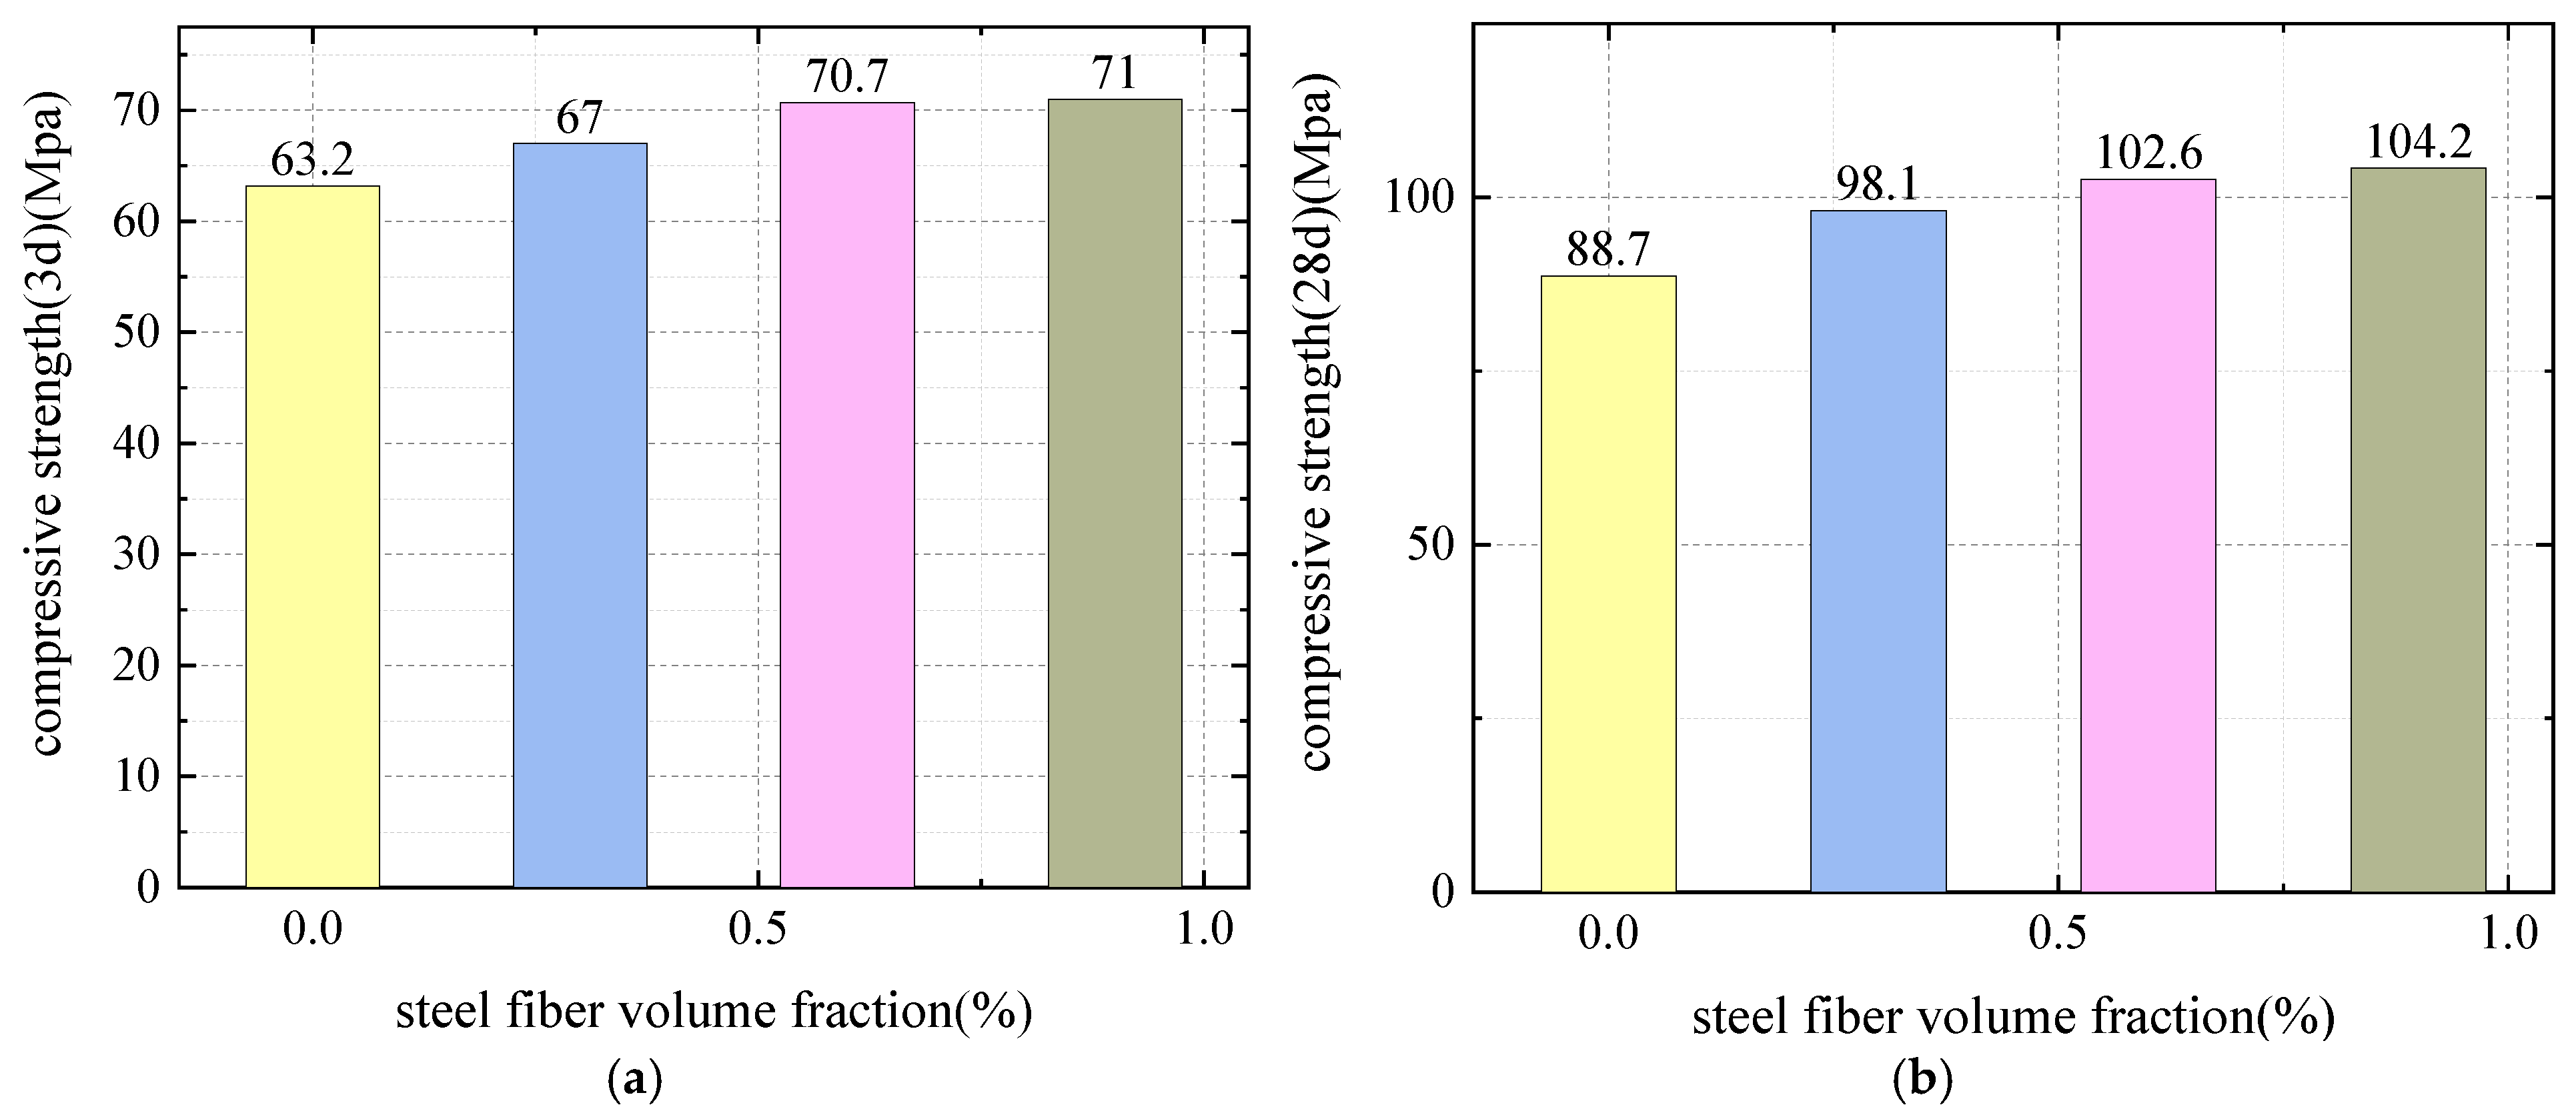
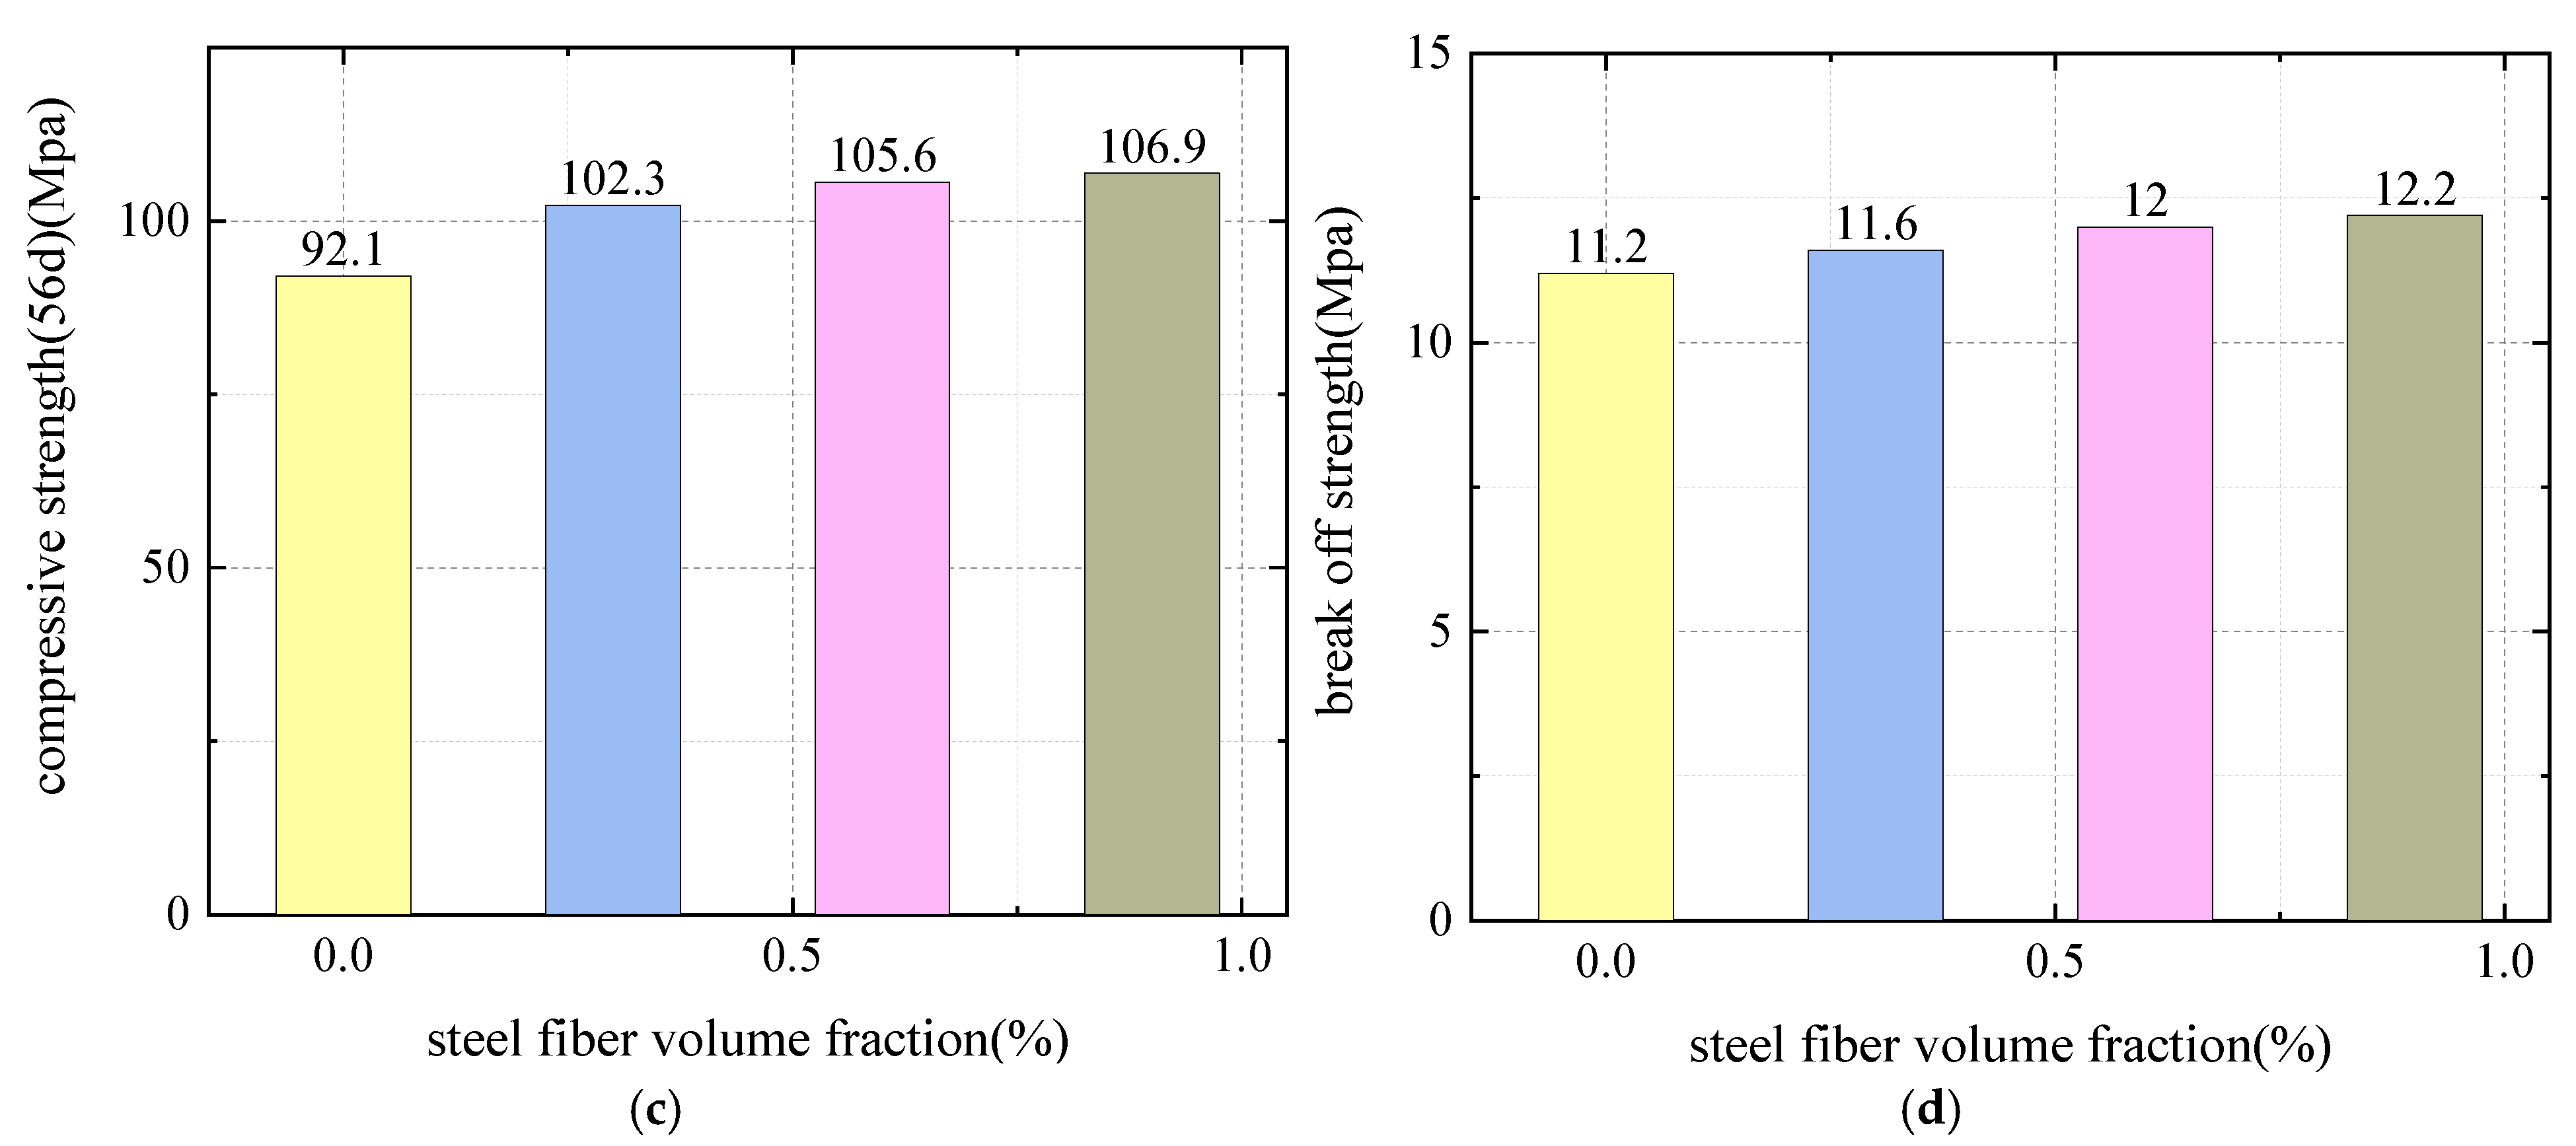
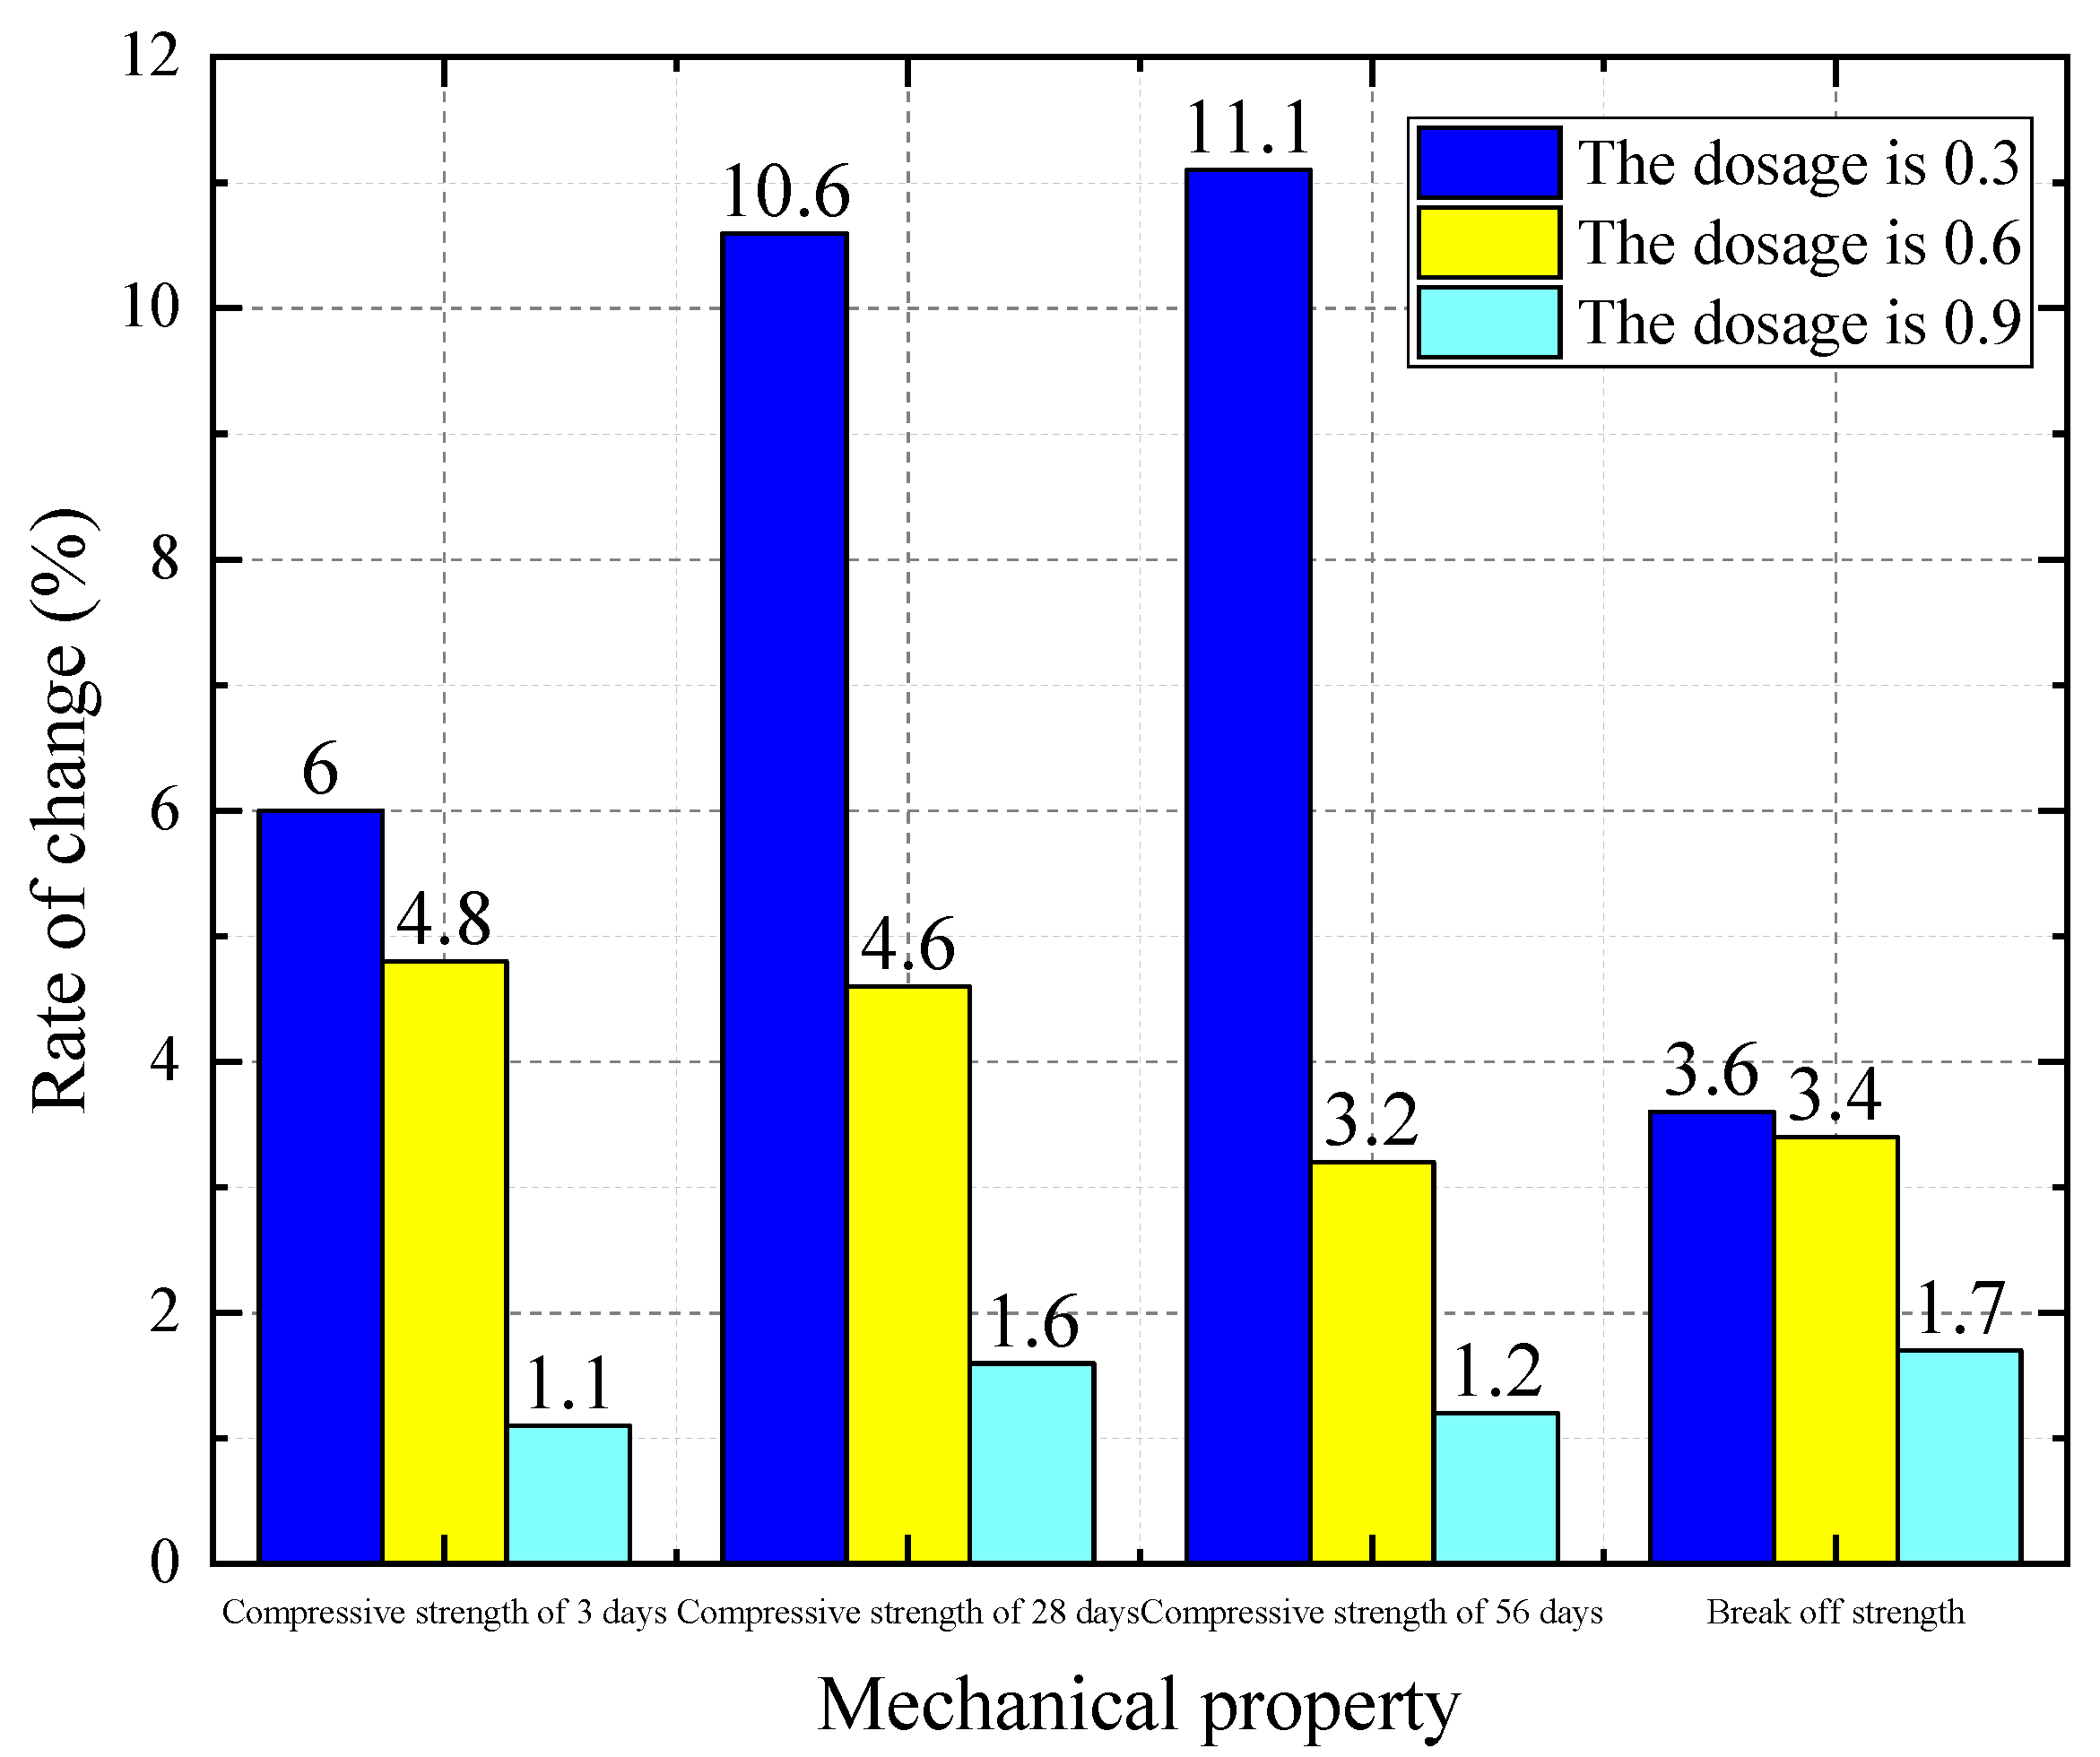
Through analysis of Figure 12 and Figure 13, with the increase in micro-steel fiber content, the compressive strength and flexural strength of steel fiber self-compacting high-strength concrete are improved. The strength of concrete increases with the increase in fiber volume content, but the increase is different. We started from the self-compacting steel fiber concrete with 0% content. For the 3 d compressive strength, the strength growth rates of micro-fiber concrete fiber volume contents of 0.3%, 0.6%, and 0.9% were 6%, 4.8%, and 1.1%, respectively. For the 28 d compressive strength, the strength growth rates of micro-fiber concrete fiber volume contents of 0.3%, 0.6%, and 0.9% were 10.60%, 4.6%, and 1.6%, respectively. For the 56-day compressive strength, the strength growth rates of microfiber concrete with fiber volume contents of 0.3%, 0.6% and 0.9% were 11.1%, 3.2% and 1.2%, respectively. The flexural strength increased by 3.6%, 3.4% and 1.7%, respectively. It can be seen that the micro-steel fiber has a reinforcing effect on the compressive strength and flexural strength of self-compacting concrete. With the increase in content, the reinforcing effect also increases accordingly. However, when the content exceeds 0.3%, the strength growth efficiency gradually decreases.

3.2. Effect of Water–Binder Ratio

Considering that the water–binder ratio is an important factor in the comprehensive index of the working performance and mechanical properties of self-compacting high-strength concrete, three different water–binder ratios of 0.20, 0.22, and 0.24 were determined according to many tests. The test results are as follows.

3.2.1. Effect on Working Performance

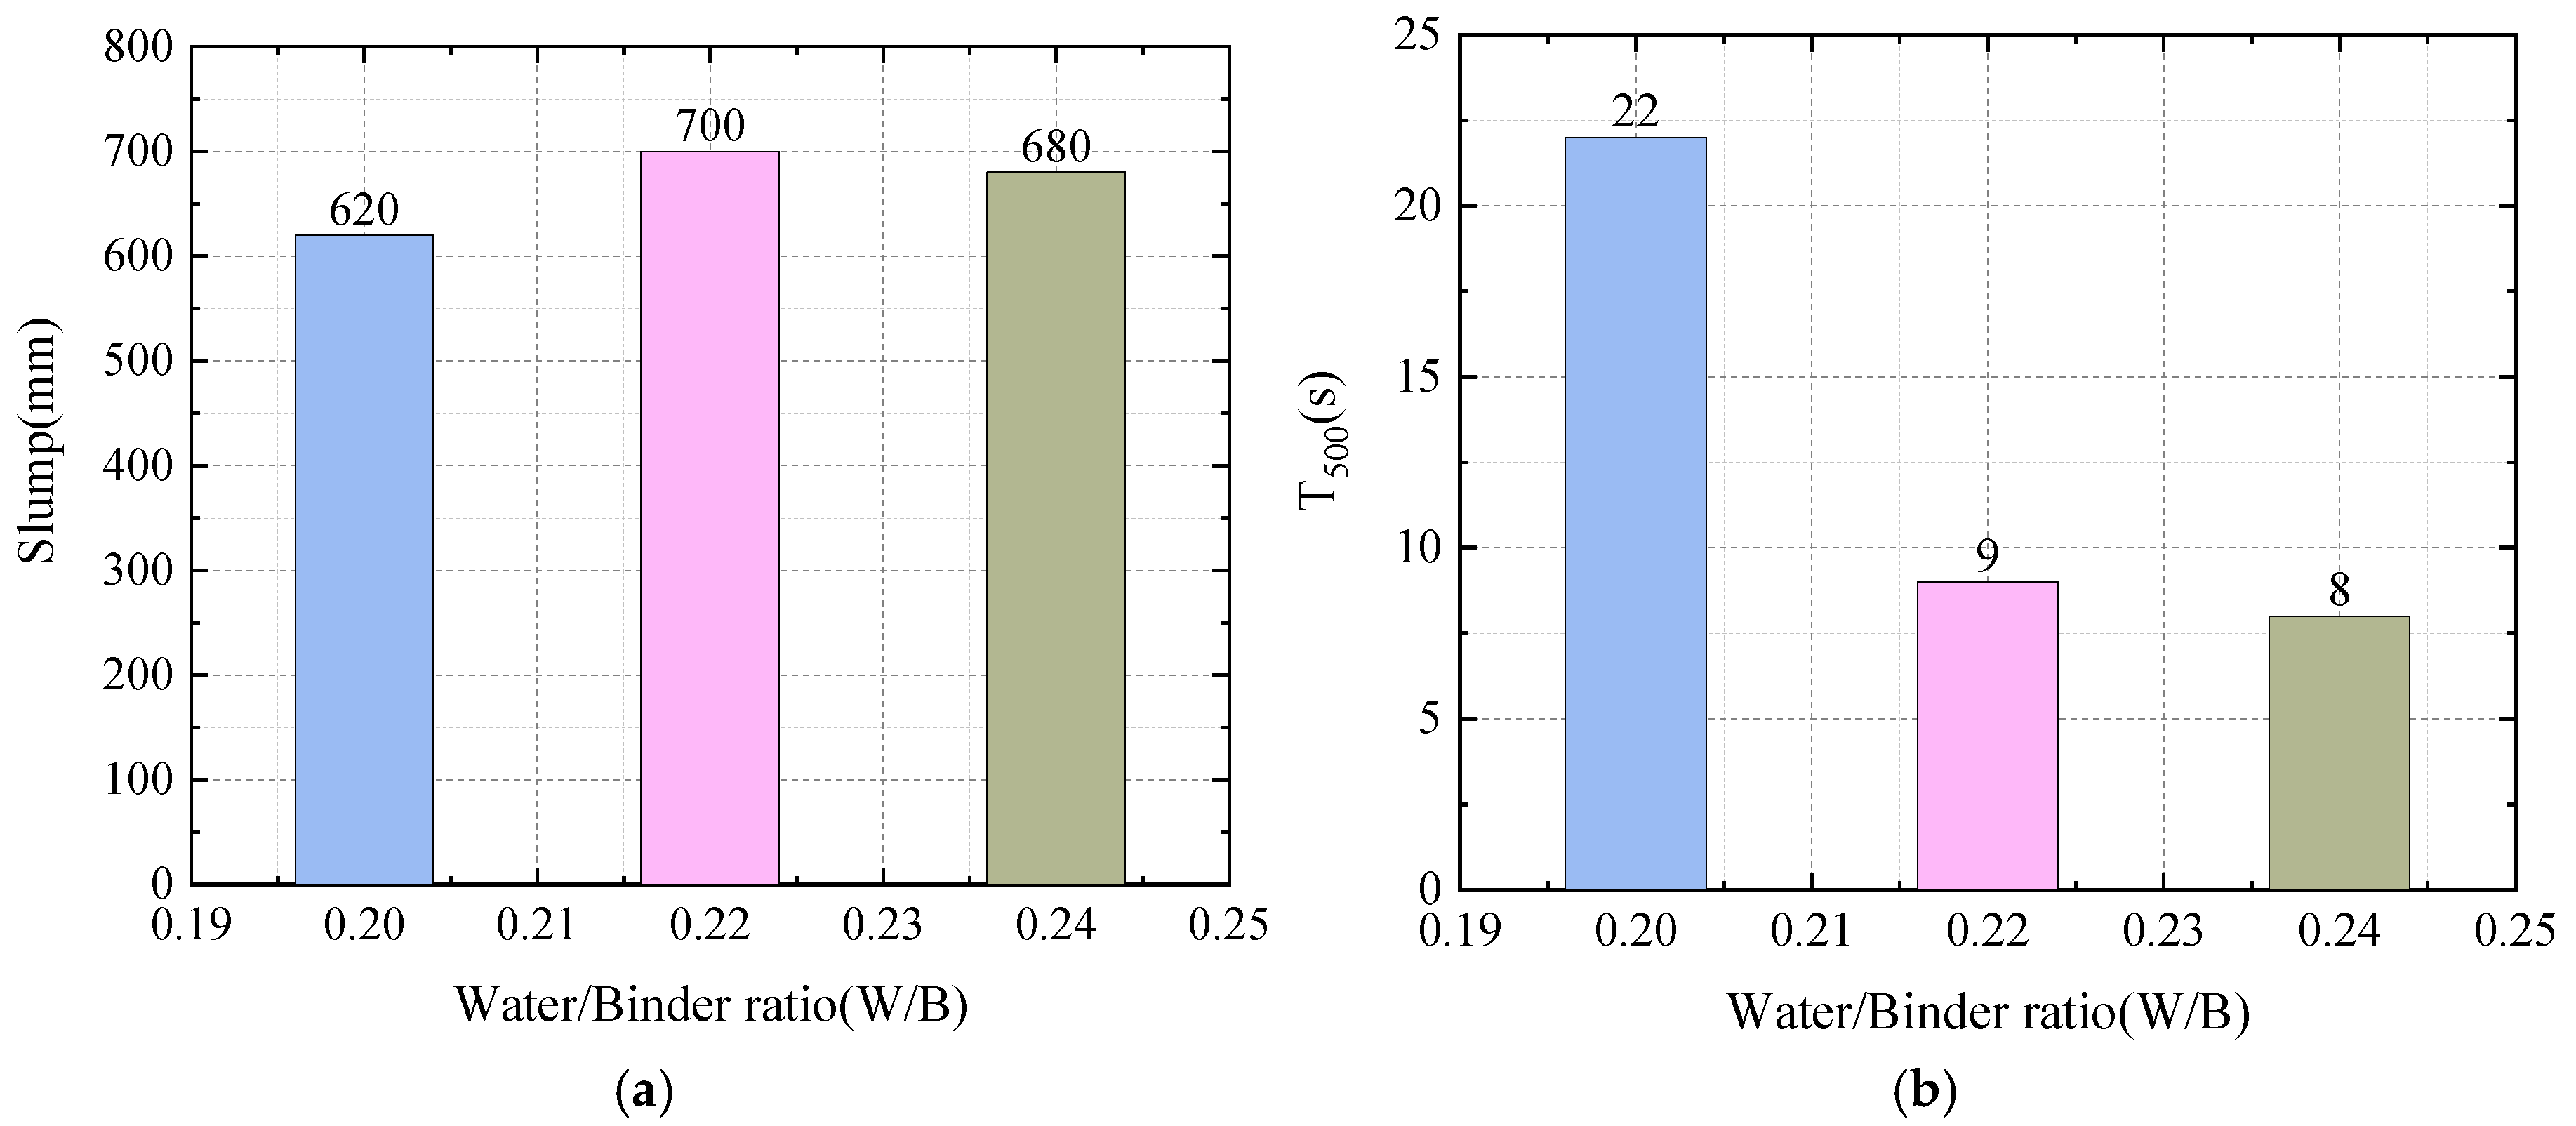
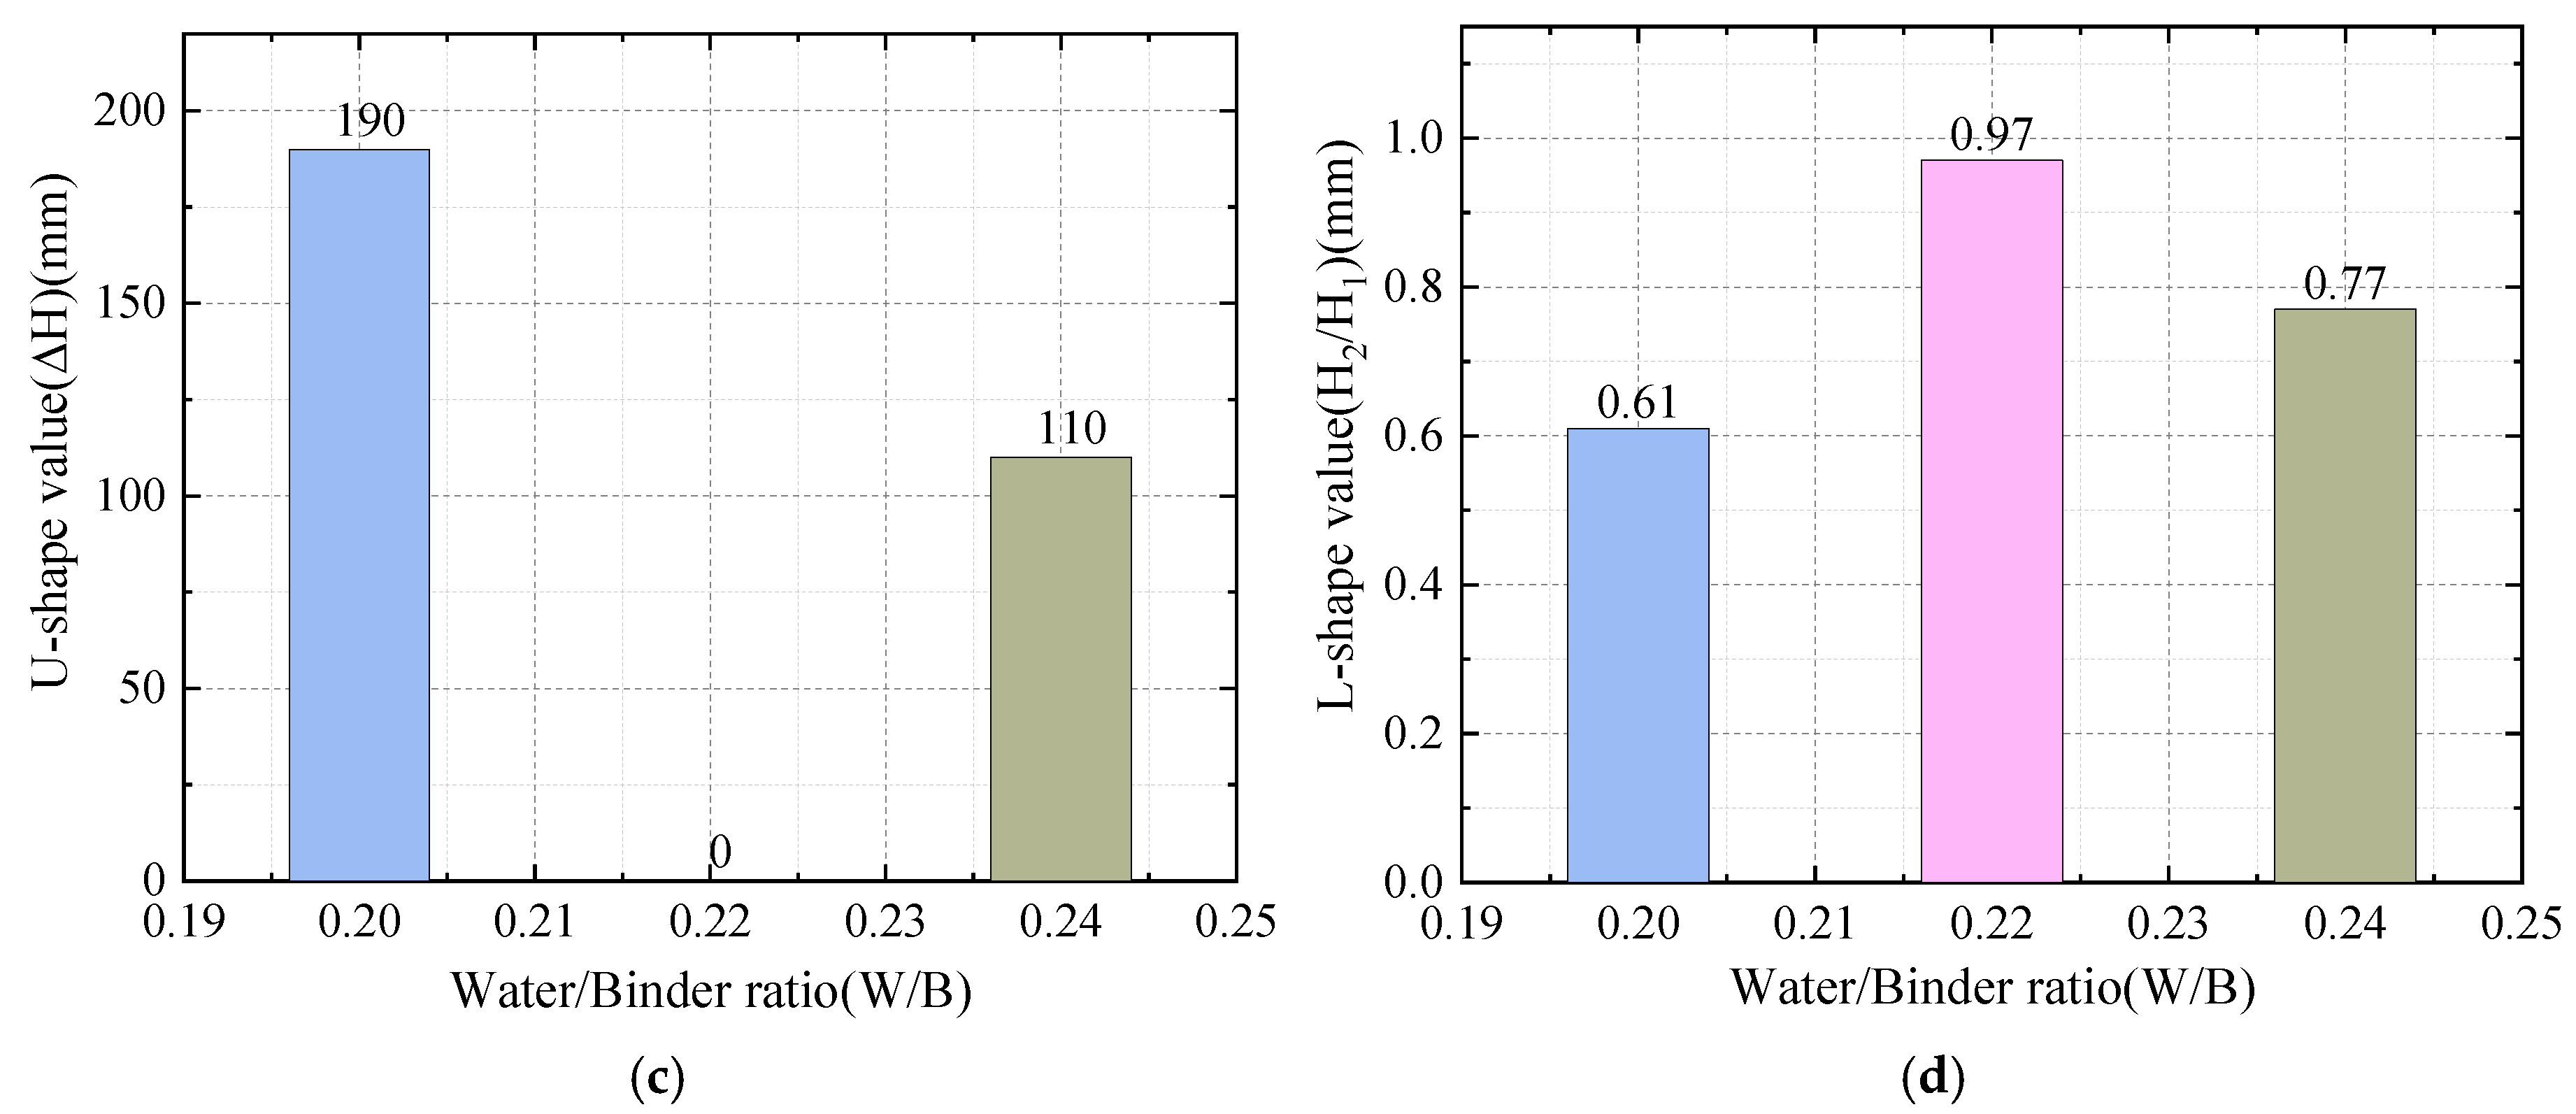
Through analysis of Figure 14, it can be concluded that the water–binder ratio has a great influence on the working performance of self-compacting high-strength concrete. When the water–binder ratio is 0.20, the slump expansion degree is 620 mm and the T500 time is 22 s. During the experiment, the concrete flow rate is slow, the U-shaped experimental test result ΔH is the largest, reaching 190 mm, and the L-shaped experimental test result H2/H1 is the smallest, 0.61. From these results, it is obvious that the effect is worse than that when the water–binder ratio is higher. When the water–binder ratio is 0.24, the minimum 8 s of T500 is 8 s, and the slump expansion of 680 mm is also larger. But the U-shaped and L-shaped test results are not good. When the water–binder ratio is 0.22, the workability is better. The maximum slump expansion is 700 mm, and the T500 time is 9S. In the U-shaped test, the two ends are flat, and in the L-shaped test, the heights of H1 and H2 are basically the same. When the water–binder ratio is 0.22, the working performance of the concrete mixture meets the self-compacting requirements. This is because the viscosity of mortar in self-compacting concrete increases with the decrease in the water–binder ratio, that is, the increase in cementitious material, which leads to the deterioration of concrete fluidity, filling, and gap passing performance. If the water–binder ratio is too large, although the viscosity of the mortar decreases and the fluidity of the concrete is improved, the mixture will produce segregation and bleeding, and the segregation resistance of the concrete will also decrease, resulting in the poor performance of the mixture. The strength of cement concrete mainly depends on the quality of the cement stone, which plays a role of cementation, and the quality of cement stone depends on the characteristics of cement and water–binder ratio. This is because the higher the strength of the cement, the higher the strength of the cement stone, the higher the strength of the concrete. In the case of the same cement strength, the strength of concrete decreases regularly with the increase in water–binder ratio. However, in self-compacting concrete, the water–binder ratio is not as small as possible. If the water–binder ratio is too small, the self-compacting performance of the self-compacting concrete mixture is poor, which can easily lead to the incomplete compaction of the concrete during molding, resulting in defects in the concrete structure, which in turn leads to a decrease in concrete strength.
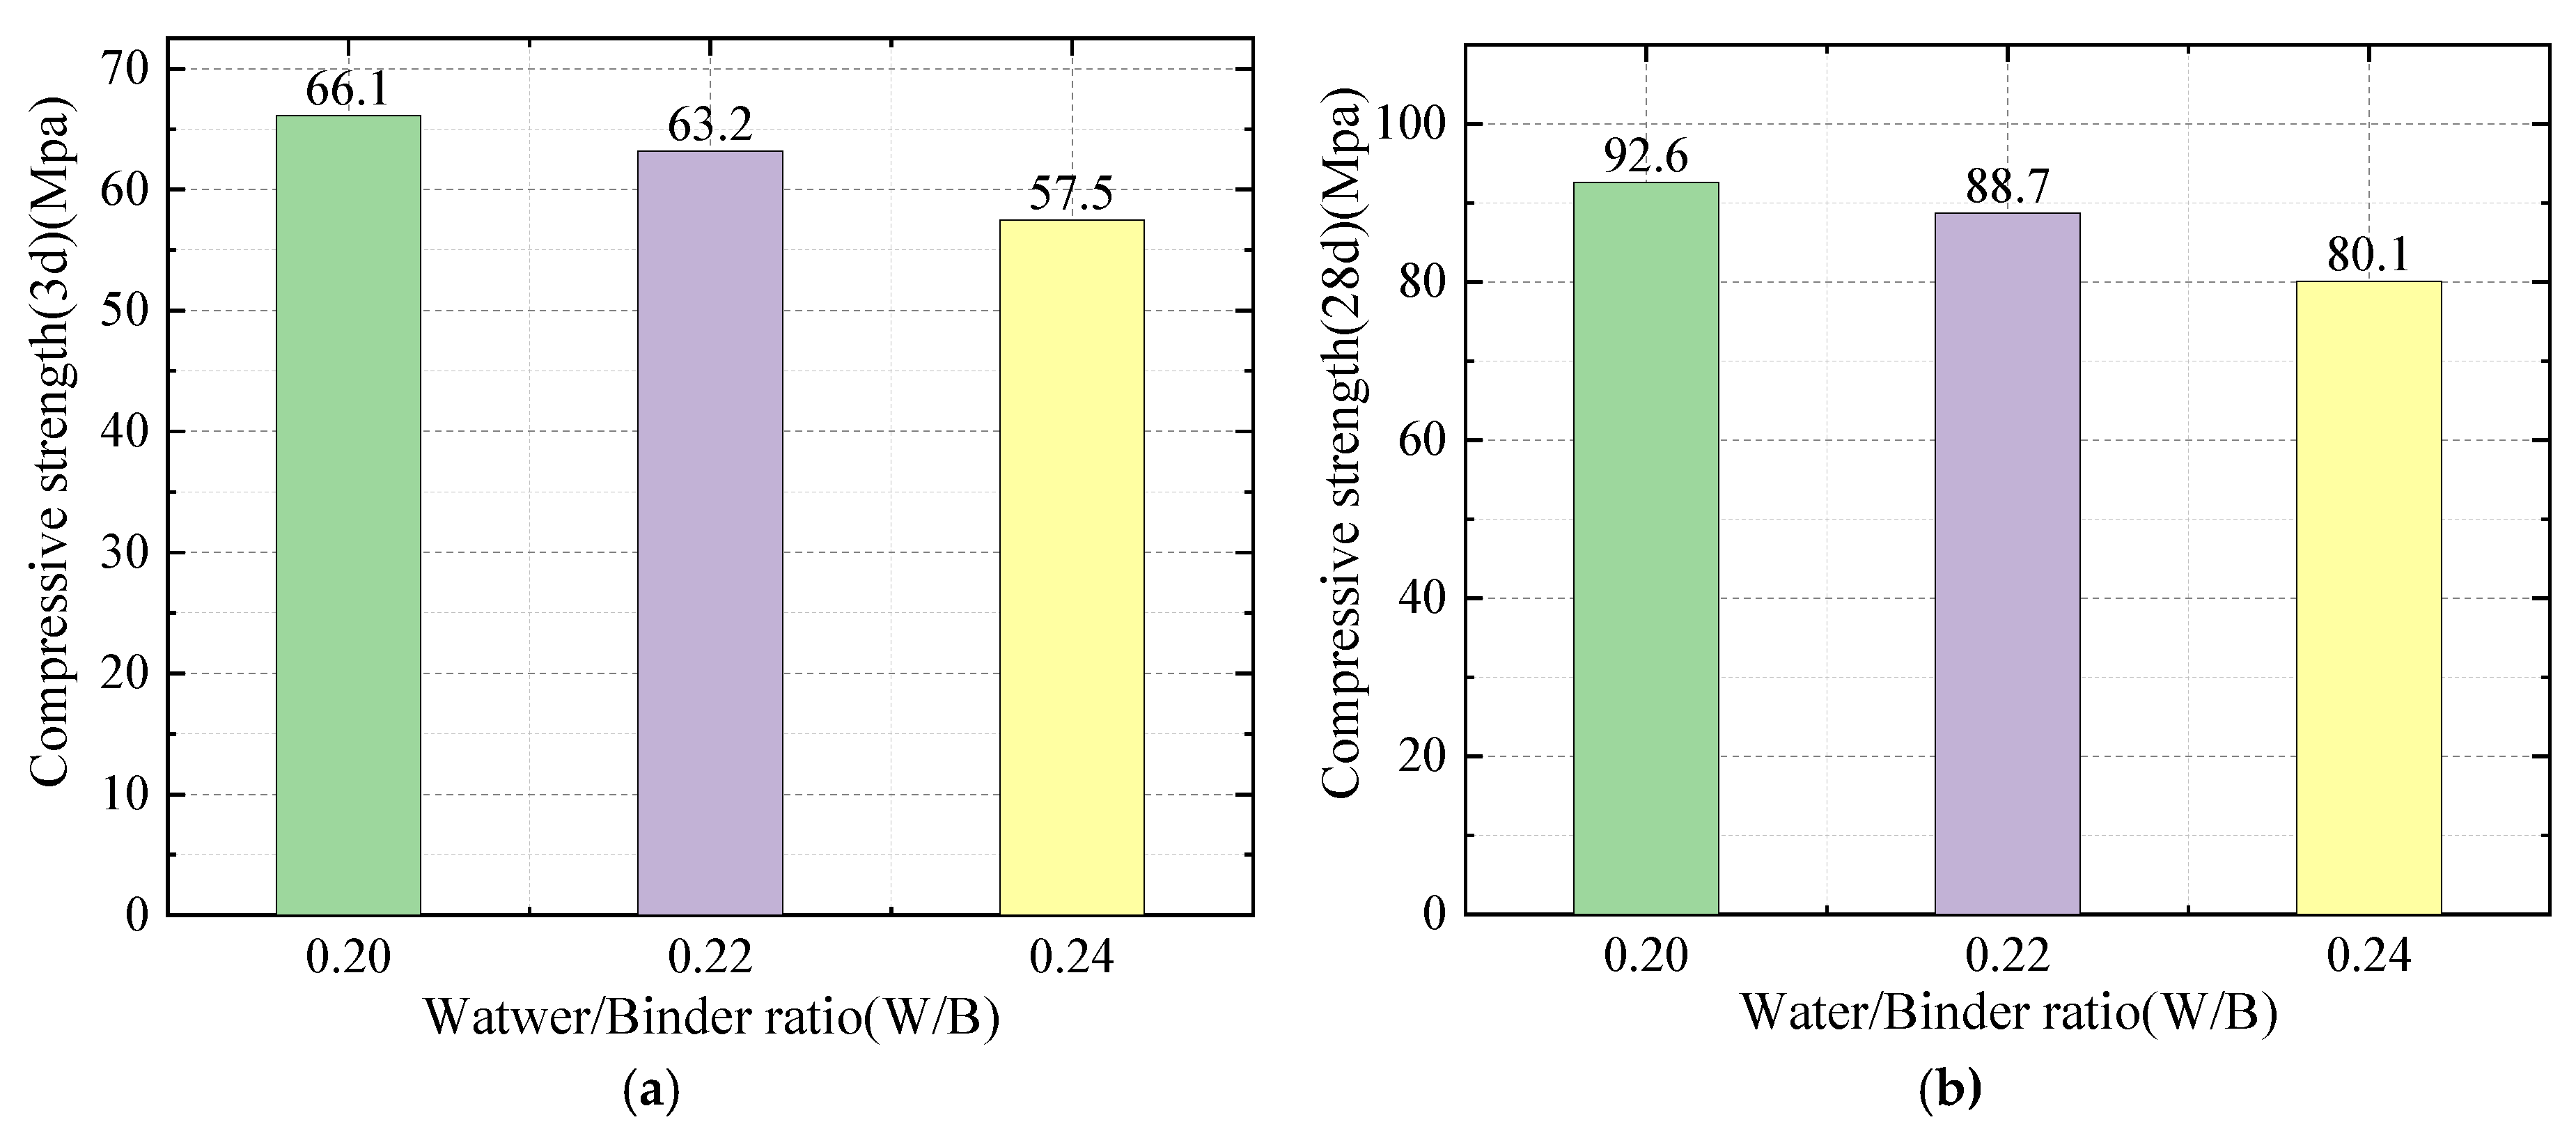
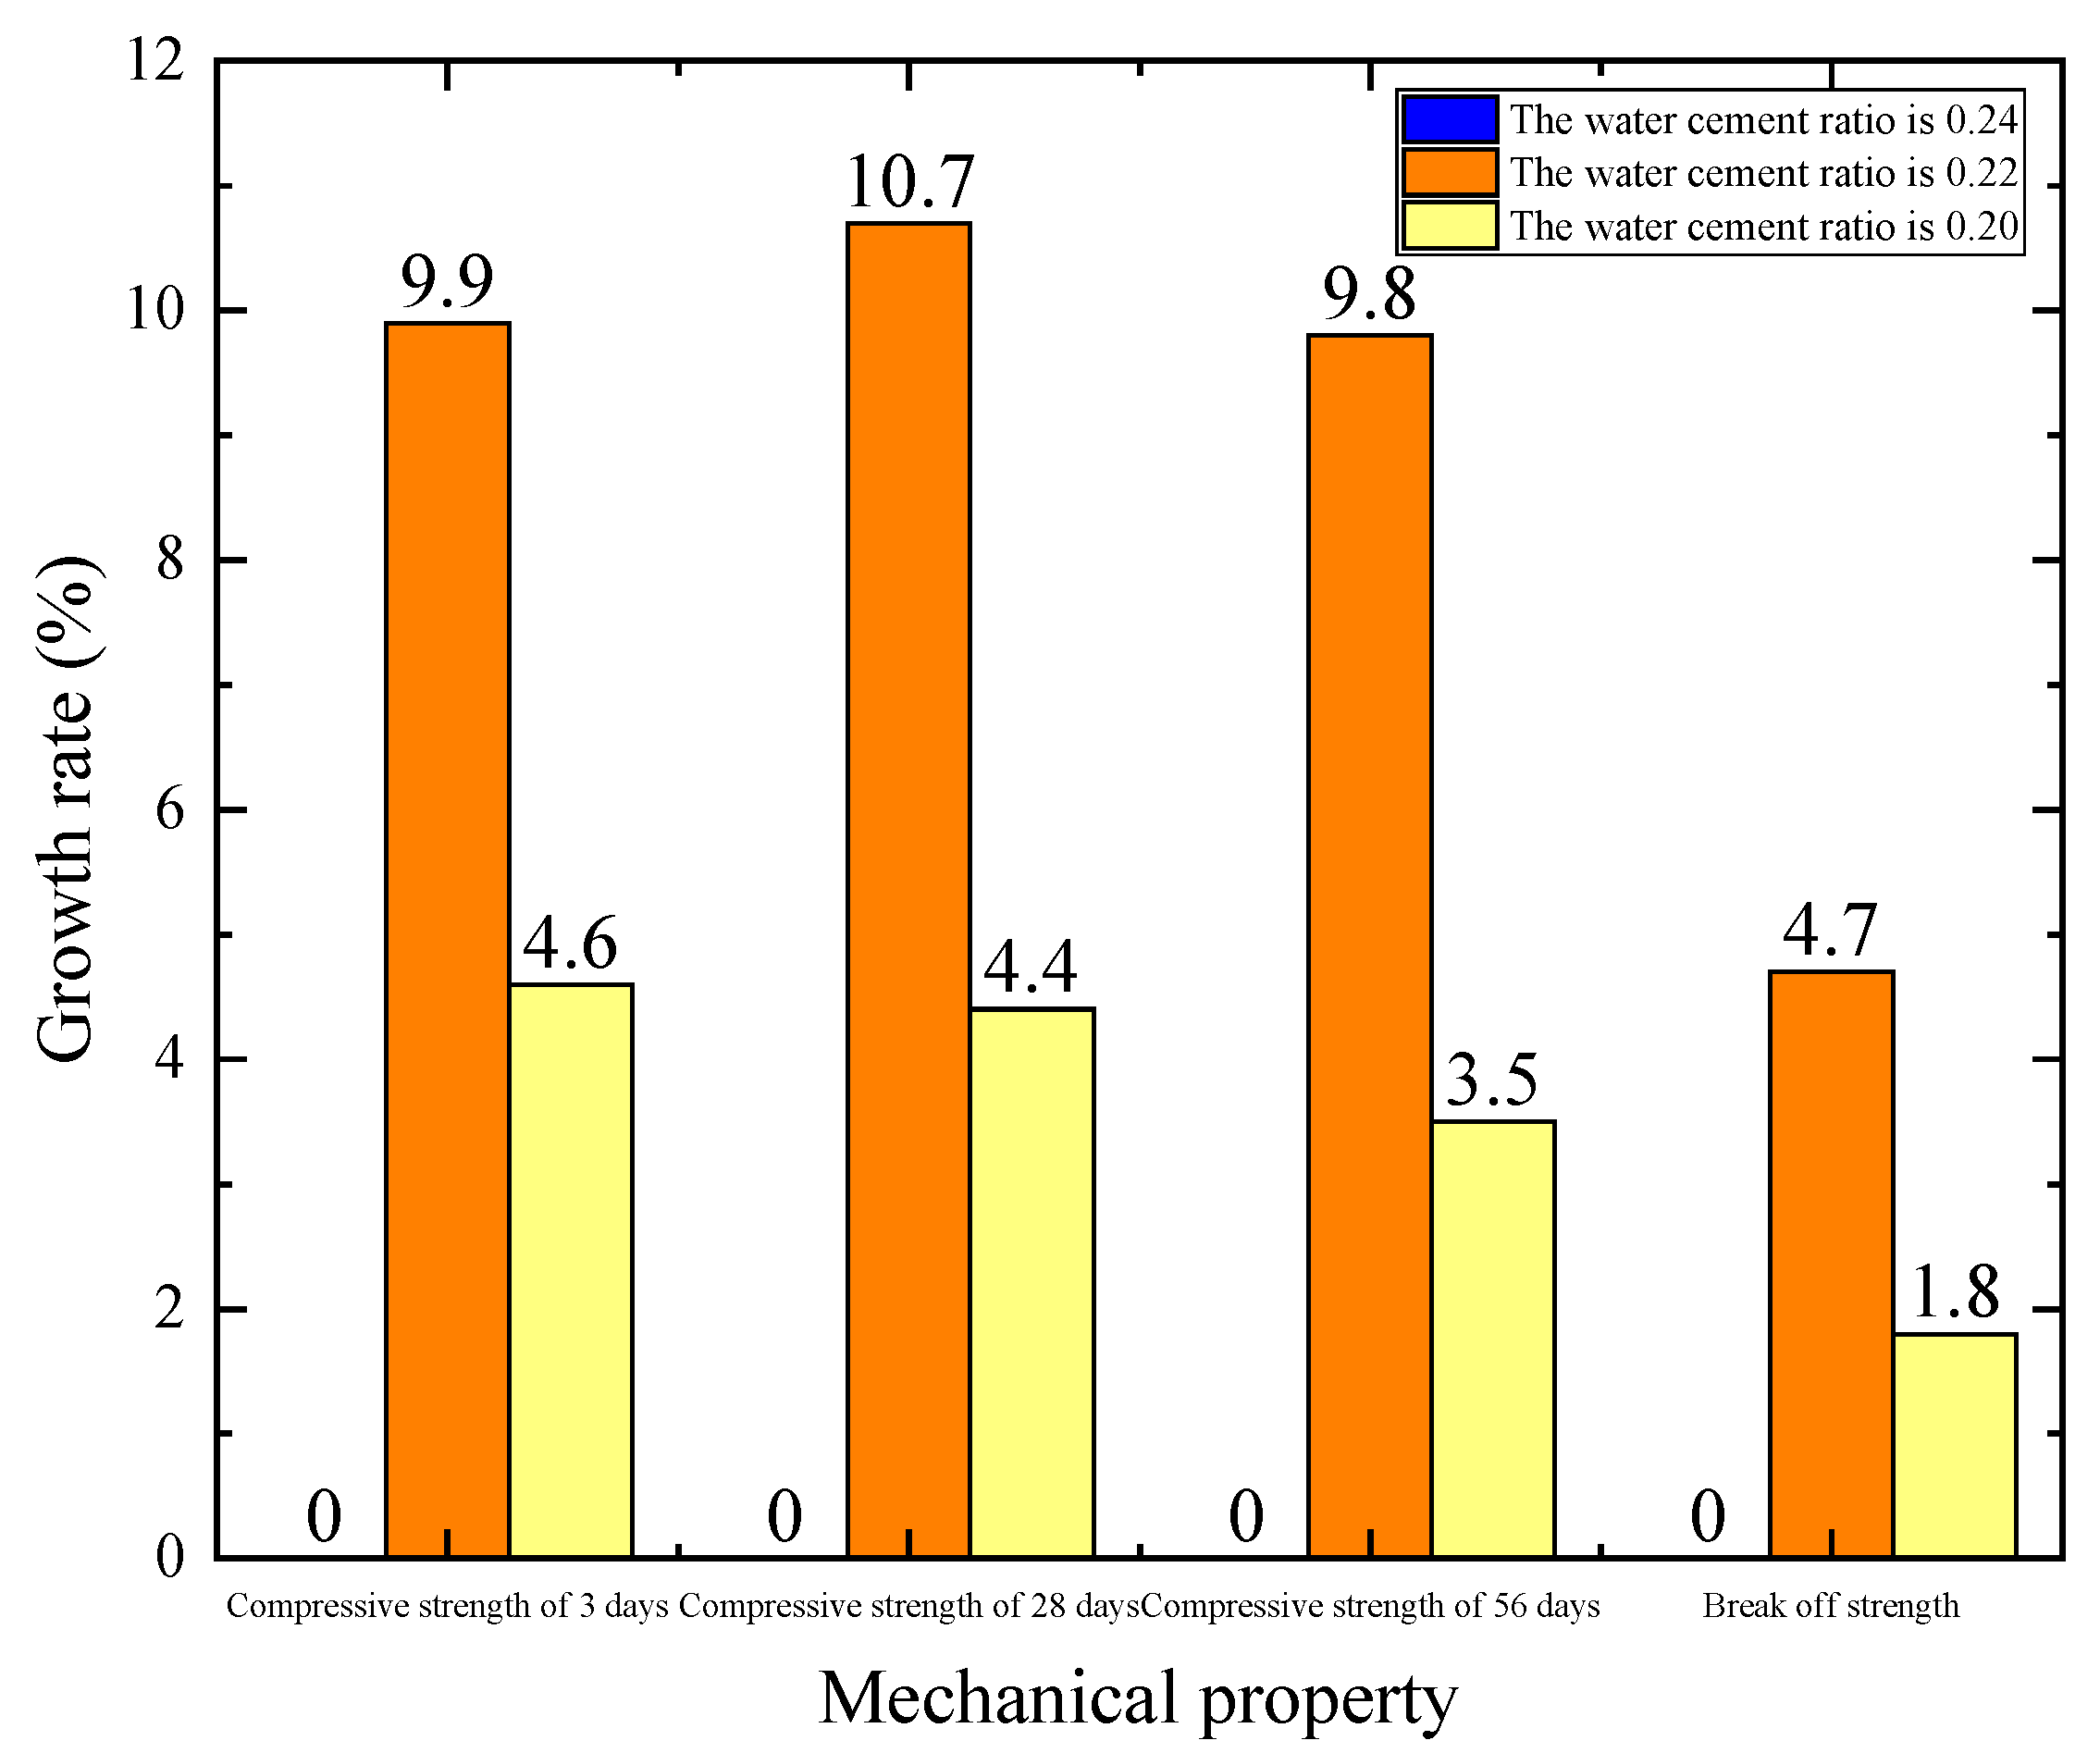
Through analysis of Figure 15 and Figure 16, with the increase in water–binder ratio, the compressive strength of concrete decreases, and the compressive strength of concrete decreases with the increase in water–binder ratio, but the magnitude of reduction is different. Based on the concrete with water–binder ratio of 0.22, the 3 d compressive strength of concrete with a water–binder ratio of 0.20 is 4.6% higher than that of 0.22, the 28 d compressive strength is 4.4% higher, the 3 d compressive strength of concrete with a water–binder ratio of 0.22 is 9.9% higher than that of 0.24, and the 28 d compressive strength is 10.7% higher. The decrease in water–binder ratio can improve the performance of the interface transition zone, thus making a great contribution to the growth of compressive strength. However, due to the decrease in water–binder ratio, the fluidity and working performance of concrete will decrease. Therefore, in order to prepare high-strength self-compacting concrete, even ultra-high-strength self-compacting concrete, the water–binder ratio that can meet the strength requirements and meet the requirements of self-compacting concrete fluidity and working performance should be selected.

3.2.2. Effect of Water–Binder Ratio on Shrinkage Performance

Through analysis of Figure 17, the self-shrinkage rate of self-compacting high-strength concrete with a water–binder ratio of 0.24 is larger than that of 0.20. Referring to the influence of the water–binder ratio on the autogenous shrinkage of concrete studied by Wang, when the water–binder ratio is greater than 0.25, the autogenous shrinkage of concrete increases with the decrease in the water–binder ratio; when the water–binder ratio is lower than 0.25, the autogenous shrinkage of concrete decreases with the decrease in the water–binder ratio. The explanation given by Wang Yongwei is that due to the low water–binder ratio, when slightly reducing the water–binder ratio, the residual moisture in the concrete decreases very little, while the total pore volume of the concrete decreases and the gel pore content increases [31]. At this time, the capillary tension may be lower than the capillary tension in the concrete with a higher water–binder ratio. Therefore, the autogenous shrinkage of concrete decreases with the decrease in water–binder ratio.
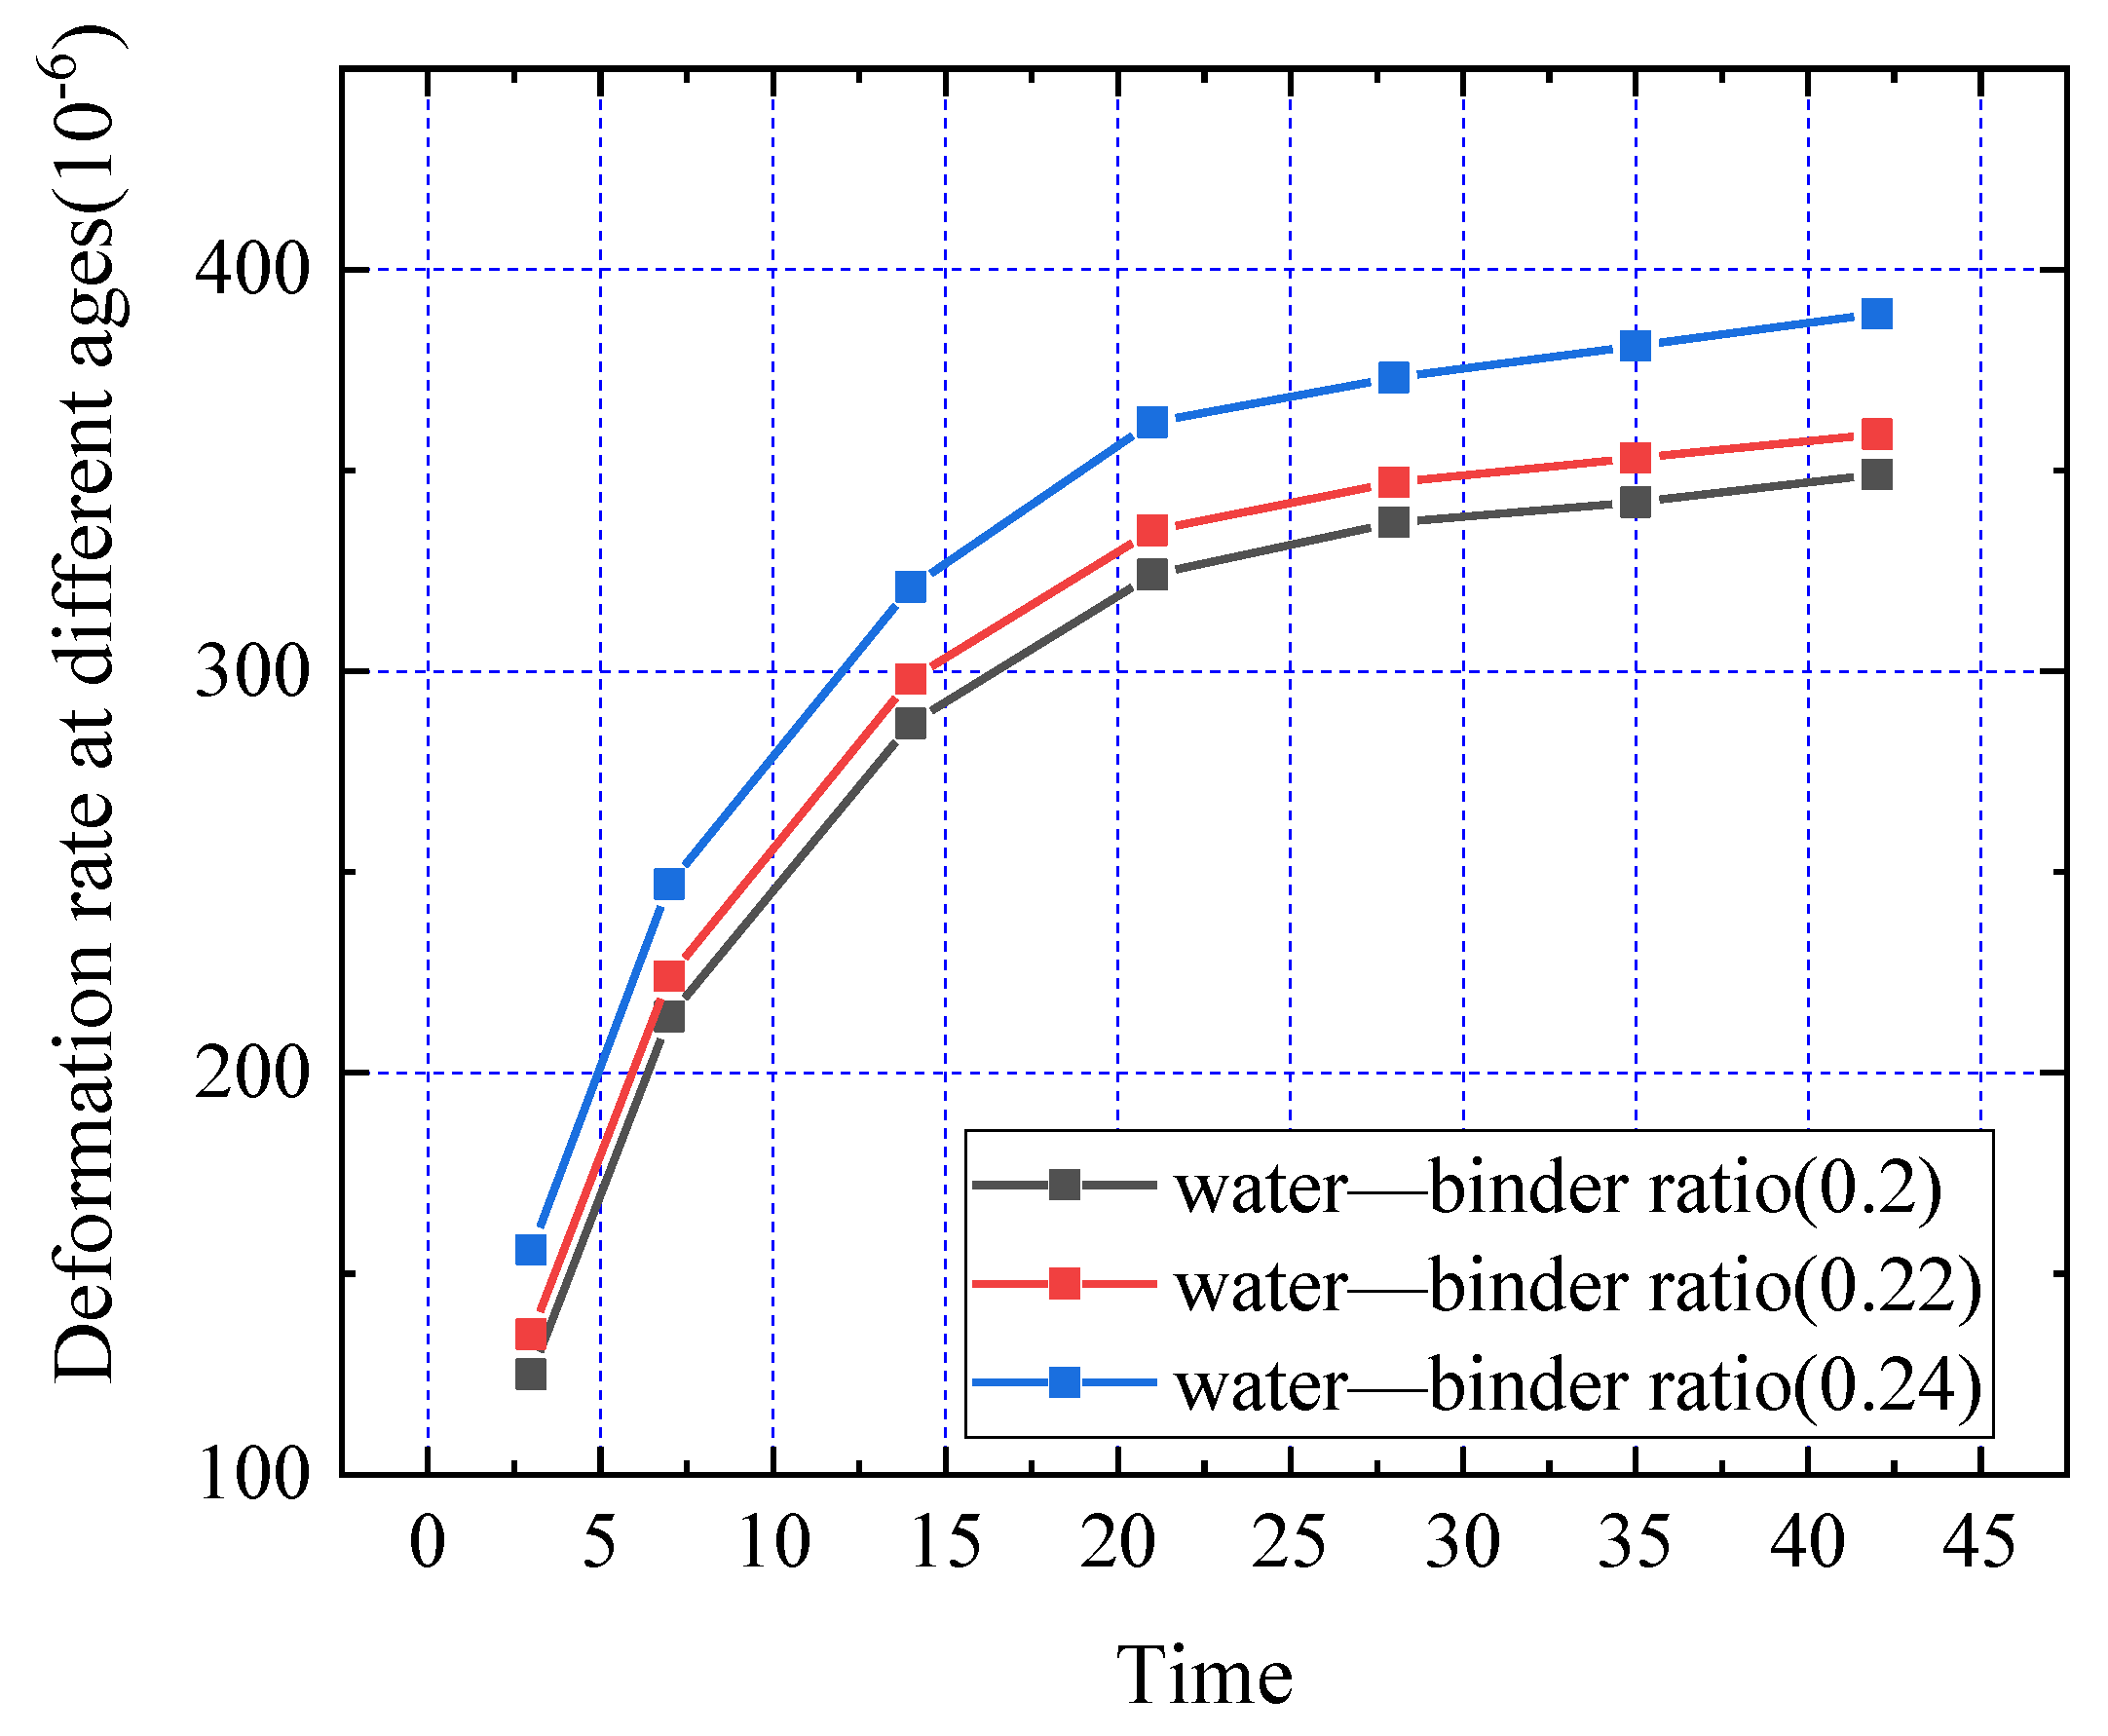
Through analysis of Figure 18, it can be concluded that with the decrease in water–binder ratio, the drying shrinkage of self-compacting high-strength concrete becomes smaller and smaller. In the early age of 3 d ~ 21 d, the shrinkage deformation of concrete increased greatly, and the increase slowed down after 21 d. The water–binder ratio of concrete affects the hydration rate and water loss rate of concrete. At the same time, when the water–binder ratio is different, the workability of concrete changes, the porosity of concrete increases, and the water loss of concrete is easier.

3.3. Effect of Sand Ratio

Under the premise of maintaining a certain water–binder ratio and type of cementitious material and the basic stability of aggregate quality, the ratio of coarse aggregate to fine aggregate (sand ratio) is the most important factor affecting the workability and strength of concrete. Too low of a sand ratio will cause the analysis of coarse aggregate and mortar, and a ratio that is too high will cause the fluidity of concrete to deteriorate, both of which may cause a decrease in concrete strength. According to many tests, four different sand ratios of 44%, 46%, 48%, and 50% were determined for testing. The test results are as follows.

3.3.1. Effect of Sand Ratio on Working Performance

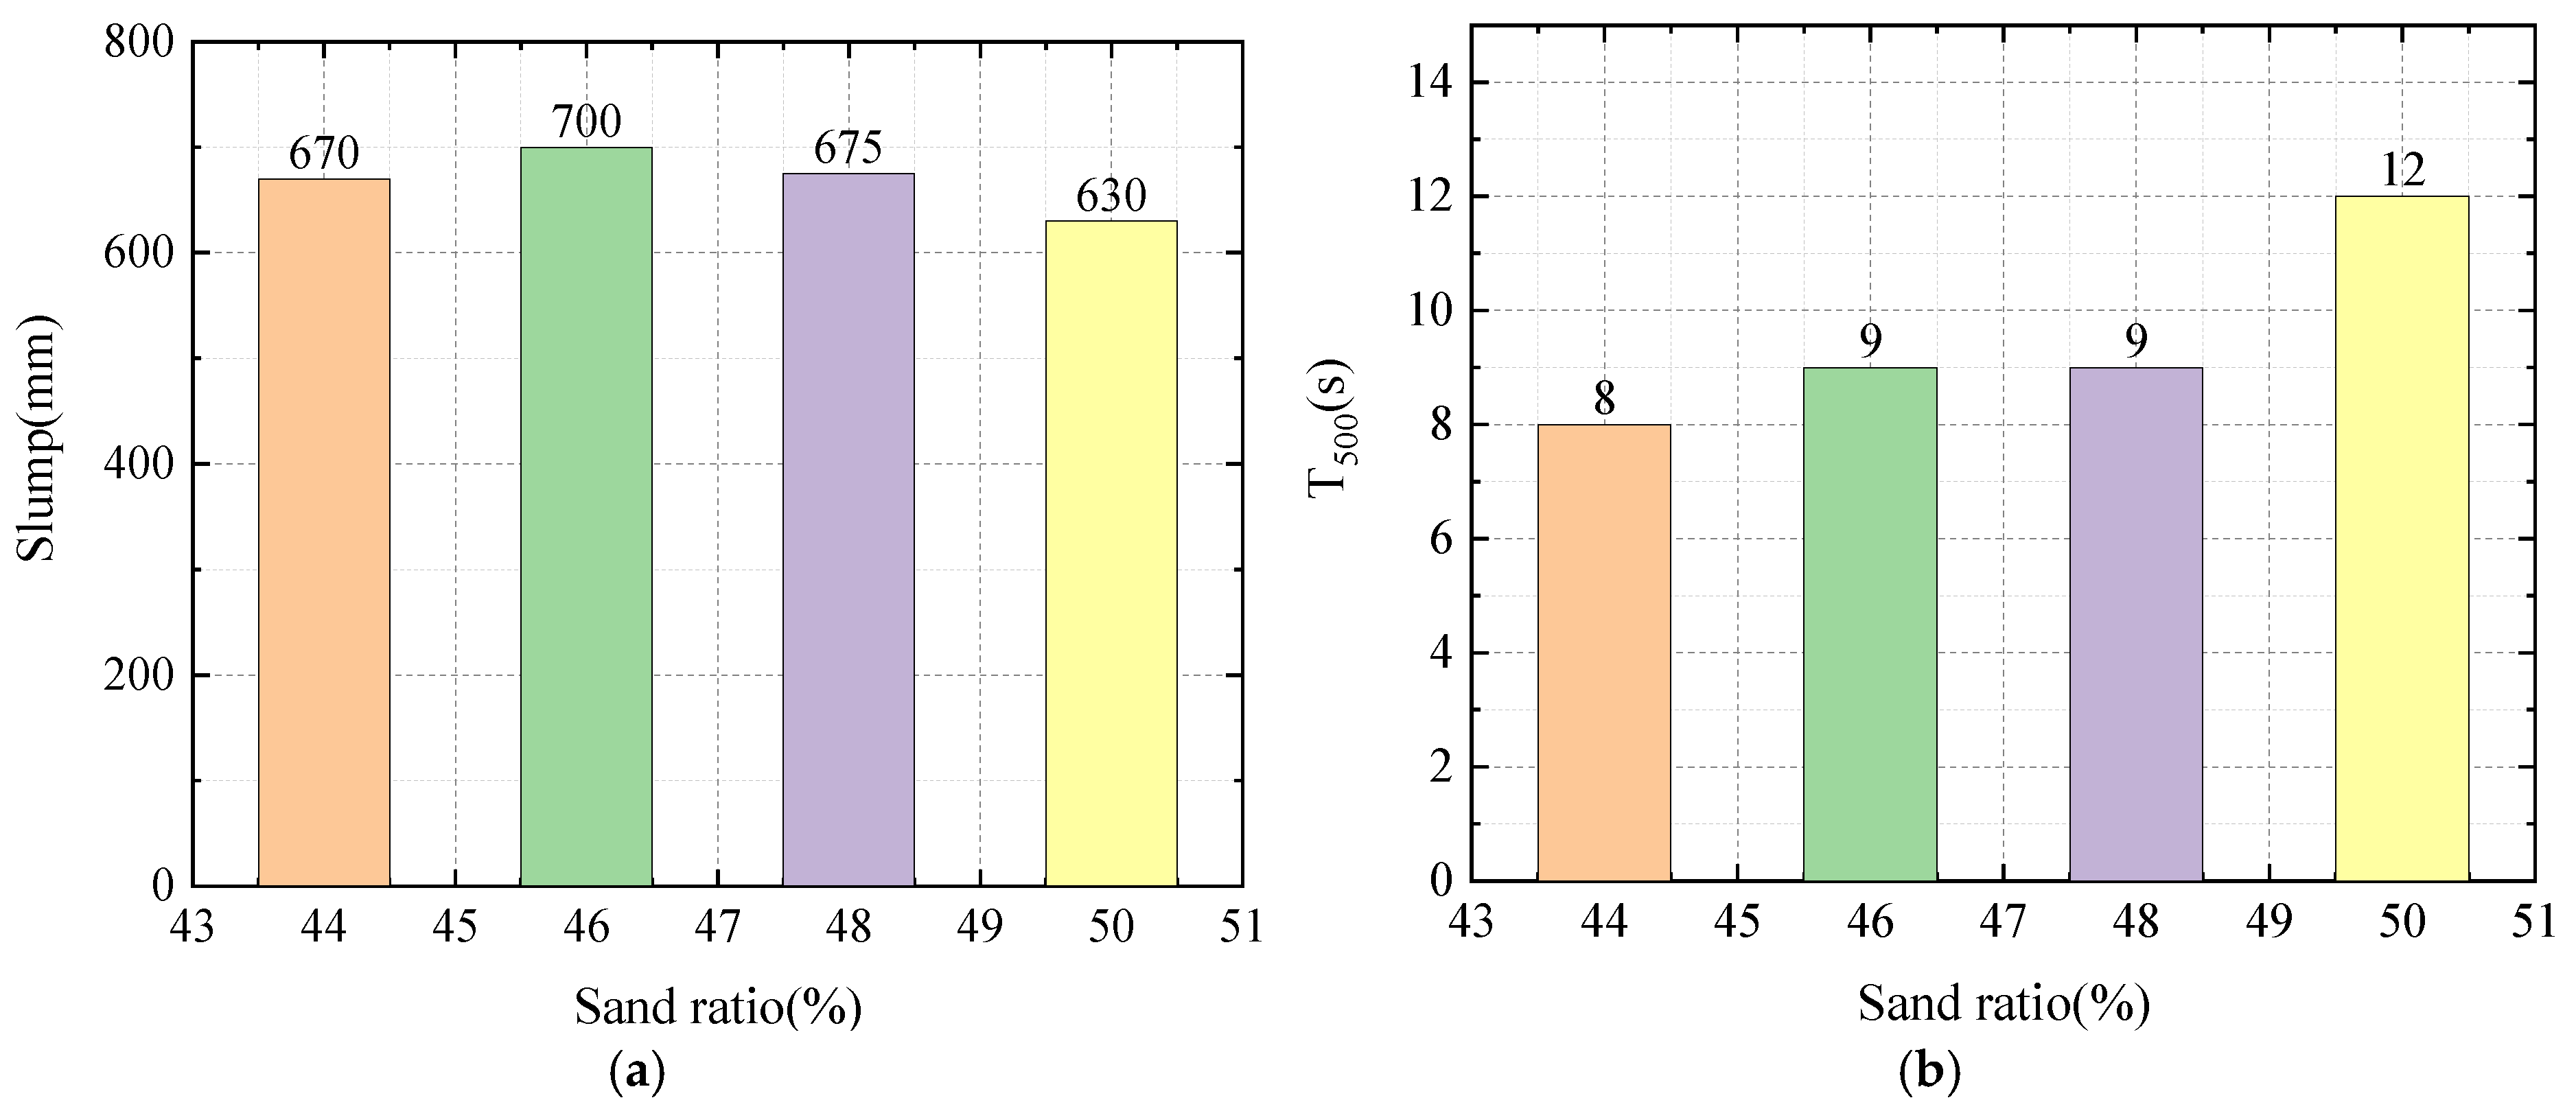
Through analysis of Figure 19, the following can be obtained: ① When the sand ratio is 44%, the slump expansion of self-compacting concrete is 670 mm, the maximum height of U-shaped ΔH is 120 mm, and the minimum L-shaped H2/H1 is 0.69, but the T500 time is the shortest at 8 s. This is because when the sand ratio is too low, the coarse aggregate of self-compacting concrete will be separated from the mortar. ② When the sand ratio is 46%, the maximum value of concrete self-compacting concrete slump expansion is 700 mm, the T500 is also small at 9S, the two ends of the U-shaped experiment are basically flat, and the L-shaped experiment is almost horizontal. The experimental results are the best, indicating that the indicators of fluidity, cohesion, and other aspects are the best. ③ After the sand ratio exceeds 46%, with the increase in sand ratio, the slump expansion, T500, U-shaped, and L-shaped experimental effects of self-compacting concrete become worse and worse, because with the increase in the sand ratio, the concrete becomes more and more sticky, and the fluidity becomes worse. Under the experimental conditions, when the water–binder ratio is 0.22 and the sand ratio is 46%, the working performance of the concrete mixture meets the self-compacting requirements. The above research results are consistent with Ba Hengjing’s research. He believes that too large or too small of a sand ratio will cause an increase in the plastic viscosity η, but the sand ratio has little effect on the yield stress ζ0 [31]; this is because when the number of cement slurry is constant, the specific surface area and porosity of the aggregate are large when the sand ratio is too large, which relatively weakens the thickness of the cement slurry layer that plays a lubricating role, thus reducing the fluidity; when the sand ratio is too small, the porosity of the aggregate is large, and the amount of mortar in the concrete mixture is insufficient, resulting in poor fluidity, especially poor cohesion and water retention, which is prone to segregation. The reasonable sand ratio should be at a slight surplus after the fine aggregate fills the gap of the coarse aggregate, and at this time, maximum fluidity, good cohesion, and water retention are obtained.

3.3.2. Effect of Sand Ratio on Mechanical Properties

Through analysis of Figure 20, the compressive strength of self-compacting high-strength concrete first increases with the increase in sand ratio, but after the content exceeds 46%, it decreases with the increase in sand ratio. When the sand ratio is 46%, the 28 d compressive strength value is the largest, and the strength is reduced to varying degrees when the sand ratio is lower or higher than 46%. It can be considered that the optimum sand ratio in the test is 46%. This is because when the sand ratio is low, the concrete may easily produce a separation of coarse aggregate and mortar. There are many voids between the coarse aggregates in the concrete, and the structure is not dense. With the increase in sand ratio, the void ratio is small, the compactness of the structure is improved, and the compressive strength is continuously improved. When the sand ratio is too high, the slurry in the concrete mixture cannot fully wrap the aggregate, resulting in poor fluidity of the concrete, affecting the overall uniformity of the concrete, and reducing the later strength of the concrete.

3.3.3. Effect of Sand Ratio on Shrinkage Performance

In this experiment, four different sand ratios of 44%, 46%, 48%, and 50% were used to test the shrinkage performance, and the influence of the sand ratio on the autogenous shrinkage and drying shrinkage of self-compacting high-strength concrete was analyzed.
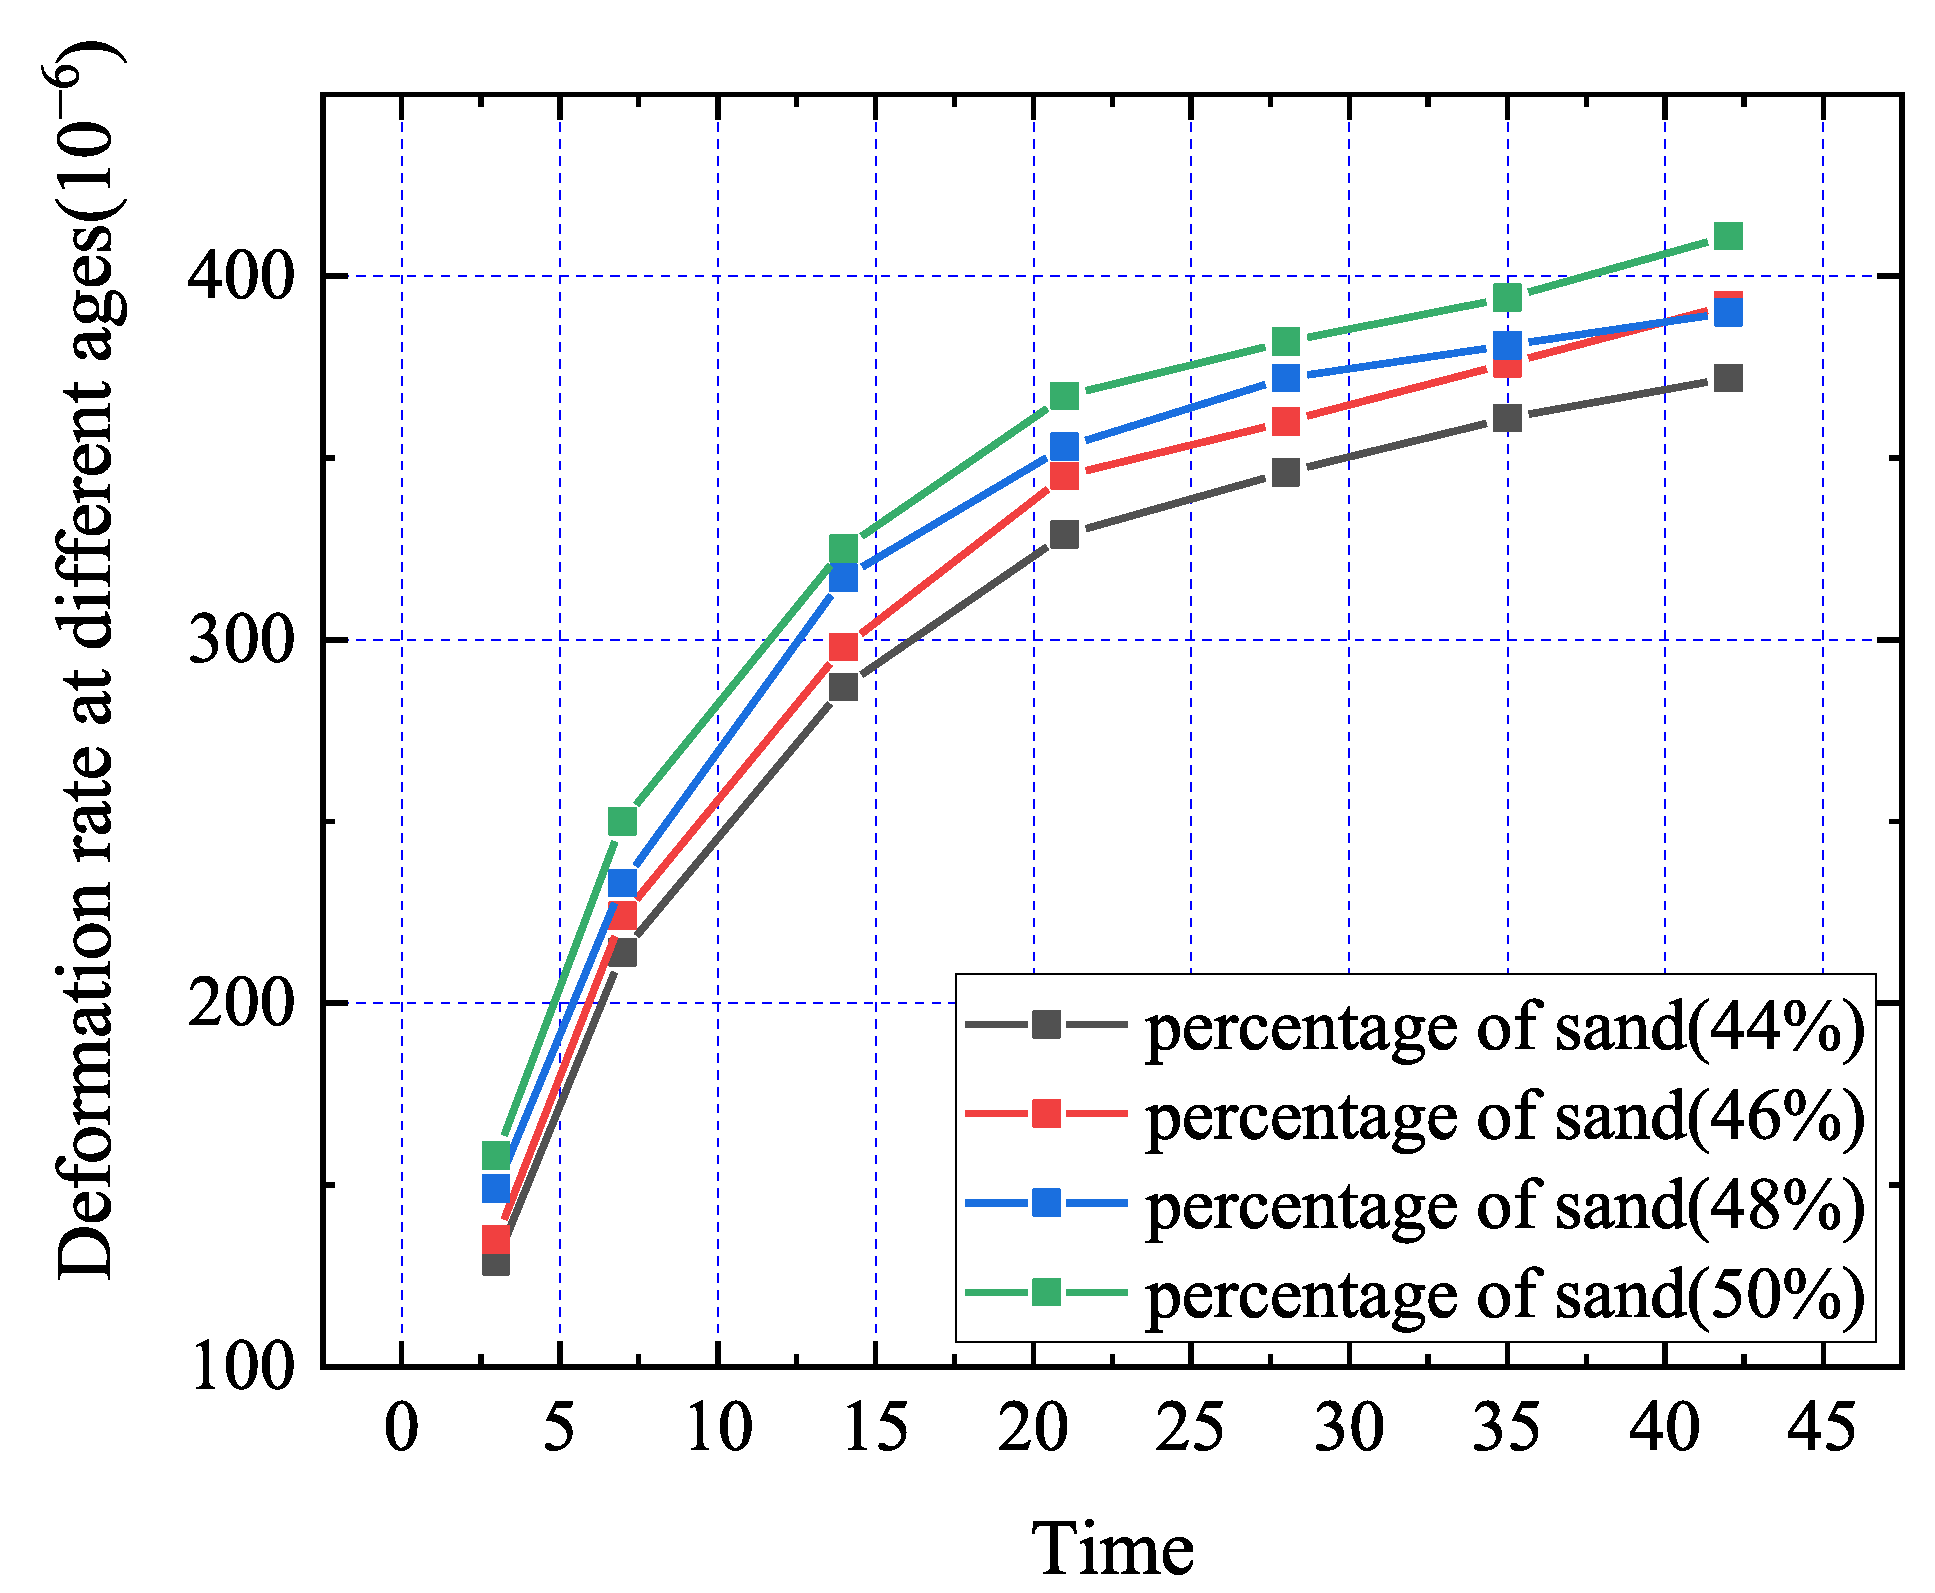
Through analysis of Figure 21, it can be obtained that when the sand ratio is 44–46%, the autogenous shrinkage of self-compacting high-strength concrete decreases with the increase in sand ratio. However, when the sand ratio is greater than 46%, the autogenous shrinkage of self-compacting high-strength concrete will become larger. Under the experimental conditions, 46% is the best sand ratio, and its self-shrinkage value is the smallest. When the sand ratio is too large, the specific surface area and porosity of the aggregate are large. When the sand ratio is low, the concrete may easily separate the coarse aggregate from the mortar, there are many voids between the coarse aggregates in the concrete, and the structure is not dense. Therefore, the optimum sand ratio has the best effect on reducing the autogenous shrinkage of self-compacting high-strength concrete.
Through analysis of Figure 22, it can be obtained that the early drying shrinkage of self-compacting high-strength concrete increases with the increase in sand ratio. This is because the water–binder ratio of the concrete is the same, so the hydration rate and water loss rate of the concrete are not much different. However, when the sand ratio is less than or greater than the optimal sand ratio, the aggregate gradation of the concrete changes, resulting in an increase in the porosity of the concrete and easier water loss from the concrete. At the same time, due to the poor frame structure of the aggregate, the ability to inhibit the shrinkage of the slurry is also weakened.

3.4. Interface Microstructure Between Steel Fiber and Concrete Matrix

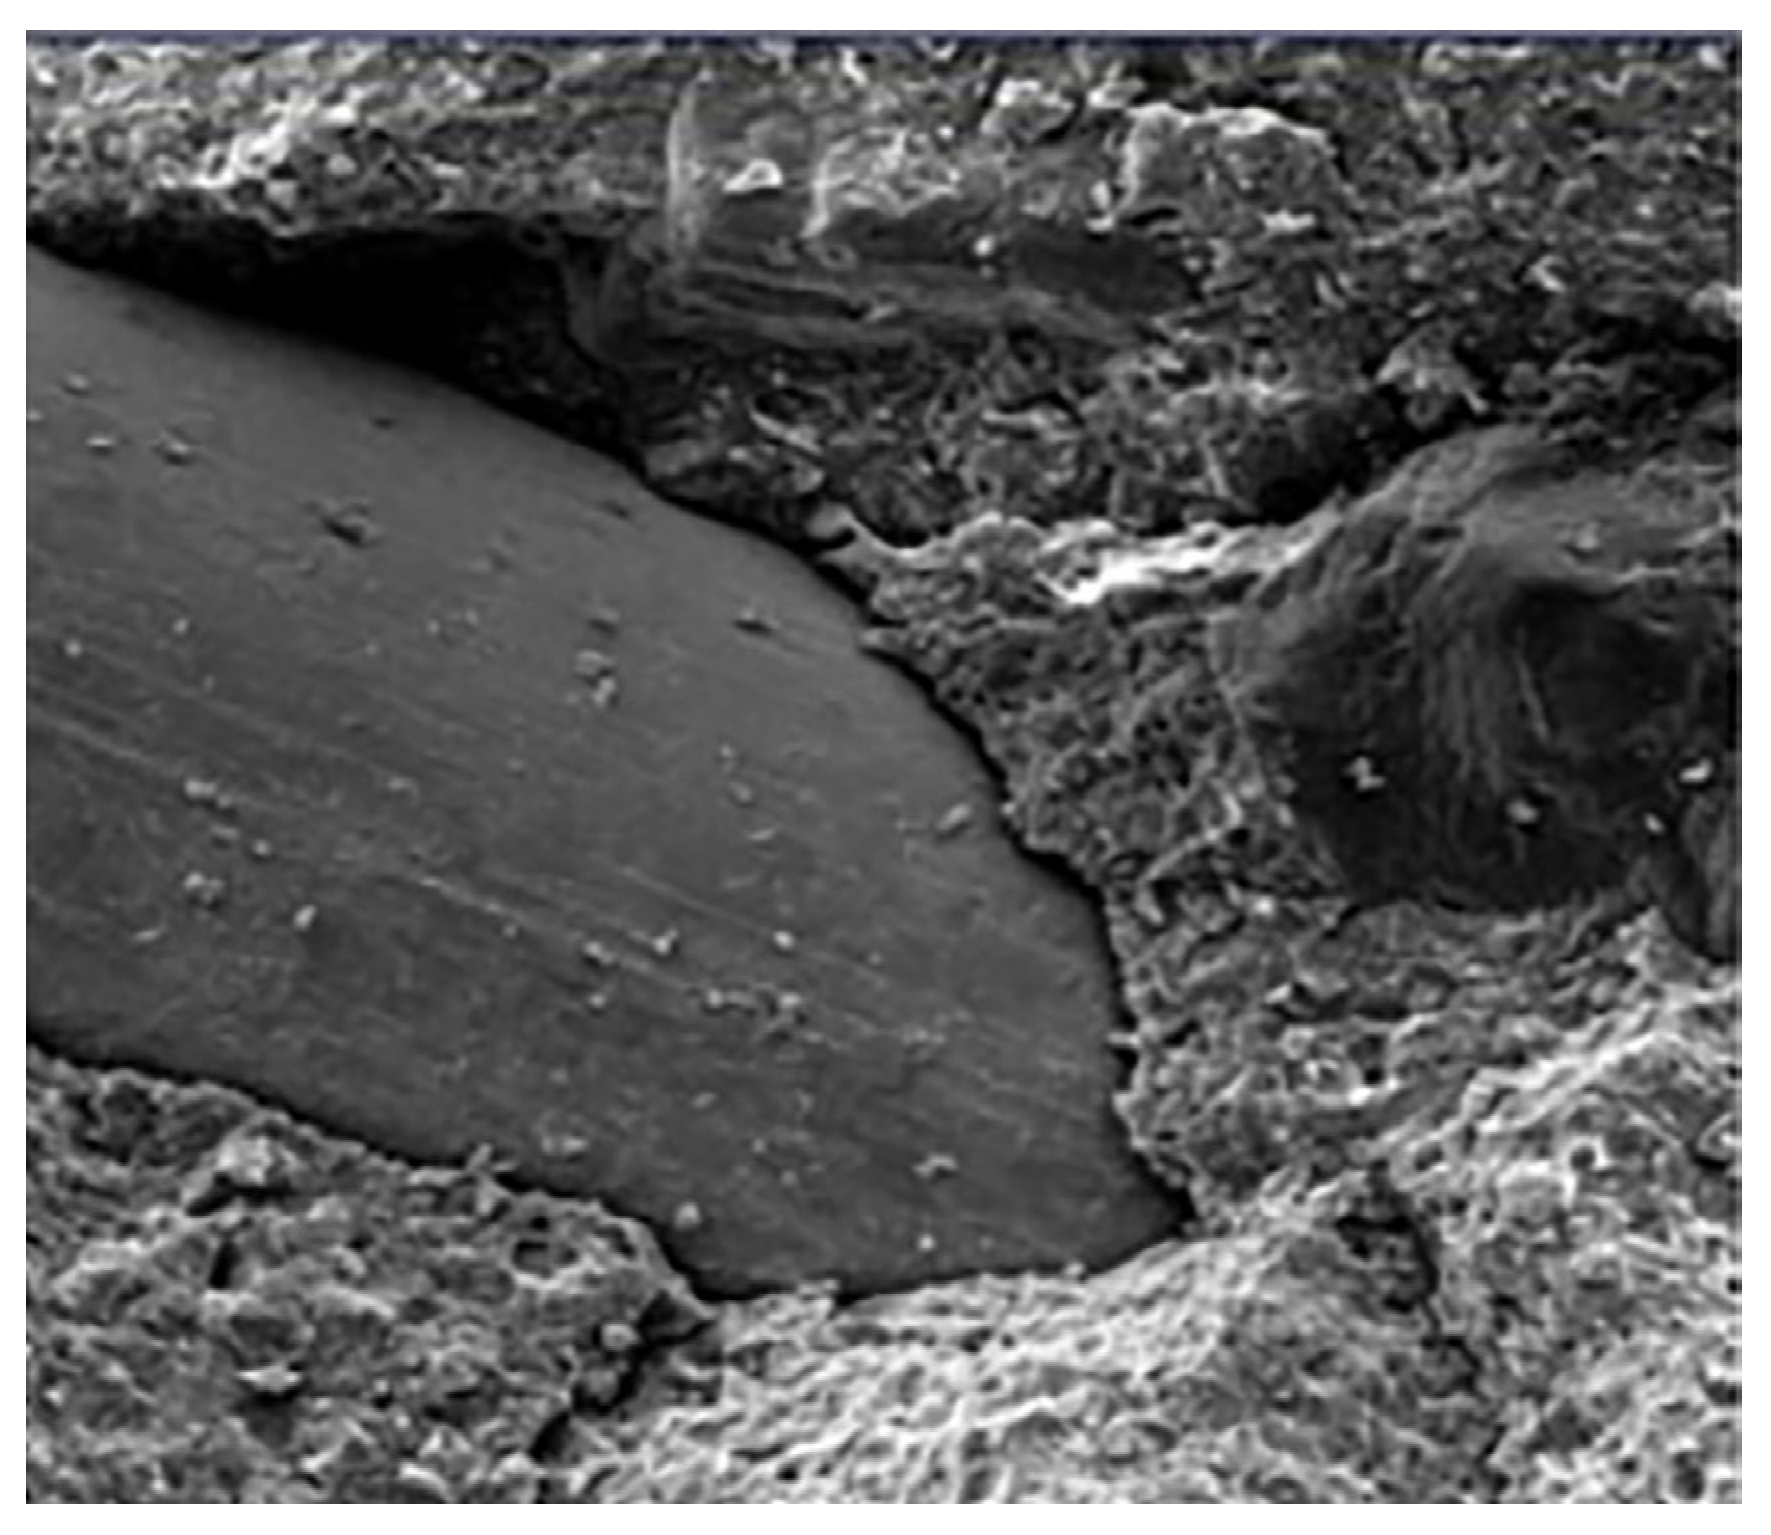
The interface structure between the steel fiber and the concrete soil matrix and the distribution of the steel fiber have an important influence on the bond strength between the steel fiber and the concrete matrix. Whether the interface between the micro-steel fiber and the concrete is dense, whether it is firm, whether the distribution of the micro-steel fiber in the concrete matrix is uniform, whether it is agglomerated, etc., will seriously affect the mechanical properties of concrete. In this experiment, the microstructure of steel fiber self-compacting high-strength concrete was studied by means of SEM, as shown in Figure 23, Figure 24, Figure 25 and Figure 26. The SEM photos of self-compacting high-strength concrete with steel fiber contents of 0.0%, 0.3%, 0.6%, and 0.9% were obtained, respectively.
Through SEM photos (Figure 23, Figure 24, Figure 25 and Figure 26), it is found that when the steel fiber content is 0.3–0.6%, the gap between the steel fiber and the concrete matrix is smaller, the filling is more dense, the steel fiber and the concrete matrix are bonded more firmly, and the interface structure is better. However, when the content of steel fiber increases to 0.9%, the bond between the steel fiber and the concrete matrix is loosened. When the steel fiber content exceeds a certain proportion, the flow performance of self-compacting concrete will be reduced, and even the phenomenon of steel fiber “agglomeration” will occur. Therefore, when steel fiber is mixed into self-compacting concrete in engineering, the reasonable content of steel fiber should be considered, which can not only reduce the cost, but also better play the role of steel fiber.

4. Conclusions

  • The C90 high-strength self-compacting concrete prepared in this experiment has the best mix ratio, which makes its working performance, mechanical properties, and shrinkage performance better. The best mix ratio is a water–binder ratio of 0.22, sand ratio of 46%, and steel fiber content of 0.3%.
  • When the steel fiber content is 0.3%, the compressive strength of self-compacting high-strength concrete can be increased by more than 4%, the flexural strength can be increased by more than 5%, and the working performance, autogenous shrinkage, and drying shrinkage are better, which can meet the performance index of self-compaction. When the steel fiber is 0.6% and 0.9%, the compressive strength of concrete can be increased by more than 10%, and the flexural strength can be increased by more than 7%. However, with the increase in the volume fraction of micro-steel fiber, the working performance of steel fiber self-compacting high-strength concrete is getting worse and worse, which makes the self-compacting concrete more and more uncompacted, and this trend becomes more and more serious with the increase in steel fiber content.
  • Under the experimental conditions, when the water–binder ratio is 0.20, the flow performance of self-compacting high-strength concrete is poor, and the concrete forming effect is not good. When the water–binder ratio is 0.24, the self-compacting high-strength concrete has good fluidity, but the cohesion is poor and segregation may easily occur. When the water–binder ratio is 0.22, the working performance of self-compacting concrete is the best.
  • Under the experimental conditions, when the optimum sand ratio is 46%, the working performance of self-compacting concrete is the best; when the sand ratio is lower than the optimum sand ratio, the self-compacting high-strength concrete will produce segregation. When the sand ratio is higher than the optimum sand ratio, the flow performance of self-compacting high-strength concrete is very poor.
  • The SEM images show that the steel fiber in the steel fiber self-compacting high-strength concrete prepared in this experiment is closely bonded to the interface of the self-compacting concrete.

Author Contributions

Conceptualization, H.L.; methodology, H.L.; validation, N.S., Z.Y. and Y.Z.; formal analysis, H.L.; investigation, N.S.; resources, H.L.; data curation, Y.Z.; writing—original draft preparation, H.L. and N.S.; writing—review and editing, N.S.; supervision, H.L.; project administration, Z.Y.; funding acquisition, H.L. All authors have read and agreed to the published version of the manuscript.

Funding

This research was funded by North China Institute of Aerospace Engineering, BKY-2020-37.

Data Availability Statement

Data is contained within the article.

Conflicts of Interest

The authors declare no conflicts of interest. The funders had no role in the design of the study; in the collection, analyses, or interpretation of data; in the writing of the manuscript; or in the decision to publish the results.

References

  1. Sobuz, M.R.; Aditto, F.S.; Datta, S.D.; Kabbo, K.I.; Jabin, J.A.; Hasan, N.M.S.; Khan, M.H.; Rahman, S.M.A.; Raazi, M.; Zaman, A.A.U. High-Strength Self-Compacting Concrete Production Incorporating Supplementary Cementitious Materials: Experimental Evaluations and Machine Learning Modelling. Int. J. Concr. Struct. Mater. 2024, 18, 67. [Google Scholar] [CrossRef]
  2. Şenol, A.F.; Karakurt, C. High-strength self-compacting concrete produced with recycled clay brick powders: Rheological, mechanical and microstructural properties. J. Build. Eng. 2024, 88, 109175. [Google Scholar] [CrossRef]
  3. Sahmaran, M.; Yaman, I.O. Hybrid fiber reinforced self-compacting concrete with a high-volume coarse fly ash. Constr. Build. Mater. 2007, 21, 150–156. [Google Scholar] [CrossRef]
  4. Carballosa, P.; García Calvo, J.L.; Revuelta, D. Influence of expansive calcium sulfoaluminate agent dosage on properties and microstructure of expansive self-compacting concretes. Cem. Concr. Compos. 2025, 107, 103464. [Google Scholar] [CrossRef]
  5. Gupta, P.K.; Rajhans, P.; Panda, S.K.; Nayak, S.; Das, S.K. Mix Design Method for Self-Compacting Recycled Aggregate Concrete and Its Microstructural Investigation by Considering Adhered Mortar in Aggregate. J. Mater. Civ. Eng. 2020, 32, 3. [Google Scholar] [CrossRef]
  6. Sasanipour, H.; Aslan, F.; Taherinezhad, J. Effect of silica fume on durability of self-compacting concrete made with waste recycled concrete aggregates. Constr. Build. Mater. 2019, 227, 116598. [Google Scholar] [CrossRef]
  7. Güneyisi, E.; Gesoğlu, M.; Algın, Z.; Yazıcı, H. Effect of surface treatment methods on the properties of self-compacting concrete with recycled aggregates. Constr. Build. Mater. 2014, 64, 172–183. [Google Scholar] [CrossRef]
  8. Chakkamalayath, J.; Joseph, A.; Al-Baghli, H.; Hamadah, O.; Dashti, D.; Abdulmalek, N. Performance evaluation of self-compacting concrete containing volcanic ash and recycled coarse aggregates. Asian J. Civ. Eng. 2020, 21, 2. [Google Scholar] [CrossRef]
  9. Wen, C.; Shen, D.; Jiao, Y.; Liu, C.; Li, M. Early-Age Cracking Resistance of Reinforced High- Strength Concrete. ACI Struct. J. 2024, 121, 11. [Google Scholar] [CrossRef]
  10. Astarlioglu, S.; Krauthammer, T. Response of normal-strength and ultra-high-performance fiber-reinforced concrete columns to idealized blast loads. Eng. Struct. 2014, 61, 1–12. [Google Scholar] [CrossRef]
  11. Hammoud, A.; Yan, J.; Li, Y.; Aoude, H. Blast Behavior of Columns Built with High-Strength Concrete and Grade 690 MPa High-Strength Reinforcement. Can. J. Civ. Eng. 2021, 48, 1422–1439. [Google Scholar] [CrossRef]
  12. Rahal, K.N.; Khaleefi, A.L.; Al-Sanee, A. An experimental investigation of shear-transfer strength of normal and high strength self compacting concrete. Eng. Struct. 2016, 109, 16–25. [Google Scholar] [CrossRef]
  13. Xiong, M.X.; Xiong, D.X.; Liew, J.Y.R. Axial performance of short concrete filled steel tubes with high- and ultra-high-strength materials. Eng. Struct. 2017, 136, 494–510. [Google Scholar] [CrossRef]
  14. Bae, B.I.; Chung, J.H.; Choi, H.K.; Jung, H.S.; Choi, C.S. Experimental study on the cyclic behavior of steel fiber reinforced high strength concrete columns and evaluation of shear strength. Eng. Struct. 2018, 157, 250–267. [Google Scholar] [CrossRef]
  15. Yoo, D.Y.; Yuan, T.; Yang, J.M.; Yoon, Y.S. Feasibility of replacing minimum shear reinforcement with steel fibers for sustainable high-strength concrete beams. Eng. Struct. 2017, 147, 207–222. [Google Scholar] [CrossRef]
  16. Rukhaiyar, S.; Sajwan, G.; Samadhiya, N.K. Strength behavior of plain cement concrete subjected to true-triaxial Compression. Can. J. Civ. Eng. 2018, 45, 179–196. [Google Scholar] [CrossRef]
  17. Powers, T.C.; Brownyard, T.L. Studies of the Physical Properties of Hardened Portland Cement Paste. Concr. Int. 2003, 9, 25. [Google Scholar]
  18. Yang, D. Study on mix proportion, brittleness and durability of high strength concrete. Concrete 1996, 2, 8. [Google Scholar]
  19. Deeb, R.; Ghanbari, A.; Karihaloo, B.L. Development of self-compacting high and ultra high performance concretes with and without steel fibres. Cem. Concr. Compos. 2012, 34, 185–190. [Google Scholar] [CrossRef]
  20. Frazão, C.; Camões, A.; Barros, J.; Gonçalves, D. Durability of steel fiber reinforced self-compacting concrete. Constr. Build. Mater. 2015, 80, 155–166. [Google Scholar] [CrossRef]
  21. Khaloo, A.; Raisi, E.M.; Hosseini, P.; Tahsiri, H. Mechanical performance of self-compacting concrete reinforced with steel fibers. Constr. Build. Mater. 2014, 51, 179–186. [Google Scholar] [CrossRef]
  22. Ding, Y.; Liu, S. Study of the flexural and shear toughness of steel fiber reinforced self-compacting concrete. China Civ. Eng. J. 2010, 43, 55–63. [Google Scholar]
  23. Akcay, B.; Tasdemir, M.A. Mechanical behaviour and fibre dispersion of hybrid steel fibre reinforced self-compacting concrete. Constr. Build. Mater. 2012, 28, 287–293. [Google Scholar] [CrossRef]
  24. Siddique, R.; Kaur, G. Strength and permeation properties of self-compacting concrete containing fly ash and hooked steel fibres. Constr. Build. Mater. 2016, 103, 5–22. [Google Scholar] [CrossRef]
  25. Alabduljabbar, H.; Alyousef, R.; Alrshoudi, F.; Alaskar, A.; Fathi, A.; Mohamed, A.M. Mechanical Effect of Steel Fiber on the Cement Replacement Materials of Self-Compacting Concrete. Fibers 2019, 7, 36. [Google Scholar] [CrossRef]
  26. Liu, X.; Wang, X.; Wang, Y.; Liu, Q.; Tian, Y.; Zhou, J.; Meng, Y. Mix Design and Performance Study of High-Strength Self-Compacting Concrete with Manufactured Sand. Materials 2025, 18, 1. [Google Scholar] [CrossRef]
  27. Yehia, S.; Douba, A.; Abdullahi, O.; Farrag, S. Mechanical and durability evaluation of fiber-reinforced self-compacting concrete. Constr. Build. Mater. 2016, 121, 120–133. [Google Scholar] [CrossRef]
  28. Kang, X.R.; Fang, G.X. Experimental Study of Composite High Strength Self-Compacting Concrete. Appl. Mech. Mater. 2017, 865, 289–294. [Google Scholar] [CrossRef]
  29. JGJ/T 283-2012.2012; Technical Specification for Application of Self-Compacting Concrete (with Provisions). Industry Standard—Construction Industry: Beijing, China, 2013.
  30. Wang, Y. Study on the Composition, Structure, Shrinkage and Compensation of Ultra-High Strength and High Performance Concrete. Master’s Thesis, Chongqing University, Chongqing, China, 2025. [Google Scholar]
  31. Ba, H.; Zhang, W. Effect of aggregate on rheological parameters of high performance concrete. Concrete 2003, 6, 3. [Google Scholar]
Figure 1. Particle size distribution map.
Buildings 15 02875 g001
Figure 2. Micro-steel fiber.
Buildings 15 02875 g002
Figure 3. Flowchart of mix proportion design of self-compacting concrete. * The loose pile rate of stone is the ratio of loose density to apparent density of stone.
Buildings 15 02875 g003
Figure 4. Schematic of slump flow test.
Buildings 15 02875 g004
Figure 5. Slump flow test in progress.
Buildings 15 02875 g005
Figure 6. Schematic of U-funnel testing instrument.
Buildings 15 02875 g006
Figure 7. Scene diagram of U-shaped funnel tester.
Buildings 15 02875 g007
Figure 8. Schematic of L-shaped funnel.
Buildings 15 02875 g008
Figure 9. L-shaped funnel scene diagram.
Buildings 15 02875 g009
Figure 10. Autogenous shrinkage of self-compacting high-strength concrete in cases with different fiber content.
Buildings 15 02875 g010
Figure 11. Drying shrinkage of self-compacting high-strength concrete in cases with different fiber content.
Buildings 15 02875 g011
Figure 12. Influence of fiber content on mechanical properties of self-compacting high-strength concrete: (a) 3-day compressive strength; (b) 28-day compressive strength; (c) 56-day compressive strength; (d) break-off strength.
Buildings 15 02875 g012aBuildings 15 02875 g012b
Figure 13. The effect of fiber content on the growth rate of mechanical properties of self-compacting high-strength concrete.
Buildings 15 02875 g013
Figure 14. Influence of water/binder ratio on workability of self-compacting high-strength concrete. (a) Effect of water–binder ratio on slump; (b) effect of water–binder ratio on T500; (c) effect of water–binder ratio on U-shape value; (d) effect of water–binder ratio on L-shape value.
Buildings 15 02875 g014aBuildings 15 02875 g014b
Figure 15. The influence of water/binder ratio on mechanical properties of self-compacting high-strength concrete: (a) 3-day compressive strength; (b) 28-day compressive strength; (c) 56-day compressive strength; (d) break-off strength.
Buildings 15 02875 g015aBuildings 15 02875 g015b
Figure 16. The effect of water/binder ratio on the growth rate of mechanical properties of self-compacting high-strength concrete.
Buildings 15 02875 g016
Figure 17. Autogenous shrinkage of self-compacting high-strength concrete in cases with different W/B.
Buildings 15 02875 g017
Figure 18. Drying shrinkage of self-compacting high-strength concrete in cases with different W/B.
Buildings 15 02875 g018
Figure 19. Influence of sand percentage on workability of self-compacting high-strength concrete. (a) Influence of sand ratio on slump; (b) influence of sand ratio on T500; (c) influence of sand ratio on U-shape value; (d) influence of sand ratio on L-shape value.
Buildings 15 02875 g019aBuildings 15 02875 g019b
Figure 20. The influence of sand percentage on mechanical properties of self-compacting high-strength concrete: (a) 3 days compressive strength; (b) 28 days compressive strength; (c) 56 days compressive strength; (d) break-off strength.
Buildings 15 02875 g020aBuildings 15 02875 g020b
Figure 21. Autogenous shrinkage of self-compacting high-strength concrete in cases with different sand percentage.
Buildings 15 02875 g021
Figure 22. Drying shrinkage of self-compacting high-strength concrete in cases with different sand percentage.
Buildings 15 02875 g022
Figure 23. Microscopic picture of self-compacting high-strength concrete without steel fiber.
Buildings 15 02875 g023
Figure 24. Microscopic picture of self-compacting high-strength concrete with steel fiber content of 0.3%.
Buildings 15 02875 g024
Figure 25. Microscopic picture of self-compacting high-strength concrete with steel fiber content of 0.6%.
Buildings 15 02875 g025
Figure 26. Microscopic picture of self-compacting high-strength concrete with steel fiber content of 0.9%.
Buildings 15 02875 g026
Table 1. Chemical components of ordinary Portland cement.
MaterialChemical Composition (%)
SiO2Fe2O3Al2O3CaOMgOSO3Total AlkaliIgnition Loss
cement21.32.535.7960.152.352.540.723.66
Table 2. The performance of ordinary Portland cement.
Fineness (m2/kg)Normal Consistency (%)Initial Setting Time (min)Final Setting Time (min)Specific Gravity of CementStability (Pie Method)Compressive Strength (Mpa)Break-Off Strength (Mpa)
3 d28 d3 d28 d
35028.41792393.1No cracks were found27.653.05.58.8
Table 4. Properties of crushed stone.
Ballast Grain Sizes (mm)Apparent Density (kg/m3)Bulk Density (kg/m3)Percentage of Void (%)Soil Content (%)
LooseningCompactLooseningCompact
5–1026701380147048.344.90.7
10–2026701400152047.643.10.5
Table 5. Properties of medium sand.
Apparent Density (kg/m3)Bulk Density (kg/m3)Percentage of Void (%)Soil Content (%)
LooseningCompactLooseningCompact
26901570163041.639.41.4
Table 6. Performance indicators of polycarboxylate superplasticizer.
Name of Plasticizer AdmixtureDensity (g/cm3)PH ValueViscosity (mPa·s)
Polycarboxylate superplasticizer1.16.795
Table 7. Performance specifications of steel fiber.
Fiber NameFiber Length (mm)Fiber Diameter (mm)Length-to-Diameter Ratio
Copper-plated micro-steel fiber100.1566.7
Table 8. The theoretical mix of C80 self-compacting concrete.
Unit Water Use (kg/m3)Binding Material (kg/m3)Cement (%)Slag
(%)
Silica Fume(%)Coarse Aggregate (kg/m3)Fine Aggregate (kg/m3)Water Reducing Admixture (%)
1557057020108347102
Note: The water consumption in the mix does not include the water in the admixture.
Table 9. Mix proportions of self-compacting high-strength concrete in cases with different water/binder ratio.
NumberingWater–Binder RatioUnit Water Use
(kg/m3)
Cementitious Material Content (kg/m3)Coarse Aggregate Content
(kg/m3)
Amount of Fine Aggregate (kg/m3)Water Reducing Admixture (%)
CementSlagSilica Fume
A10.2015554315577.57946762
A20.2215549414170.58347102
A30.2415545212964.58647362
Table 10. Mix proportions of self-compacting high-strength concrete in cases with different sand percentage.
NumberingPercentage of Sand (%)Unit Water Use
(kg/m3)
Cementitious Material Content (kg/m3)Coarse Aggregate Content
(kg/m3)
Amount of Fine Aggregate (kg/m3)Water Reducing Admixture (%)
CementSlagSilica Fume
B14415549414170.58626782
B24615549414170.58347102
B34815549414170.58017392
B45015549414170.57707702
Table 11. Mix proportions of self-compacting high-strength concrete in cases with different fiber content.
NumberingFiber Content
(%)
Unit Water Use
(kg/m3)
Cementitious Material Content (kg/m3)Coarse Aggregate Content
(kg/m3)
Amount of Fine Aggregate (kg/m3)Water Reducing Admixture (%)
CementSlagSilica Fume
C1015549414170.58347102
C20.315549414170.58347102
C30.615549414170.58347102
C40.915549414170.58347102
Table 12. The influence of fiber content on workability of self-compacting high-strength concrete.
NumberFiber Content (%)Slump (mm)T500 (s)U-Funnel Testing (ΔH) (mm)L-Funnel Testing (H2/H1)
C10700900.97
C20.36531150.97
C30.663016900.81
C40.9570301600.64
Disclaimer/Publisher’s Note: The statements, opinions and data contained in all publications are solely those of the individual author(s) and contributor(s) and not of MDPI and/or the editor(s). MDPI and/or the editor(s) disclaim responsibility for any injury to people or property resulting from any ideas, methods, instructions or products referred to in the content.