Abstract
This study investigates the long-term flexural performance of prestressed concrete double tees under sustained loading. Six full-scale specimens were subjected to a comprehensive experimental program, including a 320-day storage period following prestress release, a short-term flexural test, and a 990-day sustained loading phase. Mid-span deflections were measured using a string-line method, while the effective prestress in tendons was continuously monitored with fiber Bragg grating (FBG) sensors. Results showed a pronounced increase in camber during the storage phase, with long-term camber reaching approximately three times the initial value. Under short-term loading, the slabs exhibited a clear bilinear moment–deflection behavior. During sustained loading, most of the long-term deflection developed in the early stages, and an inverse relationship between load level and deflection growth was observed. Additionally, data from 20 short-term tests were compiled, and a bilinear stiffness model was proposed to estimate flexural stiffness in the cracked state. These findings contribute to a deeper understanding of long-term deformation in prestressed concrete double tees and provide reference data for serviceability evaluation and design refinement.
1. Introduction
Prestressed concrete double-tee slabs (hereafter referred to as “double tees”) are structural elements consisting of transverse flanges made of conventional concrete and two longitudinal prestressed ribs produced via the pre-tensioning technique. Owing to their high degree of standardization, excellent load-bearing capacity, construction efficiency, and cost-effectiveness, double tees are widely used in roof and floor applications for large-span industrial and public buildings [1]. Compared with conventional prestressed concrete beams, double tees exhibit the following distinguishing characteristics: (1) narrower rib width; (2) use of prestressing tendons as the sole longitudinal reinforcement; and (3) allowance for cracked section behavior during service. Under sustained loading, deformation characteristics—particularly camber development and deflection behavior—directly influence the serviceability of the structure, which may manifest as reduced floor flatness or cracking in topping layers. In engineering practice, due to the relatively young concrete age and low elastic modulus at the time of prestress release, an excessively large initial camber is frequently observed in double tees [2]. Furthermore, their long spans and heavy imposed loads make them vulnerable to significant deflection growth over time. Therefore, accurate prediction of long-term deformation is essential to ensure serviceability, control in-service deflections, and improve design methodologies.
Research on double tees, both in domestic and international studies, has primarily focused on the mechanical performance involving novel materials [3,4,5], connection detailing between flange panels [6,7], and the localized seismic performance of floor systems [8,9,10,11], while studies concerning their deformation characteristics remain limited. Regarding short-term flexural stiffness, Xiong et al. [12] conducted full-scale flexural tests on four double tees and found that the stiffness values calculated according to GB/T 50010-2010 [13] and EN 1992-1-1:2023 [14] underestimated the measured values by 18% and 37%, respectively. Similarly, Zhou et al. [15] reported from tests on six full-scale specimens that GB/T 50010-2010 [13] significantly underestimated actual flexural stiffness. In contrast, studies on the long-term camber and deflection of double tees are still insufficient, with most existing research focusing on conventional prestressed concrete beams. For example, Xu et al. [16] reported camber amplification coefficients ranging from −0.5 to 2.8 in prestressed beams, while Stallings et al. [17] observed that camber increased to 1.3 times its initial value after 260 days. Barr et al. [18] found an average camber growth of 2.04 times in five prestressed bridge girders within six months. Regarding long-term deflection, Ding et al. [19] measured growth factors of 2.09 and 3.43 after 18 months and 3 years, respectively, in 15 uncracked beams. Kelly et al. [20] reported a deflection ratio of 2.88 after 640 days, and Zou [21] found an average ratio of 1.68 in cracked CFRP-prestressed beams. While these studies provide valuable insights into the long-term behavior of prestressed members, they mainly address conventional beams. In contrast, double tees have an integrated slab–beam form, with wide thin flanges and deep narrow ribs. The flange serves both as a transverse floor and the compression zone of the flexural ribs. They are also typically fully prestressed, without non-prestressed longitudinal reinforcement. These differences may lead to distinct time-dependent deformation behavior, making direct application of research findings from conventional beams to double tees potentially inaccurate, especially for long-term camber and deflection. At the design code level, PCI MNL-120-17 [22] and GB/T 50010-2010 [13] adopt fixed amplification factors to account for camber and deflection growth; ACI 318-25 [23] adopts an additive amplification approach but limits its applicability to non-prestressed members; and EN 1992-1-1:2023 [14] recommends effective modulus methods for incorporating the effects of creep, shrinkage, and prestress loss—although no explicit formulas are provided. In summary, current design codes often underestimate the short-term flexural stiffness of double tees and rely on empirical amplification factors to estimate long-term deformations. These factors are primarily derived from test data on conventional prestressed beams, which incorporate both prestressed and non-prestressed longitudinal reinforcement. Given the distinct geometry and the use of exclusively prestressed reinforcement in double tees, simplified amplification approaches may underestimate long-term camber and deflection, potentially compromising serviceability. Accordingly, the applicability of current amplification approaches to double tees warrants further investigation.
In light of the above, this study conducted a comprehensive experimental investigation on the long-term flexural behavior of six full-scale prestressed concrete double tees. The program involved monitoring camber development over a 320-day storage period following prestress release, short-term flexural stiffness evaluation through staged loading, and monitoring long-term deflection under a 990-day sustained loading phase. In addition, fiber optic sensing technology was employed to measure the effective prestress in the tendons throughout the test. To complement the experimental findings, a supplementary dataset of short-term flexural tests on double tees was compiled and statistically analyzed to establish a predictive method for the minimum flexural stiffness under cracked conditions. Given the growing use of double tees in modern precast construction and the relative lack of research on their long-term deformation performance, this study seeks to supplement current understanding by providing full-scale observations under sustained service loading. Recent studies have also emphasized the importance of structural resilience and sustainability in seismic-prone regions, particularly for precast systems [24]. The integration of long-duration testing with internal prestress monitoring offers valuable insights into deformation mechanisms and code applicability. The results are expected to provide both empirical evidence and analytical support for the serviceability design and long-term performance evaluation of prestressed concrete double tees.
2. Experimental Program
2.1. Specimen Design
A total of six prestressed concrete double-tee specimens, designated as DT1 through DT6, were fabricated for the experimental program. All specimens had identical geometric dimensions, structural configurations, and prestressing reinforcement layouts. As illustrated in Figure 1, each specimen measured 11.98 m in total length, with an effective span of 11.80 m, a width of 2980 mm, and an overall depth of 450 mm. The flange thickness was 50 mm, and the topping concrete layer was 80 mm thick. The rib width at the bottom was 100 mm. Each rib contained two straight tendons positioned in a single horizontal row, located 50 mm above the bottom surface and spaced 30 mm apart. The prestressing tendons were 15.2 mm in nominal diameter, composed of high-strength low-relaxation strands with a tensile strength of 1860 MPa and a controlled jacking stress of 1395 MPa. Steel reinforcement consisted of single-layer welded wire meshes with 6 mm-diameter bars. Mesh type W1 (150 mm × 150 mm) was placed in the ribs, while mesh type W2 (150 mm × 200 mm) was used in the flange and topping layers. All reinforcement and auxiliary steel bars were made of HRB400-grade steel with a nominal yield strength of 400 MPa.
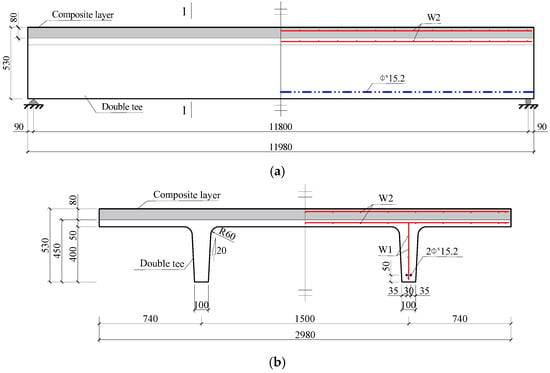
Figure 1.
Geometry and reinforcement layout of the double-tee specimen. (a) Side elevation view of the double-tee specimen; (b) Reinforcement details of Section 1–1.
2.2. Materials
The concrete used in this study was C45-grade commercial concrete, designed in accordance with the Chinese standard GB/T 50010-2010 [13]. The mix proportions are listed in Table 1. During specimen casting, companion specimens—including 150 mm cube samples and 150 mm × 150 mm × 300 mm prisms—were prepared and cured under identical conditions to those of the test specimens. These samples were used to evaluate the mechanical properties of the concrete at different ages. The measured properties, including cube compressive strength (fcu), axial compressive strength (fc), and elastic modulus (Ec), are summarized in Table 2 and Table 3 for early-age and long-term performance, respectively. The concrete used in the topping layer adopted the same mix proportions as the slab concrete. The prestressing strands were supplied by the manufacturer and conformed to the design strength specifications, with a measured yield strength of 1581 MPa and an elastic modulus of 195 GPa. All six specimens were cast using concrete from the same production batch to ensure material consistency.

Table 1.
Concrete mix design for the test specimens.

Table 2.
Measured mechanical properties of concrete at early age.

Table 3.
Measured mechanical properties of concrete at long-term ages.
2.3. Test Timeline
The age of each specimen was measured starting from the casting date, which was defined as day t = 0. According to the sequence of prestress release, topping concrete casting, and loading, the experiment was divided into four sequential stages: Stage 1—from prestress release to topping layer casting; Stage 2—from topping casting to initiation of loading; Stage 3—the loading phase, which was completed within a single day; and Stage 4—long-term monitoring under sustained loading. The starting ages (t1, t2, t3) and durations (Δt1, Δt2, Δt3) of these stages for each specimen are summarized in Table 4.

Table 4.
Timeline of experimental stages for each specimen.
2.4. Test Procedure
To simulate a uniformly distributed load, stacked concrete blocks were used as gravity-based loading elements. Three types of loading blocks were used: Type A (2200 mm × 1000 mm × 100 mm concrete slabs), Type B (2200 mm × 600 mm × 100 mm concrete slabs), and standard clay bricks (240 mm × 115 mm × 53 mm). The top surface of each specimen was divided into eight designated loading zones, as illustrated in Figure 2. The orange zones corresponded to the placement of Type A blocks, while yellow zones were designated for Type B blocks and bricks. To ensure uniform load transfer, a layer of fine sand was evenly spread across the loading zones on the slab surface prior to block placement (Figure 3).
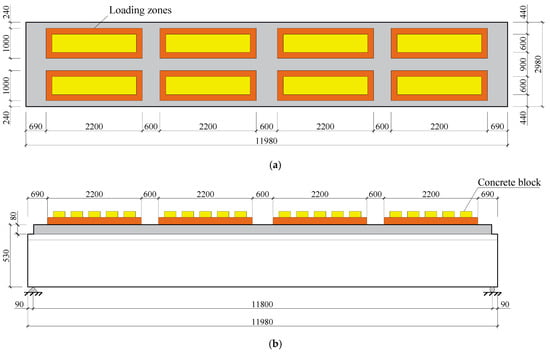
Figure 2.
Schematic diagram of the loading procedure for the double-tee specimens. (a) Loading zones for stacked weight blocks; (b) Placement of stacked loading blocks.
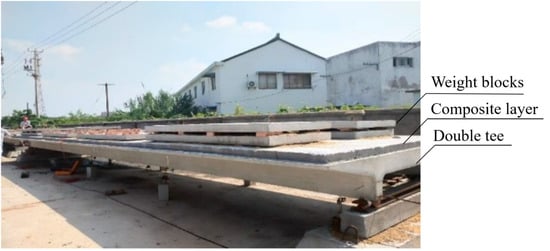
Figure 3.
On-site setup for loading test of double-tee specimens.
Assuming a unit weight of 25 kN/m3 for reinforced concrete, the self-weight moment (MG) and corresponding uniformly distributed self-weight load (qG) for the composite slab were determined to be 211.10 kN·m and 4.07 kN/m2, respectively. Based on the measured material strengths and according to GB/T 50010-2010, the cracking moment (Mcr), yield moment (My), and ultimate moment (Mu) were calculated as 276.24 kN·m, 462.30 kN·m, and 513.28 kN·m, respectively. Corresponding equivalent surface loads for cracking (qcr), yielding (qy), and ultimate capacity (qu) were 5.33 kN/m2, 8.91 kN/m2, and 9.90 kN/m2.
Loading was conducted in incremental stages, with each loading level applied symmetrically. The detailed loading schedule for all six specimens is provided in Table 5. The values shown represent the equivalent uniformly distributed loads, including self-weight; loading level 0 indicates that no external load was applied. To investigate the relationship between long-term deflection and sustained load level in double tees, the target final loads for specimens DT1 through DT6 were designed as 0.77 qu, 0.52 qu, 0.67 qu, 0.63 qu, 0.66 qu, and 0.81 qu, respectively. A comparison between the cracking load (qcr) and yielding load (qy) revealed that specimen DT2 remained uncracked after loading, whereas the other specimens exhibited cracking but did not reach yielding. All specimens were configured as simply supported beams. The roller support consisted of a cylindrical steel roller clamped by upper and lower steel bearing plates, while the pinned support was achieved by welding two steel bars beneath the roller to restrict horizontal movement.

Table 5.
Equivalent applied loads on specimens (including self-weight, unit: kN/m2).
2.5. Measurement
The mid-span vertical deflection of the double tees under stacked loading was measured using a taut string method. After the specimens were placed on their supports, a steel ruler was affixed to the side face of the rib at mid-span. Steel bars were embedded 150 mm above the base of the supports at both ends, across which a string was tensioned by using weights at both ends to maintain straight alignment. The vertical deformation was determined by reading the scale on the steel ruler at the point where the taut string intersected it, as illustrated in Figure 4.

Figure 4.
Measurement setup for vertical mid-span deformation.
To monitor the effective prestress in the tendons, fiber Bragg grating (FBG) sensors were employed. These sensors were bonded into precision-milled grooves along the central wire of each prestressing strand. The FBG sensors were connected to an optical demodulation instrument via optical leads, allowing real-time monitoring of central wavelength shifts, which were subsequently converted to axial stress values [25]. Six prestressing strands were designated as 1# through 6#, with one installed in each specimen. Two measurement points—labeled C1 and C2—were positioned along each strand, as shown in Figure 5.

Figure 5.
Arrangement of FBG sensor locations on prestressing tendons.
To facilitate crack observation, a 100 mm × 200 mm inked grid was drawn on the outer surface of the rib of each double tee before loading. During the loading process, crack development was carefully monitored at the end of each load stage. Newly formed cracks were marked directly on the specimen surface using ink markers. The widths, lengths, and spacing of visible cracks were measured using a crack width gauge and a steel tape. After completion of loading, photographs were taken of the marked regions. Based on the recorded data, schematic crack diagrams were generated, from which average crack spacing was determined.
2.6. Overview of Experimental Procedure
To improve clarity and coherence, an overview of the experimental program is presented in Figure 6. The testing process was divided into three sequential phases. Phase I included prestress release followed by a 320-day storage period under natural outdoor conditions, during which mid-span camber was measured using the string-line method, and effective prestress in the tendons was monitored via FBG sensors. Phase II involved a short-term flexural test under staged loading, where mid-span deflection and cracking behavior were recorded; prestress monitoring continued during this stage until completion of the loading. Phase III consisted of a 990-day sustained loading period, during which time-dependent deflection was tracked using the same string-line method. It should be noted that although the loading is schematically shown as uniform in Figure 6, the actual sustained load levels differed among the specimens used to investigate load-dependent long-term behavior. FBG measurements were discontinued prior to Phase III due to hardware failure.
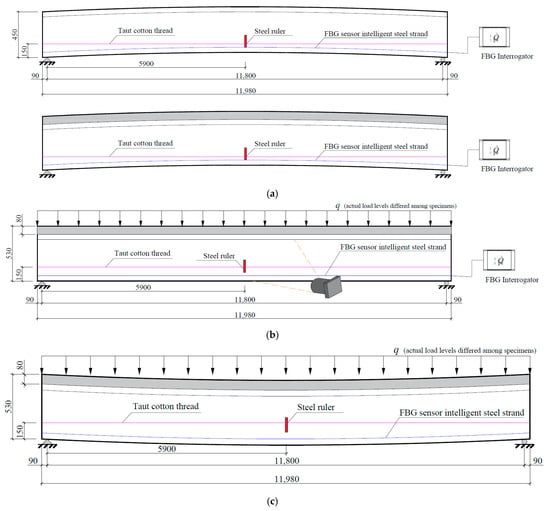
Figure 6.
Overview of the experimental procedure and measurements conducted in each phase. (a) Phase I: Prestress Release & Storage (Day 0–320); (b) Phase II: short-term flexural test (after day 320); (c) Phase III: long-term sustained loading.
3. Results
3.1. Prestressing Tendon Stress
Before loading, the stresses at measurement points C1 and C2 on each of the six smart prestressing strands were recorded and denoted as σC1 and σC2, respectively. The measured effective prestress σpe,t over time is presented in Figure 7, where t = 0 represents the casting date of the specimens. At t = 0, the measured stress matched the applied jacking stress. Following prestress release, a significant drop in tendon stress was observed, with a more pronounced decrease observed at point C2. Both C1 and C2 showed an initial rapid decline in stress, followed by a gradual stabilization. By the time the topping layer was cast—around 140 days—the stress curves had nearly plateaued, indicating stabilization of the tendon stress. At this stage, the measured stress at point C2—located near mid-span—across all six smart prestressing strands remained consistent at approximately 800 MPa. In contrast, the stress readings at point C1—positioned near the specimen ends—exhibited significant variation. Specifically, the C1 stress on strand 1# was approximately 250 MPa, whereas the corresponding values on the other five strands were relatively consistent, averaging around 380 MPa. A thorough inspection confirmed that all sensors were properly installed and that signal demodulation was functioning correctly, thereby ruling out the possibility of sensor malfunction. As shown in Figure 5, measurement point C1 was positioned near the specimen ends, where the prestress transfer from strands to concrete is more vulnerable to bond variability and local effects. While no direct damage was visually documented, the stress reading at the C1 point of strand 1# was notably lower than those of the other strands, which may reflect localized bond deterioration near the DT1 end. These interpretations remain hypothetical but are consistent with the principles of stress transfer in pretensioned members. After the topping concrete was cast, the self-weight increased, resulting in a recovery in the stress readings at point C2.
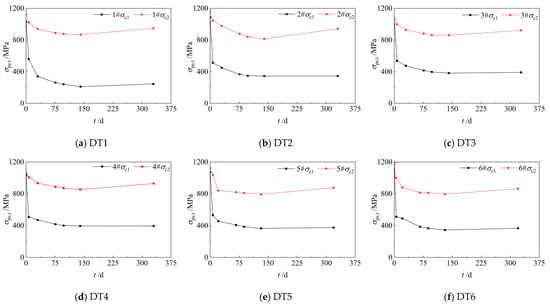
Figure 7.
Effective prestress in tendons before loading.
During the staged loading process, the prestressing tendon stresses at measurement point C2 were measured at each loading stage. These measurements were used to determine the stress increments associated with the increasing mid-span bending moments. The moment–tendon stress increment (Δσp) relationships for all six specimens are presented in Figure 8, where the vertical axis represents the applied mid-span bending moment induced by external loads only (excluding self-weight). The results indicated that for specimen DT2, the load–stress increment curve is approximately linear, indicating consistent flexural stiffness throughout loading. In contrast, the other five specimens exhibit bilinear behavior, with a distinct reduction in slope beyond a certain moment threshold—indicating stiffness degradation likely due to cracking or nonlinear material response. Table 6 summarizes the effective prestress values in the strands before and after loading. While initial values exhibited slight variations across specimens, the average initial effective prestress was approximately 905.1 MPa.
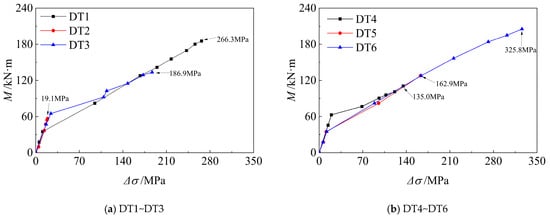
Figure 8.
Relationship between mid-span moment and tendon stress increment during staged loading.

Table 6.
Measured effective prestress in tendons before and after loading.
3.2. Long-Term Camber Before Loading
Before the application of external loads, the double tees developed camber due to the combined effects of self-weight and prestressing force. The time-history curves of mid-span camber are illustrated in Figure 9, where the horizontal axis represents the elapsed time since prestress release and the vertical axis indicates upward deflection at mid-span (positive direction). It is worth noting that all specimens were stored outdoors without weather protection during the storage period. As a result, the camber measurements were inevitably influenced by ambient temperature and humidity fluctuations, particularly due to their effects on concrete shrinkage and creep. These environmental variations contributed to the observable fluctuations in the recorded camber data. Despite this variability, a general trend of camber evolution was still clearly observable. Following prestress release, a rapid initial increase in upward deformation was recorded, which gradually slowed over time and eventually stabilized. Most of the camber increase occurred within the first 30 days after prestress release. A sharp reduction in mid-span camber occurred at 140 days, coinciding with the casting of the topping concrete layer. Subsequently, the time-dependent vertical deformation exhibited a typical pattern of rapid growth followed by gradual stabilization. Although all specimens were fabricated with identical dimensions, reinforcement layouts, and designed prestressing levels, slight differences were observed in both the initial and final camber values. These discrepancies are mainly attributed to variations in the prestress release age as well as differences in the actual applied prestressing force. The combined effect of these two factors led to measurable, though relatively small, deviations in camber. To minimize the influence of specimen-to-specimen variability on the analysis, average values across specimens were used in subsequent evaluations. Overall, the consistency in camber trends and the narrow range of variation support the reliability and representativeness of the experimental results.
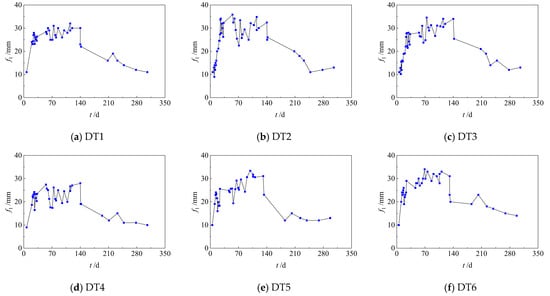
Figure 9.
Time-history curves of mid-span camber before loading.
3.3. Results of Loading Tests
3.3.1. Observations During Stacked Load Testing
During the incremental loading process, the flexural behavior of the double tees was characterized by two distinct stages:
(1) Elastic Stage (Pre-Cracking): From the onset of loading until the formation of the first visible cracks, the slabs exhibited elastic behavior. As the applied load increased, the initial upward camber gradually diminished, eventually changing into downward deflection.
(2) Crack Propagation Stage: Once cracking initiated—typically at mid-span—the cracks propagated longitudinally toward the supports. Initial cracks developed rapidly and were especially pronounced, with lengths reaching 80–90% of the rib height. Except for specimen DT4, which cracked at load level 2, the remaining five cracked specimens exhibited initial cracking at load level 3.
As the loading levels grew progressively, both the number and width of cracks progressively increased. At the maximum applied load qmax, the cracks were fully developed and had stabilized, as shown in Figure 10. The cracking pattern was primarily concentrated within the central half-span (between the quarter-span points) of the slab, with cracks relatively uniformly distributed along the longitudinal direction. The average spacing between cracks was approximately 305 mm.
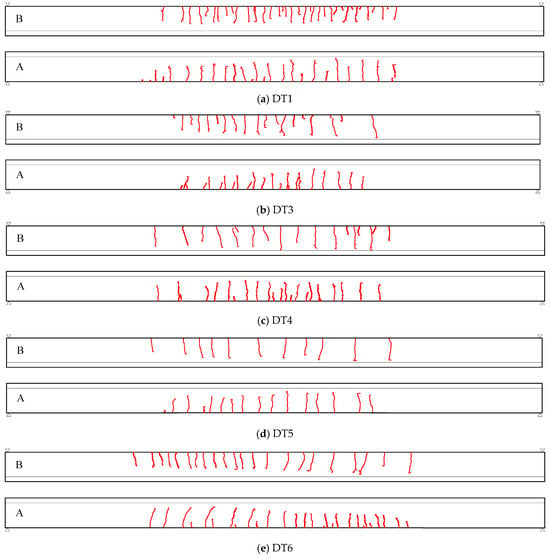
Figure 10.
Crack patterns in double-tee specimens at peak short-term loading. A and B represent the side views of the two ribs of the double tees.
3.3.2. Short-Term Load–Deflection Behavior
The mid-span moment–deflection (M–Δ) responses of all six specimens under staged loading are presented in Figure 11. In the plots, the horizontal axis Δ represents the vertical deflection relative to the pre-loading condition (positive downward), while the vertical axis M denotes the bending moment at mid-span induced solely by externally applied loads (self-weight excluded). For reference, the calculated cracking moment in accordance with GB/T 50010-2010 [13] is indicated in each case. At load levels 1 and 2, the cross-sections remained uncracked, and the specimens exhibited a nearly linear elastic behavior, characterized by a proportional increase in deflection with applied moment, which indicates that flexural stiffness remained essentially constant during the uncracked phase. Upon cracking, a significant reduction in stiffness occurred, as reflected by a clear change in slope in the M–Δ curves. Except for DT2, which remained uncracked throughout loading, the five cracked specimens showed a characteristic bilinear behavior.
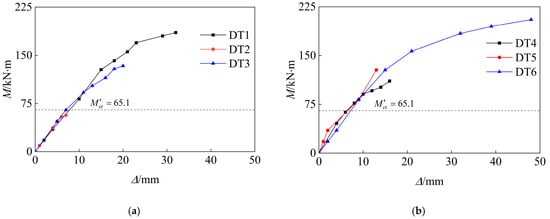
Figure 11.
Mid-span moment–deflection responses of specimens under short-term loading.
3.4. Long-Term Deflection After Loading
The time-history curves of long-term mid-span deflection for the prestressed concrete double tees under sustained loading are shown in Figure 12. In the plot, the horizontal axis t represents the duration of sustained loading, while the vertical axis fdef denotes the mid-span deflection relative to the initial value immediately after completion of the stacked loading (defined as t = 0), with downward deflection taken as positive. The results indicate that long-term deflection followed a typical time-dependent trend, characterized by a rapid increase during the early stage of sustained loading, followed by a gradual slowdown and eventual stabilization. The rate of deflection growth was strongly affected by the magnitude of the applied sustained load. Specimens subjected to higher load levels exhibited larger increases in early stage deflection. For example, at t = 5 days, the uncracked specimen DT2 exhibited a deflection increase of only 5 mm, while cracked specimens experienced increases ranging from 12 to 21 mm—approximately 2.4 to 4.2 times greater than the increase observed in DT2. By t = 50 days, the average deflection across all specimens had reached 79% of the final deflection measured at t = 990 days, indicating that the majority of long-term deformation occurred within the early phase of sustained loading.
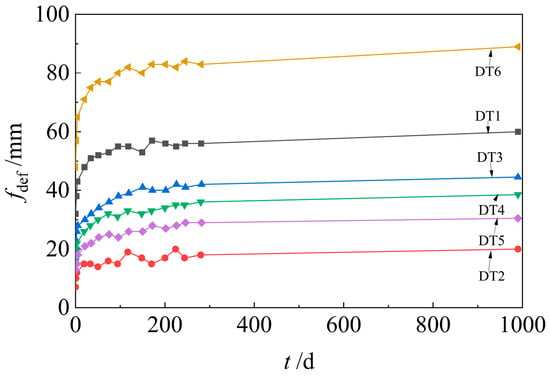
Figure 12.
Time-history curves of mid-span deflection under sustained loading.
At the time of sustained loading, the concrete in all specimens had exceeded 300 days of age, and the effects of shrinkage and creep had largely stabilized. As a result, the influence of environmental conditions on the intrinsic deformation of the slabs was relatively limited. However, since the external load was applied using concrete blocks and clay bricks placed directly on the slab surface (see Figure 13), fluctuations in ambient temperature and humidity may have slightly affected the self-weight of the loading materials—particularly the moisture-sensitive bricks. These external factors contributed to the slight fluctuations observed in the time–deflection curves during the long-term monitoring period, as shown in Figure 12.
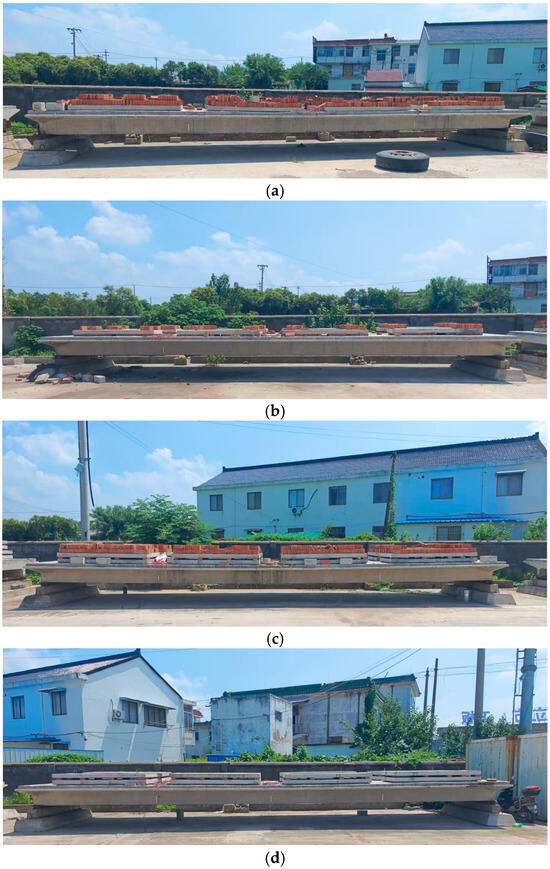
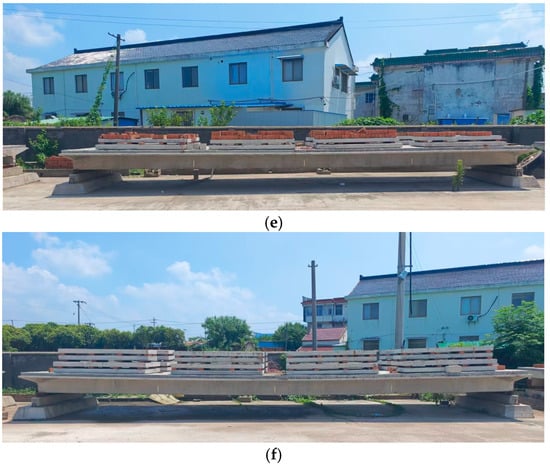
Figure 13.
Overall condition of the six specimens after completion of the experimental program.
4. Analysis of Results
4.1. Effective Prestress in Tendons
The effective prestress in the prestressing strands was evaluated based on stress measurements obtained at three key stages: immediately after tensioning, following the first phase of prestress loss (within 1 day), and after the second phase of loss caused by concrete shrinkage and creep (approximately 140 days). Since all specimens were subjected to natural curing conditions, thermal effects were deemed negligible, and no prestress loss due to temperature gradients (σl3) was considered. The long-term stress readings at measurement point C2 served to quantify the second-phase losses. These values were then compared with the calculated prestress losses as specified in GB/T 50010-2010 [13]. The comparison is summarized in Table 7. Results show that the code tends to overestimate the first phase of prestress loss, with measured tendon stresses exceeding the calculated values by 57 to 107 MPa. However, the relative deviation remained within 10%. After accounting for all loss mechanisms, the total effective prestress predicted by the code was found to agree well with the measured values, with deviations remaining below 10%. Among the six specimens, the deviation in σpe2 showed no consistent pattern—three measured values were slightly higher and three slightly lower than the corresponding theoretical predictions. These observations indicate that the prestress loss formulas provided by GB/T 50010-2010 are sufficiently accurate for estimating the effective prestress in double tees under natural curing conditions, despite localized variability among individual specimens.

Table 7.
Comparison of calculated and measured effective prestress values.
4.2. Long-Term Camber of Double Tee
Table 8 presents the initial camber values measured after prestress release, along with the ratios of long-term camber to the initial values at various ages. Relative to the camber at 140 days, values at 1, 2, and 3 months were approximately 80%, 90%, and 93%, respectively. On average, the long-term camber at the time of topping concrete casting (at 140 days) was approximately three times the initial camber measured immediately after prestress release. By comparison, the amplification factors recommended by GB/T 50010-2010 [13] and PCI MNL-120-17 [22] for long-term camber are 2.0 and 1.8, respectively—which are both noticeably lower than the experimental results in this study, which suggests that existing code provisions tend to underestimate long-term camber in prestressed concrete double tees.

Table 8.
Development of camber over time relative to initial camber.
4.3. Short-Term Bending Stiffness of Double Tees
4.3.1. Evaluation of Short-Term Flexural Stiffness Under Uniform Load
In conventional beam-type specimens, short-term flexural stiffness is typically evaluated using the moment–curvature relationship within a well-defined pure bending region. However, due to the uniformly distributed loading applied to the double-tee specimens in this study, a distinct pure bending region was absent. Furthermore, shear effects induced a non-uniform distribution of curvature along the specimen length. To address these complexities, an equivalent stiffness method was employed as a means of simplified analysis. Specifically, it was assumed that the influence of shear force on curvature could be neglected. The specimen was conceptually divided along its length into cracked and uncracked regions and assigned stiffness values Bcr (uncracked) and Bave. (cracked). Owing to the observed uniform distribution of cracks, a linear variation in stiffness was assumed across the cracked region. The distance between the uncracked region and the mid-span was included in the analysis, as illustrated in Figure 14.

Figure 14.
Assumed distribution of flexural stiffness in double tees after cracking.
Based on the aforementioned stiffness distribution and assuming small-deflection behavior in the slab’s flexural behavior, the relationship between the deflection function f(x) and the stiffness distribution B(x) across the cracked and uncracked regions can be expressed as follows:
By integrating Equation (1), the relationship between the average flexural stiffness Bave in the cracked region and the mid-span deflection Δ was obtained, as presented in Equation (2). Substituting the experimentally measured deflection into this expression enables the short-term flexural stiffness in the cracked region to be back-calculated.
where Δ denotes the mid-span deflection induced by external load; Bcr is the flexural stiffness before cracking; l is the effective span of the double tee; l1 represents the distance from mid-span to the boundary of the uncracked region; q is the uniformly distributed external load; and g is the uniformly distributed self-weight.
4.3.2. Method for Calculating Short-Term Flexural Stiffness
According to the provisions of the Chinese code GB/T 50010-2010 [13] and the European standard EN 1992-1-1: 2023 [14], the moment–curvature (M–1/ρ) relationship of cracked members is commonly idealized using a bilinear model. As illustrated in Figure 15, M0 denotes the decompression moment for prestressed members, and the initial slope corresponds to the elastic stiffness before cracking. Based on this bilinear model, the analytical relationships are formulated as follows:
where the parameters , , and represent stiffness reduction coefficients associated with different moment levels; Ec denotes the elastic modulus of concrete; I0 denotes the transformed moment of inertia; is the ratio of the cracking moment to the applied moment ; and is the ratio of the cracking moment to the moment .
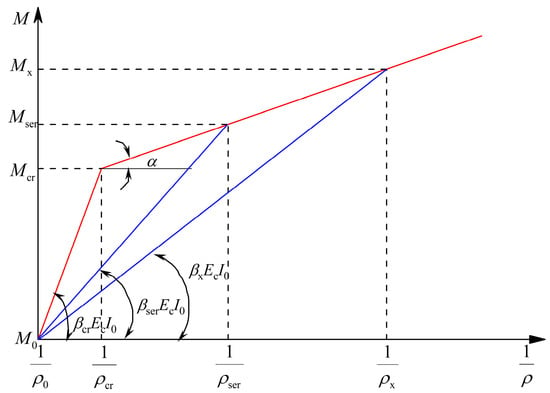
Figure 15.
Bilinear moment–curvature relationship.
By setting as 0.85 and substituting the relevant expressions into the derived equation, a simplified expression for the stiffness ratio ω was derived.
According to the reference [26], parameters and exhibit an approximately linear correlation. The validity of the proposed relationship was verified using experimental data with values of parameter approximately within the target range, as illustrated in Figure 16. It can be observed that, under consistent values of , a generally linear correlation exists between parameters and for double-tee specimens. Given the limited amount of test data, was taken as 0.6, and regression analysis was performed using results in which the actual value of ranged between 0.58 and 0.62, thereby establishing a fitted relationship between and . Substituting the regression outcome into Equation (9), the final expression for calculating ω was obtained.
where denotes the modular ratio between reinforcement and concrete, which for double tees is taken as the ratio between the elastic moduli of prestressing tendons and concrete; ρ represents the longitudinal tensile reinforcement ratio; b0 is the width of the flange panel; bave, bf, h, and hf are simplified sectional dimensions of the double tee (as shown in Figure 17), corresponding to average rib width, effective flange width, overall section depth, and flange thickness, respectively.
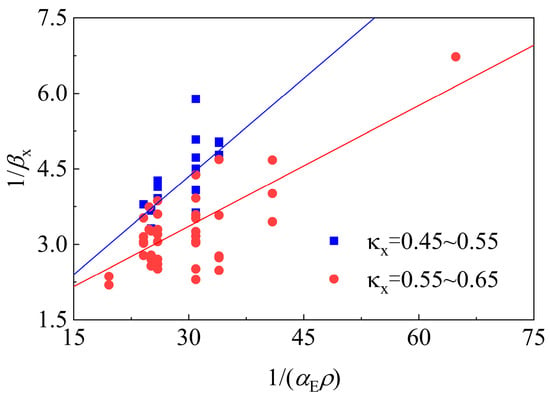
Figure 16.
Relationship between parameters and .
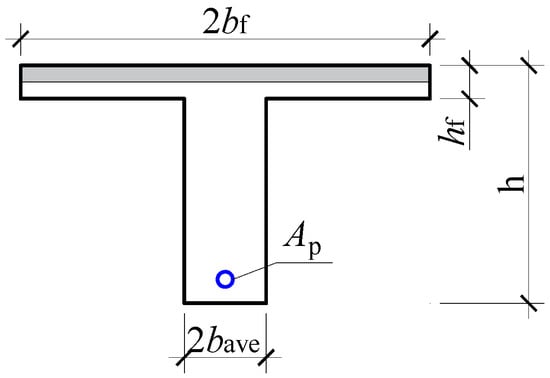
Figure 17.
Simplified cross-sectional dimensions of the double tee.
A total of 14 prestressed concrete double tees with varying cross-sectional geometries and reinforcement configurations were compiled from references [12,13,14,15,16,17,18,19,20,21,22,23,24,25,26,27,28,29] to validate the proposed method for estimating short-term flexural stiffness. The key design parameters of these specimens—including rib width (b), overall depth (h), flange width (bf), flange thickness (hf), span length (l), concrete compressive strength (fcu), and tendon stress (σcon)—are summarized in Table 9. The reinforcement configurations include various combinations of prestressing tendons with different diameters and quantities per rib. These published data were combined with the test results to assess the applicability of the proposed stiffness prediction method. For each specimen, several loading conditions within the post-cracking and pre-yielding range were selected. Using Equation (10), the stiffness ratio ω was computed and substituted into Equation (8) to obtain the predicted post-cracking stiffness Bs,a. A comparison between the predicted values Bs,a and the experimentally measured stiffness values Bs,t is shown in Figure 18. The majority of specimens exhibited deviations within ±20%, indicating good agreement between theoretical predictions and test data. The average ratio Bs,a/Bs,t was found to be 1.049, with a corresponding coefficient of variation of 0.331, indicating that the stiffness prediction method yields a reliable estimate of the post-cracking stiffness for double tees under uniform loading.

Table 9.
Summary of key parameters of double-tee slab specimens from the literature.
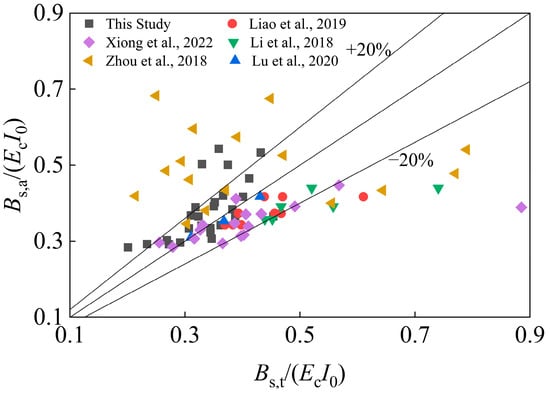
Figure 18.
Comparison between calculated and measured short-term flexural stiffness of double tees. Data sources: This study; Xiong et al. (2022) [12]; Zhou et al. (2018) [15]; Liao et al. (2019) [27]; Li et al. (2018) [28]; Lu et al. (2020) [29].
4.3.3. Analysis of Short-Term Deflection
According to the provisions of GB/T 50010-2010, the deflection of prestressed concrete flexural members may be calculated using structural mechanics principles, with the assumption that the member exhibits uniform cross-sectional properties. Specifically, the code adopts the minimum stiffness approach, whereby the member’s flexural stiffness is taken as the lowest value at the section of maximum moment. Using the average flexural stiffness of the cracked region derived using the proposed method, the mid-span deflection Δc was calculated and then compared with the corresponding experimental measurements Δt. As shown in Figure 19, the ratio Δc/Δt exhibited an average value of 1.093, with a coefficient of variation of 0.203. These results indicate that the calculated deflection was slightly larger than the measured values, reflecting a conservative estimation. The overall findings suggest that for prestressed concrete double tees, the minimum stiffness principle combined with the proposed stiffness evaluation method offers both accurate and conservative prediction of mid-span deflection under service loading conditions.
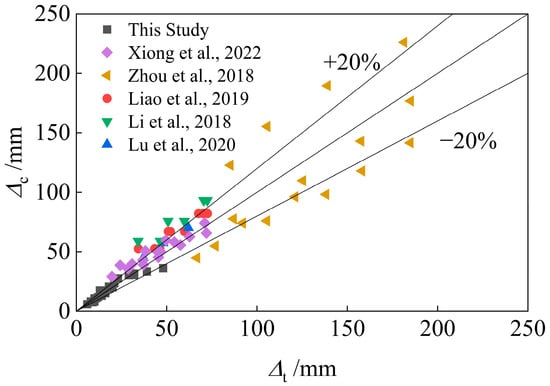
Figure 19.
Comparison between calculated and measured mid-span deflections of double tees. Data sources: This study; Xiong et al. (2022) [12]; Zhou et al. (2018) [15]; Liao et al. (2019) [27]; Li et al. (2018) [28]; Lu et al. (2020) [29].
4.4. Long-Term Deflection of Double Tees
After 990 days of sustained loading, the ratios of long-term to initial mid-span deflection for specimens DT1 through DT6 were recorded as 1.88, 2.86, 2.30, 2.41, 2.35, and 1.85, respectively. Figure 20 shows the correlation between the sustained load level and the long-term deflection behavior. In the figure, the vertical axis θ denotes the amplification ratio of mid-span deflection after 990 days relative to the initial value, while q denotes the applied sustained load, and qu is the theoretical ultimate load capacity. The results clearly show that the long-term deflection amplification factor θ exhibits a linear negative correlation with the load ratio q/qu, which indicates that as the load level increases, the relative amplification of long-term deflection decreases. The regression equation is given in Equation (13), with a coefficient of determination R2 of 0.988, reflecting a high degree of linear correlation.
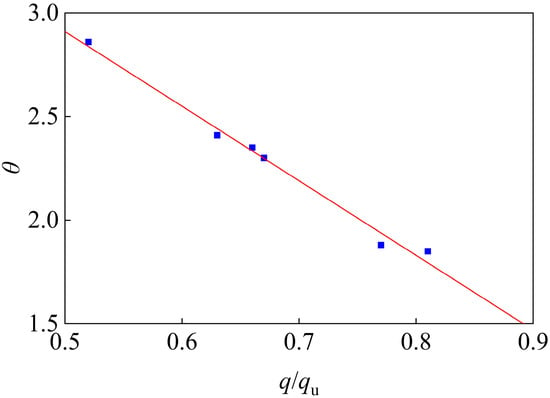
Figure 20.
Relationship between long-term deflection amplification factor and load ratio.
5. Conclusions
This study investigated the long-term flexural behavior of prestressed concrete double tees through full-scale testing under sustained service loads. Based on effective prestress monitoring, camber development during the storage phase, and both short-term and long-term deflection measurements, the following key findings were obtained:
- (1)
- The evolution of camber during the storage period followed a three-stage pattern of rapid growth, gradual deceleration, and stabilization. By 140 days, the average camber increased to approximately three times the initial value, exceeding standard amplification factors. This suggests that existing code provisions may underestimate long-term camber in double-tee members.
- (2)
- Cracked specimens exhibited clear bilinear moment–deflection behavior. A regression-based method for estimating post-cracking flexural stiffness was proposed and demonstrated strong agreement with the experimental data, providing a practical tool for stiffness prediction in design.
- (3)
- The long-term deflection showed a time-dependent trend, with nearly 80% of the total deformation occurring within the first 50 days. A strong inverse linear correlation was identified between deflection growth and load intensity, highlighting the importance of service load control for deformation mitigation.
- (4)
- All tests were conducted under uncontrolled outdoor conditions, which may have introduced minor fluctuations in long-term deformation measurements. This highlights the need for future studies to consider climate-controlled environments or analytical corrections to improve measurement reliability.
Author Contributions
Conceptualization, Y.Z. and G.C.; Methodology, G.C. and Y.L.; Validation, Y.Z. and Z.G.; Formal analysis, G.C.; Investigation, Y.L.; Resources, Y.Z.; Writing—original draft, G.C. and Y.L.; Writing—review and editing, Y.Z.; Supervision, Y.Z. and Z.G. All authors have read and agreed to the published version of the manuscript.
Funding
This research is financially supported by the National Key Research Program of China (No. 2016YFC0701900).
Institutional Review Board Statement
Not applicable.
Informed Consent Statement
Not applicable.
Data Availability Statement
The XLSX data used to support the findings of this study may be accessed by emailing the corresponding author, who can be contacted at 2330662@tongji.edu.cn.
Acknowledgments
The study was supported by the National Key Research Program of China, 2016YFC0701900. Their support is gratefully acknowledged.
Conflicts of Interest
Author Zhiqiang Gao was employed by the company China Institute of Building Standard Design & Research. The remaining authors declare that the research was conducted in the absence of any commercial or financial relationships that could be construed as a potential conflict of interest.
References
- Nasser, D.; Tadros, M.; Sevenker, A. The legacy and future of an American icon: The precast, prestressed concrete double tee. PCI J. 2015, 60, 49–68. [Google Scholar] [CrossRef]
- Liu, Y.M.; Wang, X.F.; Zhao, Y. Measurement and analysis of early-age camber of prestressed concrete double tees. Ind. Constr. 2021, 51, 67–71. (In Chinese) [Google Scholar]
- Botros, A.W.; Lucier, G.; Rizkalla, S.H.; Gieich, H. Behavior of free and connected double tee flanges reinforced with carbon-fiber-reinforced polymer. PCI J. 2016, 134, 49–68. [Google Scholar] [CrossRef]
- Antonio, C.; Fausto, M.; Giovanni, A.P. Shear behaviour of prestressed double tees in self-compacting polypropylene fiber reinforced concrete. Eng. Struct. 2017, 146, 93–104. [Google Scholar]
- Spadea, S.; Rossini, M.; Nanni, A. Design analysis and experimental behavior of precast concrete double-tee girders prestressed with carbon-fiber-reinforced polymer strands. PCI J. 2018, 63, 72–84. [Google Scholar] [CrossRef]
- Naito, C.; Cao, L.; Peter, W. Precast concrete double-tee connections: Part 1: Tension behavior. PCI J. 2009, 54, 49–66. [Google Scholar] [CrossRef]
- Hendricks, R.; Naito, C.; Osborn, A. Flange to flange double-tee connections subjected to vehicular loading: Part 1: Numerical assessment approach. PCI J. 2018, 63, 41–53. [Google Scholar] [CrossRef]
- Fleischman, R.B.; Naito, C.J.; Restrepo, J.; Sause, R.; Ghosh, S.K. Seismic design methodology for precast concrete diaphragms: Part 1: Design framework. PCI J. 2005, 50, 68–83. [Google Scholar] [CrossRef]
- Fleischman, R.B.; Ghosh, S.K.; Naito, C.J.; Wan, G.; Restrepo, J.; Schoettler, M.; Sause, R.; Cao, L.L. Seismic design methodology for precast concrete diaphragms: Part 2: Research program. PCI J. 2005, 50, 14–31. [Google Scholar] [CrossRef]
- Lee, H.J.; Danel, A.K. Seismic response of parking structures with precast concrete diaphragm. PCI J. 2008, 67, 1–24. [Google Scholar] [CrossRef]
- Marco, B.; Marco, S. Numerical simulation of seismic-induced failure of a precast structure during the emilia earthquake. J. Perform. Constr. Facil. 2018, 32, 1–11. [Google Scholar] [CrossRef]
- Xiong, X.Y.; Ge, Y.P.; Yao, G.F. Experimental study on flexural behavior of full scale precast prestressed concrete double-tee members. J. Build. Struct. 2022, 43, 127–136. (In Chinese) [Google Scholar]
- GB/T 50010-2010; Code for Design of Concrete Structures. China Architecture & Building Press: Beijing, China, 2024.
- BS EN 1992-1-1:2023; Eurocode 2: Design of Concrete Structures—Part 1-1: General Rules and Rules for Buildings. British Standards Institution (BSI): London, UK, 2023.
- Zhou, W.; Zhang, W.L. Tests on flexural behavior of double-tee beams in precast parking structures. J. Build. Struct. 2018, 39, 66–73. (In Chinese) [Google Scholar]
- Xu, J.S.; Xue, L.H. Rational method for estimating long-term camber and deflection of prestressed concrete flexure members. J. Build. Struct. 2011, 41, 95–102+110. (In Chinese) [Google Scholar]
- Stallings, J.M.; Barnes, R.W.; Eskildsen, S. Camber and prestress losses in Alabama HPC bridge girders. PCI J. 2003, 48, 90–104. [Google Scholar] [CrossRef]
- Barr, P.J.; Angomas, F. Differences between calculated and measured long-term deflections in a prestressed concrete girder bridge. J. Perform. Constr. Facil. 2010, 24, 603–609. [Google Scholar] [CrossRef]
- Ding, D.J.; Pang, T.H. The experimental study of reinforced concrete and prestressed concrete flexural members under sustained loads. J. Build. Struct. 1980, 1, 1–11. (In Chinese) [Google Scholar]
- Kelly, D.J.; Bradberry, T.E.; Breen, J.E. Time-Dependent Deflections of Pretensioned Beams; The University of Texas, Center for Transportation Research: Austin, TX, USA, 1987. [Google Scholar]
- Zou, X.W. Long-term deflection and cracking behavior of concrete beams prestressed with carbon fiber-reinforced polymer tendons. J. Compos. Constr. 2003, 7, 187–193. [Google Scholar] [CrossRef]
- PCI Design Handbook. In Precast and Prestressed Concrete, 8th ed.; Precast/Prestressed Concrete Institute: Chicago, IL, USA, 2021.
- ACI Committee 318. Building Code Requirements for Structural Concrete (ACI 318-25) and Commentary; American Concrete Institute: Farmington Hills, MI, USA, 2025. [Google Scholar]
- Mostafaei, H.; Ashoori Barmchi, M.; Bahmani, H. Seismic Resilience and Sustainability: A Comparative Analysis of Steel and Reinforced Structures. Buildings 2025, 15, 1613. [Google Scholar] [CrossRef]
- Zhu, W.; Teng, W.; Liu, F.; Wu, D.; Wu, Y. Measurement of cable force through a fiber bragg grating-type thin rod vibration sensor and its application. Sensors 2022, 22, 8081. [Google Scholar] [CrossRef]
- Li, Y.Q. Short-term stiffness of prestressed concrete bending members. In Compilation of Background Materials on the 1985 Design Code for Reinforced Concrete Structures; Bai, S.X., Huang, C.R., Eds.; China Academy of Building Research: Beijing, China, 1985; pp. 201–204. [Google Scholar]
- Liao, X.D.; Ma, X.X.; Li, X.; Chen, Y.L. Study on structural performance test of prestressed concrete double tee slab. J. Build. Struct. 2019, 49, 80–87. (In Chinese) [Google Scholar]
- Li, X.; Li, S.Y.; Li, B.; Ma, X.F.; He, X.Y. Experimental study on structural performance of prestressed double T slab. In Proceedings of the Industrial Architecture 2018 National Academic Annual Conference Papers (Volume II), Shanghai, China, 20 June 2018. (In Chinese). [Google Scholar]
- Lu, J.F.; Sun, Z.Q.; Qiu, Y.; Li, Z.W.; Zhou, Z.W.; Huang, C.J. Experimental research on mechanics of long span and heavy-load prestressed concrete double-tees. Ind. Constr. 2020, 50, 62–67. (In Chinese) [Google Scholar]
Disclaimer/Publisher’s Note: The statements, opinions and data contained in all publications are solely those of the individual author(s) and contributor(s) and not of MDPI and/or the editor(s). MDPI and/or the editor(s) disclaim responsibility for any injury to people or property resulting from any ideas, methods, instructions or products referred to in the content. |
© 2025 by the authors. Licensee MDPI, Basel, Switzerland. This article is an open access article distributed under the terms and conditions of the Creative Commons Attribution (CC BY) license (https://creativecommons.org/licenses/by/4.0/).