1. Introduction
Fiber-reinforced polymer (FRP) composites have emerged as valuable alternatives to conventional steel reinforcement in concrete structures due to their superior properties, including high strength-to-weight ratio, corrosion resistance, and electromagnetic neutrality [
1,
2,
3]. Among various FRP types, glass fiber-reinforced polymer (GFRP) reinforcement has gained particular prominence for its cost-effectiveness while maintaining suitable mechanical characteristics [
4]. These materials are increasingly adopted in infrastructure exposed to aggressive environments where steel corrosion poses significant durability concerns [
5,
6].
The structural integrity of GFRP-reinforced concrete fundamentally depends on the bond interface between these materials, which governs stress transfer efficiency, load-bearing capacity, and crack control [
7,
8,
9]. Unlike steel reinforcement, FRP bars develop bond, through a complex interplay of chemical adhesion, friction, and mechanical interlocking, with their relative contributions varying based on surface configuration [
9,
10]. This complexity necessitates a comprehensive understanding of GFRP-concrete bond behavior for reliable structural design.
The bond strength at the FRP-concrete interface arises from three primary mechanisms: chemical adhesion, friction, and mechanical interlocking, with their relative contributions varying based on bar surface configuration [
11,
12,
13]. Extensive research has been conducted on the bond performance between GFRP reinforcement and concrete, identifying several key factors affecting bond behavior: reinforcement surface texture, bar diameter, embedment length, and concrete strength [
14,
15,
16,
17,
18,
19,
20]. Yan et al. [
9] provided a comprehensive review highlighting that GFRP bars with ribbed or sand-coated surfaces exhibit significantly superior bond performance compared to smooth bars due to enhanced mechanical interlocking and frictional resistance. However, bond strength typically decreases with increasing bar diameter and anchorage length, primarily attributed to non-uniform stress distribution along the anchorage zone. Fahmy et al. [
10] and Al-Mahmoud et al. [
13] further demonstrated that surface treatment significantly influences both bond strength and failure mechanisms.
In unconstrained specimens, failure typically occurs either through bar pull-out or concrete cover splitting, the latter representing a brittle failure mode that should be avoided in structural applications. Transverse stirrup reinforcement provides an effective solution for suppressing concrete splitting while enhancing bond strength and structural ductility [
19,
21]. These stirrups create passive confinement around the FRP reinforcement, restricting radial crack propagation, thereby improving bond capacity and potentially transforming the failure mechanism from brittle splitting to more ductile pull-out behavior [
22,
23].
While the effect of confinement on steel reinforcement bond behavior has been well documented, its influence on FRP reinforcement remains incompletely understood. Harajli [
24,
25] investigated the effect of confinement using steel, FRC, or FRP on the bond stress-slip response under cyclic loading, noting significant differences in performance compared to unconfined conditions. Hu et al. [
26] demonstrated that stirrups can enhance both ultimate and residual bond strength between GFRP reinforcement and concrete, though their experimental methodology employed central pull-out specimens that may not fully represent the complex stress fields present in actual beam elements.
Most existing studies on GFRP-concrete bonds have utilized direct pull-out tests, which produce stress states different from those in actual structural elements [
9,
15]. Beam test methods have been recognized as more reliable for simulating bond behavior in real structures [
27,
28,
29,
30]. Additionally, the performance of GFRP-concrete bond under cyclic and seismic loading represents a critical consideration for practical applications [
31,
32]. Research indicates significant bond strength degradation under cyclic loading compared to monotonic conditions [
33,
34], with important implications for GFRP applications in seismic regions.
Current design guidelines, such as ACI 440.1R-06 [
3], provide empirical equations for estimating FRP-concrete bond strength based primarily on monotonic test data with limited consideration of confinement effects. Evaluations of these guidelines reveal limitations in their applicability across different loading conditions and confinement scenarios [
35,
36]. Despite significant research progress, knowledge gaps remain regarding the interaction between confinement effects and loading conditions, particularly concerning stirrup confinement in experimental designs that reflect actual structural configuration [
37,
38,
39,
40].
Beyond conventional cast-in-place concrete, recent advances in rheology-guided 3D concrete printing [
41] highlight how processing-induced microstructures may alter interfacial bond and crack development, which is relevant to FRP, concrete interaction in practice. Additionally, microstructural modifications (e.g., nano-SiO
2 and phase-change microcapsules [
42]) that refine pore structure and enhance frost resistance could potentially influence bond durability and residual bond capacity under environmental exposures. Finally, studies on confined composite members (e.g., concrete-filled steel tubes [
43]) further substantiate the pivotal role of confinement in transforming failure modes and enhancing post-peak resistance, consistent with the confinement-driven mode shift observed in this work. Recent advances in the experimental investigation and modeling of reinforced concrete have contributed greatly to our understanding of bond behavior and structural performance. For example, studies using finite element, deep learning, and analytical methods have achieved significant progress in predicting bond stress–slip relationships for steel reinforcement under various loading conditions [
44]. Reliability-based approaches to evaluating flexural strength in concrete beams with hybrid steel and FRP reinforcement have clarified important design considerations [
45]. Other investigations have addressed axial performance of confined UHPC columns [
46], performance of strengthened predamaged columns under complex loading [
47], and bond performance of FRP reinforcement in marine concretes such as sea sand coral concrete [
48]. Collectively, these contributions provide valuable context for the evolving field of bond and composite action in advanced concrete structures.
To address these research gaps, this study presents a comprehensive experimental investigation on the bond performance between GFRP bars and concrete with varying levels of stirrup confinement using beam test specimens that better simulate actual structural behavior. The experimental program examines 28 GFRP-concrete specimens to systematically investigate how stirrup confinement affects bond performance across multiple influential factors, including concrete strength, cover thickness, GFRP surface configuration, bar diameter, and bond length. The test results provide valuable insights into the fundamental mechanisms governing the bond behavior of GFRP bars in confined concrete.
2. Experimental Program
2.1. Test Specimens
Given that beam test methodology provides the closest approximation to bond stress conditions in actual structures, this study implemented an experimental protocol based on Lin’s [
8] research design, comprising a total of 28 test specimens. Detailed specimen parameters are presented in
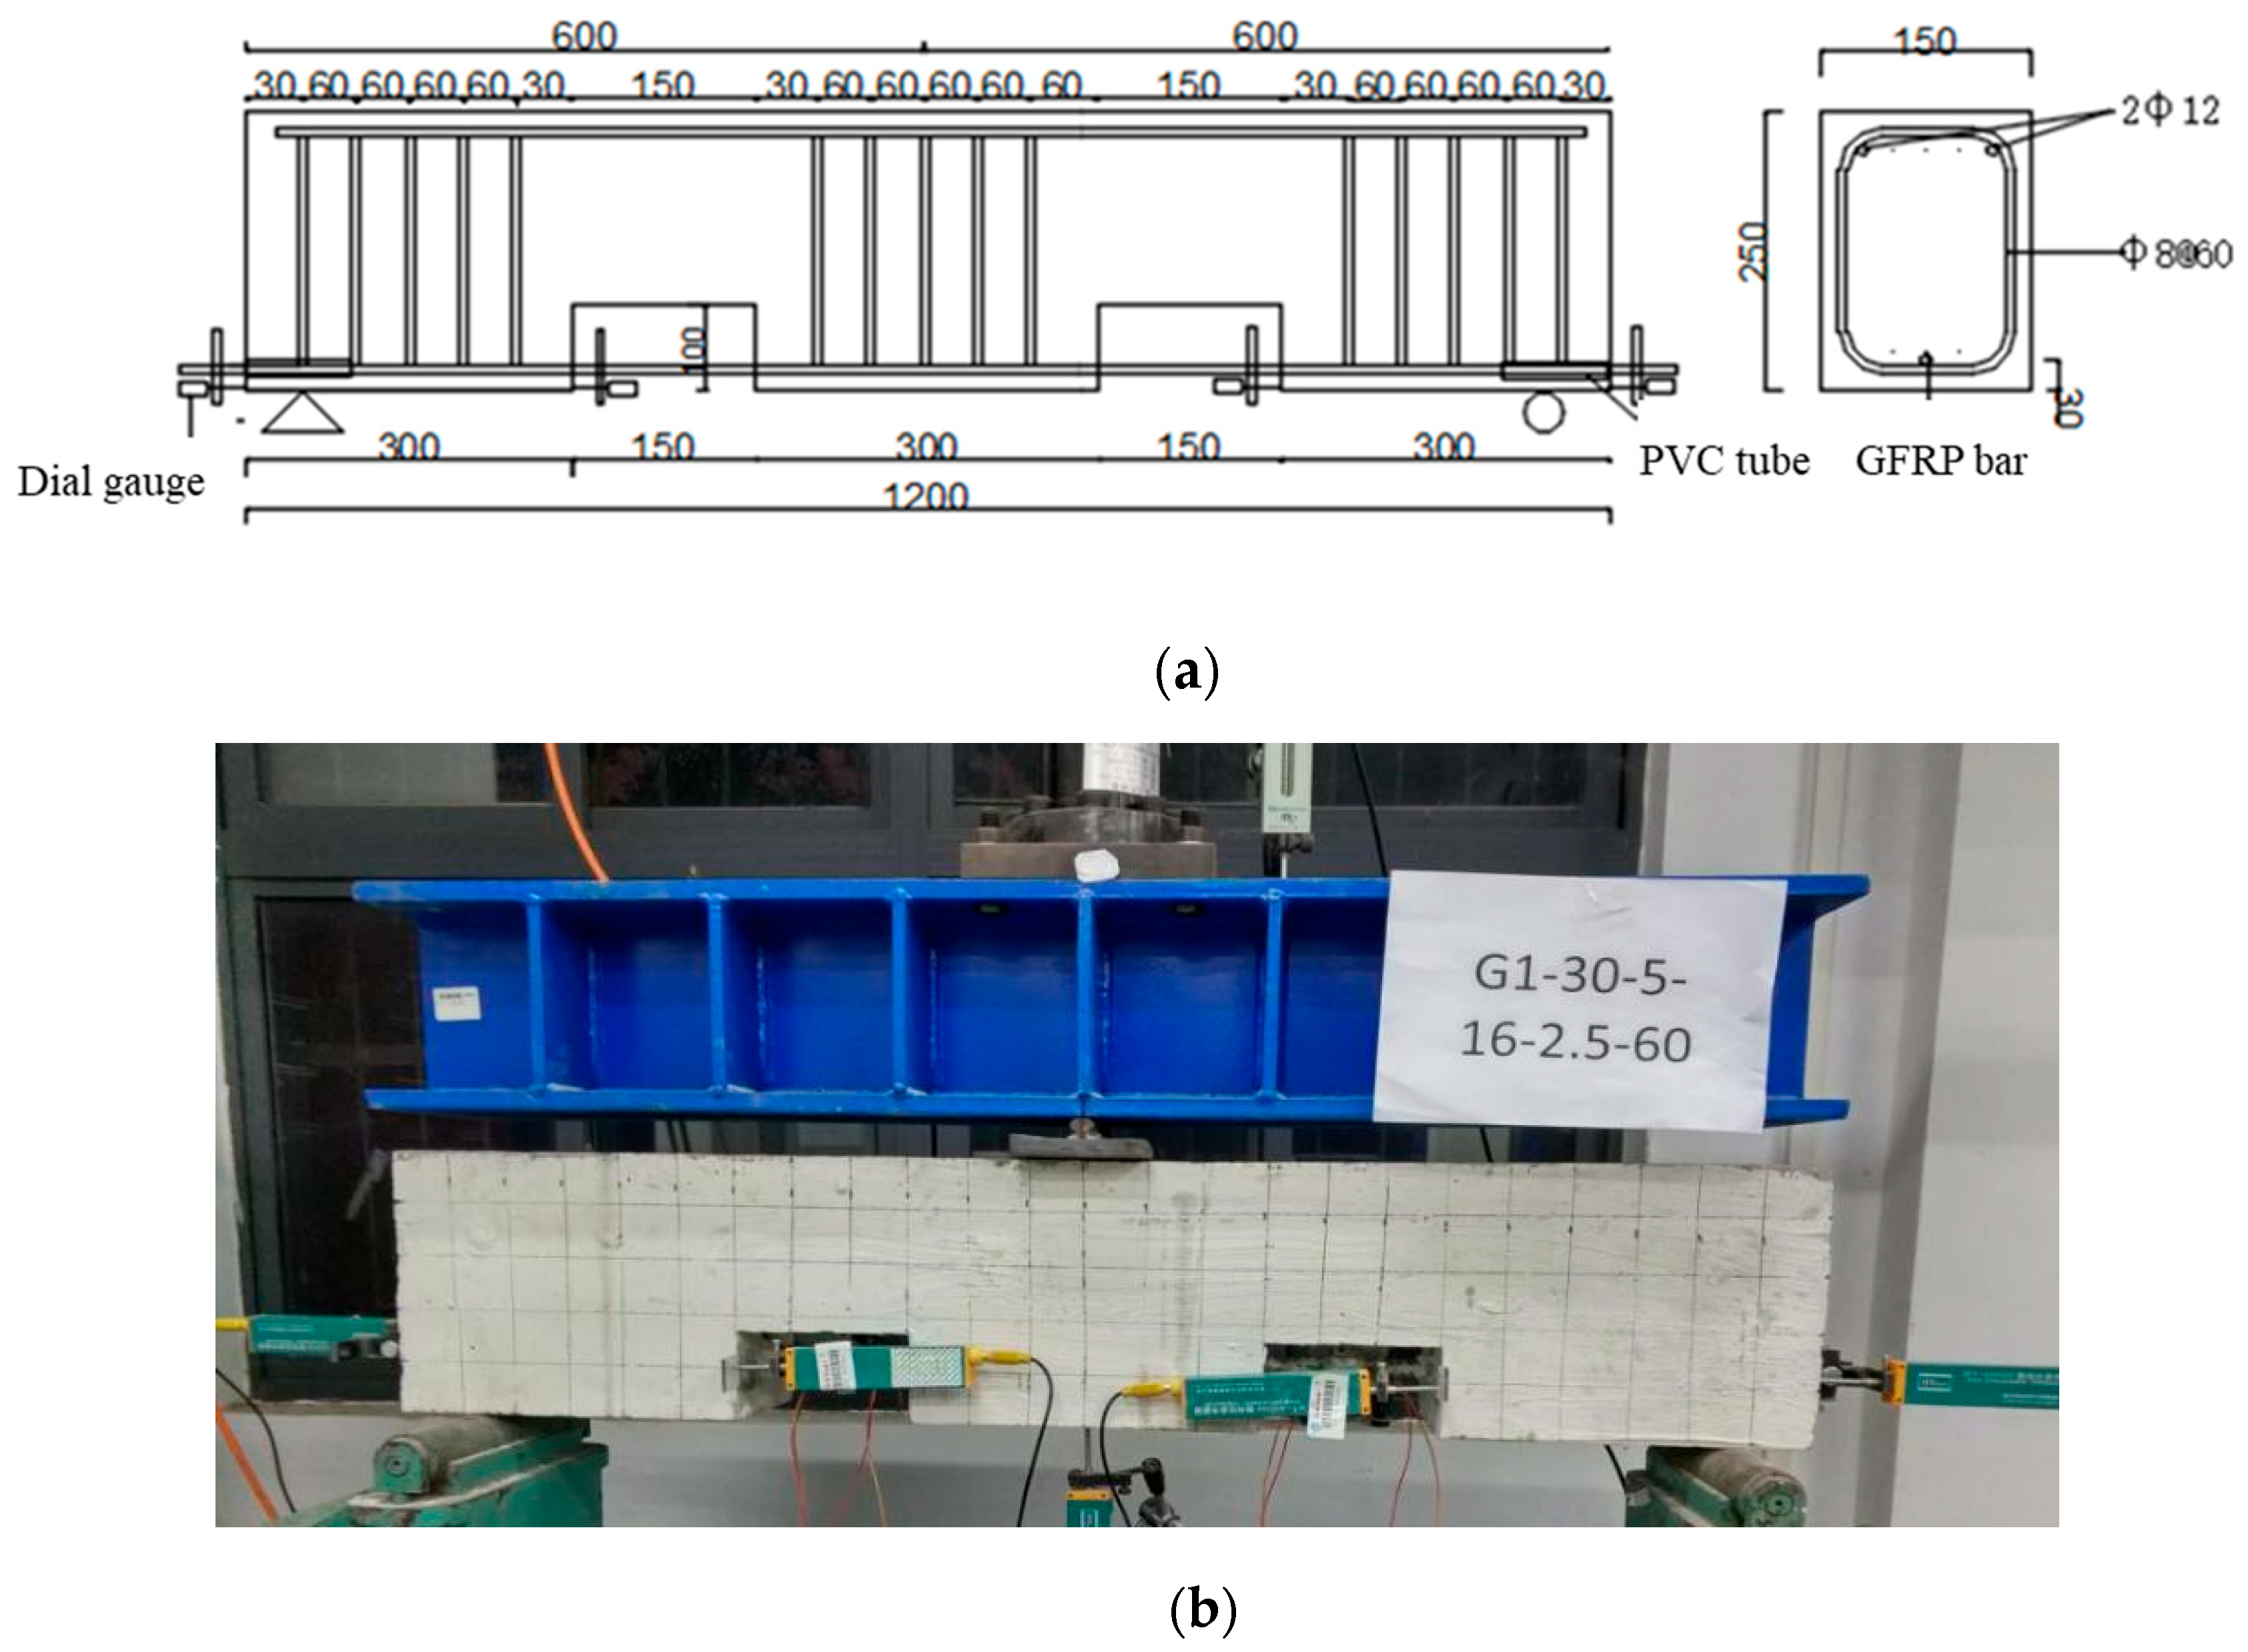
Table 1, with comprehensive dimensional specifications illustrated in
Figure 1.
The specimen identification system employs the following nomenclature: G1 and G2 designate ribbed and sand-coated surface configurations, respectively; 30 and 50 represent concrete strength grades C30 and C50; 5 and 10 indicate embedment lengths of 5d and 10d (where d is the bar diameter); 16 and 20 denote GFRP bar diameters of 16mm and 20 mm; 1.5 and 2.5 signify concrete cover thicknesses of 1.5d and 2.5d; finally, 0 indicates absence of transverse stirrups, while 60, 80, and 120 represent stirrup spacing in millimeters. The experimental program was designed to systematically investigate the primary influence of each parameter while limiting interactions. Given the available resources, one parameter at a time was varied individually (e.g., stirrup spacing, concrete strength, cover thickness, bar diameter, bar type, and embedment length), with all other parameters held constant at reference values. This method allows for direct comparison within each variable group, enabling the isolation of main effects. However, this one-factor-at-a-time strategy does not account for possible interactions between variables. For example, simultaneous changes to concrete strength and cover thickness or bar diameter may produce non-additive effects that are not directly captured in this matrix. While a formal Design of Experiments (DoE) would provide a more comprehensive assessment of such interactions, the limited number of specimens in this study necessitated a more pragmatic approach. Future research with larger specimen sets and a DoE framework is recommended to further investigate and quantify parameter interactions.
The specimens were fabricated using wooden formwork, with notches incorporated on both beam sides to facilitate measurement of reinforcement strain and relative displacement between the GFRP bars and surrounding concrete. To eliminate the influence of support reactions and ensure uniform bond stress distribution while enabling variable embedment lengths, plastic tubes were installed at both ends of the contact zone between the FRP reinforcement and concrete. Prior to concrete placement, these tubes were carefully sealed at both ends using double-sided adhesive tape to prevent concrete infiltration. Additionally, a thin layer of lubricating oil was applied to the interior surfaces of the wooden formwork to facilitate subsequent demolding operations.
During the casting process, quality control specimens, comprising two 150 mm cubic samples and two cylindrical specimens, were prepared from each concrete batch to determine the corresponding compressive strength. Following concrete placement, the specimens were immediately covered with plastic film to maintain optimal moisture conditions, with formwork removal and subsequent curing procedures initiated after 24 h.
To safeguard against potential damage to displacement measuring instrumentation due to sudden large-scale slippage during loading, preparatory holes were drilled through the exposed portions of GFRP reinforcement at the beam ends before testing commenced. This precautionary measure ensured that when bond failure accompanied by significant cracking occurred at one end, the installed pins would prevent rapid extraction of the GFRP reinforcement, thereby protecting the measurement apparatus while allowing the test to continue in a controlled manner.
2.2. Material Properties
2.2.1. Concrete
To investigate the influence of concrete compressive strength on bond performance, this experimental program incorporated two distinct concrete strength grades: C30 and C50. The concrete mix proportions were designed in accordance with the “Code for Design of Mix Proportion of Ordinary Concrete” (JGJ 55-2011) [
49]. For all mixes, P.O42.5 Portland cement was supplied by CNBM Tianshan Cement Co., Ltd., Urumqi, China (Batch No. 2024-05-18), conforming to GB 175-2023, which was utilized as the binder, medium sand as the fine aggregate, and 5–20 mm gravel as the coarse aggregate. An aliphatic high-efficiency superplasticizer was employed to achieve the desired workability. The detailed mix proportions for both concrete grades are presented in
Table 2.
To ensure rigorous quality control throughout the experimental program, each concrete batch was sampled to produce 150 mm × 300 mm cylindrical specimens. All specimens were subjected to identical curing conditions for a standard 28-day period.
Compressive strength testing was conducted using conventional compression testing equipment. The average compressive strengths of the C30 and C50 cubic specimens, after appropriate conversion, were determined to be 33.6 MPa and 47.6 MPa, respectively. Similarly, the average compressive strengths of the cylindrical specimens were calculated as 31.3 MPa and 46.5 MPa for the C30 and C50 mixes, respectively. These strength values confirmed that the concrete mixtures achieved their target strength classifications and provided a sound basis for the subsequent bond performance evaluations [
50].
2.2.2. Reinforcement Materials
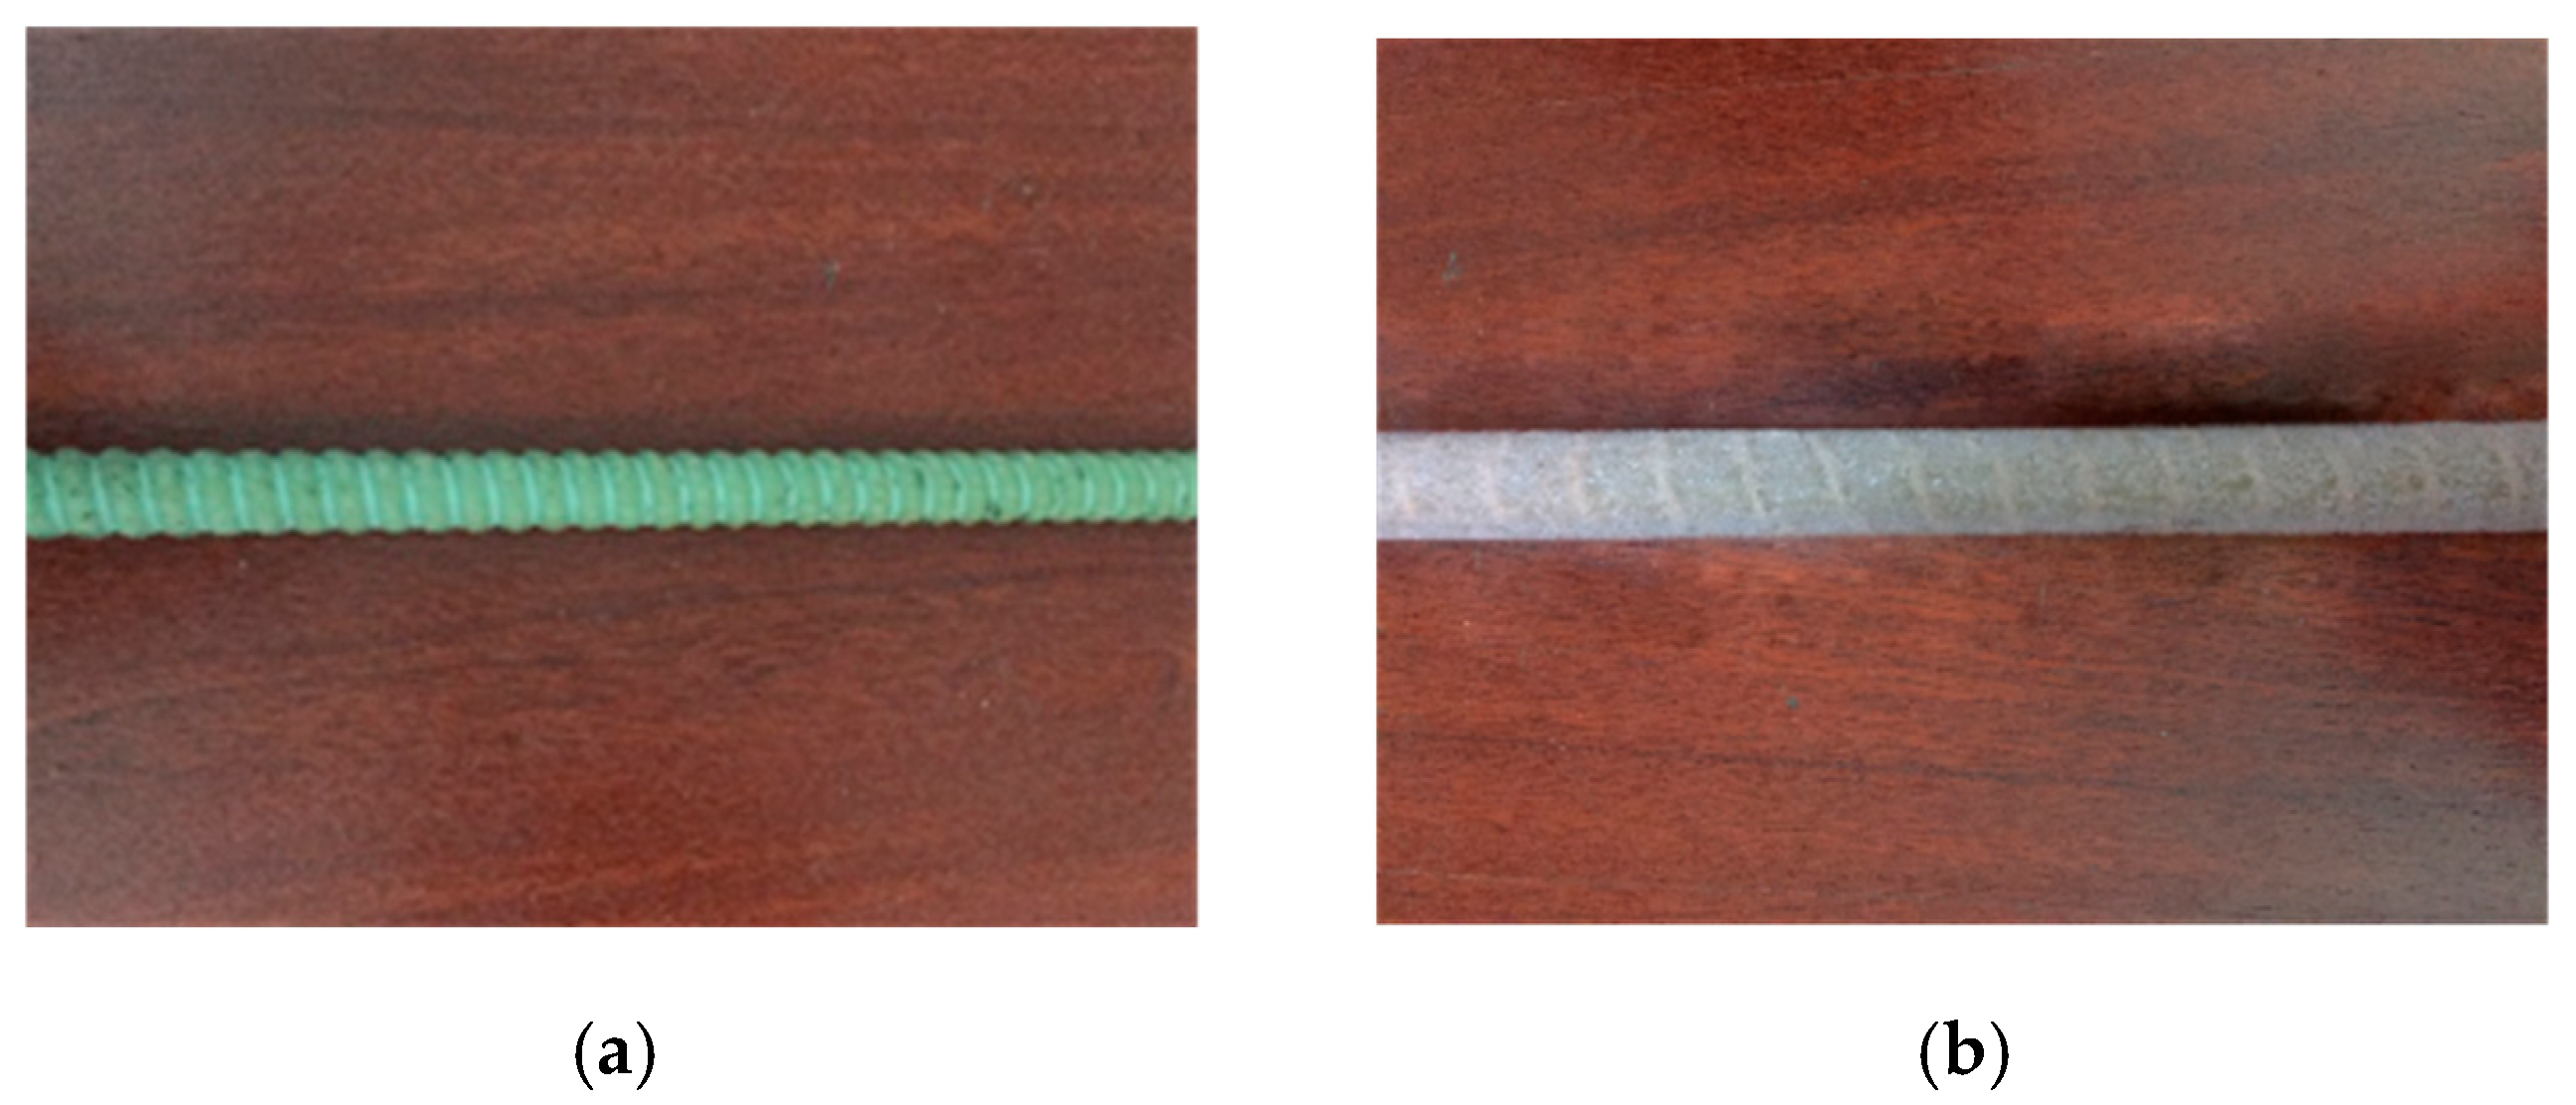
The GFRP reinforcement used in this experimental investigation was manufactured at the laboratory of Southeast University. These bars exhibited an ultimate tensile strength of 1100 MPa and an elastic modulus of 46 GPa. Two different bar diameters were employed: 16 mm and 20 mm, each featuring one of two distinct surface configurations, sand-coating or ribbed, as shown in
Figure 2.
As illustrated in
Figure 2, the two surface treatments present contrasting characteristics: the ribbed GFRP bars feature more pronounced rib heights but relatively smooth surface texture between the ribs, while the sand-coated GFRP bars have lower profile deformations but a consistently rougher surface texture throughout due to the embedded sand particles. For the transverse reinforcement in the test specimens, plain round steel bars were utilized. The stirrups were fabricated from 8 mm diameter bars, while 12 mm diameter bars were used for the vertical support reinforcement. These steel bars possessed a yield strength of 235 MPa and an elastic modulus of 200 GPa.
2.3. Test Setup and Instrumentation
The experimental testing was conducted using a 500 kN hydraulic servo testing machine under centralized loading conditions, which is a modified beam test according to RILEM standard [
51,
52]. This hydraulic servo testing machine (Model: YAW-5000) was supplied by Jinan Time-Shijin Testing Machine Co., Ltd., Jinan, China. The system was operated with TestForce v4.2 and calibrated on 2024-06-15 by CNAS-accredited Lab. A displacement-controlled loading protocol was implemented at a rate of 0.5 mm/min. The test was terminated when either the reinforcement load decreased to 50% of its peak value or the relative displacement reached 10 mm. During the testing procedure, displacement transducers were affixed to the exposed GFRP reinforcement at both beam ends, with their measuring probes positioned in direct contact with the concrete surface. Additionally, displacement gauges were installed within the notched sections of the beam. To protect these sensitive instruments from potential damage caused by concrete spalling during the loading process, glass plates were carefully attached within the beam notches, and the displacement gauge probes were positioned to contact these glass surfaces, as illustrated in
Figure 3. Throughout the entire loading sequence, comprehensive data acquisition was performed using an IMC data acquisition system. This system continuously recorded all relevant parameters, including load values and free-end slip measurements. The sampling frequency was set at 5 Hz for both displacement/load values and strain gauge readings, ensuring detailed capture of the specimen response during all stages of testing.
3. Experimental Results
3.1. Failure Mode
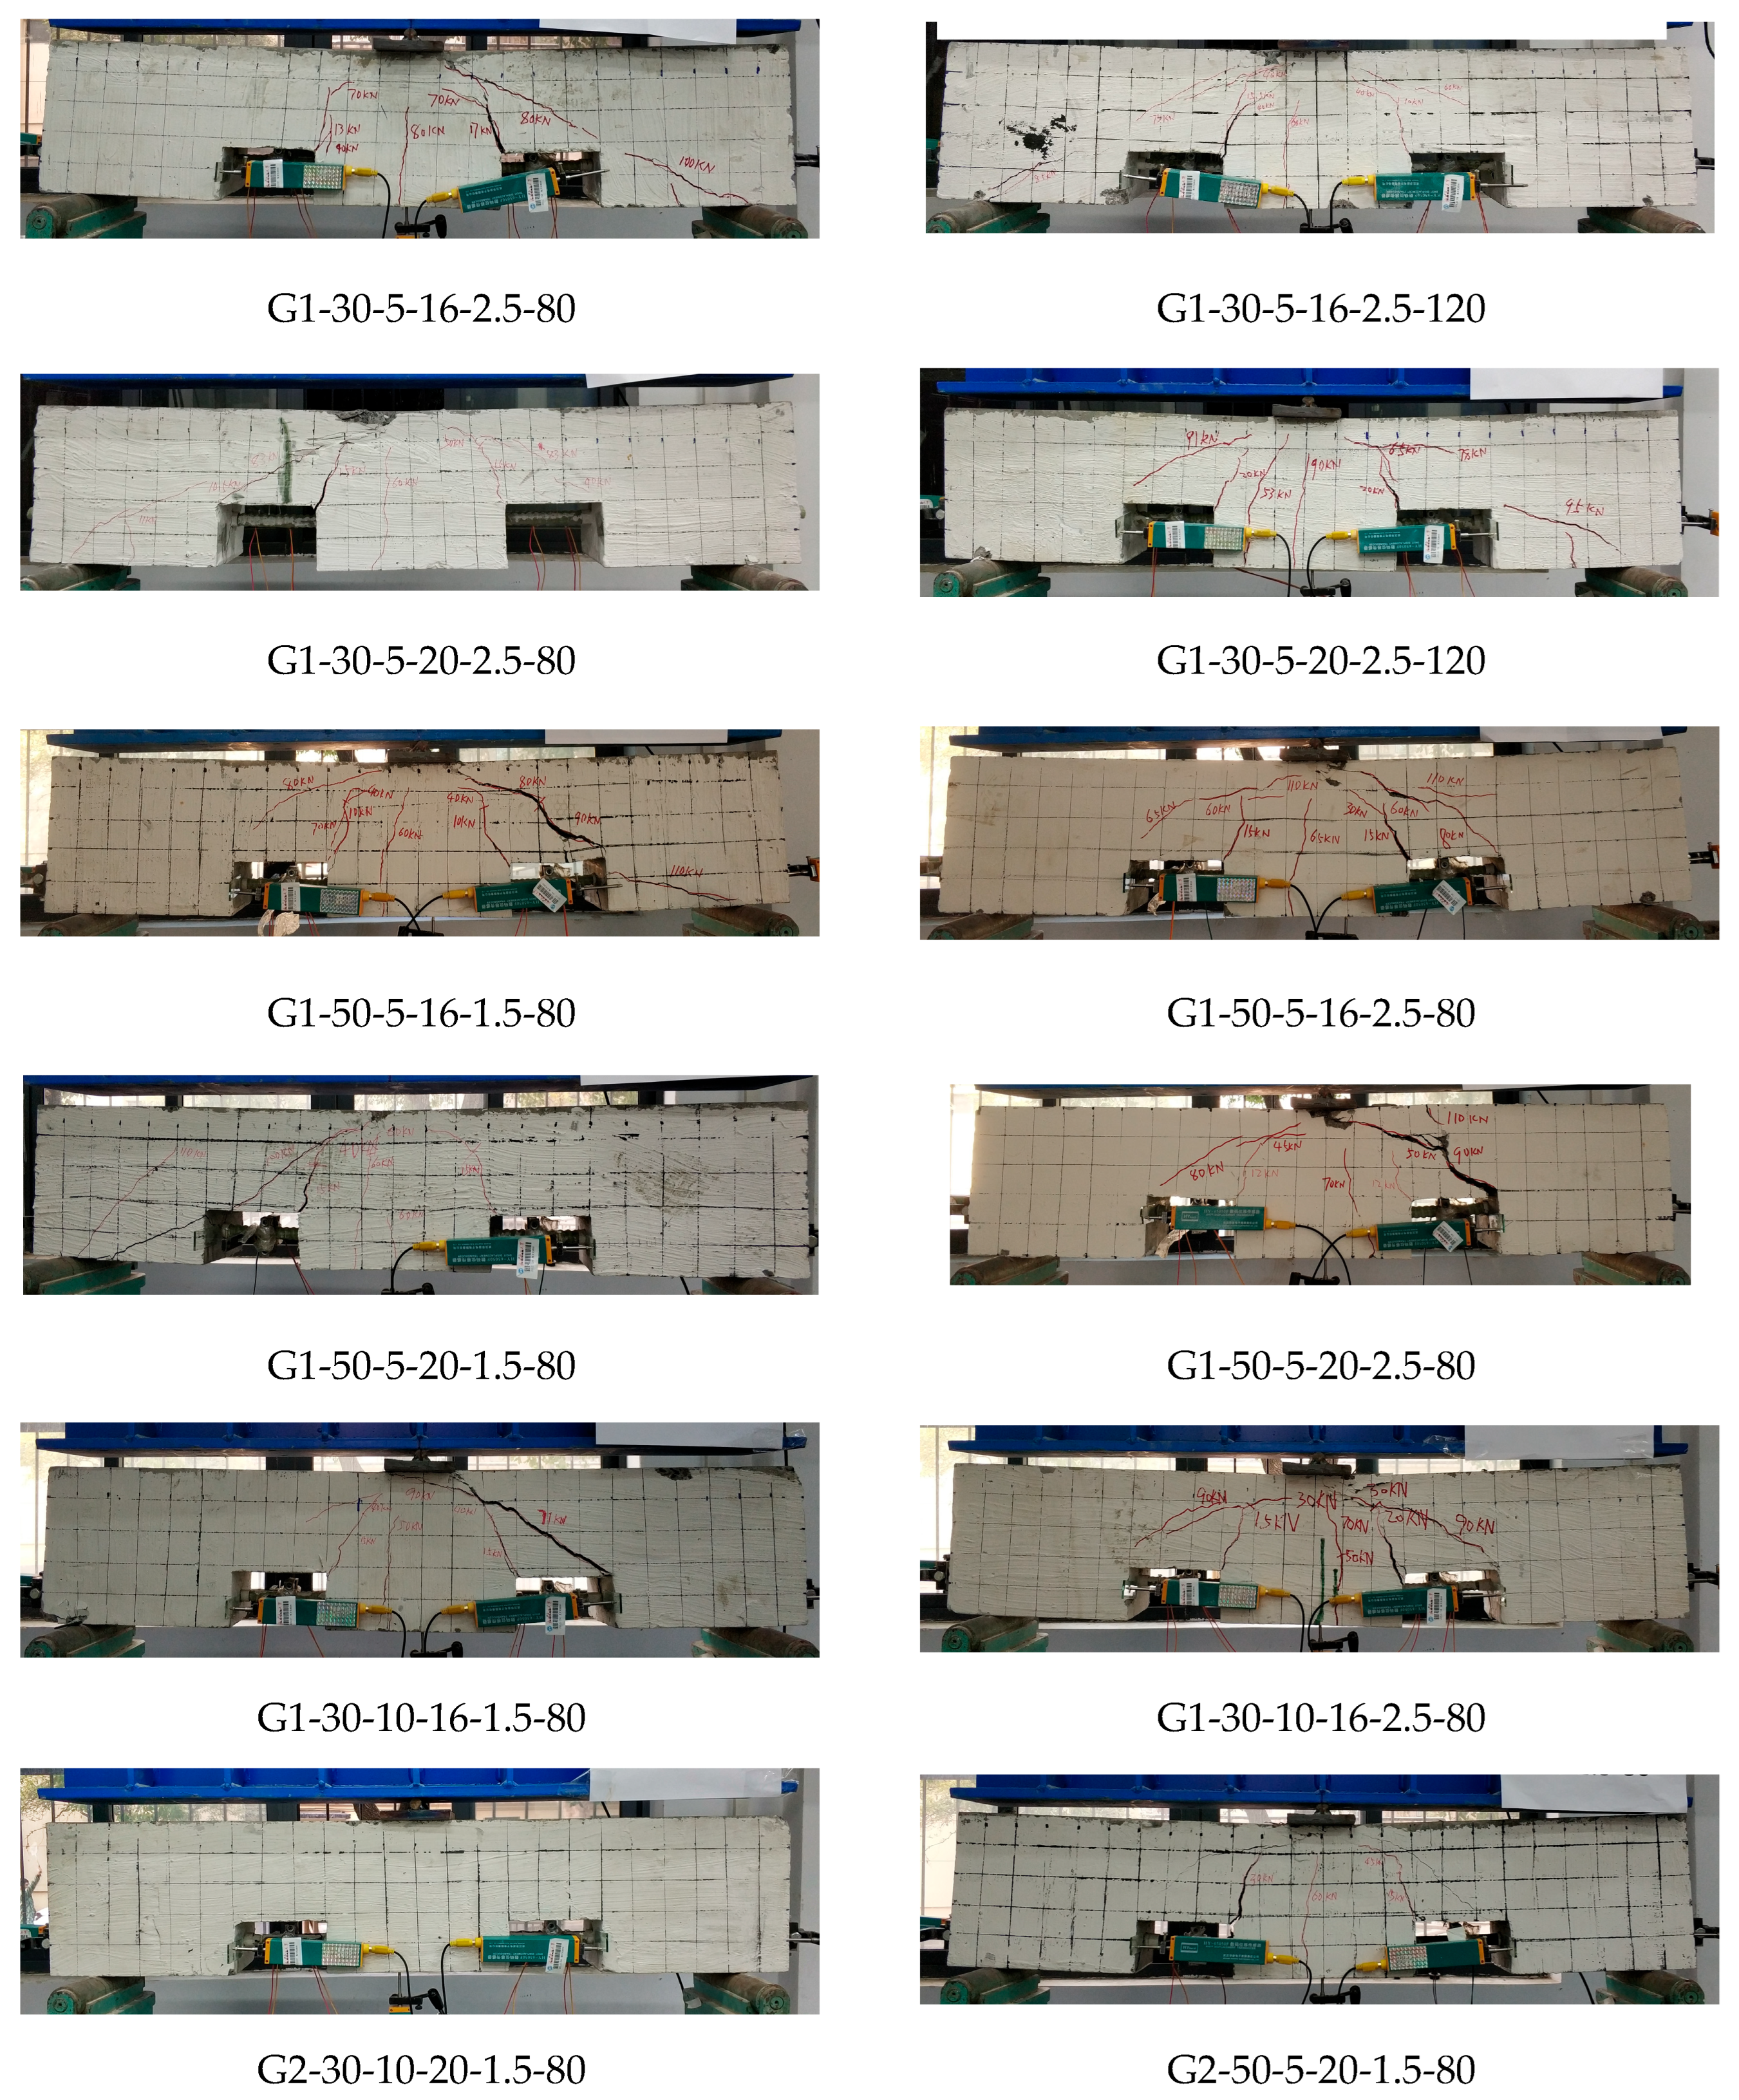
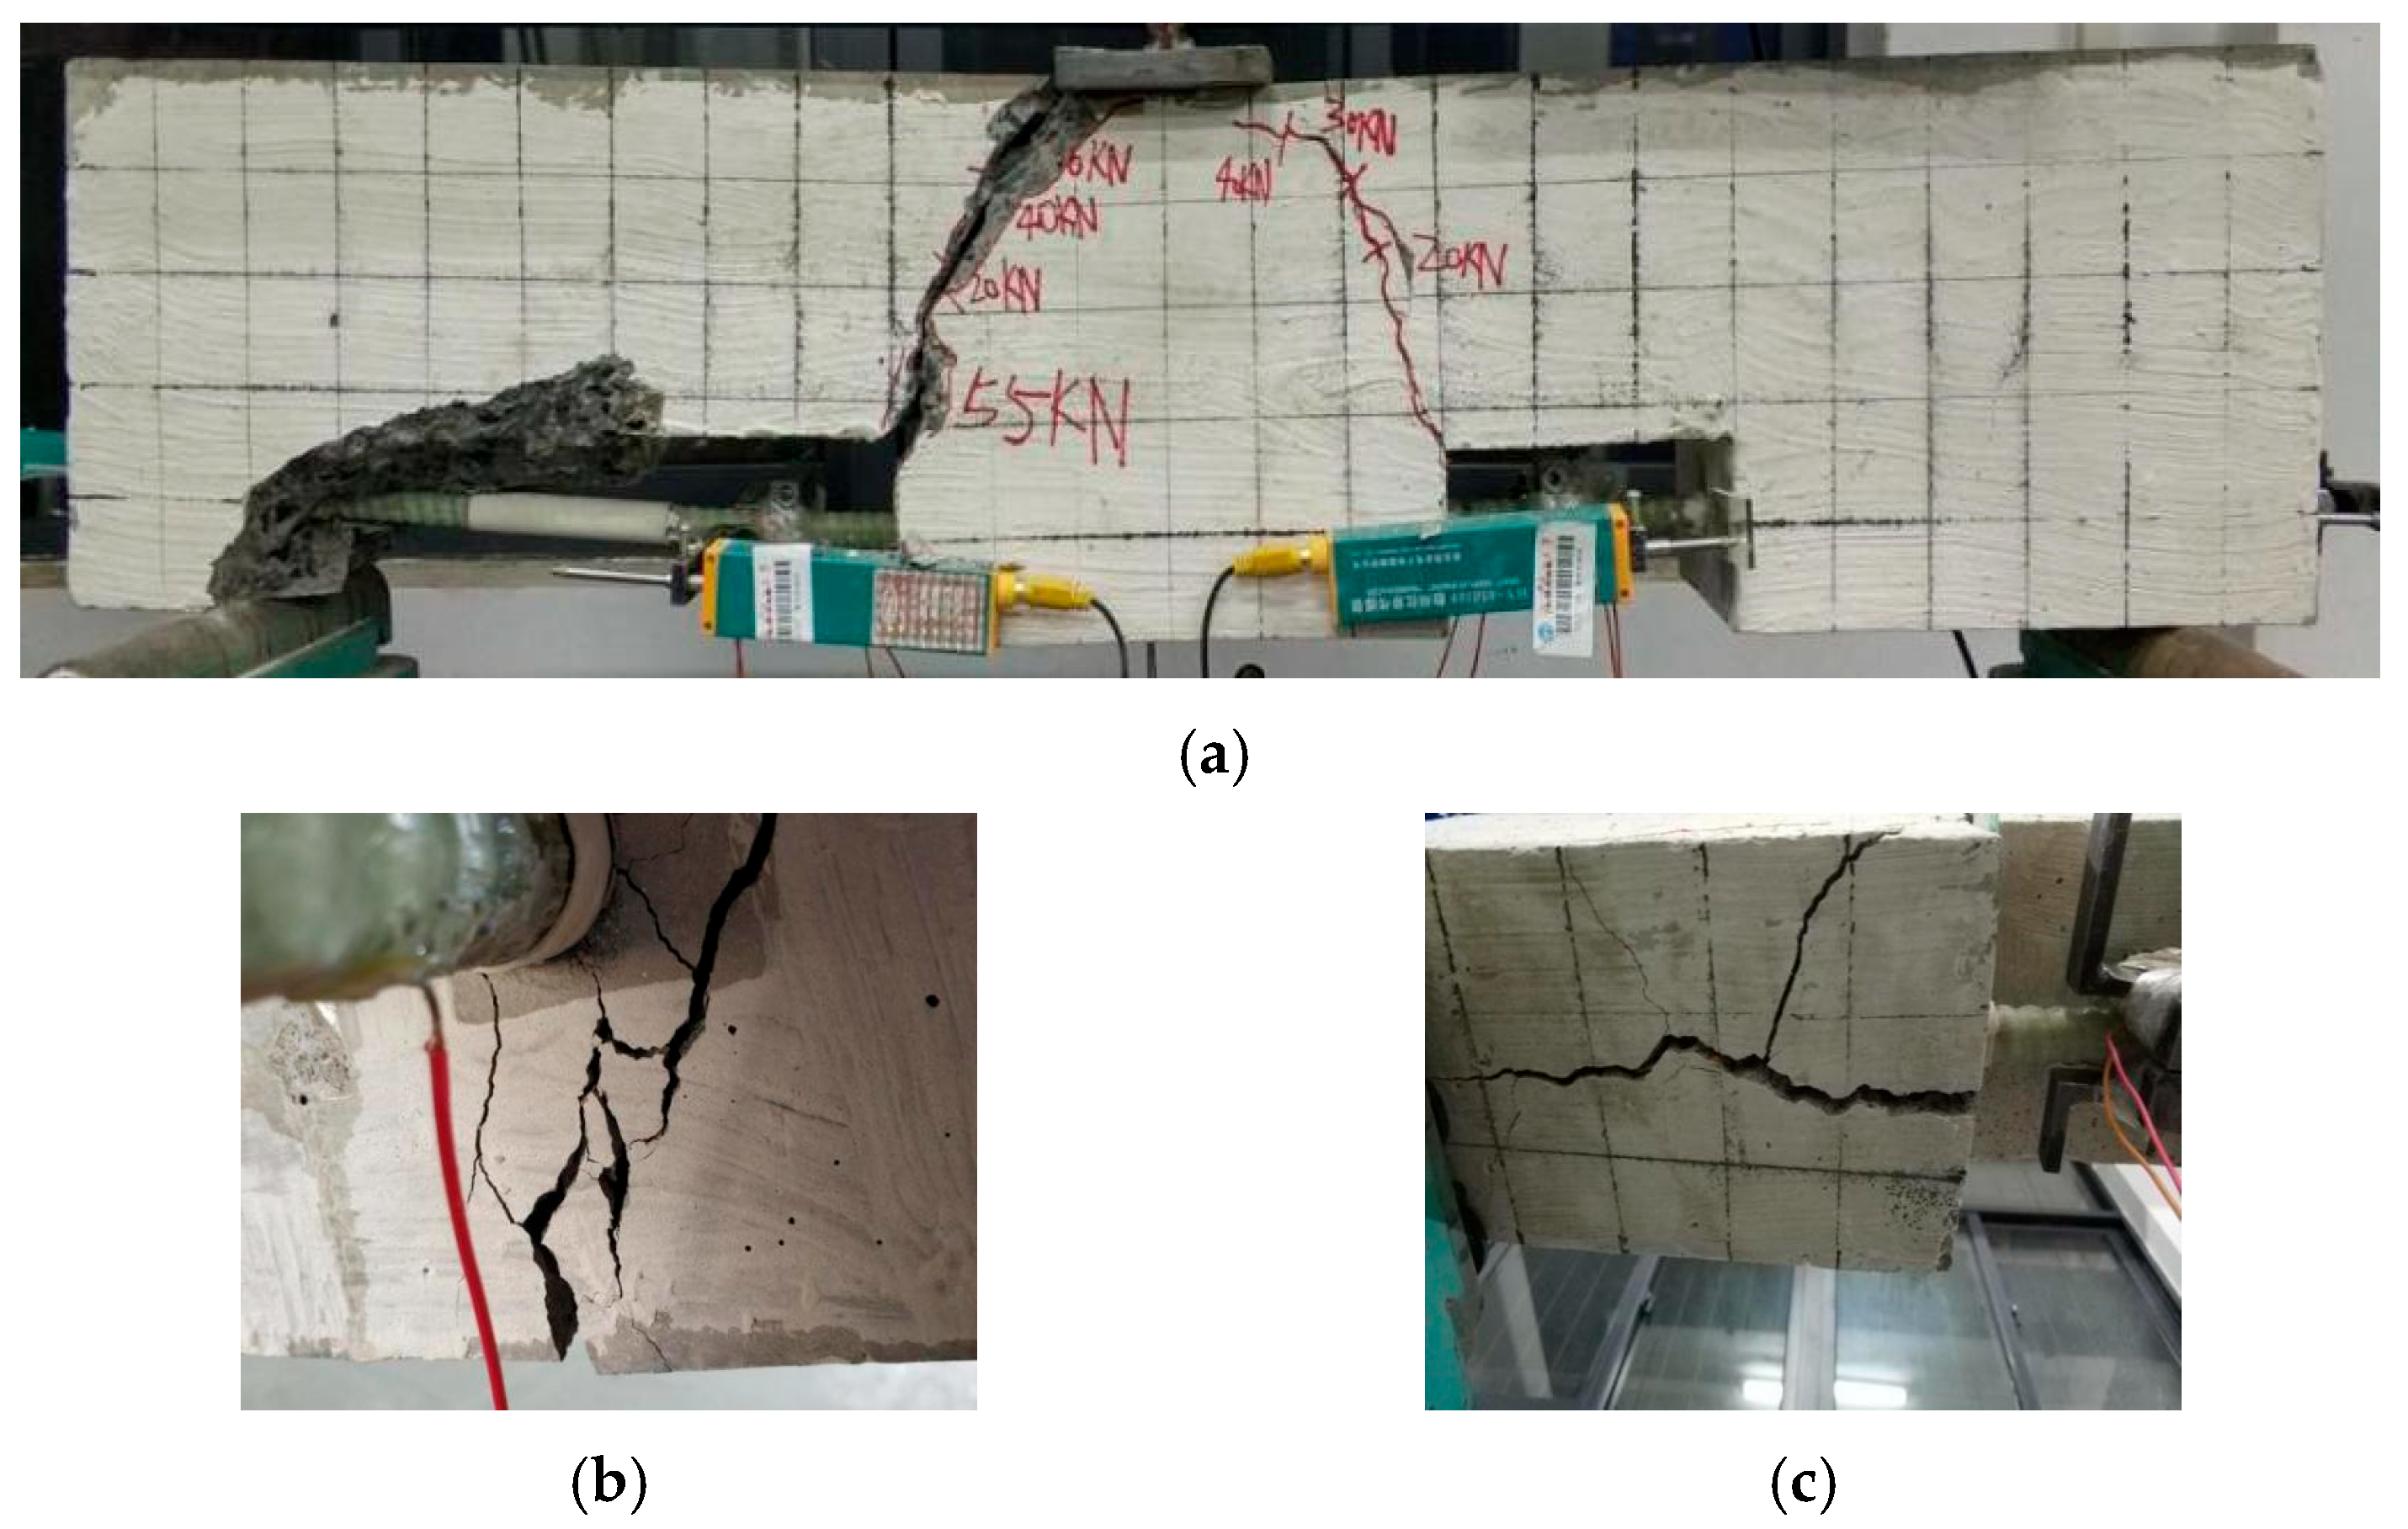
Figure 4 shows the failure models of typical beam specimens. Based on comprehensive observations throughout the loading process, the specimen failure progression can be characterized by three distinct stages:
Stage 1: Pre-cracking Phase
During this initial phase, prior to reaching the cracking load threshold, specimens exhibited no visible deformation or damage. The relative displacement measurements at both beam ends consistently registered zero, while GFRP reinforcement strain increased in a nearly linear manner with applied load. Comparative analysis across all specimens revealed a clear correlation between cracking load capacity and both volumetric stirrup ratio and concrete compressive strength, with higher values of these parameters corresponding to increased cracking resistance.
Stage 2: Initial Cracking phase
When loading reached approximately 7–15 kN, stress concentrations at the groove corners triggered the sequential formation of initial cracks at these locations. Following crack initiation, slight changes in relative displacement readings began to register at the specimen ends. As loading progressed, distinct behavioral differences emerged between specimens with and without transverse reinforcement:
In specimens without stirrups, the corner cracks progressively expanded and coalesced into two pronounced diagonal fracture planes.
In specimens with stirrups, although corner cracks similarly propagated, the reinforcement cage comprising vertical bars and stirrups effectively distributed shear forces throughout the specimen, resulting in more dispersed cracking patterns characterized by multiple diagonal and flexural cracks.
Concurrently, fine microcracking began to develop in the concrete surrounding the GFRP reinforcement, while the rate of strain increases in the GFRP bars gradually diminished.
Stage 3: Ultimate Failure phase
With continued load application, splitting cracks surrounding the GFRP reinforcement rapidly propagated toward the beam soffit. For specimens without stirrups, this culminated in concrete cover delamination and spalling. During this phase, displacement measurements increased dramatically while GFRP reinforcement strain exhibited a sudden decline.
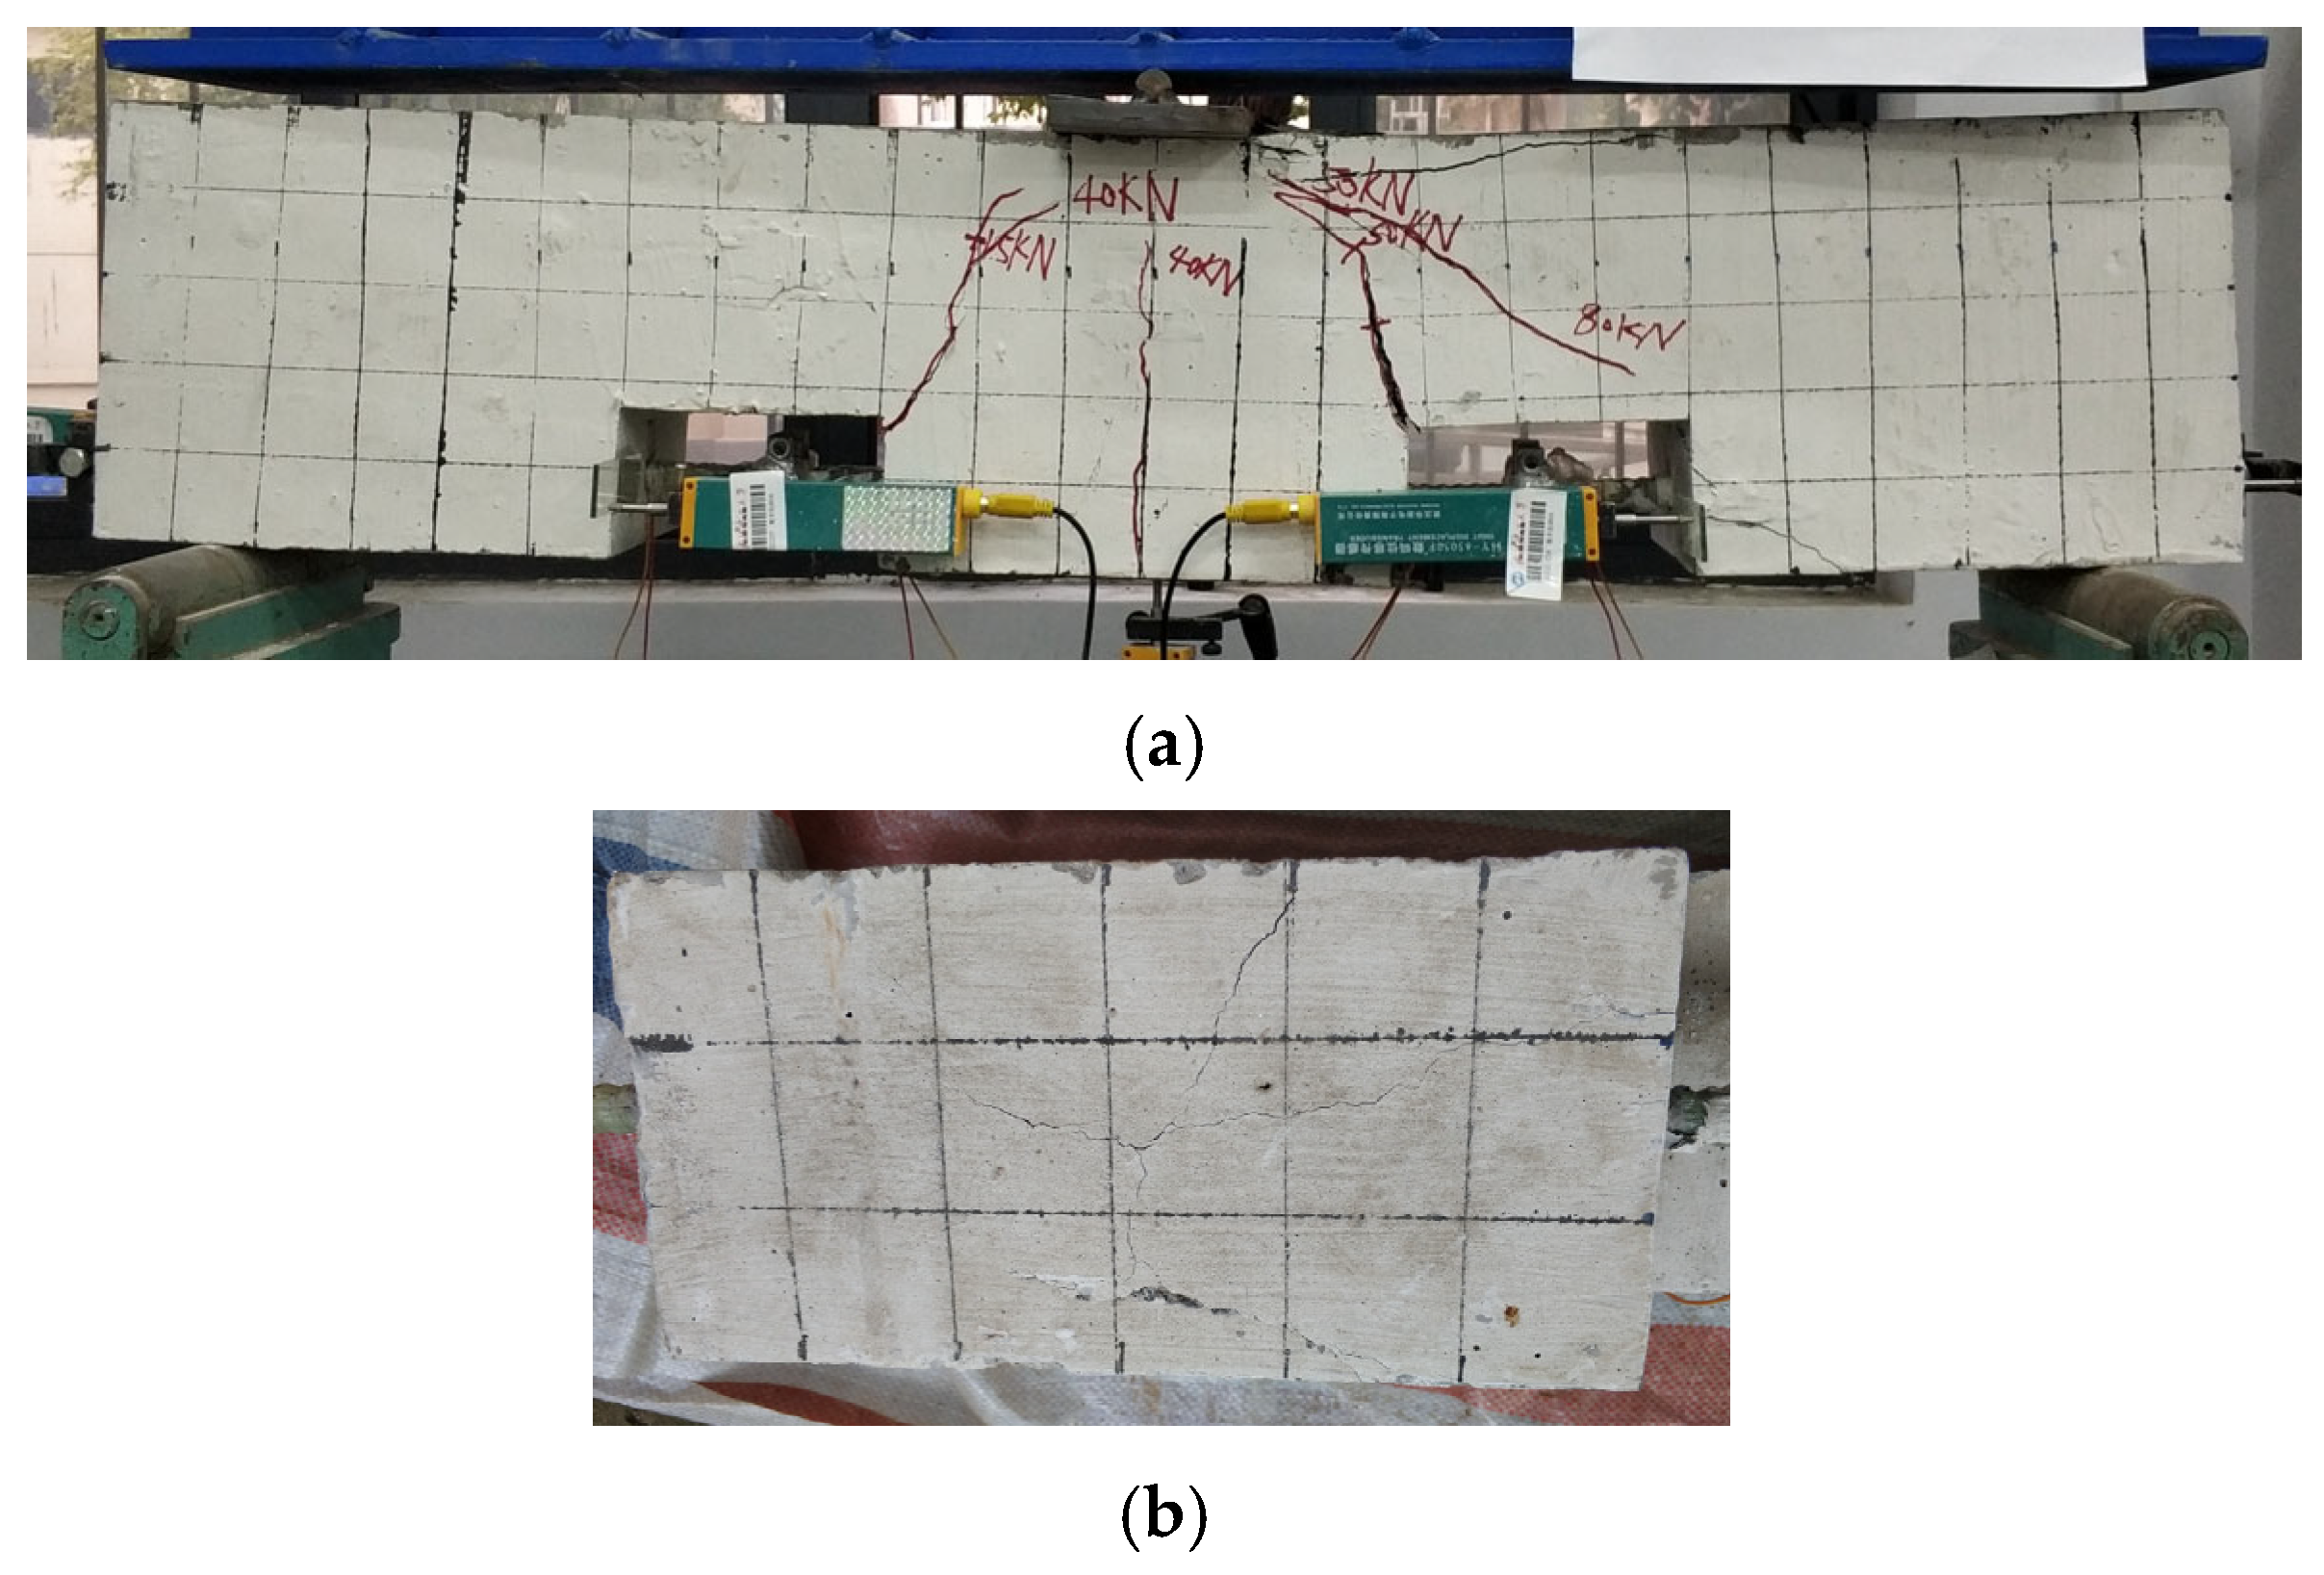
As shown in
Figure 5 and
Figure 6, compared to unreinforced specimens, those with transverse stirrups maintained substantial frictional and mechanical interlocking forces between concrete and GFRP reinforcement even after splitting cracks reached the beam soffit. This enhanced post-cracking performance can be attributed to the confinement effect provided by stirrups, which effectively restrained crack propagation. Notably, both the width of splitting cracks and their propagation rate demonstrated direct proportionality to stirrup spacing, with wider and more rapidly developing cracks occurring in specimens with greater stirrup spacing intervals. Similar to the standard pull-out test [
53], the beam-type bond specimens also experienced two typical failure modes: pull-out failure and concrete splitting failure, which depend on the confinement level provided by stirrups.
3.2. Bond Performance
Since the bonding stress between GFRP and concrete is nonlinear within the bonding length range, the maximum average bonding stress within the bonding length range of GFRP is taken as the bonding strength of GFRP-concrete interface. The calculation formula is as follows [
54]:
where
P denotes the pullout force calculated from the tensile strain measured by strain gauges;
means the average bond stress between GFRP reinforcement and concrete;
indicates the diameter of GFRP reinforcement;
is the bond length.
The test results of 28 beam-type bond specimens in the test are summarized in
Table 3. Specifically, this study identifies the relatively plateau residual stage that appears after the first peak and the subsequent falling segment in the
curve, and a representative point
within this residual stage is then determined to quantify the residual bond strength.
As shown in
Table 3, the majority of specimens failed by splitting, which is consistent with the typical response of reinforced concrete elements with relatively small concrete covers and moderate degrees of confinement. However, a few specimens exhibited pull-out failures. Pull-out failures generally occur when the concrete surrounding the reinforcement is sufficiently robust to prevent longitudinal splitting, thus enabling the bar to debond and slip through the surrounding matrix. In our test series, the specimens that experienced pull-out failure predominantly had a larger concrete cover relative to the bar diameter, which increased the resistance to crack propagation along the splitting plane. Additionally, in specimens with enhanced transverse reinforcement or when using sand-coated bars (which generate less splitting stress concentration), the tendency for splitting is further reduced, thereby making pull-out the more likely failure mode. These factors shifted the failure mode from splitting to pull-out. Therefore, the governing factor for the observed pull-out failures appears to be the combined effect of larger concrete cover and/or enhanced confinement, which restrains splitting and allows bond deterioration along the bar-concrete interface to become the critical mechanism.
It should be noted that, except for stirrup spacing (for which three values were tested), each parameter in the current parametric study was investigated at only two discrete levels. This approach provides initial insight into the parameter effects but limits the ability to establish comprehensive trends or identify potential nonlinear behavior. The two values for each parameter (e.g., concrete cover, bar diameter, bond length) were selected to represent commonly used ranges in practical applications and to ensure observable contrasts within the constraints of available resources.
For unconfined specimens or confined specimens with minimal stirrup, the dominant failure mode was concrete splitting. This was characterized by the sudden formation of longitudinal cracks along the cover, resulting in abrupt bond loss and brittle behavior. On the other hand, confined specimens, those with reduced stirrup spacing, exhibited a distinctly different failure mode, namely gradual bar pullout. In these cases, the transverse stirrups effectively restrained the initiation and propagation of splitting cracks, permitting a more ductile failure process governed by progressive debonding and slip of the GFRP bar. Throughout all tests, bar rupture or GFRP bar fracture was not observed.
These findings confirm the important role of stirrup confinement in shifting the bond failure mode from brittle concrete splitting to more ductile bar pullout, which is considered desirable for structural safety and reliability.
3.3. Bond Stress-Slip Behavior
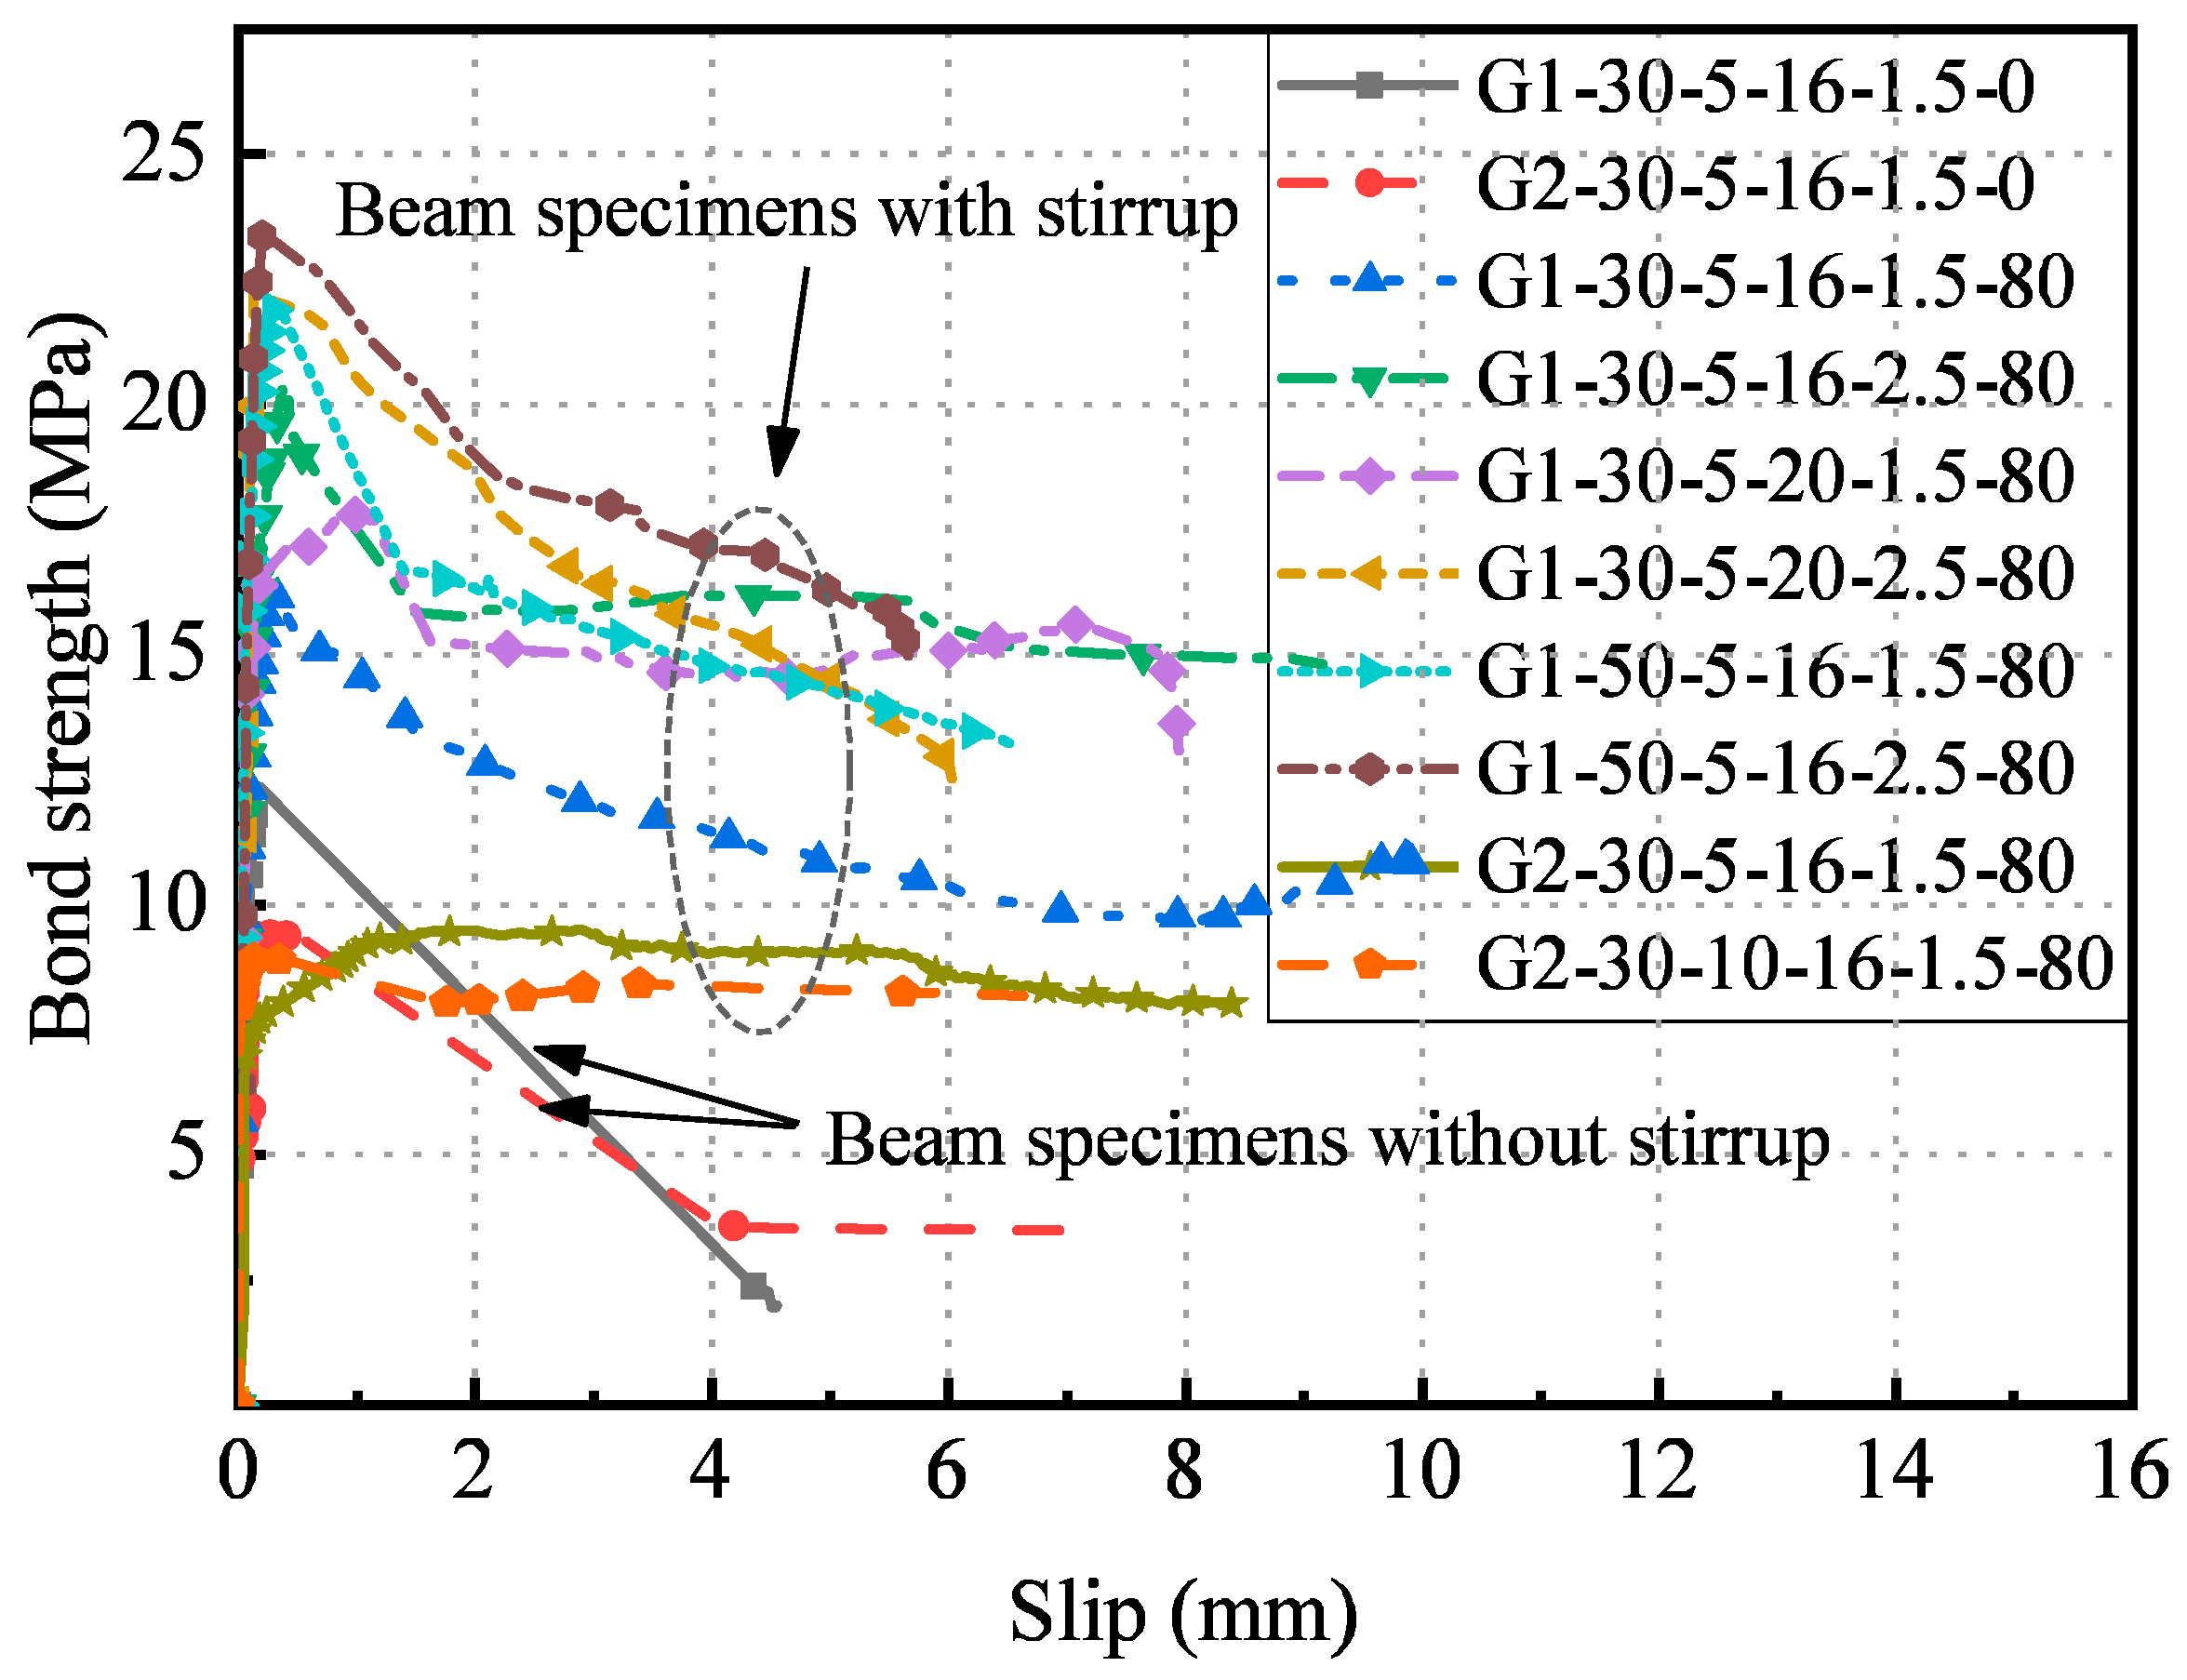
The experimental bond stress-slip curves for the typical beam specimens are shown in
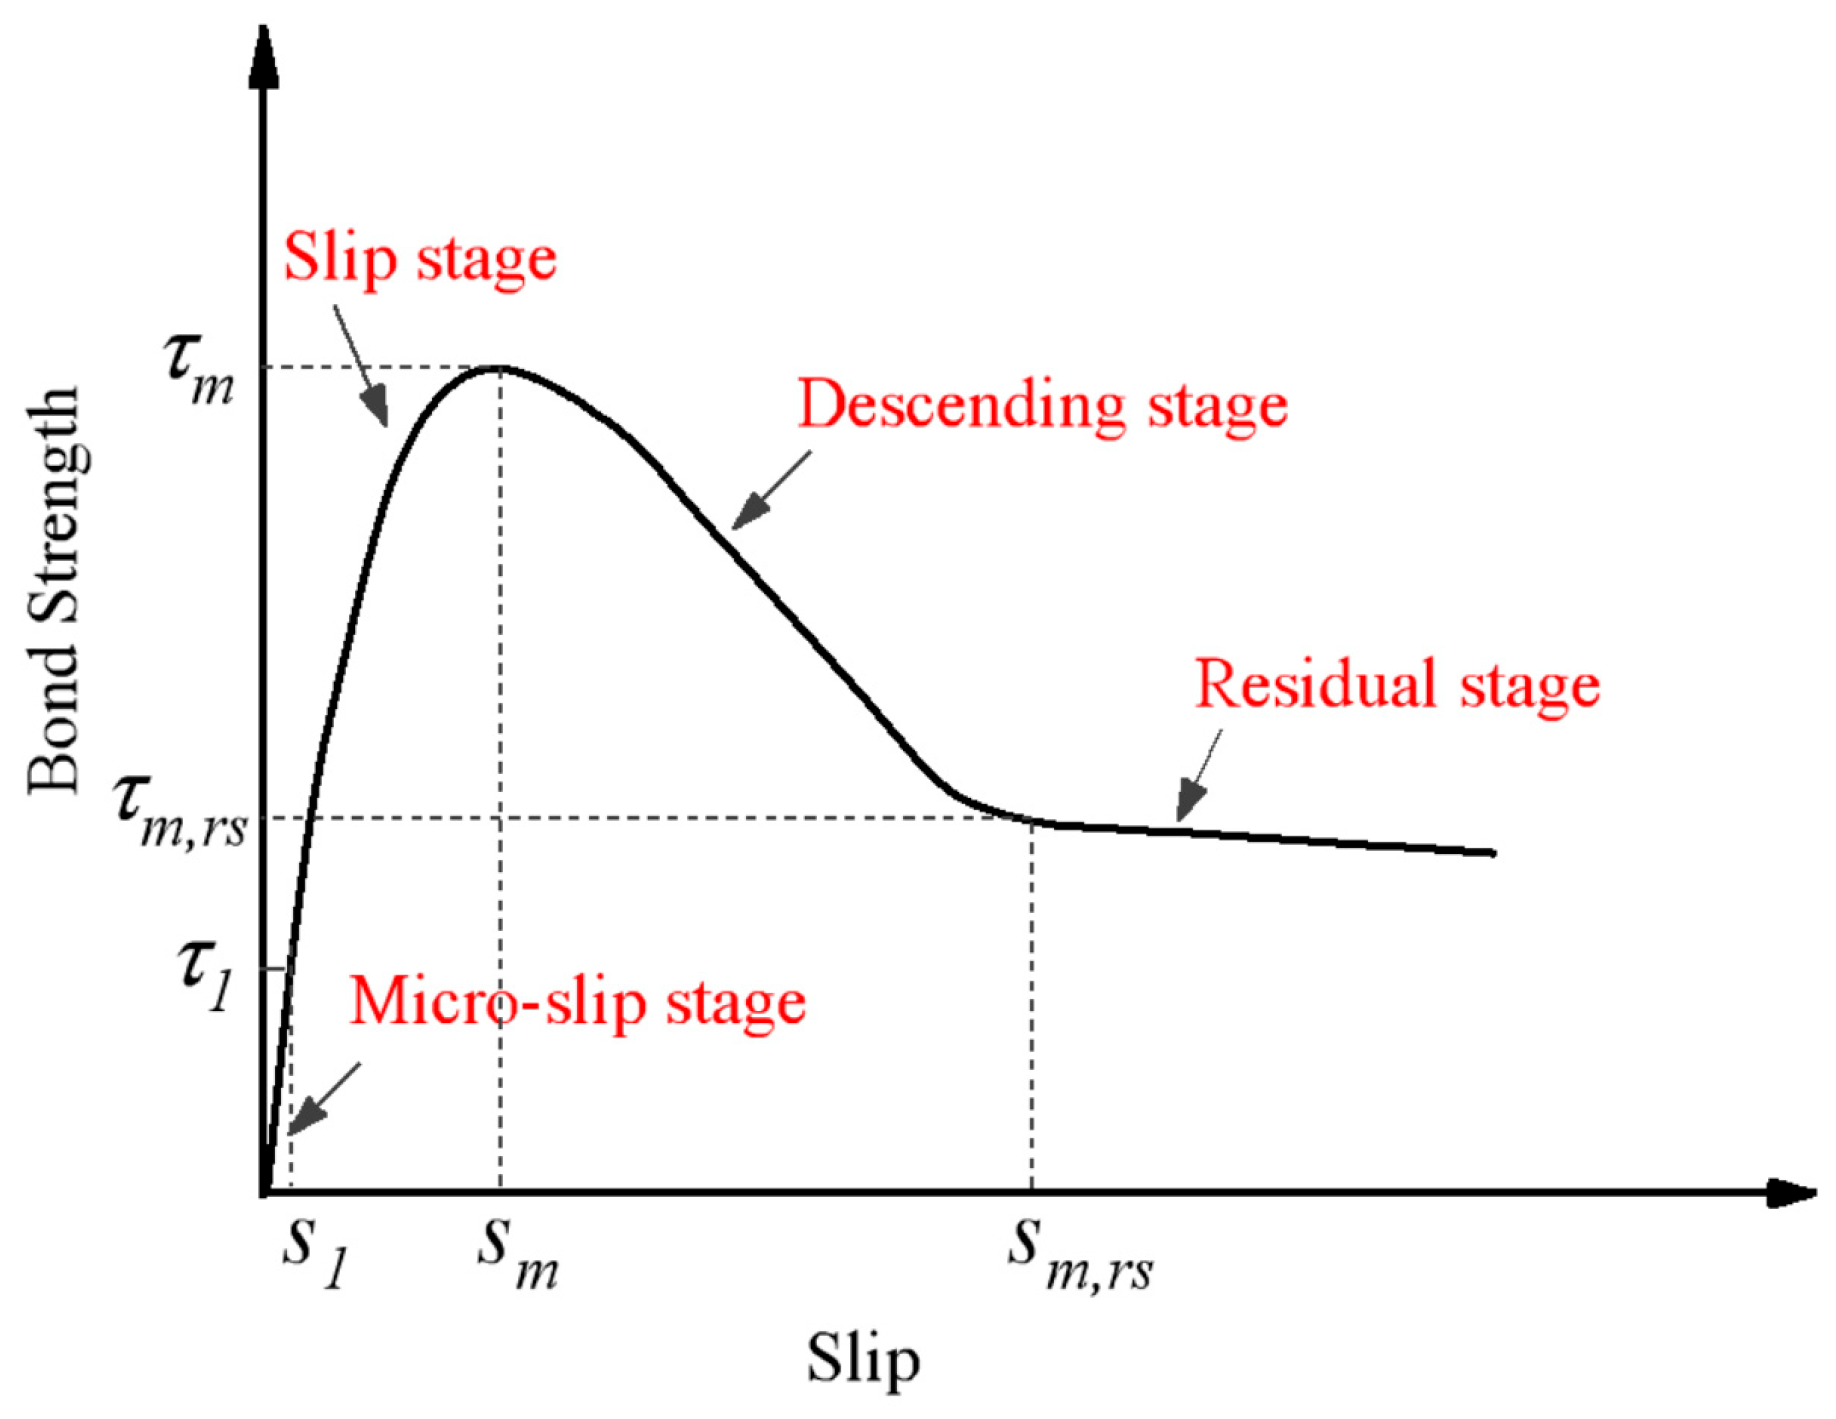
Figure 7. The bond stress-slip curves across all specimens reveals a consistent four-phase behavior pattern comprising micro-slip stage, slip stage, descending stage, and residual stage, similar to the corresponding findings [
55], as illustrated in
Figure 8.
- (1)
Micro-slip stage
In the micro-slip section, the bond area demonstrated approximately linear elastic bond-slip behavior. This response is attributed to the bond stress, generated predominantly by chemical adhesion, which prevented any slippage at the free end.
- (2)
Slip Stage
During the initial loading phase, both the concrete matrix and GFRP reinforcement maintain elastic behavior. The displacement gauges positioned at the specimen’s midsection (loading end) register minimal slip, while those at the beam extremities (free end) consistently record zero displacement. In this phase, chemical adhesion constitutes the primary bond mechanism between the GFRP reinforcement and surrounding concrete.
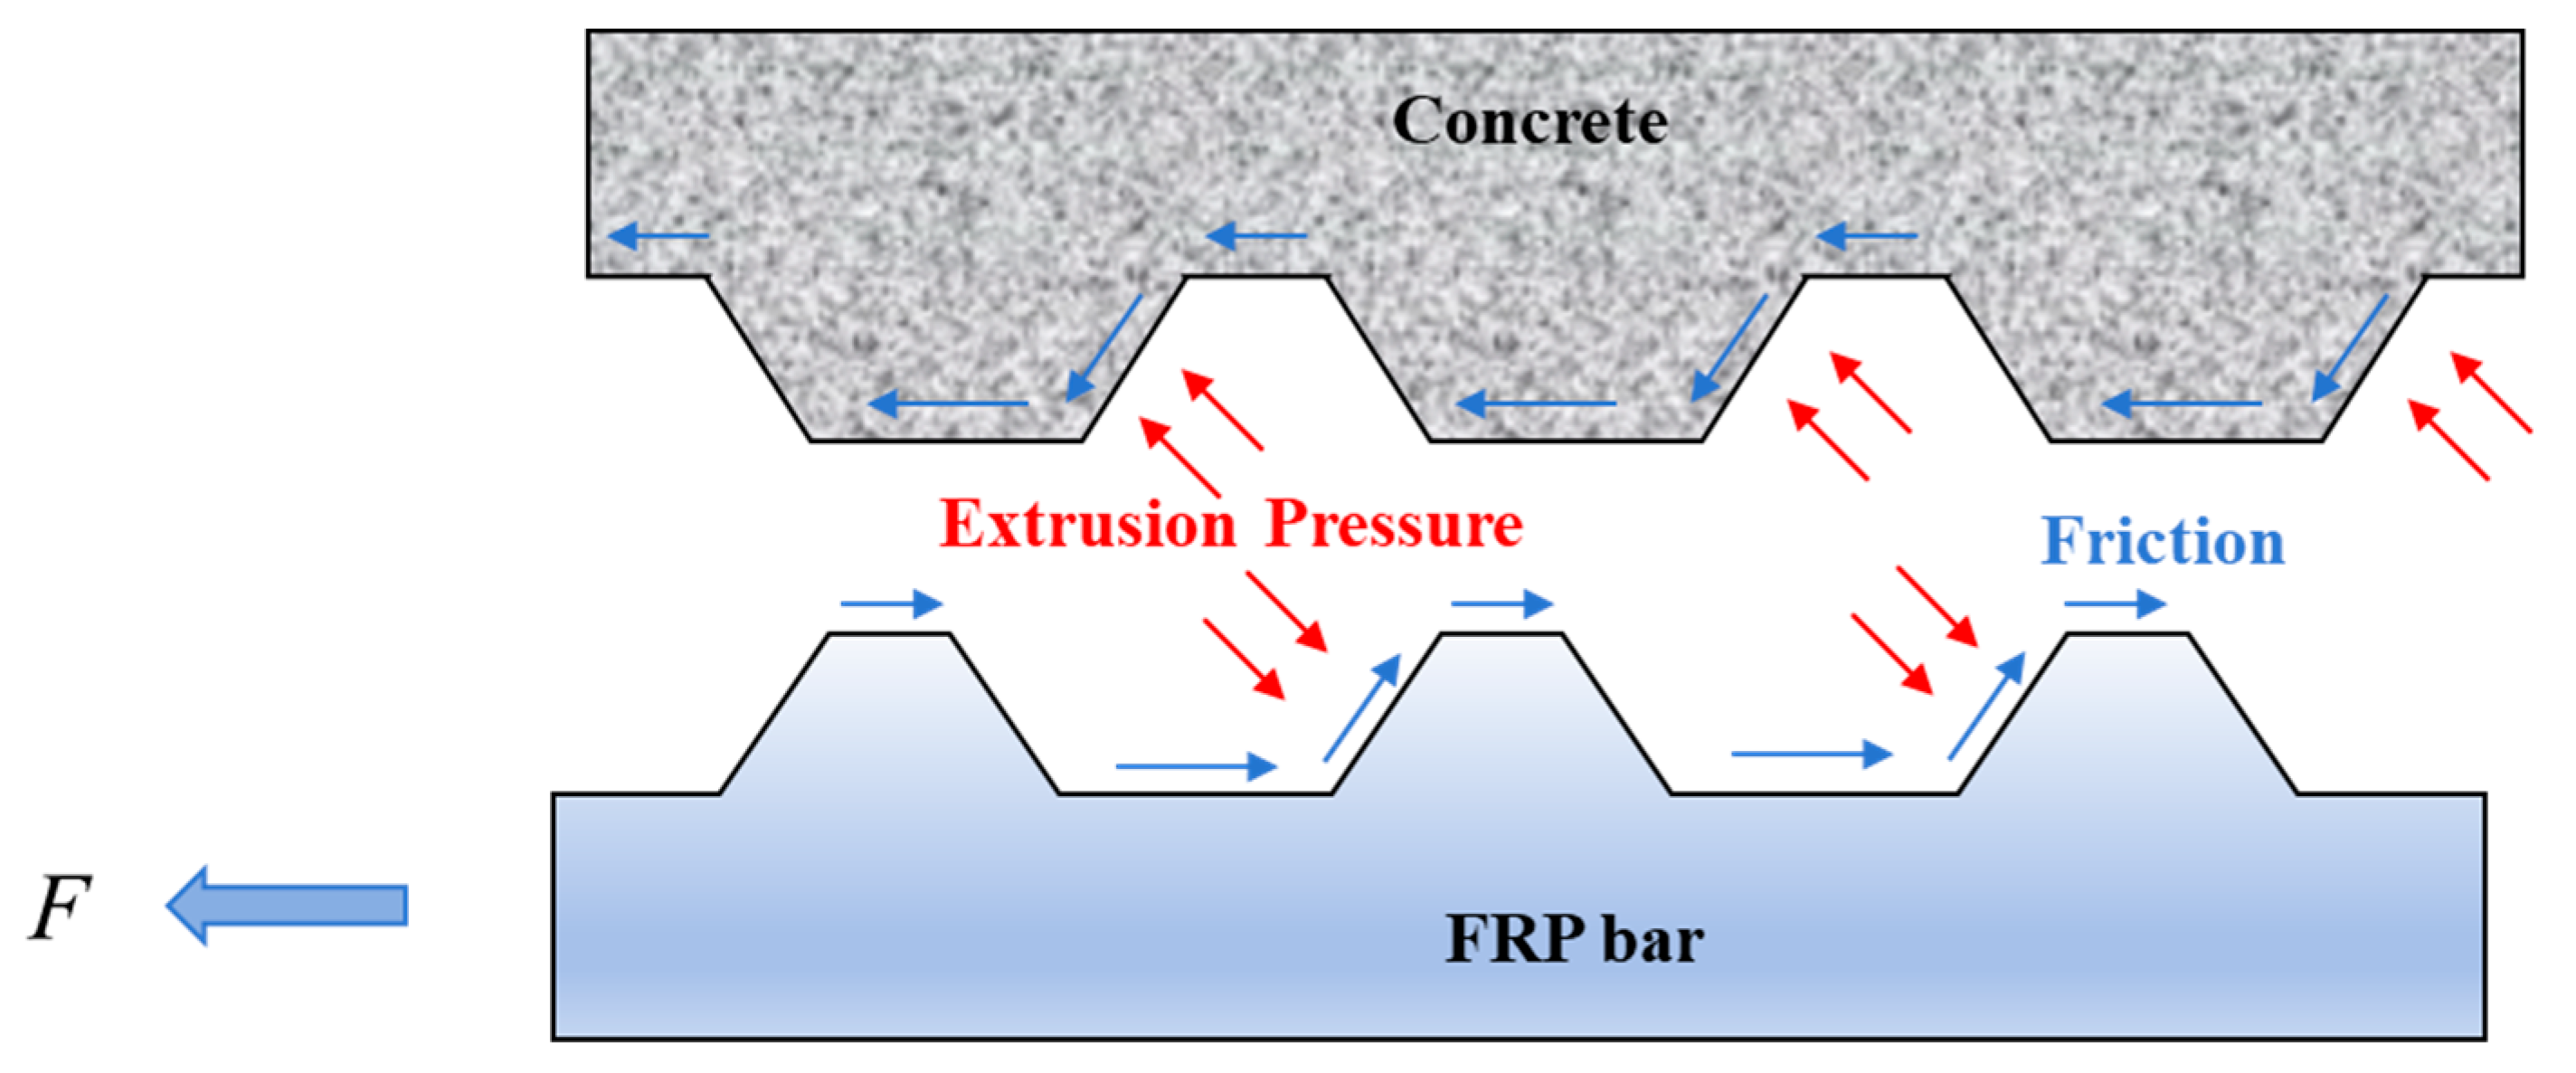
When the reaction force under concentrated loading reaches approximately 10 kN, initial cracking occurs at the notch corners of the specimen, accompanied by incipient slip at the free ends. As loading intensifies, diagonal cracks begin to develop throughout the specimen. Concurrently, chemical adhesion progressively deteriorates beginning at the loaded end, while slip acceleration becomes more pronounced at the free ends. At this stage, mechanical interlocking and frictional resistance emerge as the dominant bond mechanisms between the GFRP reinforcement and concrete.
As the applied load approaches ultimate capacity, the interlocking interface between GFRP reinforcement ribs and concrete progressively deteriorates, manifesting as a distinct inflection point in the bond stress-slip relationship curve.
- (3)
Descending Stage
Following peak load attainment, tensile stresses in the transverse stirrups progressively intensify. Longitudinal splitting cracks at the GFRP-concrete interface propagate rapidly toward the specimen’s bottom surface. Simultaneously, crack widths continue to expand, signifying diminishing mechanical interlocking capacity between the concrete and GFRP reinforcement. This degradation in mechanical interlock precipitates a sharp reduction in bond stress, while the relative displacement between GFRP reinforcement and concrete accelerates substantially.
- (4)
Residual Stage
With further progression of relative displacement between the GFRP reinforcement and concrete, the transverse ribs of the GFRP bars undergo gradual degradation while the concrete interlocking surfaces experience continued abrasion. This mutual deterioration of contact surfaces results in progressive reduction of both frictional resistance and mechanical interlocking forces between the two materials, ultimately establishing a relatively stable residual bond strength that persists during large slip deformations.
3.4. Parameter Analysis
3.4.1. Effect of Stirrup Spacing
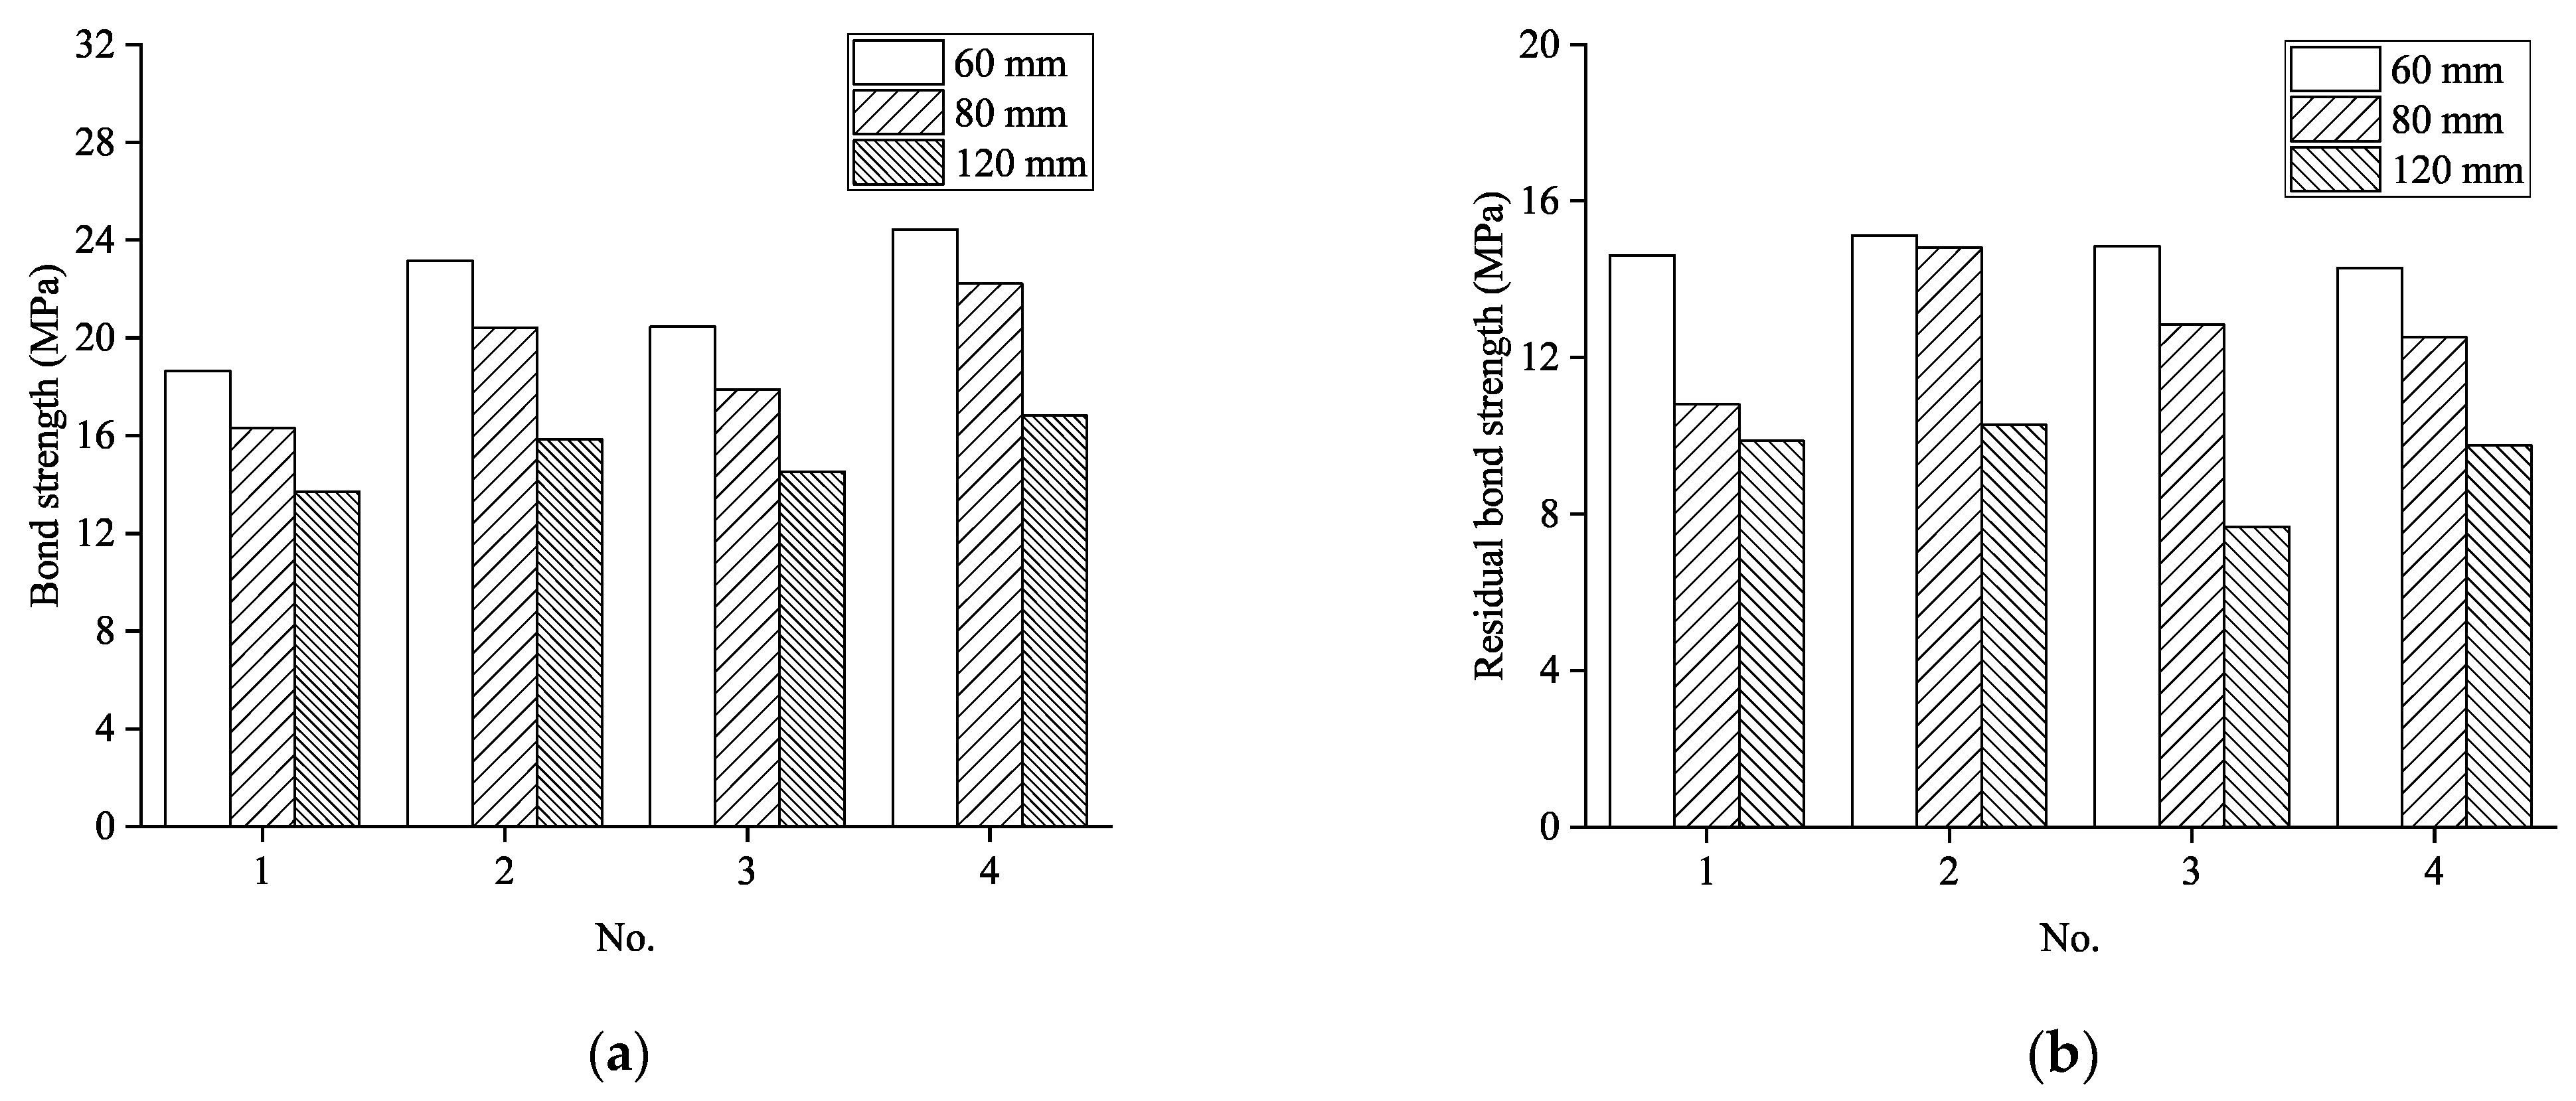
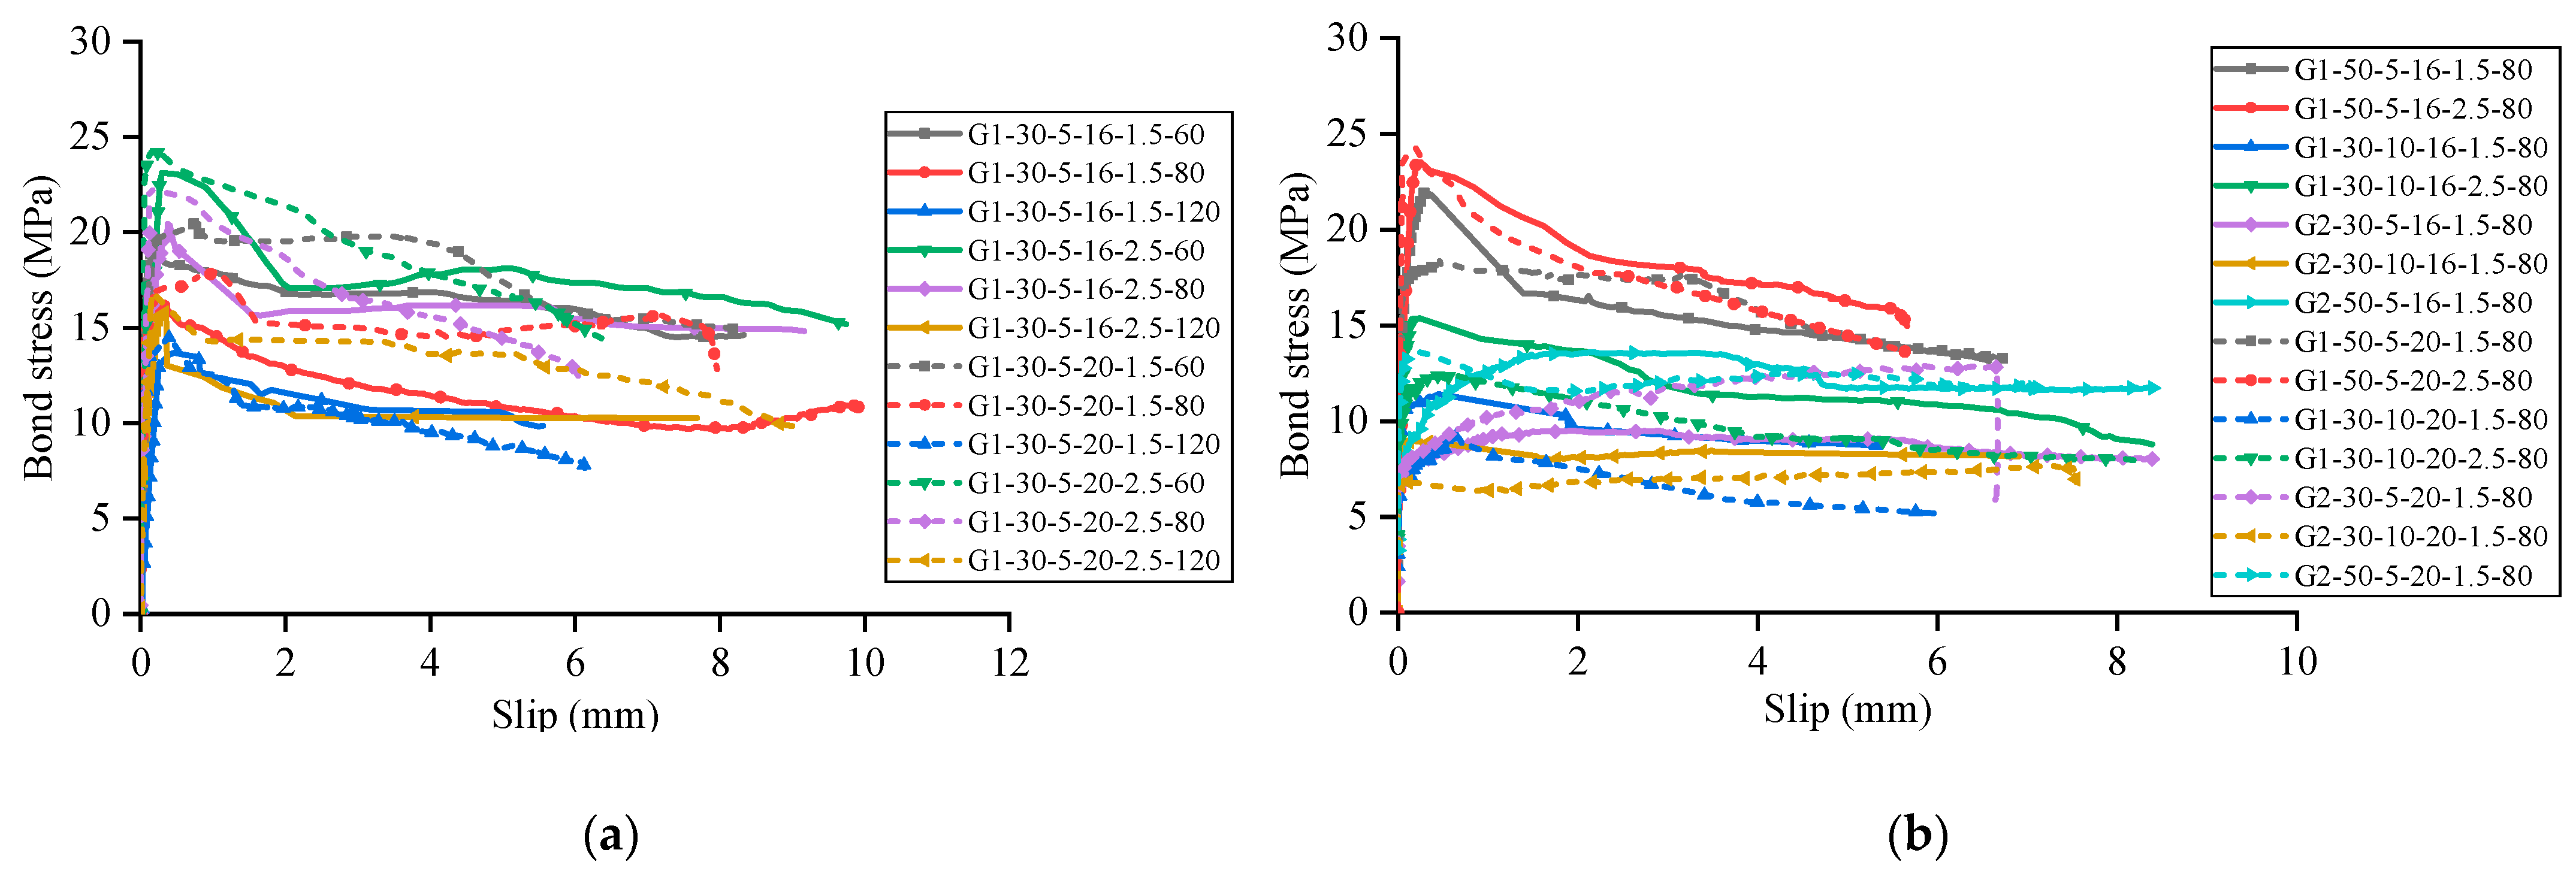
Figure 9 presents a comparative analysis of bond stress-slip relationships for specimens with varying stirrup spacing configurations, and
Figure 10 compares the bond strength and residual bond strength of specimens with different stirrup spacing. The data reveal significant performance enhancements in specimens with transverse stirrups compared to their unreinforced counterparts. Specifically, the inclusion of stirrups resulted in bond strength improvements ranging from 10.48% to 50.81%, while even more dramatic enhancements were observed in residual bond strength, which increased by 393.5% to 630.5%.
This marked difference in bond performance can be explained through examination of the underlying failure mechanisms. In specimens without stirrups, once splitting cracks propagate through the concrete cover and reach the beam soffit, bond stress between the GFRP reinforcement and concrete diminishes rapidly due to the absence of lateral confinement. Conversely, in specimens with transverse reinforcement, even after bond stress reaches its peak value, the stirrups effectively confine the concrete matrix, thereby restricting further development of splitting cracks. This confinement mechanism enables the maintenance of substantial residual bond strength throughout large slip deformations.
Additionally, specimens with stirrups exhibit significantly more gradual descending branches in their bond stress-slip relationships. As relative displacement continues to increase, splitting crack widths progressively expand while the interface between GFRP reinforcement and concrete experiences increasing abrasion, resulting in gradual bond stress deterioration rather than sudden failure.
Further analysis of the influence of stirrup spacing reveals a clear inverse relationship between stirrup spacing and bond performance. Specimens with closer stirrup spacing consistently demonstrate superior performance in terms of both maximum bond strength and residual bond capacity. This relationship confirms the critical role of confinement density in enhancing the bond behavior between GFRP reinforcement and concrete, particularly in maintaining post-peak bond resistance.
3.4.2. Effect of Concrete Cover Thickness
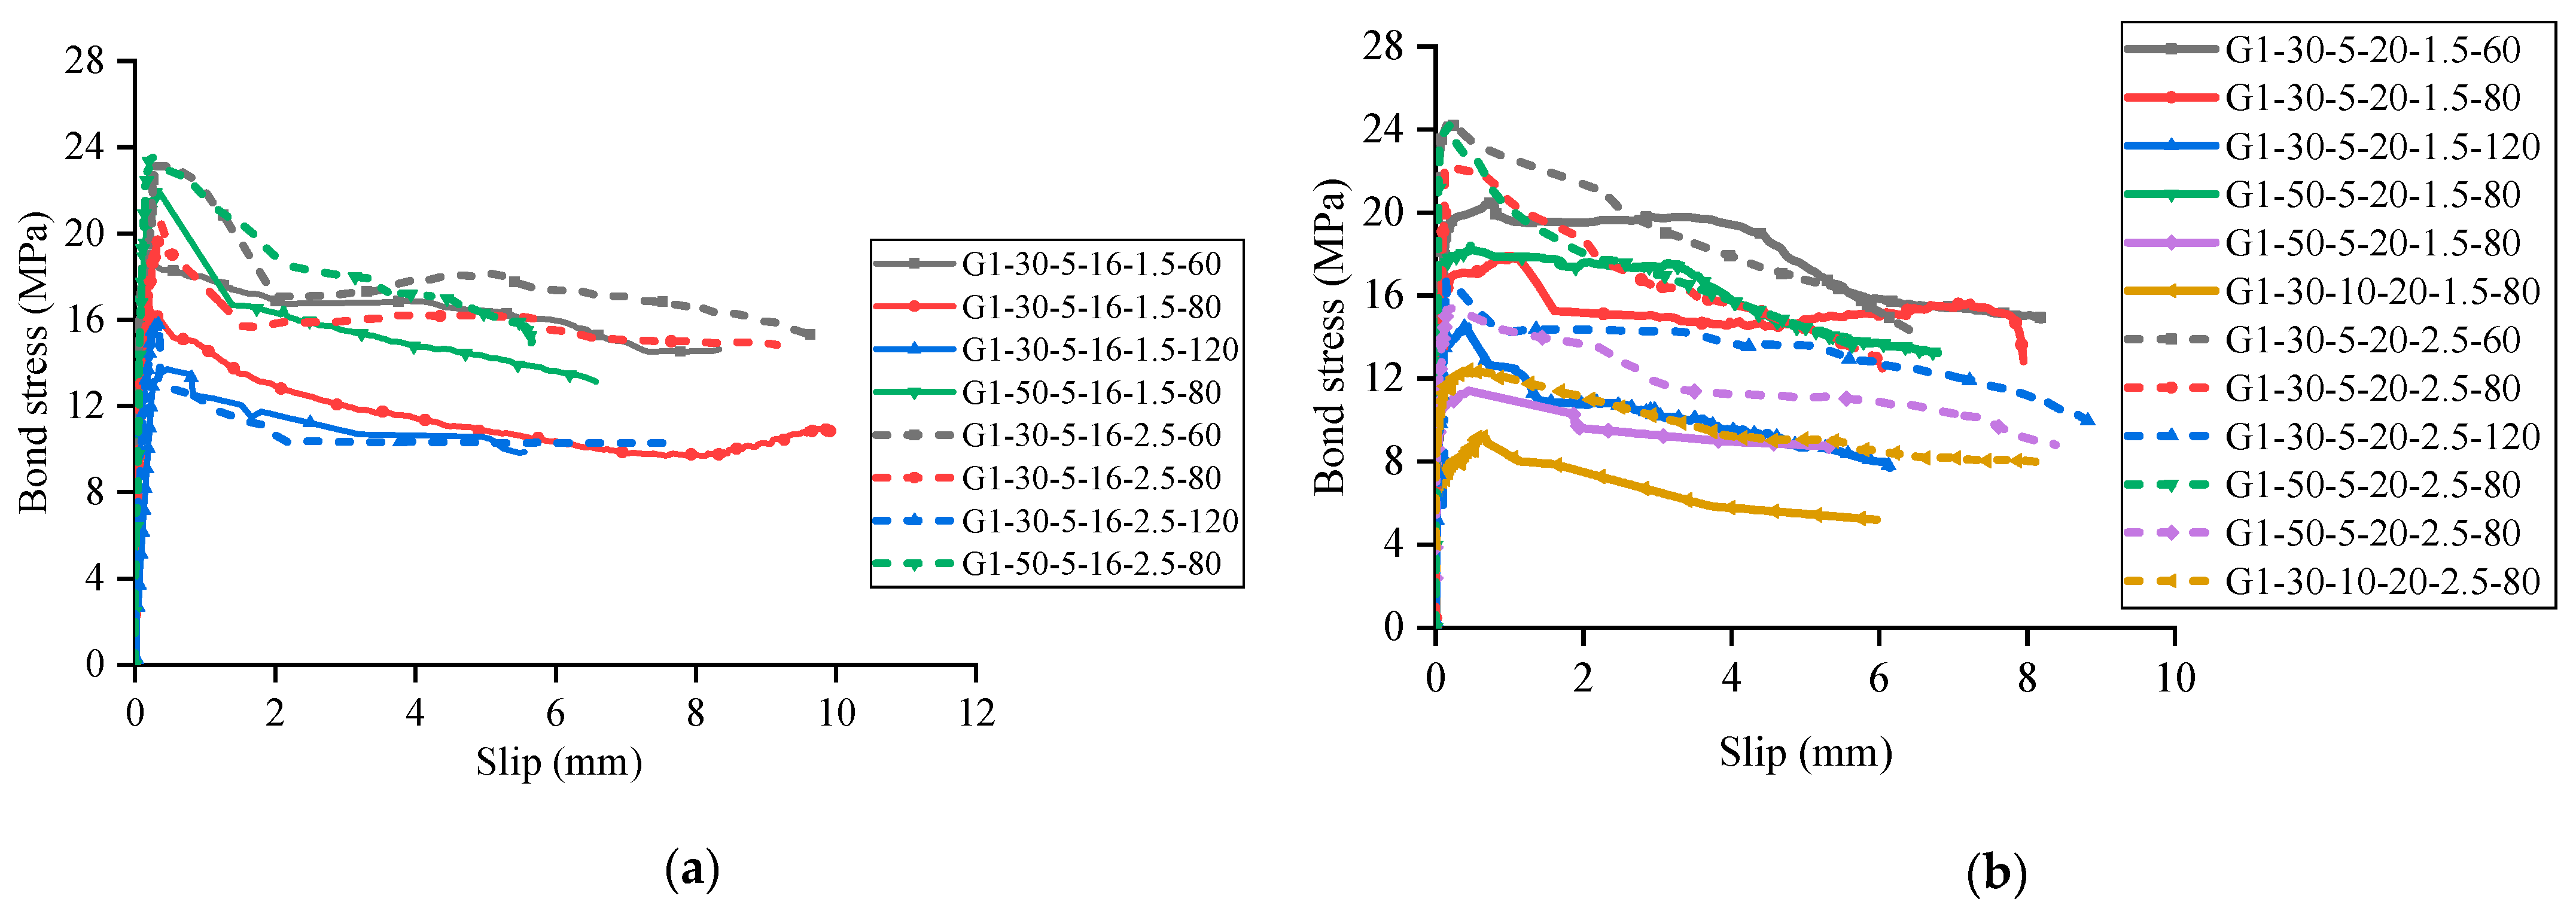
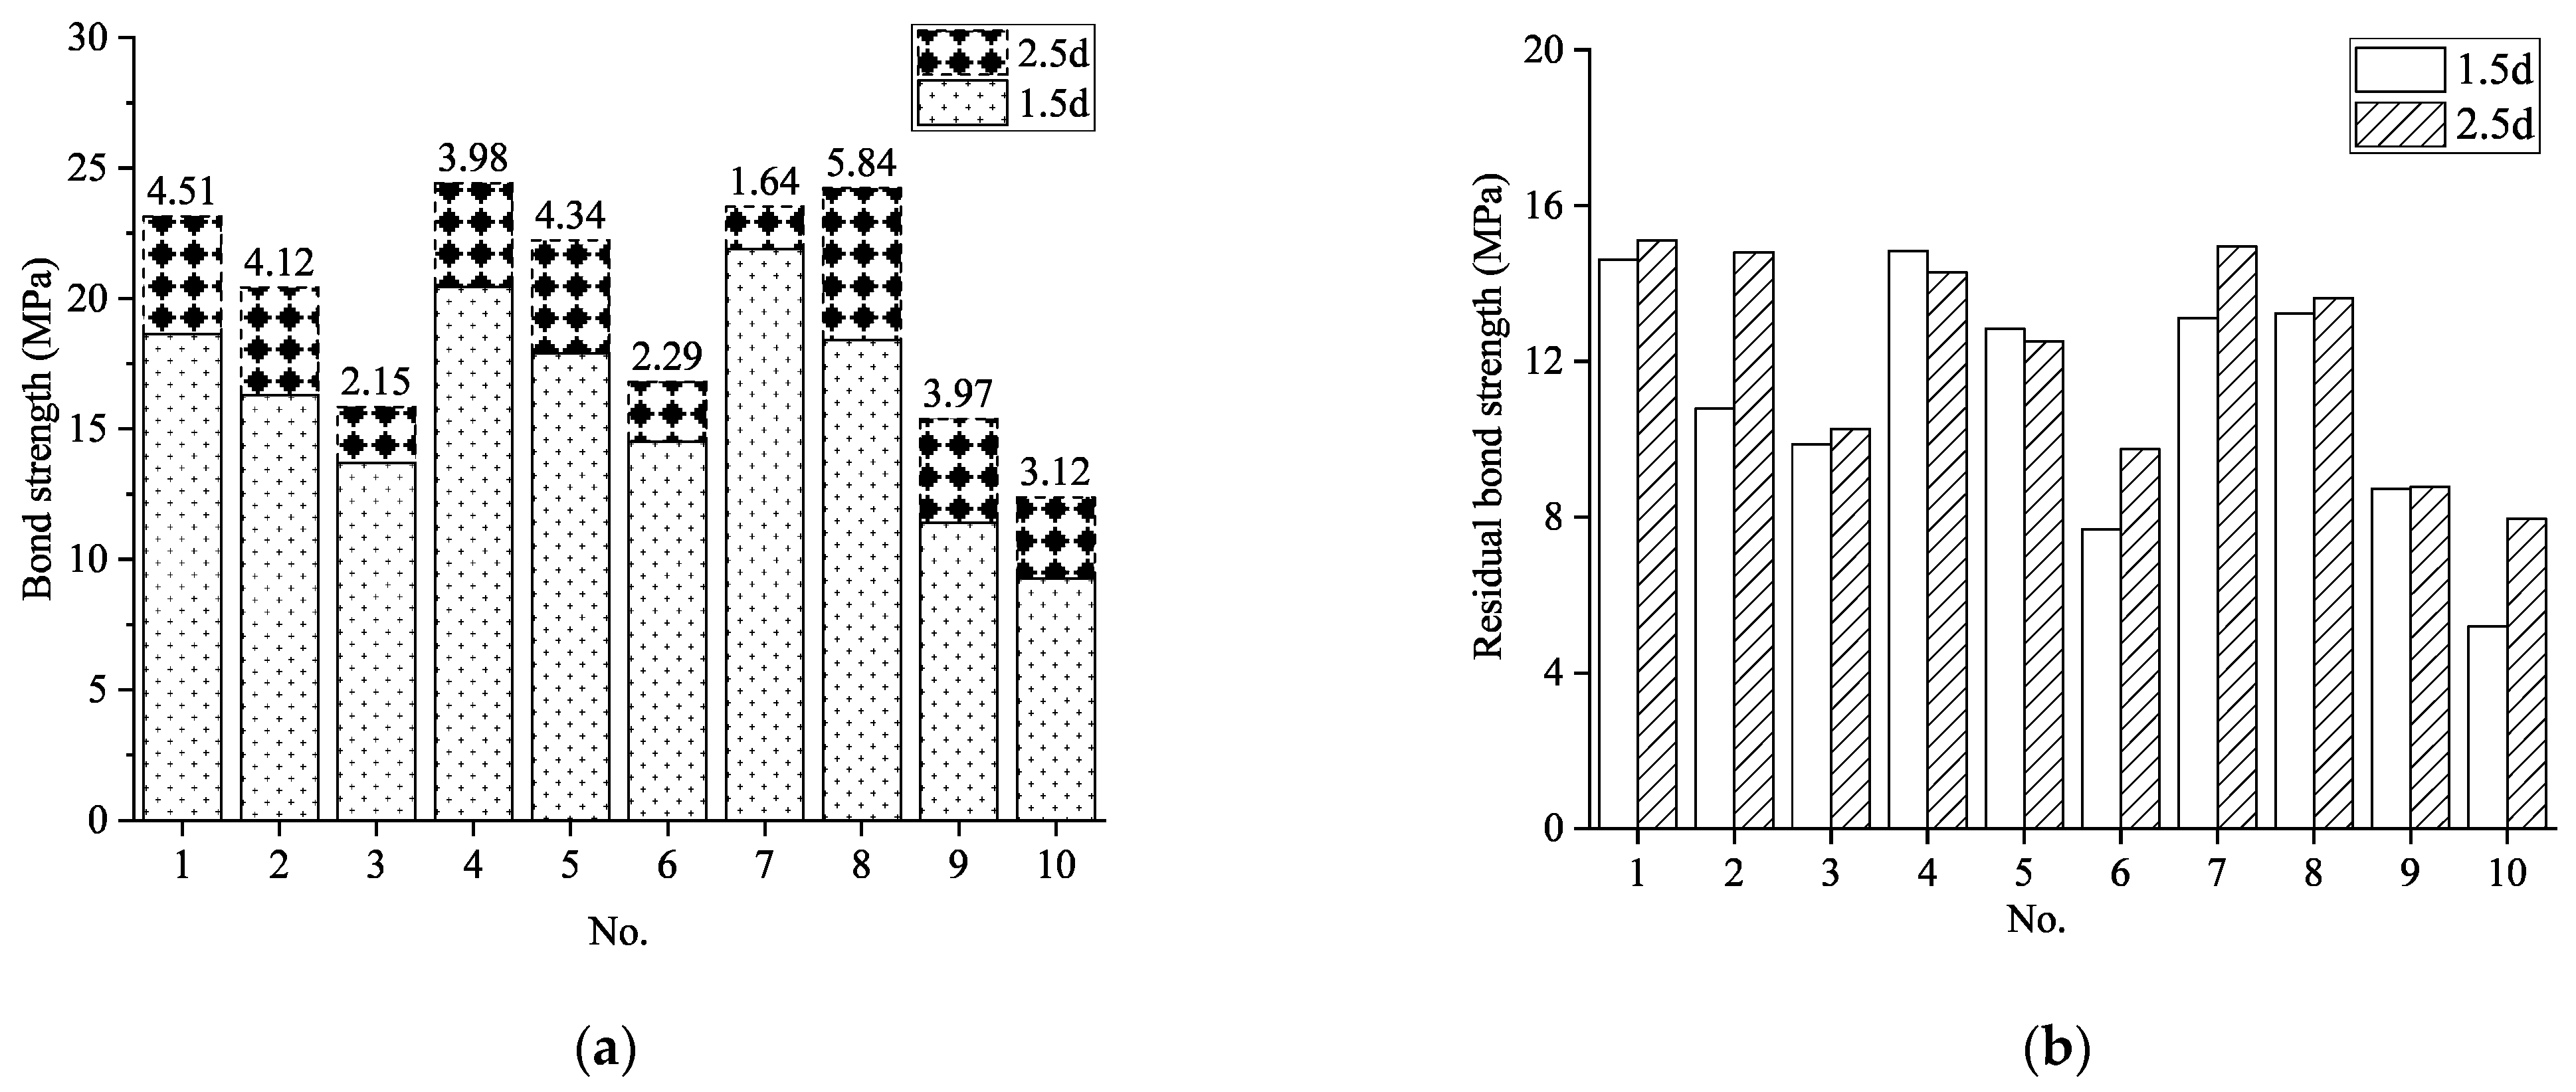
Figure 11 and
Figure 12 systematically investigate the effect of concrete cover thickness on bond behavior through comparative analysis of ten specimen groups, each comprising paired specimens with concrete cover thicknesses of 1.5d and 2.5d. The tested pairs included Groups 1 and 6, Groups 4 and 7, Groups 5 and 8, Groups 9 and 12, Groups 10 and 13, Groups 11 and 14, Groups 15 and 16, Groups 17 and 18, Groups 19 and 20, and Groups 21 and 22.
As illustrated, specimens with greater concrete cover thickness (2.5d) consistently demonstrated superior bond strength compared to their counterparts with thinner cover (1.5d), with enhancement ranging from 7.49% to 34.79%. This significant improvement can be attributed to the predominant splitting failure mechanism observed between GFRP reinforcement and concrete. Specifically, as concrete cover thickness increases, the concrete’s resistance to splitting forces is substantially enhanced, requiring greater tensile stresses to initiate and propagate radial cracks. This enhanced confinement capacity directly translates to increased bond strength.
The beneficial effect of increased concrete cover extends beyond peak bond strength to post-peak behavior as well. As shown in
Figure 12, most specimen groups with a thicker concrete cover (2.5d) maintained higher residual bond strength compared to their thinner cover counterparts. This improvement in residual bond capacity further underscores the importance of adequate concrete cover in enhancing both the ultimate bond strength and the post-peak ductility of GFRP-reinforced concrete elements.
These findings highlight the critical role of concrete cover thickness as a design parameter for optimizing bond performance in GFRP-reinforced concrete structures, particularly in applications where splitting failure represents the governing failure mode.
3.4.3. Effect of Concrete Strength
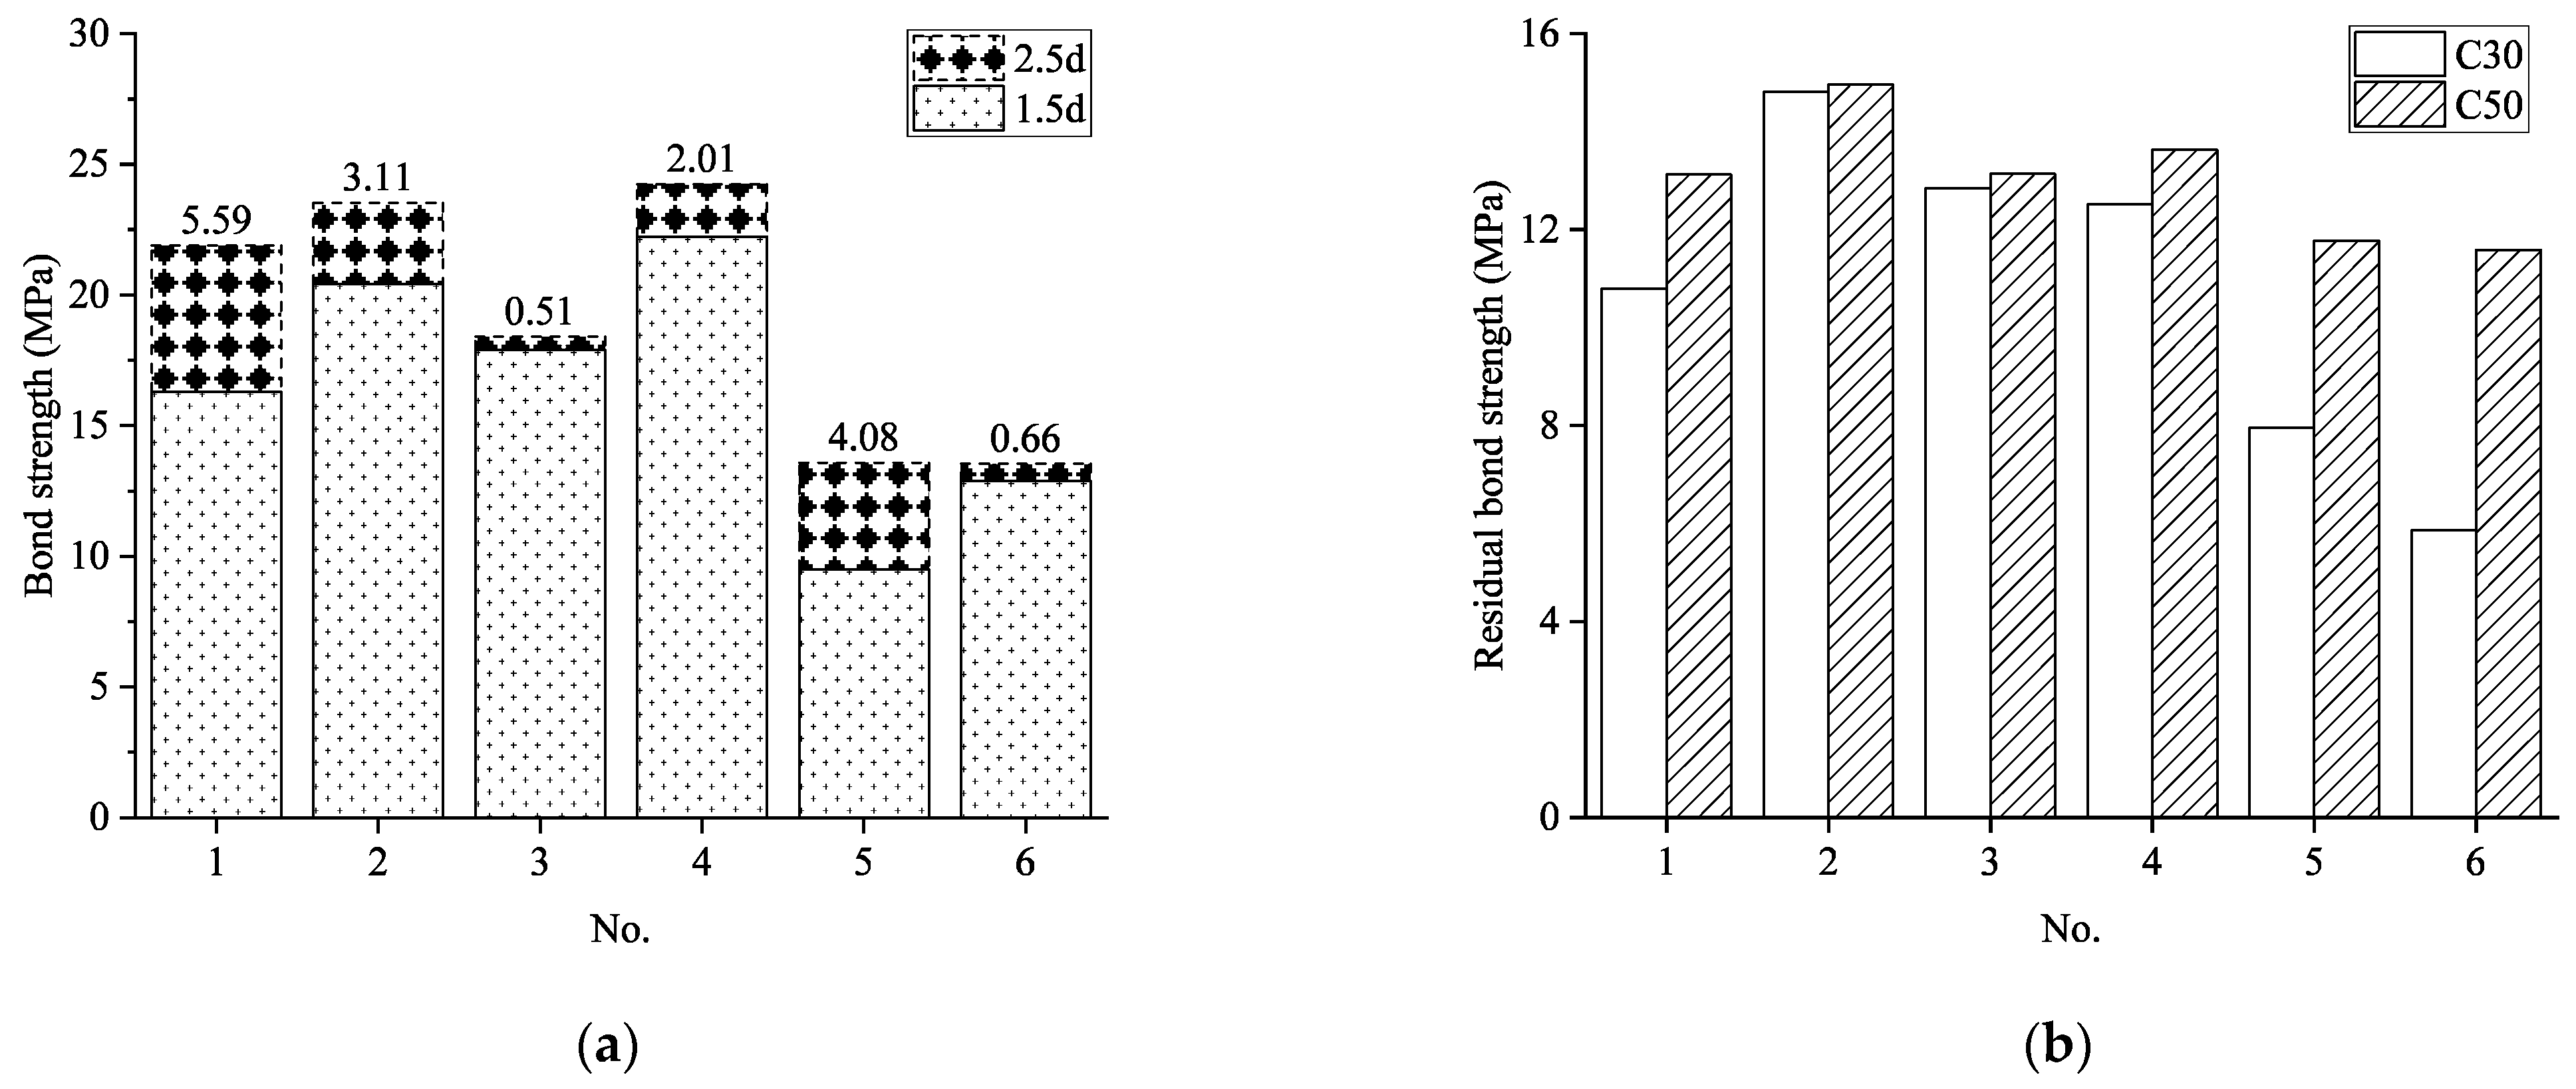
Figure 13 and
Figure 14 present a comparative analysis of bond stress-slip curves and bond strength for specimens with varying concrete compressive strengths. The comparison encompasses six group pairs: Groups 4 and 15, Groups 7 and 16, Groups 10 and 17, Groups 13 and 18, Groups 23 and 25, and Groups 26 and 28.
Analysis of these results demonstrates that concrete compressive strength exerts a substantial influence on bond performance between GFRP reinforcement and concrete. When all other parameters remain constant, increasing the concrete compressive strength resulted in bond strength enhancements ranging from 2.77% to 30.04%. This relationship can be explained through examination of the underlying bond mechanics: when specimens fail by splitting, their bond strength correlates directly with the concrete’s resistance to splitting tensile forces. Higher strength concrete inherently possesses superior tensile strength and crack resistance, thereby providing enhanced confinement to the reinforcement and resulting in greater bond capacity.
The influence of concrete strength extends to post-peak behavior as well. Following complete propagation of splitting cracks, transverse stirrups provide critical lateral confinement to the concrete, enabling the maintenance of residual bond stress. Since residual bond stress primarily comprises mechanical interlocking and frictional components, higher concrete compressive strength contributes to greater mechanical interlock capacity at the GFRP-concrete interface.
As illustrated in
Figure 14, comparison of residual bond strength across the various specimen groups reveals a consistent trend of increasing residual bond capacity with higher concrete compressive strength. The improvement in residual bond strength reached up to 49.35%, highlighting the significant contribution of concrete strength to post-peak bond performance.
These findings underscore the importance of concrete strength as a key design parameter for optimizing bond behavior in GFRP-reinforced concrete elements, with particular benefits observed in both ultimate bond capacity and post-failure residual strength.
3.4.4. Effect of GFRP Bar Surface Configuration
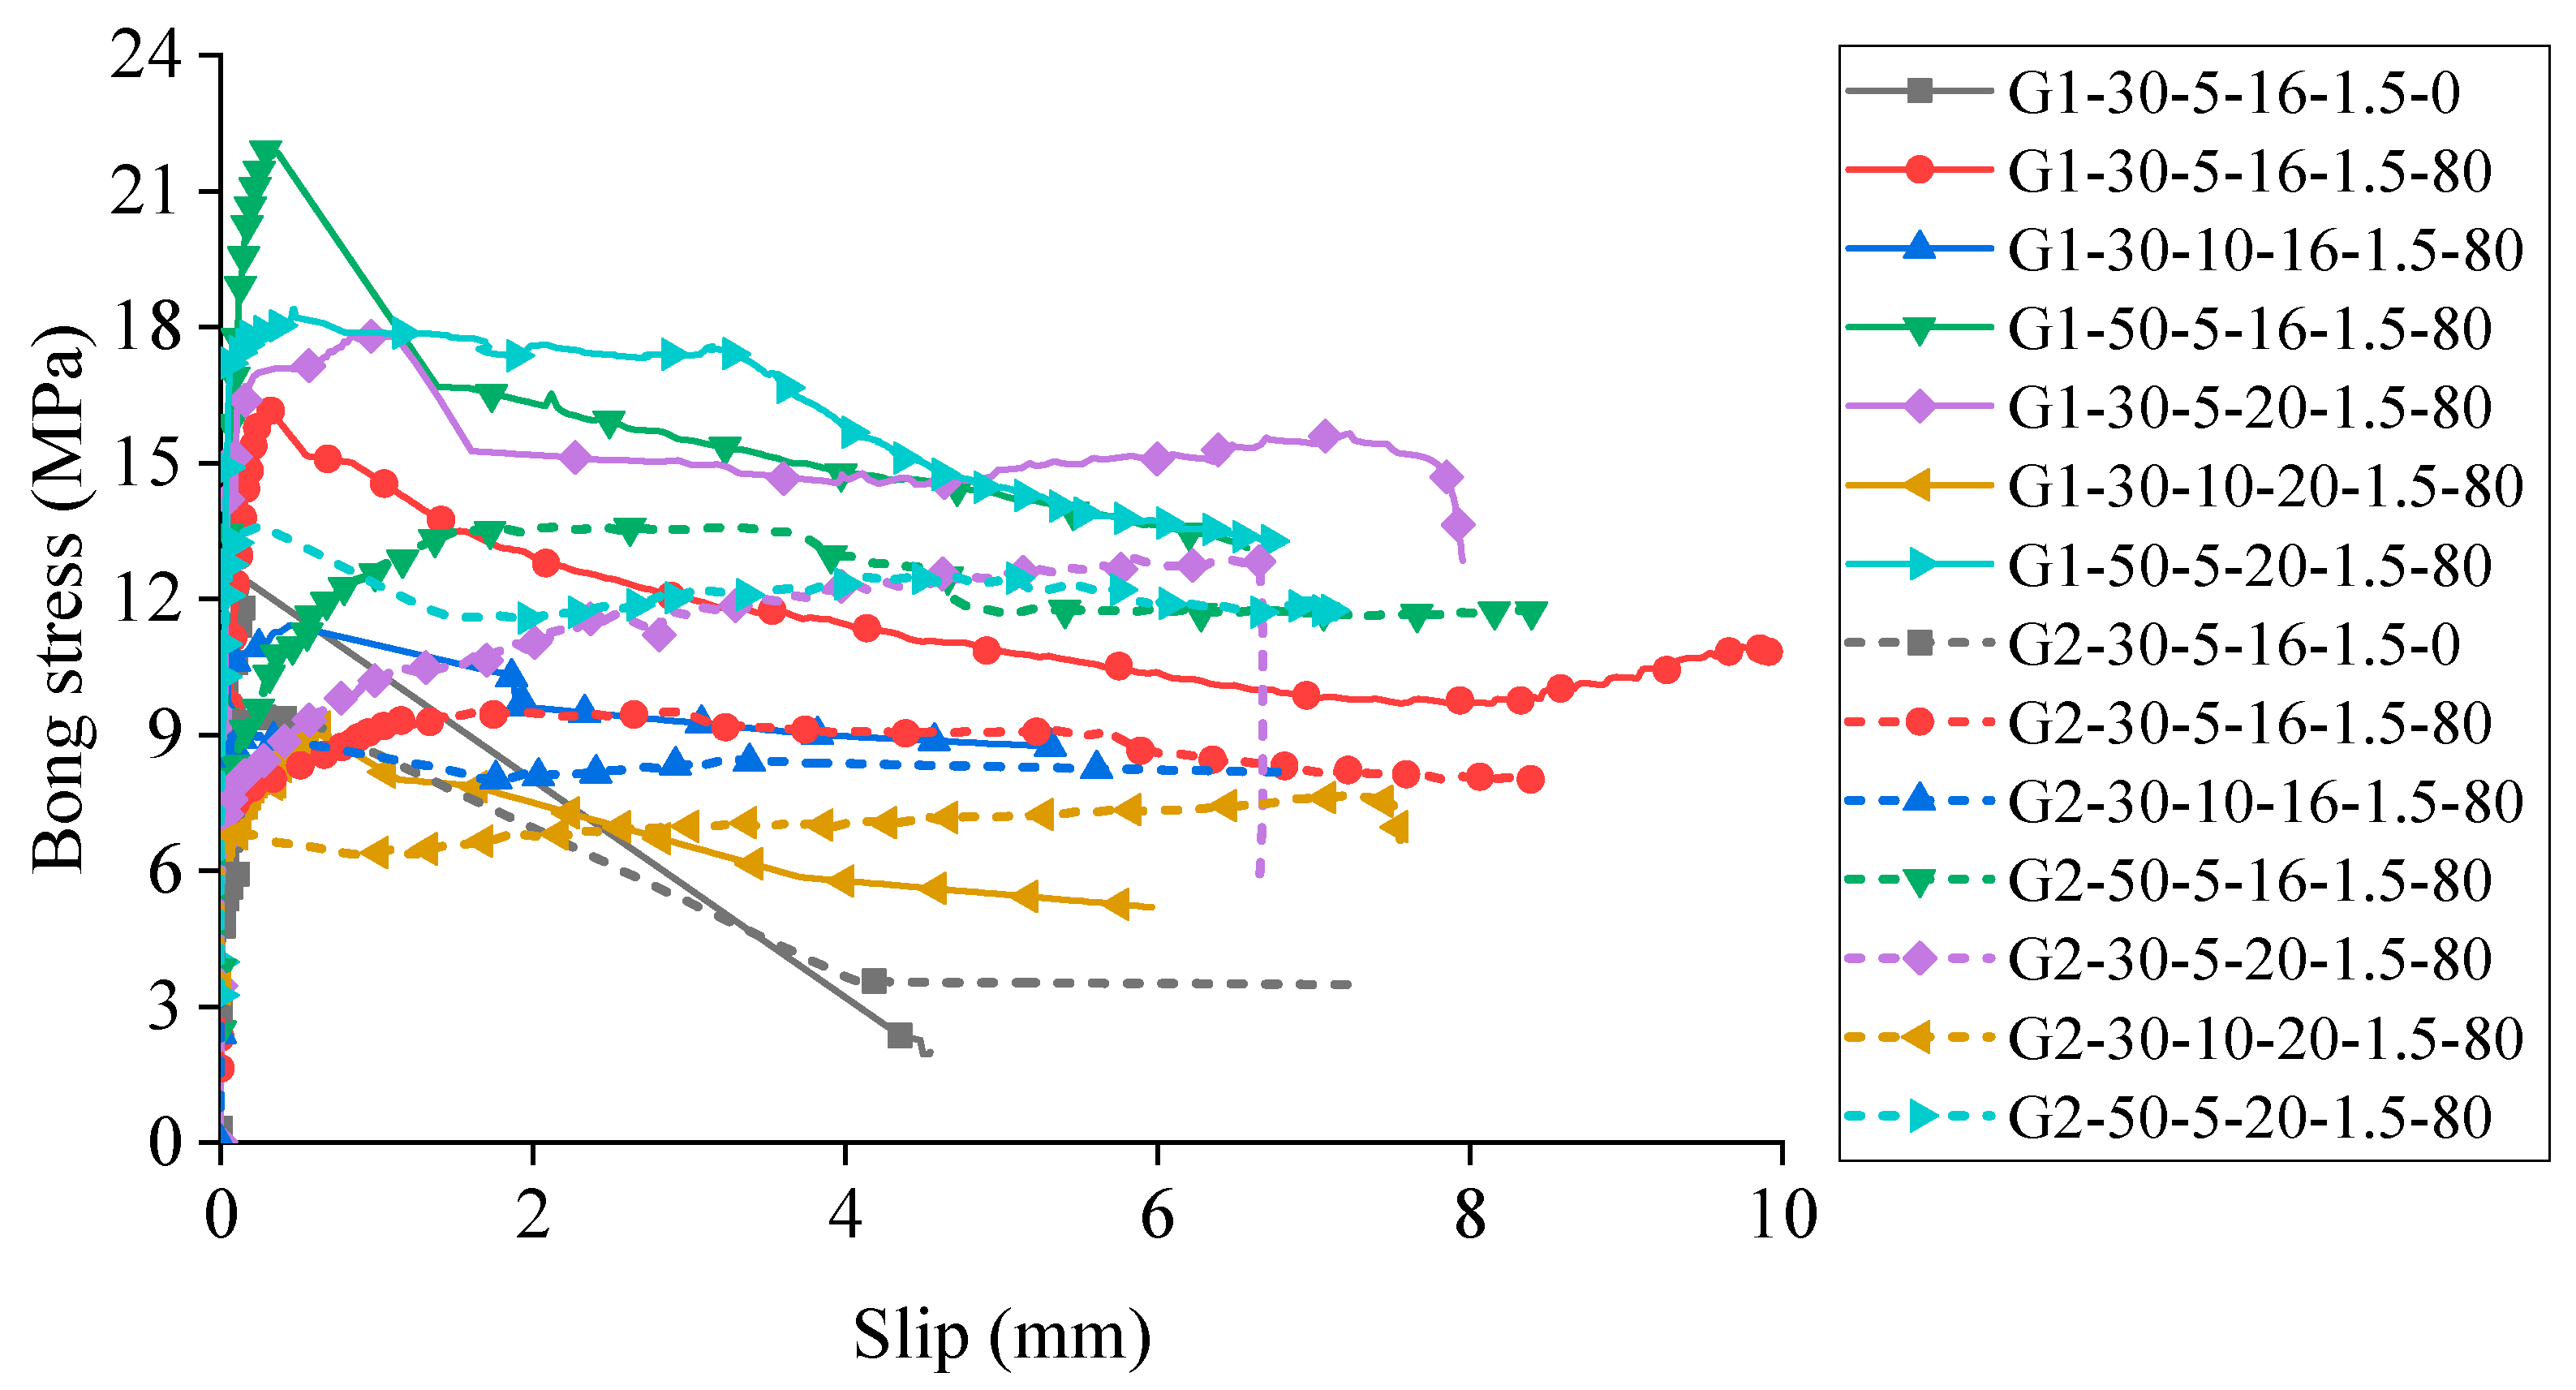
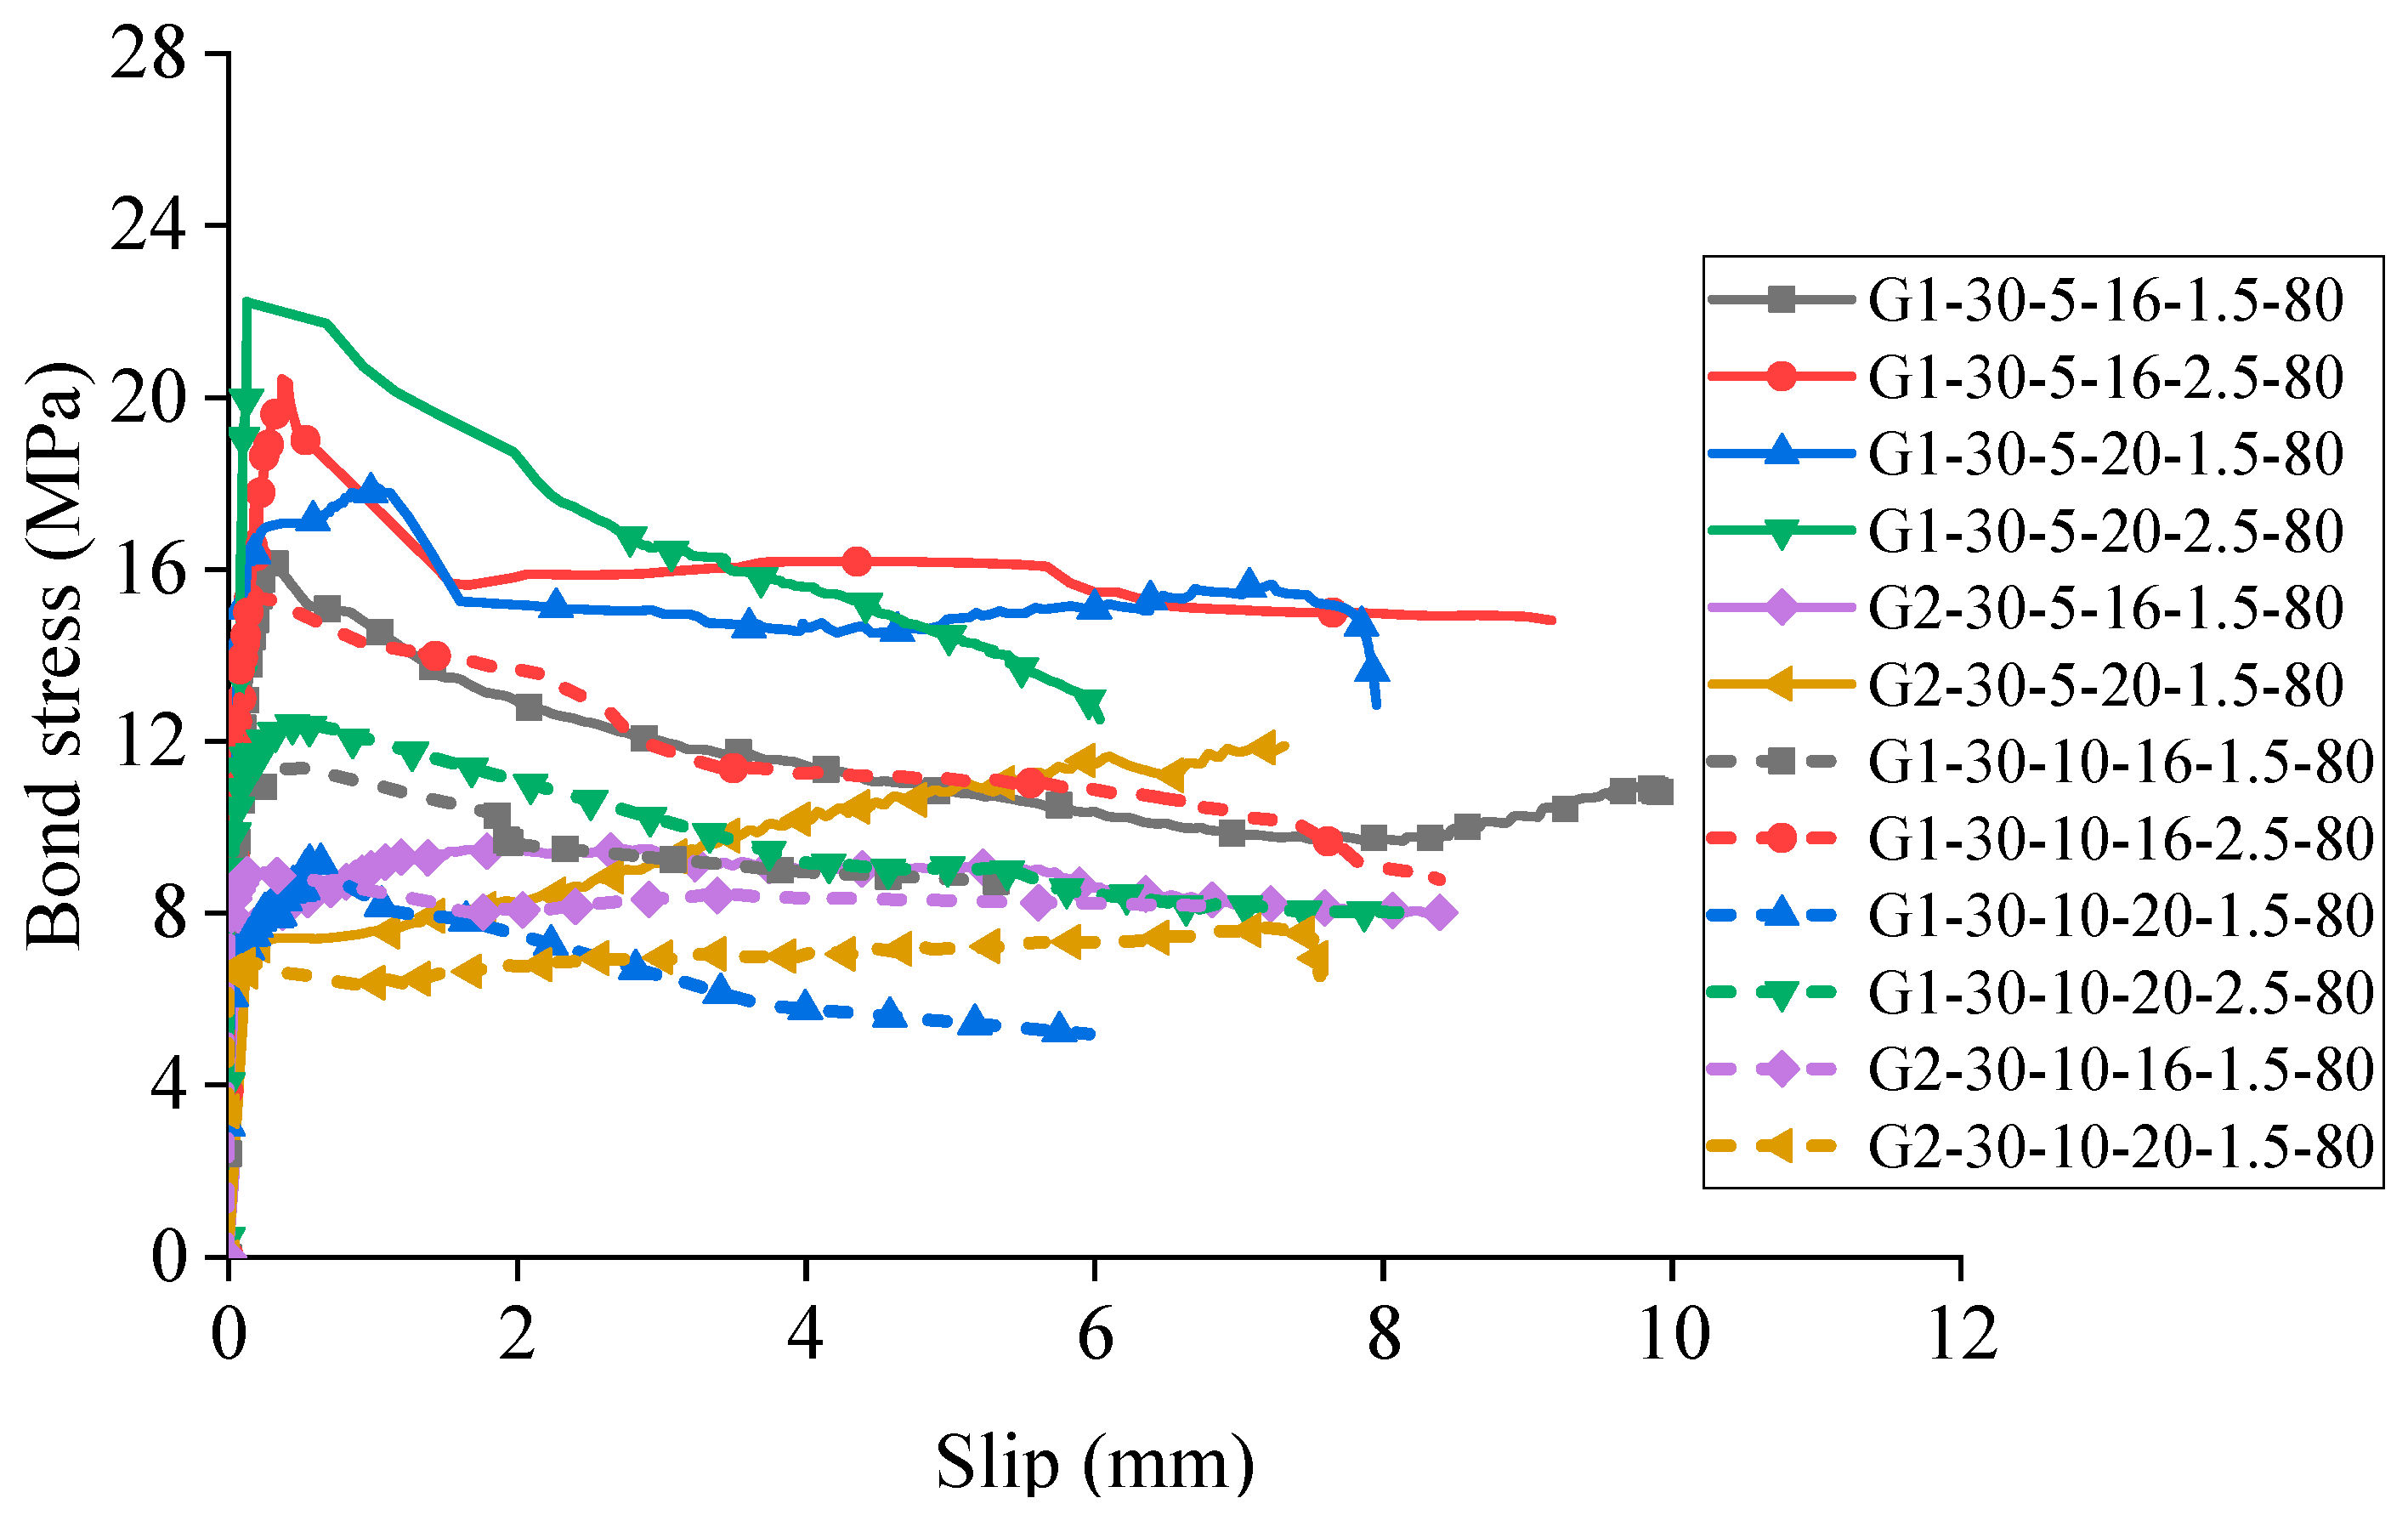
Figure 15 and
Figure 16 present a comparative analysis of bond stress-slip curves and bond strength across seven specimens with different GFRP reinforcement surface configurations. The results demonstrate that specimens with ribbed GFRP bars consistently outperformed those with sand-coated bars, exhibiting bond strength enhancements ranging from 17.26% to 41.72%. This significant improvement confirms that transverse ribs on GFRP reinforcement substantially enhance bond performance, mirroring the behavior observed with conventional steel reinforcement [
56].
The superior bond performance of ribbed GFRP bars can be attributed to the mechanical interlocking mechanism that develops between the transverse ribs and surrounding concrete, as illustrated in
Figure 15. During tensile loading, the concrete forms bearing surfaces against the reinforcement ribs, generating substantial mechanical resistance to bar pullout. In contrast, sand-coated GFRP bars feature much shallower surface profiles with minimal bearing angles, resulting in significantly reduced mechanical interlocking capacity.
Analysis of the bond stress-slip relationships, as shown in
Figure 17, reveals distinct post-peak behavior between the two surface configurations. Sand-coated specimens demonstrate more stable residual bond stress after reaching peak strength compared to their ribbed counterparts. This characteristic behavior occurs because sand-coated GFRP bars cause less abrasive damage to the surrounding concrete during large relative displacements. Additionally, the residual bond strength of sand-coated bars primarily derives from frictional resistance rather than mechanical interlocking, resulting in a more gradual degradation of bond capacity with increasing slip.
These findings highlight the critical influence of surface configuration on both ultimate bond strength and post-peak behavior, providing important insights for optimizing GFRP reinforcement design in concrete structures based on specific performance requirements.
3.4.5. Effect of GFRP Bar Diameter
Figure 18 and
Figure 19 present a comparative analysis of bond stress-slip curves and bond strength across thirteen specimen pairs with different GFRP reinforcement diameters while maintaining consistent values for all other parameters. The paired specimen groups include: Groups 1 and 9, Groups 4 and 10, Groups 5 and 11, Groups 6 and 12, Groups 7 and 13, Groups 8 and 14, Groups 15 and 17, Groups 16 and 18, Groups 19 and 21, Groups 20 and 22, Groups 23 and 26, Groups 24 and 27, and Groups 25 and 28.
Analysis of these results indicates that GFRP reinforcement diameter exerts minimal influence on bond strength performance. This limited effect may be attributed to the relatively narrow range of bar diameters examined in this study, which included only 16 mm and 20 mm variants. The modest 4 mm difference between these two diameters appears insufficient to produce statistically significant variations in bond behavior.
The absence of a strong diameter effect in this investigation suggests that within this specific diameter range, other parameters such as concrete cover thickness, concrete compressive strength, surface configuration, and transverse reinforcement may play more dominant roles in determining bond performance. Future research examining a broader spectrum of GFRP reinforcement diameters would be valuable to establish whether more pronounced diameter effects emerge across a wider size range.
3.4.6. Effect of Bond Length
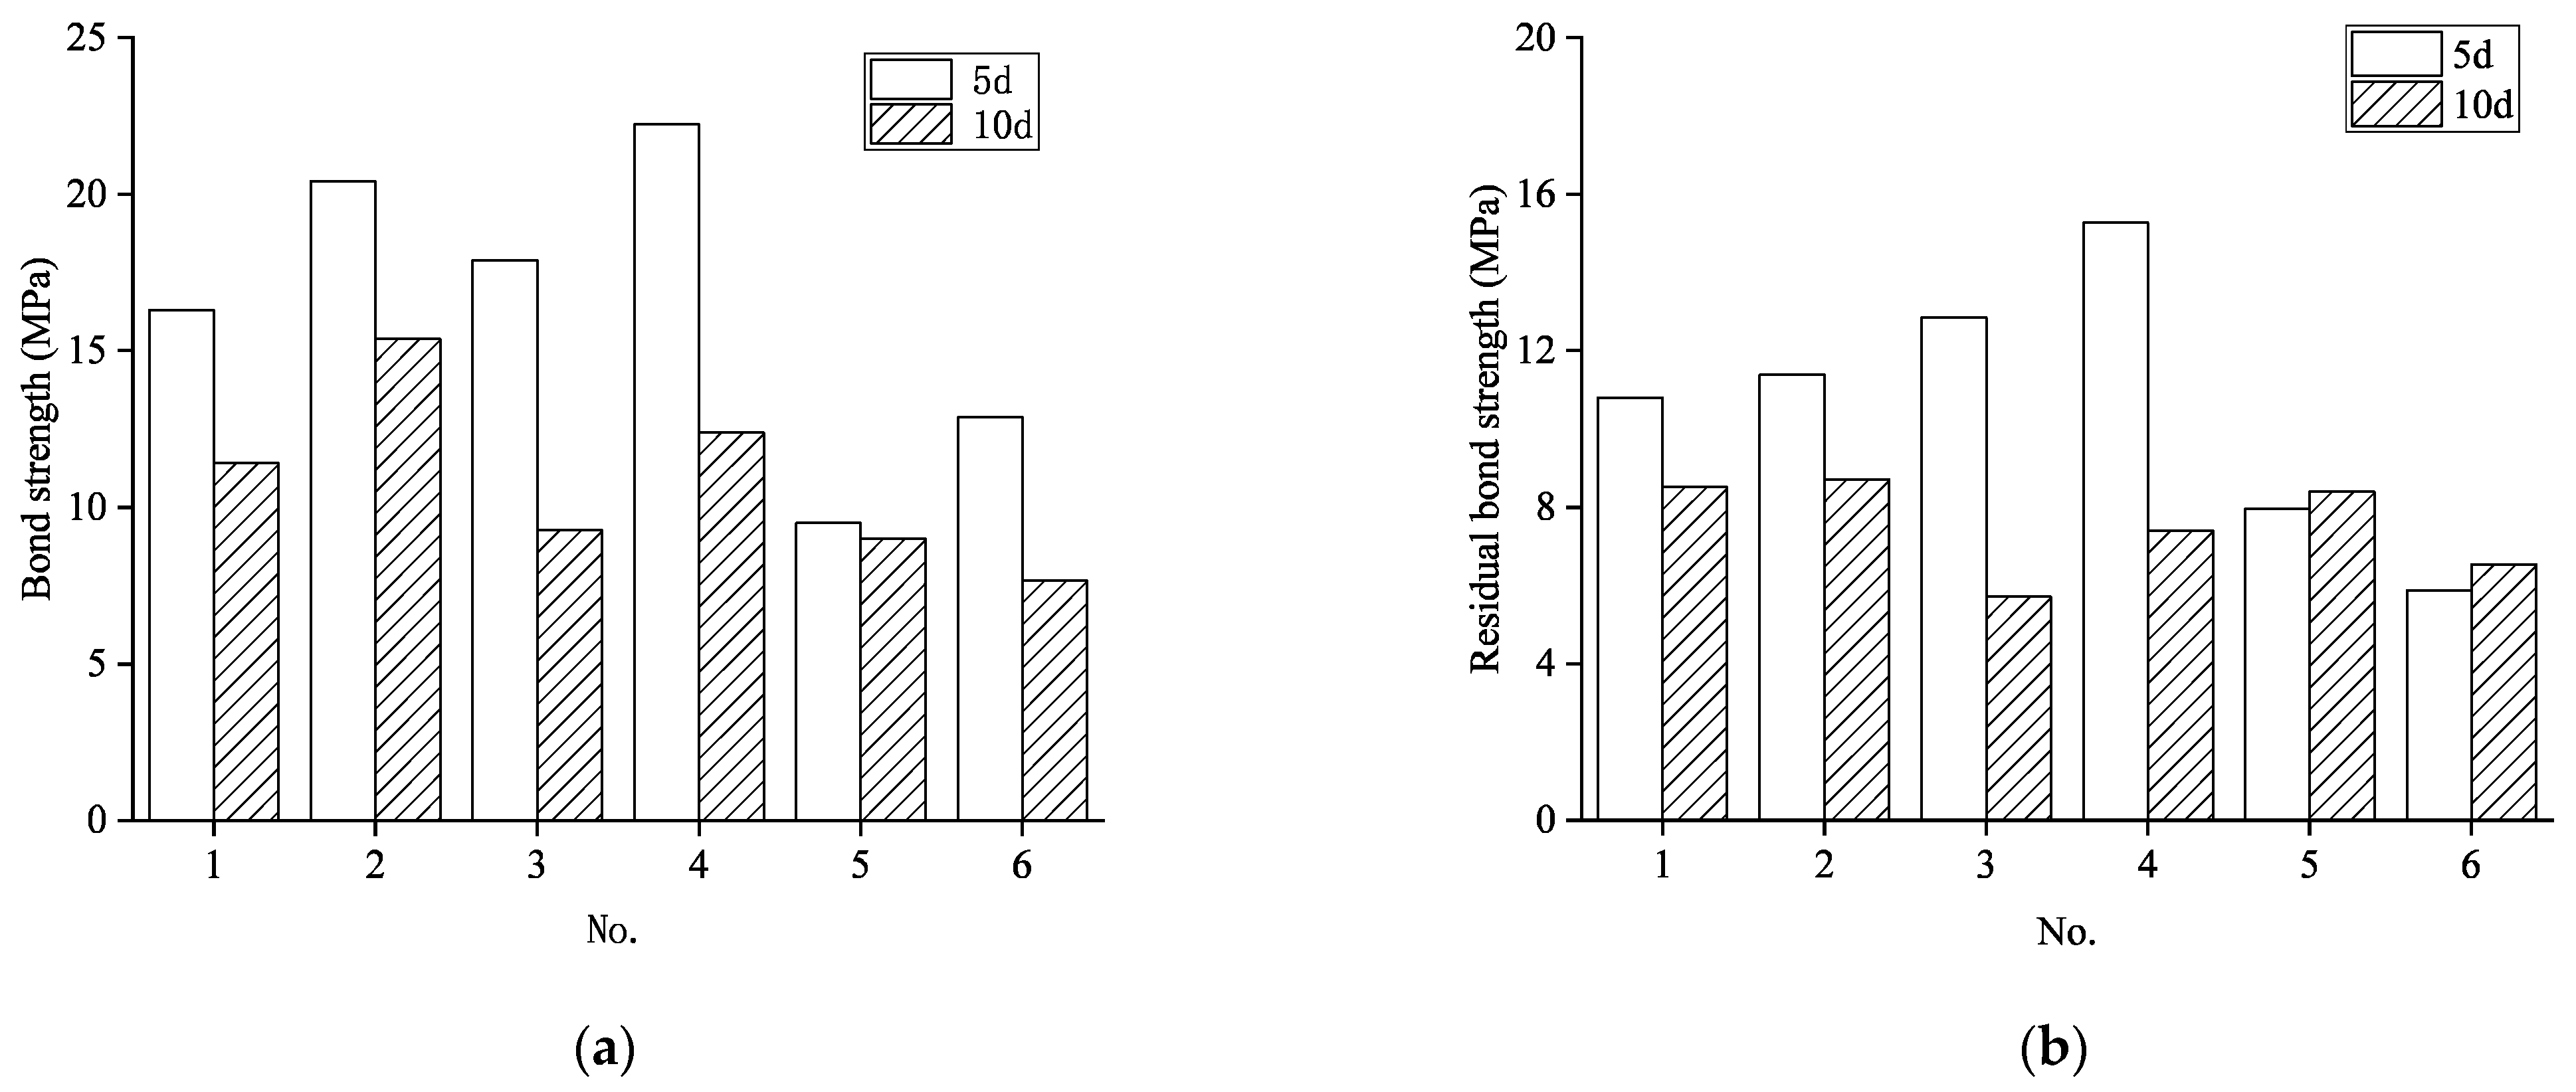
Figure 20 and
Figure 21 examine six pairs of specimens with varying embedment lengths to evaluate their influence on bond behavior. The paired specimen groups included: Groups 4 and 19, Groups 7 and 20, Groups 10 and 21, Groups 13 and 22, Groups 23 and 24, and Groups 26 and 27. Analysis of bond strength and stress-slip relationships across different embedment lengths, while maintaining consistency in all other parameters, yielded two significant findings:
- (1)
Impact on bond strength
As illustrated in
Figure 21, specimens with longer embedment lengths (10d) exhibited substantially lower average bond strength compared to their shorter counterparts (5d), with reductions ranging from 5.67% to 92.99%. This counter-intuitive relationship stems from the non-uniform distribution of bond stress along the reinforcement. In specimens with greater embedment length, bond stress concentrates in relatively shorter high-stress regions near the loaded end, while substantial portions of the embedded bar experience minimal stress, resulting in lower average bond strength values.
Conversely, specimens with shorter embedment lengths develop more uniform stress distributions with proportionally longer high-stress regions, thereby yielding higher average bond strength, as depicted in
Figure 22. This explains the apparently paradoxical observation that while the ultimate pullout force increases with embedment length, the calculated average bond strength actually decreases. These findings align with the experimental results reported by Wang [
57].
- (2)
Effect on initial bond stiffness
Figure 20 presents the bond stress-slip relationships for specimens with different embedment lengths. A clear trend emerges showing that initial bond stiffness (represented by the slope of the ascending branch of the stress-slip curve) increases progressively with embedment length. This enhanced initial stiffness in specimens with greater embedment length reflects the increased system rigidity provided by the larger bonded interface area between the GFRP reinforcement and surrounding concrete.
These findings highlight the significant influence of embedment length on both bond strength and load-deformation characteristics, emphasizing the importance of considering this parameter in the design and analysis of GFRP-reinforced concrete elements.
4. Design Suggestions
Previous research [
58] has established a critical distinction in bond behavior based on failure modes: under splitting failure conditions, bond strength between FRP reinforcement and concrete increases proportionally with concrete cover thickness or transverse reinforcement ratio. Conversely, under pullout failure conditions, the bond strength remains largely unaffected by these same parameters. This divergence occurs because pullout failures involve shearing of the concrete keys between reinforcement ribs under sufficient confinement, while splitting failures are governed by the lateral confinement capacity provided by the concrete cover and transverse reinforcement.
This fundamental difference in behavioral response highlights a significant limitation in current design codes, which generally provide bond strength equations without differentiation between failure modes. Such an approach fails to account for the varying influences of design parameters across different failure mechanisms, potentially leading to either overly conservative or unsafe designs depending on the governing failure mode.
The scarcity of failure mode classification criteria in both domestic and international research literature has contributed to this shortcoming. Yan [
9] provides valuable initial guidance, suggesting that splitting failure typically governs when concrete cover ranges from 1 to 3 times the GFRP bar diameter, while pullout failure becomes dominant when cover thickness exceeds 3 times the bar diameter. However, this criterion considers only cover thickness without accounting for the confinement contribution of transverse reinforcement.
While multiple factors influence the failure mode transition, concrete cover thickness and transverse reinforcement represent the most significant parameters governing confinement capacity. Drawing upon methodologies developed by Xu, Lin [
27,
53] for conventional reinforced concrete, a more comprehensive approach for GFRP-reinforced concrete can be formulated. This approach employs a constraint parameter
K to characterize the combined confining effect of concrete cover and transverse reinforcement on the GFRP reinforcement.
This constraint parameter would provide a rational basis for distinguishing between splitting and pullout failure modes, enabling more precise bond strength predictions that account for the differential effects of design parameters based on the governing failure mechanism.
where
denotes the concrete cover thickness, which is the distance from the surface of the GFRP bar to the outer surface of the concrete member.
represents the diameter of the GFRP bar.
indicates the conversion coefficient.
equates the stirrup confinement index proposed by Xu et al. [
11].
means the cross-sectional area of the stirrup through the split surface.
denotes the stirrup spacing. It should be noted that only one specimen was tested per parameter combination in this study. Consequently, the analytical expressions and comparative results presented in
Section 4 are derived from individual observations for each series. Future studies should incorporate multiple replicates per parameter combination to verify the observed trends, quantify experimental variability, and validate the proposed models with robust statistical confidence.
4.1. Bond Strength
4.1.1. Splitting Mode
The fundamental mechanism of splitting failure in GFRP-reinforced concrete specimens occurs when the circumferential tensile stress generated by GFRP reinforcement on the surrounding concrete reaches the concrete’s tensile strength. Consequently, the combined confinement capacity provided by concrete cover and transverse reinforcement significantly influences bond performance. Current research [
15] demonstrates that under splitting failure modes, greater confinement capacity promotes more effective interaction between GFRP reinforcement and concrete prior to bond failure, resulting in enhanced bond strength.
Based on a comprehensive analysis of the experimental data from this investigation, the following prediction formula for bond strength between GFRP reinforcement and concrete is proposed:
where
represents the adjustment factor of surface configuration, 1.0 for ribbed GFRP bars and 0.85 for sand-coating GFRP bars.
denotes the bond strength between GFRP bar and concrete.
means the compressive strength of concrete.
is the diameter of the GFRP bar.
denotes the embedded (bond) length of the GFRP bar.
K is the constraint parameter, which is the comprehensive confinement capacity of both the concrete cover and transverse stirrups on GFRP bars.
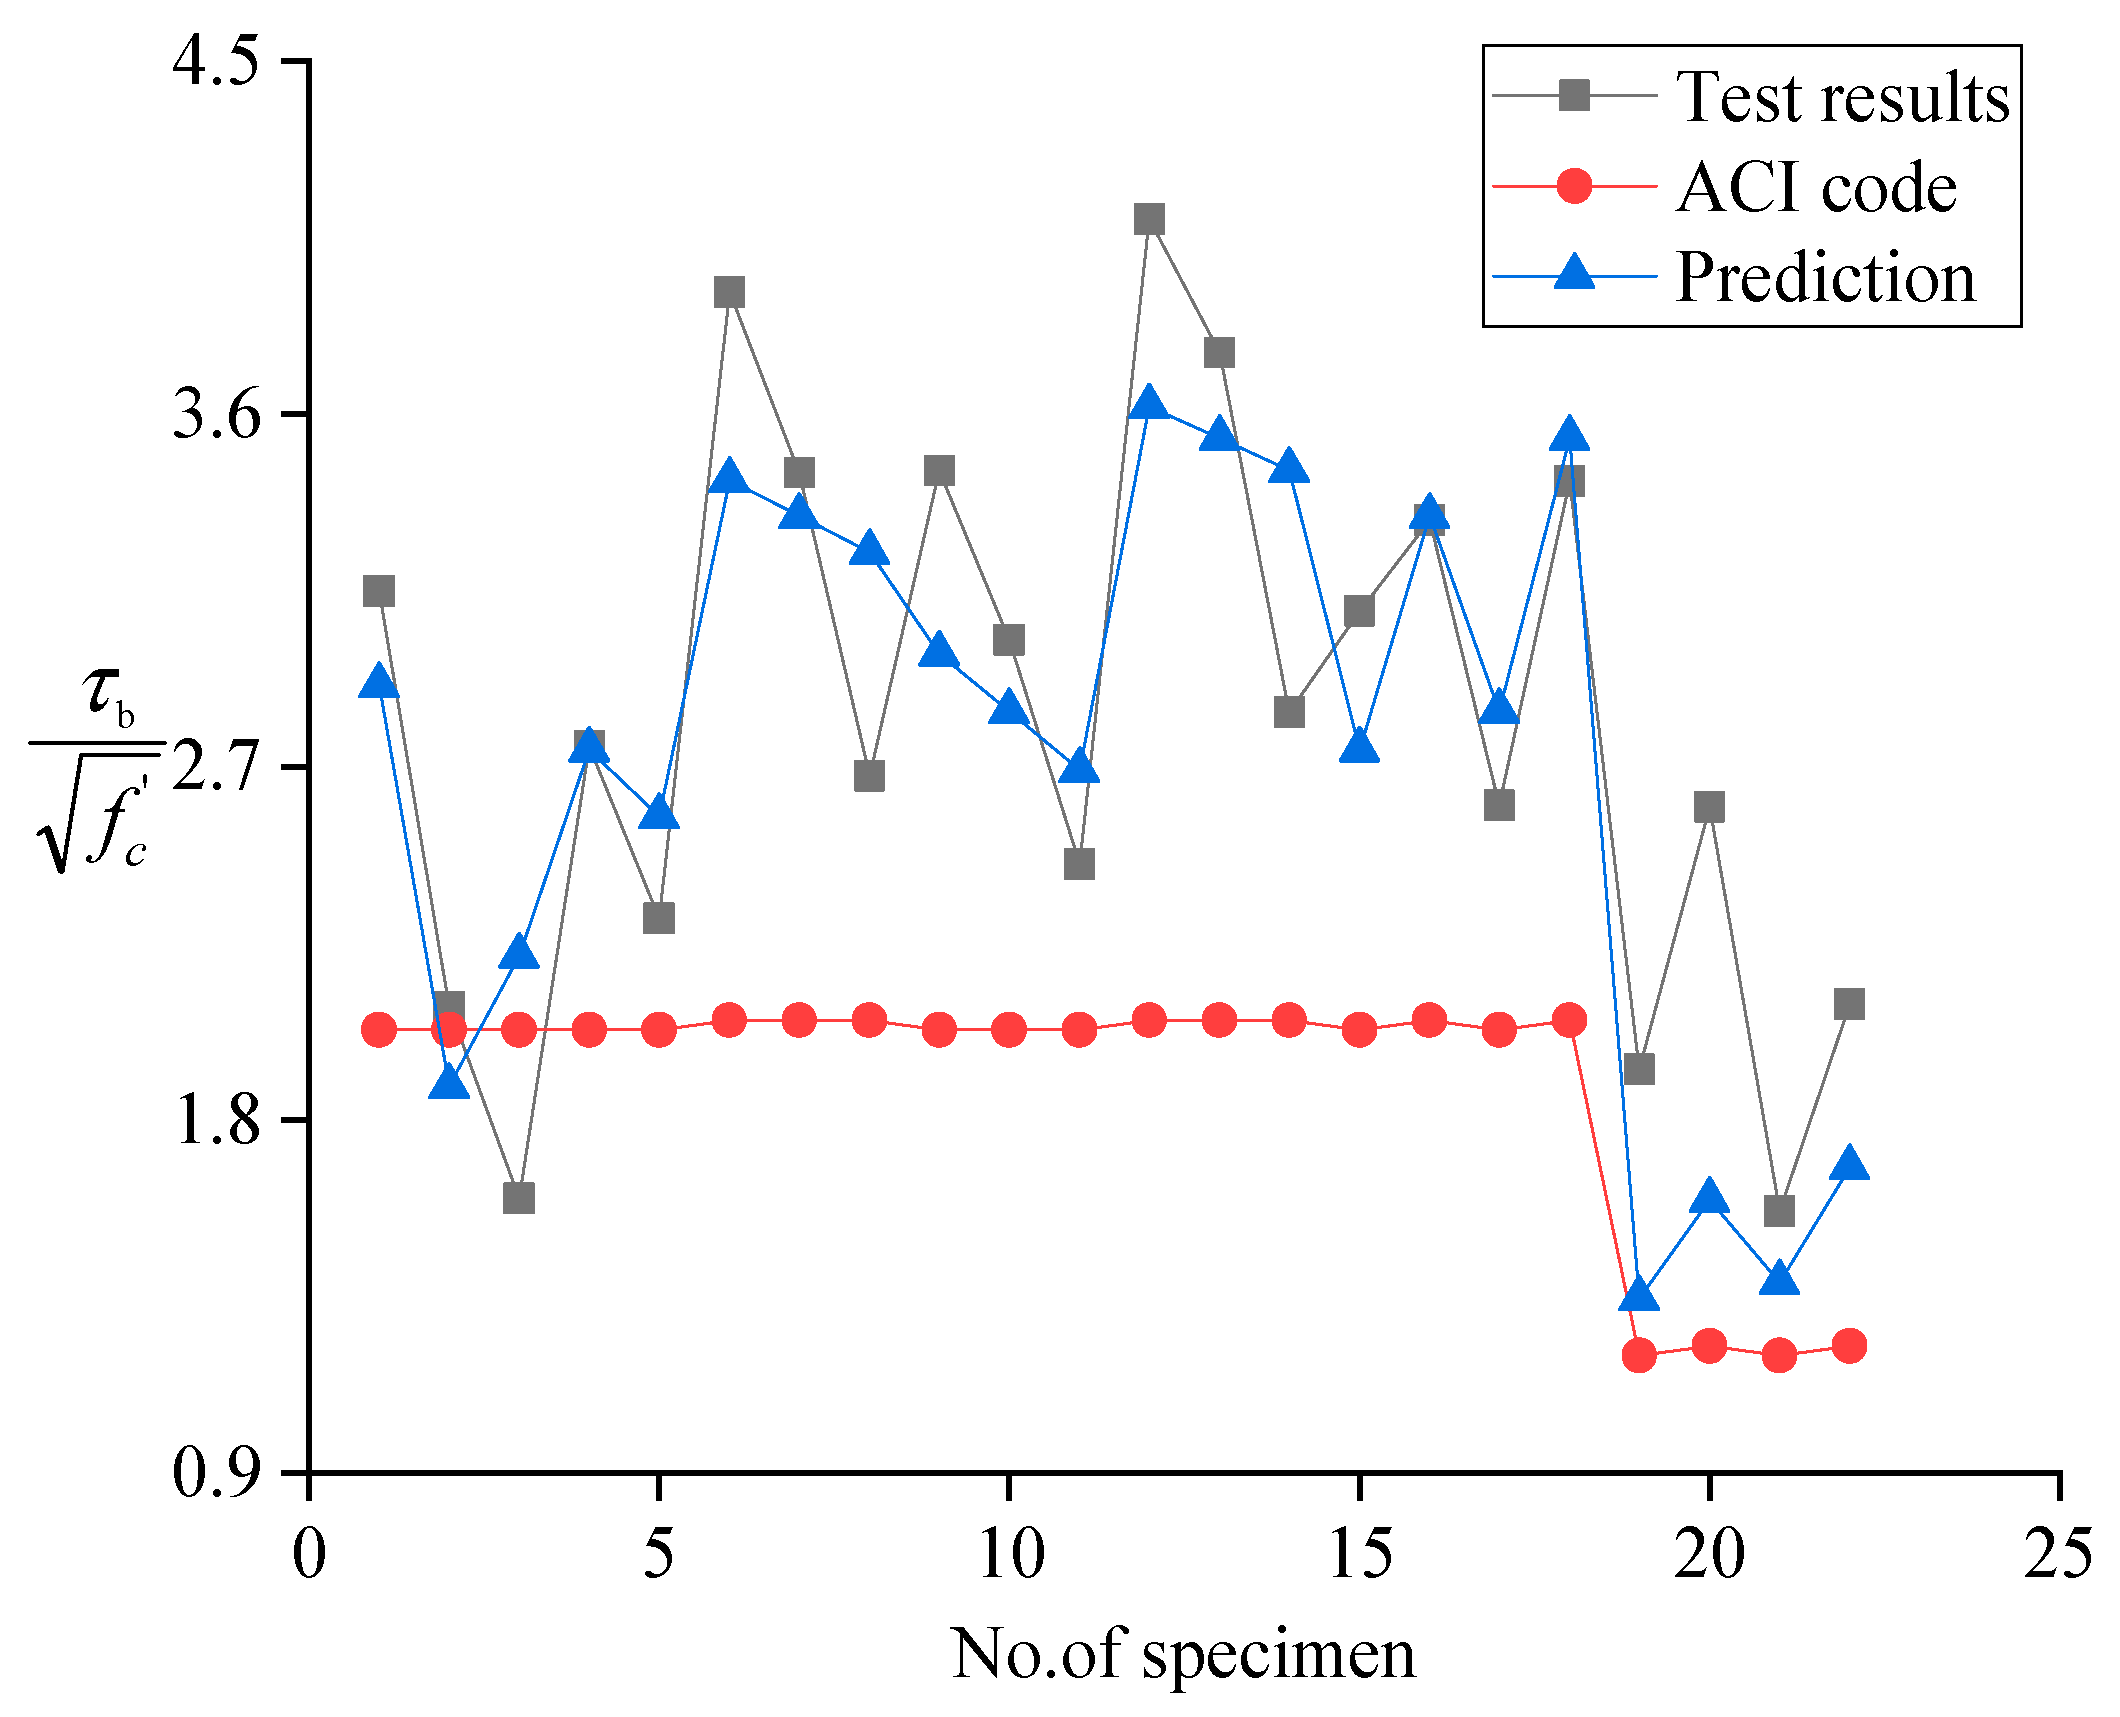
Figure 23 presents a comparative analysis about
in Equation (4) between the experimental values obtained in this study and the predicted values from both the American code provision (ACI440.1R-06) [
3]. The comparison clearly demonstrates that the predictions from Equation (4) align significantly better with the experimental results than those from the ACI code. The predictions exhibit excellent alignment with the test results, as evidenced by the mean value, standard deviation (STD) and coefficient of variation (CoV) of the prediction-to-test ultimate load ratios being 0.970, 0.173, and 0.179, respectively. This improved accuracy can be attributed to the incorporation of both surface configuration effects and confinement parameters in the proposed equation, which more comprehensively accounts for the key factors influencing bond behavior in GFRP-reinforced concrete elements.
The enhanced predictive capability of the proposed equation provides designers with a more reliable tool for calculating bond strength in GFRP-reinforced concrete structures, potentially leading to more efficient and economical designs while maintaining structural safety and integrity.
4.1.2. Pull-Out Mode
The fundamental characteristic of pull-out failure in GFRP-reinforced concrete involves the continuous deformation and abrasion of the GFRP reinforcement under compressive forces exerted by concrete between the transverse ribs. In this failure mechanism, once sufficient confinement is provided to prevent splitting, the ultimate bond strength becomes governed primarily by the shear resistance of concrete between ribs or the surface properties of the reinforcement, rather than by external confinement.
Consequently, when the confinement parameter K exceeds 3, further increases in external confinement (whether through additional concrete cover or transverse reinforcement) produce negligible improvements in bond strength. This threshold represents the transition point where the failure mode shifts definitively from splitting to pull-out, and additional confinement no longer contributes significantly to bond capacity.
For pull-out failure mode, the bond strength prediction formula can be expressed as:
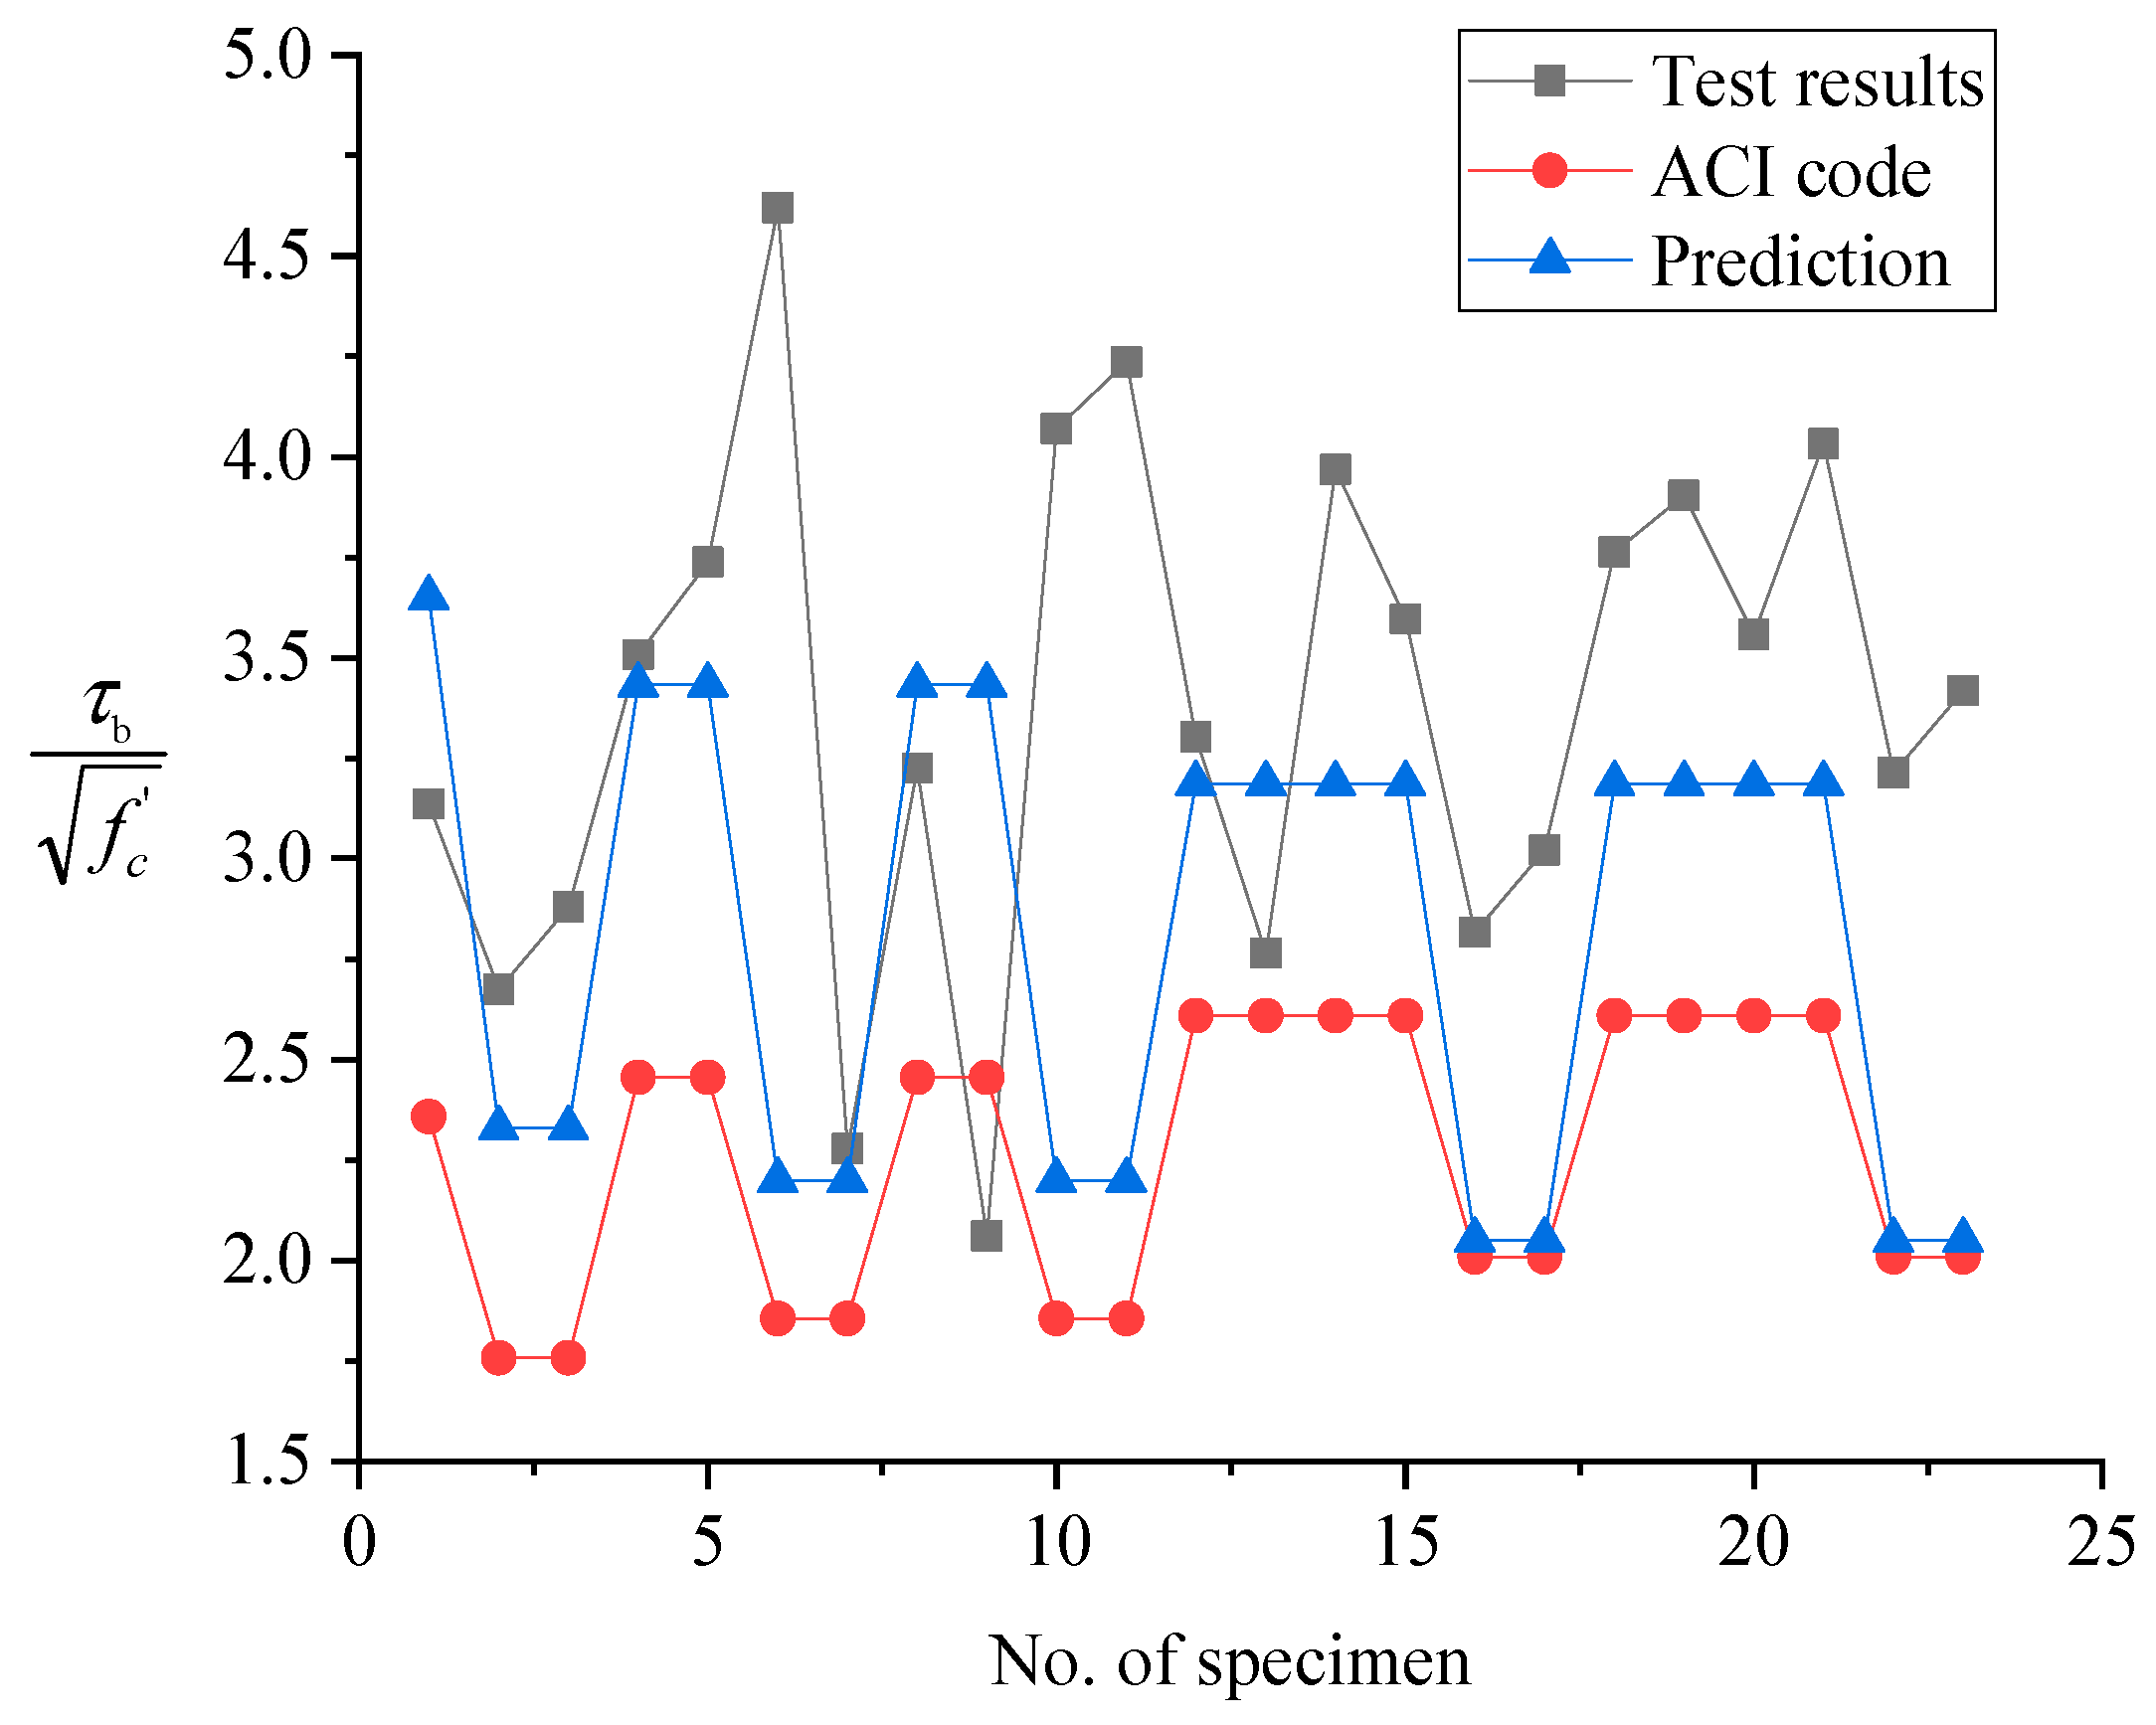
Figure 24 presents a comparative analysis between the experimental results from Defreese [
59] and the predicted values from both the American code provision (ACI440.1R-06) [
3] and Equation (5). This equation recognizes that bond strength in pull-out failure reaches an upper limit determined primarily by concrete strength and reinforcement surface properties, with the confinement effect effectively capped at
K = 3. This approach provides a rational basis for bond strength prediction across the full spectrum of confinement conditions, acknowledging the different mechanisms governing splitting and pull-out failures in GFRP-reinforced concrete elements.
While the ACI 440.11-06 guideline provides a widely adopted basis for GFRP bar bond and development length evaluation, several more recent studies have proposed updated models considering new experimental data and improved understanding of GFRP-concrete bond behavior. For instance, Gouda et al. [
54] proposed new development length equations tailored for GFRP bars in flexural RC members. Their approach better accounts for bar surface condition and bond-critical parameters. Ortiz et al. [
55] introduced a revised lap splice length equation incorporating factors such as confinement and cover, while Hosseini et al. [
56] conducted a comprehensive study on the bond behavior of lap spliced GFRP bars, including the effects of different transverse reinforcement arrangements and bar profiles. Notably, the Gouda and Hosseini equations better capture the effects of transverse reinforcement and bar surface on bond performance, which is consistent with the trends observed in this research.
The code provisions in ACI 440.1R-06 fall short mainly because they do not differentiate failure modes (splitting vs. pullout), give limited consideration to transverse confinement effects, and do not explicitly capture the combined influence of cover thickness, stirrup confinement, and surface configuration. The proposed approach introduces a confinement parameter K and a surface factor α, and uses mode-specific equations (Equation (4) for splitting mode and Equation (5) for pullout mode). As shown in
Figure 23 and
Figure 24, these equations provide much closer agreement with the test data than ACI 440.1R-06, particularly in reflecting the strong sensitivity of both peak and residual bond strengths to confinement and surface configuration.
4.2. Bond Length
Under loading conditions, GFRP-reinforced concrete elements may experience either reinforcement rupture or bond failure. For a specific component, the ultimate tensile strength of the GFRP reinforcement remains constant, while the anchorage force between concrete and GFRP reinforcement increases proportionally with development length. The critical condition occurs when the anchorage force precisely equals the ultimate tensile strength, resulting in simultaneous bond failure and reinforcement rupture. The development length corresponding to this threshold condition is defined as the “basic development length.” In practical design applications, reliable structural performance necessitates ensuring that bond failure between GFRP reinforcement and concrete precedes reinforcement rupture.
The ultimate bond force between GFRP reinforcement and concrete can be expressed in terms of ultimate bond strength:
where
indicates the ultimate axial force;
means anchorage length;
denotes average bond strength.
By substituting the bond strength prediction equations (either Equations (4) or (5), depending on the failure mode) into Equation (7), the following development length equations for GFRP reinforcement can be obtained:
The final basic development length is determined by decoupling the above equation and selecting the larger value between the development lengths calculated for splitting and pullout failure modes. This approach ensures that sufficient anchorage is provided regardless of the governing failure mechanism, thereby maintaining structural integrity and safety under design loads.
By harnessing realistic (experiment-calibrated) bond strengths under good confinement, designers can reduce development and splice lengths relative to ACI 440.1R-06, easing bar layout at member ends, reducing congestion, and improving constructability. In practice, first quantify the transverse confinement by computing the parameter K, which combines the effects of concrete cover and transverse reinforcement; then classify the governing failure mode based on K: if K is below the threshold, treat the bond as splitting-controlled and use the splitting equation, whereas if K ≥ 3 (per our study), treat it as pullout-controlled and use the pullout equation. Incorporate the bar surface configuration through the appropriate surface factor (ribbed vs. sand-coated), and finally compute the required development length using the mode-specific bond strength; for robustness when K is near the boundary, adopt the larger of the two mode-based development lengths.
This methodology provides a rational basis for determining the minimum development length required to fully utilize the tensile capacity of GFRP reinforcement in concrete structures, accounting for the influential parameters identified in this experimental investigation.

