
Latent Psychological Pathways in Thermal Comfort Perception: The Mediating Role of Cognitive Uncertainty on Depression and Vigour


Abstract
1. Introduction
2. Materials and Methods
2.1. Participants and General Procedure
2.2. Case Building
2.3. Instruments and Data Collection
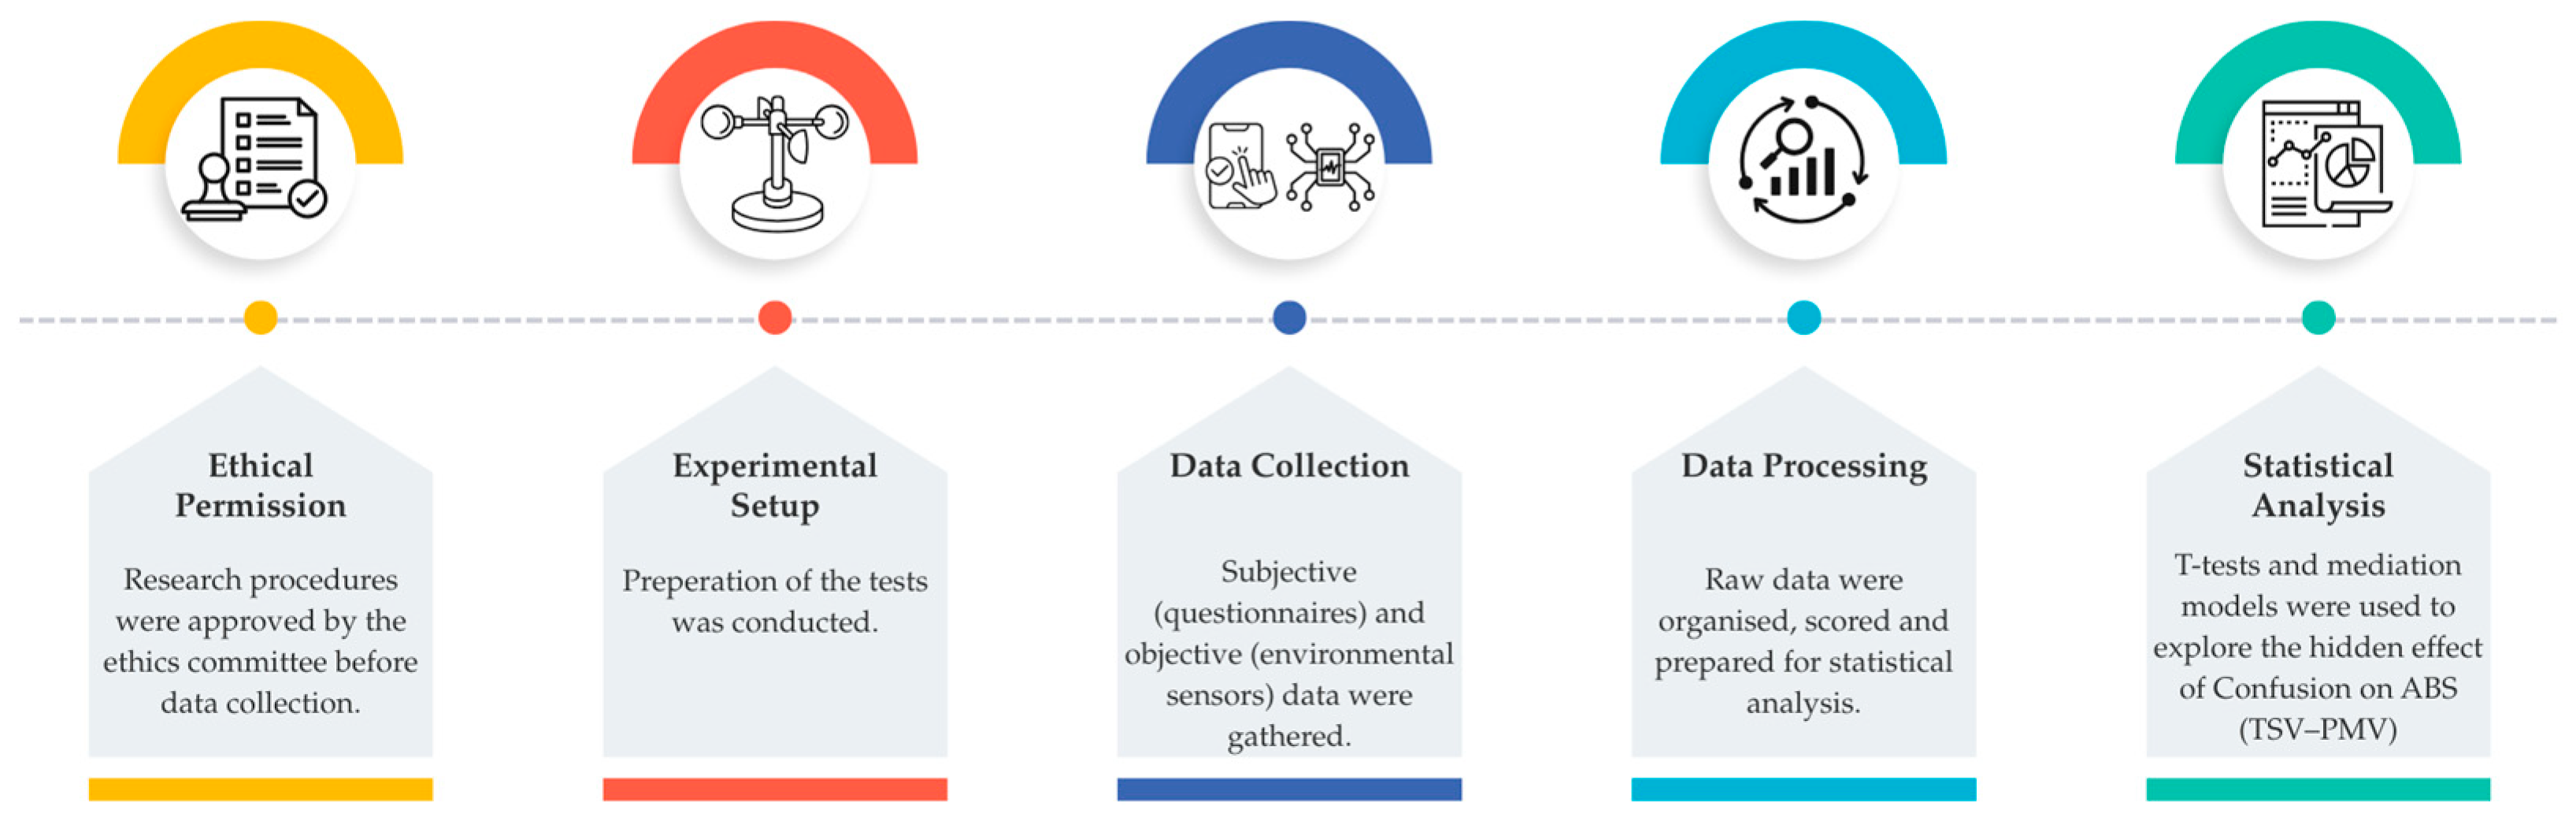
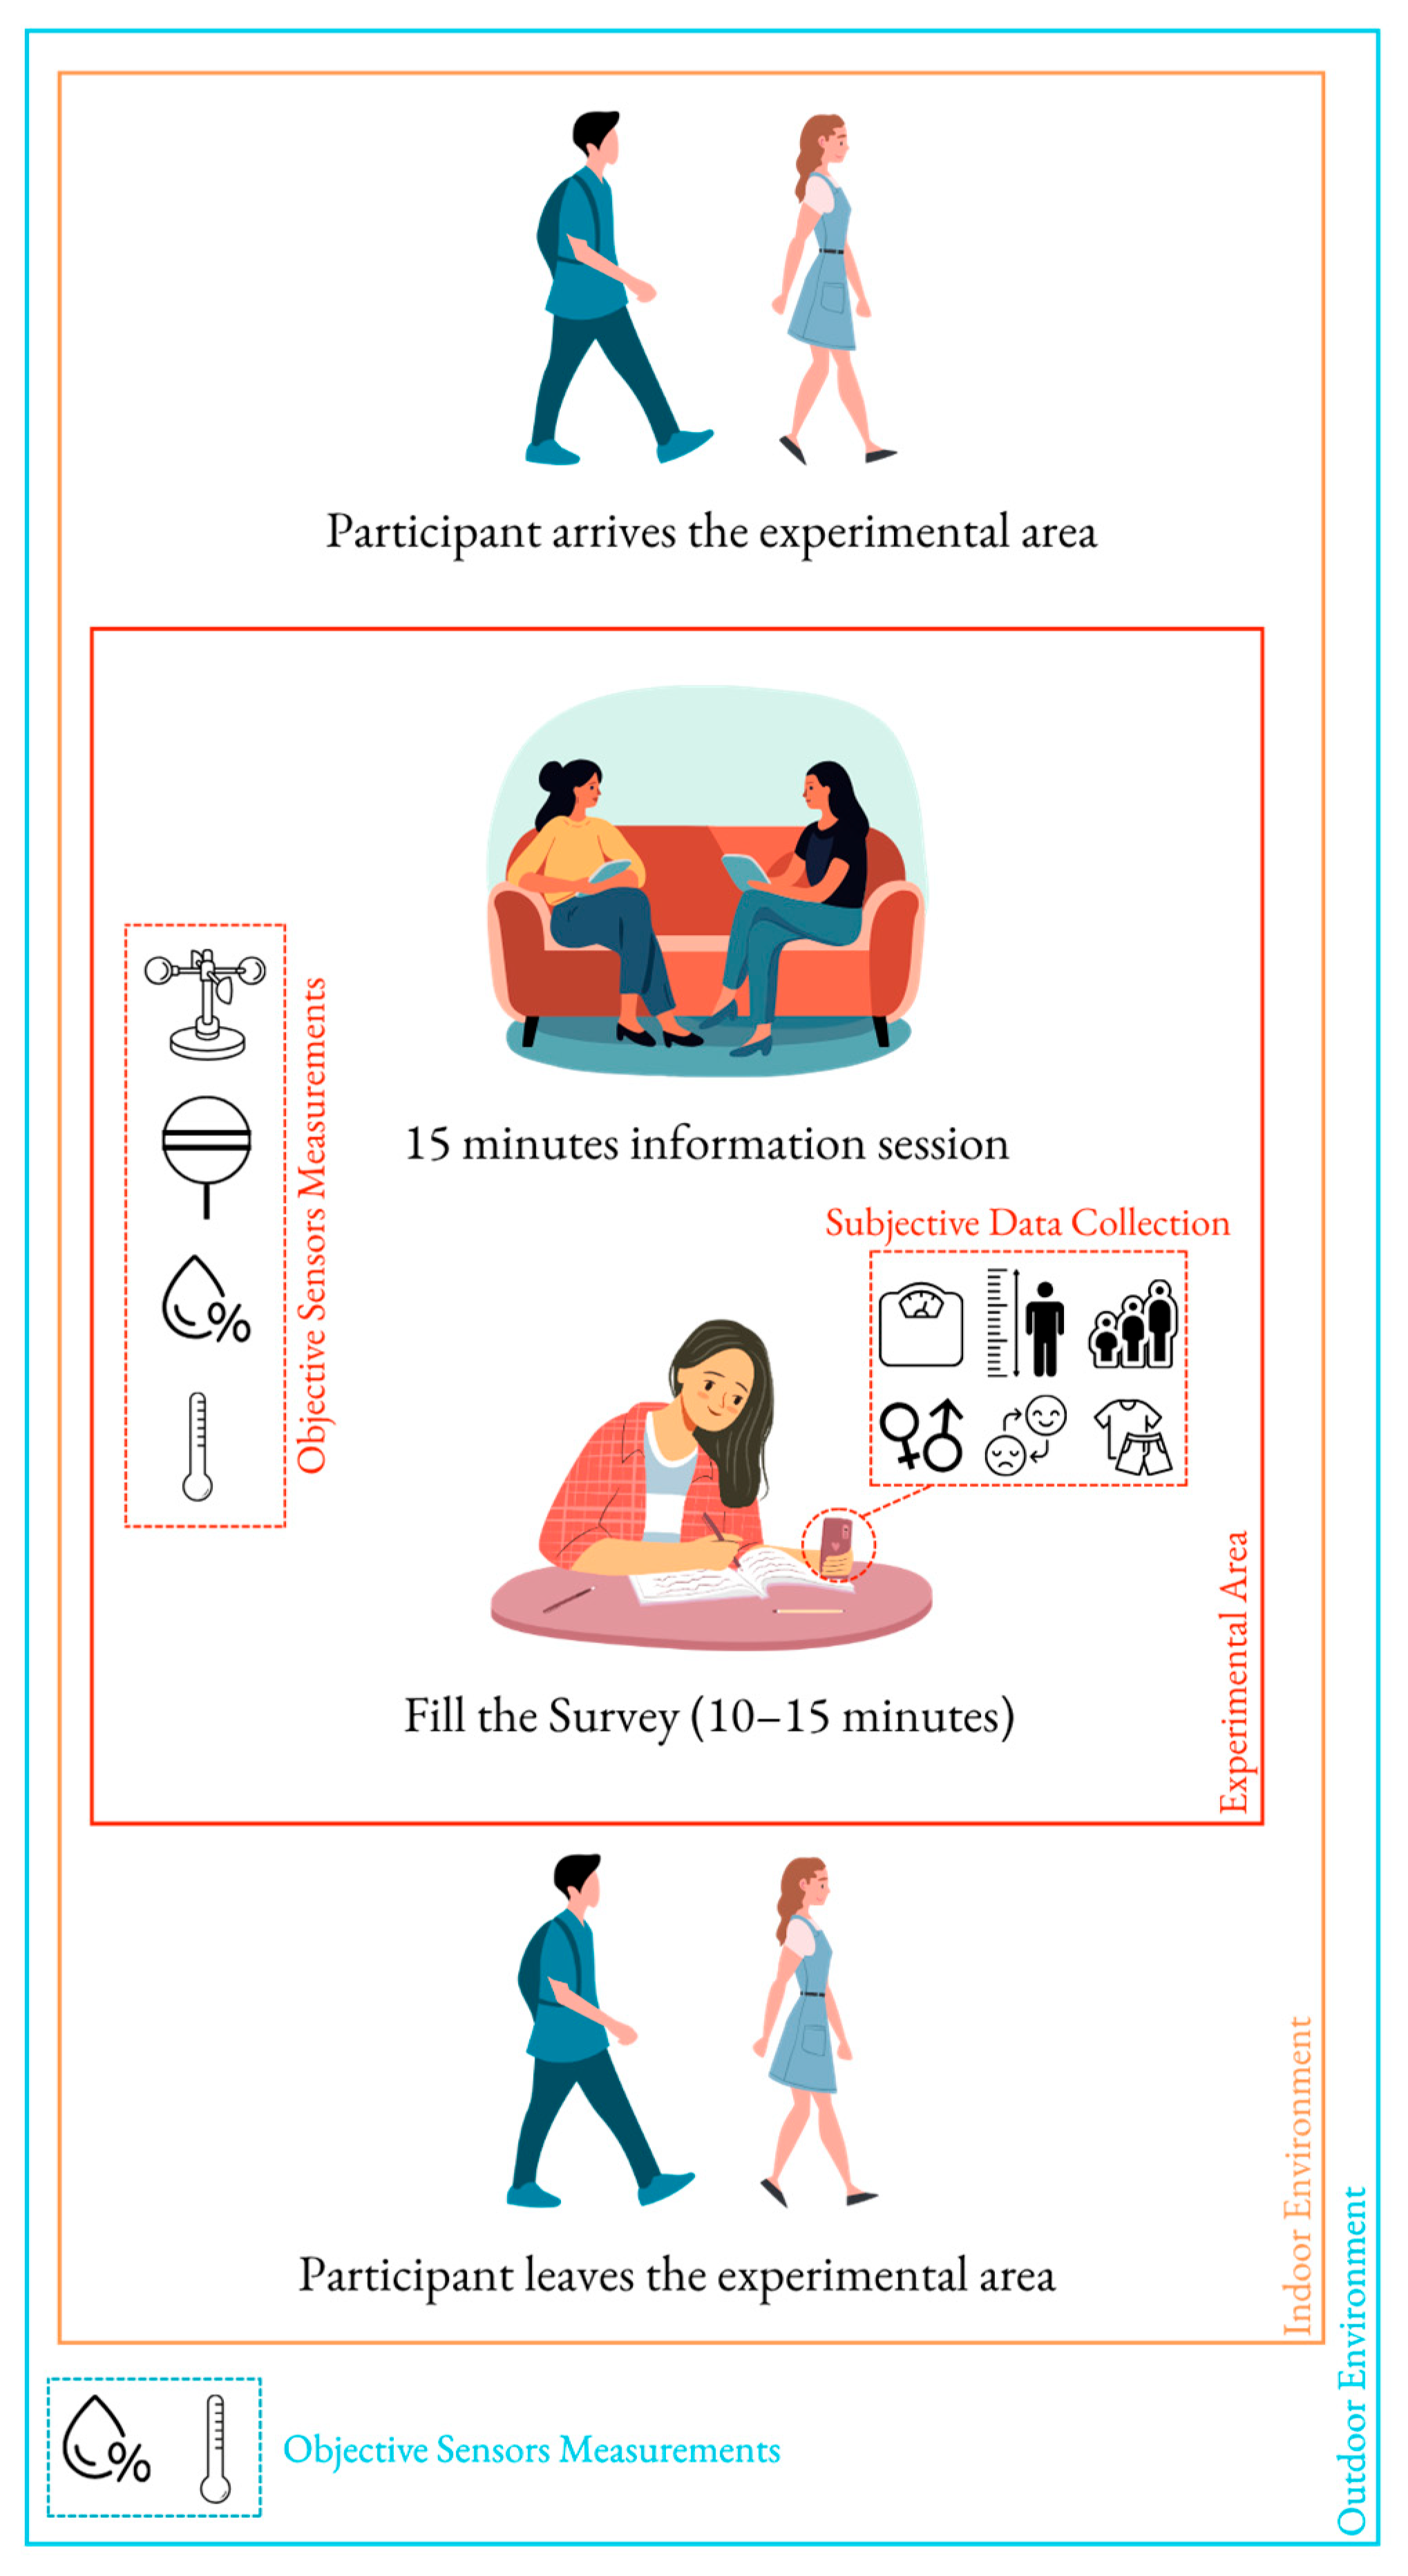
- Study conducted between August 2021 and August 2022, during office hours.
- Indoor conditions (air temperature, humidity, globe temperature, and air velocity) logged every minute with calibrated sensors at 1.1 m height.
- Outdoor temperature and humidity monitored using a separate data logger.
- Participants submitted their personal data (gender, age, clothing, mood, and thermal sensation) via a developed mobile application.
- A 15 min rest period before starting the experiments ensured a stable metabolic rate (1.1 met).
- Basic clothing insulation values were calculated based on ASHRAE-55 [1].
- The POMS questionnaire was used for psychological assessment, and the average scores of each subscale were calculated before conducting the data analysis.
2.4. Statistical Analysis
3. Results
4. Discussion
5. Conclusions
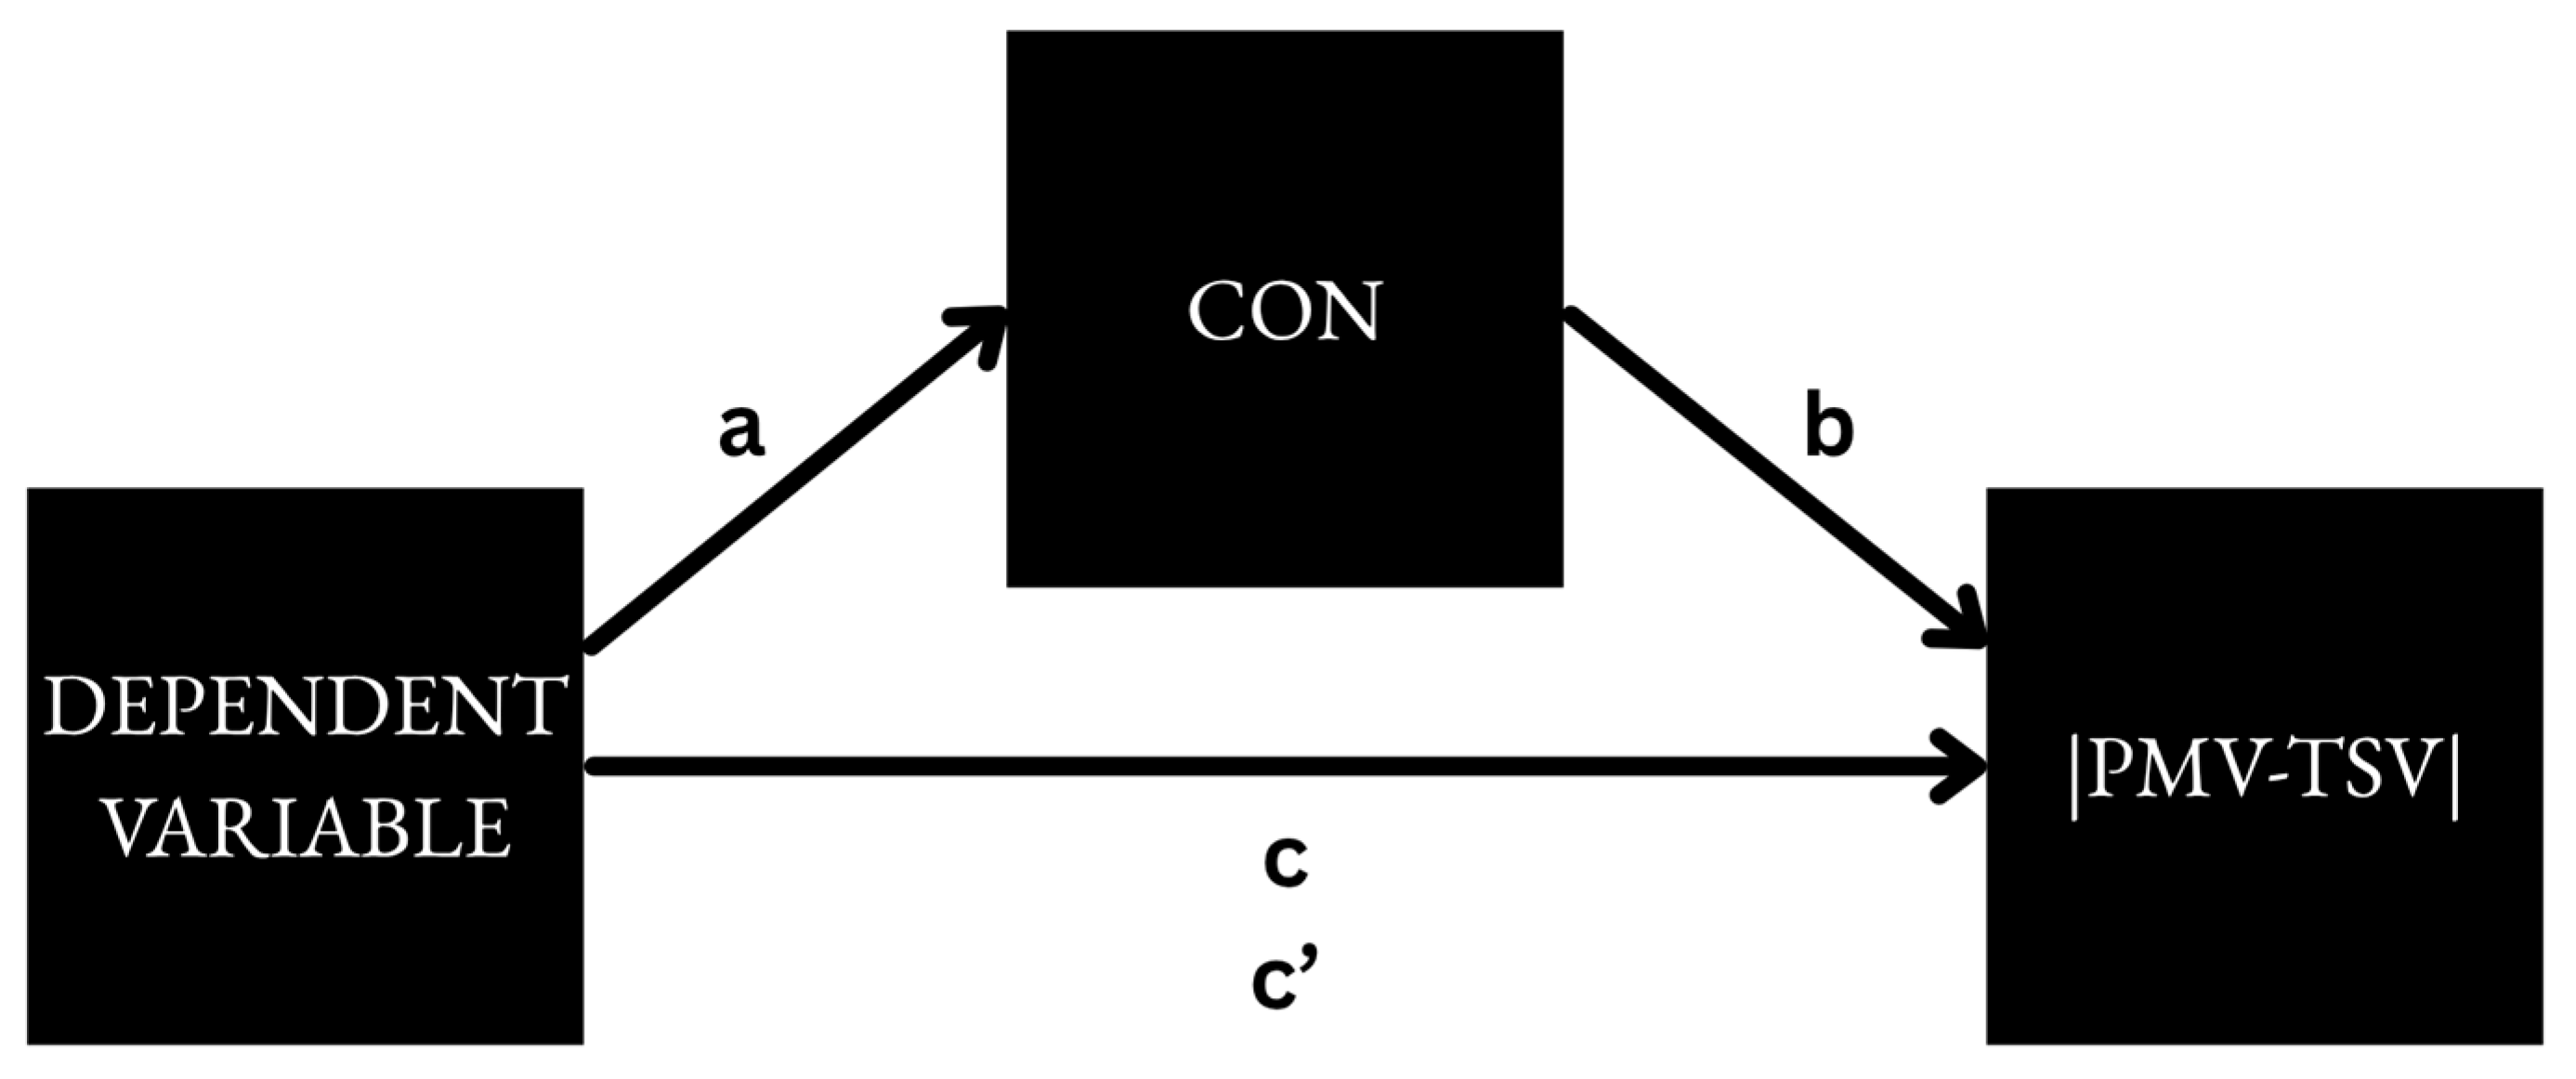
- Confusion significantly mediated the relationship between VIG and ABS (PMV-TSV) in female participants, with an 8.94% indirect-to-total effect ratio.
- Confusion also mediated the relationship between DEP and ABS (PMV-TSV) in male participants, with a 38.44% indirect-to-total effect ratio.
- As a conjecture, if we consider previously reported direct effects of VIG (0.31) and DEP (0.30) on ABS (PMV-TSV) from studies without gender differentiation, CON may contribute approximately 0.03 (8.94% of 0.31) in females and approximately 0.12 (38.44% of 0.30) in males. It is vital to emphasise that these values are approximations, based on prior literature that did not account for gender-specific analysis.
- These results indicate that the CON subscale plays a more critical role in thermal comfort perception than previously assumed.
Author Contributions
Funding
Data Availability Statement
Acknowledgments
Conflicts of Interest
Abbreviations
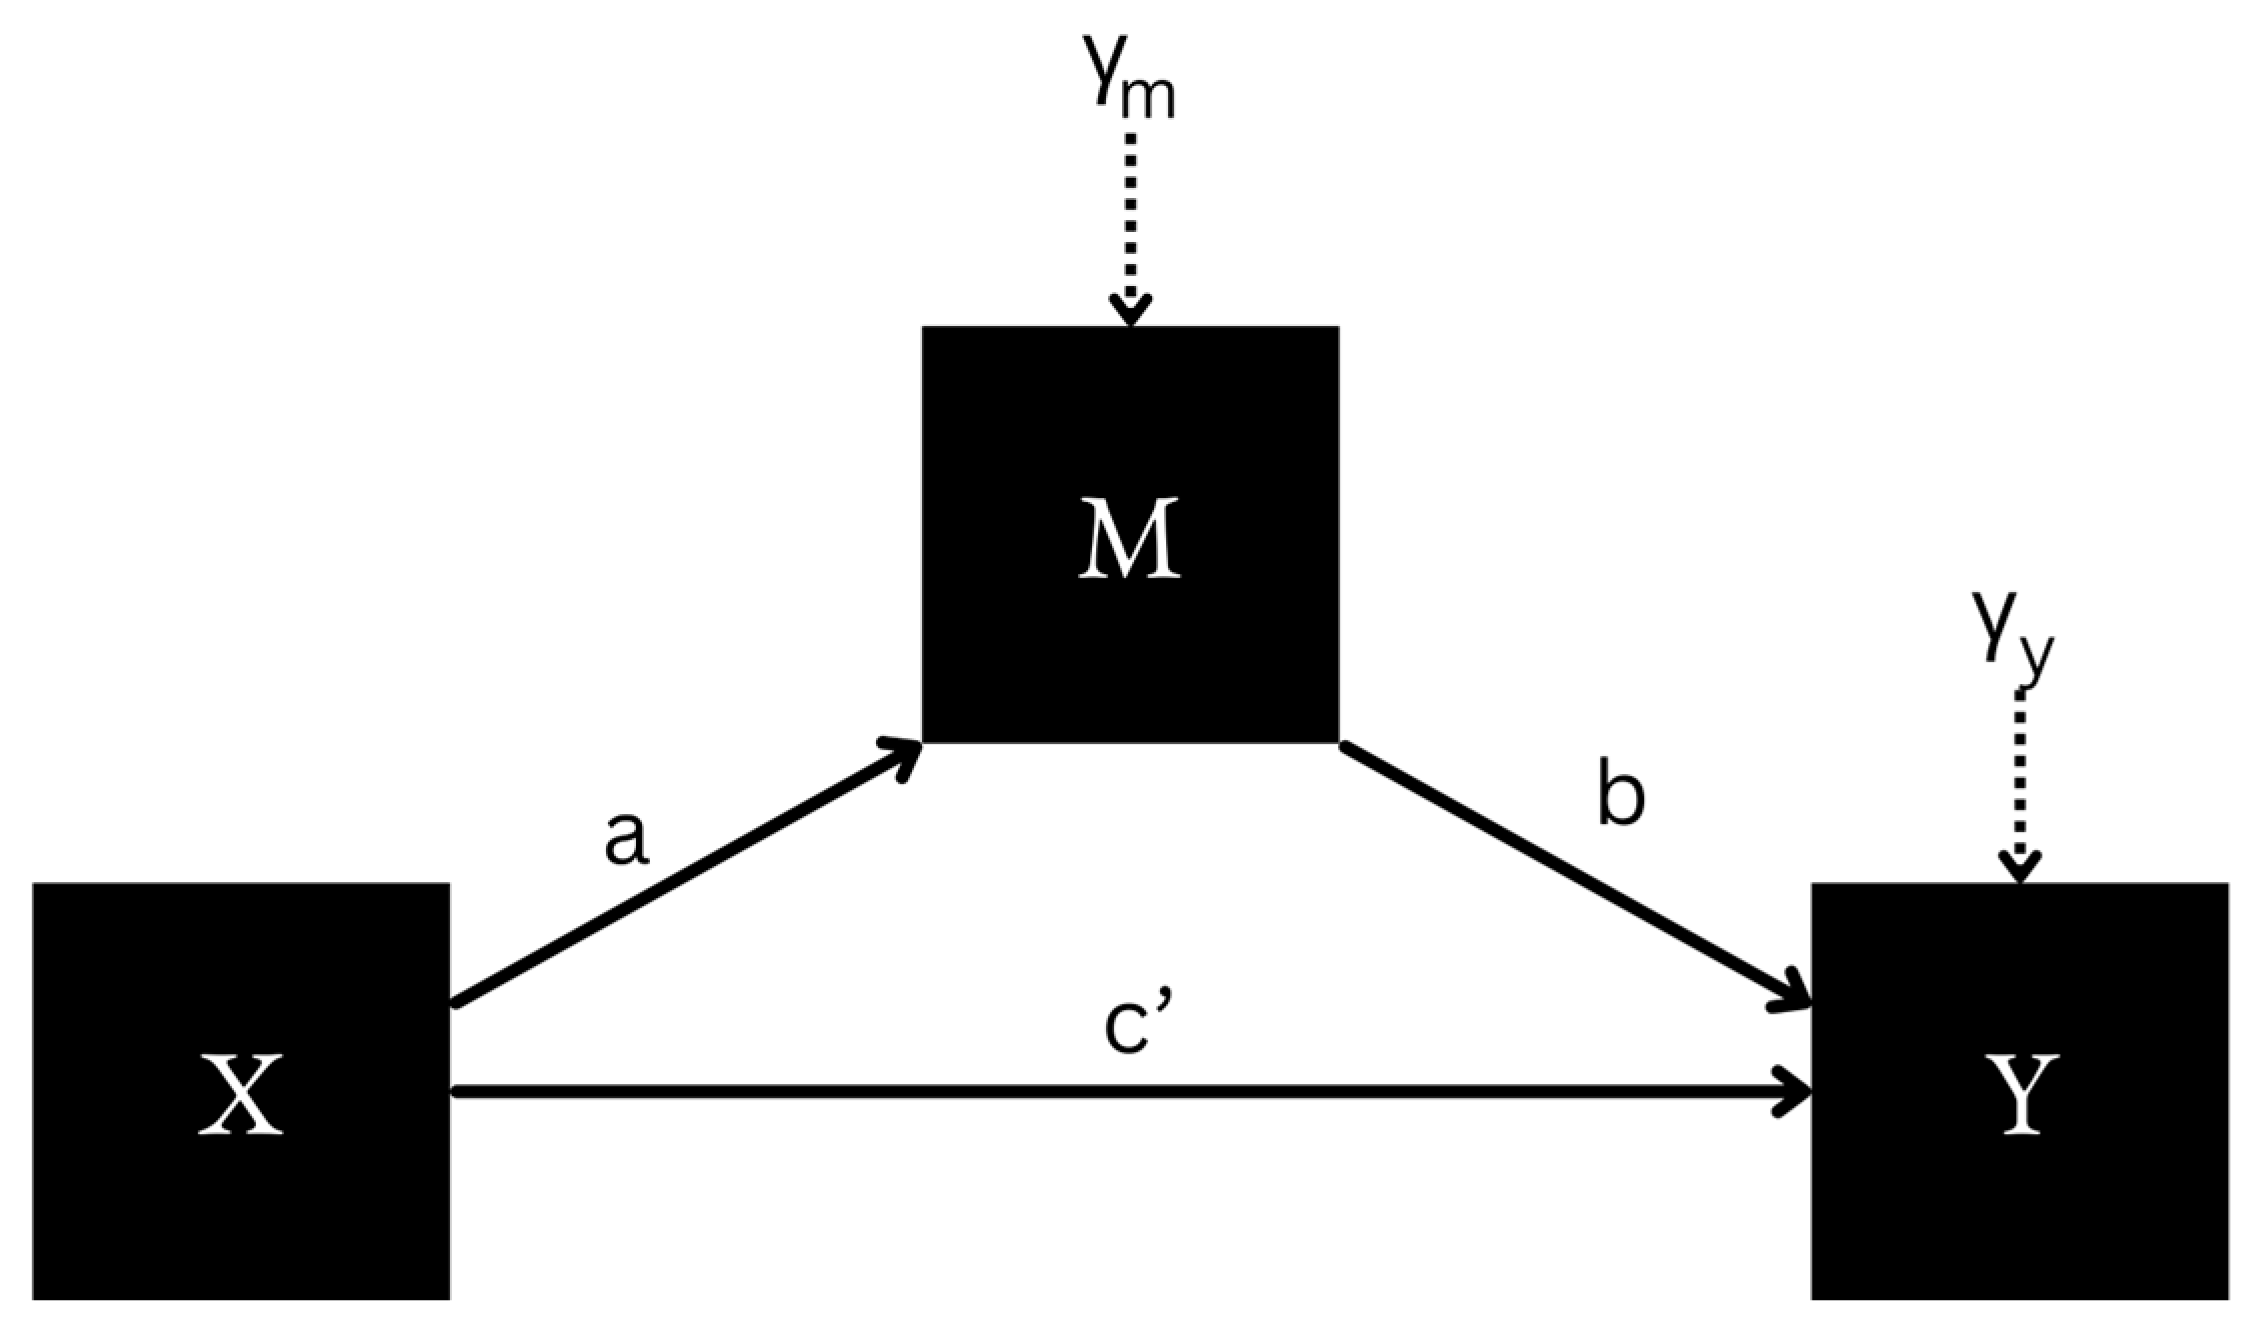
| a | Regression coefficient between X and M |
| ABS (PMV-TSV) | The absolute difference between PMV and TSV |
| ABS (PMV-TSV)female | The absolute difference between PMV and TSV for females |
| ABS (PMV-TSV)male | The absolute difference between PMV and TSV for males |
| ANG | Anger |
| ASHRAE | American Society of Heating, Refrigerating, and Air-Conditioning Engineers |
| ATC | Adaptive Thermal Comfort |
| b | Regression coefficient between M and Y |
| c | Total effect |
| c’ | Direct effect |
| CON | Confusion |
| DEP | Depression |
| DEPmale | Depression in males |
| df | Degree of freedom |
| FAT | Fatigue |
| H1 | First Null Hypothesis |
| H2 | Second Null Hypothesis |
| Icl | Basic clothing insulation |
| k | Kurtosis |
| im | Regression intercept for M |
| iy | Regression intercept for Y |
| M | Mediator |
| m | Mean |
| NA | Negative affect |
| p | Significance value |
| PA | Positive affect |
| PANAS | Positive and Negative Affect Schedule |
| PMV | Predicted Mean Vote |
| POMS | Profile of Mood States |
| POMS-SF | Short form of the Profile of Mood States Questionnaire |
| PPD | Predicted Percentage of Dissatisfied |
| RH | Relative humidity |
| SD | Standard deviation |
| sk | Skewness |
| Ta | Air temperature |
| TEN | Tension |
| TMD | Total mood disturbance |
| TMDmean | Mean TMD Value |
| TMDparticipant | Participant’s TMD value |
| Tr | Mean radiant temperature |
| TSV | Thermal sensation vote |
| Va | Air Velocity |
| VIG | Vigour |
| VIGfemale | Vigour of females |
| X | Input variable in mediation model |
| Y | Outcome variable in mediation model |
| Expected or predicted value of Y | |
| β | Standardised regression coefficient |
| γm | Error terms predicting the mediator |
| γy | Error terms predicting the outcome Y |
Appendix A

| Statements | Rating | Statements | Rating | ||||||||
|---|---|---|---|---|---|---|---|---|---|---|---|
| Friendly | 0 | 1 | 2 | 3 | 4 | Nervous | 0 | 1 | 2 | 3 | 4 |
| Tense | 0 | 1 | 2 | 3 | 4 | Lonely | 0 | 1 | 2 | 3 | 4 |
| Angry | 0 | 1 | 2 | 3 | 4 | Miserable | 0 | 1 | 2 | 3 | 4 |
| Worn Out | 0 | 1 | 2 | 3 | 4 | Muddled | 0 | 1 | 2 | 3 | 4 |
| Unhappy | 0 | 1 | 2 | 3 | 4 | Cheerful | 0 | 1 | 2 | 3 | 4 |
| Clear headed | 0 | 1 | 2 | 3 | 4 | Bitter | 0 | 1 | 2 | 3 | 4 |
| Lively | 0 | 1 | 2 | 3 | 4 | Exhausted | 0 | 1 | 2 | 3 | 4 |
| Confused | 0 | 1 | 2 | 3 | 4 | Anxious | 0 | 1 | 2 | 3 | 4 |
| Sorry for things done | 0 | 1 | 2 | 3 | 4 | Ready to fight | 0 | 1 | 2 | 3 | 4 |
| Shaky | 0 | 1 | 2 | 3 | 4 | Good natured | 0 | 1 | 2 | 3 | 4 |
| Listless | 0 | 1 | 2 | 3 | 4 | Gloomy | 0 | 1 | 2 | 3 | 4 |
| Peeved | 0 | 1 | 2 | 3 | 4 | Desperate | 0 | 1 | 2 | 3 | 4 |
| Considerate | 0 | 1 | 2 | 3 | 4 | Sluggish | 0 | 1 | 2 | 3 | 4 |
| Sad | 0 | 1 | 2 | 3 | 4 | Rebellious | 0 | 1 | 2 | 3 | 4 |
| Active | 0 | 1 | 2 | 3 | 4 | Helpless | 0 | 1 | 2 | 3 | 4 |
| On edge | 0 | 1 | 2 | 3 | 4 | Weary | 0 | 1 | 2 | 3 | 4 |
| Grouchy | 0 | 1 | 2 | 3 | 4 | Bewildered | 0 | 1 | 2 | 3 | 4 |
| Blue | 0 | 1 | 2 | 3 | 4 | Alert | 0 | 1 | 2 | 3 | 4 |
| Energetic | 0 | 1 | 2 | 3 | 4 | Deceived | 0 | 1 | 2 | 3 | 4 |
| Panicky | 0 | 1 | 2 | 3 | 4 | Furious | 0 | 1 | 2 | 3 | 4 |
| Hopeless | 0 | 1 | 2 | 3 | 4 | Efficient | 0 | 1 | 2 | 3 | 4 |
| Relaxed | 0 | 1 | 2 | 3 | 4 | Trusting | 0 | 1 | 2 | 3 | 4 |
| Unworthy | 0 | 1 | 2 | 3 | 4 | Full of pep | 0 | 1 | 2 | 3 | 4 |
| Spiteful | 0 | 1 | 2 | 3 | 4 | Bad tempered | 0 | 1 | 2 | 3 | 4 |
| Sympathetic | 0 | 1 | 2 | 3 | 4 | Worthless | 0 | 1 | 2 | 3 | 4 |
| Uneasy | 0 | 1 | 2 | 3 | 4 | Forgetful | 0 | 1 | 2 | 3 | 4 |
| Restless | 0 | 1 | 2 | 3 | 4 | Carefree | 0 | 1 | 2 | 3 | 4 |
| Unable to concentrate | 0 | 1 | 2 | 3 | 4 | Terrified | 0 | 1 | 2 | 3 | 4 |
| Fatigued | 0 | 1 | 2 | 3 | 4 | Guilty | 0 | 1 | 2 | 3 | 4 |
| Helpful | 0 | 1 | 2 | 3 | 4 | Vigorous | 0 | 1 | 2 | 3 | 4 |
| Annoyed | 0 | 1 | 2 | 3 | 4 | Uncertain about things | 0 | 1 | 2 | 3 | 4 |
| Discouraged | 0 | 1 | 2 | 3 | 4 | Bushed | 0 | 1 | 2 | 3 | 4 |
| Resentful | 0 | 1 | 2 | 3 | 4 | ||||||
Appendix B
| Subscales | Statements |
|---|---|
| Anger | Anger, Peeved, Grouchy, Spiteful, Annoyed, Resentful, Bitter, Ready to Fight, Rebellious, Deceived, Furious, and Bad Tempered. |
| Confusion | Confused, Unable to Concentrate, Muddled, Bewildered, Efficient *, Forgetful, and Uncertain About Things. |
| Depression | Unhappy, Sorry for Things Done, Sad, Blue, Hopeless, Unworthy, Discouraged, Lonely, Miserable, Gloomy, Desperate, Helpless, Worthless, Terrified, and Guilty. |
| Fatigue | Worn Out, Listless, Fatigued, Exhausted, Sluggish, Weary, and Bushed. |
| Friendliness ** | Friendly, Clear Headed, Considerate, Sympathetic, Helpful, Good Natured, and Trusting. |
| Tension | Tense, Shaky, On Edge, Panicky, Relaxed *, Uneasy, Restless, Nervous, and Anxious. |
| Vigour | Lively, Active, Energetic, Cheerful, Alert, Full of Pep, Carefree, and Vigorous. |
References
- ASHRAE. Thermal Environmental Conditions for Human Occupancy; ASHRAE: Atlanta, GA, USA, 2020. [Google Scholar]
- Fanger, P.O. Thermal Comfort. Analysis and Applications in Environmental Engineering; Danish Technical Press: Copenhagen, Denmark, 1970. [Google Scholar]
- De Dear, R.J.; Brager, G.S. Thermal Comfort in Naturally Ventilated Buildings: Revisions to ASHRAE Standard 55. Energy Build. 2002, 34, 549–561. [Google Scholar] [CrossRef]
- Özbey, M.F.; Çeter, A.E.; Örfioğlu, Ş.; Alkan, N.; Turhan, C. Sensitivity Analysis of the Effect of Current Mood States on the Thermal Sensation in Educational Buildings. Indoor Air 2022, 32, e13073. [Google Scholar] [CrossRef] [PubMed]
- Luo, M.; Cao, B.; Ji, W.; Ouyang, Q.; Lin, B.; Zhu, Y. The Underlying Linkage between Personal Control and Thermal Comfort: Psychological or Physical Effects? Energy Build. 2016, 111, 56–63. [Google Scholar] [CrossRef]
- Mansor, R.; Low, S.-T.; Choong, W.-W. The Effects of Personal Control and Perceived Thermal Comfort on Occupant Psycho-logical Health at the Workplace. Arch. Sci. Rev. 2024, 68, 94–106. [Google Scholar] [CrossRef]
- Liu, Y.; Yu, Z.; Song, Y.; Yu, X.; Zhang, J.; Song, D. Psychological Influence of Sky View Factor and Green View Index on Daytime Thermal Comfort of Pedestrians in Shanghai. Urban Clim. 2024, 56, 102014. [Google Scholar] [CrossRef]
- Wang, H.; Liu, L. Experimental Investigation about Effect of Emotion State on People’s Thermal Comfort. Energy Build. 2020, 211, 109789. [Google Scholar] [CrossRef]
- Gillerot, L.; Rozario, K.; de Frenne, P.; Oh, R.; Ponette, Q.; Bonn, A.; Chow, W.; Godbold, D.; Steinparzer, M.; Haluza, D.; et al. Forests Are Chill: The Interplay between Thermal Comfort and Mental Wellbeing. Landsc. Urban Plan. 2024, 242, 104933. [Google Scholar] [CrossRef]
- Zhuang, L.; Huang, J.; Li, F.; Zhong, K. Psychological Adaptation to Thermal Environments and Its Effects on Thermal Sensation. Physiol. Behav. 2022, 247, 113724. [Google Scholar] [CrossRef] [PubMed]
- Watson, D.; Clark, L.A.; Tellegen, A. Development and Validation of Brief Measures of Positive and Negative Affect: The PANAS Scales. J. Pers. Soc. Psychol. 1988, 54, 1063–1070. [Google Scholar] [CrossRef] [PubMed]
- McNair, D.; Lorr, M.; Doppleman, L. Manual for the Profile of Mood States; Educational and Industrial Testing Service (EITS): San Diego, CA, USA, 1971. [Google Scholar]
- Curran, S.L.; Andrykowski, M.A.; Studts, J.L. Short Form of the Profile of Mood States (POMS-SF): Psychometric Information. Psychol. Assess. 1995, 7, 80–83. [Google Scholar] [CrossRef]
- Lin, S.; Hsiao, Y.-Y.; Wang, M. Test Review: The Profile of Mood States 2nd Edition. J. Psychoeduc. Assess. 2014, 32, 273–277. [Google Scholar] [CrossRef]
- Terry, P.C.; Lane, A.M. Normative Values for the Profile of Mood States for Use with Athletic Samples. J. Appl. Sport Psychol. 2008, 12, 93–109. [Google Scholar] [CrossRef]
- Lin, C.; Zhang, Y. Combined Effects of Stress, Depression, and Emotion on Thermal Comfort: A Case Study in Shenzhen. J. Build. Eng. 2025, 103, 112158. [Google Scholar] [CrossRef]
- Anderson, A.; Stankovic, A.; Cowan, D.; Fellows, A.; Buckey, J. Natural Scene Virtual Reality as a Behavioral Health Countermeasure in Isolated, Confined, and Extreme Environments: Three Isolated, Confined, Extreme Analog Case Studies. Hum. Factors 2023, 65, 1266–1278. [Google Scholar] [CrossRef] [PubMed]
- Turhan, C.; Alkan, N.; Çeter, A.E.; Özbey, M.F. The Relation between Occupant’s Mood State and Thermal Sensation. In Proceedings of the 14th HVAC World Congress (CLIMA 2022), Rotterdam, The Netherlands, 22–25 May 2022. [Google Scholar]
- Çeter, A.E.; Özbey, M.F.; Turhan, C. Gender Inequity in Thermal Sensation Based on Emotional Intensity for Participants in a Warm Mediterranean Climate Zone. Int. J. Therm. Sci. 2023, 185, 108089. [Google Scholar] [CrossRef]
- Özbey, M.F.; Turhan, C. A Novel Comfort Temperature Determination Model Based on Psychology of the Participants for Educational Buildings in a Temperate Climate Zone. J. Build. Eng. 2023, 76, 107415. [Google Scholar] [CrossRef]
- Turhan, C.; Özbey, M.F.; Lotfi, B.; Gökçen Akkurt, G. Integration of Psychological Parameters into a Thermal Sensation Prediction Model for Intelligent Control of the HVAC Systems. Energy Build. 2023, 296, 113404. [Google Scholar] [CrossRef]
- Özbey, M.F.; Alkan, N.; Turhan, C. Investigation of the Relationship between Tension Level and Thermal Sensation. A Case Study of University Study Hall. E3S Web Conf. 2023, 396, 01010. [Google Scholar] [CrossRef]
- Turhan, C.; Özbey, M.F.; Çeter, A.E.; Akkurt, G.G. A Novel Data-Driven Model for the Effect of Mood State on Thermal Sensation. Buildings 2023, 13, 1662. [Google Scholar] [CrossRef]
- Yerlikaya-Özkurt, F.; Özbey, M.F.; Turhan, C. Modeling the Mood State on Thermal Sensation with a Data Mining Algorithm and Testing the Accuracy of Mood State Correction Factor. New Ideas Psychol. 2025, 76, 101124. [Google Scholar] [CrossRef]
- Özbey, M.F.; Turhan, C. Modelling the Positive and Negative Interaction between Mood and Thermal Sensation in the Built Environment Using a Combined Markov Chain Monte Carlo Algorithm and Morris Method. Build. Serv. Eng. Res. Technol. 2025, 01436244251346640. [Google Scholar] [CrossRef]
- Karjalainen, S. Thermal Comfort and Gender: A Literature Review. Indoor Air 2012, 22, 96–109. [Google Scholar] [CrossRef] [PubMed]
- Hashiguchi, N.; Feng, Y.; Tochihara, Y. Gender Differences in Thermal Comfort and Mental Performance at Different Vertical Air Temperatures. Eur. J. Appl. Physiol. 2010, 109, 41–48. [Google Scholar] [CrossRef] [PubMed]
- Parsons, K.C. The Effects of Gender, Acclimation State, the Opportunity to Adjust Clothing and Physical Disability on Requirements for Thermal Comfort. Energy Build. 2002, 34, 593–599. [Google Scholar] [CrossRef]
- Cao, W.; Xuan, X.; Wang, Y.; Wu, W. The Thermal Sensitivity (Griffiths Constant) of Occupants for Naturally Ventilated Buildings in China. Energy Build. 2025, 341, 115786. [Google Scholar] [CrossRef]
- Zhao, Q.; Lyu, J.; Du, H.; Lian, Z.; Zhao, Z. Gender Differences in Thermal Sensation and Skin Temperature Sensitivity under Local Cooling. J. Therm. Biol. 2023, 111, 103401. [Google Scholar] [CrossRef] [PubMed]
- Wang, Z.; de Dear, R.; Luo, M.; Lin, B.; He, Y.; Ghahramani, A.; Zhu, Y. Individual Difference in Thermal Comfort: A Literature Review. Build. Environ. 2018, 138, 181–193. [Google Scholar] [CrossRef]
- Lane, A.M. The Rise and Fall of the Iceberg: Development of a Conceptual Model of Mood-Performance Relationships. In Mood and Human Performance: Conceptual, Measurement, and Applied Issues; Routledge: New York, NY, USA, 2007; pp. 1–34. [Google Scholar]
- Pessoa, L. On the Relationship between Emotion and Cognition. Nat. Rev. Neurosci. 2008, 9, 148–158. [Google Scholar] [CrossRef] [PubMed]
- Teasdale, J.D. Multi-Level Theories of Cognition-Emotion Relations. In Handbook of Cognition and Emotion; Wiley: Chichester, UK, 1999; pp. 665–681. [Google Scholar]
- American Psychiatric Association (APA). Diagnostic and Statistical Manual of Mental Disorders, 5th ed.; American Psychiatric Association: Washington, DC, USA, 2013; ISBN 978-0-89042-554-1. [Google Scholar]
- Wyrwich, K.W.; Yu, H. Validation of POMS Questionnaire in Postmenopausal Women. Qual. Life Res. 2011, 20, 1111–1121. [Google Scholar] [CrossRef] [PubMed]
- Terry, P.C.; Lane, A.M.; Fogarty, G.J. Construct Validity of the Profile of Mood States—Adolescents for Use with Adults. Psychol. Sport Exerc. 2003, 4, 125–139. [Google Scholar] [CrossRef]
- Turkish State Meteorological Service Extreme Maximum, Minimum and Average Temperatures Measured in Long Period (°C). Available online: https://www.mgm.gov.tr/veridegerlendirme/il-ve-ilceler-istatistik.aspx (accessed on 12 July 2025). (In Turkish)
- Delta OHM. Thermal Comfort Data Logger. HD32.3TC—Thermal Microclimate PMV-PPD/WBGT; Delta OHM: Padova, Italy, 2022. [Google Scholar]
- Aosong Electronics Co., Ltd. Datasheet of DHT 22 Digital-Output Relative Humidity & Temperature Sensor; Aosong: Guangzhou, China, 2022. [Google Scholar]
- Buratti, C.; Palladino, D.; Ricciardi, P. Application of a New 13-Value Thermal Comfort Scale to Moderate Environments. Appl. Energy 2016, 180, 859–866. [Google Scholar] [CrossRef]
- Lara, D.R.; Bisol, L.W.; Munari, L.R. Antidepressant, Mood Stabilizing and Procognitive Effects of Very Low Dose Sublingual Ketamine in Refractory Unipolar and Bipolar Depression. Int. J. Neuropsychopharmacol. 2013, 16, 2111–2117. [Google Scholar] [CrossRef] [PubMed]
- Siegel, A.N.; Di Vincenzo, J.D.; Brietzke, E.; Gill, H.; Rodrigues, N.B.; Lui, L.M.W.; Teopiz, K.M.; Ng, J.; Ho, R.; McIntyre, R.S.; et al. Antisuicidal and Antidepressant Effects of Ketamine and Esketamine in Patients with Baseline Suicidality: A Systematic Review. J. Psychiatr. Res. 2021, 137, 426–436. [Google Scholar] [CrossRef] [PubMed]
- Sasikala, P.; Narayanasa Maruthy, K.; Preetham Gurja, J.; Siva Kumar, A.; Preetham kumar Gurja, J.; Professor, A. Effect of Caffeine on Multi-Domain Neurocognitive Abilities in Occasional Coffee Consumers. Artic. Int. J. Physiol. 2021, 9, 33. [Google Scholar]
- Schrieks, I.C.; Ripken, D.; Stafleu, A.; Witkamp, R.F.; Hendriks, H.F.J. Effects of Mood Inductions by Meal Ambiance and Moderate Alcohol Consumption on Endocannabinoids and N-Acylethanolamines in Humans: A Randomized Crossover Trial. PLoS ONE 2015, 10, e0126421. [Google Scholar] [CrossRef] [PubMed]
- Weinstein, S.M.; Mermelstein, R.; Shiffman, S.; Flay, B. Mood Variability and Cigarette Smoking Escalation Among Adolescents. Psychol. Addict. Behav. 2008, 22, 504–513. [Google Scholar] [CrossRef] [PubMed]
- Kozuh, I.; Jeremic, Z.; Sarias, A.; Bele, J.L.; Devedzic, V.; Debevc, M. Social Presence and Interaction in Learning Environments: The Effect on Student Success. Educ. Technol. Soc. 2015, 18, 223–236. [Google Scholar]
- Rothschild, B.M.; María López-Jiménez, C.; Cano-García, F.J.; Sanduvete-Chaves, S.; Chacón-Moscoso, S. The Shortened Version of the Profile of Mood States: A Reliable and Valid Measure of Emotional Functioning for Chronic Pain Patients. Rheumato 2025, 5, 4. [Google Scholar] [CrossRef]
- IBM. IBM SPSS Statistics, version 28.0; IBM: Armonk, NY, USA, 2021. Available online: https://www.ibm.com/docs/en/spss-statistics/28.0.0 (accessed on 12 July 2025).
- Cohen, J. Statistical Power Analysis for the Behavioral Sciences, 2nd ed.; Lawrence Erlbaum Associates: Mahwah, NJ, USA, 1988; ISBN 0-8058-0283-5. [Google Scholar]
- Hayes, A.F. Introduction to Mediation, Moderation, and Conditional Process Analysis, 3rd ed.; Guilford Press: New York, NY, USA, 2022; ISBN 9781462549030. [Google Scholar]
- Brownlow, C.; Eacersall, D.; Nelson, C.W.; Parsons-Smith, R.L.; Terry, P.C. Risks to Mental Health of Higher Degree by Research (HDR) Students during a Global Pandemic. PLoS ONE 2022, 17, e0279698. [Google Scholar] [CrossRef] [PubMed]
- Vlachopoulos, S.P.; Lane, A.M.; Terry, P.C. A Greek Translation of the Brunel Mood Scale: Initial Validation among Exercise Participants and Inactive Adults. Sports 2023, 11, 234. [Google Scholar] [CrossRef] [PubMed]
- Terry, P.C.; Skurvydas, A.; Lisinskiene, A.; Majauskiene, D.; Valanciene, D.; Cooper, S.; Lochbaum, M. Validation of a Lithuanian-Language Version of the Brunel Mood Scale: The BRUMS-LTU. Int. J. Environ. Res. Public Health 2022, 19, 4867. [Google Scholar] [CrossRef] [PubMed]
- Hermawan; Prianto, E.; Setyowati, E. Thermal Comfort of Wood-Wall House in Coastal and Mountainous Region in Tropical Area. Procedia Eng. 2015, 125, 725–731. [Google Scholar] [CrossRef]
- Buratti, C.; Ricciardi, P. Adaptive Analysis of Thermal Comfort in University Classrooms: Correlation between Experimental Data and Mathematical Models. Build. Environ. 2009, 44, 674–687. [Google Scholar] [CrossRef]
- Ren, Z.; Xie, Z. Predictors of Anxiety and Depression in Medical Professionals During the Time of COVID-19 Outbreak. Disaster Med. Public Health Prep. 2022, 16, 1929–1934. [Google Scholar] [CrossRef] [PubMed]
- Roseman, I.J. Appraisal in the Emotion System: Coherence in Strategies for Coping. Emot. Rev. 2013, 5, 141–149. [Google Scholar] [CrossRef]
- Ellsworth, P.C. Appraisal Theory: Old and New Questions. Emot. Rev. 2013, 5, 125–131. [Google Scholar] [CrossRef]
- Tarnopolsky, M. Hormonal Differences Between Males and Females. In Gender Differences in Metabolism; Karger: Basel, Switzerland, 2020; pp. 15–35. [Google Scholar]
- Tuniki, H.P.; Jurelionis, A.; Rupp, R.F.; Valančius, R.; Bekö, G. Thermal Comfort and Adaptive Occupant Behaviour in Open Plan Offices in India and Lithuania. Buildings 2025, 15, 766. [Google Scholar] [CrossRef]
- Shahzad, S.; Gomez Torres, S.; Rijal, H.B.; Nicol, F. Lack of Thermal Comfort Is a Matter of Life and Death: A Systematic Review for Older People. Buildings 2025, 15, 1141. [Google Scholar] [CrossRef]
- Gou, Z.; Gamage, W.; Lau, S.S.Y.; Lau, S.S.Y. An Investigation of Thermal Comfort and Adaptive Behaviors in Naturally Ventilated Residential Buildings in Tropical Climates: A Pilot Study. Buildings 2018, 8, 5. [Google Scholar] [CrossRef]


| Study | Research Question | Results |
|---|---|---|
| Turhan et al. [18] | Do mood states influence individuals’ thermal sensation? | A significant difference was observed between the control and experimental groups, indicating that mood states affect thermal sensation. |
| Özbey et al. [4] | How does the current mood state, as measured by the POMS subscales, influence the absolute difference between perceived and predicted thermal sensation, and which mood subscales are the most sensitive to this difference? | The most sensitive parameters were found in VIG and DEP, while the least sensitive subscale was CON. |
| Çeter et al. [19] | How does emotional intensity relate to the absolute difference between perceived and predicted thermal sensation across genders? | Statistically, males were found to be more sensitive to changes in emotional intensity compared to females. |
| Özbey and Turhan [20] | Can a comfort temperature model be developed that considers both outdoor temperature and psychological mood states? | Comfort temperatures varied significantly among individuals in non-neutral mood states, with lower comfort temperatures observed in those experiencing higher or lower levels of concern. |
| Turhan et al. [21] | Can a fuzzy logic model predict thermal sensation accurately by including mood states as input variables? | The developed fuzzy logic model predicted thermal sensation with an accuracy of 92%. |
| Özbey et al. [22] | How is the Tension subscale of the POMS questionnaire correlated with thermal sensation? | For males, the items “shaky,” “uneasy,” and “anxious” were significant, while for females, “nervous” and “anxious” were significant predictors. |
| Turhan et al. [23] | Is it possible to model thermal sensation using a black-box approach that incorporates mood states? | Individuals in neither pessimistic nor optimistic mood groups tended to perceive warmer temperatures. |
| Yerlikaya et al. [24] | Can the previously developed black-box model [23] be validated using a data mining method like Multivariate Adaptive Regression Splines (MARS)? | The correlation coefficients between the MARS and the black-box model were 0.9426 (training) and 0.9420 (testing), confirming the high accuracy of modelling mood states with the MARS. |
| Özbey and Turhan [25] | How do individual POMS subscales influence thermal sensation, and what are the positive and negative effects of these mood states on perceived thermal comfort? | VIG was the most influential parameter, while CON and FAT had negative effects (feeling cooler) on thermal sensation. |
| Measurement Device | Parameter | Range | Accuracy | Resolution |
|---|---|---|---|---|
| DELTA OHM HD32.3TCA [39] | Globe Temperature | −10–100 °C | ±0.1 °C | 0.1 °C |
| Air Velocity | 0.02–5 m/s | ±(0.05 + 5% of the measurement) m/s | 0.01 m/s | |
| Indoor Air Temperature | 40–100 °C | ±0.1 °C | 0.1 °C | |
| Relative Humidity | 0–100% RH | ±1.5% | 0.1% | |
| Environmental Data Logger DHT-22 [40] | Outdoor Temperature | −40–80 °C | <±0.5 °C | 0.1 °C |
| Outdoor Relative Humidity | 0–100% | ±2% | 0.1% |
| Indoor Parameters | m | SD | Outdoor Parameters | m | SD |
|---|---|---|---|---|---|
| Ta (°C) | 21.82 | 1.38 | Toutdoor (°C) | 11.61 | 8.73 |
| Tr (°C) | 21.94 | 1.36 | |||
| va (°C) | <0.01 | 0.02 | RHoutdoor (%) | 57.34 | 21.11 |
| RHindoor (%) | 33.51 | 9.34 |
| Female | Male | All | ||||||||||
|---|---|---|---|---|---|---|---|---|---|---|---|---|
| m | SD | sk | K | m | SD | sk | k | m | SD | sk | k | |
| ANG | 1.13 | 0.65 | 0.45 | −0.12 | 1.12 | 0.57 | 0.58 | 0.67 | 1.12 | 0.60 | 0.53 | 0.31 |
| CON | 1.35 | 0.52 | 0.72 | 0.78 | 1.34 | 0.50 | 0.43 | 0.79 | 1.35 | 0.51 | 0.55 | 0.78 |
| DEP | 1.02 | 0.64 | 0.70 | 0.56 | 1.02 | 0.53 | 0.63 | 0.99 | 1.02 | 0.58 | 0.67 | 0.86 |
| FAT | 1.62 | 0.69 | 0.31 | 0.07 | 1.66 | 0.66 | 0.10 | 0.51 | 1.65 | 0.67 | 0.18 | 0.30 |
| TEN | 1.52 | 0.62 | 0.46 | 0.17 | 1.48 | 0.57 | 0.49 | 0.73 | 1.50 | 0.59 | 0.49 | 0.49 |
| VIG | 1.86 | 0.58 | −0.33 | 0.41 | 2.13 | 0.53 | −0.75 | 0.78 | 2.02 | 0.57 | −0.59 | 0.45 |
| ABS (PMV-TSV) | 0.70 | 0.55 | 0.98 | 0.42 | 0.75 | 0.55 | 0.99 | 0.50 | 0.73 | 0.55 | 0.99 | 0.46 |
| Levene’s Test for Equality of Variances | df | t | p | 95%CID Lower | 95%CID Upper | |
|---|---|---|---|---|---|---|
| ANG | Equal variances not assumed (p < 0.05) | 820.886 | −0.164 | 0.870 | −0.81 | 0.07 |
| CON | Equal variances assumed | 1110 | −0.091 | 0.927 | −0.06 | 0.06 |
| DEP | Equal variances not assumed (p < 0.05) | 798.881 | 0.112 | 0.911 | −0.07 | 0.08 |
| FAT | Equal variances assumed | 1110 | 0.933 | 0.351 | −0.04 | 0.12 |
| TEN | Equal variances not assumed (p < 0.05) | 863.203 | −1.054 | 0.292 | −0.11 | 0.04 |
| VIG | Equal variances assumed | 1110 | 7.869 | <0.001 * | 0.20 | 0.33 |
| ABS (PMV-TSV) | Equal variances assumed | 1110 | 1.196 | 0.232 | −0.03 | 0.11 |
| Model Pathways | β | Standard Error | t | p | LL95%CI | UL95%CI | |
|---|---|---|---|---|---|---|---|
| VIGfemale | a | −0.096 | 0.043 | −2.009 | 0.045 * | −0.171 | −0.002 |
| b | 0.104 | 0.051 | 2.169 | 0.031 * | 0.010 | 0.210 | |
| c | −0.118 | 0.046 | −2.467 | 0.014 * | −0.202 | −0.023 | |
| c’ | −0.108 | 0.046 | −2.257 | 0.024 * | −0.192 | −0.013 | |
| DEPmale | a | 0.716 | 0.025 | 26.700 | <0.001 * | 0.622 | 0.721 |
| b | 0.195 | 0.060 | 3.582 | <0.001 * | 0.096 | 0.330 | |
| c | −0.083 | 0.039 | −2.170 | <0.001 * | −0.163 | −0.008 | |
| c’ | −0.222 | 0.056 | −4.092 | <0.001 * | −0.338 | −0.119 | |
Disclaimer/Publisher’s Note: The statements, opinions and data contained in all publications are solely those of the individual author(s) and contributor(s) and not of MDPI and/or the editor(s). MDPI and/or the editor(s) disclaim responsibility for any injury to people or property resulting from any ideas, methods, instructions or products referred to in the content. |
© 2025 by the authors. Licensee MDPI, Basel, Switzerland. This article is an open access article distributed under the terms and conditions of the Creative Commons Attribution (CC BY) license (https://creativecommons.org/licenses/by/4.0/).
Share and Cite
Özbey, M.F.; Turhan, C.; Alkan, N.; Akkurt, G.G. Latent Psychological Pathways in Thermal Comfort Perception: The Mediating Role of Cognitive Uncertainty on Depression and Vigour. Buildings 2025, 15, 2538. https://doi.org/10.3390/buildings15142538
Özbey MF, Turhan C, Alkan N, Akkurt GG. Latent Psychological Pathways in Thermal Comfort Perception: The Mediating Role of Cognitive Uncertainty on Depression and Vigour. Buildings. 2025; 15(14):2538. https://doi.org/10.3390/buildings15142538
Chicago/Turabian StyleÖzbey, Mehmet Furkan, Cihan Turhan, Neşe Alkan, and Gulden Gokcen Akkurt. 2025. "Latent Psychological Pathways in Thermal Comfort Perception: The Mediating Role of Cognitive Uncertainty on Depression and Vigour" Buildings 15, no. 14: 2538. https://doi.org/10.3390/buildings15142538
APA StyleÖzbey, M. F., Turhan, C., Alkan, N., & Akkurt, G. G. (2025). Latent Psychological Pathways in Thermal Comfort Perception: The Mediating Role of Cognitive Uncertainty on Depression and Vigour. Buildings, 15(14), 2538. https://doi.org/10.3390/buildings15142538