
The Impact of the Built Environment on Innovation Output in High-Density Urban Centres at the Micro-Scale: A Case Study of the G60 S&T Innovation Valley, China


Abstract
1. Introduction
2. Literature Review
3. Research Area, Data, and Method
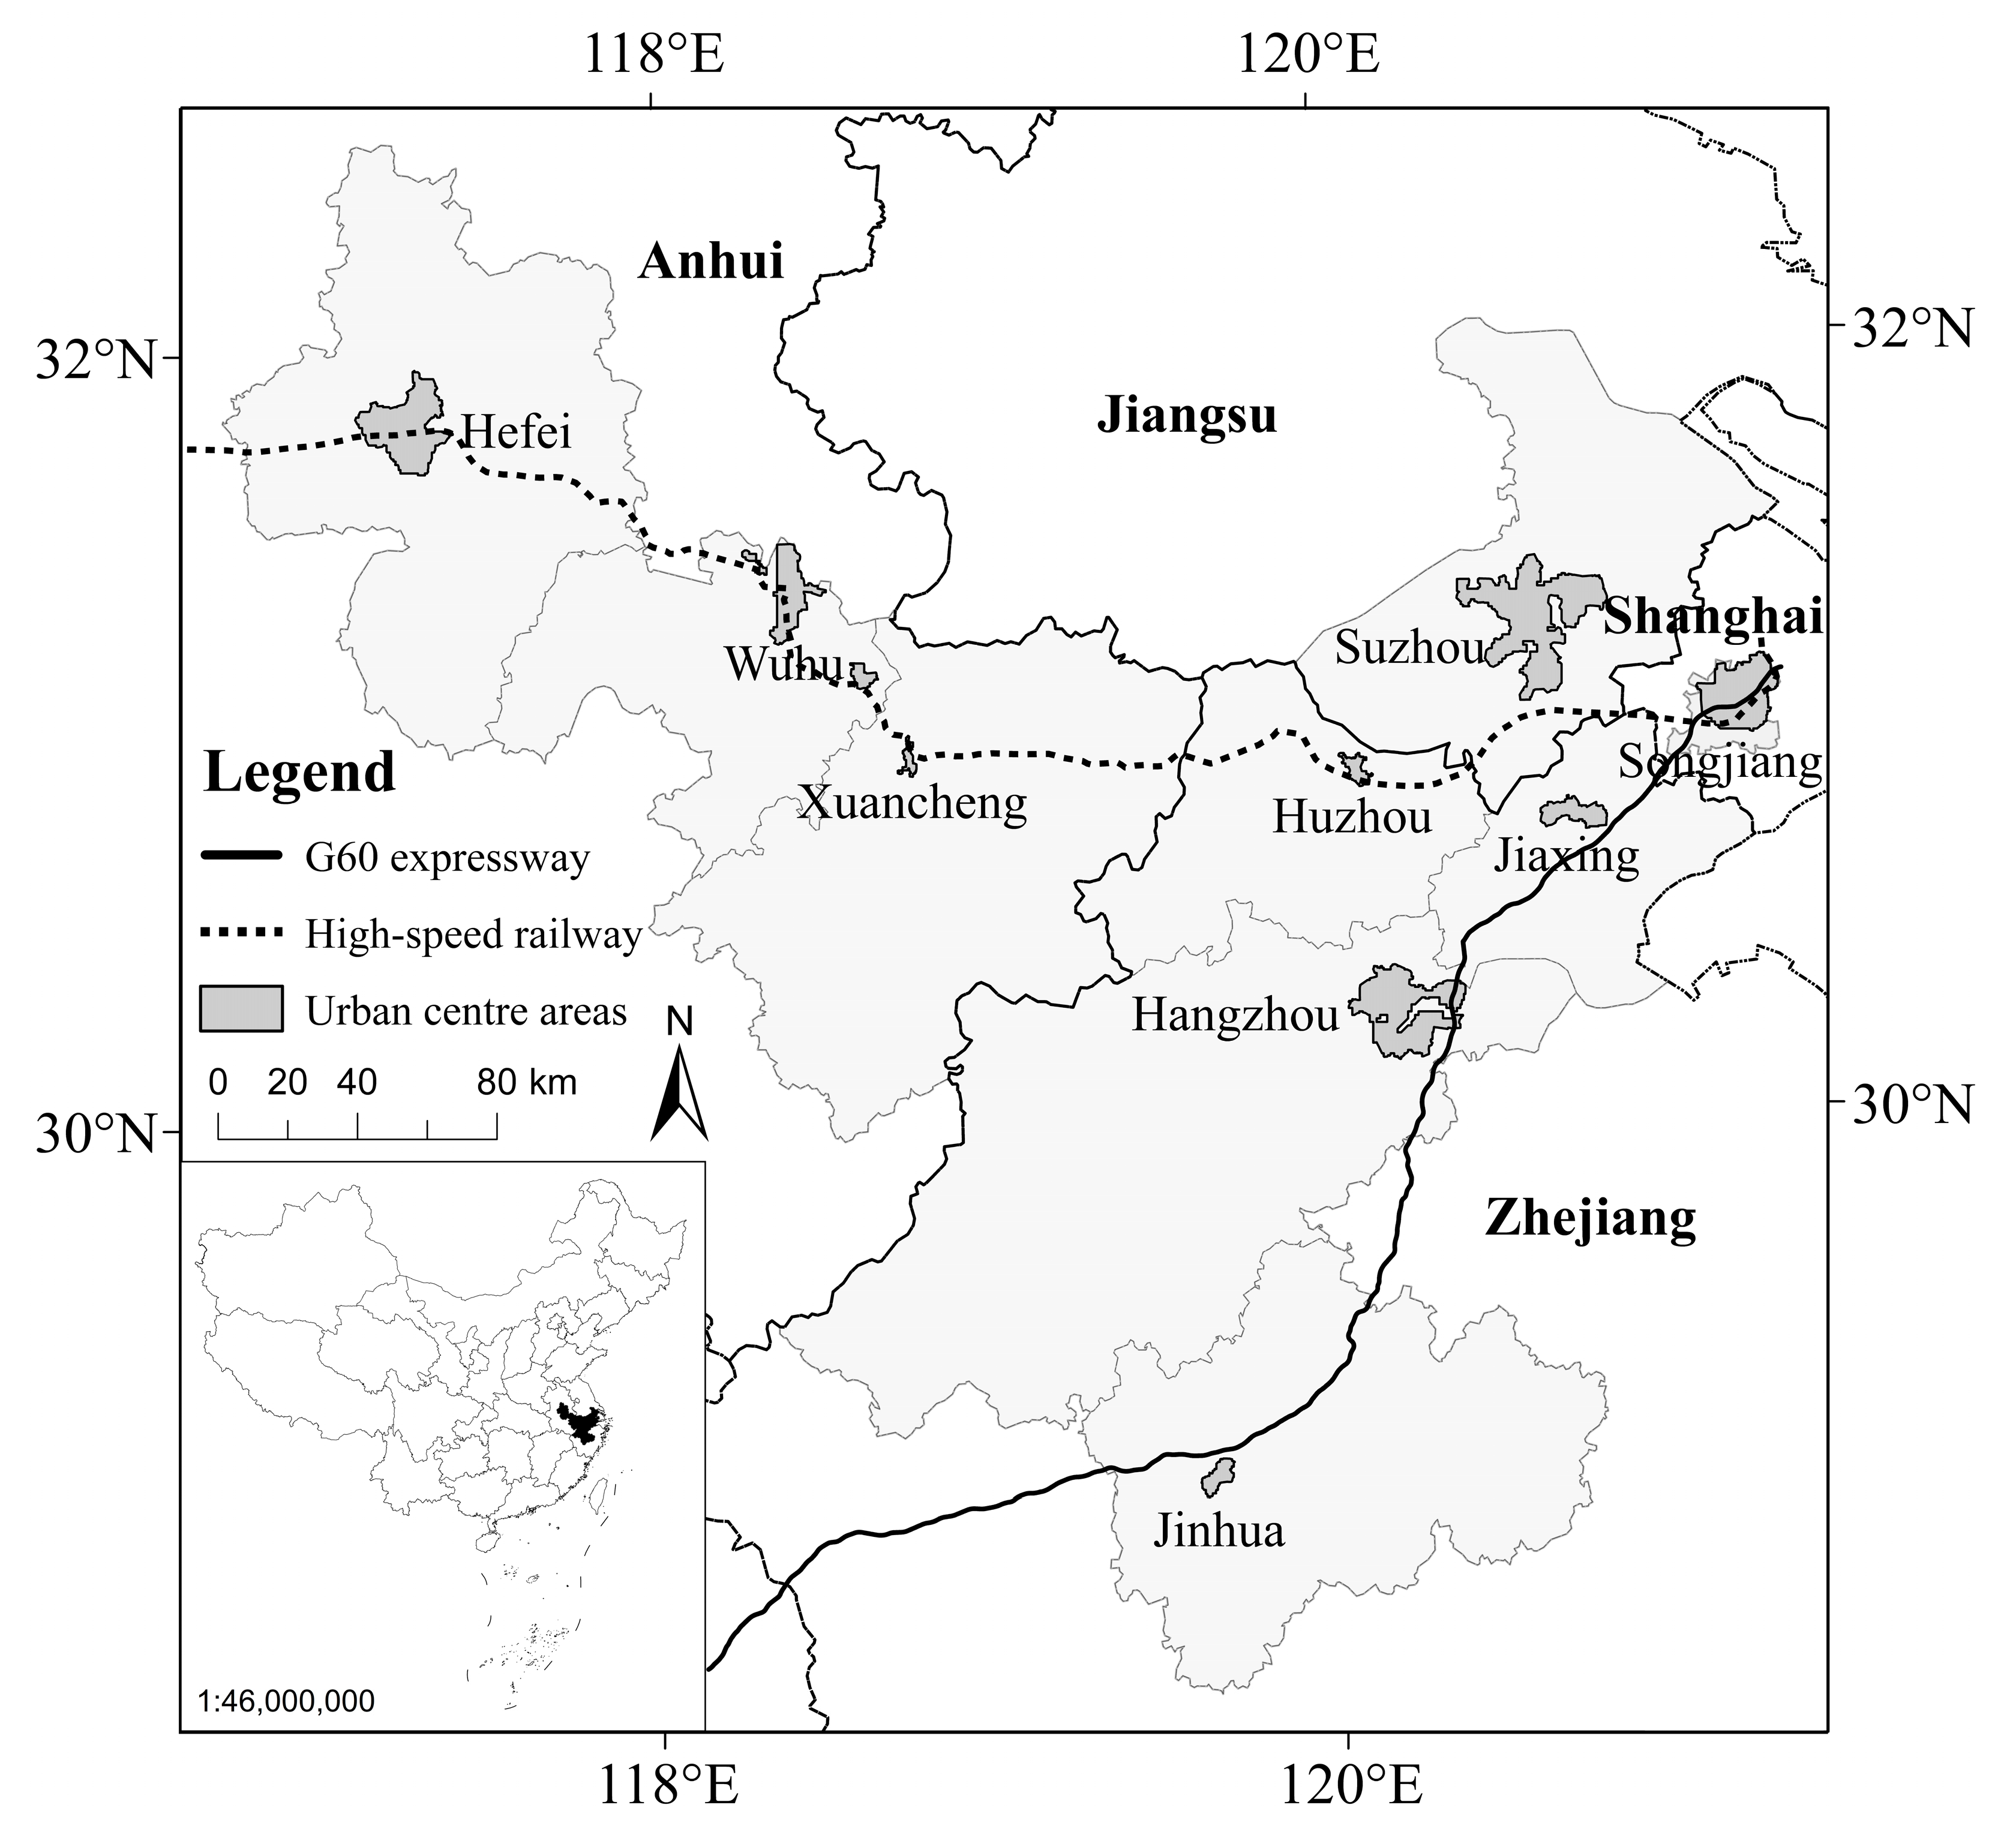
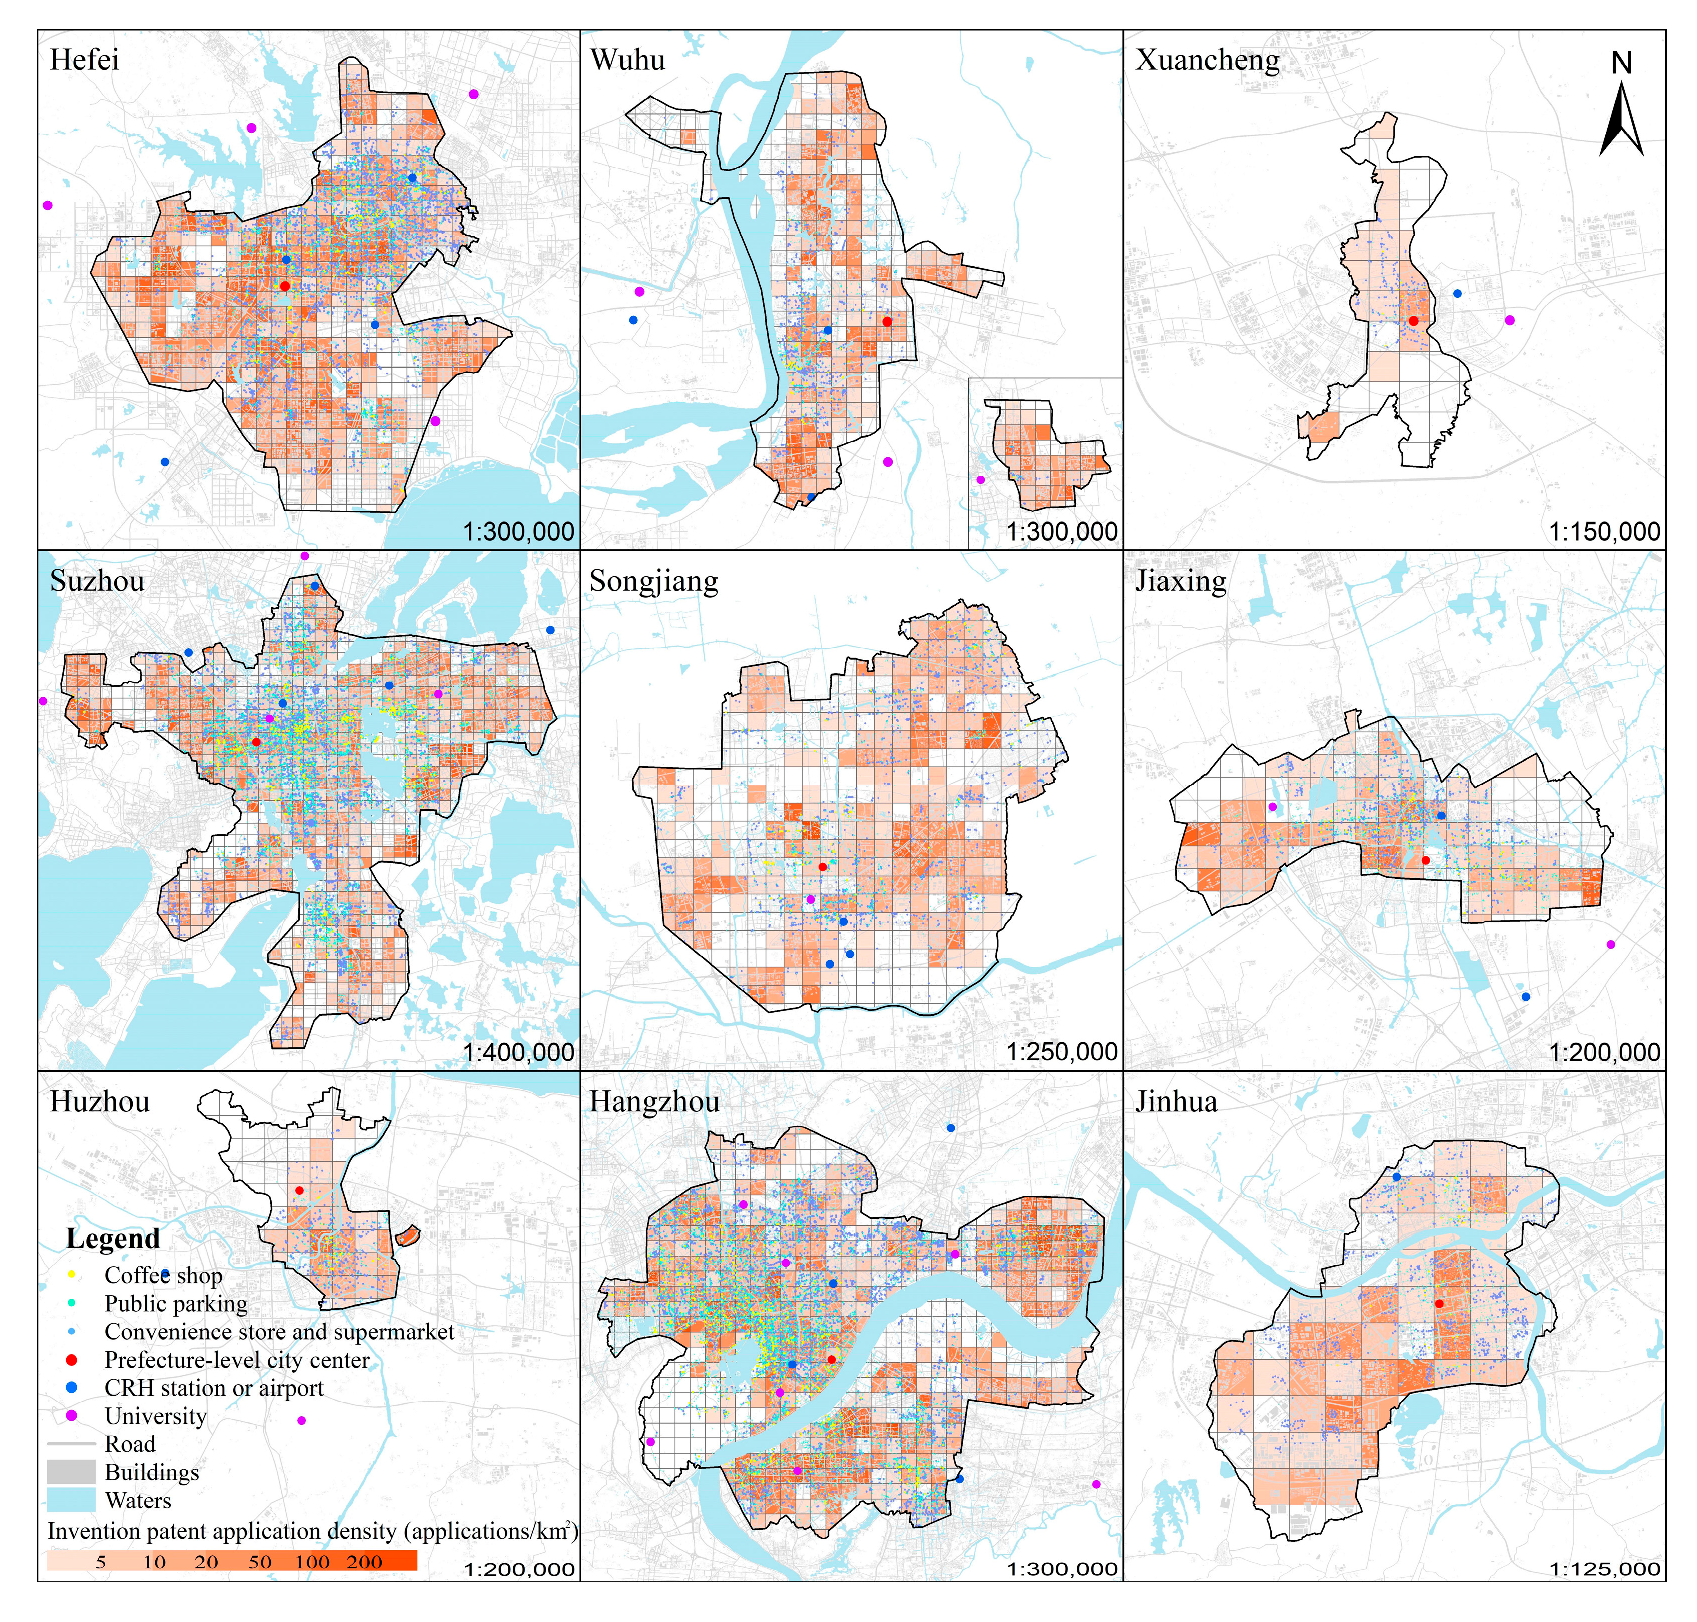
3.1. Research Area
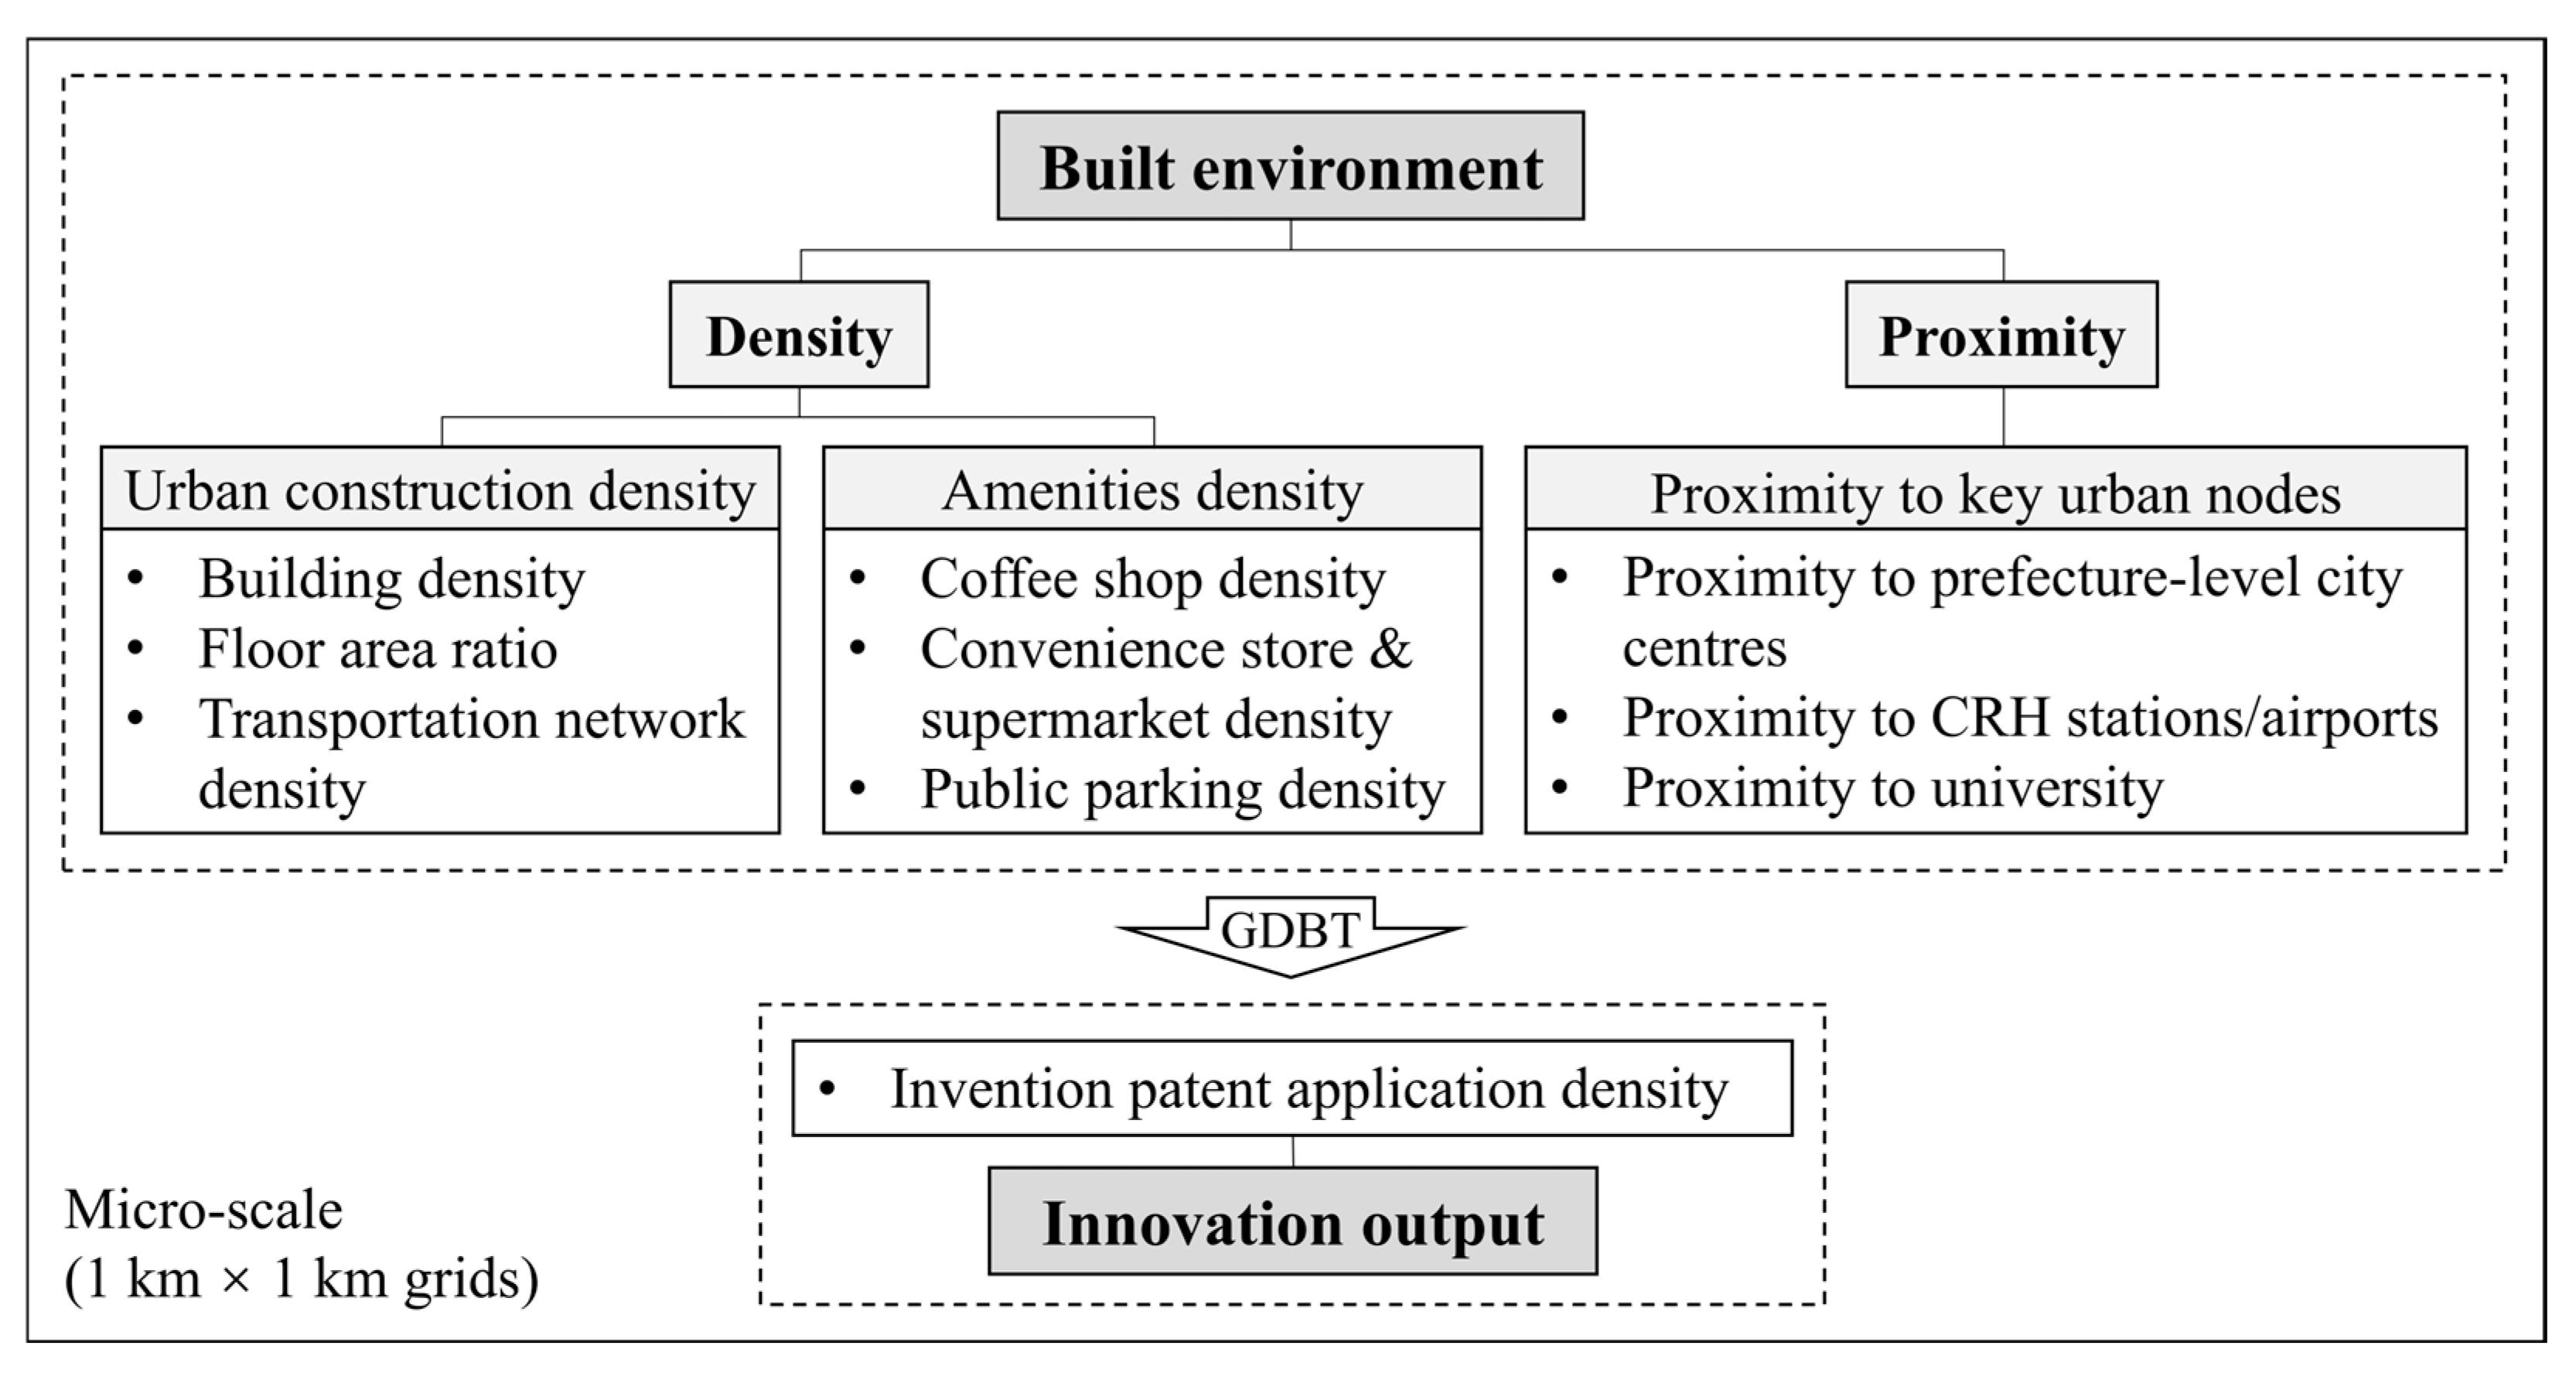
3.2. Research Framework
3.3. Data Sources
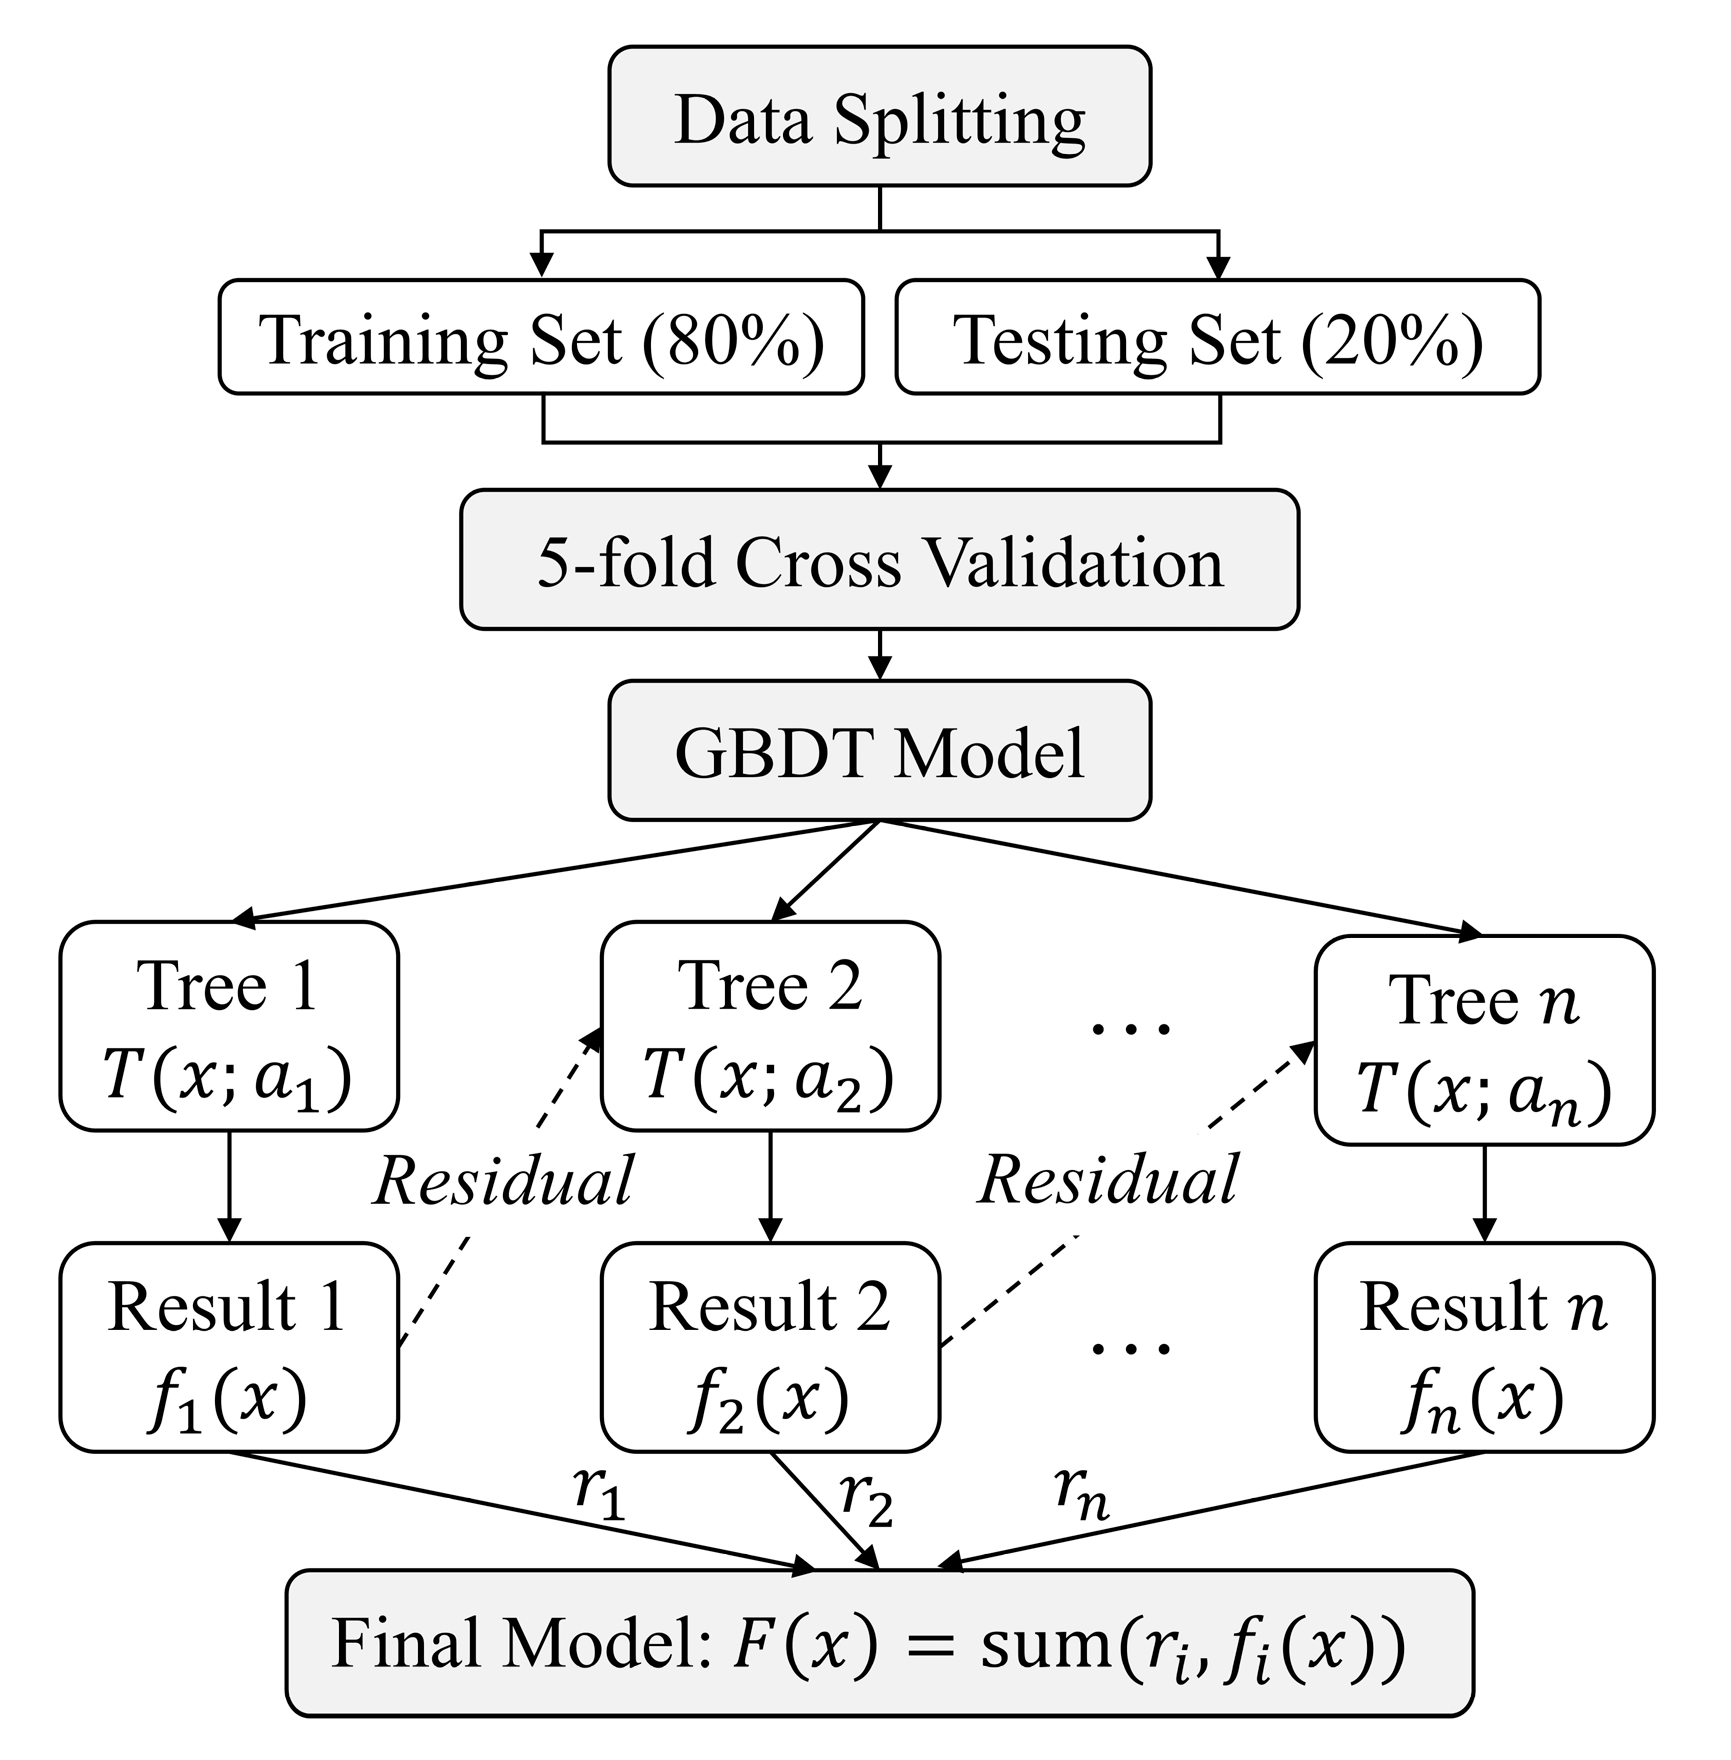
3.4. Method
4. Results
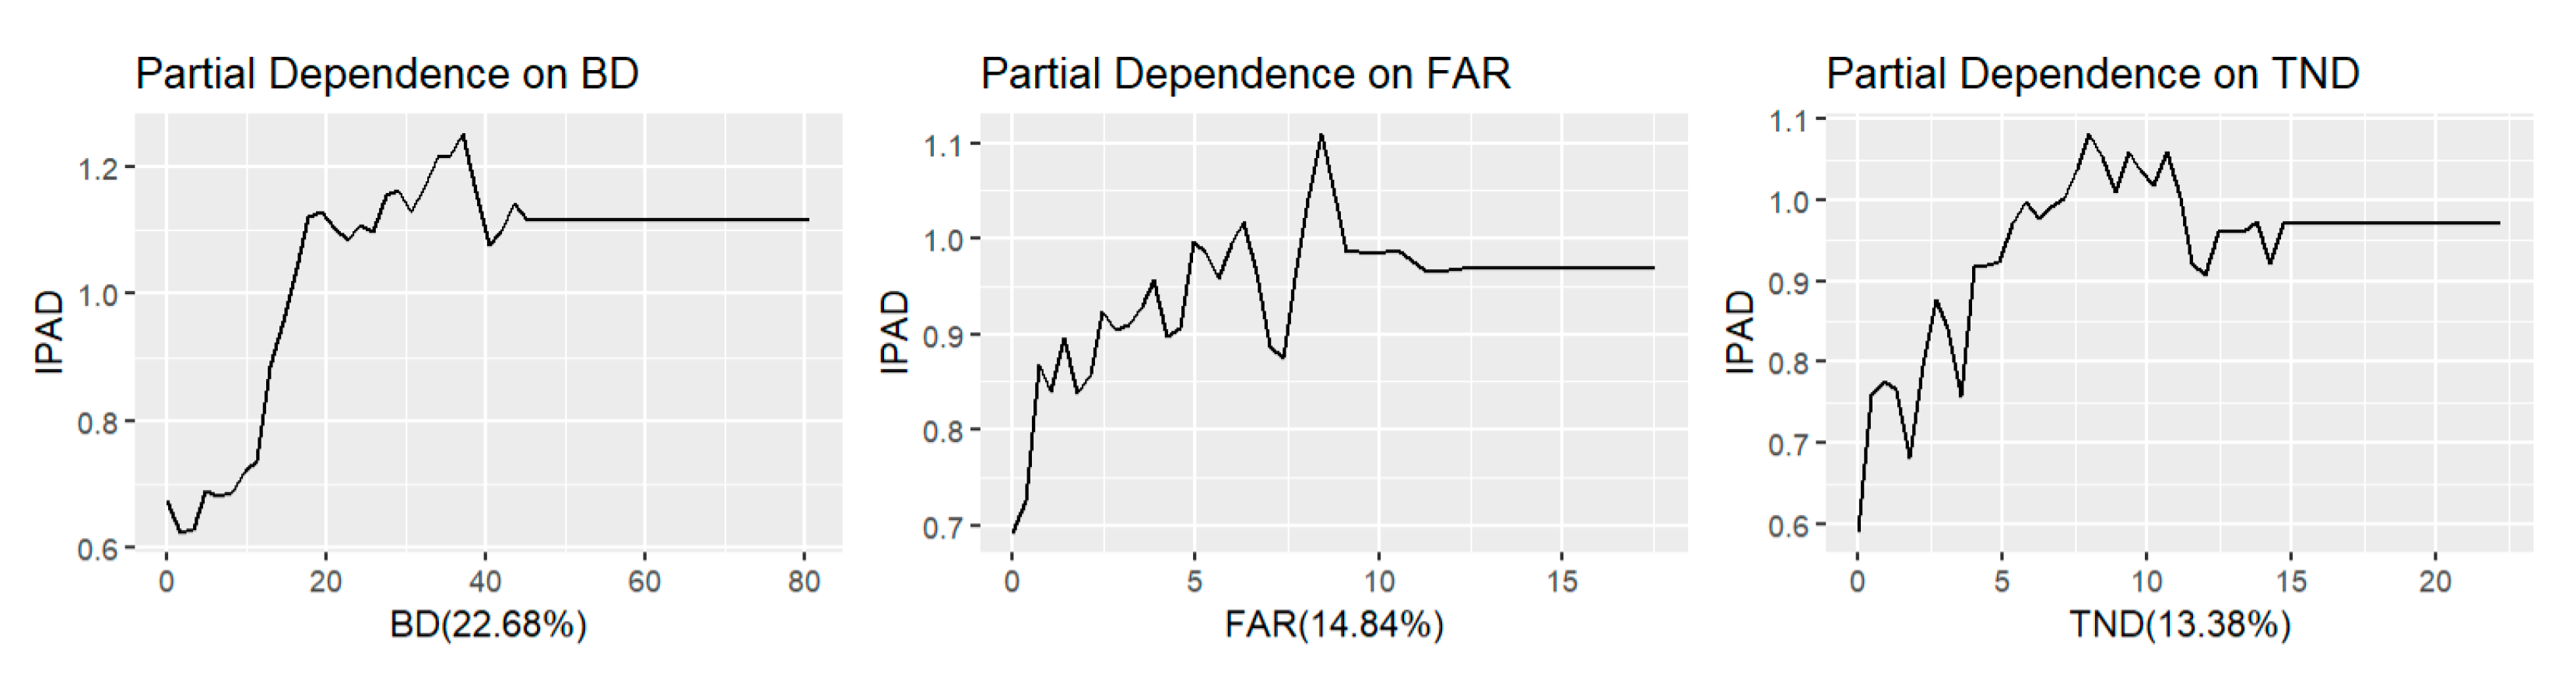
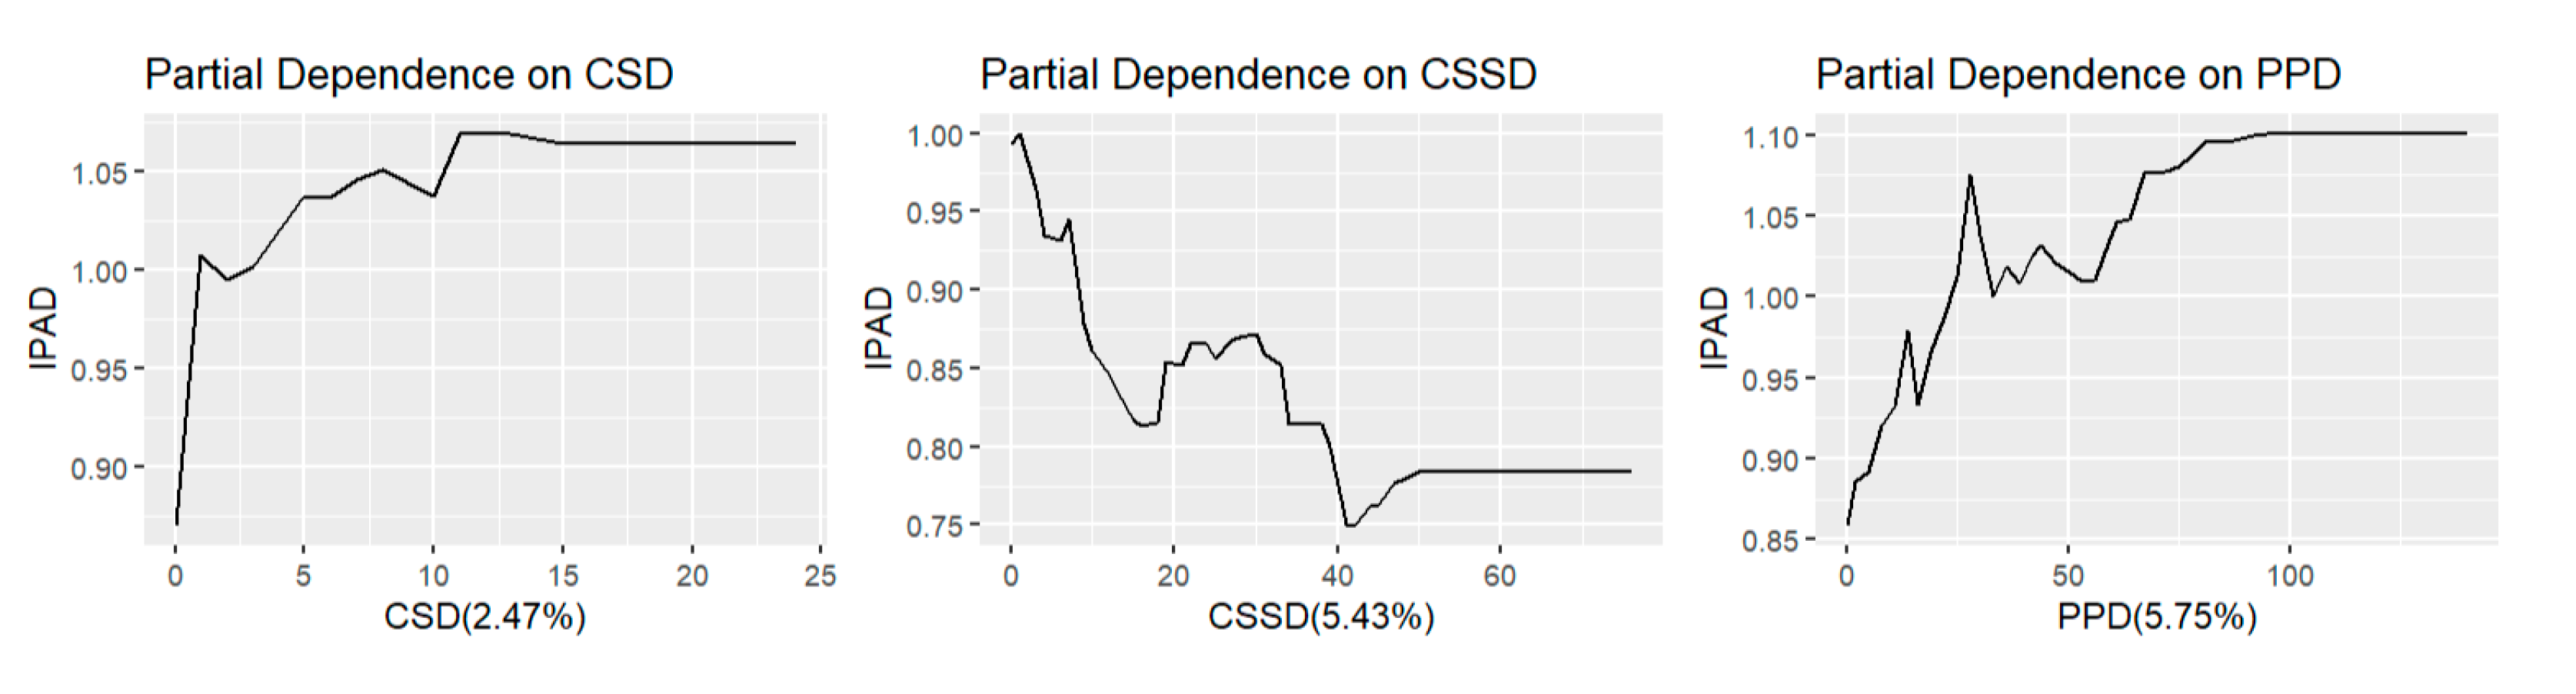
4.1. The Relative Importance and Threshold Effects of Independent Variables Across All Urban Centres
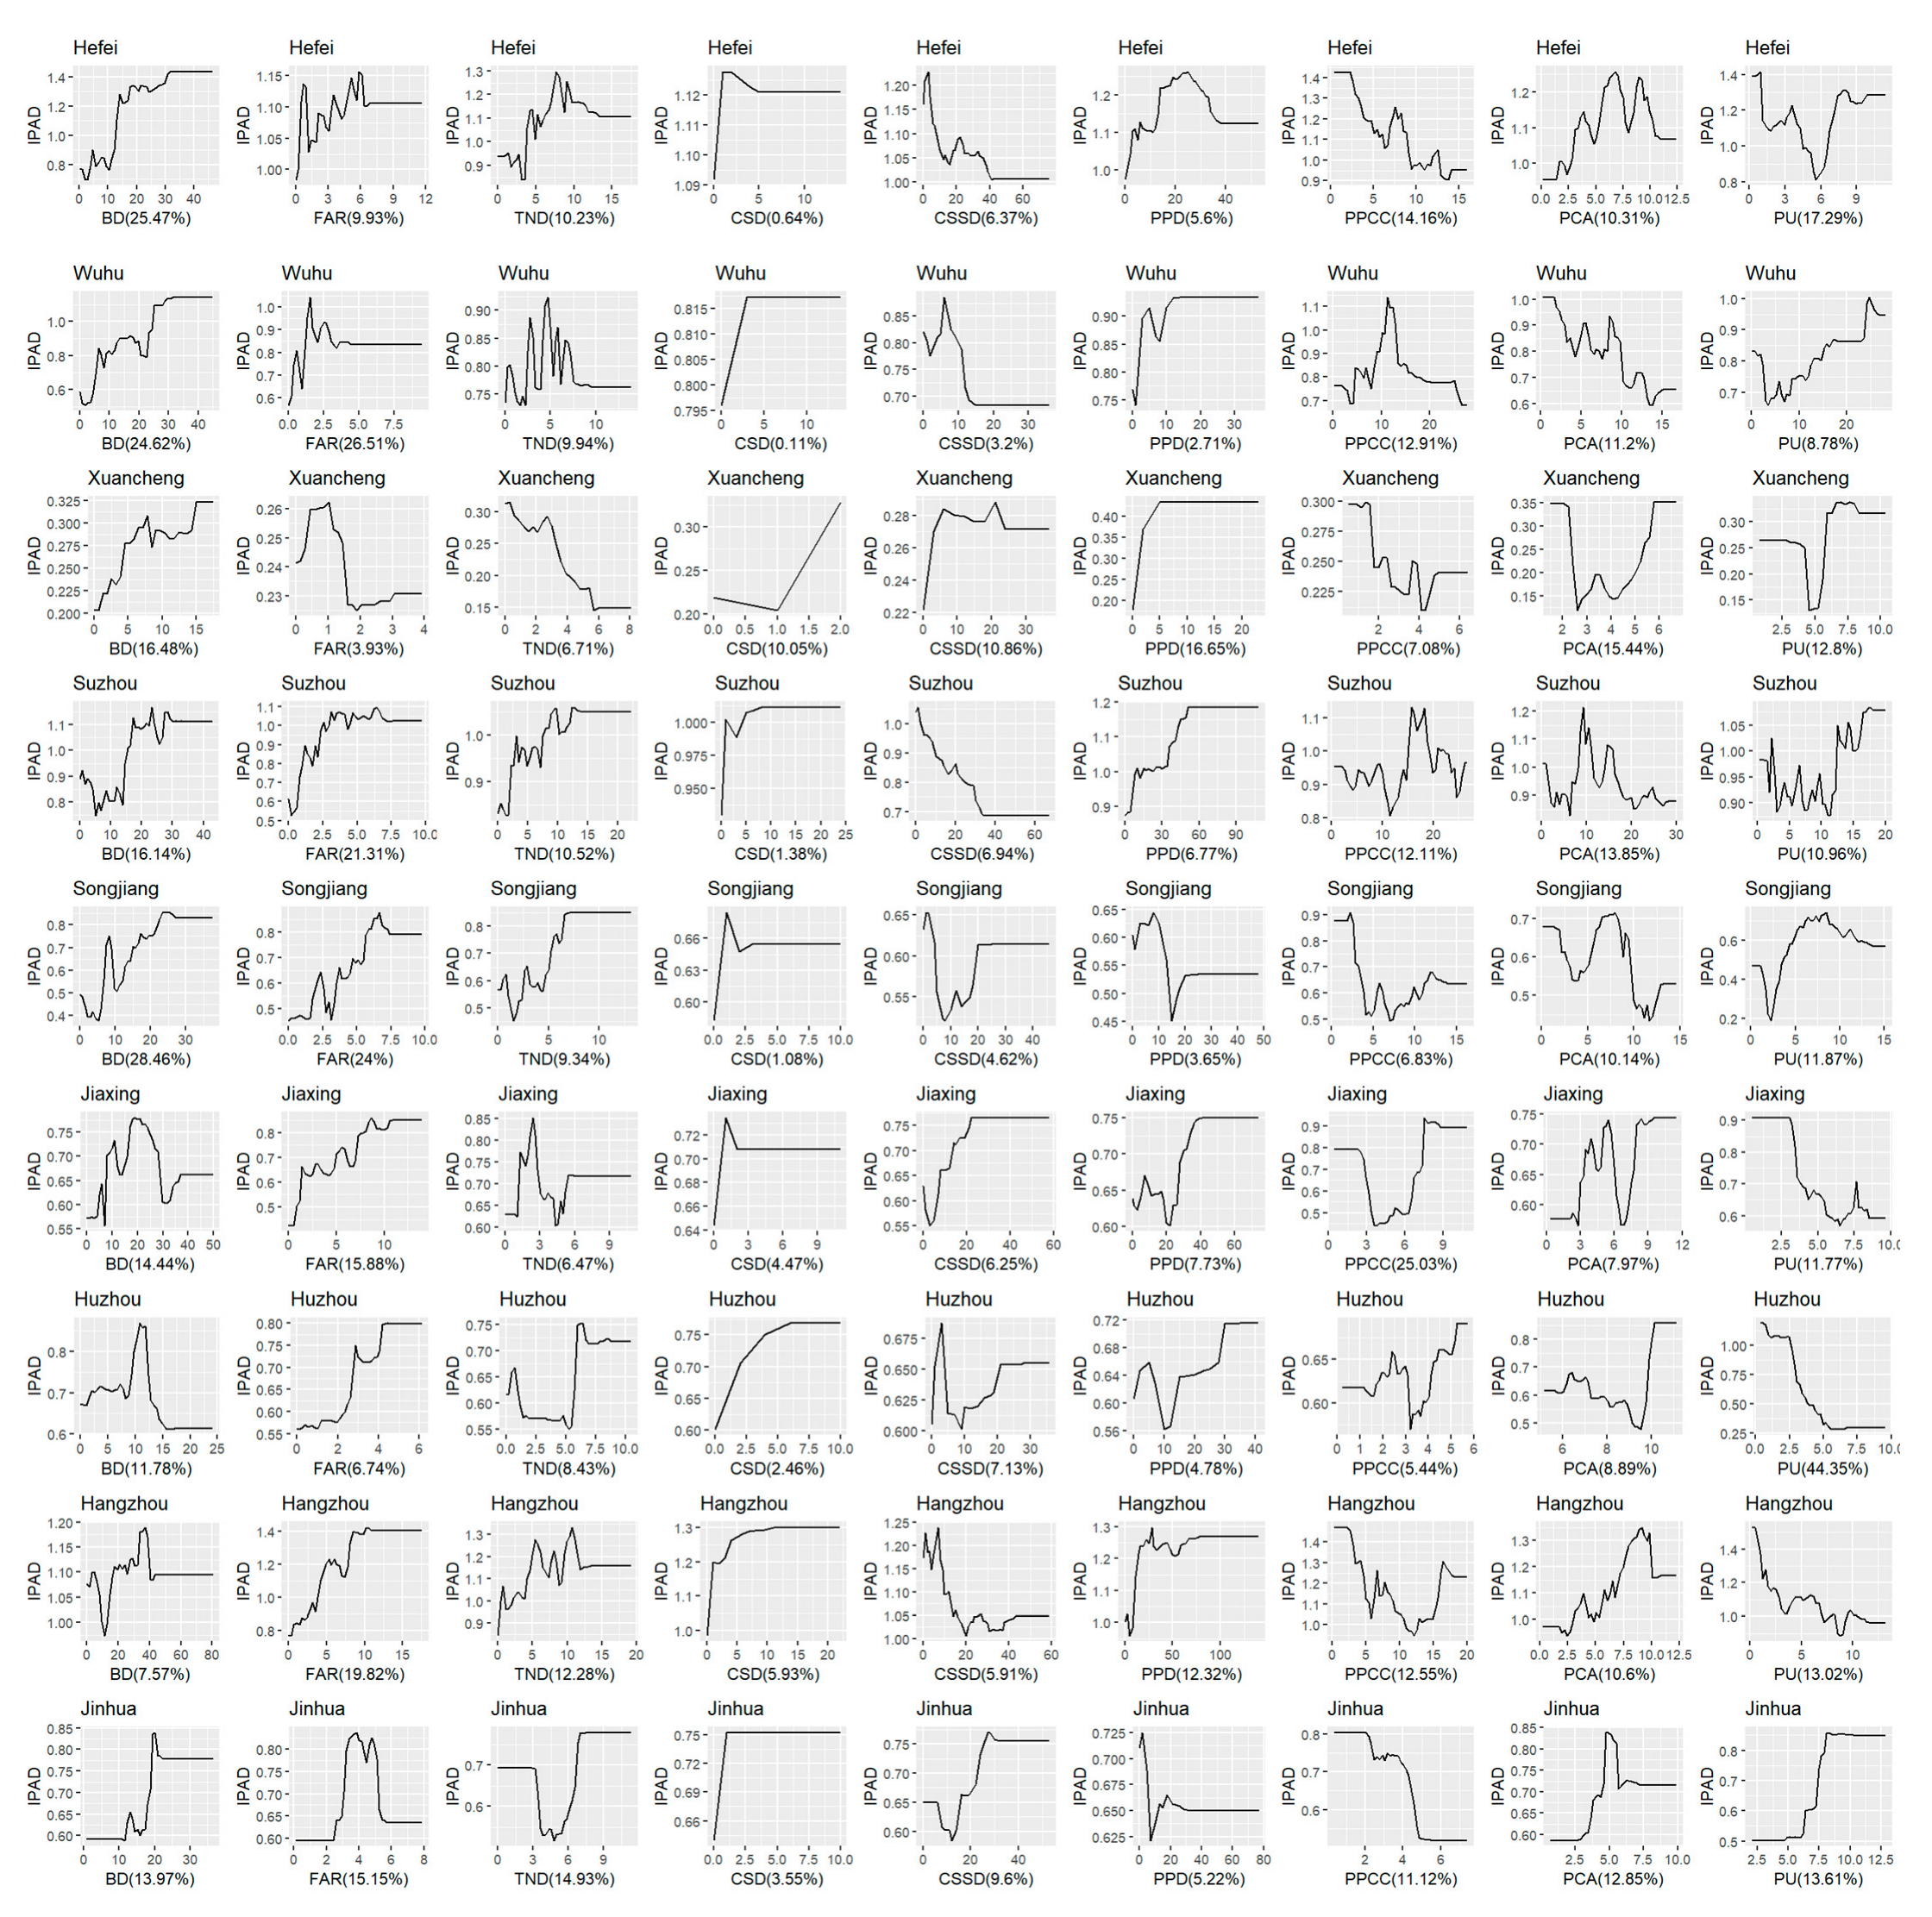
4.2. The Relative Importance and Threshold Effects of Independent Variables Across Respective Urban Centres
5. Discussion and Policy Implications
6. Conclusions
Author Contributions
Funding
Data Availability Statement
Conflicts of Interest
Abbreviations
| S&T | Science and technology |
| GBDT | Gradient boosting decision tree |
| YRD | Yangtze River Delta |
| CRH | China Railway High-Speed |
| IPAD | Invention patent application density |
| BD | Building density |
| FAR | Floor area ratio |
| TND | Transportation network density |
| CSD | Coffee shop density |
| CSSD | Convenience store and supermarket density |
| PPD | Public parking density |
| PPCC | Proximity to prefecture-level city centres |
| PCA | Proximity to CRH stations/airports |
| PU | Proximity to universities |
References
- Guo, Y.; Chen, P.; Wan, Y.; Zhu, Y.; Cao, X.; Zeng, G. Technology transfer in asymmetric innovation corridors: Theory and empirical evidence from China. Appl. Geogr. 2025, 178, 103599. [Google Scholar] [CrossRef]
- Saxenian, A. Regional Advantage: Culture and Competition in Silicon Valley and Route 128; Harvard University Press: Cambridge, MA, USA, 1994. [Google Scholar]
- Lepawsky, J. Clustering as Anti-politics Machine? Situating the Politics of Regional Economic Development and Malaysia’s Multimedia Super Corridor. Reg. Stud. 2009, 43, 463–478. [Google Scholar] [CrossRef]
- Cappellano, F.; Richardson, K.; Trautman, L. Cross border regional planning: Insights from Cascadia. Int. Plan. Stud. 2021, 26, 182–197. [Google Scholar] [CrossRef]
- Wachsmuth, D.; Kilfoil, P. Two logics of regionalism: The development of a regional imaginary in the Toronto–Waterloo Innovation Corridor. Reg. Stud. 2021, 55, 63–76. [Google Scholar] [CrossRef]
- Schwartz, M.; Peglow, F.; Fritsch, M.; Günther, J. What drives innovation output from subsidized R&D cooperation?—Project-level evidence from Germany. Technovation 2012, 32, 358–369. [Google Scholar] [CrossRef]
- Block, J.H.; Spiegel, F. Family firm density and regional innovation output: An exploratory analysis. J. Fam. Bus. Strategy 2013, 4, 270–280. [Google Scholar] [CrossRef]
- Hasan, I.; Tucci, C.L. The innovation–economic growth nexus: Global evidence. Res. Policy 2010, 39, 1264–1276. [Google Scholar] [CrossRef]
- Florida, R.; Adler, P.; Mellander, C. The city as innovation machine. Reg. Stud. 2017, 51, 86–96. [Google Scholar] [CrossRef]
- Berkes, E.; Gaetani, R. The Geography of Unconventional Innovation. Econ. J. 2021, 131, 1466–1514. [Google Scholar] [CrossRef]
- Dvir, R.; Pasher, E. Innovation engines for knowledge cities: An innovation ecology perspective. J. Knowl. Manag. 2004, 8, 16–27. [Google Scholar] [CrossRef]
- Jaffe, A.B.; Trajtenberg, M.; Henderson, R. Geographic Localization of Knowledge Spillovers as Evidenced by Patent Citations. Q. J. Econ. 1993, 108, 577–598. [Google Scholar] [CrossRef]
- Mascarini, S.; Garcia, R.; Quatraro, F. Local knowledge spillovers and the effects of related and unrelated variety on the novelty of innovation. Reg. Stud. 2023, 57, 1666–1680. [Google Scholar] [CrossRef]
- Zhao, K.; Li, W. High-Speed Railway Network, City Heterogeneity, and City Innovation. Sustainability 2023, 15, 15648. [Google Scholar] [CrossRef]
- Fritsch, M.; Wyrwich, M. Does Successful Innovation Require Large Urban Areas? Germany as a Counterexample. Econ. Geogr. 2021, 97, 284–308. [Google Scholar] [CrossRef]
- Fan, X.; Xu, Y. Does high-speed railway promote urban innovation? Evidence from China. Socio-Econ. Plan. Sci. 2023, 86, 101464. [Google Scholar] [CrossRef]
- Duan, J.; Zhao, Z.; Xu, Y.; You, X.; Yang, F.; Chen, G. Spatial Distribution Characteristics and Driving Factors of Little Giant Enterprises in China’s Megacity Clusters Based on Random Forest and MGWR. Land 2024, 13, 1105. [Google Scholar] [CrossRef]
- Wu, K.; Wang, Y.; Zhang, H.; Liu, Y.; Ye, Y. Impact of the Built Environment on the Spatial Heterogeneity of Regional Innovation Productivity: Evidence from the Pearl River Delta, China. Chin. Geogr. Sci. 2021, 31, 413–428. [Google Scholar] [CrossRef]
- Mouratidis, K.; Poortinga, W. Built environment, urban vitality and social cohesion: Do vibrant neighborhoods foster strong communities? Landsc. Urban Plan. 2020, 204, 103951. [Google Scholar] [CrossRef]
- Mouratidis, K. Built environment and social well-being: How does urban form affect social life and personal relationships? Cities 2018, 74, 7–20. [Google Scholar] [CrossRef]
- Chen, L.; Lu, Y.; Ye, Y.; Xiao, Y.; Yang, L. Examining the association between the built environment and pedestrian volume using street view images. Cities 2022, 127, 103734. [Google Scholar] [CrossRef]
- Yang, W.; Fei, J.; Li, Y.; Chen, H.; Liu, Y. Unraveling nonlinear and interaction effects of multilevel built environment features on outdoor jogging with explainable machine learning. Cities 2024, 147, 104813. [Google Scholar] [CrossRef]
- Jiang, H.; Xiong, W. The Impact of Land-Use Mix on Technological Innovation: Evidence from a Grid-Cell-Level Analysis of Shanghai, China. Land 2024, 13, 462. [Google Scholar] [CrossRef]
- Ewing, R.; Cervero, R. Travel and the Built Environment: A meta-analysis. J. Am. Plan. Assoc. 2010, 76, 265–294. [Google Scholar] [CrossRef]
- Hamidi, S.; Zandiatashbar, A. Does urban form matter for innovation productivity? A national multi-level study of the association between neighbourhood innovation capacity and urban sprawl. Urban Stud. 2018, 56, 1576–1594. [Google Scholar] [CrossRef]
- Hamidi, S.; Zandiatashbar, A.; Bonakdar, A. The relationship between regional compactness and regional innovation capacity (RIC): Empirical evidence from a national study. Technol. Forecast. Soc. Change 2019, 142, 394–402. [Google Scholar] [CrossRef]
- Bereitschaft, B. Are walkable places tech incubators? Evidence from Nebraska’s ‘Silicon Prairie’. Reg. Stud. Reg. Sci. 2019, 6, 339–356. [Google Scholar] [CrossRef]
- Xu, G.; Zhong, L.; Wu, F.; Zhang, Y.; Zhang, Z. Impacts of Micro-Scale Built Environment Features on Tourists’ Walking Behaviors in Historic Streets: Insights from Wudaoying Hutong, China. Buildings 2022, 12, 2248. [Google Scholar] [CrossRef]
- Steinmetz-Wood, M.; El-Geneidy, A.; Ross, N.A. Moving to policy-amenable options for built environment research: The role of micro-scale neighborhood environment in promoting walking. Health Place 2020, 66, 102462. [Google Scholar] [CrossRef] [PubMed]
- Wood, S.; Dovey, K. Creative Multiplicities: Urban Morphologies of Creative Clustering. J. Urban Des. 2015, 20, 52–74. [Google Scholar] [CrossRef]
- Li, L.; Zhang, X. Spatial Evolution and Critical Factors of Urban Innovation: Evidence from Shanghai, China. Sustainability 2020, 12, 938. [Google Scholar] [CrossRef]
- Hellwig, V. Tech hubs within cities—Determinants and dynamics. Ann. Reg. Sci. 2024, 73, 1885–1916. [Google Scholar] [CrossRef]
- Li, J.; Li, Y.; Tu, M.; Liu, X. Third places as catalysts for technological innovation? Evidence from a grid cell level analysis of Nanjing, China. Int. J. Urban Sci. 2024, 28, 105–123. [Google Scholar] [CrossRef]
- Cervero, R.; Kockelman, K. Travel demand and the 3Ds: Density, diversity, and design. Transp. Res. Part D Transp. Environ. 1997, 2, 199–219. [Google Scholar] [CrossRef]
- Boschma, R. Proximity and Innovation: A Critical Assessment. Reg. Stud. 2005, 39, 61–74. [Google Scholar] [CrossRef]
- Balland, P.-A.; Boschma, R.; Frenken, K. Proximity and Innovation: From Statics to Dynamics. Reg. Stud. 2015, 49, 907–920. [Google Scholar] [CrossRef]
- Gordon, I. Density and the built environment. Energy Policy 2008, 36, 4652–4656. [Google Scholar] [CrossRef]
- Chen, Z.; Dong, B.; Pei, Q.; Zhang, Z. The impacts of urban vitality and urban density on innovation: Evidence from China’s Greater Bay Area. Habitat Int. 2022, 119, 102490. [Google Scholar] [CrossRef]
- Wu, Y.; Wei, Y.D.; Li, H.; Liu, M. Amenity, firm agglomeration, and local creativity of producer services in Shanghai. Cities 2022, 120, 103421. [Google Scholar] [CrossRef]
- Zhang, M.; Partridge, M.D.; Song, H. Amenities and the geography of innovation: Evidence from Chinese cities. Ann. Reg. Sci. 2020, 65, 105–145. [Google Scholar] [CrossRef]
- Tao, T.; Cao, J. Exploring nonlinear and collective influences of regional and local built environment characteristics on travel distances by mode. J. Transp. Geogr. 2023, 109, 103599. [Google Scholar] [CrossRef]
- Jin, M.; Guo, J.; Xie, S.; Lin, Y.; Gong, Y.; Liu, Y. Understanding the Effect of Built Environment on Travel Behavior at Multiple Geographic Scales. Transp. Res. Rec. J. Transp. Res. Board 2023, 2677, 1062–1076. [Google Scholar] [CrossRef]
- Credit, K. Transit-oriented economic development: The impact of light rail on new business starts in the Phoenix, AZ Region, USA. Urban Stud. 2018, 55, 2838–2862. [Google Scholar] [CrossRef]
- Audretsch, D.B.; Feldman, M.P. Chapter 61—Knowledge Spillovers and the Geography of Innovation. In Handbook of Regional and Urban Economics; Henderson, J.V., Thisse, J.-F., Eds.; Elsevier: Amsterdam, The Netherlands, 2004; Volume 4, pp. 2713–2739. [Google Scholar]
- Fitjar, R.D.; Huber, F.; Rodríguez-Pose, A. Not too close, not too far: Testing the Goldilocks principle of ‘optimal’ distance in innovation networks. Ind. Innov. 2016, 23, 465–487. [Google Scholar] [CrossRef]
- Duranton, G.; Puga, D. The Economics of Urban Density. J. Econ. Perspect. 2020, 34, 3–26. [Google Scholar] [CrossRef]
- Boschma, R.; Frenken, K. Chapter 5: The Spatial Evolution of Innovation Networks: A Proximity Perspective. In The Handbook of Evolutionary Economic Geography; Edward Elgar Publishing: Cheltenham, UK, 2010. [Google Scholar]
- Dong, W.; Cao, X.; Wu, X.; Dong, Y. Examining pedestrian satisfaction in gated and open communities: An integration of gradient boosting decision trees and impact-asymmetry analysis. Landsc. Urban Plan. 2019, 185, 246–257. [Google Scholar] [CrossRef]
- Zhang, W.; Lu, D.; Zhao, Y.; Luo, X.; Yin, J. Incorporating polycentric development and neighborhood life-circle planning for reducing driving in Beijing: Nonlinear and threshold analysis. Cities 2022, 121, 103488. [Google Scholar] [CrossRef]
- Wang, R.; Wang, X.; Zhang, Z.; Zhang, S.; Li, K. Research on the Nonlinear and Interactive Effects of Multidimensional Influencing Factors on Urban Innovation Cooperation: A Method Based on an Explainable Machine Learning Model. Systems 2025, 13, 187. [Google Scholar] [CrossRef]
- Yang, J.; Shi, B. Scale or size? An analysis of the factors that affect building density: Evidence from high-density central urban zones in Asia. Urban Des. Int. 2021, 26, 220–233. [Google Scholar] [CrossRef]
- Barr, J.; Cohen, J.P. The floor area ratio gradient: New York City, 1890–2009. Reg. Sci. Urban Econ. 2014, 48, 110–119. [Google Scholar] [CrossRef]
- Fritsch, M.; Slavtchev, V. Universities and Innovation in Space. Ind. Innov. 2007, 14, 201–218. [Google Scholar] [CrossRef]
- Che, Y.; Li, X.; Liu, X.; Wang, Y.; Liao, W.; Zheng, X.; Zhang, X.; Xu, X.; Shi, Q.; Zhu, J.; et al. 3D-GloBFP: The first global three-dimensional building footprint dataset. Earth Syst. Sci. Data 2024, 16, 5357–5374. [Google Scholar] [CrossRef]
- Zhang, W.; Zhao, Y.; Cao, X.J.; Lu, D.; Chai, Y. Nonlinear effect of accessibility on car ownership in Beijing: Pedestrian-scale neighborhood planning. Transp. Res. Part D Transp. Environ. 2020, 86, 102445. [Google Scholar] [CrossRef]
- Ding, C.; Cao, X.; Næss, P. Applying gradient boosting decision trees to examine non-linear effects of the built environment on driving distance in Oslo. Transp. Res. Part A Policy Pract. 2018, 110, 107–117. [Google Scholar] [CrossRef]
- Ma, J.; Cheng, J.C.P.; Jiang, F.; Chen, W.; Zhang, J. Analyzing driving factors of land values in urban scale based on big data and non-linear machine learning techniques. Land Use Policy 2020, 94, 104537. [Google Scholar] [CrossRef]
- Wang, K.; Wang, X. Generational differences in automobility: Comparing America’s Millennials and Gen Xers using gradient boosting decision trees. Cities 2021, 114, 103204. [Google Scholar] [CrossRef]
- Jun, M.-J. A comparison of a gradient boosting decision tree, random forests, and artificial neural networks to model urban land use changes: The case of the Seoul metropolitan area. Int. J. Geogr. Inf. Sci. 2021, 35, 2149–2167. [Google Scholar] [CrossRef]
- Tao, T.; Wang, J.; Cao, X. Exploring the non-linear associations between spatial attributes and walking distance to transit. J. Transp. Geogr. 2020, 82, 102560. [Google Scholar] [CrossRef]
- Chao, L.; Zerun, L.; Mi, D. Study on the Impacts of Urban Density on Common Chronic Diseases in American Metropolitan Areas. Urban Plan. Int. 2024, 40, 1–22. (In Chinese) [Google Scholar] [CrossRef]
- Ding, C.; Cao, X.; Liu, C. How does the station-area built environment influence Metrorail ridership? Using gradient boosting decision trees to identify non-linear thresholds. J. Transp. Geogr. 2019, 77, 70–78. [Google Scholar] [CrossRef]
- Ben Letaifa, S.; Rabeau, Y. Too close to collaborate? How geographic proximity could impede entrepreneurship and innovation. J. Bus. Res. 2013, 66, 2071–2078. [Google Scholar] [CrossRef]
- Hua, L.; Yang, Z.; Shao, J. Impact of network density on the efficiency of innovation networks: An agent-based simulation study. PLoS ONE 2022, 17, e0270087. [Google Scholar] [CrossRef] [PubMed]
- Balland, P.-A.; Jara-Figueroa, C.; Petralia, S.G.; Steijn, M.P.A.; Rigby, D.L.; Hidalgo, C.A. Complex economic activities concentrate in large cities. Nat. Hum. Behav. 2020, 4, 248–254. [Google Scholar] [CrossRef] [PubMed]
- Breschi, S.; Lissoni, F. Knowledge Spillovers and Local Innovation Systems: A Critical Survey. Ind. Corp. Change 2001, 10, 975–1005. [Google Scholar] [CrossRef]


| Dimensions | Variables | Symbol | Unit | Min | Max | Mean | SD | |
|---|---|---|---|---|---|---|---|---|
| Dependent variable | ||||||||
| Innovation output | Invention patent application density | IPAD | applications/km2 | 0.00 | 4046.00 | 40.30 | 165.10 | |
| Independent variables | ||||||||
| Density | Urban construction density | Building density | BD | % | 0.00 | 80.72 | 15.29 | 10.46 |
| Floor area ratio | FAR | - | 0.00 | 17.55 | 3.57 | 2.68 | ||
| Transportation network density | TND | km/km2 | 0.00 | 22.24 | 5.14 | 3.29 | ||
| Amenity density | Coffee shop density | CSD | shops/km2 | 0.00 | 24.00 | 0.81 | 2.10 | |
| Convenience store and supermarket density | CSSD | shops/km2 | 0.00 | 76.00 | 8.52 | 11.49 | ||
| Public parking density | PPD | lots/km2 | 0.00 | 140.00 | 10.22 | 16.48 | ||
| Proximity | Proximity to key urban nodes | Proximity to prefecture-level city centres | PPCC | km | 0.22 | 27.70 | 9.93 | 5.76 |
| Proximity to CRH stations/airports | PCA | km | 0.14 | 29.95 | 7.60 | 5.15 | ||
| Proximity to universities | PU | km | 0.15 | 28.04 | 6.74 | 4.67 | ||
| Sub-Dimensions | Variables | Overall Ranking | Relative Importance (%) | Total (%) |
|---|---|---|---|---|
| Urban construction density | BD | 1 | 22.68 | 50.90 |
| FAR | 2 | 14.84 | ||
| TND | 4 | 13.38 | ||
| Amenity density | CSD | 9 | 2.46 | 13.64 |
| CSSD | 8 | 5.43 | ||
| PPD | 7 | 5.75 | ||
| Proximity to key urban nodes | PPCC | 5 | 11.35 | 35.46 |
| PCA | 6 | 10.17 | ||
| PU | 3 | 13.94 |
| Variables | Relative Importance (%) | |||||||||||||||||
|---|---|---|---|---|---|---|---|---|---|---|---|---|---|---|---|---|---|---|
| Hefei | Total | Wuhu | Total | Xuancheng | Total | Suzhou | Total | Songjiang | Total | Jiaxing | Total | Huzhou | Total | Hangzhou | Total | Jinhua | Total | |
| BD | 25.47 | 45.63 | 24.62 | 61.07 | 16.48 | 27.13 | 16.14 | 47.97 | 28.46 | 61.80 | 14.44 | 36.79 | 11.78 | 26.95 | 7.57 | 39.67 | 13.97 | 44.05 |
| FAR | 9.93 | 26.51 | 3.94 | 21.31 | 24.00 | 15.88 | 6.74 | 19.82 | 15.15 | |||||||||
| TND | 10.23 | 9.94 | 6.71 | 10.52 | 9.34 | 6.47 | 8.43 | 12.28 | 14.93 | |||||||||
| CSD | 0.64 | 12.61 | 0.13 | 6.04 | 10.05 | 37.55 | 1.40 | 15.11 | 1.08 | 9.36 | 4.46 | 18.44 | 2.46 | 14.37 | 5.93 | 24.16 | 3.55 | 18.37 |
| CSSD | 6.37 | 3.20 | 10.86 | 6.94 | 4.62 | 6.25 | 7.13 | 5.91 | 9.60 | |||||||||
| PPD | 5.60 | 2.71 | 16.64 | 6.77 | 3.65 | 7.73 | 4.78 | 12.32 | 5.22 | |||||||||
| PPCC | 14.16 | 41.76 | 12.91 | 32.89 | 7.08 | 35.32 | 12.11 | 36.92 | 6.83 | 28.84 | 25.03 | 44.77 | 5.44 | 58.68 | 12.55 | 36.17 | 11.12 | 37.58 |
| PCA | 10.31 | 11.20 | 15.44 | 13.85 | 10.14 | 7.97 | 8.89 | 10.60 | 12.85 | |||||||||
| PU | 17.29 | 8.78 | 12.80 | 10.96 | 11.87 | 11.77 | 44.35 | 13.02 | 13.61 | |||||||||
| Best iteration | 2334 | 1371 | 688 | 1853 | 1914 | 1528 | 2900 | 3023 | 9797 | |||||||||
| Pseudo R2 | 0.699 | 0.521 | 0.590 | 0.654 | 0.627 | 0.515 | 0.762 | 0.753 | 0.685 | |||||||||
| Obs. | 426 | 262 | 29 | 751 | 355 | 114 | 49 | 505 | 62 | |||||||||
Disclaimer/Publisher’s Note: The statements, opinions and data contained in all publications are solely those of the individual author(s) and contributor(s) and not of MDPI and/or the editor(s). MDPI and/or the editor(s) disclaim responsibility for any injury to people or property resulting from any ideas, methods, instructions or products referred to in the content. |
© 2025 by the authors. Licensee MDPI, Basel, Switzerland. This article is an open access article distributed under the terms and conditions of the Creative Commons Attribution (CC BY) license (https://creativecommons.org/licenses/by/4.0/).
Share and Cite
Wang, L.; Li, L. The Impact of the Built Environment on Innovation Output in High-Density Urban Centres at the Micro-Scale: A Case Study of the G60 S&T Innovation Valley, China. Buildings 2025, 15, 2528. https://doi.org/10.3390/buildings15142528
Wang L, Li L. The Impact of the Built Environment on Innovation Output in High-Density Urban Centres at the Micro-Scale: A Case Study of the G60 S&T Innovation Valley, China. Buildings. 2025; 15(14):2528. https://doi.org/10.3390/buildings15142528
Chicago/Turabian StyleWang, Lie, and Lingyue Li. 2025. "The Impact of the Built Environment on Innovation Output in High-Density Urban Centres at the Micro-Scale: A Case Study of the G60 S&T Innovation Valley, China" Buildings 15, no. 14: 2528. https://doi.org/10.3390/buildings15142528
APA StyleWang, L., & Li, L. (2025). The Impact of the Built Environment on Innovation Output in High-Density Urban Centres at the Micro-Scale: A Case Study of the G60 S&T Innovation Valley, China. Buildings, 15(14), 2528. https://doi.org/10.3390/buildings15142528