

Expectations Versus Reality: Economic Performance of a Building-Integrated Photovoltaic System in the Andean Ecuadorian Context

 ,
,  , , , and
Abstract
1. Introduction
2. Previous Research
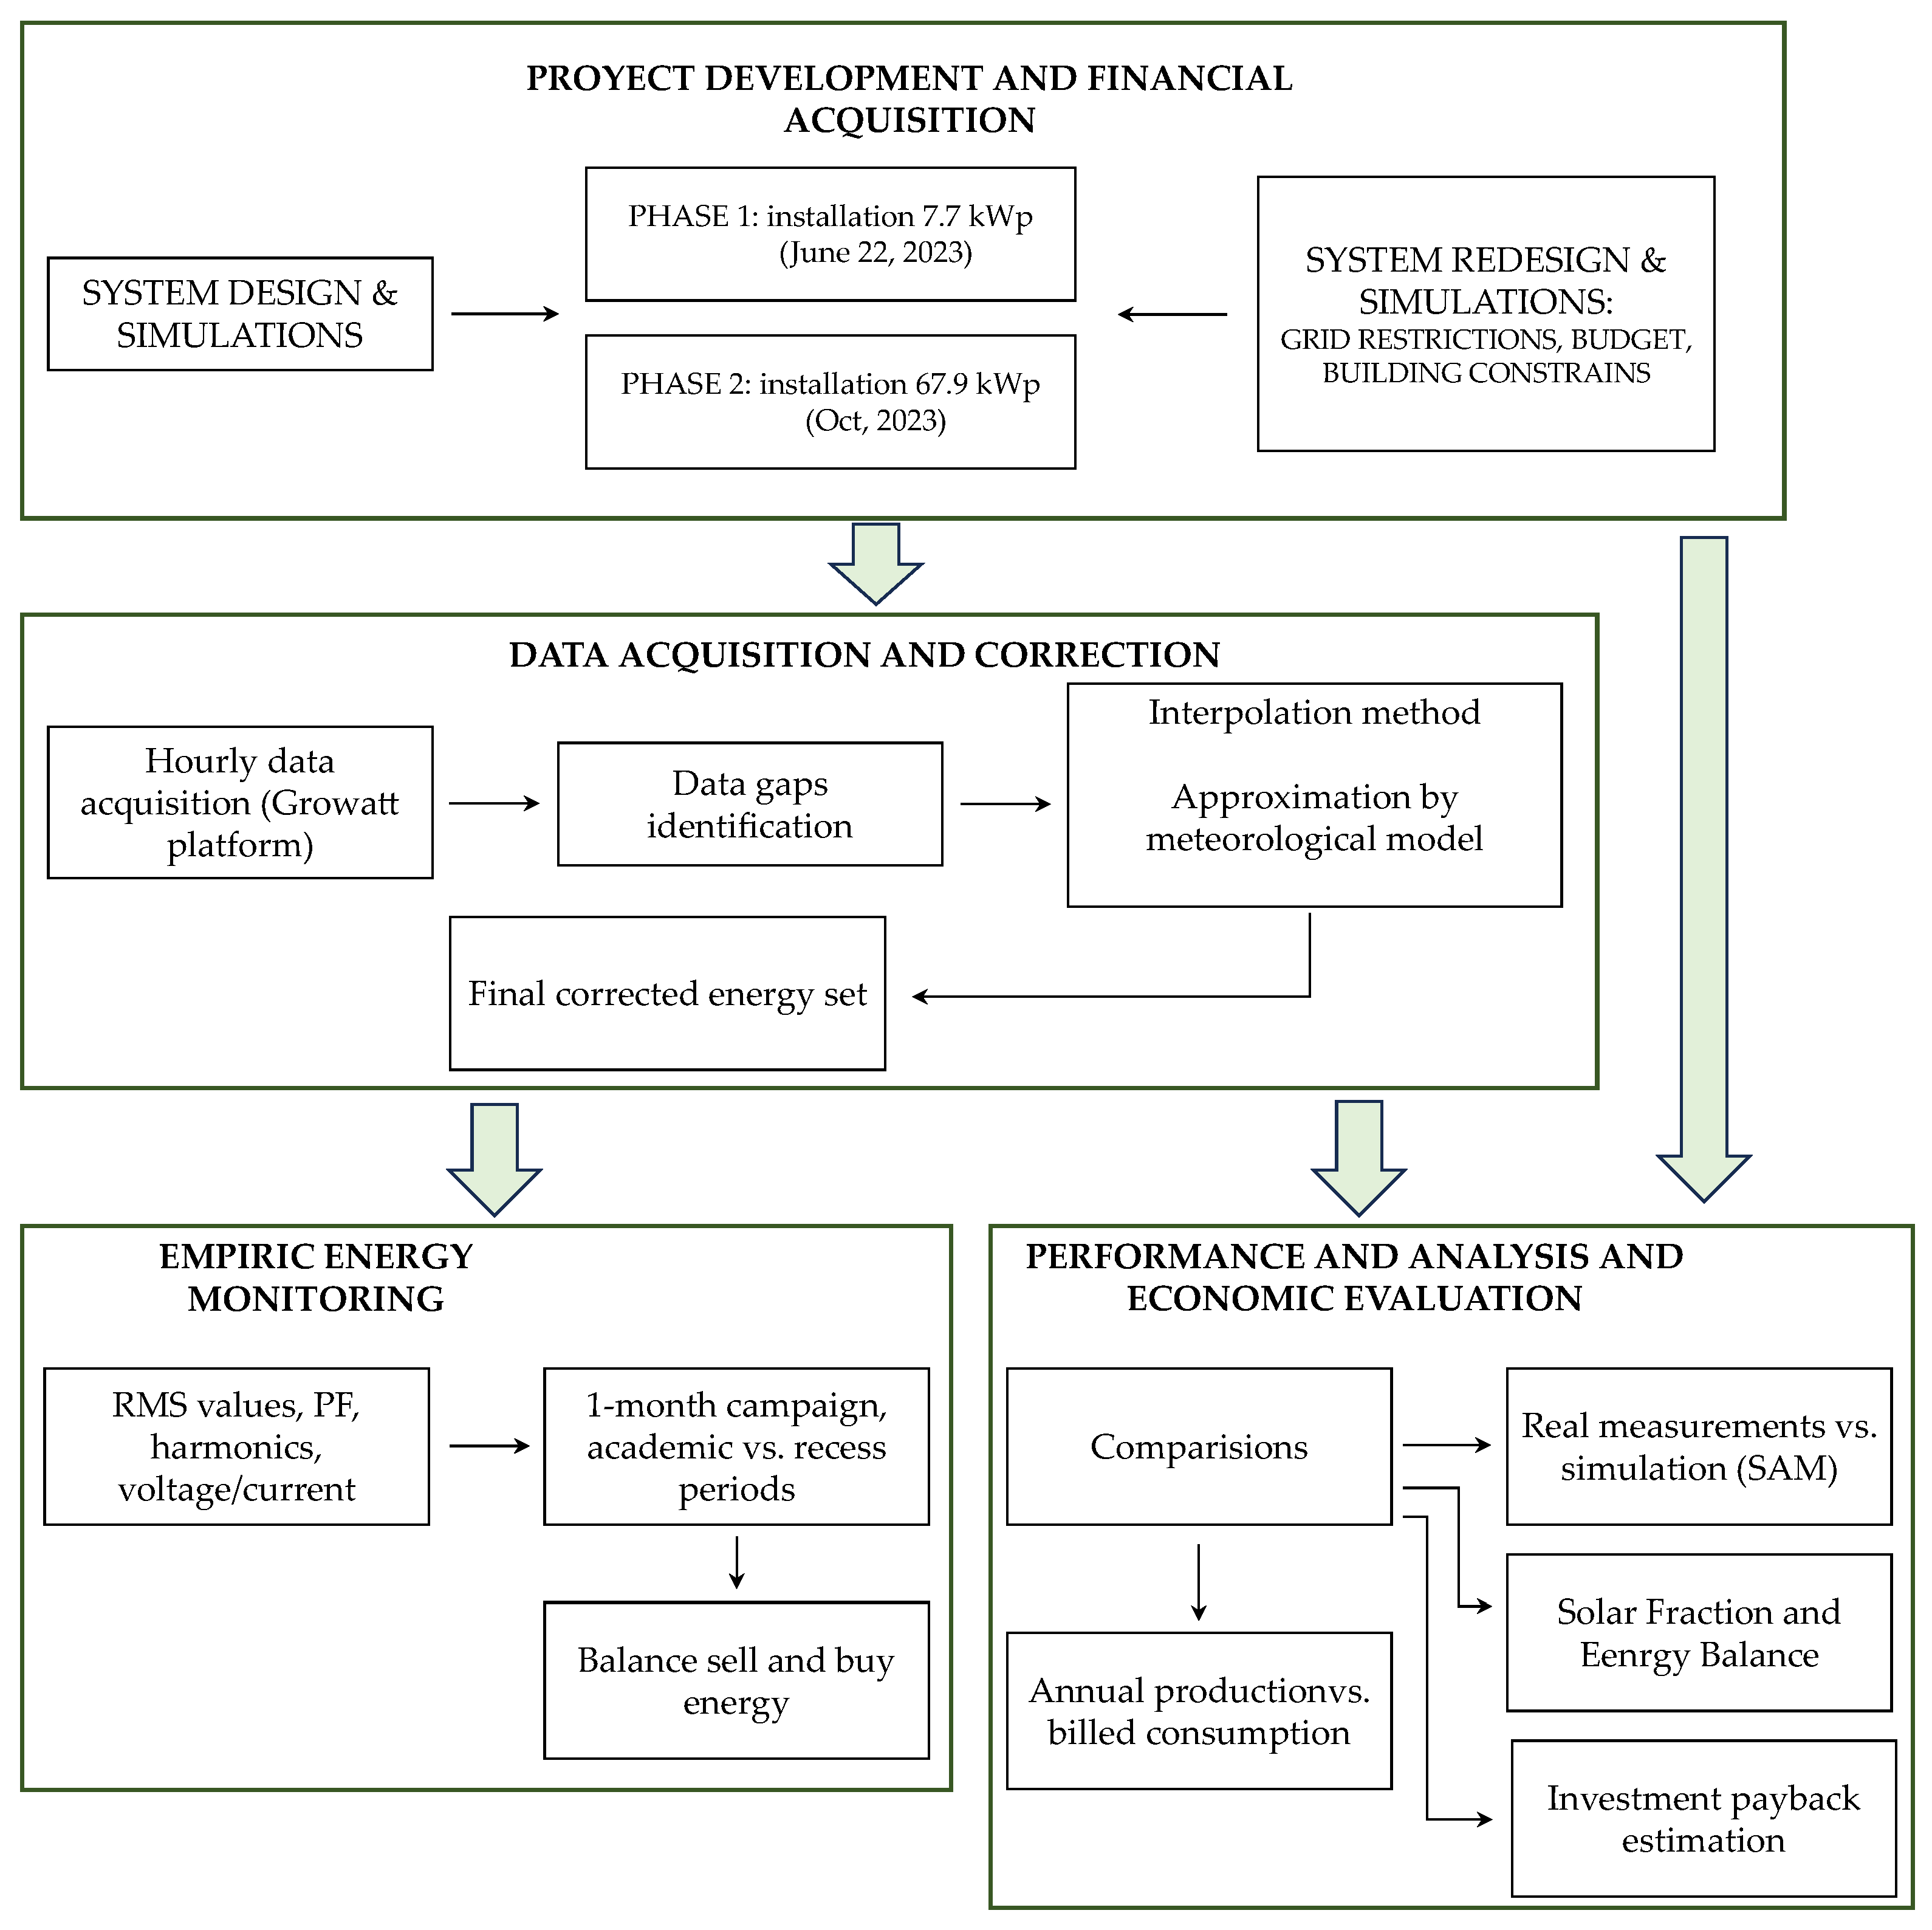
3. Methodology
4. Results
4.1. Background Project
4.2. Development and Outcome of First Stage
4.3. Development and Outcome of the Second Stage
4.3.1. Instrumentation and Maintenance Assumptions
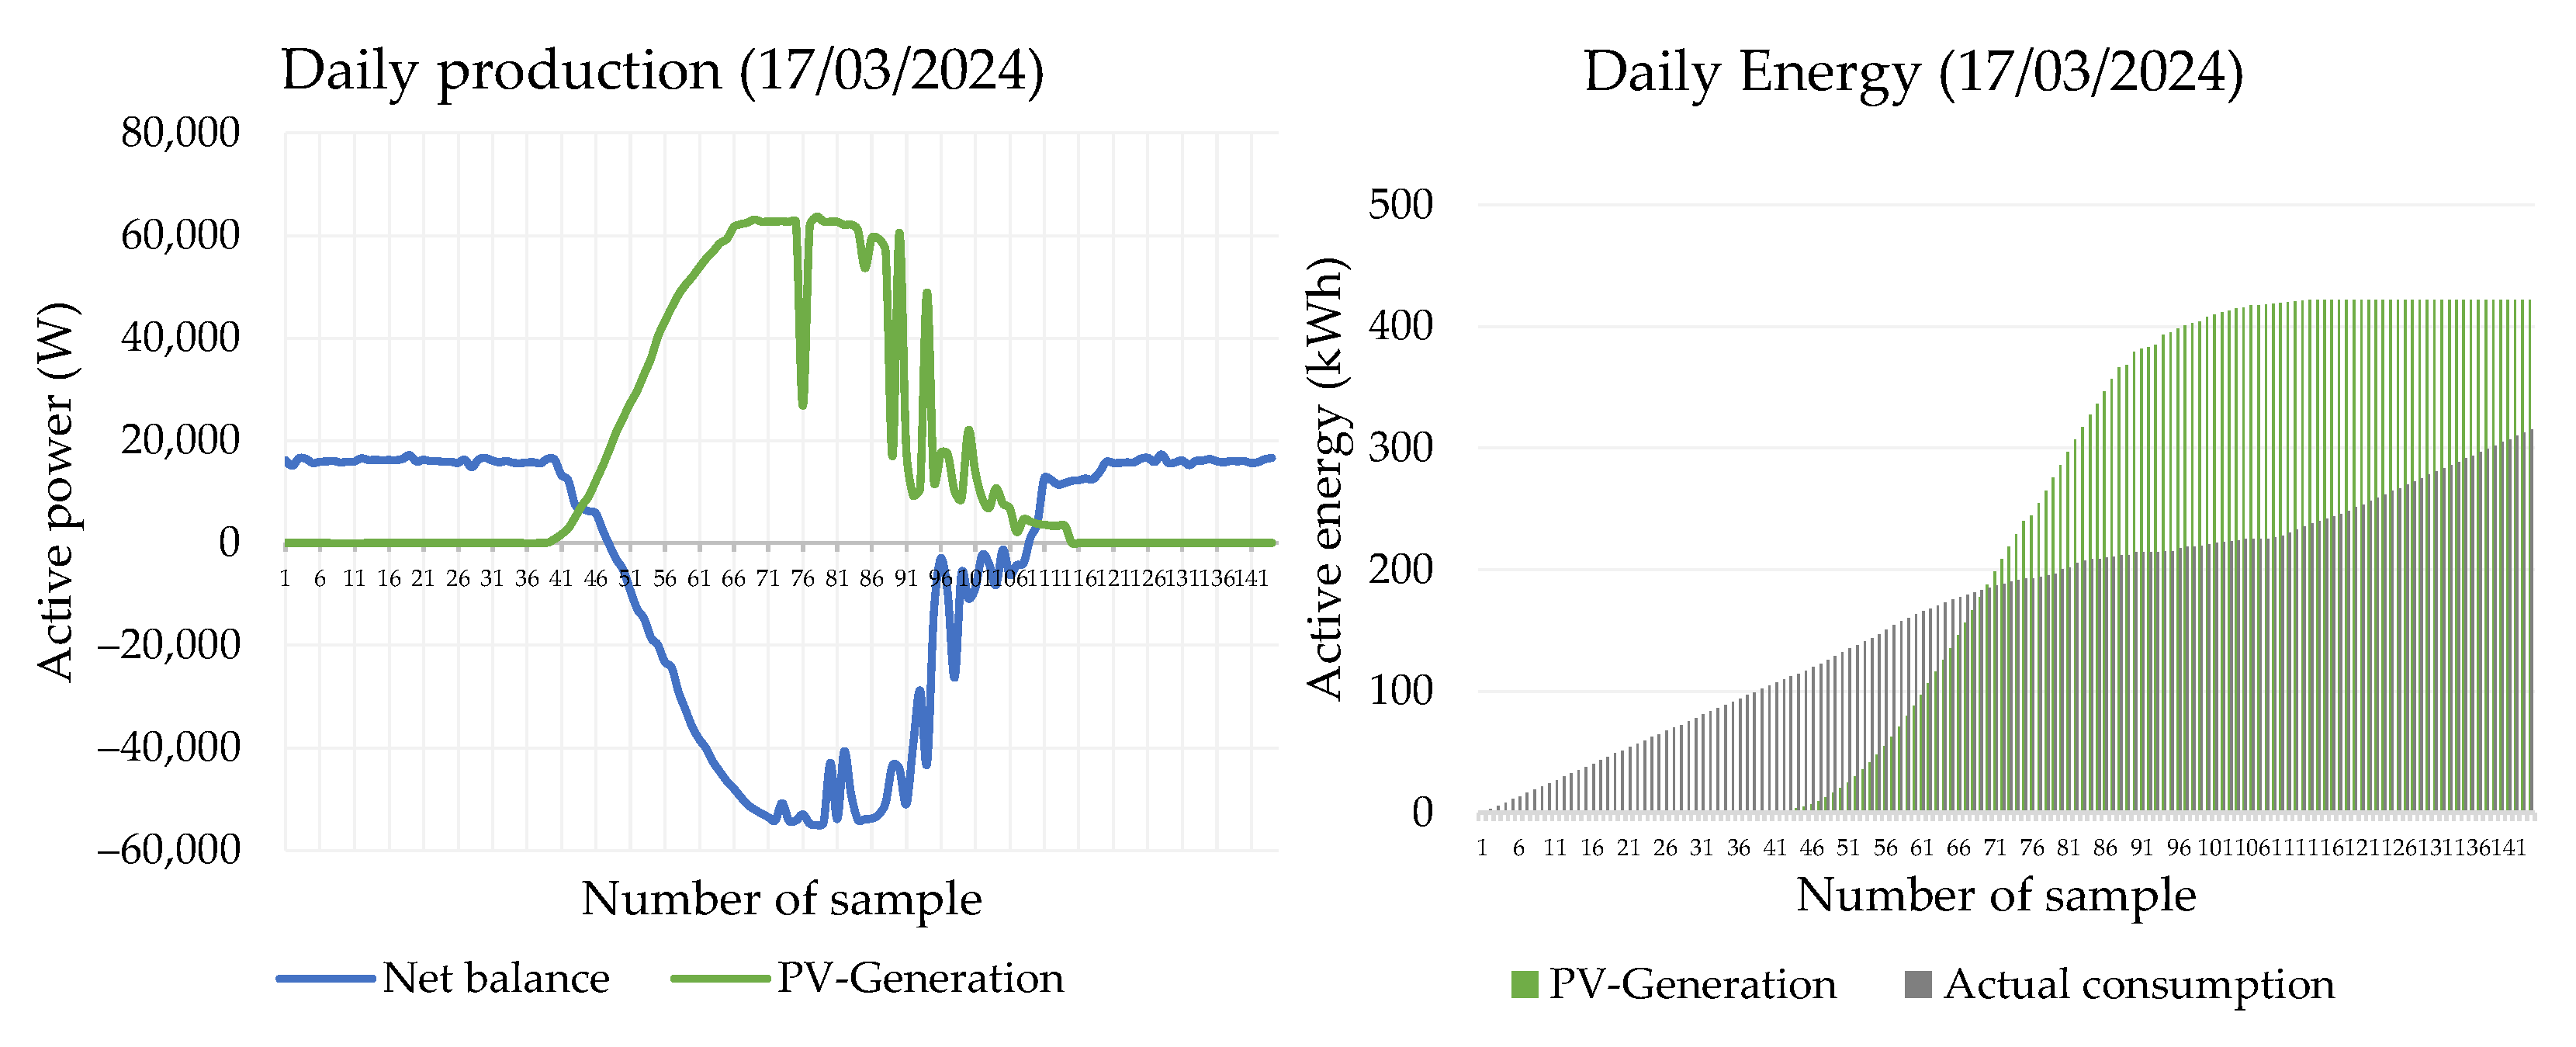
4.3.2. Power Flows and Daily Profiles
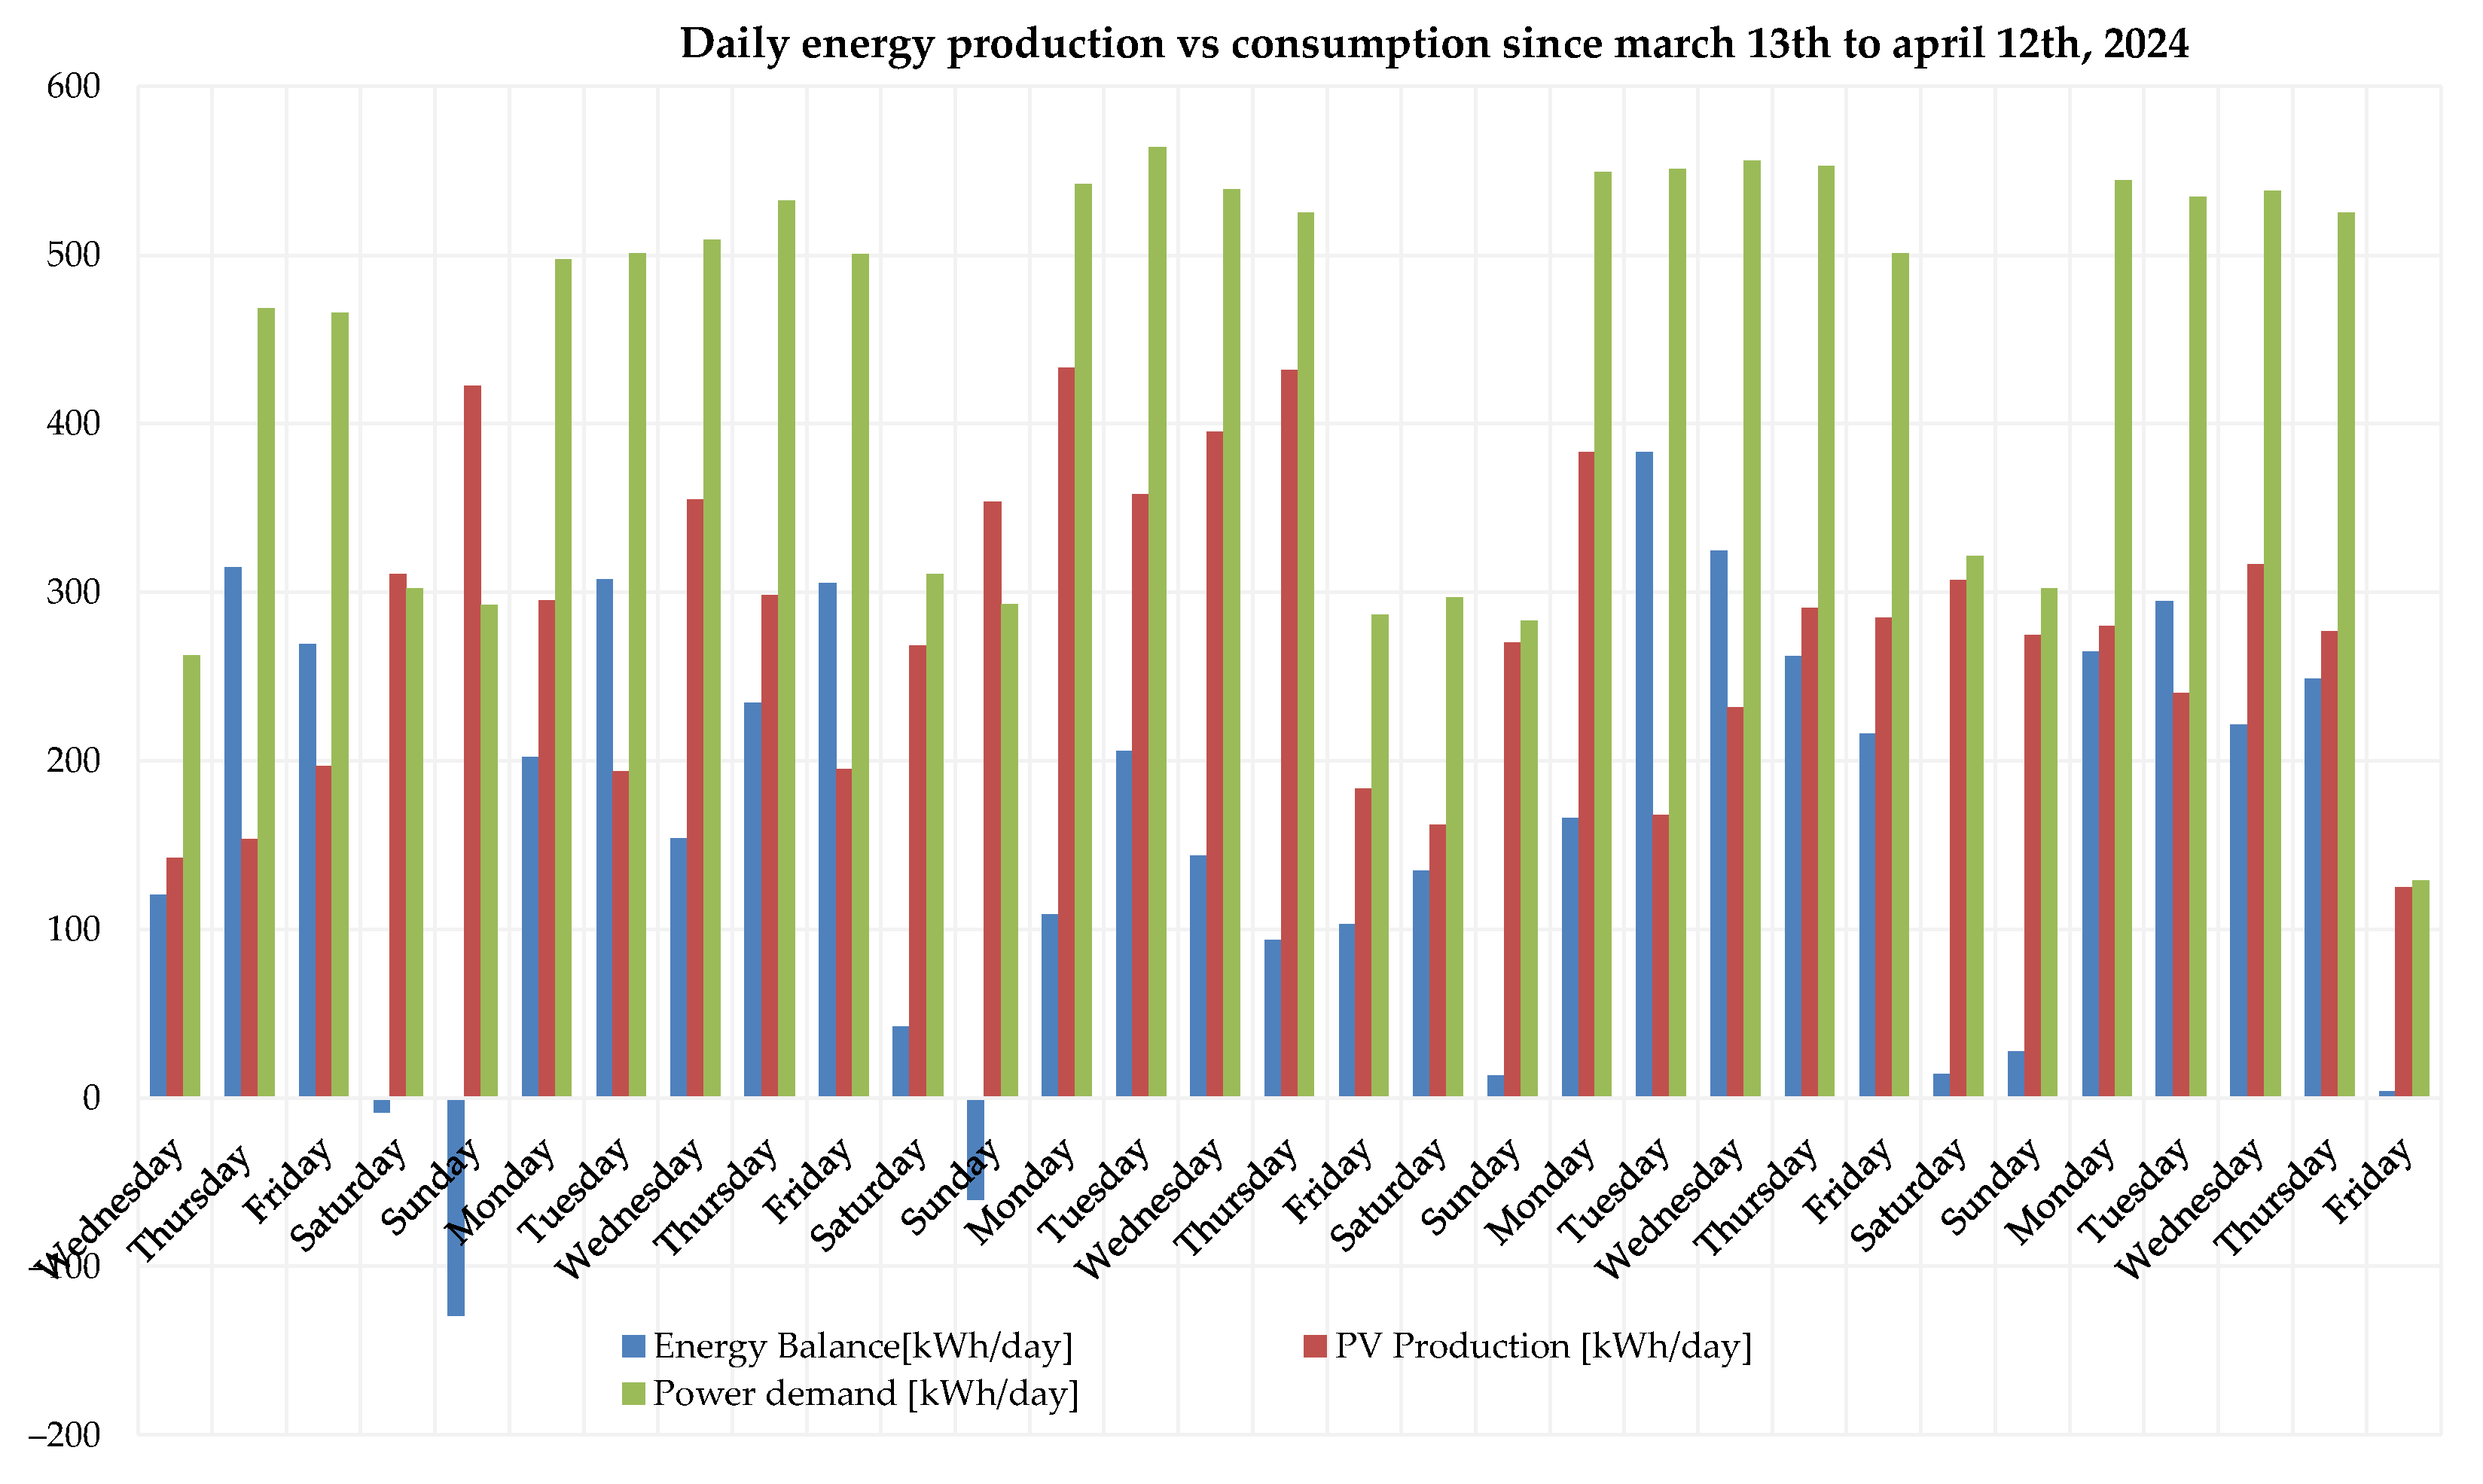
4.3.3. Weekly Trends and Grid Dependency Reduction
4.3.4. Integration and Functional Scope of the Lithium-Ion Battery System
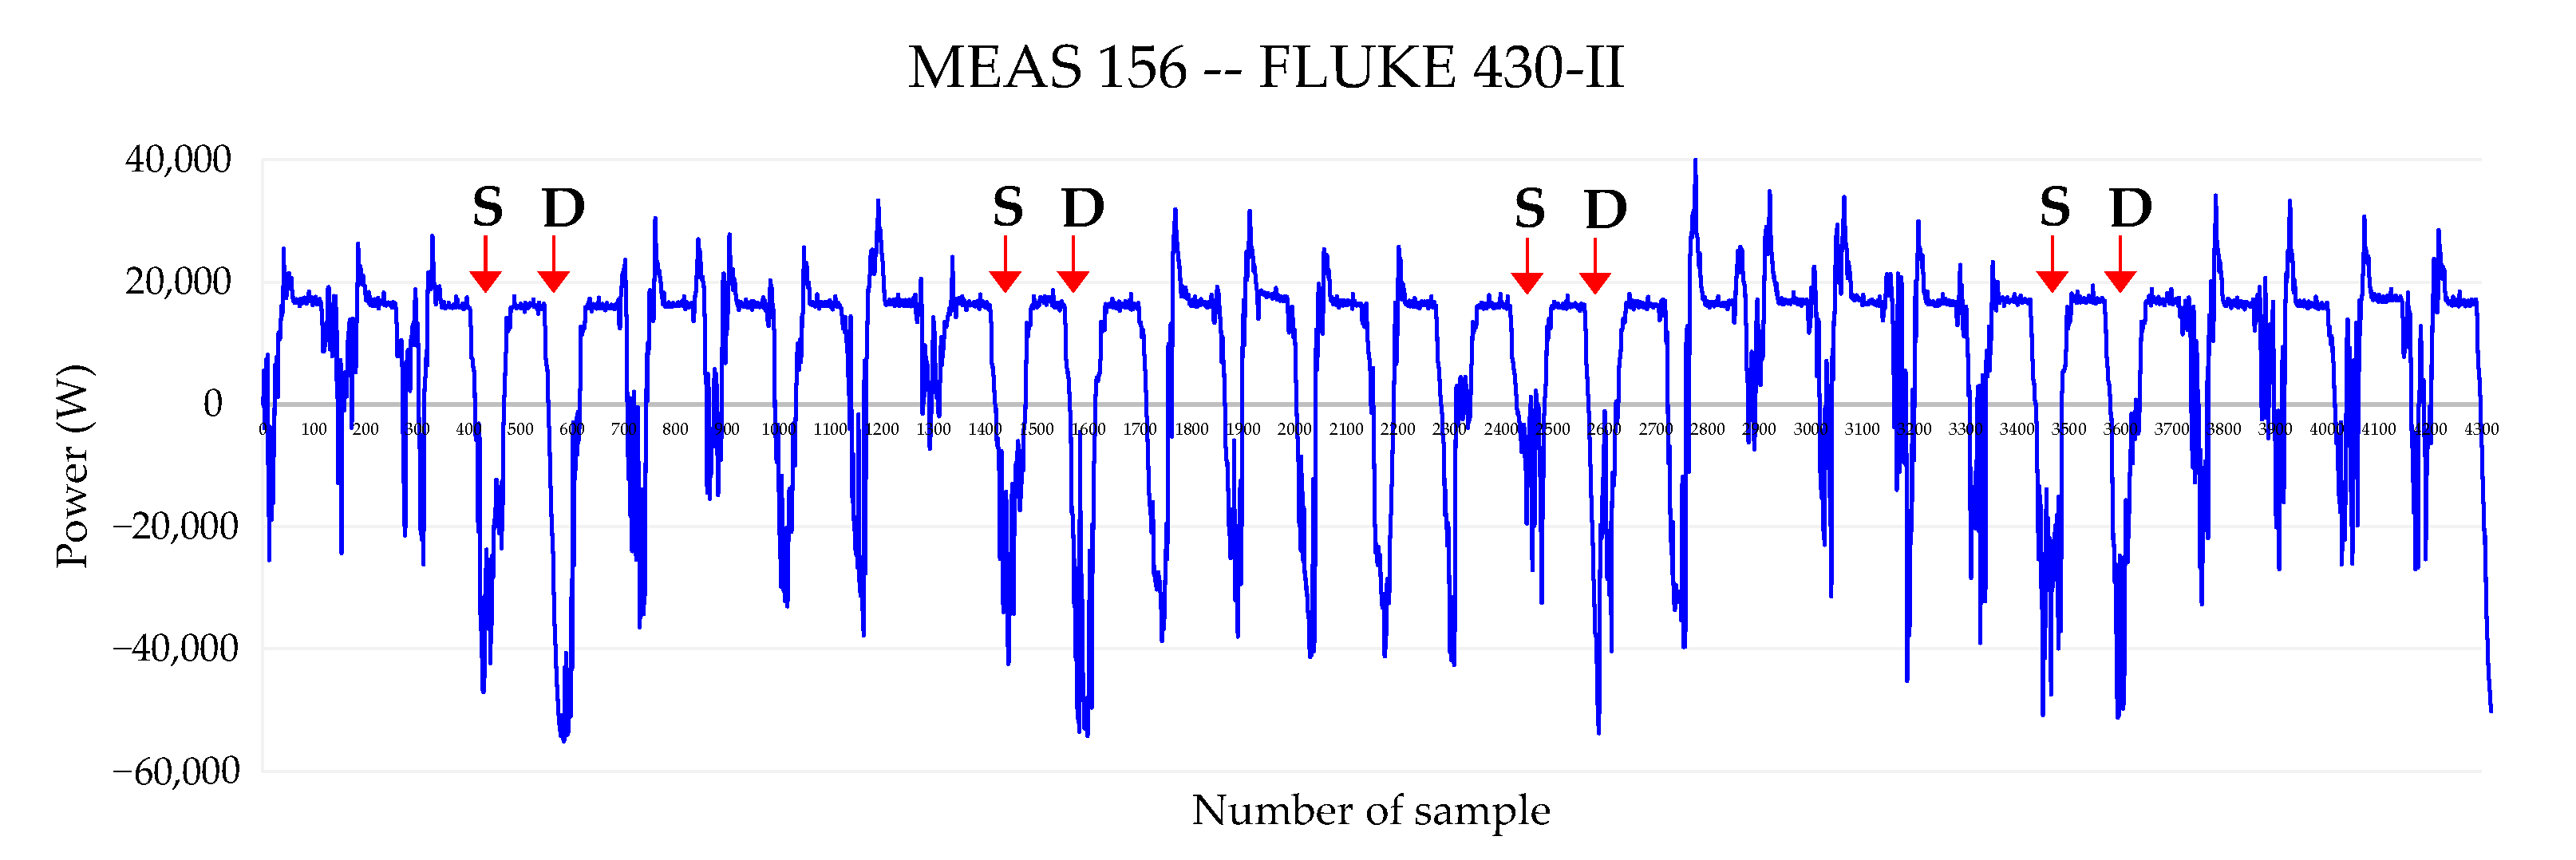
4.3.5. Power Quality Assessment at the Grid Connection Point
4.3.6. Comparison with a Nearby PV Installation
4.3.7. Financial Analysis
5. Discussion
Implications for Energy Subsidy Reform in Ecuador
- Redesigning Subsidies with Institutional Self-Generation in Mind: The current uniform subsidy scheme discourages investment in PV systems, even in public buildings where solar availability, consumption patterns, and infrastructure compatibility are favorable. Replacing flat-rate subsidies with performance-based incentives—such as verifiable energy offset credits—could align public sector investments with national energy goals while improving transparency in electricity spending.
- Creating Budget-Neutral Mechanisms: Institutional incentives do not necessarily require increased fiscal expenditure. As demonstrated in studies such as Schaffitzel et al. (2020) [37], part of the savings achieved through targeted subsidy reduction can be redirected toward self-generation programs in sectors with high social returns, including education and healthcare. These programs could operate through competitive funds, rebates, or long-term procurement contracts with performance verification [37].
- Incorporating Avoided Infrastructure Costs into Fiscal Planning: Distributed generation reduces the need for expansion in transmission and distribution infrastructure, especially in urban areas with stable demand and aging grid components. Including these avoided costs in the financial assessment of public investments—as suggested by Camino-Mogro and Arias (2024)—can shift the cost–benefit balance in favor of photovoltaic projects, even when using conservative tariff assumptions [38].
- Transitioning to differentiated tariffs based on consumption and user type: Evidence indicates that generalized subsidies benefit higher-income users disproportionately. Implementing tiered tariffs, where public institutions with generation capacity are assigned real-cost or near-cost rates, could encourage the more efficient use of electricity budgets and accelerate the adoption of PV systems. In this context, compensation schemes such as net billing or time-based feed-in payments—evaluated in the residential sector by Benalcázar et al. (2025)—could be adapted for institutional users, balancing cost recovery with fair access and fiscal neutrality [39].
- Ensuring administrative simplicity and policy continuity: For these reforms to succeed, mechanisms must be easy to apply, stable across political cycles, and linked to transparent monitoring. In the case of the BIPV system studied here, even small-scale installations benefit from real-time monitoring, verified generation, and traceable billing—all of which can support a reliable framework for institutional incentives.
6. Conclusions
Author Contributions
Funding
Data Availability Statement
Acknowledgments
Conflicts of Interest
Abbreviations
| AC | Alternating Current; |
| ARCERNNR | Agencia de Regulación y Control de Energía y Recursos Naturales No Renovables; |
| BIPV | Building-Integrated Photovoltaic; |
| DC | Direct Current; |
| DPI | Departamento de Planificación Institucional (University of Cuenca); |
| EL | Electroluminescence; |
| ESS | Energy Storage System; |
| FAUC | Faculty of Architecture and Urbanism, University of Cuenca; |
| GWh | Gigawatt-hour; |
| IEC | International Electrotechnical Commission; |
| IEA | International Energy Agency; |
| IR | Infrared; |
| kVA | Kilovolt-Ampere; |
| kWh | Kilowatt-Hour; |
| kWp | Kilowatt-Peak; |
| MV | Medium Voltage; |
| NREL | National Renewable Energy Laboratory; |
| PV | Photovoltaic; |
| RMS | Root Mean Square; |
| SAM | System Advisor Model; |
| TDD | Total Demand Distortion; |
| THD | Total Harmonic Distortion; |
| UPS | Universidad Politécnica Salesiana; |
| USD | United States Dollar; |
| VRI | Vicerrectorado de Investigación (University of Cuenca); |
| Voltage Deviation; | |
| Wp | Watt-peak. |
References
- International Energy Agency. Developing a Global Energy Efficiency Workforce in the Buildings Sector. 2025. Available online: https://www.iea.org/reports/developing-a-global-energy-efficiency-workforce-in-the-buildings-sector (accessed on 11 February 2025).
- CENACE. National Energy Efficiency Plan of Ecuador. 2019. Available online: https://www.cenace.gob.ec/wp-content/uploads/downloads/2019/06/2.-PLANEE-version-ingles_compressed_compressed-1-1-5-16.pdf (accessed on 11 February 2025).
- Zalamea, E.; Barragán, A. Arquitectura, Sol y Energía; Imprenta Universidad de Cuenca: Cuenca, Ecuador, 2021. [Google Scholar]
- EMBER. Global Electricity Review 2024. Available online: https://ember-energy.org/app/uploads/2024/05/Report-Global-Electricity-Review-2024.pdf (accessed on 12 February 2025).
- Dávalos, D. Ecuador pagó USD 615.16 Millones a Colombia Por Compra de Electricidad Entre el 2023 y 2024. Mundial Medios. 2025. Available online: https://kchcomunicacion.com/2025/02/14/ecuador-pago-usd-61516-millones-a-colombia-por-electricidad-entre-el-2023-y-2024/ (accessed on 15 July 2025).
- Caldeira, M.J.V.; Ferraz, G.M.F.; dos Santos, I.F.S.; Tiago Filho, G.L.; Barros, R.M. Using solar energy for complementary energy generation and water level recovery in Brazilian hybrid hydroelectricity: An energy and economic study. Renew. Energy 2023, 218, 119287. [Google Scholar] [CrossRef]
- International Energy Agency. World Energy Employment 2024. Available online: https://www.iea.org/reports/world-energy-employment-2024 (accessed on 12 February 2025).
- Agencia de Regulación y Control de la Electricidad. Informe Técnico Económico para el Análisis y Determinación del Costo Total del Sector Eléctrico. 2025. Available online: https://arconel.gob.ec/wp-content/uploads/downloads/2024/12/2.-Informe-Nro.-INF-DTRET-2024-044_SAPG-2025.pdf (accessed on 10 July 2025).
- ARCONEL. Marco Normativo de la Generación Distribuida para el Autoabastecimiento de Consumidores Regulados de Energía Eléctrica. 2024. Available online: https://nmslaw.com.ec/wp-content/uploads/2024/10/2-Regulacion-Nro.-005-24-signed.pdf (accessed on 10 July 2025).
- ARCONEL. Resolución Nro. ARCONEL-042/18. Regulación Sobre Generación Distribuida para el Autoabastecimiento. 2018. Available online: https://www.gob.ec/sites/default/files/regulations/2024-12/Regulacion-005_24-Codificada-signed.pdf (accessed on 12 July 2025).
- ARCERNNR. Análisis y Determinación del Costo del Servicio Público de Energía Eléctrica 2023. 2024. Available online: https://arconel.gob.ec/wp-content/uploads/downloads/2024/07/INF-DRETSE-2023-042_Costos-SAPG-2024.pdf (accessed on 13 February 2025).
- Zalamea-León, E.; Astudillo-Flores, M.; Ochoa-Correa, D.; Barragán-Escandón, E.A. Incidence of non-working days on limiting photovoltaic potential on a building with day-hours high power consumption, without storage and grid injection. Energies Qual. J. 2024, 2, 66–71. [Google Scholar] [CrossRef]
- Barragán-Escandón, A. El Autoabastecimiento Energético en los países en vías de Desarrollo en el Marco del Metabolismo Urbano: Caso Cuenca, Ecuador. Tesis Académica. Ph.D. Thesis, Universidad de Jaén, Jaén, Spain, 2018. Available online: https://ruja.ujaen.es/items/cbb912a9-6615-411e-97df-d7aa51756e95 (accessed on 12 July 2025).
- Kourgiozou, V.; Commin, A.; Dowson, M.; Rovas, D.; Mumovic, D. Scalable pathways to net zero carbon in the UK higher education sector: A systematic review of smart energy systems in university campuses. Renew. Sustain. Energy Rev. 2021, 147, 111234. [Google Scholar] [CrossRef]
- López-Ochoa, L.M.; Bobadilla-Martínez, D.; Las-Heras-Casas, J.; López-González, L.M. Towards nearly zero-energy educational buildings with the implementation of the Energy Performance of Buildings Directive via energy rehabilitation in cold Mediterranean zones: The case of Spain. Energy Rep. 2019, 5, 1488–1508. [Google Scholar] [CrossRef]
- Abulibdeh, A. Towards zero-carbon, resilient, and community-integrated smart schools and campuses: A review. World Dev. Sustain. 2024, 5, 100193. [Google Scholar] [CrossRef]
- Şevik, S. Techno-economic evaluation of a grid-connected PV-trigeneration-hydrogen production hybrid system on a university campus. Int. J. Hydrogen Energy 2022, 47, 23935–23956. [Google Scholar] [CrossRef]
- Maity, R.; Shuhaimi, M.K.I.B.A.; Sudhakar, K.; Razak, A.A. Forestvoltaics, Floatovoltaics and Building Applied Photovoltaics (BAPV) Potential for a University Campus. Energy Eng. J. Assoc. Energy Eng. 2024, 121, 2331–2361. [Google Scholar] [CrossRef]
- Cai, Z.; Zhang, W.; Chen, J.; Su, P. Photovoltaic Integrated Shading Devices in the Retrofitting of Existing Buildings on Chinese Campuses Within a Regional Context. Buildings 2024, 14, 3577. [Google Scholar] [CrossRef]
- Thoy, E.J.W.; Go, Y.I. Enhancement and validation of building integrated PV system: 3D modelling, techno-economics and environmental assessment. Energy Built Environ. 2022, 3, 444–466. [Google Scholar] [CrossRef]
- Castrillón-Mendoza, R.; Manrique-Castillo, P.A.; Rey-Hernández, J.M.; Rey-Martínez, F.J.; González-Palomino, G. PV energy performance in a sustainable campus. Electronics 2020, 9, 1847. [Google Scholar] [CrossRef]
- Ting, D.T.S.; Afrouzi, H.N.; Siddique, M.B.M.; Hassan, A.; Ahmed, J. Modelling and Simulation of Building-Integrated Photovoltaics (BIPV) Installations in Swinburne University. In Recent Advances in Electrical and Electronic Engineering and Computer Science; Zakaria, Z., Emamian, S.S., Eds.; Springer: Singapore, 2022; pp. 39–46. [Google Scholar]
- Arnaout, M.A.; Go, Y.I.; Saqaff, A. Pilot study on building-integrated PV: Technical assessment and economic analysis. Int. J. Energy Res. 2020, 44, 9538–9559. [Google Scholar] [CrossRef]
- Diniz, A.S.A.C.; da Silva, G.M.; Nunes, R.E.A.; Santana, V.A.C.; Braga, D.S.; Maia, C.B. Evaluation of solar photovoltaics on university buildings: A case study toward campus sustainability. Sol. Compass 2024, 12, 100100. [Google Scholar] [CrossRef]
- Zalamea-León, E.; Ordoñez-Castro, A.; Barragán-Escandón, A.; Orellana-Alvear, B.; Hidalgo-Cordero, J.; Serrano-Guerrero, X. Photovoltaics for reaching Net-Zero Energy Standard in Educational buildings. Renew. Energy Power Qual. J. 2024, 22, 145–150. [Google Scholar] [CrossRef] [PubMed]
- Espinoza, J.L.; González, L.G.; Sempértegui, R. Micro Grid Laboratory as a Tool for Research on Non-Conventional Energy Sources in Ecuador. In Proceedings of the 2017 IEEE International Autumn Meeting on Power, Electronics and Computing (ROPEC), Ixtapa, Mexico, 8–10 November 2017; pp. 1–7. [Google Scholar] [CrossRef]
- Fluke Corporation. Fluke 430 Series II Three-Phase Power Quality and Energy Analyzers: Technical Data. 2022. Available online: https://www.fluke.com/en-us/product/electrical-testing/power-quality/430-series-ii (accessed on 10 July 2025).
- Dirección de Monitoreo de Eventos Adversos, G.d.E. SitRep1. Sismo Balao, Guayas. 2023. Available online: https://www.gestionderiesgos.gob.ec/wp-content/uploads/2023/04/SitRep-22-Sismo-Balao-Guayas-03042023_12h00.pdf (accessed on 12 July 2025).
- National Renewable Energy Laboratory. Modelo de Asesor de Sistemas (SAM). 2023. Available online: https://sam.nrel.gov (accessed on 10 July 2025).
- Ministerio de Educación del Ecuador. Estadística Educativa: Infraestructura Física de las Instituciones Educativas Fiscales. Volumen 5, Dirección Nacional de Análisis, Información y Evaluación Educativa. 2024. Available online: https://educacion.gob.ec/wp-content/uploads/downloads/2024/10/Estadistica-Educativa-Vol-5.pdf (accessed on 10 July 2025).
- Zalamea-León, E.; Astudillo-Flores, M.; Barragán-Escandón, A.; Peláez-Samaniego, M.R. Comparative capacities of residential solar thermal systems versus F-chart model predictions and economic potential in an equatorial-latitude country. Energy Rep. 2023, 9, 1576–1590. [Google Scholar] [CrossRef]
- Growatt. ShineServer User Manual. 2025. Available online: https://cdn.growatt.com/user_manual_file/ShineServer_user_manual_EN_V3.0.pdf (accessed on 1 March 2025).
- Skoplaki, E.; Palyvos, J.A. On the temperature dependence of photovoltaic module electrical performance: A review of efficiency/power correlations. Solar Energy 2009, 83, 614–624. [Google Scholar] [CrossRef]
- Growatt New Energy. Growatt SPH 4000TL3 BH-UP Hybrid Three-Phase Inverter. 2025. Available online: https://growatt.tech/es/product/growatt-sph-4000-tl3-bh-up-hybryd-3-phase-inverter/ (accessed on 12 July 2025).
- Growatt New Energy. ARK XH High Voltage Lithium Battery for Residential PV Systems. 2025. Available online: https://en.growatt.com/products/ark-xh-battery (accessed on 12 July 2025).
- Agencia de Regulación y Control de Energía y Recursos Naturales No Renovables (ARCERNNR). Codificación de la Regulación No. ARCERNNR 002/20: Código de Red para el Operador de Distribución. 2025. Available online: https://arconel.gob.ec/wp-content/uploads/downloads/2025/05/Anexo-003-2023-Codificacion-Regulacion-002-20_rev-DE-signed-1.pdf (accessed on 4 July 2025).
- Schaffitzel, F.; Jakob, M.; Steckel, J.C. Can government transfers make energy subsidy reform socially acceptable? A case study on Ecuador. Energy Policy 2020, 137, 111106. [Google Scholar] [CrossRef]
- Camino-Mogro, S.; Arias, T. Assessing the impact of electricity subsidies on electricity demand and fiscal burden in Ecuador. Energy Policy 2024, 184, 113983. [Google Scholar] [CrossRef]
- Benalcázar, P.; Ortega, P.; Carrión, D.; Procel, P. Prosumer policy options in developing countries: A comparative analysis of feed-in tariffs, net metering, and net billing for residential PV-battery systems. Energy Policy 2025, 185, 113997. [Google Scholar] [CrossRef]


| Monthly Power Bills (USD) | |||||||||||||
| Utility Account Code | Jan | Feb | Mar | Apr | May | Jun | Jul | Aug | Sep | Oct | Nov | Dec | Total |
| 2857694 | 1039 | 776 | 768 | 935 | 1032 | 1079 | 1147 | 630 | 787 | 952 | 961 | 934 | 11,041 |
| Average monthly bill (USD): 920.08 | |||||||||||||
| Monthly Power Consumption (kWh) | |||||||||||||
| Utility Account Code | Jan | Feb | Mar | Apr | May | Jun | Jul | Aug | Sep | Oct | Nov | Dec | Total |
| 2857694 | 12,763 | 9302 | 9875 | 12,172 | 12,415 | 13,043 | 13,777 | 7603 | 9554 | 11,489 | 11,654 | 11,308 | 134,954.6 |
| Average cost per kWh (USD): 0.0818 | |||||||||||||
| Metric | Billed Price Scenario | Real Cost Scenario |
|---|---|---|
| Annual energy (year 1) | 117,624 kWh | 117,624 kWh |
| Capacity factor (year 1) | 15.5% | 15.5% |
| Energy yield (year 1) | 1357 kWh/kW | 1357 kWh/kW |
| Performance ratio (year 1) | 0.81 | 0.81 |
| Levelized COE (nominal) | 6.98 USD/kWh | 6.98 USD/kWh |
| Levelized COE (real) | 5.64 USD/kWh | 5.64 USD/kWh |
| Electricity bill without system (year 1) | USD 11,154 | USD 24,029 |
| Electricity bill with system (year 1) | USD 1539 | USD 3255 |
| Net savings with system (year 1) | USD 9615 | USD 20,774 |
| Net present value | USD 17,551 | USD 165,227 |
| Simple payback period | 12.5 years | 5.5 years |
| Discounted payback period | 17.8 years | 6.3 years |
| Net capital cost | USD 115,150 | USD 115,150 |
| Equity | USD 115,150 | USD 115,150 |
| Debt | USD 0 | USD 0 |
| Month | Jun | Jul | Aug | Sep | Oct | Nov | Dec | Jan | Feb | Mar | Apr | May | Total |
|---|---|---|---|---|---|---|---|---|---|---|---|---|---|
| Energy (kWh) | 727.6 | 729.1 | 870.0 | 973.0 | 933.4 | 978.8 | 1036.1 | 942.4 | 839.6 | 900.2 | 750.3 | 751.8 | 10,432.3 |
| Inverter Serial Number | Orientation | Jan | Feb | Mar | Apr | May | Jun | Jul | Aug | Sep | Oct | Nov | Dec | Total (kWh) |
|---|---|---|---|---|---|---|---|---|---|---|---|---|---|---|
| EKDUCGXXXX (56.9 kWp, 50 kVA) | N/S/E/W | 7009.9 | 6317.3 | 6453.4 | 5694.7 | 5884.0 | 6010.2 | 5677.8 | 6793.3 | 5857.2 | 4496.1 | 6712.6 | 6720.7 | 73,627.3 |
| FPH2B1XXXX (2.3 kWp, 2 kVA) | W | 290.3 | 256.7 | 256.5 | 227.6 | 236.6 | 236.8 | 220.1 | 257.9 | 217.9 | 184.1 | 259.3 | 263.8 | 2907.6 |
| THG2BDXXXX (5.4 kWp, 5 kVA) | N | 625.7 | 583.8 | 610.5 | 550.0 | 581.1 | 606.7 | 564.1 | 681.3 | 560.6 | 404.4 | 592.6 | 594.7 | 6955.4 |
| YDDQD4XXXX (5.5 kWp, 5 kVA) | W | 658.8 | 592.7 | 599.1 | 534.4 | 558.7 | 575.7 | 538.7 | 615.6 | 521.5 | 417.5 | 620.3 | 627.5 | 6860.6 |
| ZMG3BMXXXX (5.5 kWp, 5 kVA hybrid) | E | 673.4 | 609.6 | 619.5 | 544.3 | 559.6 | 570.6 | 550.3 | 641.0 | 572.8 | 430.8 | 669.2 | 643.2 | 7084.2 |
| Monthly Total (kWh) | – | 9258 | 8360 | 8539 | 7551 | 7820 | 8000 | 7551 | 8989 | 7730 | 5933 | 8854 | 8850 | 97,435.1 |
| Month | 2019 (kWh) | 2024 (kWh) |
|---|---|---|
| January | 12,763.26 | 2399.04 |
| February | 9302.40 | 1380.06 |
| March | 9874.62 | 3855.60 |
| April | 12,171.66 | 4336.02 |
| May | 12,415.38 | 5351.94 |
| June | 13,042.74 | 4537.98 |
| July | 13,777.14 | 4920.48 |
| August | 7603.08 | 0.00 |
| September | 9553.86 | 2844.79 |
| October | 11,489.28 | 2844.78 |
| November | 11,653.50 | 0.00 |
| December | 11,307.72 | 0.00 |
| Annual Total | 134,954.64 | 34,494.69 |
| Parameter | Phase A | Phase B | Phase C |
|---|---|---|---|
| [%] | 4.20 | 3.80 | 3.19 |
| THD [%] | 0.94 | 1.00 | 1.03 |
| TDD [%] | 2.47 | 3.37 | 4.49 |
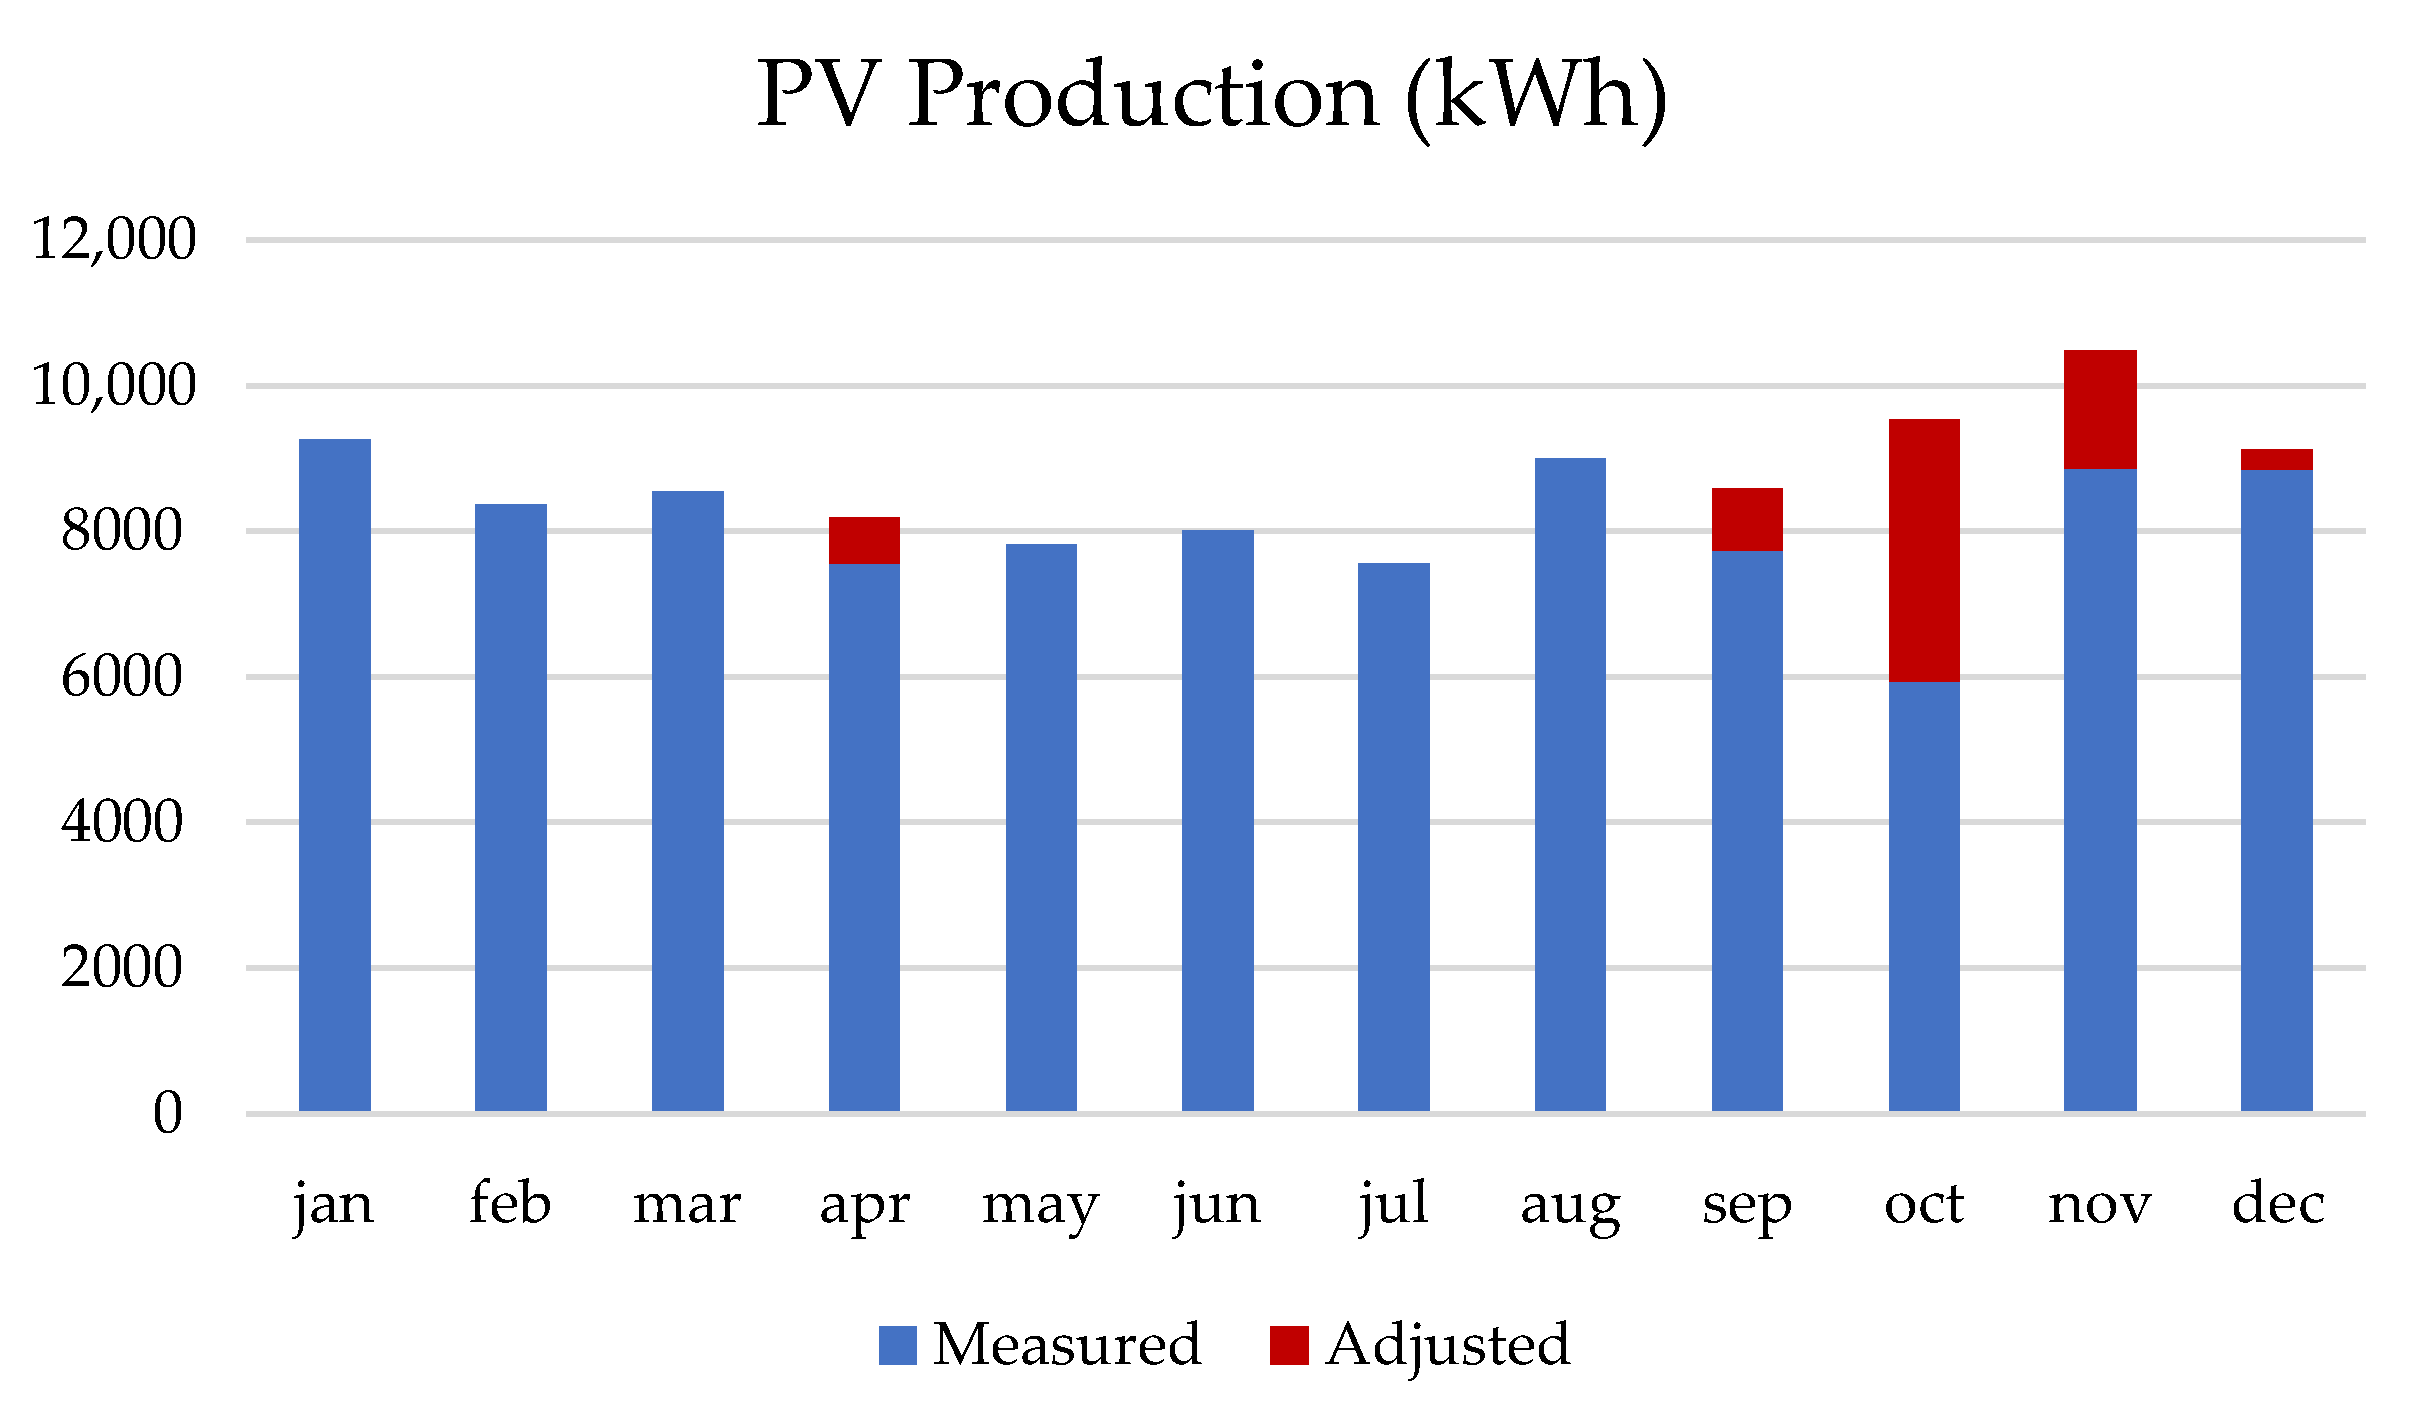
| Month | Adjusted Energy (kWh) | Std. Dev. (kWh) | Variance (kWh2) |
|---|---|---|---|
| January | 9258 | 20.78 | 431.95 |
| February | 8360 | 18.91 | 357.41 |
| March | 8539 | 19.94 | 397.58 |
| April | 8190 | 19.84 | 393.53 |
| May | 7820 | 20.83 | 433.92 |
| June | 8000 | 20.18 | 407.27 |
| July | 7551 | 21.46 | 460.69 |
| August | 8989 | 22.89 | 523.98 |
| September | 8586 | 23.57 | 555.71 |
| October | 9538 | 21.46 | 460.63 |
| November | 10,494 | 21.40 | 457.81 |
| December | 9127 | 20.47 | 418.87 |
| Total | 104,452 | – | – |
| Scenario | Annual Expense 2019 (USD) | Annual Expense 2024 (USD) | Payback Period (Years) |
|---|---|---|---|
| At USD 0.065/kWh | 8772.05 | 2242.15 | 15.3 |
| At USD 0.0818/kWh | 11,039.29 | 2821.67 | 12.1 |
| At USD 0.1559/kWh | 21,039.43 | 5377.72 | 6.4 |
Disclaimer/Publisher’s Note: The statements, opinions and data contained in all publications are solely those of the individual author(s) and contributor(s) and not of MDPI and/or the editor(s). MDPI and/or the editor(s) disclaim responsibility for any injury to people or property resulting from any ideas, methods, instructions or products referred to in the content. |
© 2025 by the authors. Licensee MDPI, Basel, Switzerland. This article is an open access article distributed under the terms and conditions of the Creative Commons Attribution (CC BY) license (https://creativecommons.org/licenses/by/4.0/).
Share and Cite
Zalamea-León, E.; Ochoa-Correa, D.; Sánchez-Castillo, H.; Astudillo-Flores, M.; Barragán-Escandón, E.A.; Ordoñez-Castro, A. Expectations Versus Reality: Economic Performance of a Building-Integrated Photovoltaic System in the Andean Ecuadorian Context. Buildings 2025, 15, 2493. https://doi.org/10.3390/buildings15142493
Zalamea-León E, Ochoa-Correa D, Sánchez-Castillo H, Astudillo-Flores M, Barragán-Escandón EA, Ordoñez-Castro A. Expectations Versus Reality: Economic Performance of a Building-Integrated Photovoltaic System in the Andean Ecuadorian Context. Buildings. 2025; 15(14):2493. https://doi.org/10.3390/buildings15142493
Chicago/Turabian StyleZalamea-León, Esteban, Danny Ochoa-Correa, Hernan Sánchez-Castillo, Mateo Astudillo-Flores, Edgar A. Barragán-Escandón, and Alfredo Ordoñez-Castro. 2025. "Expectations Versus Reality: Economic Performance of a Building-Integrated Photovoltaic System in the Andean Ecuadorian Context" Buildings 15, no. 14: 2493. https://doi.org/10.3390/buildings15142493
APA StyleZalamea-León, E., Ochoa-Correa, D., Sánchez-Castillo, H., Astudillo-Flores, M., Barragán-Escandón, E. A., & Ordoñez-Castro, A. (2025). Expectations Versus Reality: Economic Performance of a Building-Integrated Photovoltaic System in the Andean Ecuadorian Context. Buildings, 15(14), 2493. https://doi.org/10.3390/buildings15142493