Article

Effects of Aggregate-to-Binder Ratio on Mechanical Performance of Engineered Geopolymer Composites with Recycled Rubber Aggregates

1
School of Civil and Transportation Engineering, Guangdong University of Technology, Guangzhou 510006, China
2
Guangzhou Building Materials Institute Limited Company, Guangzhou 510663, China
*
Authors to whom correspondence should be addressed.
Buildings 2025, 15(14), 2496; https://doi.org/10.3390/buildings15142496
Submission received: 16 June 2025 / Revised: 13 July 2025 / Accepted: 14 July 2025 / Published: 16 July 2025
(This article belongs to the Special Issue Next-Gen Cementitious Composites for Sustainable Construction)

Abstract

This study investigates the development of a fully rubberized fine-aggregate engineered geopolymer composite (R-EGC) by replacing quartz sand with waste rubber particles (RPs). The influence of the rubber aggregate-to-binder mass ratio (A/B) on the performance of the R-EGC was systematically examined from both macroscopic and microscopic perspectives. Quantitative analysis of crack width and number was conducted using binarized image-processing techniques to elucidate the crack propagation patterns. Moreover, scanning electron microscopy (SEM) and energy-dispersive spectroscopy (EDS) were employed to analyze the interfacial transition zone (ITZ) between the rubber aggregates and the geopolymer matrix under varying A/B ratios, aiming to explore the underlying failure mechanisms of the R-EGC. The research results indicated that the flowability of the R-EGC decreased gradually with increasing A/B ratio. The flowability of R-0.1 was 73.5%, outperforming R-0.2 and R-0.3 (66% and 65%, respectively). R-0.1 achieved the highest compressive strength of 35.3 MPa (compared to 31.2 MPa and 28.4 MPa for R-0.2 and R-0.3, respectively). R-0.3 demonstrated the most effective crack-control capability, with a tensile strength of 3.96 MPa (representing increases of 11.9% and 3.7% compared to R-0.1 and R-0.2, respectively) and the smallest crack width of 104 μm (indicating reductions of 20.6% and 43.5% compared to R-0.1 and R-0.2, respectively). R-0.2 exhibited the best ductility, with an ultimate tensile strain of 8.33%. Microstructural tests revealed that the interfacial transition zone (ITZ) widths for R-0.1, R-0.2, and R-0.3 were 2.47 μm, 4.53 μm, and 1.09 μm, respectively. An appropriate increase in the ITZ width was found to be beneficial for enhancing tensile ductility, but it compromised the crack-control ability of the R-EGC, thereby reducing its durability. Overall, this study clarifies the fundamental influence of the A/B ratio on the mechanical performance of the R-EGC. The findings provide valuable insights for future research in this field.

1. Introduction

As the most widely used construction material [1,2,3], concrete exhibits high compressive strength but extremely low tensile strength—typically only about 0.01%. To address this limitation, researchers in the 1990s developed engineered cementitious composites (ECCs), a class of fiber-reinforced cement-based composite characterized by strain-hardening behavior and multiple microcracking [4,5,6,7]. Owing to their exceptional tensile-ductility and crack-control capabilities, ECCs can effectively resist the ingress of external aggressive ions such as chloride (Cl) and sulfate (SO42−), thereby significantly improving the brittleness and limited durability of conventional concrete [8,9,10]. This advancement offers a promising pathway toward more durable and sustainable construction materials. However, the large-scale production of conventional ECCs requires substantial amounts of Portland cement, resulting in considerable CO2 emissions. This is environmentally unfriendly and may further aggravate the challenges faced by urban environments [11,12,13,14].
To address the aforementioned challenges, researchers have developed strain-hardening geopolymer composites (EGCs). EGCs utilize industrial by-products such as fly ash (FA) and ground granulated blast-furnace slag (GGBS) as alternative binders to replace Portland cement, thereby reducing carbon emissions while retaining excellent mechanical performance and enhancing environmental sustainability [11]. For example, Hui et al. [15] reported that EGCs demonstrate higher sustainability than ECCs, with a carbon footprint approximately 13–50% lower. Additionally, the study by Nguyễn et al. [16] showed that EGCs can achieve a maximum tensile strain of up to 13.7%, indicating outstanding toughness. A review by Zhong et al. further revealed that approximately 64% of existing EGCs exhibit greater tensile strain (exceeding 2.49%) and around 27% demonstrate higher tensile strength (exceeding 4.86 MPa) compared to traditional ECCs.
With the rapid growth of the global population, the demand for automobiles has surged, leading to a significant increase in tire production [17,18]. It is estimated that approximately one billion waste tires are generated worldwide each year [18,19]. Currently, waste tires are predominantly disposed of through open-air stockpiling or incineration. However, open dumping creates breeding grounds for mosquitoes, while centralized incineration emits large quantities of toxic gases [20,21]. Therefore, there is an urgent need for sustainable strategies to recycle waste tires as valuable resources. Simultaneously, the depletion of natural river sand has posed a serious challenge to the fine-aggregate supply for conventional EGC production. Against this backdrop, researchers have begun exploring the feasibility of crushing waste tires into rubber particles (RPs) to partially replace natural sand in the production of strain-hardening composites. Mohammed et al. [22] reported that the inclusion of RPs leads to a reduction in compressive strength. In contrast, Hisbani et al. [23] found that replacing 5–10% of river sand with RPs improves the durability of concrete. Mater et al. [24] emphasized that both the RP content and particle size significantly influence the compressive and tensile strengths of concrete. According to Ghone et al. [25], the synergistic interaction between RPs and reinforcing fibers can markedly enhance the toughness and ultimate load-bearing capacity of concrete. Chen et al. [26] further observed that the addition of rubber powder reduces the crack propagation rate in engineered high-strength concrete (E-HSC). Furthermore, numerous studies [27,28,29,30,31] have confirmed that incorporating RPs into conventional cement-based concrete can improve various properties, such as crack resistance, lightweight characteristics, and corrosion resistance [32,33,34,35,36]. In addition, rubberized concrete is suitable for structures that require high energy dissipation capacity under loading, such as the anchorage zones of bridge expansion joints, high-rise buildings, airports, and civil infrastructure [37].
Recent studies have explored the feasibility of using RPs as a full replacement for natural river sand in the production of strain-hardening alkali-activated composites. For example, Yang et al. [38] demonstrated that the incorporation of RPs has a positive effect on the workability of fresh EGC mixtures, which helps improve the processability of EGCs and the dispersion of the fibers within the matrix. In addition, when the RP-to-binder mass ratio increases from 0 to 0.05 (the saturation point), the compressive strength decreases by approximately 6.14%, while the tensile strength, first-crack strength, and ultimate tensile strain increase by about 8.1%, 8.6%, and 4.5%, respectively. However, as the RP-to-binder mass ratio further increases from 0.05 to 0.2, the compressive strength decreases by 25.5%, the tensile strength drops by approximately 15.2%, the first-crack strength declines by about 19.6%, and the ultimate tensile strain is reduced by around 14.3%. In addition, Hou et al. [39] conducted experimental investigations on the crack-width control performance of crumb rubber particles. Their results indicated that strain-hardening cementitious composites (SHCCs) fully incorporating RPs as fine aggregate exhibited a 68.3% reduction in the average crack width compared to the 0% RP control group, albeit at the cost of a 33.4% decrease in compressive strength. This phenomenon can be attributed to a dual mechanism: on the one hand, the introduction of RPs acts as initial flaws within the matrix, reducing its inherent toughness; on the other hand, the bridging effect of rubber particles effectively mitigates crack propagation. While substantial research exists on the effects of incorporating RPs on the performance of pseudo-strain-hardening composites, investigations into the complete replacement of natural river sand with RPs for producing EGCs have not been conducted.
The main objective of this study is to investigate the effects of different rubber particle-to-binder mass ratios (A/B = 0.1, 0.2, and 0.3) on the fundamental mechanical and microstructural properties of a fully rubberized fine-aggregate geopolymer-based strain-hardening composite (R-EGC), including workability, axial tensile behavior, axial compressive behavior, and the width of the interfacial transition zone (ITZ) between the aggregate and matrix. The axial tensile and compressive performance of the R-EGC under different A/B ratios was analyzed, and a material cost analysis of R-EGCs with varying A/B ratios was also conducted.

2. Experimental Program

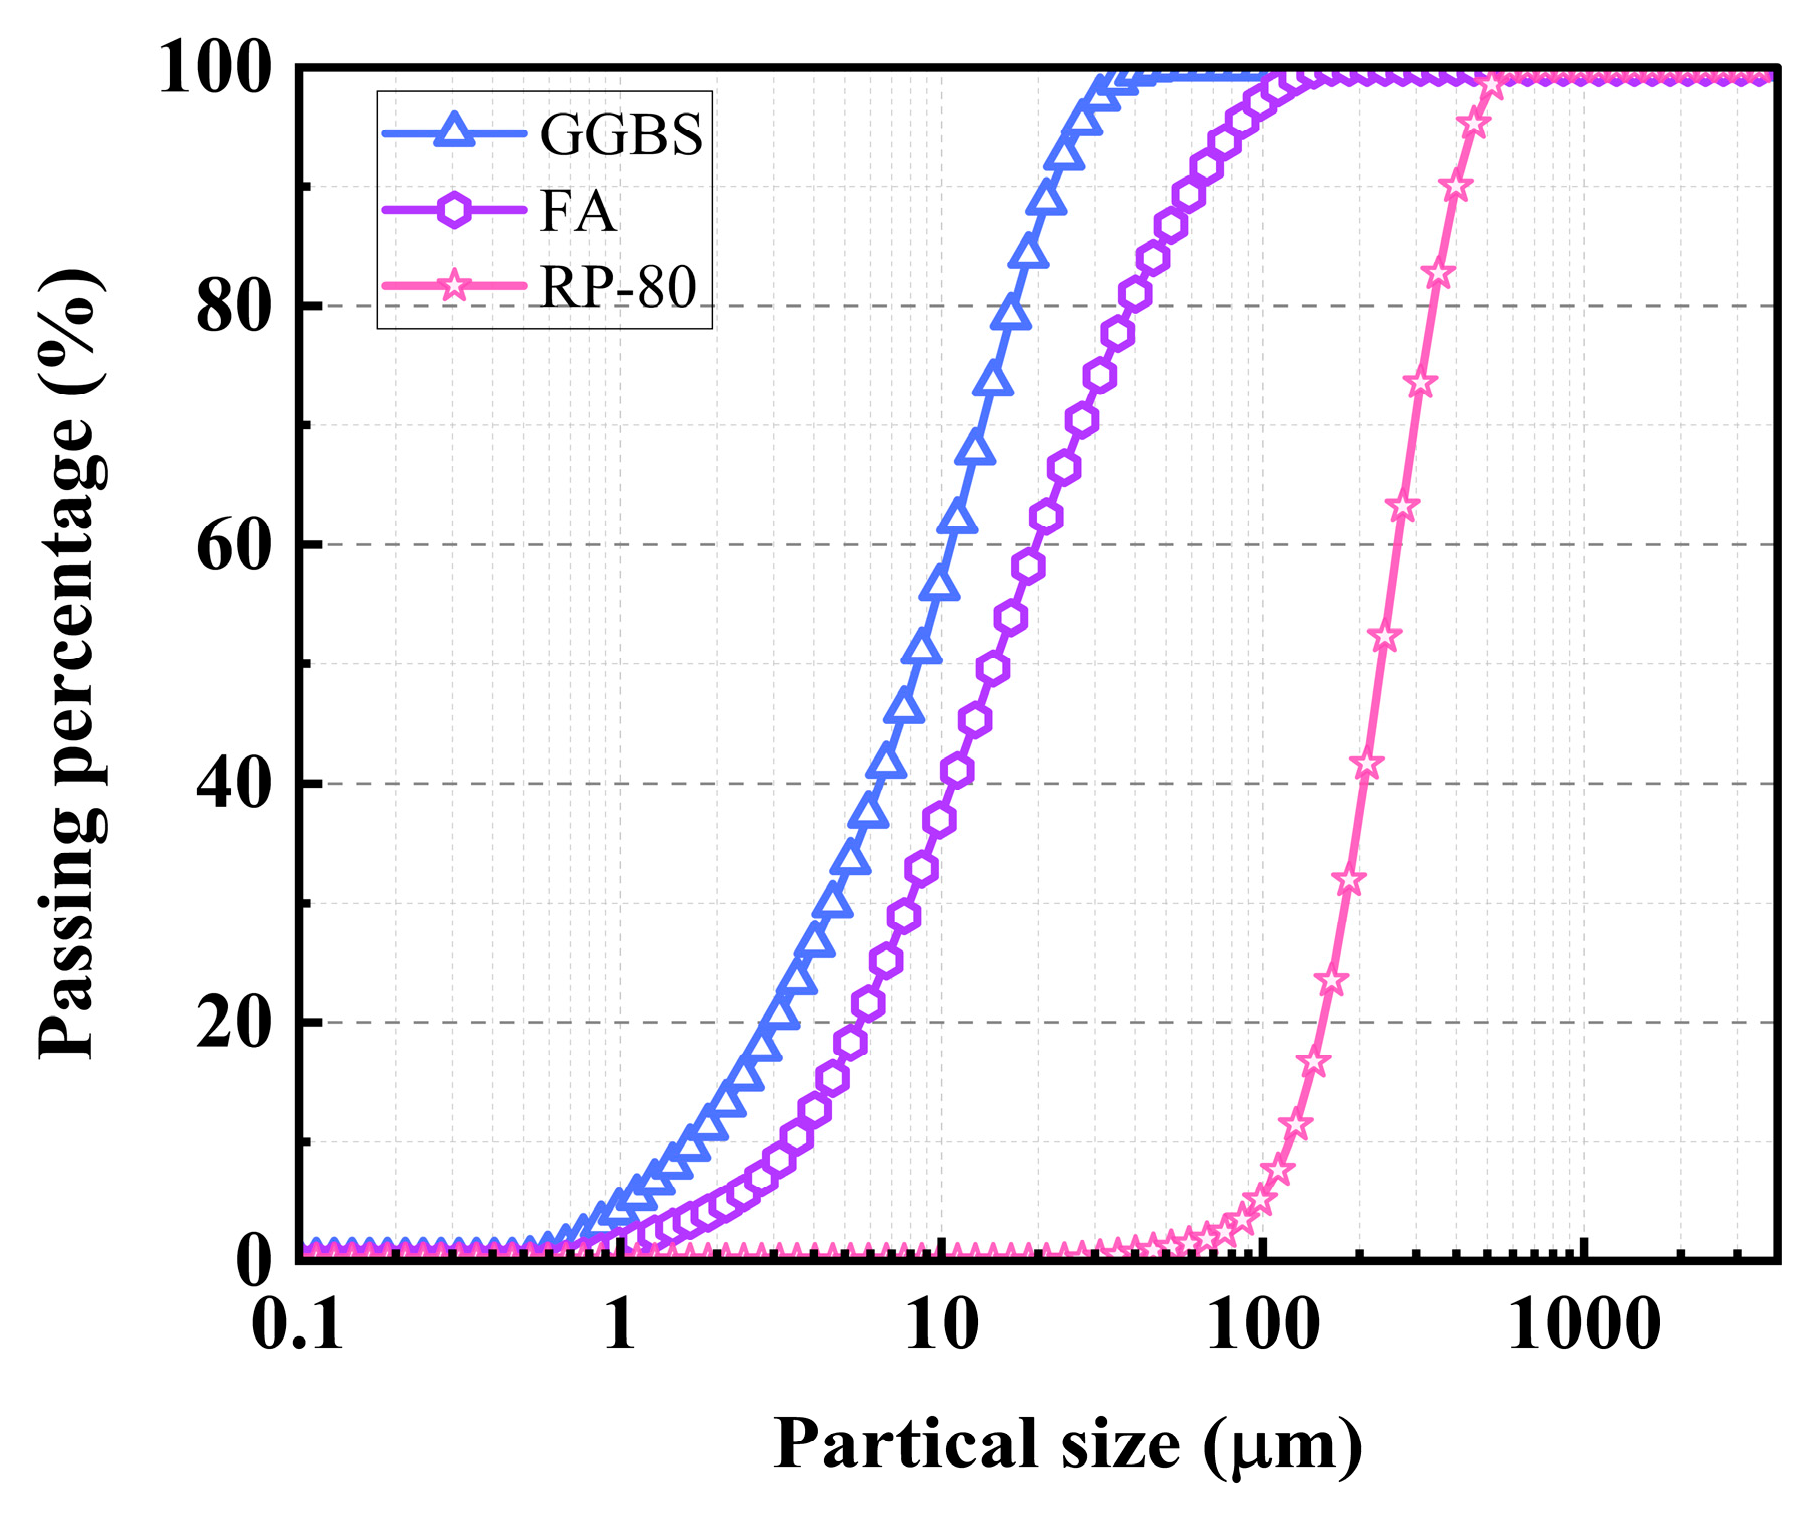
2.1. Materials and Mix Proportions

The raw materials used in this study include Class F FA, S105-GGBS, RPs, water, alkali activators, a set retarder, and polyethylene (PE) fibers. The microstructures of these materials, captured via scanning electron microscopy, are shown in Figure 1. The alkali activator employed in this study was prepared by mixing two solutions in a mass ratio of 1:2, namely a 10 mol/L sodium hydroxide (NaOH) solution and a sodium silicate (Na2SiO3) solution with a silica modulus of 2.25. The sodium hydroxide (NaOH) solution was prepared by dissolving NaOH solid with a purity of no less than 96% in water, with the NaOH solid accounting for 30.2% of the total solution mass and water accounting for 69.8%. The sodium silicate solution contained 13.75% Na2O, 29.99% SiO2, and 56.26% H2O by mass. The set retarder used was barium chloride dihydrate (BaCl2·2H2O) with a purity of no less than 99.5%. It reacts with the sodium silicate solution to form a protective film that effectively prevents direct contact between the GGBS and the sodium silicate solution, thereby delaying the setting process [40]. The retardation mechanism primarily relies on the reaction between BaCl2 and sodium silicate, which forms a protective film on the particle surfaces. This film inhibits direct contact between sodium silicate and slag particles, thereby delaying the reaction and achieving the desired setting control. The median particle sizes (D50) of the GGBS and FA were 53.80 μm and 15.44 μm, respectively. Their chemical compositions and physical properties are listed in Table 1 and Table 2. The average particle size of the RPs was approximately 180 μm, with a density of 1.13 g/cm3 and a low elastic modulus of 7 GPa. The particle-size distribution of each powder material was measured using a laser particle-size analyzer, and the results are shown in Figure 2. The physical and mechanical properties of the PE fibers are summarized in Table 3.

2.2. Mix Proportions

The experimental design consisted of three mix-proportion schemes with varying rubber particle-to-binder mass ratios (A/B), as shown in Table 4. The dosage of PE fibers was fixed at 1.5% of the total concrete volume in all mixtures. Based on the methodology proposed in [6,38,41,42,43,44,45,46,47], the EGC mix proportions were further optimized in this study to ensure uniform dispersion of the fibers within the matrices while maintaining desirable workability of the fresh pastes.

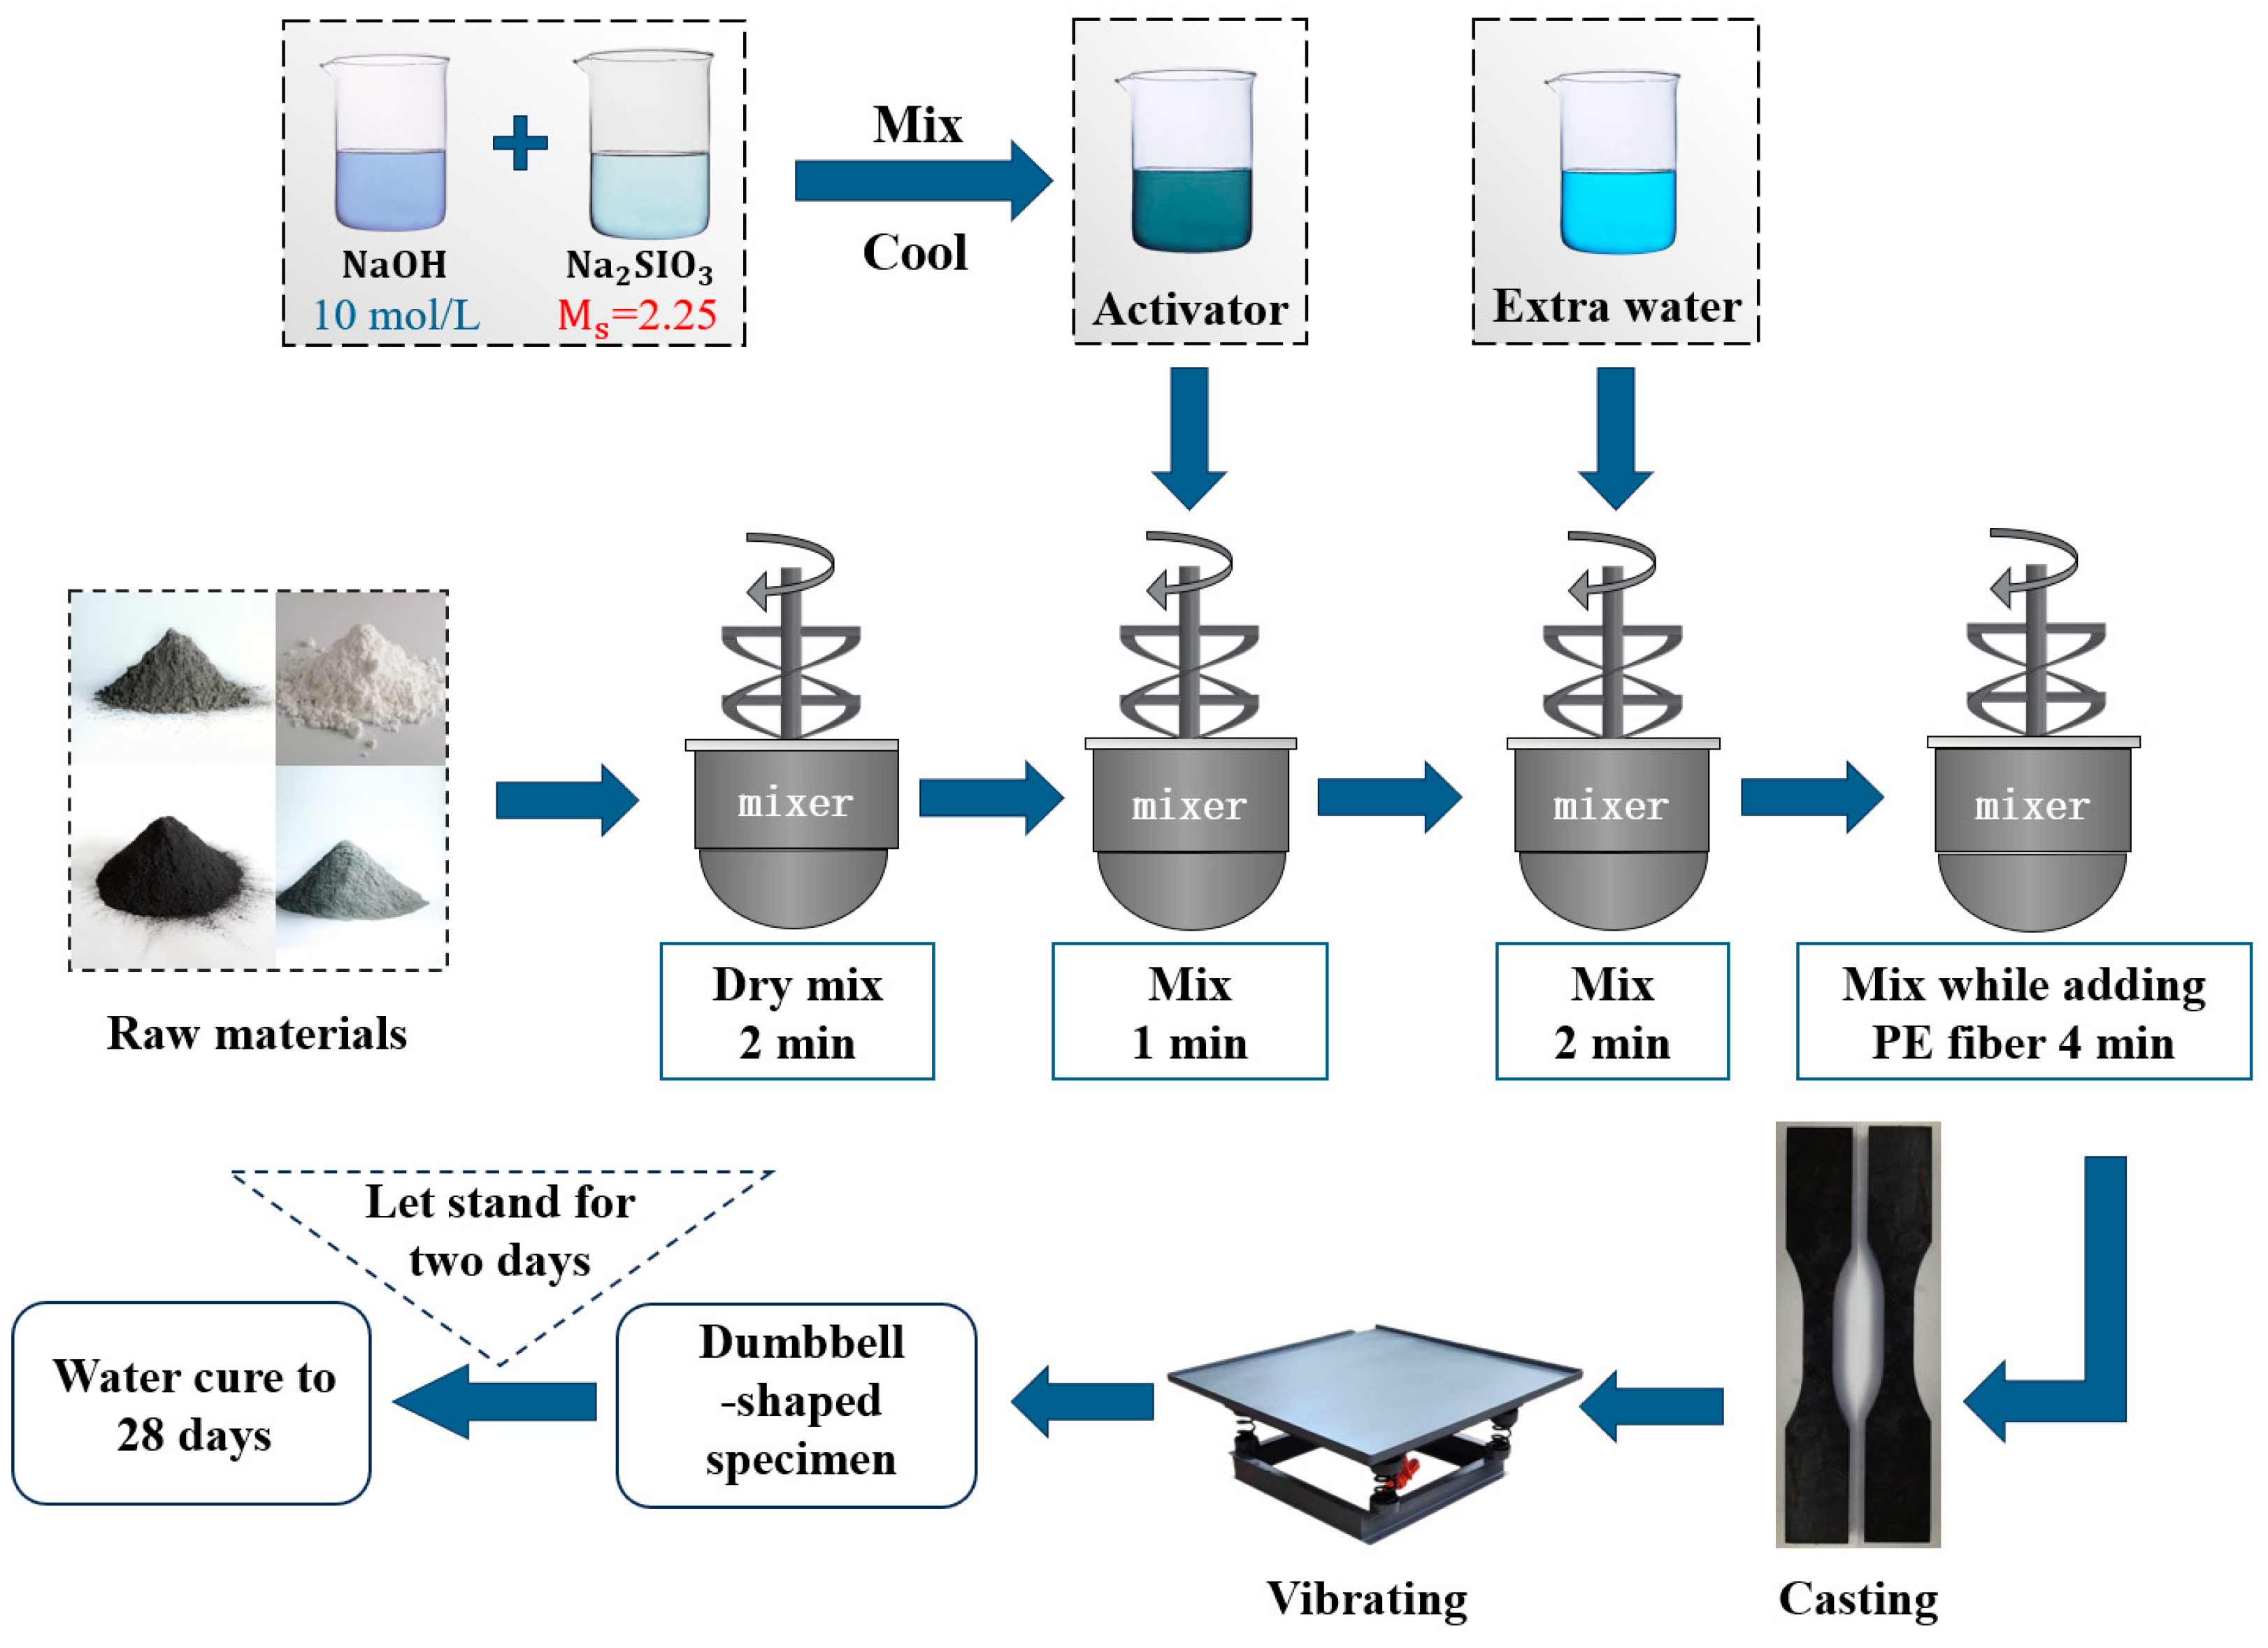
2.3. Preparation Process of R-EGC Specimens

Figure 3 illustrates the standard dimensions of the specimens used in this study. The cylindrical specimens had dimensions of φ50 mm × 100 mm, while the dog-bone-shaped specimens measured 330 mm × 30 mm × 13 mm [48].
The detailed mixing procedure for the R-EGC specimens is illustrated in Figure 4. All specimens were prepared using a 30 L planetary mortar mixer equipped with three speed settings: low (75 rpm), medium (165 rpm), and high (285 rpm). First, FA, GGBS, RPs, and the set retarder were added to the mixing bowl and mixed at low speed for 2 min to ensure homogeneous distribution of the dry components. Subsequently, the pre-prepared alkali activator was gradually added over the course of 1 min while mixing continued, allowing thorough interaction between the activator and the dry mix. In the next step, the pre-measured water was introduced steadily over 2 min to form a consistent paste as the mixture absorbed the liquid. Finally, over a period of 4 min, pre-opened PE fibers were slowly added to the paste. The mixer speed was gradually increased from low to medium and then high, depending on the dispersion state of the fibers, to achieve uniform fiber distribution throughout the matrix. After mixing, a portion of the fresh paste was poured into the slump-flow test mold to assess workability, while the remainder was cast into cylindrical molds and dog-bone-shaped molds. The molds were compacted using a vibrating table to minimize entrapped air and ensure uniformity. Once casting was completed, the specimen surfaces were covered with plastic wrap to prevent moisture loss. After curing at room temperature for 24 h, specimens were demolded and transferred to a standard curing chamber maintained at 20 ± 2 °C and >95% relative humidity for 28 days. Following curing, axial compressive and axial tensile tests were conducted.

2.4. Test Setup

2.4.1. Flowability Test

As shown in Figure 5, the workability of the fresh paste in all groups was evaluated according to ASTM C1437-2013 [49]. The test was conducted using a truncated-cone mold with standard dimensions: a top diameter of 70 mm, a bottom diameter of 100 mm, and a height of 50 mm. The specific testing procedure was as follows: (1) The mold was placed at the center of the flow table, and its inner surface was lightly moistened. (2) Freshly mixed paste was poured into the mold and leveled with the top edge. (3) Immediately after lifting the mold vertically, the flow table was activated. (4) After 25 drops of the flow table, the test was stopped. (5) The two orthogonal diameters of the spread paste were measured using a caliper, and their average value was calculated to quantify flowability, as expressed by Equation (1):
F l o w = D 100   m m 100   m m × 100 %

2.4.2. Axial Compressive Test

As shown in Figure 6, the compressive tests for all specimen groups were conducted in accordance with ASTM C469-2022 [50]. The specific testing procedure was as follows: (1) Prior to testing, the top and bottom surfaces of the cylindrical specimens were leveled using a gypsum-capping technique. (2) Two strain gauges were affixed axially on the specimen surface with a spacing of 20 mm, and two linear variable differential transformers (LVDTs) were symmetrically installed along the axial direction to collect strain data. (3) The specimens were loaded using a servo-hydraulic testing machine at a constant displacement rate of 0.2 mm/min.

2.4.3. Axial Tensile Test

As shown in Figure 7, the axial tensile tests for all specimen groups were conducted in accordance with the standard of the Japan Society of Civil Engineers (JSCE) [51]. The detailed testing procedure was as follows: (1) To facilitate crack observation during testing, a thin layer of white paint was applied to a central 70 mm region of the dog-bone-shaped specimens prior to loading. (2) To avoid eccentric loading, universal joints were installed at both ends of the testing-machine grips. (3) To accurately measure axial deformation during loading, two displacement transducers with a gauge length of 25 mm were mounted within the central 75 mm region of the specimen. (4) The specimens were loaded using a universal testing machine at a constant displacement rate of 0.5 mm/min.

3. Results and Discussion

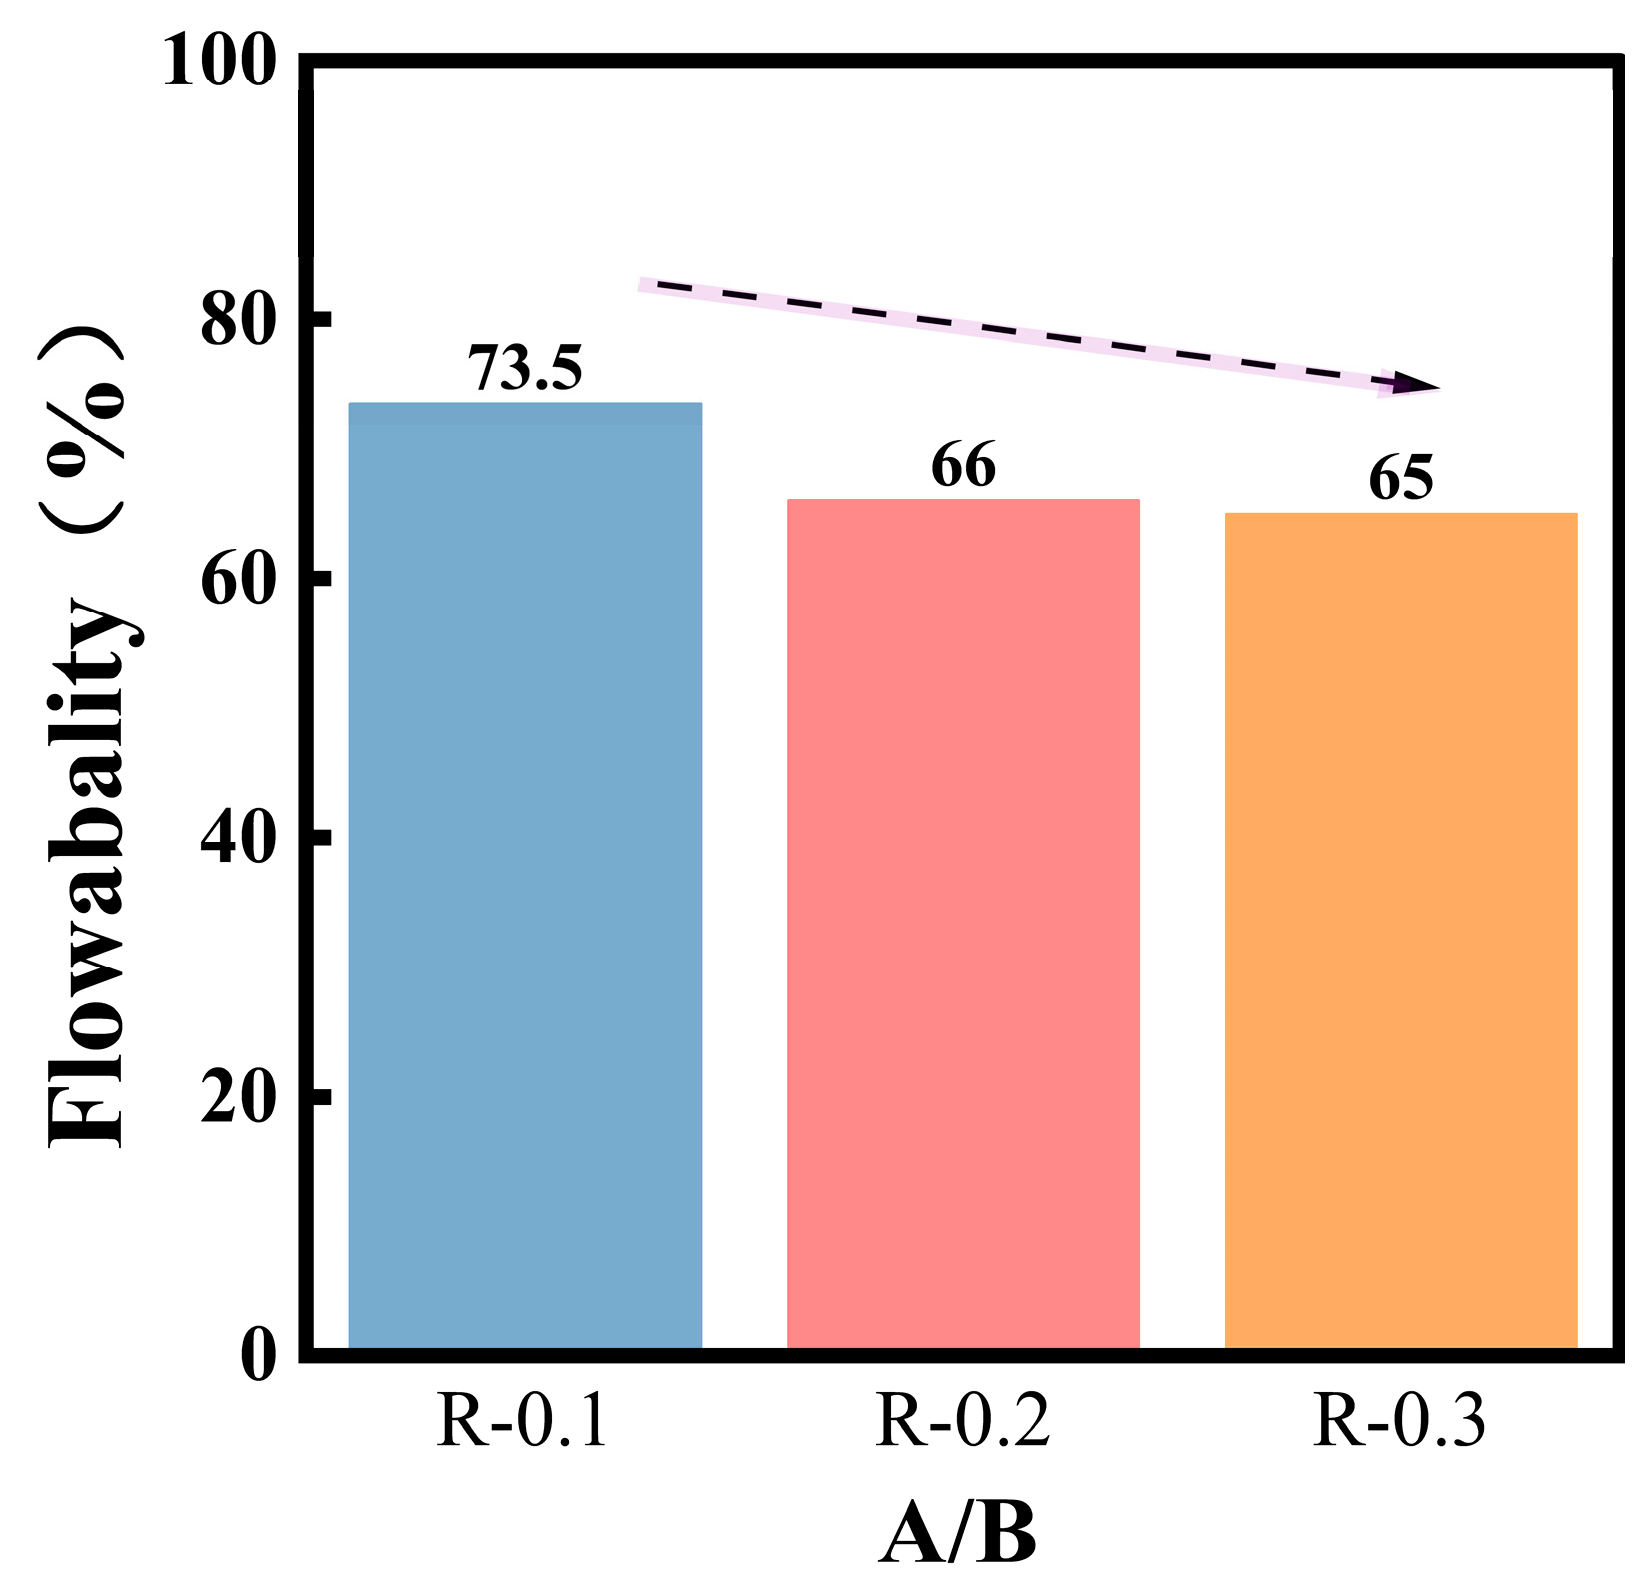
3.1. Flowability of the R-EGC Paste

The flowability of the fresh R-EGC paste and the dispersion of the fibers within the matrix significantly influenced the local fiber-volume content in specific interfacial regions, thereby affecting the hardened mechanical properties of the composite. Figure 8 presents the flowability results for all groups of fresh R-EGC paste. The degree of flowability directly affected the fiber dispersion within the matrix, which, in turn, governed the pseudo-strain-hardening behavior of the fiber-reinforced composite [52]. As shown in Figure 8, the flowability of R-0.1 was 73.5%, while those of R-0.2 and R-0.3 were 66% and 65%, respectively. A clear decreasing trend in flowability was observed with increasing A/B ratio. Specifically, as the A/B ratio increased from 0.1 to 0.3, the flowability decreased by 10.2% and 11.7%, respectively. This trend may be attributed to the reduction in air permeability of the R-EGC as the RP content increased, which elevated the level of discontinuous porosity and hindered the mobility of free water within the composite, thus reducing paste flowability [53]. Moreover, due to the irregular shape of the RPs and the increased interparticle friction, higher RP content may have led to particle interlocking, further diminishing the flowability of the fresh paste [54].
Therefore, using a lower RP content in the preparation of R-EGC is more favorable for enhancing the flowability of the mixture, improving workability and fiber dispersion, and ultimately strengthening the pseudo-strain-hardening behavior of the composite.

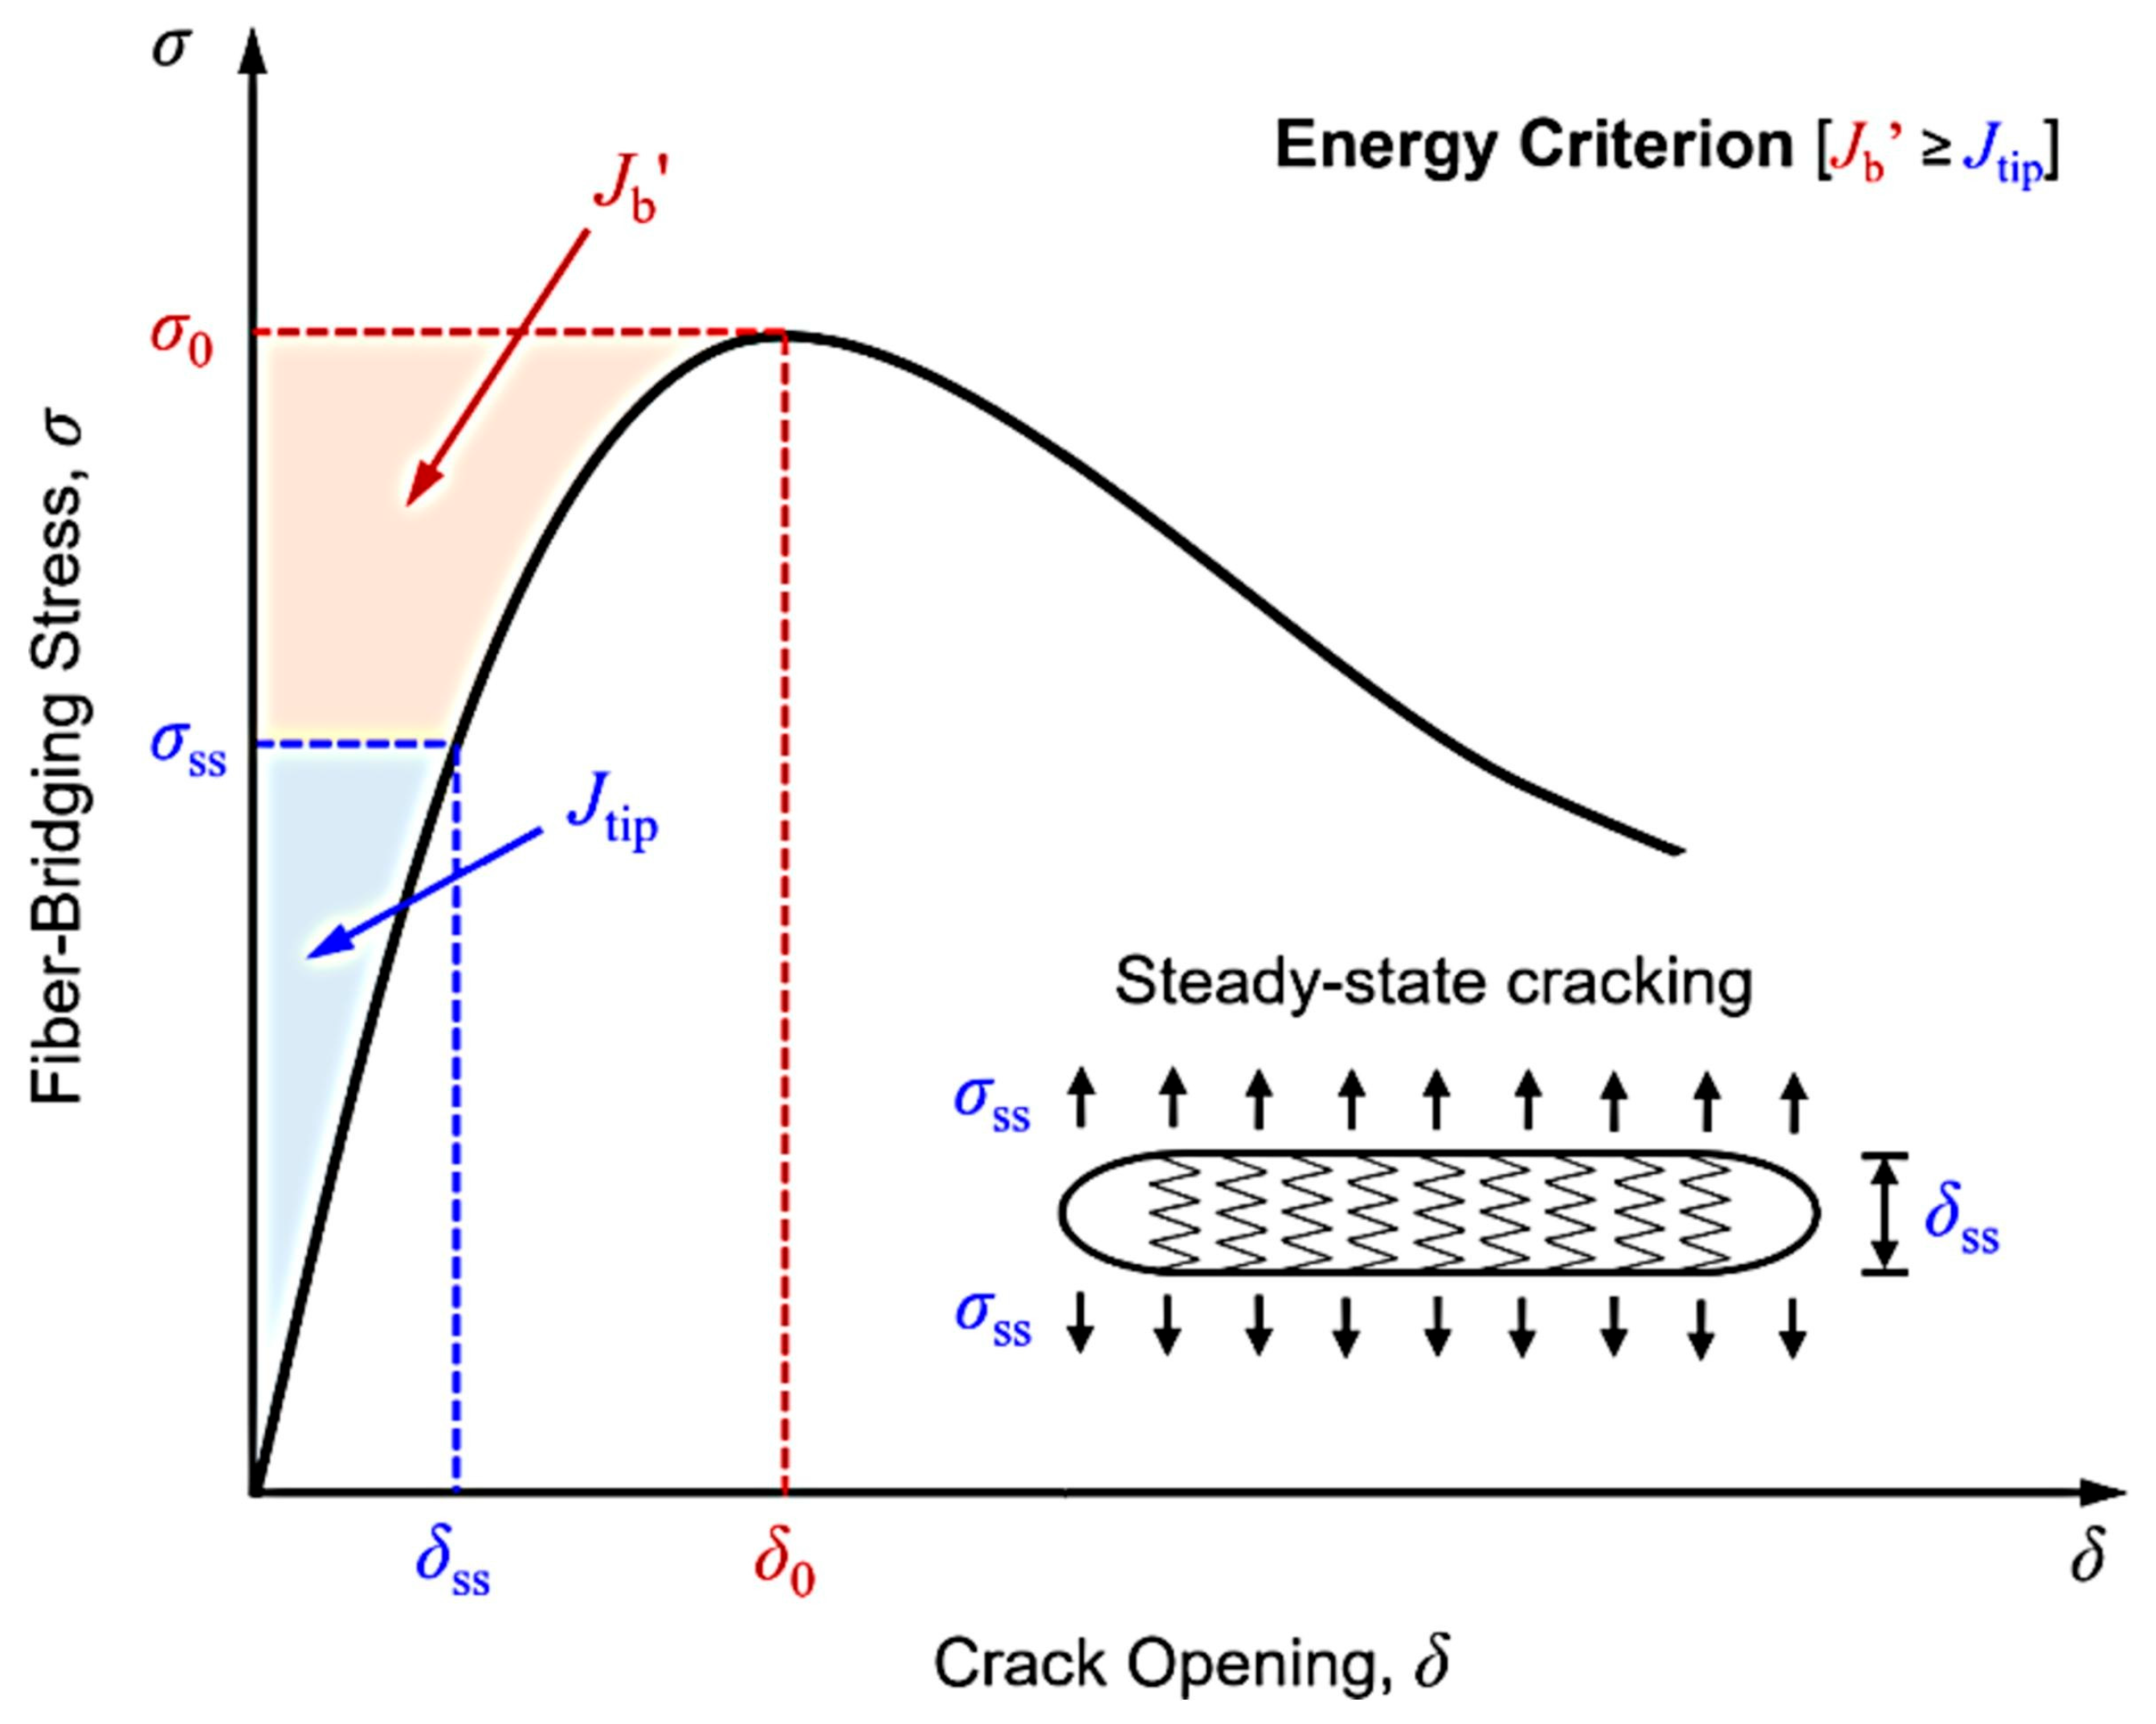
3.2. Micromechanical Design Principles of EGCs

The micromechanical design principles of ECCs provide a solid foundation for the development of an R-EGC. In ECCs, the desired macroscopic tensile strain-hardening behavior is achieved by tailoring the interactions between the fibers and the matrix at the microscale. This theoretical design framework is primarily based on two criteria: the strength criterion and the energy criterion.
The strength criterion requires that the matrix-cracking strength be lower than the maximum fiber-bridging strength:
σ c < σ 0
Here, σ c denotes the matrix-cracking strength, and σ 0 represents the maximum fiber-bridging strength.
The energy criterion requires that the crack-tip toughness be less than the complementary energy:
J t i p σ 0 δ 0 0 δ 0 σ   ( δ )   d δ = J b
J t i p = K m 2 / E c
Here, δ 0 corresponds to the crack-opening displacement associated with the maximum fiber-bridging strength σ 0 ; K m represents the fracture toughness of the matrix; and E c denotes the elastic modulus of the matrix.
The relationship between fiber bridging stress and crack opening displacement is shown in Figure 9.

3.3. Effect of A/B Ratio on Compression Behavior
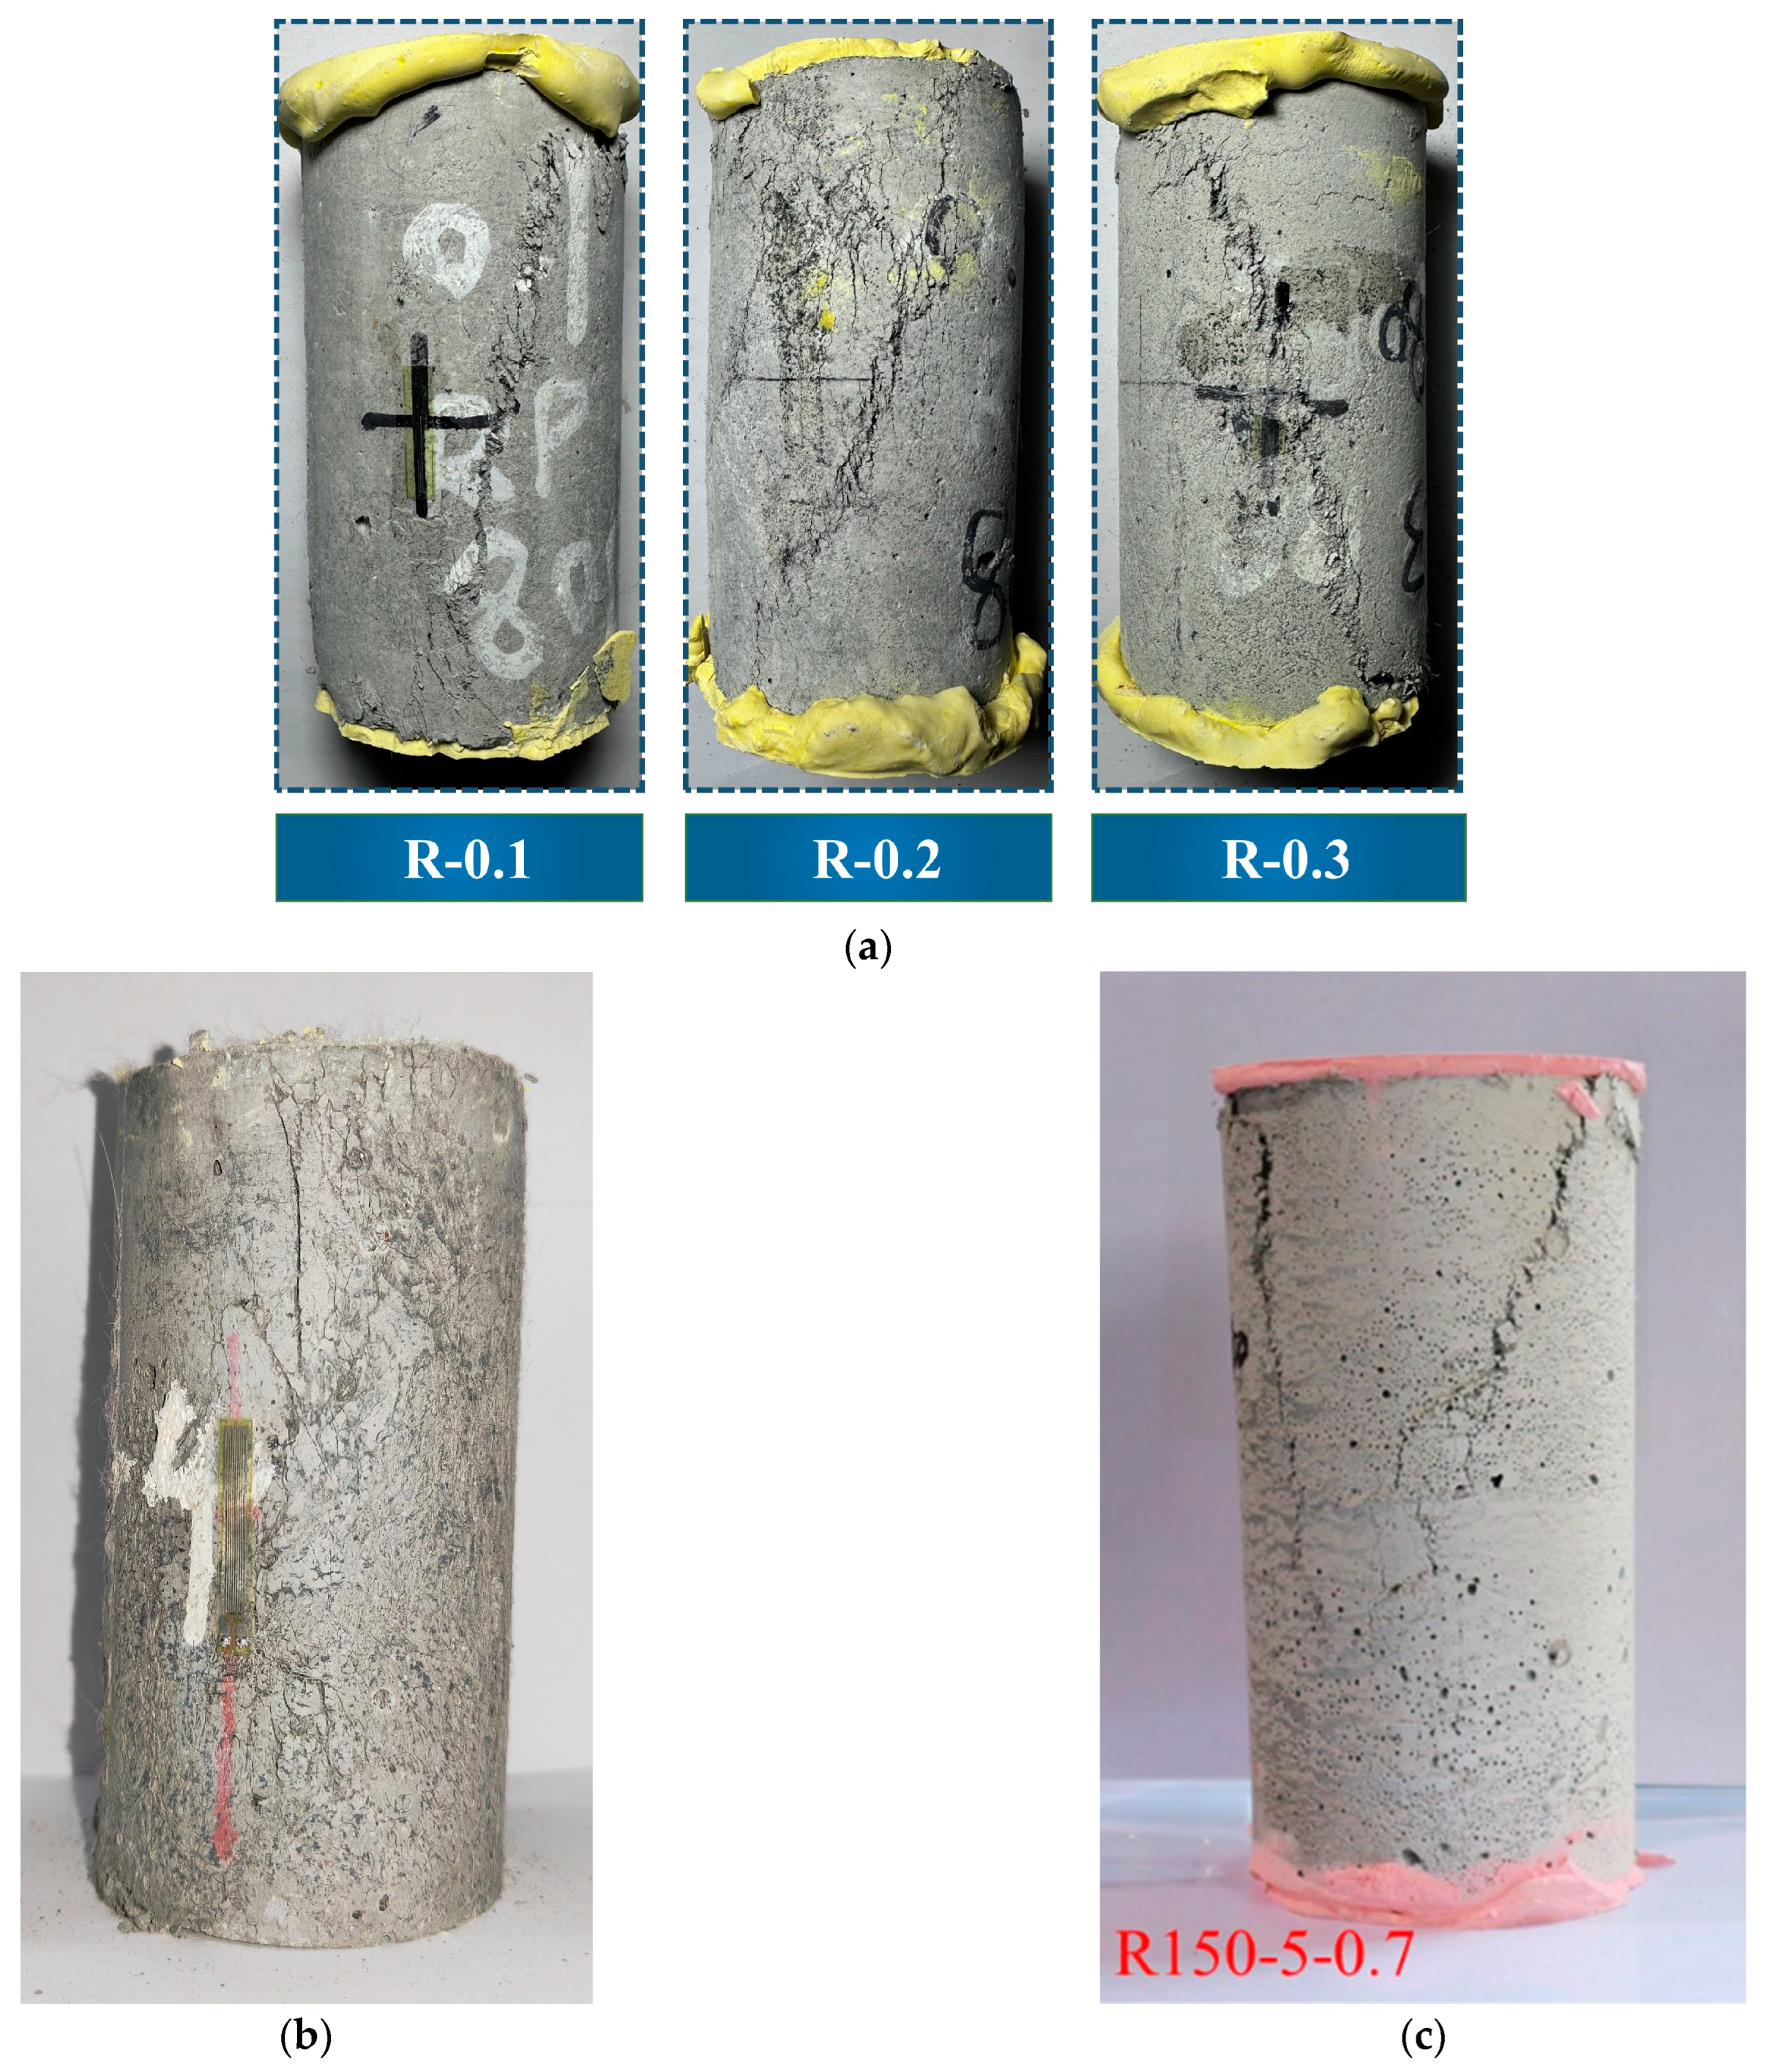
3.3.1. Failure Mode

Figure 10 illustrates the axial compressive failure modes of the R-EGC specimens under different A/B ratios, along with comparisons to quartz sand-based geopolymer fiber-reinforced concrete (Q-EGC) and rubber aggregate cement-based fiber-reinforced concrete (R-ECC). It is noteworthy that both Q-EGC and R-ECC used PE fibers identical in type and dosage to those employed in this study.
As shown in Figure 10, the primary crack in Q-EGC exhibited a linear propagation path, accompanied by several deflected and branched microcracks along the main crack, although the overall microcrack density remained low. In contrast, R-ECC tended to fail in a brittle manner, dominated by a single wide main crack. Compared to both Q-EGC and R-ECC, the proposed R-EGC demonstrated significantly enhanced crack-path deflection during the formation of the primary crack, which led to the development of diagonal and mesh-like crack patterns and effectively prevented rapid crack penetration. These results suggest that R-EGC exhibits a more complex and progressive crack-control mechanism, with superior crack-dissipation capability and energy-absorption potential. This can be attributed to the following factors: (1) Compared to quartz sand, the irregular shape and low elastic modulus of the RPs provide a flexible cushioning effect during compression, promoting crack deflection and branching and thereby reducing stress concentration along the main crack path [11,56,57,58,59,60]. (2) The geopolymer matrix, with its higher porosity compared to Portland cement matrices, presents a looser microstructure that facilitates microcrack initiation and propagation. The synergistic effect of these two factors enhances the overall energy-dissipation capacity of the composite [7,38].
Furthermore, as observed in Figure 10a, the energy-dissipation capacity of the R-EGC specimens under axial compression initially increased and then decreased with rising A/B ratio. This trend can be explained by the fact that at A/B = 0.2, the proportion of RPs to the relatively stiff matrix was at an optimal level, resulting in a more uniform distribution of rubber particles. This facilitated crack deflection, branching, and even arrest during propagation, leading to the formation of multi-level crack networks and significantly enhancing the overall energy-dissipation capacity and ductility of the composite. As shown in Figure 11, when the crack encountered an RP, it deflected and generated secondary cracks [23]. However, when the A/B ratio increased to 0.3, the amount of binder per unit volume was insufficient to effectively encapsulate the large number of rubber particles. This led to the formation of continuous interfacial weak zones within the matrix. These weak zones served as preferential paths for crack propagation under stress, reducing the ability of the material to distribute cracks and ultimately causing a shift in failure mode from ductile to brittle. Although RPs inherently possess certain flexibility and energy-absorption characteristics, at high dosage levels, their beneficial effects on ductility are insufficient to compensate for the brittleness induced by the rapid development of dominant cracks due to the weakened matrix stiffness [61,62].
Figure 10. Comparison of compressive failure modes of the R-EGC specimens with varying A/B ratios, Q-EGC, and R-ECC. (a) Failure modes of R-EGC specimens. (b) Failure mode of Q-EGC (as cited in the literature [38]). (c) Failure mode of R-ECC (as cited in the literature [63]).
Buildings 15 02496 g010
Figure 11. Microscopic schematic of crack deflection around the RPs.
Buildings 15 02496 g011

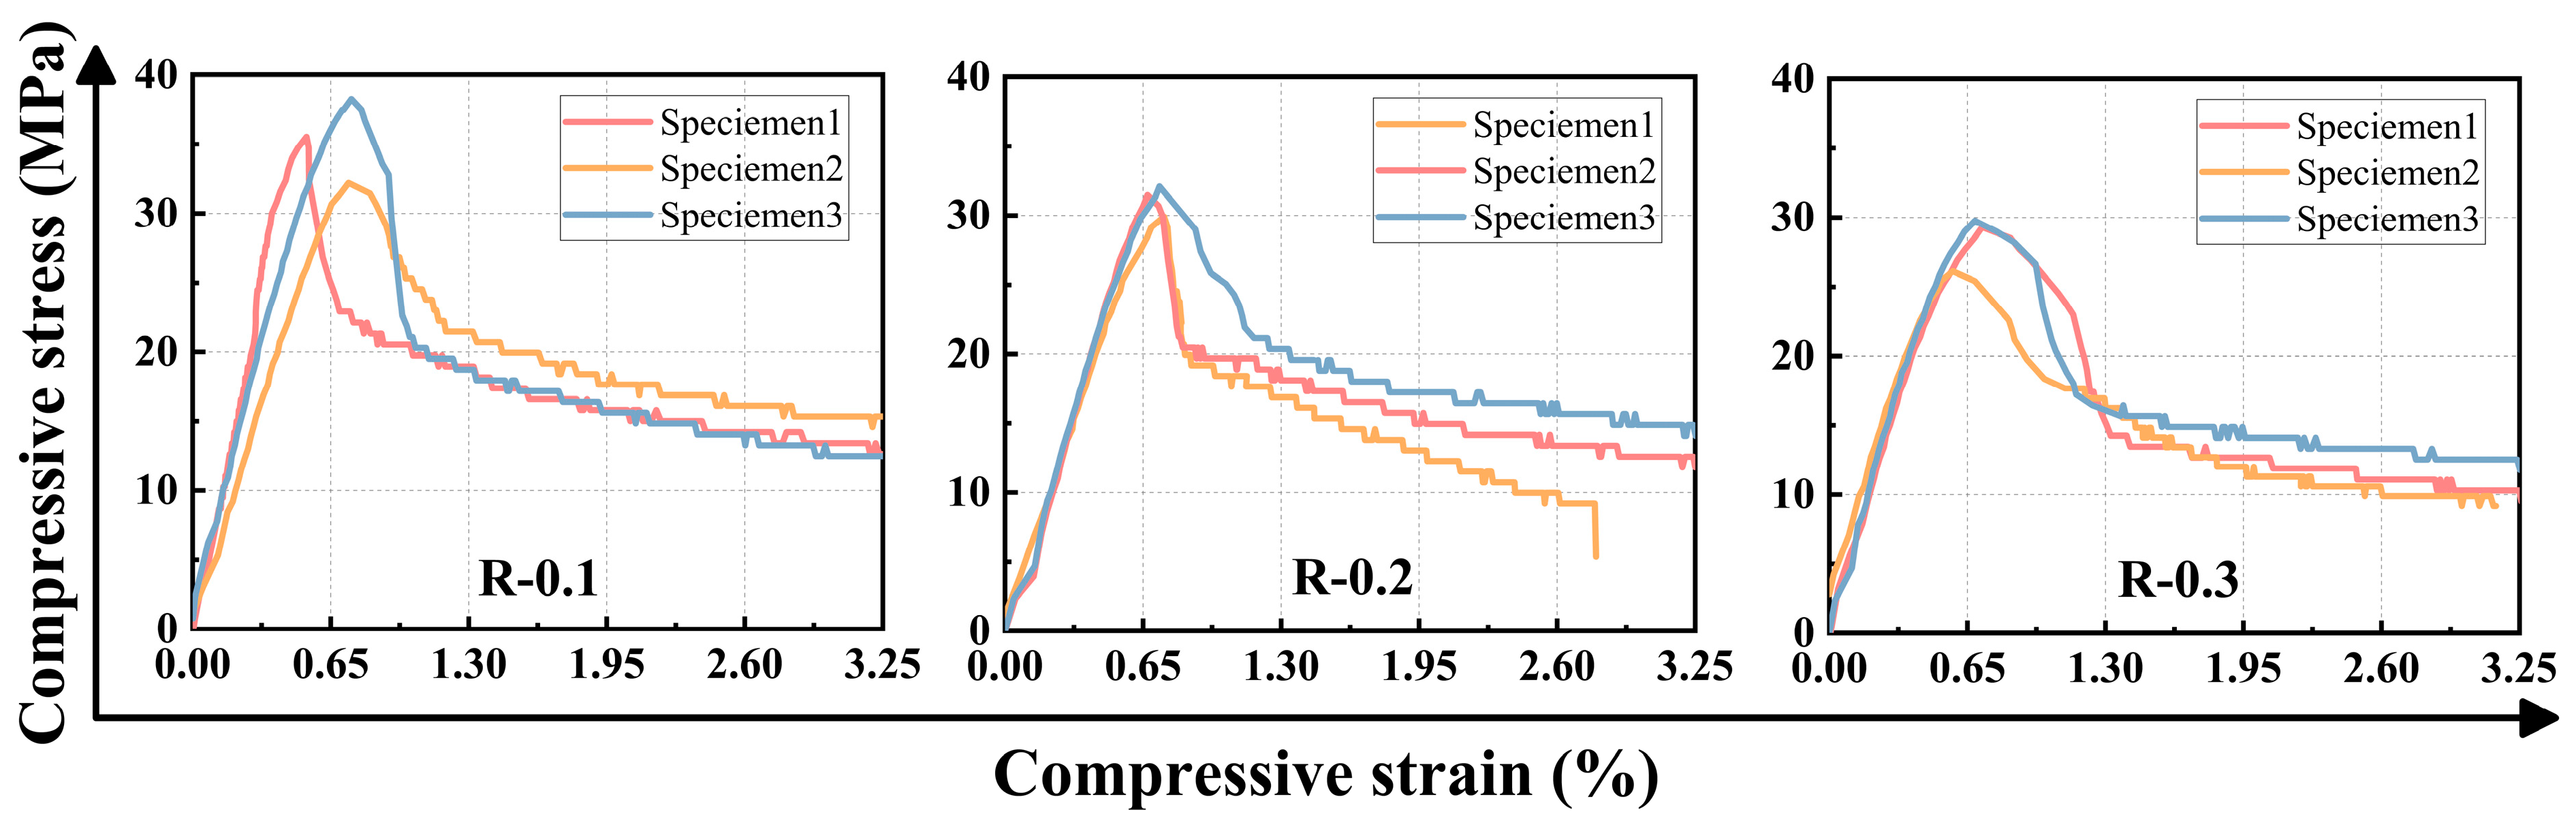
3.3.2. Effect of A/B Ratio on Stress–Strain Curves

Figure 12 presents the axial compressive stress–strain curves of the R-EGC specimens under different A/B ratios. As observed, the compressive behavior of the R-EGC can be divided into three distinct stages: the elastic stage, the strain-hardening stage, and the post-peak softening stage. In the elastic stage, the R-EGC underwent recoverable deformation upon unloading without the formation of microcracks. This behavior is consistent with that of most concrete materials under axial compression, where the matrix stiffness is sufficient to maintain structural integrity and the bridging effect of fibers has not yet been activated [64,65]. As the axial compressive load increased, the R-EGC transitioned into the strain-hardening stage. In this phase, microcracks began to form, and the composite exhibited elasto-plastic behavior due to the synergistic effects of PE-fiber bridging and sliding, as well as the energy dissipation at crack tips induced by RPs. With further loading, primary cracks propagated and widened. Once the axial compressive strength reached its peak, the material entered the softening stage, and the load-bearing capacity began to decline, ultimately leading to failure of the specimen.
After reaching the peak stress, the stress–strain curve did not exhibit a sudden drop (i.e., cliff-like decline) typical of brittle materials. Instead, it showed a brief rapid decrease followed by a more gradual descent, indicating a deviation from the brittle behavior commonly observed in conventional concrete. This phenomenon can be attributed to the excellent elasticity and strength of PE fibers. PE fibers possess zero moisture regain under normal atmospheric conditions and demonstrate stable resistance to chemical and environmental degradation, allowing them to maintain consistent physical properties within the matrix. As a result, PE fibers can continue to provide effective crack-bridging and toughening even after the formation of macrocracks, thereby imparting more pronounced ductile characteristics to the R-EGC.

3.3.3. Compressive Strength, Peak Strain, and Modulus of Elasticity

Figure 13 and Table 5 present the axial compressive strength, peak strain, and elastic modulus of the R-EGC specimens under different A/B ratios. As shown in Figure 13, with increasing A/B ratio, the axial compressive strength of the R-EGC gradually decreased, while both the peak strain and elastic modulus exhibited a non-monotonic trend—first increasing and then decreasing. Specifically, as the A/B ratio increased from 0.1 to 0.3, the axial compressive strength decreased by 11.6% and 19.5%, respectively. The peak strain reached its maximum value of 0.72% at A/B = 0.2, while the peak strains at A/B = 0.1 and A/B = 0.3 remained identical. The elastic modulus initially dropped by approximately 21.9% and then increased by about 20.8%.
The gradual decrease in compressive strength with increasing A/B ratio can be attributed to the higher RP content, which led to increased matrix porosity and the formation of more initial defects in the R-EGC. This ultimately reduced the overall stiffness of the composite. This observation is consistent with the findings reported by Chen et al. [66]. The elastic modulus exhibited an initial decrease followed by an increase as the A/B ratio rose. This may be due to the dominant role of the RPs in disrupting the continuity of the cementitious skeleton at lower A/B ratios, thereby reducing stiffness. However, as the A/B ratio increased further, the packing density between the RPs improved, and the highly deformable nature of the RPs provided hysteresis and stress-buffering effects during the early stages of microcrack development. These mechanisms collectively contributed to the partial recovery of the overall modulus. This trend may also explain the observed peak-strain behavior, which first increased and then decreased with increasing A/B ratio. In addition, the insufficient bonding between the hydrophobic RPs and the geopolymer matrix was a contributing factor to the strength reduction [67].

3.4. Effect of A/B Ratio on Uniaxial Tensile Behavior

Uniaxial Tensile Failure Mode

Figure 14 shows that, regardless of the A/B ratio, the fiber failure mode in all R-EGC specimens was dominated by fiber pull-out.
To investigate the failure modes of the R-EGC specimens under axial tensile loading, this study employed binarized image-processing techniques to track crack development at five strain levels—from initial cracking strain to peak strain—as shown in Figure 15. As illustrated in Figure 15, the R-EGC specimens with different A/B ratios all exhibited typical ductile behavior characterized by multiple cracking.
To further investigate the crack-distribution characteristics of the R-EGC specimens under axial tensile loading, a quantitative analysis of the maximum average crack width and crack density at different A/B ratios was conducted, as shown in Figure 16. As illustrated in Figure 16, the average crack width of the R-EGC specimens first increased and then decreased with increasing A/B ratio, while the crack density exhibited the opposite trend. At A/B = 0.3, the maximum average crack width was as low as 104 μm, whereas at A/B = 0.2, it rose to 184 μm. In contrast, the crack density remained relatively stable across all A/B ratios, at approximately 40 mm−1. These results indicate that variations in the RP-to-binder ratio have a significantly greater impact on crack width than on crack density under axial tensile loading. This behavior is likely due to the combined effects of increased RP content: reduced fiber–matrix bridging strength, enlarged fiber-slip displacement, and a widened interfacial transition zone (ITZ). These factors contribute more substantially to the formation of wider cracks than to the generation of additional secondary cracks induced by initial matrix defects associated with high RP content.
Figure 17 shows the tensile stress–strain curves for the R-EGC specimens with different A/B ratios. As observed, the stress–strain curves of R-0.1, R-0.2, and R-0.3 can be divided into three distinct stages. The first stage is characterized by a rapid increase in stress, corresponding to the elastic deformation of the material. The second stage shows a continued increase in stress with strain, followed by a slight drop and then a gradual rise, indicating strain-hardening behavior resulting from the combined effects of crack propagation and fiber bridging. The third stage features a slow decline in stress, representing the softening and failure phases of the composite. These results demonstrate that all three R-EGC mixtures exhibited typical pseudo-strain-hardening behavior. This can be attributed to the effective bridging of microcracks by the PE fibers during continuous tensile loading and to matrix weakening induced by the RPs, which created sufficient stress-concentration points to trigger new microcracks and dissipate energy.
Moreover, the tensile-stress fluctuations of the R-EGC specimens first increased and then decreased with rising A/B ratio. Notably, the smallest stress fluctuation was observed at A/B = 0.3, indicating that the initial crack width followed a similar trend—first increasing and then decreasing—with the minimum initial crack width occurring at A/B = 0.3. This observation is consistent with the crack-width pattern shown in Figure 16a. These results suggest that increasing the RP-to-binder ratio improves tensile-stress stability and enhances the crack-control capacity of the composite.
Figure 18 and Table 6 present the tensile strength, ultimate tensile strain, cracking strength, and initial cracking strain of the R-EGC specimens with different A/B ratios. The values represent the averages of three specimens.
As shown in Figure 18, the cracking strength, initial cracking strain, and ultimate tensile strain of the R-EGC specimens all exhibited an initial increase followed by a decrease as the A/B ratio increased, while the tensile strength showed a continuous upward trend. This indicates that a moderate increase in the A/B ratio can enhance crack-path deflection and crack dispersion without significantly compromising matrix stiffness, thereby delaying crack initiation and improving the deformability of the composite. However, when the A/B ratio was further increased to 0.3, the binder content became relatively insufficient. The reduced spacing between the RPs led to localized accumulation, resulting in more frequent and wider ITZs, which weakened both the fiber–matrix bridging strength and the overall stiffness of the matrix. Consequently, the axial tensile cracking resistance and ultimate strain were reduced. It is noteworthy that the tensile strength continued to increase with higher A/B ratios, suggesting that although the incorporation of more flexible aggregate particles may adversely affect ductility at high content levels, their contribution to microcrack control still plays a positive role in maintaining load-bearing capacity under axial tensile loading. Therefore, it can be concluded that an excessively high A/B ratio is detrimental to improving R-EGC ductility, while a relatively moderate A/B ratio can significantly enhance its tensile performance.

3.5. Economic Evaluation of R-EGC

Figure 19 illustrates the application scenarios of R-EGC. By adjusting the mix proportions, R-EGC can be applied in construction projects with high crack-resistance requirements, such as port terminals, underwater tunnels, and subterranean pipe corridors. It is also suitable for projects requiring high strain capacity, such as the anchorage zones of bridge expansion joints and expansion joints in airport runways.
In practical engineering applications, in addition to meeting the performance requirements of the composite material, economic efficiency must also be considered. Table 7 and Table 8 present the procurement costs of raw materials and the total cost required to produce R-EGC.

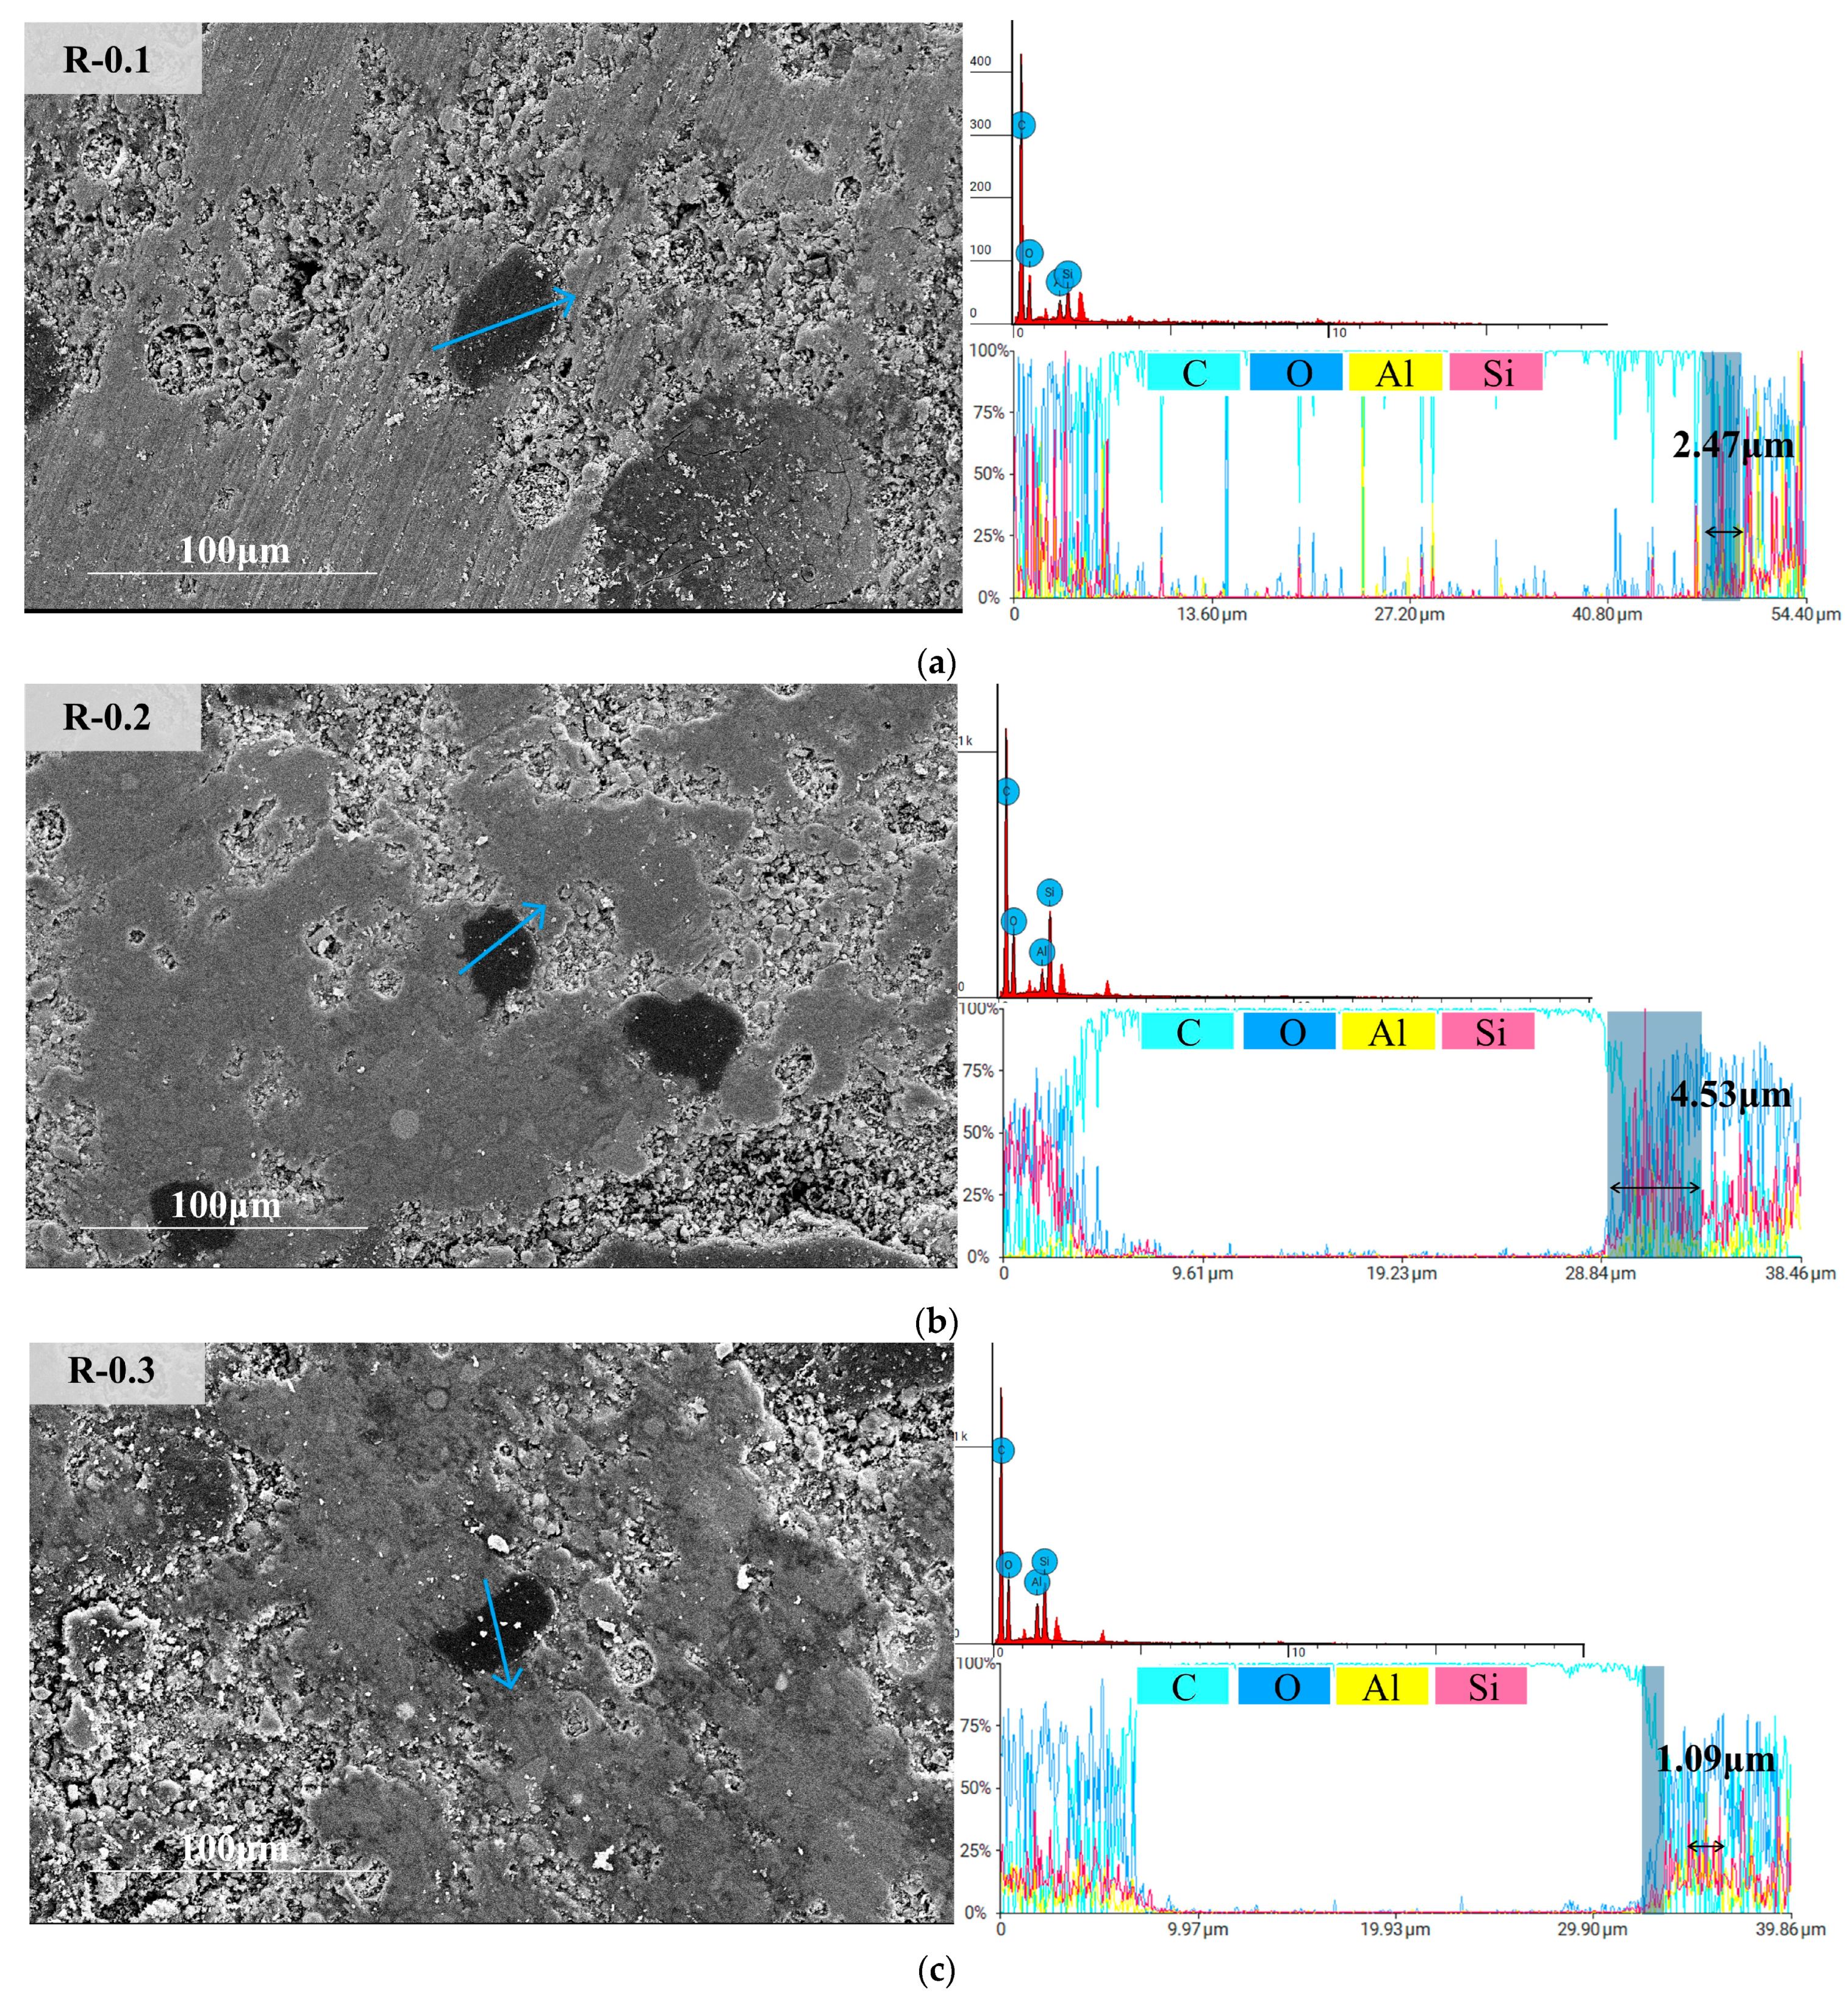
4. Microscopic Analysis

Interfacial Transition Zone (ITZ)

Figure 20 presents the ITZs between the aggregate and matrix in the R-EGC specimens with different A/B ratios. In Figure 20, the cyan, blue, yellow, and pink lines represent C (carbon), O (oxygen), Al (aluminum), and Si (silicon), respectively. EDS line scanning was conducted along the matrix–aggregate–matrix direction, clearly revealing the ITZ, highlighted with a blue-shaded area, where the concentrations of C and O alternate. This indicates the presence of a typical ITZ. This phenomenon occurs because the RPs are primarily composed of carbon black and are rich in C [68], while the geopolymer matrix mainly consists of reaction products formed through the dissolution and polycondensation of Si–O and Al–O species, making it rich in O, Si, and Al elements [69]. Concrete is considered to be composed of aggregates, mortar, and the ITZ between the aggregates and the surrounding mortar. The width of the ITZ reflects the bonding quality between the aggregates and the geopolymer matrix, which, in turn, provides insight into the cracking behavior of pseudo-strain-hardening composites [70,71,72,73]. As shown in the three EDS line scans in Figure 20, the lengths of the blue-shaded regions—where the C-element content decreased from nearly 100% to 0%—were 2.47 μm for R-0.1, 4.53 μm for R-0.2, and 1.09 μm for R-0.3, respectively. The results show that the ITZ width of R-0.1 was 2.47 μm, that of R-0.2 was 4.53 μm, and that of R-0.3 was 1.09 μm. The results indicate that the ITZ between the aggregate and the matrix in the R-EGC first increased and then decreased in width as the A/B ratio increased. This phenomenon can be mainly attributed to the following mechanism: when the A/B ratio increased from 0.1 to 0.2, the quantity of RPs in the matrix increased. More free water was adsorbed on the surface of the RPs, forming a “water film layer” that hindered the approach of binder particles, resulting in a locally elevated water-to-binder ratio and a wider ITZ [74]. This effect is known as the wall-dilution effect. However, when the A/B ratio increased from 0.2 to 0.3, the closer packing of rubber particles weakened the wall-dilution effect of individual RPs, leading to a reduction in regions with a high local water-to-binder ratio, and thus a narrower ITZ in R-0.3. R-0.2 exhibited the widest ITZ, indicating weaker interfacial bonding between the RPs and the matrix at A/B = 0.2, which may reduce the fracture toughness and strength of the composite and make it more prone to cracking, potentially enhancing its ductility. In contrast, R-0.3 showed the narrowest ITZ, suggesting a stronger bond at the RP–matrix interface at A/B = 0.3, which may be beneficial for improving the composite strength. This observed evolution of microstructure provides a mechanistic explanation for the variations in fundamental mechanical properties such as axial compressive and tensile performance with different A/B ratios.

5. Conclusions

In this study, R-EGC specimens were prepared using different rubber particle-to-binder mass ratios (A/B = 0.1, 0.2, 0.3). The influence of the A/B ratio on the composite’s performance was comprehensively evaluated from both macroscopic and microscopic perspectives. The main conclusions are as follows:
(1)
A lower A/B ratio improves the workability of the fresh mix and the dispersion of fibers, while an increase in the A/B ratio leads to reduced flowability.
(2)
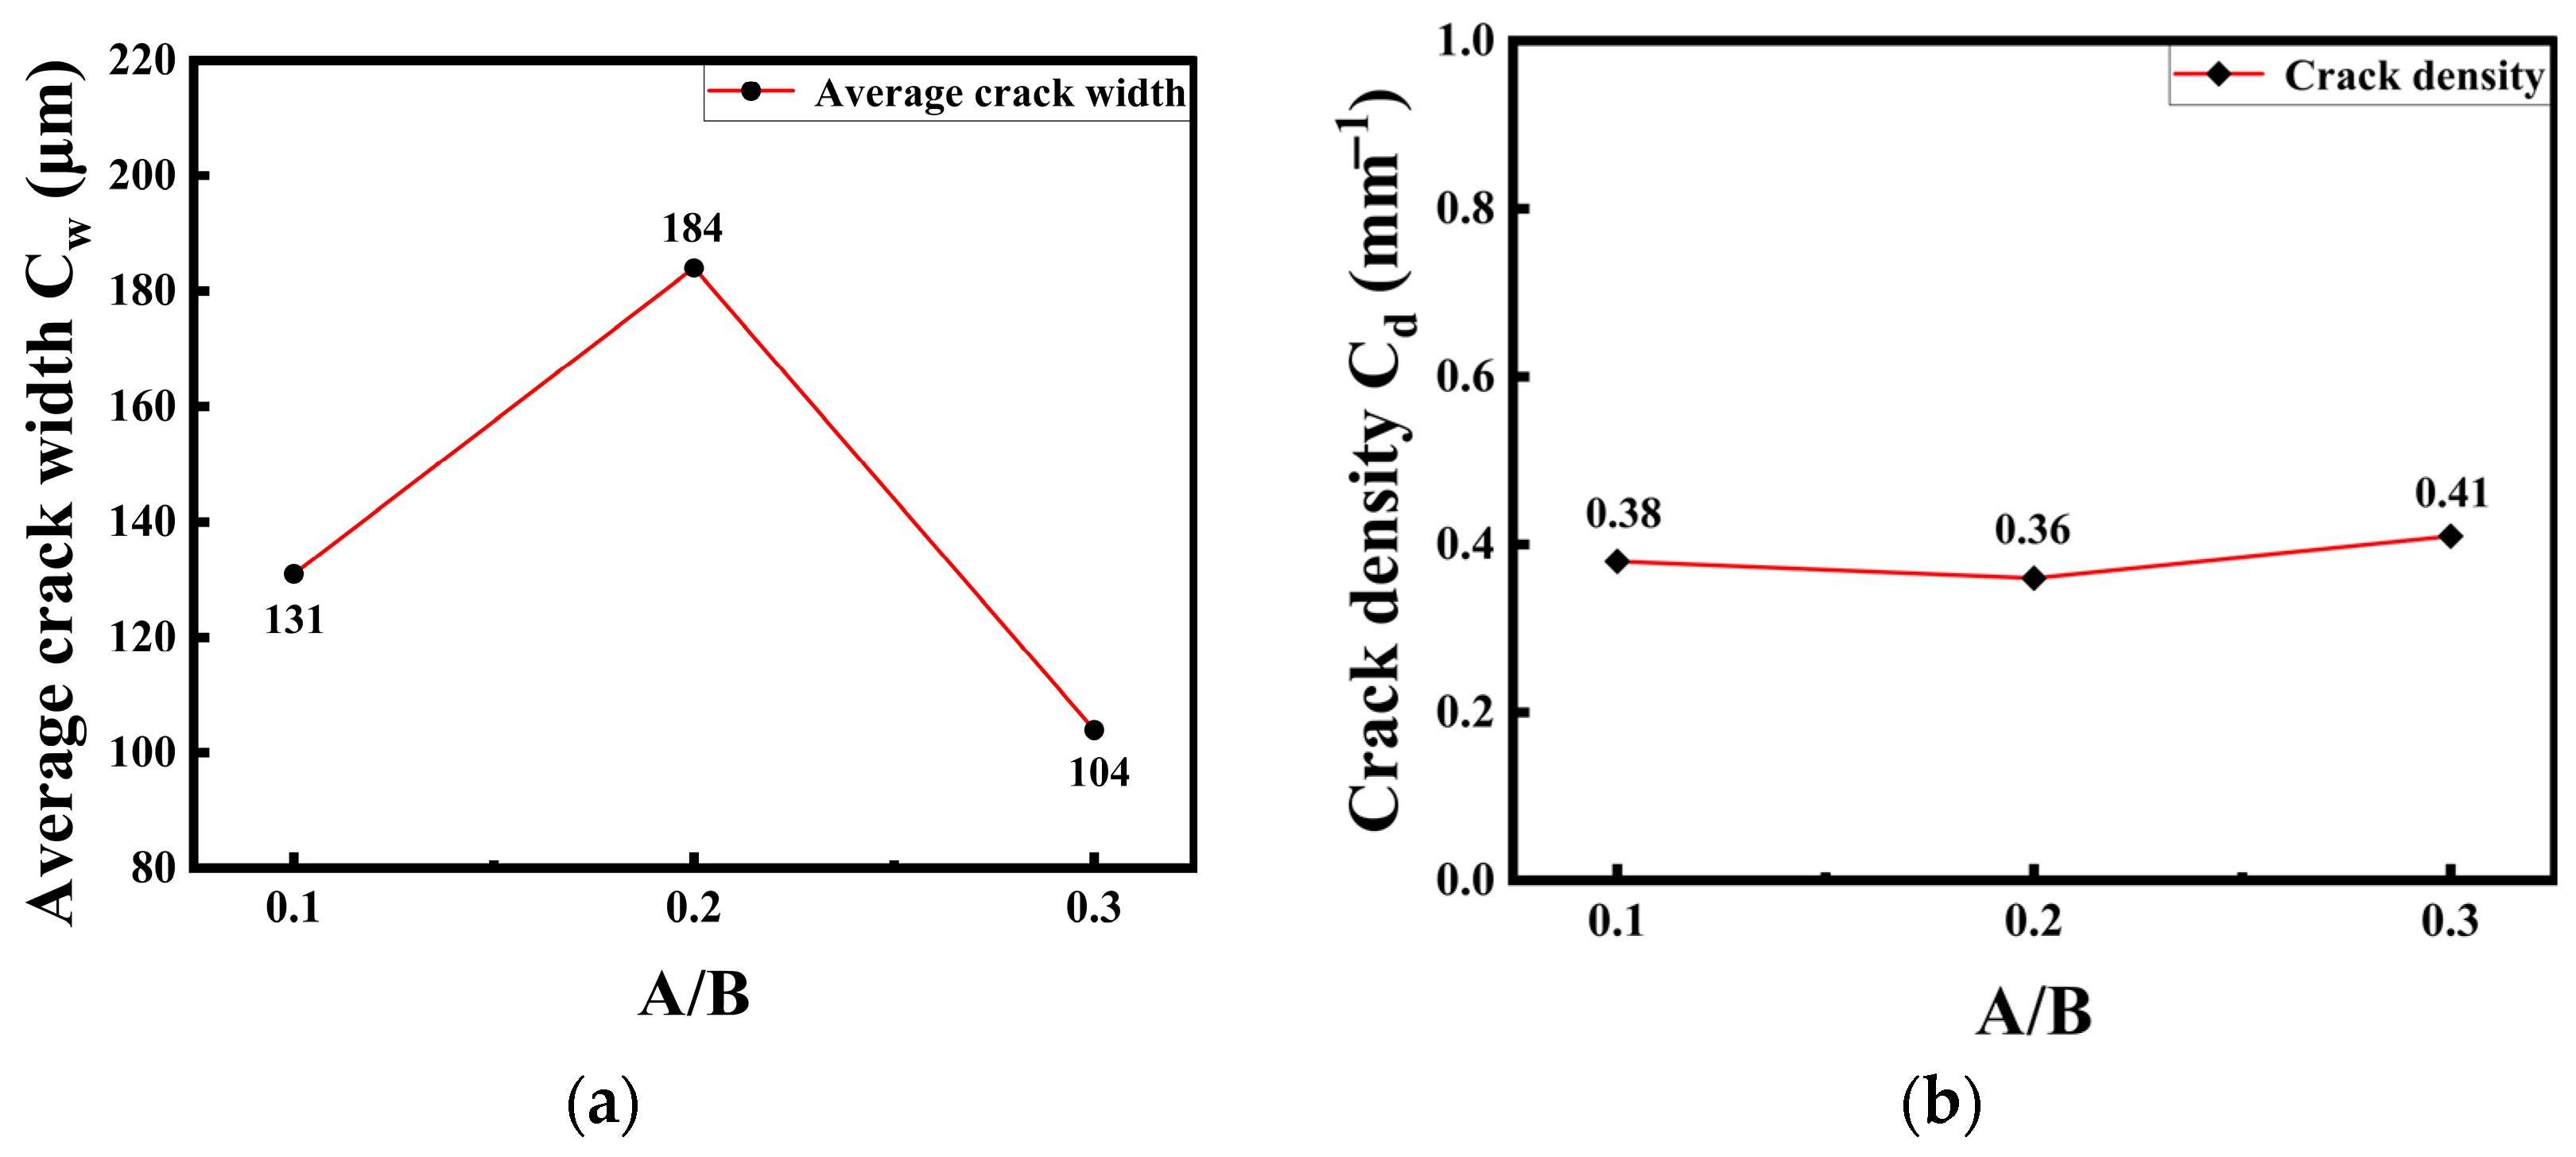
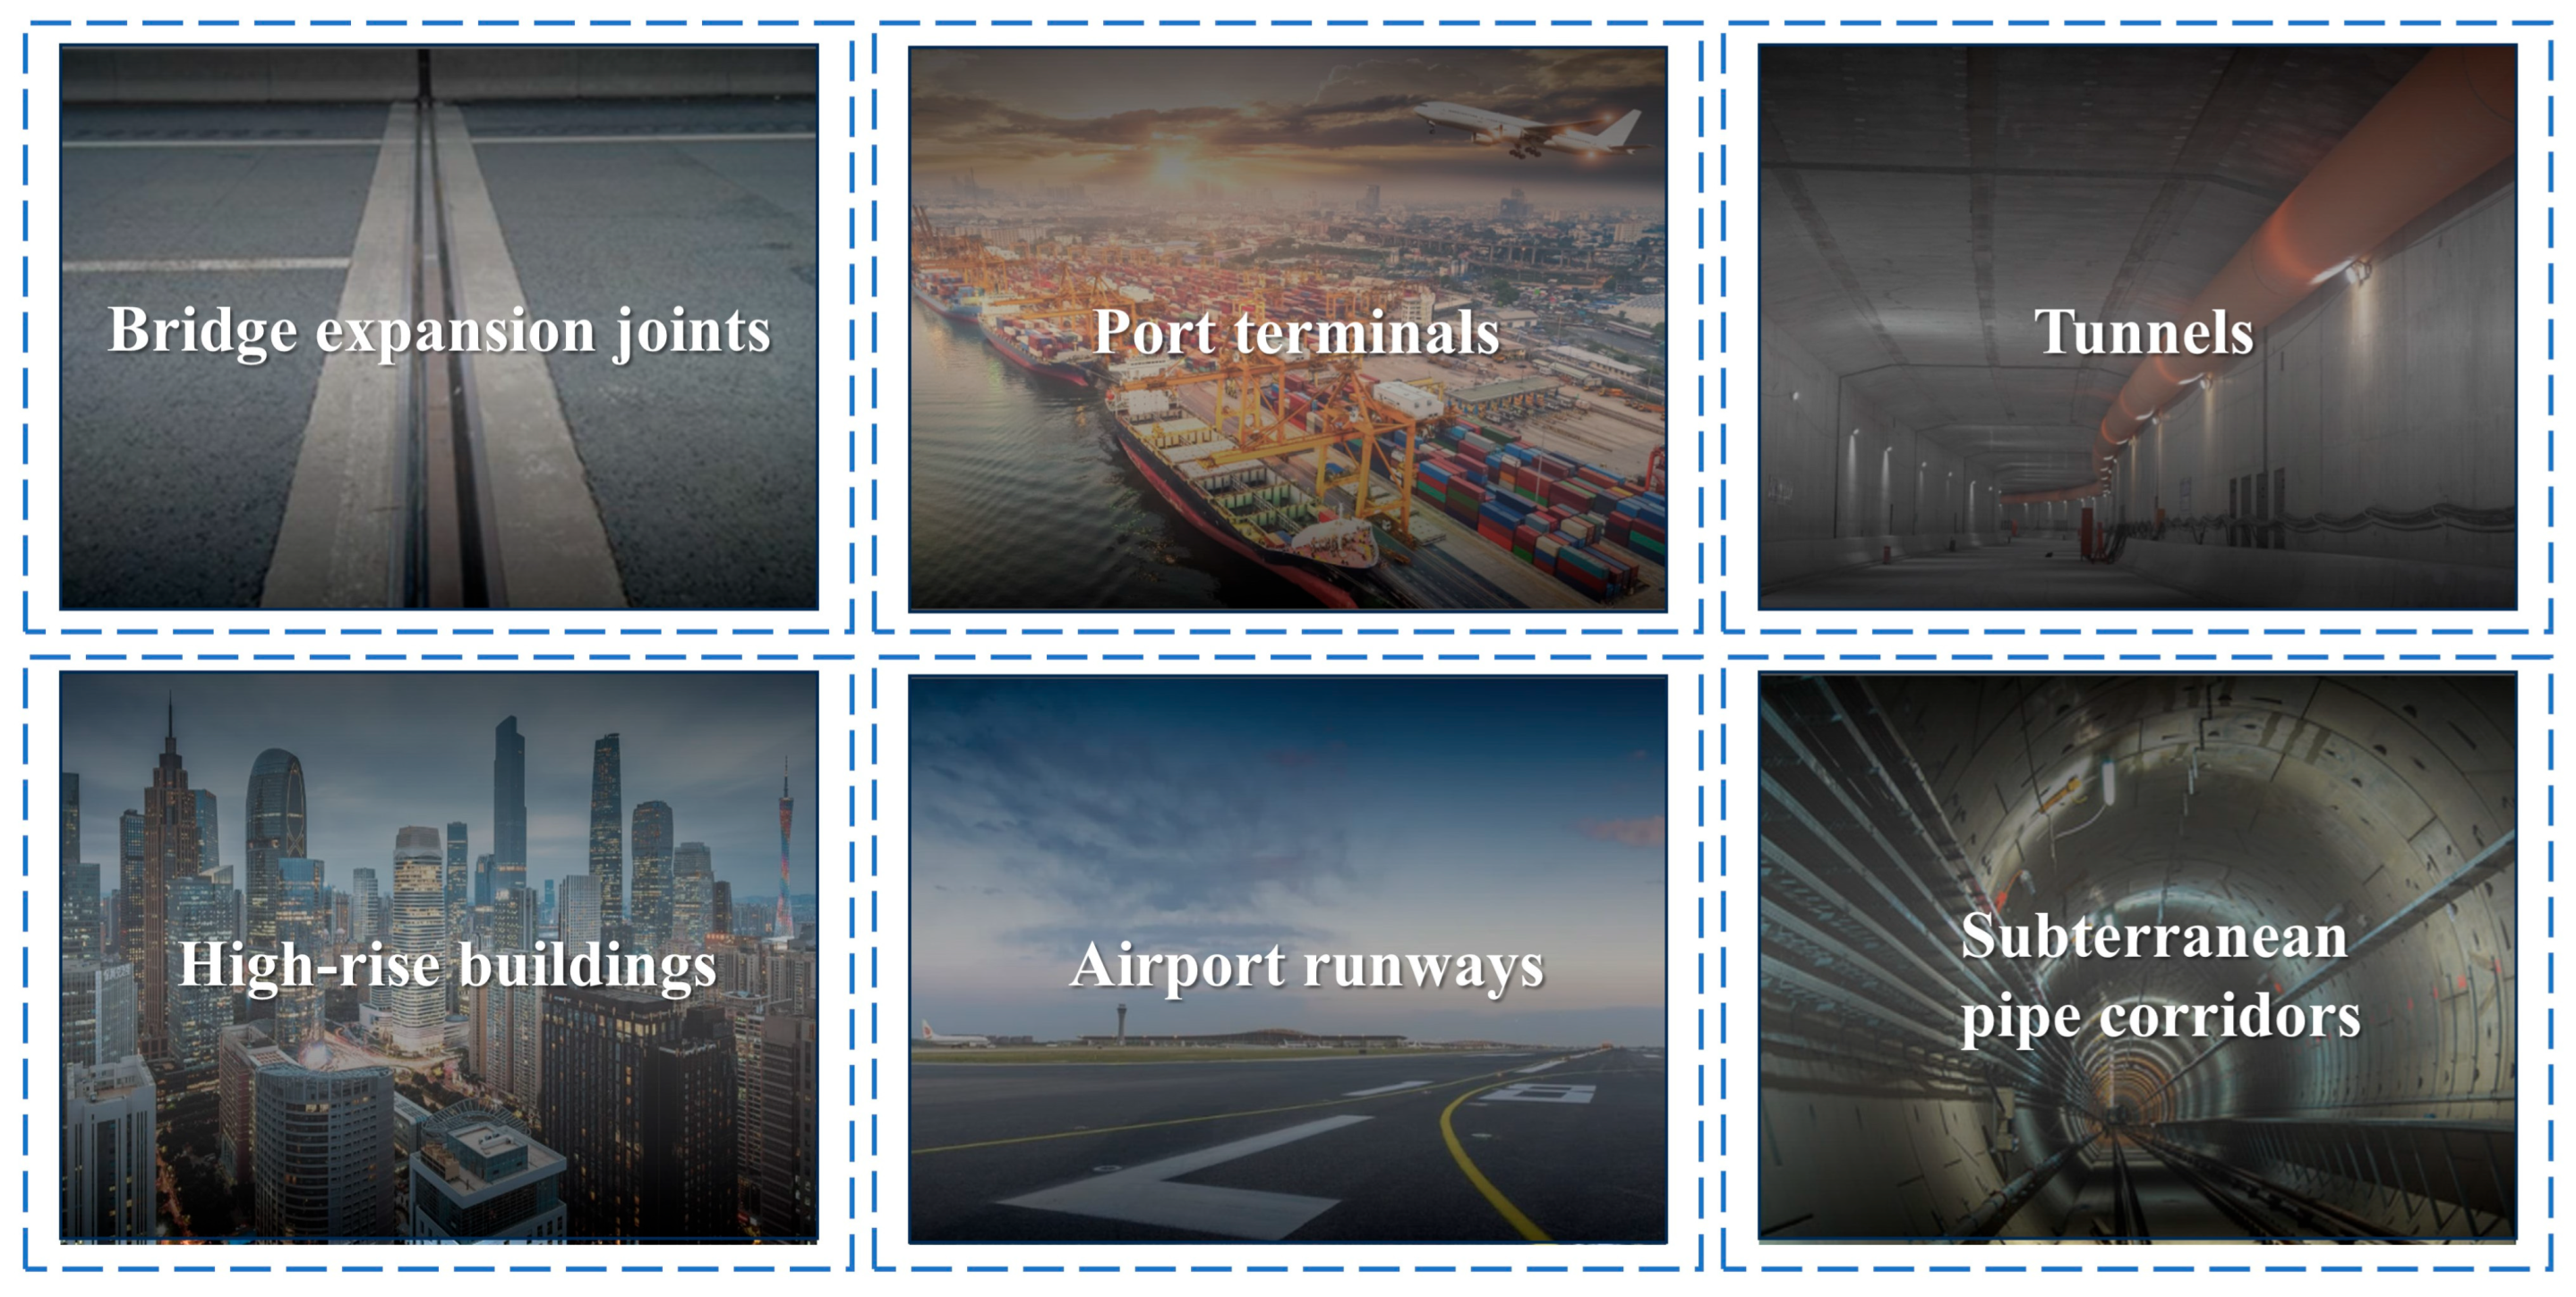
At A/B = 0.3, the material exhibits optimal crack-control performance under tensile loading. R-0.3 shows the narrowest average crack width of 104 μm and the highest crack density of 0.41 mm−1, making it suitable for engineering applications requiring high durability, such as port terminals, subterranean utility tunnels, and traffic tunnels.
(3)
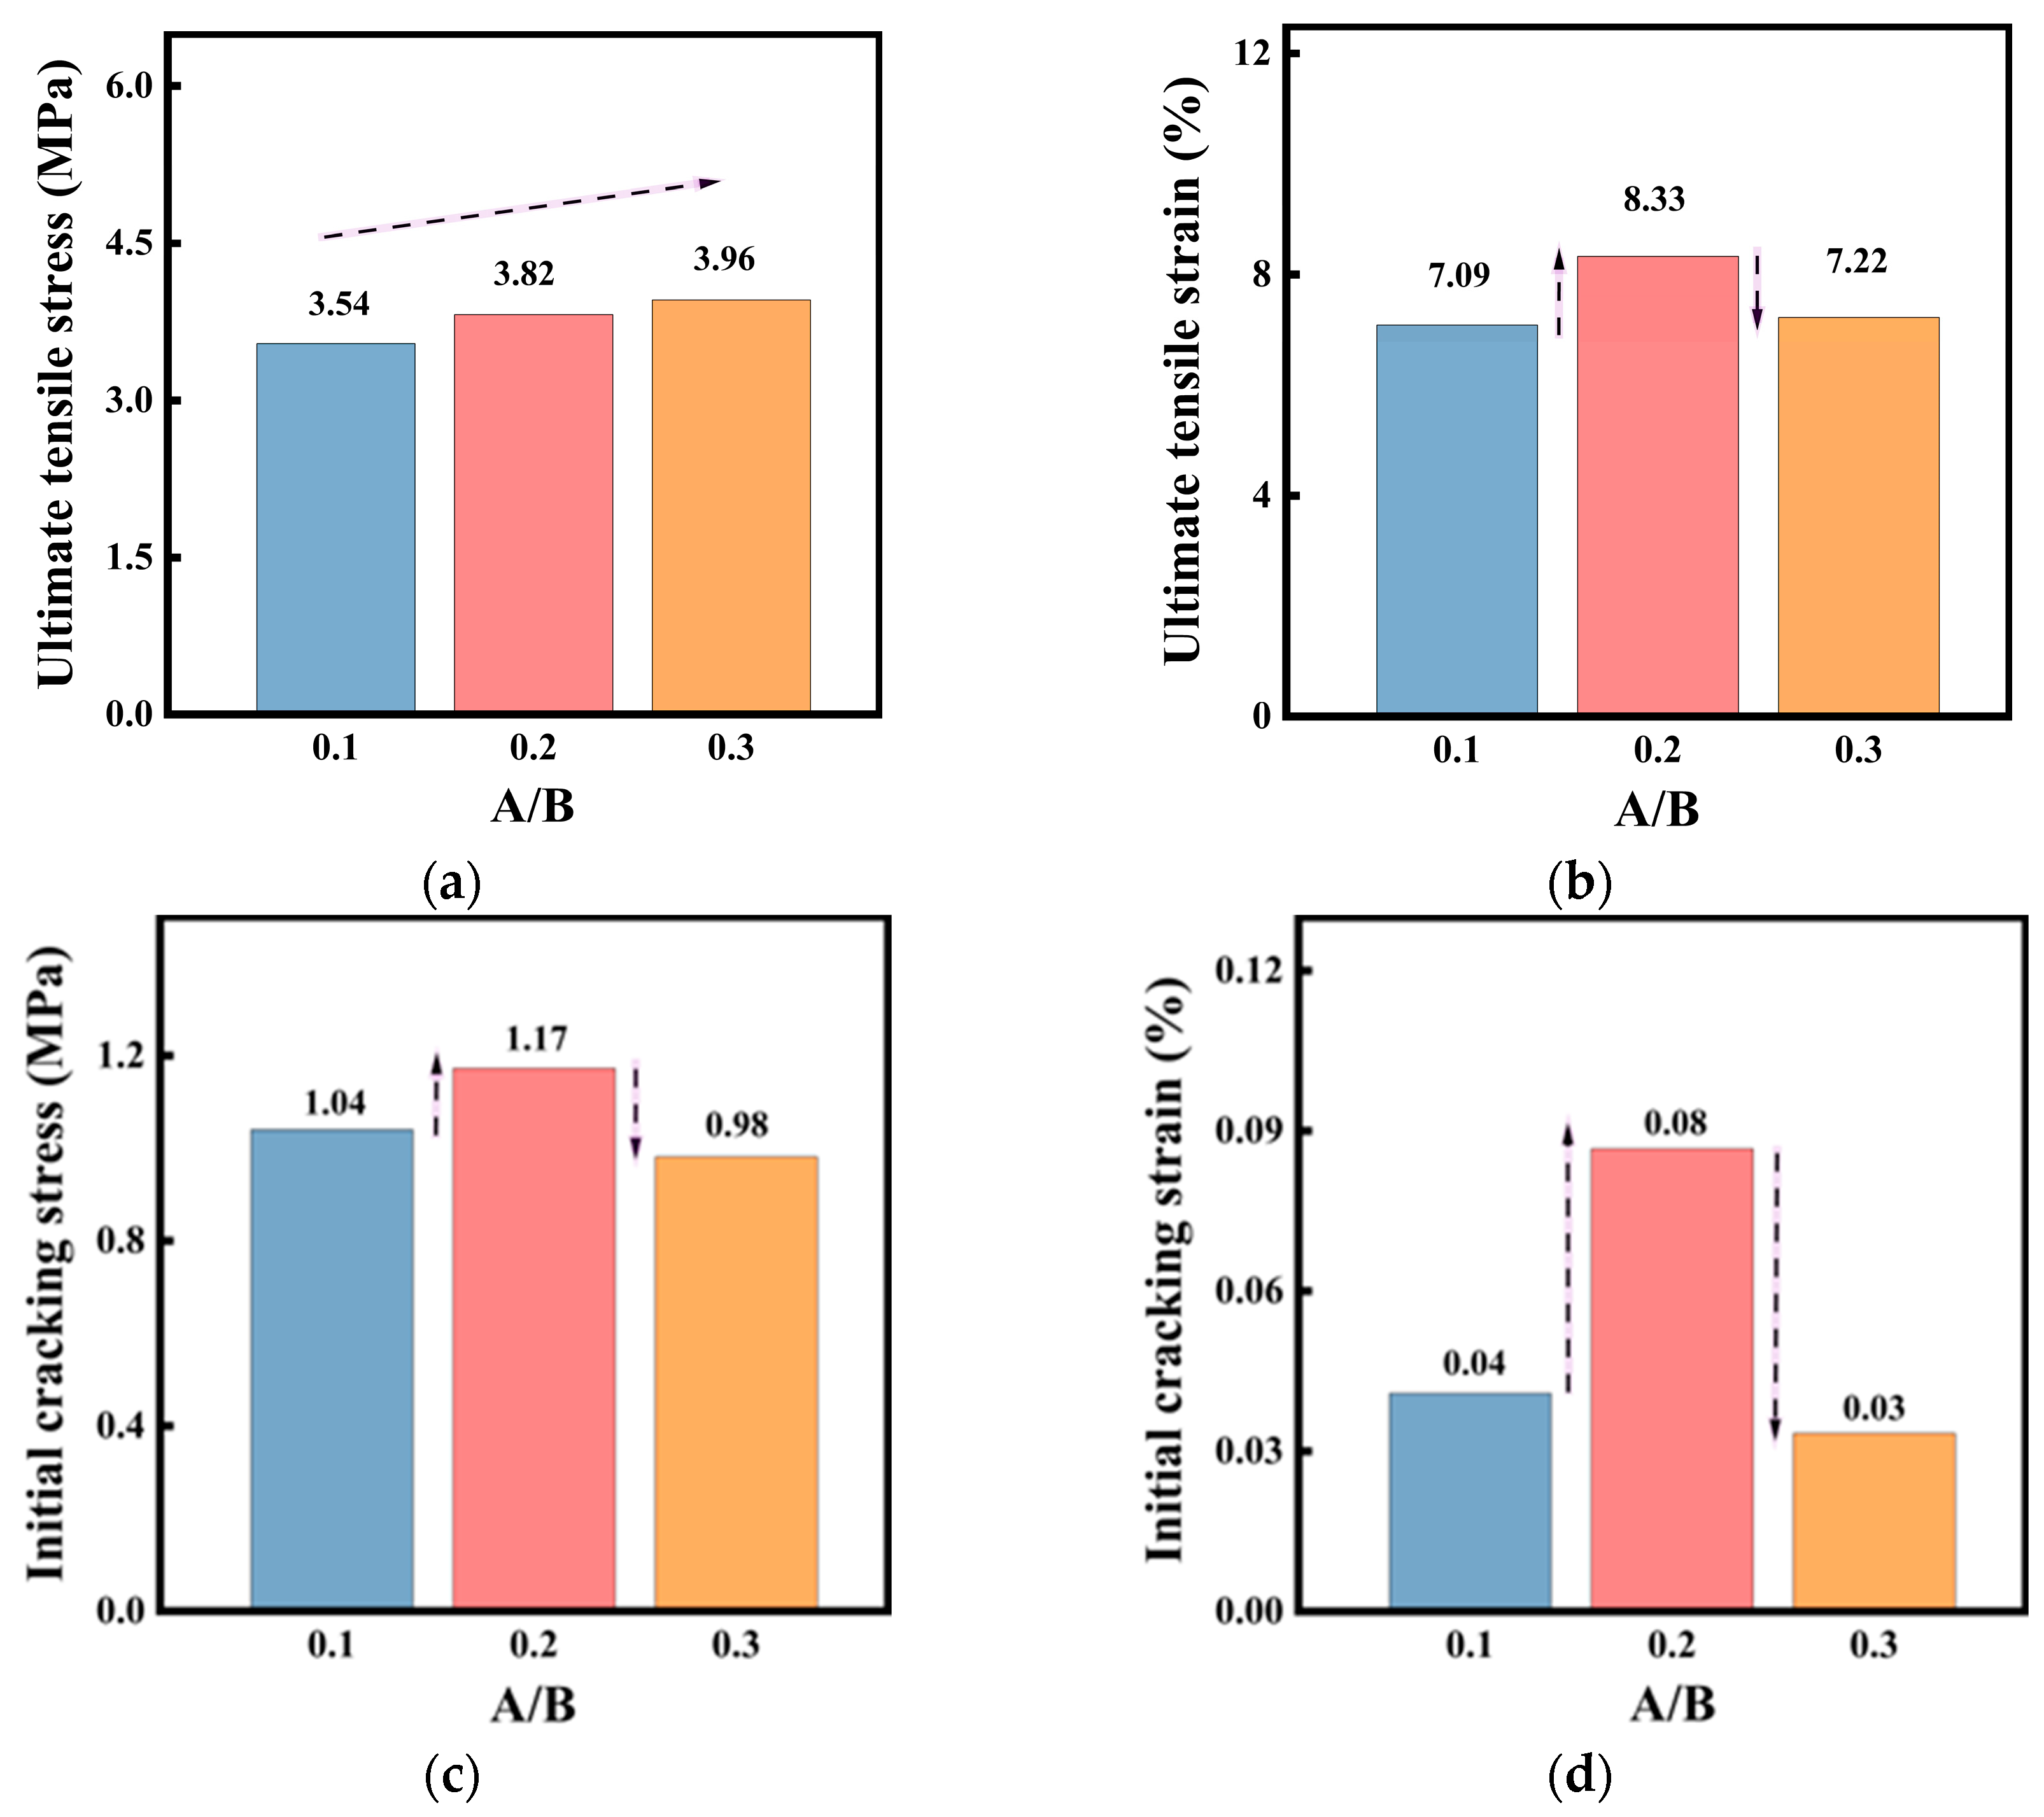
At A/B = 0.2, the material demonstrates the best tensile ductility. R-0.2 achieves a tensile strength of 3.82 MPa and an ultimate tensile strain of up to 8.33%, making it applicable for engineering projects with high-tensile-ductility requirements, such as high-rise buildings, anchorage zones of bridge expansion joints, and airport runways.
(4)
Microscopic analysis indicates that the A/B ratio affects the width of the ITZ and the size of initial defects in the R-EGC. R-0.2 has the widest ITZ at 4.53 μm, suggesting that a moderate A/B ratio helps enhance tensile ductility, while R-0.3 has the narrowest ITZ at 1.09 μm, indicating that a higher A/B ratio improves the material’s crack-control capability.

Author Contributions

Data curation, Software, Writing—Original draft, Methodology, and Validation, Y.L.; Validation, Methodology, S.Z.; Investigation and Visualization, R.C.; Investigation and Validation, Z.Z.; Investigation and Validation, J.H.; Investigation, Z.Y. (Zhan Yang) and Z.Y. (Zizhao Yao); Conceptualization, Writing—Reviewing and Editing, Methodology, and Funding acquisition, Y.G. and G.Z. All authors have read and agreed to the published version of the manuscript.

Funding

This research was funded by the “Climbing Program”—Special Fund for Science and Technology Innovation Training for University Students in Guangdong Province, grant number pdjh2025ak076.

Data Availability Statement

The data presented in this study are available on request from the corresponding author. The data are not publicly available due to confidentiality issues.

Conflicts of Interest

Author Zhan Yang was employed by the company Guangzhou Building Materials Institute Limited Company. The remaining authors declare that the research was conducted in the absence of any commercial or financial relationships that could be construed as a potential conflict of interest.

References

  1. Khalil, W.; Obeidy, N. Some properties of sustainable concrete containing two environmental wastes. MATEC Web Conf. 2018, 162, 02029. [Google Scholar] [CrossRef]
  2. Niu, Y.; Wang, W.; Su, Y.; Jia, F.; Long, X. Plastic damage prediction of concrete under compression based on deep learning. Acta Mech. 2024, 235, 255–266. [Google Scholar] [CrossRef]
  3. Alaloul, W.S.; Musarat, M.A.; Tayeh, B.A.; Sivalingam, S.; Rosli, M.F.B.; Haruna, S.; Khan, M.I. Mechanical and deformation properties of rubberized engineered cementitious composite (ECC). Case Stud. Constr. Mater. 2020, 13, e00385. [Google Scholar] [CrossRef]
  4. Huo, Y.; Liu, T.; Lu, D.; Han, X.; Sun, H.; Huang, J.; Ye, X.; Zhang, C.; Chen, Z.; Yang, Y. Dynamic tensile properties of steel fiber reinforced polyethylene fiber-engineered/strain-hardening cementitious composites (PE-ECC/SHCC) at high strain rate. Cem. Concr. Compos. 2023, 143, 105234. [Google Scholar] [CrossRef]
  5. Li, J.; Qiu, J.; Weng, J.; Yang, E.-H. Micromechanics of engineered cementitious composites (ECC): A critical review and new insights. Constr. Build. Mater. 2023, 362, 129765. [Google Scholar] [CrossRef]
  6. Lin, J.-X.; Song, Y.; Xie, Z.-H.; Guo, Y.-C.; Yuan, B.; Zeng, J.-J.; Wei, X. Static and dynamic mechanical behavior of engineered cementitious composites with PP and PVA fibers. J. Build. Eng. 2020, 29, 101097. [Google Scholar] [CrossRef]
  7. Jiang, Z.-X.; Su, J.-Y.; Ruan, G.-W.; Lv, J.-H.; Yang, Z.-M.; Lai, H.-M.; Lin, J.-X. Tensile behavior of rubberized high strength-high ductile concrete under elevated temperature. Constr. Build. Mater. 2024, 446, 138036. [Google Scholar] [CrossRef]
  8. Xu, S.-L.; Xu, H.-L.; Huang, B.-T.; Li, Q.-H.; Yu, K.-Q.; Yu, J.-T. Development of ultrahigh-strength ultrahigh-toughness cementitious composites (UHS-UHTCC) using polyethylene and steel fibers. Compos. Commun. 2022, 29, 100992. [Google Scholar] [CrossRef]
  9. Ding, Y.; Yu, J.-T.; Yu, K.-Q.; Xu, S.-L. Basic mechanical properties of ultra-high ductility cementitious composites: From 40 MPa to 120 MPa. Compos. Struct. 2018, 185, 634–645. [Google Scholar] [CrossRef]
  10. Li, V.C.; Wang, S.; Wu, C. Tensile strain-hardening behavior of polyvinyl alcohol engineered cementitious composite (PVA-ECC). ACI Mater. J. 2001, 98, 483–492. [Google Scholar] [CrossRef] [PubMed]
  11. Elmesalami, N.; Celik, K. A critical review of engineered geopolymer composite: A low-carbon ultra-high-performance concrete. Constr. Build. Mater. 2022, 346, 128491. [Google Scholar] [CrossRef]
  12. Celik, K.; Hay, R.; Hargis, C.W.; Moon, J. Effect of volcanic ash pozzolan or limestone replacement on hydration of Portland cement. Constr. Build. Mater. 2019, 197, 803–812. [Google Scholar] [CrossRef]
  13. Chen, Y.; Sha, A.; Jiang, W.; Lu, Q.; Du, P.; Hu, K.; Li, C. Eco-friendly bismuth vanadate/iron oxide yellow composite heat-reflective coating for sustainable pavement: Urban heat island mitigation. Constr. Build. Mater. 2025, 470, 140645. [Google Scholar] [CrossRef]
  14. Xu, L.-Y.; Lao, J.-C.; Qian, L.-P.; Shi, D.-D.; Lan, J.; Xie, T.-Y.; Hou, D.; Huang, B.-T. Upcycling red mud into high-strength high-ductility Engineered Geopolymer Composites (EGC): Toward superior performance and sustainability. Compos. Part B Eng. 2025, 305, 112713. [Google Scholar] [CrossRef]
  15. Zhong, H.; Zhang, M. Engineered geopolymer composites: A state-of-the-art review. Cem. Concr. Compos. 2023, 135, 104850. [Google Scholar] [CrossRef]
  16. Nguyễn, H.H.; Lương, Q.-H.; Choi, J.-I.; Ranade, R.; Li, V.C.; Lee, B.Y. Ultra-ductile behavior of fly ash-based engineered geopolymer composites with a tensile strain capacity up to 13.7%. Cem. Concr. Compos. 2021, 122, 104133. [Google Scholar] [CrossRef]
  17. Thomas, B.S.; Gupta, R.C.; Panicker, V.J. Recycling of waste tire rubber as aggregate in concrete: Durability-related performance. J. Clean. Prod. 2016, 112, 504–513. [Google Scholar] [CrossRef]
  18. Qaidi, S.M.A.; Dinkha, Y.Z.; Haido, J.H.; Ali, M.H.; Tayeh, B.A. Engineering properties of sustainable green concrete incorporating eco-friendly aggregate of crumb rubber: A review. J. Clean. Prod. 2021, 324, 129251. [Google Scholar] [CrossRef]
  19. Gao, X.; Yang, J.; Shao, J.; Zhu, H.; Xu, J.; Haruna, S.I. Regulation of carbon nanotubes on internal humidity of concrete with recycled tire rubber: Mechanism analysis and modeling. J. Build. Eng. 2024, 82, 108253. [Google Scholar] [CrossRef]
  20. Hernández-Olivares, F.; Barluenga, G.; Bollati, M.; Witoszek, B. Static and dynamic behaviour of recycled tyre rubber-filled concrete. Cem. Concr. Res. 2002, 32, 1587–1596. [Google Scholar] [CrossRef]
  21. Siddique, R.; Naik, T.R. Properties of concrete containing scrap-tire rubber—An overview. Waste Manag. 2004, 24, 563–569. [Google Scholar] [CrossRef] [PubMed]
  22. Mohammed, B.S.; Awang, A.B.; Wong, S.S.; Nhavene, C.P. Properties of nano silica modified rubbercrete. J. Clean. Prod. 2016, 119, 66–75. [Google Scholar] [CrossRef]
  23. Hisbani, N.; Shafiq, N.; Shams, M.A.; Farhan, S.A.; Zahid, M. Properties of concrete containing crumb rubber as partial replacement of fine Aggregate—A review. Hybrid Adv. 2025, 10, 100481. [Google Scholar] [CrossRef]
  24. Etli, S. Mechanical Properties of Self-Compacting Mortars Containing Rubber Waste Particles as Fine Aggregate in Freeze–Thaw Cycles. J. Mater. Civ. Eng. 2024, 36, 04024246. [Google Scholar] [CrossRef]
  25. Adebayo, I.W.; Long, G.; Tang, Z.; Ghone, M.O.; Zaland, S.; Garba, M.J.; Yang, K.; Akhunzada, K.; Oluwasina, U.A. Effect of crumb rubber and polyethylene fiber on the strength and toughness of fly ash/slag-based geopolymer concrete. Constr. Build. Mater. 2024, 455, 139133. [Google Scholar] [CrossRef]
  26. Chen, G.; Zhuo, K.-X.; Luo, R.-H.; Lai, H.-M.; Cai, Y.-J.; Xie, B.-X.; Lin, J.-X. Fracture behavior of environmentally friendly high-strength concrete using recycled rubber powder and steel fibers: Experiment and modeling. Case Stud. Constr. Mater. 2024, 21, e03501. [Google Scholar] [CrossRef]
  27. Mohajerani, A.; Burnett, L.; Smith, J.V.; Markovski, S.; Rodwell, G.; Rahman, M.T.; Kurmus, H.; Mirzababaei, M.; Arulrajah, A.; Horpibulsuk, S.; et al. Recycling waste rubber tyres in construction materials and associated environmental considerations: A review. Resour. Conserv. Recycl. 2020, 155, 104679. [Google Scholar] [CrossRef]
  28. Mhaya, A.M.; Huseien, G.F.; Abidin, A.R.Z.; Ismail, M. Long-term mechanical and durable properties of waste tires rubber crumbs replaced GBFS modified concretes. Constr. Build. Mater. 2020, 256, 119505. [Google Scholar] [CrossRef]
  29. Jiang, Y.; Zhang, S. Experimental and analytical study on the mechanical properties of rubberized self-compacting concrete. Constr. Build. Mater. 2022, 329, 127177. [Google Scholar] [CrossRef]
  30. Hesami, S.; Salehi Hikouei, I.; Emadi, S.A.A. Mechanical behavior of self-compacting concrete pavements incorporating recycled tire rubber crumb and reinforced with polypropylene fiber. J. Clean. Prod. 2016, 133, 228–234. [Google Scholar] [CrossRef]
  31. El Marzak, M.; Karim Serroukh, H.; Benaicha, M.; Jalbaud, O.; Hafidi Alaoui, A.; Burtschell, Y. Rheological and mechanical analysis of self-compacting concrete incorporating rubber aggregates. Case Stud. Constr. Mater. 2025, 22, e04564. [Google Scholar] [CrossRef]
  32. Li, Y.; Zhang, S.; Wang, R.; Dang, F. Potential use of waste tire rubber as aggregate in cement concrete—A comprehensive review. Constr. Build. Mater. 2019, 225, 1183–1201. [Google Scholar] [CrossRef]
  33. Yu, Y.; Jin, Z.; Shen, D.; An, J.; Sun, Y.; Li, N. Microstructure evolution and impact resistance of crumb rubber concrete after elevated temperatures. Constr. Build. Mater. 2023, 384, 131340. [Google Scholar] [CrossRef]
  34. Najim, K.B.; Hall, M.R. Mechanical and dynamic properties of self-compacting crumb rubber modified concrete. Constr. Build. Mater. 2012, 27, 521–530. [Google Scholar] [CrossRef]
  35. Ganjian, E.; Khorami, M.; Maghsoudi, A.A. Scrap-tyre-rubber replacement for aggregate and filler in concrete. Constr. Build. Mater. 2009, 23, 1828–1836. [Google Scholar] [CrossRef]
  36. Zhang, Z.; Ma, H.; Qian, S. Investigation on Properties of ECC Incorporating Crumb Rubber of Different Sizes. J. Adv. Concr. Technol. 2015, 13, 241–251. [Google Scholar] [CrossRef]
  37. Xu, Y.; Wang, J.; Zhang, P.; Guo, J.; Hu, S. Enhanced effect and mechanism of colloidal nano-SiO2 modified rubber concrete. Constr. Build. Mater. 2023, 378, 131203. [Google Scholar] [CrossRef]
  38. Yang, Z.-M.; Pan, H.-S.; Jiang, Z.-X.; Lv, J.-H.; Ruan, G.-W.; Lai, H.-M.; Lin, J.-X. Pseudo strain-hardening alkali-activated composites with up to 100% rubber aggregate: Static mechanical properties analysis and constitutive model development. Constr. Build. Mater. 2024, 439, 137338. [Google Scholar] [CrossRef]
  39. Hou, M.; Zhang, D.; Li, V.C. Crack width control and mechanical properties of low carbon engineered cementitious composites (ECC). Constr. Build. Mater. 2022, 348, 128692. [Google Scholar] [CrossRef]
  40. Zhao, S.; Yu, Q.; Qiao, F.; Huang, J.; Yin, S.; Wen, Z.; Gu, G. Setting and strength characteristics of alkali-activated carbonatite cementitious materials with ground slag replacement. J. Wuhan Univ. Technol.-Mater. Sci. Ed. 2006, 21, 125–128. [Google Scholar] [CrossRef]
  41. Lin, J.-X.; Chen, G.; Pan, H.-S.; Wang, Y.-C.; Guo, Y.-C.; Jiang, Z.-X. Analysis of stress-strain behavior in engineered geopolymer composites reinforced with hybrid PE-PP fibers: A focus on cracking characteristics. Compos. Struct. 2023, 323, 117437. [Google Scholar] [CrossRef]
  42. Peng, Y.-Q.; Zheng, D.-P.; Pan, H.-S.; Yang, J.-L.; Lin, J.-X.; Lai, H.-M.; Wu, P.-Z.; Zhu, H.-Y. Strain hardening geopolymer composites with hybrid POM and UHMWPE fibers: Analysis of static mechanical properties, economic benefits, and environmental impact. J. Build. Eng. 2023, 76, 107315. [Google Scholar] [CrossRef]
  43. Pan, H.; Xie, Z.; Chen, G.; Su, J.; Zhuo, K.; Chen, Z.; Lin, J.; Feng, C.; Guo, Y. Dynamic compressive behavior of high-strength engineered geopolymer composites. J. Build. Eng. 2023, 80, 108036. [Google Scholar] [CrossRef]
  44. Su, J.-Y.; Chen, G.; Pan, H.-S.; Lin, J.-X.; Zhang, J.; Zhuo, K.-X.; Chen, Z.-B.; Guo, Y.-C. Rubber modified high strength-high ductility concrete: Effect of rubber replacement ratio and fiber length. Constr. Build. Mater. 2023, 404, 133243. [Google Scholar] [CrossRef]
  45. Chen, S.-J.; Liu, R.-A.; Huang, X.-Y.; Yang, Z.-M.; Lin, J.-X. PET particles modify strain hardening cementitious composites: An approach to introduce defects to enhance deformation capacity. Constr. Build. Mater. 2024, 447, 138064. [Google Scholar] [CrossRef]
  46. Chen, Z.-B.; Su, J.-Y.; Luo, R.-H.; Lin, J.-X.; Chen, X.-F.; Huang, P.-Y.; Guo, Y.-C. Experimental investigation on fracture behavior of rubberized engineered cementitious composites under thermo-mechanical loadings. Eng. Fract. Mech. 2025, 315, 110838. [Google Scholar] [CrossRef]
  47. Lin, J.-X.; He, G.-J.; Wu, J.-S.; Deng, W.-B.; Zhou, Z.-Y.; Guo, G.-S.; Sheng, C.; Xie, B.-X.; Guo, Y.-C. Mechanical performance of steel-PE hybrid fiber-reinforced SHAAC: A comparative study of two distinct hybridization approaches. J. Mater. Res. Technol. 2025, 35, 5637–5650. [Google Scholar] [CrossRef]
  48. MIIT. Standard Test Method for the Mechanical Properties of Ductile Fiber Reinforced Cementitious Composites; Building Materials Industry Press: Beijing, China, 2018. [Google Scholar]
  49. ASTM-C1437; Standard Test Method for Flow of Hydraulic Cement Mortar. ASTM International: West Conshohocken, PA, USA, 2013.
  50. ASTM-C469/C469M; Standard Test Method for Static Modulus of Elasticity and Poisson’s Ratio of Concrete in Compression. ASTM International: West Conshohocken, PA, USA, 2020.
  51. Yokota, H.; Rokugo, K.; Sakata, N. Recommendations for Design and Construction of High Performance Fiber Reinforced Cement Composite with Multiple Fine Cracks; Springer: Tokyo, Japan, 2007. [Google Scholar]
  52. Li, Z.; Zhou, J.; Leung, C.K.Y. Fiber distribution in strain-hardening cementitious composites (SHCC): Experimental investigation and its correlation with matrix flowability and tensile strength. Cem. Concr. Compos. 2025, 160, 106068. [Google Scholar] [CrossRef]
  53. Benazzouk, A.; Douzane, O.; Quéneudec, M. Transport of fluids in cement–rubber composites. Cem. Concr. Compos. 2004, 26, 21–29. [Google Scholar] [CrossRef]
  54. Abaza Osama, A.; Hussein Zaids, S. Flexural Behavior of Steel Fiber-Reinforced Rubberized Concrete. J. Mater. Civ. Eng. 2016, 28, 04015076. [Google Scholar] [CrossRef]
  55. Li Victor, C.; Leung Christopher, K.Y. Steady-State and Multiple Cracking of Short Random Fiber Composites. J. Eng. Mech. 1992, 118, 2246–2264. [Google Scholar] [CrossRef]
  56. Nematollahi, B.; Sanjayan, J.; Shaikh, F.U.A. Synthesis of heat and ambient cured one-part geopolymer mixes with different grades of sodium silicate. Ceram. Int. 2015, 41, 5696–5704. [Google Scholar] [CrossRef]
  57. Ohno, M. Green and Durable Geopolymer Composites for Sustainable Civil Infrastructure. Ph.D. Thesis, University of Michigan, Ann Arbor, MI, USA, 2017. [Google Scholar]
  58. Nematollahi, B.; Qiu, J.; Yang, E.-H.; Sanjayan, J. Micromechanics constitutive modelling and optimization of strain hardening geopolymer composite. Ceram. Int. 2017, 43, 5999–6007. [Google Scholar] [CrossRef]
  59. Ohno, M.; Li, V.C. An integrated design method of Engineered Geopolymer Composite. Cem. Concr. Compos. 2018, 88, 73–85. [Google Scholar] [CrossRef]
  60. Khan, S.U.; Ayub, T. PET Fiber–Reinforced Engineered Geopolymer and Cementitious Composites. J. Mater. Civ. Eng. 2022, 34, 15. [Google Scholar] [CrossRef]
  61. Zhong, H.; Poon, E.W.; Chen, K.; Zhang, M. Engineering properties of crumb rubber alkali-activated mortar reinforced with recycled steel fibres. J. Clean. Prod. 2019, 238, 117950. [Google Scholar] [CrossRef]
  62. Abd Allah Abd-Elaty, M.; Farouk Ghazy, M.; Hussein Khalifa, O. Mechanical and thermal properties of fibrous rubberized geopolymer mortar. Constr. Build. Mater. 2022, 354, 129192. [Google Scholar] [CrossRef]
  63. Huang, Z.; Liang, T.; Huang, B.; Zhou, Y.; Ye, J. Ultra-lightweight high ductility cement composite incorporated with low PE fiber and rubber powder. Constr. Build. Mater. 2021, 312, 125430. [Google Scholar] [CrossRef]
  64. Shi, X.; Park, P.; Rew, Y.; Huang, K.; Sim, C. Constitutive behaviors of steel fiber reinforced concrete under uniaxial compression and tension. Constr. Build. Mater. 2020, 233, 117316. [Google Scholar] [CrossRef]
  65. Alguhi, H.; Tomlinson, D. Experimental and analytical study of steel and chopped glass fibre reinforced concrete under compression. Constr. Build. Mater. 2024, 418, 135421. [Google Scholar] [CrossRef]
  66. Chen, G.; Zheng, D.-P.; Chen, Y.-W.; Lin, J.-X.; Lao, W.-J.; Guo, Y.-C.; Chen, Z.-B.; Lan, X.-W. Development of high performance geopolymer concrete with waste rubber and recycle steel fiber: A study on compressive behavior, carbon emissions and economical performance. Constr. Build. Mater. 2023, 393, 131988. [Google Scholar] [CrossRef]
  67. Malaiškienė, J.; Astrauskas, T.; Januševičius, T.; Kizinievič, O.; Kizinievič, V. Potential applications of rubber buffing dust and recovered crumb rubber in cement concrete. Results Eng. 2024, 24, 103266. [Google Scholar] [CrossRef]
  68. Xu, S.; Yuan, P.; Liu, J.; Pan, Z.; Liu, Z.; Su, Y.; Li, J.; Wu, C. Development and preliminary mix design of ultra-high-performance concrete based on geopolymer. Constr. Build. Mater. 2021, 308, 125110. [Google Scholar] [CrossRef]
  69. Wang, S.; Cheng, M.; Xie, M.; Yang, Y.; Liu, T.; Zhou, T.; Cen, Q.; Liu, Z.; Li, B. From waste to energy: Comprehensive understanding of the thermal-chemical utilization techniques for waste tire recycling. Renew. Sustain. Energy Rev. 2025, 211, 115354. [Google Scholar] [CrossRef]
  70. Peng, Z.; Xiong, Q.-X.; Zhou, X.; Gao, X.; Zhao, X.-Y.; Meng, Z.; Liu, Q.-F. A porosity-based mechanics model for studying crack evolution from ITZ to mortar matrix in concrete. Comput. Methods Appl. Mech. Eng. 2025, 444, 118085. [Google Scholar] [CrossRef]
  71. Cai, Y.; Xiong, B.; Zhao, B. Evolution of the interfacial transition zone of alkali-activated concrete with aging. Constr. Build. Mater. 2025, 489, 142364. [Google Scholar] [CrossRef]
  72. Sun, L.; Wang, X.; Zhang, C. Three-dimensional high fidelity mesoscale rapid modelling algorithm for concrete. Structures 2024, 70, 107561. [Google Scholar] [CrossRef]
  73. Kishore, K.; Tomar, R. Understanding the role of interfacial transition zone in cement paste and concrete. Mater. Today Proc. 2023, 80, 877–881. [Google Scholar] [CrossRef]
  74. Singh, P.; Singh, D.N.; Singh, A. Interfacial transition zone in rubberized concrete: A panacea for the extreme environmental conditions. Constr. Build. Mater. 2025, 469, 140477. [Google Scholar] [CrossRef]
Figure 1. SEM images of raw materials.
Buildings 15 02496 g001
Figure 2. Particle-size distributions.
Buildings 15 02496 g002
Figure 3. Dimensions of the specimens (mm).
Buildings 15 02496 g003
Figure 4. Specimen preparation process.
Buildings 15 02496 g004
Figure 5. Flowability testing setup.
Buildings 15 02496 g005
Figure 6. Test setup of uniaxial compression test.
Buildings 15 02496 g006
Figure 7. Test setup of uniaxial tensile test.
Buildings 15 02496 g007
Figure 8. Flowability of fresh R-EGC paste.
Buildings 15 02496 g008
Figure 9. The typical σ–δ relation for ECCs (as cited in the literature [55]).
Buildings 15 02496 g009
Figure 12. Compressive stress–strain curves of the R-EGC specimens with different A/B ratios.
Buildings 15 02496 g012
Figure 13. Effect of A/B ratio on characteristic parameters of direct compressive test.
Buildings 15 02496 g013
Figure 14. Fiber failure mode.
Buildings 15 02496 g014
Figure 15. Failure progress of R-EGC specimens with different A/B ratios.
Buildings 15 02496 g015
Figure 16. Average crack width and crack density of typical R-EGC with different A/B ratios under tensile loads. (a) Average crack width, C w . (b) Average crack density, C d .
Buildings 15 02496 g016
Figure 17. Tensile stress–strain curves of R-EGC specimens with different A/B ratios.
Buildings 15 02496 g017
Figure 18. Effect of A/B ratio on characteristic parameters of direct tensile test. (a) Ultimate tensile strength. (b) Ultimate tensile strain. (c) Initial cracking strength. (d) Initial cracking strain.
Buildings 15 02496 g018
Figure 19. Application scenarios of R-EGC.
Buildings 15 02496 g019
Figure 20. Interfacial transition zones (ITZ) of the R-EGC specimens. (a) ITZ of the R-0.1. (b) ITZ of the R-0.2. (c) ITZ of the R-0.3.
Buildings 15 02496 g020
Table 1. Chemical composition of FA and GGBS.
CompositionFAGGBS
wt%
MgO1.016.01
SiO25434.5
Al2O331.217.7
CaO4.0134
Fe2O34.161.03
SO32.21.64
TiO21.13/
other2.375.12
Table 2. Physical properties of FA and GGBS.
PropertiesFAGGBS
Moisture content (%)0.50.45
Loss on ignition (%)4.60.84
Specific surface area (m2/kg)1835429
Density (g/cm3)2.33.1
Table 3. Physical and mechanical properties of PE fibers.
Fiber
Type
Length
(mm)
Diameter
(μm)
Modulus of Elasticity
(GPa)
Tensile Strength
(MPa)
Density
(g/cm3)
Elongation
(%)
PE182411630000.973
Table 4. Groups and mix proportions (kg/m3).
GroupRPBinderActivatorWaterBaCl2PE
FAGGBS
R-0.151.8971.2242.8486.0129.612.114.6
R-0.2103.5
R-0.3155.3
Table 5. Compressive test results of R-EGC specimens.
SpecimenCompressive Strength (MPa)Peak Strain (%)Elastic Modulus (GPa)
R-0.135.3 (3.02)0.66 (0.13)7.52 (0.18)
R-0.231.2 (1.12)0.72 (0.04)5.87 (0.37)
R-0.328.4 (1.98)0.66 (0.07)7.09 (0.51)
Note: Values in parentheses represent the standard deviation obtained from tests on three specimens.
Table 6. Tensile test results of R-EGC specimens.
GroupUltimate Tensile Strength (MPa)Ultimate Tensile Strain (%)Initial Cracking Strength (MPa)Initial Cracking Strain (%)
R-0.13.54 (0.63)7.09 (0.04)1.04 (0.29)0.04 (0.03)
R-0.23.82 (0.20)8.83 (0.28)1.17 (0.49)0.08 (0.13)
R-0.33.96 (0.52)7.23 (0.12)0.98 (0.26)0.03 (0.03)
Table 7. Cost of materials.
MaterialsCost (USD/ton)
FA70
GGBS77
RPs47
Water0.5
Alkali activator96.2
PE fibers30,000
Table 8. Cost of R-EGCs.
GroupCost (USD/m3)
R-0.1573.93
R-0.2576.36
R-0.3578.79
Disclaimer/Publisher’s Note: The statements, opinions and data contained in all publications are solely those of the individual author(s) and contributor(s) and not of MDPI and/or the editor(s). MDPI and/or the editor(s) disclaim responsibility for any injury to people or property resulting from any ideas, methods, instructions or products referred to in the content.

