Abstract
This paper investigates the shear performance of shear lugs commonly used in nuclear equipment foundations. A total of six groups of H-shaped steel shear lug specimens, six groups of angle steel shear lug specimens, and eight groups of steel plate shear lug specimens are designed and tested under horizontal shear loading. The failure modes, shear capacities, and deformation characteristics of the specimens are systematically examined. Furthermore, the influence of the embedment depth of the shear lug and the distance from the shear lug to the concrete edge on the shear performance of specimens is thoroughly analyzed. Based on the test results, equations for calculating the shear capacity of shear lugs are proposed. The result indicates that the failure modes of the three types of specimens under shear loading mainly show concrete shear breakout failure, and the changes in the embedment depth and concrete edge distance have a large effect on the shear capacity and ductility of the specimen. The proposed equations show good agreement with the test results, which can provide a theoretical foundation for the design of the shear lugs used in nuclear engineering.
1. Introduction
As a clean and efficient form of energy, nuclear energy has become an important strategic choice for countries around the world to promote a low-carbon economy and achieve sustainable development [1,2,3]. With the advancement of nuclear energy and the continuous increase in the nuclear power installed capacity, the civil structures of nuclear power plants are facing increasingly stringent design requirements [4,5]. Under both normal and accidental operating conditions, nuclear power equipment must be safely and reliably anchored to the equipment foundation. This requirement is critical to ensuring the safety of nuclear reactors and the stable operation of nuclear power systems. During seismic events, nuclear power equipment is subjected to both horizontal and vertical seismic loads. These loads will be transferred to the equipment foundation through anchor bolts and shear lugs welded at the equipment base [6]. For safety considerations, the anchor bolt is not designed to resist shear forces, while the shear lug is typically employed to replace it in resisting shear forces [7]. Therefore, the shear performance of the shear lug plays a vital role in ensuring the safe and stable operation of nuclear power equipment under extreme conditions such as earthquakes.
The shear lugs commonly used in nuclear engineering are typically fabricated from shaped steel, including H-shaped steel, angle steel, and steel plates. These shaped steels are also widely employed in conventional structures, such as composite structures and fabricated structures [8,9,10,11], where their main function is to act as connectors to maintain the integrity and stability of the structure or member. In such applications, they are generally referred to as “shear connectors” and are expected to provide both shear-resisting and tensile-resisting functions. However, in nuclear equipment foundations, these shaped steels primarily serve a shear-resisting function and are commonly referred to as “shear lugs” in American design codes for nuclear power plants [12]. So far, numerous studies have been conducted to investigate the failure modes, failure mechanisms, and calculation methods for various types of shear connectors used in conventional structures [13,14,15,16,17,18,19,20,21]. However, relatively limited attention has been given to the shear performance of the shear lugs used in nuclear equipment foundations. Compared with conventional structures, the nuclear equipment foundation is characterized by larger dimensions, higher concrete strength, and greater shear lug strength. Therefore, although existing studies on shear connectors offer valuable insights, they are not fully applicable to the design of shear lugs used in nuclear equipment foundations. Moreover, under lateral loading conditions, the failure modes of nuclear equipment foundations configured with shear lugs mainly include concrete shear breakout failure, concrete local compression failure, and shear lug failure. For the latter two failure modes, relatively well-established capacity calculation methods are currently available. However, there are few studies on the calculation methods used to determine the concrete shear breakout capacity of shear lugs. The American code ACI 318-19 [22] adopts the design equations for the shear breakout capacity of anchors to calculate the shear breakout capacity of shear lugs. However, this method is relatively simple and fails to account for the critical factors that influence the shear capacity of the shear lugs. Given the increasing design demands on the bearing capacity of nuclear equipment foundations, it is necessary to develop more comprehensive and applicable equations for calculating the shear capacity of the shear lugs used in nuclear equipment foundations.
In this paper, horizontal loading tests are conducted on the shear lugs commonly used in nuclear equipment foundations, including six groups of H-shaped steel shear lug specimens, six groups of angle steel shear lug specimens, and eight groups of steel plate shear lug specimens. The failure modes, shear capacities, and deformation characteristics of specimens are systematically investigated. Furthermore, the influence of the embedment depth of the shear lug and the distance from the shear lug to the concrete edge on the failure behavior of specimens is thoroughly analyzed. Finally, the equation for calculating the shear breakout capacity of the shear lugs used in nuclear equipment foundations is proposed, and its accuracy is verified through a comparison with the test results. The main contributions of this study are twofold. First, it presents experimental data on the shear performance of the shear lugs commonly used in nuclear equipment foundations and identifies the key factors governing their shear resistance. Second, it refines the simplified method for calculating the concrete shear breakout capacity of shear lugs in existing design codes, thereby improving the accuracy and reliability of the design equations.
2. Specimen Design
This study includes a total of three groups of test conditions. For research purposes, the design parameters for each group are based on relevant specifications from actual nuclear power engineering, with slight adjustments made to accommodate the test conditions. In general, the designed specimens can reflect the equipment foundation in the actual project.
2.1. H-Shaped Steel Shear Lug Specimen
A total of six H-shaped steel shear lug specimens are designed in this test group. The primary variables are the embedment depth of the shear lug () and the distance from the shear lug to the concrete edge (). To prevent concrete breakout failure, two specimen sizes are designed based on different concrete edge distances: (a) For = 150 mm and = 250 mm, the specimen dimensions are 900 mm × 700 mm × 750 mm (length × width × thickness); (b) For = 375 mm, the specimen dimension is 900 mm × 900 mm × 750 mm. The main parameters of the specimens are summarized in Table 1. The specimen naming convention follows the format “H-Embedment depth-Edge distance”. The cross-sectional dimensions of the H-shaped steel used for all specimens are H150 × 150 × 16 × 16 (mm). Additionally, the strength grade of the steel is Q355B, and its yield strength and ultimate tensile strength measured by uniaxial tensile test are 403.22 MPa and 596.03 MPa, respectively. The strength grade of concrete is C40, and its cubic compressive strength () is tested according to the Chinese code (GB 50010-2010) [23]. Table 1 also presents the measured concrete compressive strength for each specimen.

Table 1.
Parameters of H-shaped steel shear lug specimens.
All specimens in this test group are provided with both surface and bottom rebars, and the rebar configuration is kept consistent across all specimens. The rebar configuration for the H-shaped steel shear lug specimen is shown in Figure 1. Specifically, the surface and bottom rebars are lapped at the midspan of the specimen, with a lap length of 300 mm; the stirrups adopt a double-leg configuration with a spacing of 150 mm. To facilitate load application, a steel plate measuring 200 mm × 200 mm × 80 mm is welded to the top of the H-shaped steel shear lug. In addition, the surface and bottom rebars are HRB400 steel with a diameter of 12 mm, while the stirrups are HPB300 steel with a diameter of 8 mm.
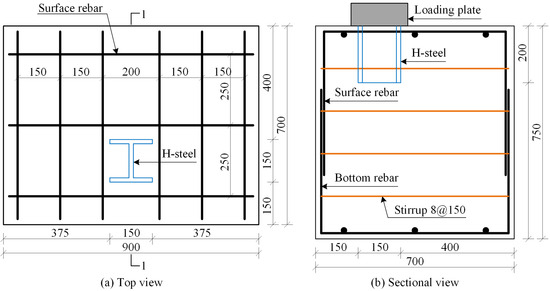
Figure 1.
Rebar configuration of the H-shaped steel shear lug specimen.
2.2. Angle Steel Shear Lug Specimen
In this test group, a total of six angle steel shear lug specimens are designed. The primary variables include the leg length of the angle steel () and the distance from the shear lug to the concrete edge (). All specimens have identical dimensions of 900 mm × 700 mm × 750 mm (length × width × thickness). The main parameters of the specimens are summarized in Table 2. The specimen naming convention follows the format “L-Leg length-Edge distance”. The equal-leg angle steel is used for all specimens, with types including L100 × 10, L125 × 12, and L160 × 16, each with a length of 150 mm. Additionally, the strength grade of the steel is Q345, and its measured yield strength and ultimate tensile strength are 373.71 MPa and 555.3 MPa, respectively. The measured cube compressive strengths of the concrete used for each specimen are listed in Table 2.

Table 2.
Parameters of angle steel shear lug specimens.
Figure 2 shows the rebar configuration of the angle steel shear lug specimen, which is consistent with that of the H-shaped steel shear lug specimens.
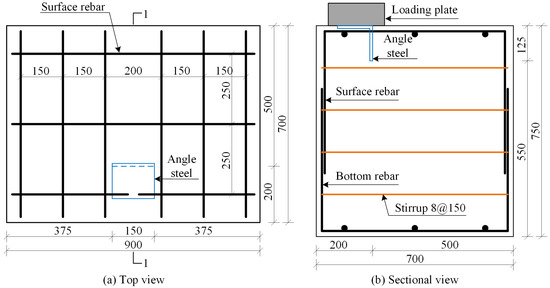
Figure 2.
Rebar configuration of the angle steel shear lug specimen.
2.3. Steel Plate Shear Lug Specimen
A total of eight steel plate shear lug specimens are designed in this test group. The primary variables include the height-to-thickness ratio of the steel plates (, which actually reflects the embedment depth of the steel plate) and the distance from the steel plate to the concrete edge (). All specimens have identical dimensions of 900 mm × 700 mm × 750 mm (length × width × thickness). The main parameters of the specimens are listed in Table 3. The specimen naming convention follows the format “S-Height-to-thickness ratio-Edge distance”. The steel plate shear lugs have a length of 150 mm and a thickness of 25 mm. Additionally, the strength grade of the steel is Q345, and its measured yield strength and ultimate tensile strength are 380.63 MPa and 576.49 MPa, respectively. The measured cube compressive strengths of the concrete used for each specimen are presented in Table 3.

Table 3.
Parameters of steel plate shear lug specimens.
Figure 3 shows the rebar configuration of the steel plates shear lug specimen, which is also consistent with that of the H-shaped steel shear lug specimens.
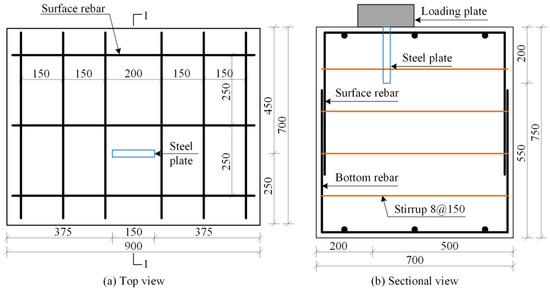
Figure 3.
Rebar configuration of the steel plate shear lug specimen.
3. Test Programme
Figure 4 shows the schematic diagram of the test loading setup. The base of the testing machine (actuator) is fixed to the reaction wall, while its top is connected to a load transfer device. The load transfer device is connected to the loading plate on top of the specimen through two steel plates and four bolts, ensuring effective load transmission. To facilitate loading, the test is conducted by applying the tensile load in the horizontal direction. In practical engineering, the base of nuclear equipment foundations is fully anchored to the structural slab, with displacements in all three directions at the bottom completely restrained. To restrict the horizontal displacement of the specimen, two hydraulic jacks are placed on the side near the testing machine, and a steel beam is arranged on the opposite side to provide lateral restraint. In addition, to prevent the rotation of the specimen during loading, two hydraulic jacks are symmetrically arranged on the top surface of the specimen to provide vertical constraint. Through the above loading setup, the actual boundary condition of the equipment foundation can be well reflected, and the eccentricity of the specimen can be effectively avoided during the loading process.
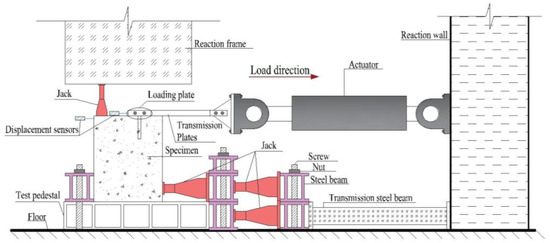
Figure 4.
Test loading setup.
The test is performed using a load-controlled loading manner with a loading rate of 1 kN/s. During the test, the data collected include the horizontal load, the displacement of the H-shaped steel, and the overall displacement of the specimen. The arrangement of measurement points is also shown in Figure 4. Specifically, the horizontal load is obtained from the load cell integrated into the testing machine; the displacement of the shear lug is measured using two displacement sensors mounted on the loading plate at the top of the specimen; and the overall displacement of the specimen is recorded by two displacement sensors symmetrically placed at the rear of the specimen.
4. Failure Modes of Specimens
4.1. Failure Modes of H-Shaped Steel Shear Lug Specimens
This test group consists of three types of specimens with = 150 mm, 250 mm, and 375 mm. For the specimens with small concrete edge distances ( = 150 mm and = 250 mm), the failure process and failure modes are similar. Taking specimen H-200-150 as an example, the failure process is summarized as follows: In the early loading stage, the specimen remains elastic without significant phenomena observed. When the load reaches approximately 230 kN, concrete splitting cracks appear along the longitudinal axis of the specimen, and the concrete begins to separate from the rear flange of the H-shaped steel. As the load increases further, shear diagonal cracks gradually appear in front of the H-shaped steel. When the load reaches 275 kN, the concrete in front of the H-shaped steel is crushed, and the shear diagonal crack widens significantly and extends to the side of the specimen. Thereafter, the displacement grows rapidly, and the specimen loses its bearing capacity.
The typical failure modes of H-shaped steel shear lug specimens with small concrete edge distances are shown in Figure 5. The test phenomena indicate that these specimens mainly exhibit concrete shear breakout failure. The concrete in front of the H-shaped steel forms a distinct cone-shaped failure, with diagonal cracks starting from the edge of the front flange and gradually extending toward the edge of the specimen, eventually reaching the front of the specimen. In contrast, the concrete behind the H-shaped steel remains largely intact, with only splitting cracks observed along the longitudinal axis of the specimen. These cracks are constrained by the surface rebar and do not extend to the sides of the specimen. Additionally, a small amount of concrete spalling is observed on the front of the specimen.
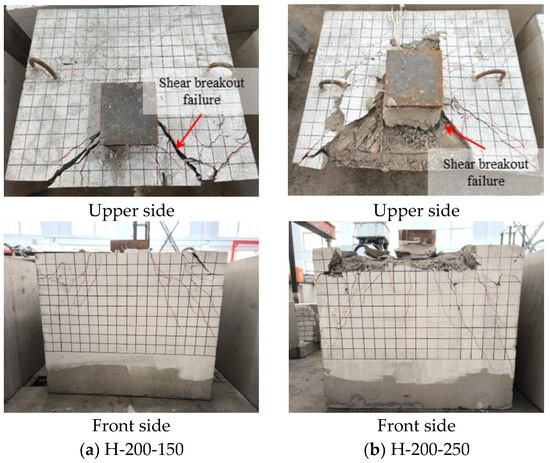
Figure 5.
Failure modes of H-shaped steel shear lug specimens with small concrete edge distances.
Figure 6 shows the typical failure modes of H-shaped steel shear lugs with a large concrete edge distance ( = 375 mm). For these specimens, the failure process is illustrated using specimen H-200-375 as an example. When the applied load reaches 270 kN, the first crack appears near the rear flange of the H-shaped steel. As the load increases, this crack gradually widens, and additional shear diagonal cracks and splitting cracks successively develop on the surface of the specimen. When the load reaches 480 kN, the specimen suddenly loses its stiffness and bearing capacity, exhibiting a significant brittle failure behavior. The test results show that when the concrete edge distance is large, the failure mode of the specimen varies with the embedment depth of the H-shaped steel. When the embedment depth is small ( = 100 mm), the specimens are mainly subjected to concrete local compression failure, which manifests itself as the crushing of the concrete near the shear lug, as shown in Figure 6a. In contrast, when the embedment depth is large ( = 200 mm), the specimen exhibits a mixed failure mode. Specifically, both local compression failure and shear breakout failure characteristics are observed, with the latter being the dominant failure mode.
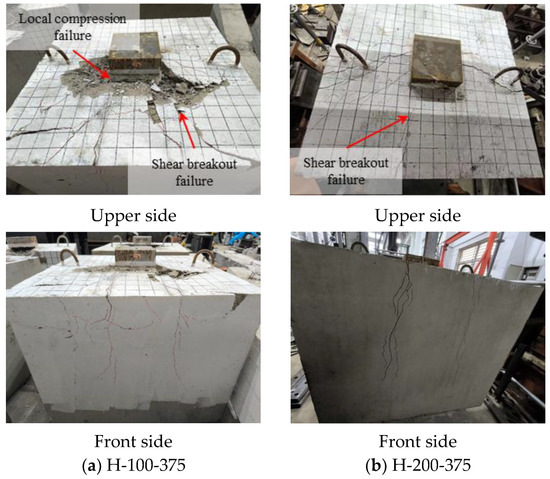
Figure 6.
Failure modes of H-shaped steel shear lug specimens with large concrete edge distances.
4.2. Failure Modes of Angle Steel Shear Lug Specimens
In this test group, all specimens exhibit similar failure processes throughout the loading process. Taking specimen L-125-200 as an example, the failure process is summarized as follows. When the applied load reaches approximately 127 kN, the first shear diagonal crack appears near the angle steel. As the load increases, this crack gradually widens and extends toward the front side of the specimen. Simultaneously, multiple diagonal cracks develop around it, and the stiffness of the specimen gradually decreases. When the load reaches 140 kN, separation initiates between the rear flange of the angle steel and the surrounding concrete. At a load of 195 kN, the specimen attains its ultimate bearing capacity, after which the displacement increases rapidly, the concrete in front of the loading plate spalls off, and the load gradually decreases.
For specimens with small concrete edge distances ( = 200 mm and = 250 mm), the failure mode is characterized by concrete shear breakout failure. The concrete in front of the angle steel experiences severe crushing, and diagonal cracks initiate at the angle steel, gradually propagating along the shear cone path toward the specimen edge and eventually extending to the front side. For specimens with a leg length of = 100 mm, only two major diagonal cracks form on the surface, accompanied by the cone-shaped spalling of the concrete on the front side. In this case, the crack does not propagate significantly toward the bottom of the specimen. However, when the leg length increases to = 125 mm and = 160 mm, multiple diagonal cracks develop in addition to the major crack. The extent of the cone failure of the concrete is significantly increased, and the concrete cracks on the front side extend much deeper. Figure 7 shows the typical failure modes of angle steel shear lug specimens with small concrete edge distances.
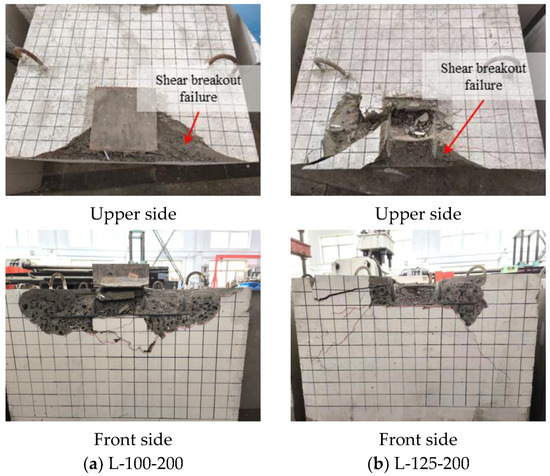
Figure 7.
Failure modes of angle steel shear lug specimens with small edge distances.
For specimens with large concrete edge distances ( = 300 mm and = 350 mm), the failure mode exhibits characteristics of both concrete local compression failure and concrete shear breakout failure, with the latter ultimately dominating the failure process. Compared to specimens with small concrete edge distances, the shear cone in these specimens is more extensive. Additionally, for specimens with three different leg lengths, the front side of the concrete displays significant cone-shaped spalling. Figure 8 presents the typical failure modes of angle steel shear lug specimens with large concrete edge distances.
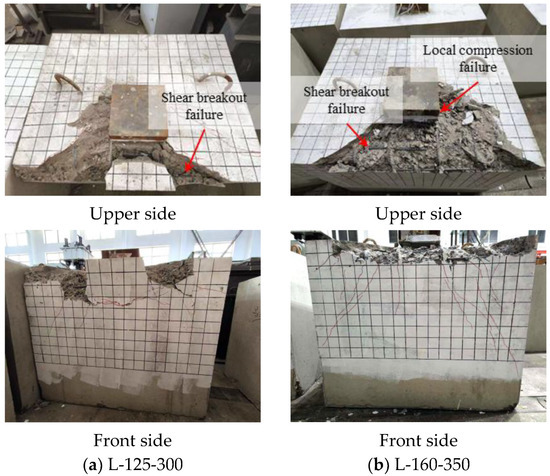
Figure 8.
Failure modes of angle steel shear lug specimens with large edge distances.
4.3. Failure Modes of Steel Plate Shear Lug Specimens
In this test group, the failure process of the specimens is similar. Taking the specimen S-4-250 as an example, the failure process is summarized as follows. When the load increases to approximately 175 kN, the first shear diagonal crack appears near the steel plate. As the load increases, this crack progressively widens and propagates toward the front side of the specimen, accompanied by the development of additional cracks. At this stage, the overall stiffness of the specimen begins to decrease. After the load reaches 180 kN, noticeable separation occurs between the rear flange of the steel plate and the surrounding concrete. When the load further increases to 227 kN, the specimen reaches its ultimate bearing capacity. Thereafter, the displacement rises rapidly, concrete in front of the loading plate begins to spall off, and the load gradually decreases.
For specimens with small concrete edge distances ( = 250 mm), the failure mode is characterized by concrete shear breakout failure. Cone-shaped spalling is observed on the concrete surface in front of the steel plate, where diagonal cracks initiate and propagate toward the concrete edge, eventually reaching the front side of the specimen. For the specimen with a height-to-thickness ratio of = 2, only two major diagonal cracks appear on its surface, and these cracks do not extend to the bottom of the specimen. In the case of the specimen with = 4, in addition to the major cracks, several parallel cracks also develop. In specimens with = 6 and = 8, the diagonal cracks on their surfaces are more numerous and denser than those of specimens with = 4, and some of them even extend to the diagonal rear of the loading plate. These cracks show a tendency to extend towards the bottom of the specimen, and the larger is, the greater the depth of extension. Moreover, these specimens form a distinctly conical concrete block on their front side, but no spalling occurs. The typical failure mode of steel plate shear lug specimens with small concrete edge distances is shown in Figure 9.
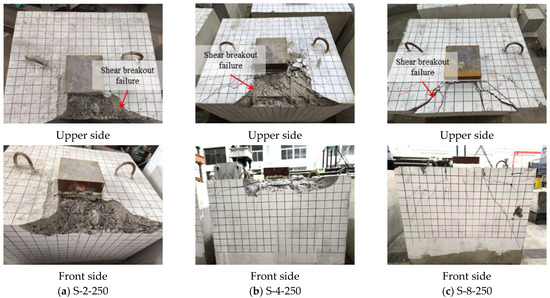
Figure 9.
Failure modes of steel plate shear lug specimens with small concrete edge distances.
For specimens with large concrete edge distances, the S-2-350 specimen (characterized by small embedment depth) exhibits concrete local compression failure. In contrast, the remaining specimens primarily experience concrete shear breakout failure. Additionally, the crack development and failure modes with different are consistent with those observed in specimens with small concrete edge distances. Figure 10 illustrates the typical failure modes of steel plate shear lug specimens with large concrete edge distances.
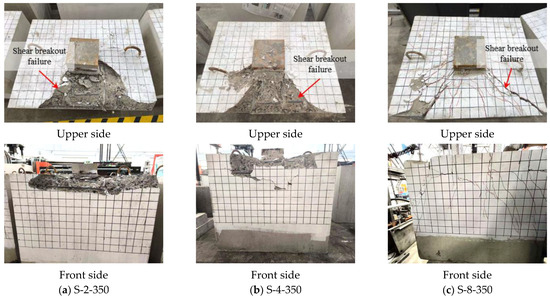
Figure 10.
Failure modes of steel plate shear lug specimens with large concrete edge distances.
5. Test Results and Analysis
5.1. Test Group for H-Shaped Steel Shear Lug Specimens
5.1.1. Test Results
Table 4 summarizes the test results of H-shaped steel shear lug specimens, and Figure 11 presents the corresponding load–displacement curves. For specimens with an embedment depth of = 100 mm, brittle failure is observed regardless of the edge distance. For specimens with = 200 mm, those with edge distances of = 150 mm and = 250 mm exhibit a gradual reduction in shear capacity after reaching the peak load, which indicates that the specimens have a certain degree of ductility. However, when = 375 mm, the failure of the specimens involves the local crushing of concrete. Therefore, the specimens experience a rapid loss of stiffness and shear capacity following the peak load, which shows obvious brittle failure characteristics.

Table 4.
Test results of H-shaped steel shear lug specimens.
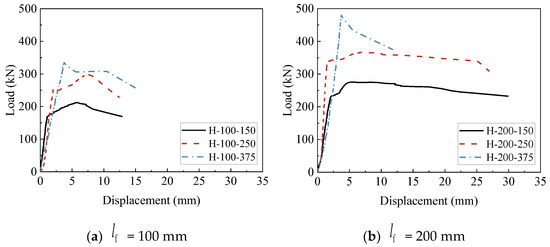
Figure 11.
Load–displacement curves of H-shaped steel shear lug specimens.
5.1.2. Analysis of Influencing Factors
(1) Effect of embedment depth
Table 5 presents the comparison of the shear performance of H-shaped steel shear lug specimens with varying embedment depths. It can be seen that the shear capacity of the specimen increases with the increase in the embedment depth of the shear lug. Under the same concrete edge distance, increasing the embedment depth from 100 mm to 200 mm can improve the shear capacity of the specimens by more than 23% (43% at = 375 mm). However, this increase in embedment depth is accompanied by a slight reduction in the deformation capacity of the specimens.

Table 5.
Comparison of test results of H-shaped steel shear lug specimens with different embedment depths.
(2) Effect of concrete edge distance
Table 6 presents a comparison of the shear performance of H-shaped steel shear lug specimens with different concrete edge distances. The results show that at the same embedment depth, the shear capacity of the specimens improves significantly with the increase in the concrete edge distance. Compared to the specimen with = 150 mm, all other specimens exhibit an increase in shear capacity of more than 33%. However, the peak displacement of the specimens shows a tendency to increase and then decrease as the concrete edge distance increases. This is mainly due to the fact that the large concrete edge distance tends to lead to local concrete crushing, which reduces the deformation capacity of the specimen. In addition, in terms of the failure modes of the specimen, when = 150 mm and = 250 mm, concrete cracks develop and extend towards the front side of the specimens after the concrete enters the plastic stage. As the concrete gradually loses its bearing capacity, the shear force is increasingly resisted by the rebars. However, the specimen with = 375 mm exhibits concrete local compression failure, characterized by significant concrete crushing in front of the H-shaped steel. In this case, the shear capacity of the specimen is mainly controlled by the compressive strength of the concrete, and the contribution of the rebar is relatively small.

Table 6.
Comparison of test results of H-shaped steel shear lug specimens with different concrete edge distances.
5.2. Test Group for Angle Steel Shear Lug Specimens
5.2.1. Test Results
Table 7 summarizes the test results of angle steel shear lug specimens, and Figure 12 presents the corresponding load–displacement curves. The results show that all the specimens except specimens L-100-300 display an extended plastic deformation phase throughout the loading process. After reaching peak load, these specimens show a gradual decrease in shear capacity with increasing displacement, reflecting favorable ductility. In contrast, the specimen L-100-300 exhibits a rapid decrease in stiffness and shear capacity after reaching the peak load, which exhibits pronounced brittleness.

Table 7.
Test results of angle steel shear lug specimens.
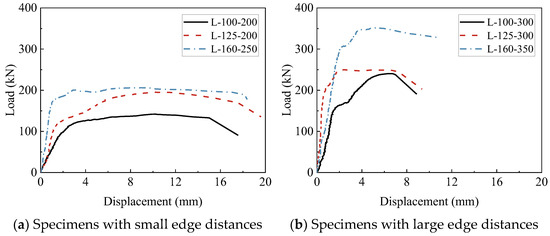
Figure 12.
Load–displacement curves of angle steel shear lug specimens.
5.2.2. Analysis of Influencing Factors
(1) Effect of angle leg length
Table 8 presents a comparison of the shear performance of angle steel shear lug specimens with different leg lengths. Compared to the specimen with = 100 mm, all other specimens exhibit a shear capacity increase of more than 35%, except for specimen L-125-300, which shows only a modest increase of approximately 4%. Meanwhile, the peak displacement of the specimen generally decreases to varying extents as the leg length increases. In addition, the test results indicate that all specimens mainly exhibit concrete shear breakout failure, regardless of leg length. Therefore, the leg length has a limited influence on the failure mode of angle steel shear lug specimens.

Table 8.
Comparison of test results of angle steel specimens with different leg lengths.
(2) Effect of concrete edge distances
Table 9 shows a comparison of the shear performance of angle steel shear lug specimens with different concrete edge distances. As shown in Table 9, with the increase in the concrete edge distance, the shear capacity of the specimens improves, whereas their deformability significantly decreases. Compared to the specimens with = 200 mm, the specimens with = 300 mm show an increase in shear capacity of about 28% to 71% and a reduction in peak displacement of about 35% to 72%. Furthermore, the test phenomenon indicates that the concrete edge distance has a certain effect on the failure mode of the specimens. At the small concrete edge distance, the failure mode of the specimens is characterized by concrete shear breakout failure. As the concrete edge distance increases, the failure mode of the specimens shows the composite characteristics of concrete local compression failure and concrete shear breakout failure.

Table 9.
Comparison of test results of angle steel shear lug specimens with different concrete edge distances.
5.3. Test Group for Steel Plate Shear Lug Specimens
5.3.1. Test Results
Table 10 summarizes the test results of the steel plate shear lug specimens, and Figure 13 presents the corresponding load–displacement curves. For specimens with height-to-thickness ratios of = 2 and = 4, both the stiffness and shear capacity drop sharply after reaching their peak load, which shows significant brittle failure characteristics. In contrast, the plastic deformation capacity of the specimens with = 6 and = 8 is significantly improved. After reaching the peak load, the shear capacity of the specimens gradually decreases with the increase in displacement, which exhibits obvious ductile failure characteristics.

Table 10.
Test results of steel plate shear lug specimens.
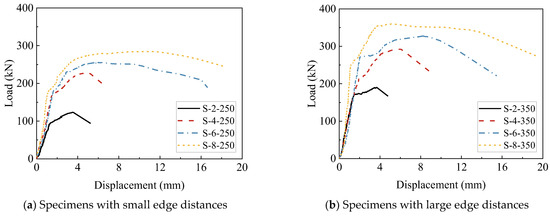
Figure 13.
Load–displacement curves of steel plate shear lug specimens.
5.3.2. Analysis of Influencing Factors
(1) Effect of height-to-thickness ratios of steel plate
Table 11 shows a comparison of the shear performance of steel plate shear lug specimens with different height-to-thickness ratios. It can be seen that the shear performance of the specimens improves significantly with the increase in the height-to-thickness ratio. Compared to the specimen with = 2, all other specimens exhibit an increase in shear capacity of more than 53% (130% at = 8) and an increase in peak displacement of over 40% (222% at = 8). These results indicate that the height-to-thickness ratio is a key factor that affects the shear performance of the steel plate shear lug specimen. Moreover, according to the failure phenomena and Figure 13, it can be seen that regardless of the concrete edge distance, specimens with a small height-to-thickness ratio exhibit brittle failure. As the height-to-thickness ratio increases, the failure mode gradually transitions from brittle to ductile. Therefore, the deformation capacity of the specimens generally shows an increasing trend with increasing height-to-thickness ratio.

Table 11.
Comparison of test results of steel plate shear lug specimens with different height-to-thickness ratios.
(2) Effect of concrete edge distances
Table 12 presents a comparison of the shear performance of steel plate shear lug specimens with different concrete edge distances. Under the same height-to-thickness ratio, the shear capacity of the specimen with = 350 mm is improved by about 26.47% to 54.2%, compared to that of the specimen with = 250 mm. Furthermore, the peak displacement of the specimens also increases as the concrete edge distance increases, except for the specimens with = 8. In terms of failure mode, specimens with small concrete edge distances exhibit concrete shear breakout failure, regardless of the embedment depth. In contrast, specimens with large concrete edge distances and small embedment depths tend to undergo concrete local compression failure.

Table 12.
Comparison of test results of steel plate shear lug specimens with different concrete edge distances.
6. Calculation of Concrete Shear Breakout Capacity of Shear Lugs
The experimental results presented in this study indicate that equipment foundation specimens equipped with shear lugs primarily exhibit concrete shear breakout failure under horizontal loading, while the shear lugs do not fail. Therefore, this paper focuses on the method used to calculate the concrete shear breakout capacity of the shear lug. Given the similarity between the concrete shear breakout failure modes of the shear lug and the anchor, the ACI 318-19 code [22] directly adopts the anchor-based method to estimate the concrete shear breakout capacity of the shear lug. However, this method is relatively simple and neglects several critical factors that influence the shear capacity of the shear lug. In the following, the ACI 318-19 method is briefly introduced, followed by a discussion of the modified method proposed in this study for calculating the concrete shear breakout capacity of the shear lug.
6.1. Method Recommended in the ACI 318-19 Code
The ACI 318-19 code adopts the following equation for calculating the concrete shear breakout capacity of a single shear lug:
where is the basic breakout strength of a single shear lug; is the projected area of concrete cone of a single shear lug; is the idealized projected area; is the breakout edge effect factor; is the breakout cracking factor; and is the breakout thickness factor.
In Equation (1), is calculated according to Figure 14. In Figure 14, is the width of the shear lug, is the effective embedment depth of the shear lug, and the effective area of the shear lug () needs to be deducted when calculating . The term in Equation (1) is calculated using the following equation:
where is the cylindrical compressive strength of concrete, which shall not exceed 10,000 psi (approximately 68.95 MPa) for cast-in shear lugs and 8000 psi (approximately 55.16 MPa) for post-installed shear lugs, in accordance with the ACI 318-19 code; is the distance of the single lug from the concrete edge.
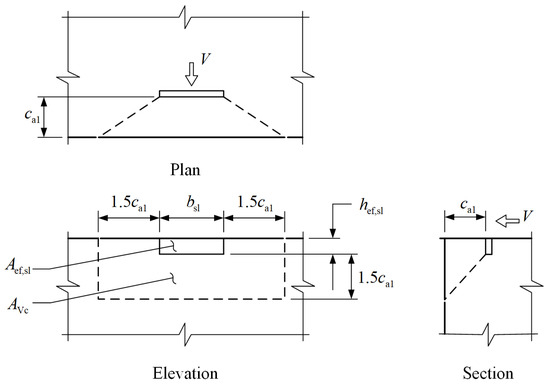
Figure 14.
Schematic diagram for the calculation of AVc.
Table 13 presents a comparison between the concrete shear breakout capacities of the shear lug calculated using Equation (2) and the test results (denoted as ) obtained in this paper. It can be seen that the capacities predicted by Equation (2) are significantly lower than the test values. This indicates that the concrete shear breakout capacity of the shear lug calculated according to the ACI 318-19 code is highly conservative.

Table 13.
Comparison between the calculated results based on the equation in ACI 318-19 code and the test results.
6.2. Method Proposed in This Paper
From a mechanical perspective, the concrete shear breakout capacity of the shear lug is influenced not only by the concrete edge distance, but also by lots of variables such as the width, thickness, and length of the shear lug, as well as the contact area between the shear lug and concrete. However, these parameters are not accounted for in Equation (2), resulting in a highly conservative prediction. Therefore, a new equation needs to be developed for predicting the concrete shear breakout capacity of the shear lug. In this study, this is achieved by modifying the equation of the anchor provided in the ACI 318-19 code.
In the ACI 318-19 code, the equation for predicting the basic concrete shear breakout capacity of a single anchor is as follows:
where is the load-bearing length of the anchor for shear; is the diameter of the anchor. The concrete shear breakout failure of a single anchor is shown in Figure 15a.
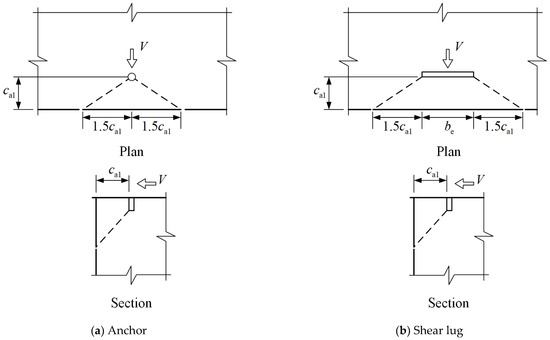
Figure 15.
Schematic diagram of concrete shear breakout failure for the anchor and shear lug.
In Equation (3), the term represents the length to diameter ratio of the anchor, which reflects the effect of the stiffness of the anchor. Equation (3) can be rewritten in the following form:
in which
where is the cone failure angle, which is taken as = according to the ACI 318-19 code.
In Equation (4), the term can be viewed as the projected area of the concrete breakout surface resulting from the loaded anchor, as shown in Figure 15a. By replacing in Equation (4) with (which represents the projected area of the concrete breakout surface resulting from the loaded shear lug, as shown in Figure 15b), the equation for evaluating the basic concrete shear breakout capacity of the shear lug can be obtained as follows:
where y is a coefficient determined by regression using test data; and are the equivalent thickness and width of the shear lug based on the principle of equal moments of inertia, respectively, and the equivalent way of the H-shaped steel shear lug is shown in Figure 16.
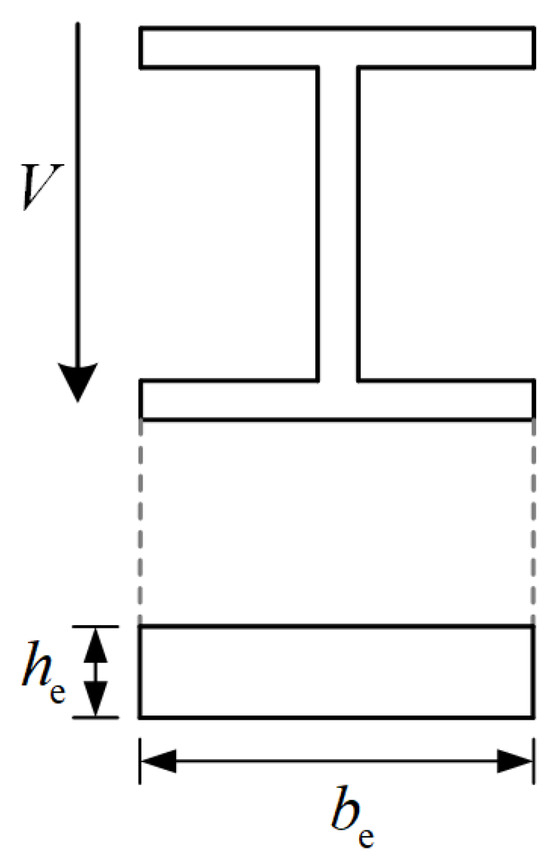
Figure 16.
Equivalent way of the H-shaped steel shear lug.
To determine the value of , the least squares method is used to perform a regression analysis on the test results, yielding . It should be noted that this regression provides the best statistical fit in the sense of the mean, thereby validating the rationality of the proposed equation. Table 14 summarizes the comparison between the capacities calculated using Equation (6) (i.e., ) and the test results. Meanwhile, Figure 17 illustrates the comparison between the calculated results and the test results. The mean and coefficient of variation of the ratio between the calculated results and test results are and , respectively, indicating that the proposed equation has a high accuracy.

Table 14.
Comparison between the calculated results based on the proposed equation and the test results.
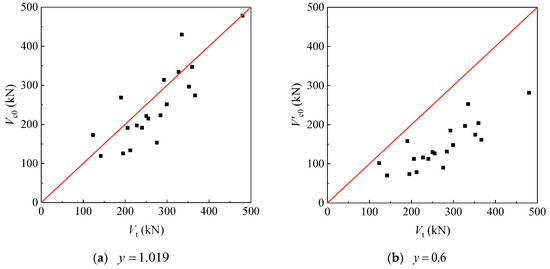
Figure 17.
Comparison of calculated results with test results.
It should be noted that the value of in Equation (6) is determined based on the best fit between the calculated results and the test data but cannot be applied in the design because it only offers approximately 50% probability confidence in the safety side. If the same value of y is taken as the coefficient in Equation (3), i.e., , an equation similar to the expression for the concrete shear breakout capacity of the anchor can be obtained as follows:
The shear breakout capacities calculated using Equation (7) (i.e., ) are compared with the test results obtained in this paper, and the results are also shown in Table 14 and Figure 17. It is evident that all calculated capacities are lower than the corresponding test values, and the statistical analysis of in Table 14 is shown in Figure 18. Meanwhile, the goodness-of-fit testing indicates that does not reject the assumption of a lognormal distribution, and the mean and standard deviation of the logarithm of are and , respectively. It should be noted that Equation (7) can be treated as an expansion of Equation (3), which was originally used for a single anchor, because it becomes identical with Equation (3) in the case of and .
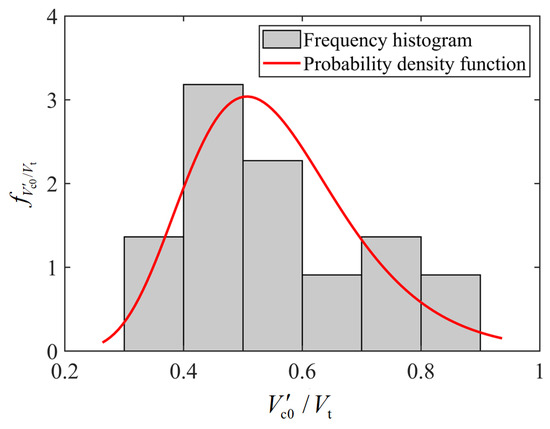
Figure 18.
Statistical histogram of .
The probability distribution function for the lognormal distribution is as follows:
Using the above equation, the probability that (i.e., ) is calculated to be 0.993. This indicates that the concrete shear breakout capacity of the shear lug predicted by Equation (7) has a guarantee rate of more than 95%.
It should be noted that the equations proposed in this study (i.e., Equations (6) and (7)) are developed based on the equations recommended in the ACI 318-19 code [22]. These equations are applicable for calculating the shear breakout capacity of a single shear lug under static horizontal loading. For dynamic loading conditions or configurations involving multiple shear lugs, additional requirements specified in Sections 17.7 and 17.10 of the ACI 318-19 code should be consulted.
7. Conclusions
In this paper, horizontal loading tests are conducted on three typical shear lugs commonly used in nuclear equipment foundations. The shear performance of shear lugs is systematically investigated. Based on the test results, equations for calculating the concrete shear breakout capacity of shear lugs are proposed. The main findings are summarized as follows:
(1) The concrete edge distance has a significant effect on the failure behavior of H-shaped steel specimens. At small edge distances, the specimens primarily exhibit concrete shear breakout failure, accompanied by good ductile behavior. In contrast, larger edge distances tend to induce local concrete crushing, resulting in a noticeable reduction in ductility. Moreover, increasing the embedment depth and edge distance can enhance the shear capacity of the specimens, with maximum improvements reaching 43% and 74%, respectively.
(2) For angle steel specimens, concrete shear breakout failure is the dominant failure mode, regardless of the angle leg length and concrete edge distance. When the edge distance is large, this failure mode is often accompanied by local concrete crushing, leading to a certain degree of ductility reduction. Moreover, increasing the angle leg length and the edge distance can improve the shear capacity of the specimens, with maximum improvements reaching 47% and 71%, respectively.
(3) The height-to-thickness ratio of the steel plate is a key factor affecting the shear performance of steel plate specimens. At low ratios, the specimen is prone to concrete local compression failure. As the ratio increases, the failure mode progressively shifts to concrete shear breakout, accompanied by a substantial improvement in ductility. Moreover, increasing the height-to-thickness ratio and the edge distance can significantly improve the shear capacity of the specimens, with maximum improvements reaching 130% and 54%, respectively.
(4) The proposed equation accounts for the key parameters influencing the shear capacity of shear lugs, and the calculated results show good agreement with the test data. Furthermore, a design equation for calculating the concrete shear breakout capacity of the shear lugs used in nuclear equipment foundations is also given, which has a guarantee rate of more than 95%.
It should be clarified that this study has several limitations arising from objective constraints. For instance, repeated tests under identical loading conditions are not conducted to verify the consistency of the experimental results. Moreover, there are no more test data to extend the validation of the proposed equations. In the future, more research is needed to further improve this research work.
Author Contributions
Conceptualization, X.L.; Formal analysis, C.Z.; Funding acquisition, Y.Z.; Investigation, C.Z.; Methodology, X.L. and Y.Z.; Software, Y.G. and C.Z.; Supervision, Y.Z.; Validation, Y.G.; Writing—original draft, Y.G.; Writing—review and editing, X.L. and Y.Z. All authors have read and agreed to the published version of the manuscript.
Funding
This research was funded by China Nuclear Power Engineering Co., Ltd. Program, grant number KY22156.
Data Availability Statement
The original contributions presented in this study are included in the article. Further inquiries can be directed to the corresponding authors.
Conflicts of Interest
Author Yuan Gong was employed by the company China Nuclear Power Engineering Co., Ltd. The remaining authors declare that the research was conducted in the absence of any commercial or financial relationships that could be construed as a potential conflict of interest. The authors declare that this study received funding from China Nuclear Power Engineering Co., Ltd. The funder was not involved in the study design, collection, analysis, interpretation of data, the writing of this article or the decision to submit it for publication.
References
- Holan, J.; Bílý, P.; Štefan, R.; Vácha, P. Feasibility Study of a Prestressed-Concrete Containment Vessel for a Novel GFR Nuclear Reactor. Eng. Struct. 2023, 286, 116119. [Google Scholar] [CrossRef]
- Li, X.; Gong, J. Probabilistic Evaluation of the Leak-Tightness Function of the Nuclear Containment Structure Subjected to Internal Pressure. Reliab. Eng. Syst. Saf. 2024, 241, 109684. [Google Scholar] [CrossRef]
- Guo, J.; Li, X.; Gong, J. Failure Behavior and Vulnerability of Containment Structures Subjected to Overpressure Loads Considering Different Failure Criteria. Buildings 2024, 14, 1299. [Google Scholar] [CrossRef]
- Xu, Y.; Chen, C.; Xie, M.; Gong, J. Experimental Study of the Influence of Supplementary Reinforcement on Tensile Breakout Capacity of Headed Anchors in Nuclear Power Plant Equipment Foundations. Buildings 2024, 14, 3027. [Google Scholar] [CrossRef]
- GB 50017-2017; Standard for Design of Steel Structures. The Ministry of Construction of the People’s Republic of China: Beijing, China, 2017.
- Xu, Y.; Gong, J.; Chen, C.; Xie, M. Experimental Investigation on Shear Breakout Capacity of Headed Anchors with Supplementary Reinforcements in Equipment Foundations of Nuclear Power Plants. Structures 2025, 78, 109340. [Google Scholar] [CrossRef]
- Nie, Y.; Zhang, J.; Liu, D.; Lan, T.; Xiao, D.; Dong, Z. Numerical Simulation and Experimental Study on Mechanical Behavior of the Gusset for Nuclear Power Plant Containment. Eng. Struct. 2023, 292, 116522. [Google Scholar] [CrossRef]
- Murray, D.W. A Review of Explosive Characteristics of Prestressed Secondary Containment near Ultimate Load. Nucl. Eng. Des. 1979, 52, 157–164. [Google Scholar] [CrossRef]
- Lilliefors, H.W. On the Kolmogorov-Smirnov Test for Normality with Mean and Variance Unknown. J. Am. Stat. Assoc. 1967, 62, 399–402. [Google Scholar] [CrossRef]
- Chuah, C.L.; Shima, H.; Virach, R. Load-Displacement Relationship of Plate Shape Shear Connector in Steel-Concrete Composite Structures. Doboku Gakkai Ronbunshu 1991, 1991, 223–229. [Google Scholar] [CrossRef] [PubMed]
- Pardeshi, R.T.; Patil, Y.D. Review of Various Shear Connectors in Composite Structures. Adv. Steel Constr. 2021, 17, 394–402. [Google Scholar][Green Version]
- ACI 349-13; Code Requirements for Nuclear Safety-Related Concrete Structures and Commentary. American Concrete Institute: Farmington Hills, MI, USA, 2013.
- Deng, W.; Xiong, Y.; Liu, D.; Zhang, J. Static and Fatigue Behavior of Shear Connectors for a Steel-Concrete Composite Girder. J. Constr. Steel Res. 2019, 159, 134–146. [Google Scholar] [CrossRef]
- Mazoz, A.; Benanane, A.; Titoum, M. Push-out Tests on a New Shear Connector of I-Shape. Int. J. Steel Struct. 2013, 13, 519–528. [Google Scholar] [CrossRef]
- Shariati, A.; Shariati, M.; Ramli Sulong, N.H.; Suhatril, M.; Arabnejad Khanouki, M.M.; Mahoutian, M. Experimental Assessment of Angle Shear Connectors under Monotonic and Fully Reversed Cyclic Loading in High Strength Concrete. Constr. Build. Mater. 2014, 52, 276–283. [Google Scholar] [CrossRef]
- Soty, R.; Shima, H. Formulation for Shear Force–Relative Displacement Relationship of L-Shape Shear Connector in Steel–Concrete Composite Structures. Eng. Struct. 2013, 46, 581–592. [Google Scholar] [CrossRef]
- Xiao, N.; Li, S.; Zhao, W. Calculation of Shear Capacity of Shear Connector in Steel Column Base. J. Build. Struct. 2010, 31, 86–93. [Google Scholar] [CrossRef]
- Soty, R.; Shima, H. Formulation for Maximum Shear Force on L-Shape Shear Connector Subjected to Strut Compressive Force at Splitting Crack Occurrence in Steel-Concrete Composite Structures. Procedia Eng. 2011, 14, 2420–2428. [Google Scholar] [CrossRef]
- Jiasen, L. Design Method for an H Type Steel Shear Key for the Steel Column Base. Struct. Eng. 2015, 31, 7–11. [Google Scholar] [CrossRef]
- Jiang, H.; Fang, H.; Liu, J.; Fang, Z.; Zhang, J. Experimental Investigation on Shear Performance of Transverse Angle Shear Connectors. Structures 2021, 33, 2050–2060. [Google Scholar] [CrossRef]
- Shariati, M.; Ramli Sulong, N.H.; Suhatril, M.; Shariati, A.; Arabnejad Khanouki, M.M.; Sinaei, H. Comparison of Behaviour between Channel and Angle Shear Connectors under Monotonic and Fully Reversed Cyclic Loading. Constr. Build. Mater. 2013, 38, 582–593. [Google Scholar] [CrossRef]
- ACI 318-19; Building Code Requirement for Structural Concrete. American Concrete Institute: Farmington Hills, MI, USA, 2019.
- GB 50010-2010; Code for Design of Concrete Structures. The Ministry of Construction of the People’s Republic of China: Beijing, China, 2015.
Disclaimer/Publisher’s Note: The statements, opinions and data contained in all publications are solely those of the individual author(s) and contributor(s) and not of MDPI and/or the editor(s). MDPI and/or the editor(s) disclaim responsibility for any injury to people or property resulting from any ideas, methods, instructions or products referred to in the content. |
© 2025 by the authors. Licensee MDPI, Basel, Switzerland. This article is an open access article distributed under the terms and conditions of the Creative Commons Attribution (CC BY) license (https://creativecommons.org/licenses/by/4.0/).