Article

AI-Driven Analysis of Tuff and Lime Effects on Basalt Fiber-Reinforced Clay Strength

by
Yasemin Aslan Topçuoğlu
1,*,
Zeynep Bala Duranay
2,
Zülfü Gürocak
1 and
Hanifi Güldemir
2
1
Department of Geological Engineering, Firat University, Elazığ 23119, Türkiye
2
Electrical Electronics Engineering Department, Technology Faculty, Firat University, Elazig 23119, Türkiye
*
Author to whom correspondence should be addressed.
Buildings 2025, 15(14), 2433; https://doi.org/10.3390/buildings15142433
Submission received: 29 May 2025 / Revised: 7 July 2025 / Accepted: 9 July 2025 / Published: 11 July 2025

Abstract

In this study, free compression tests were conducted to examine the changes in the strength of soil after adding 24 mm long basalt fiber (1%), lime (3%, 6%, 9% by dry weight), and tuff (10%, 20%, 30% by dry weight) before curing and after 28, 42, and 56 days of curing. Instead of the K + BF 1% + SL 9% mixture, where the SL ratio is high, it has been revealed that T, which has a lower SL content and is environmentally friendly (as in the K + BF 1% + SL 6% + T 10% mixture), can be used considering environmental factors and costs. However, due to the length and cost of experimental studies, the use of artificial intelligence to reduce the need for physical tests/experiments and to accelerate processes will provide savings in terms of labor, time, and cost. Unconfined compressive strength (qu) prediction was performed using the artificial neural network (ANN) technique. The accuracy of the ANN model was proven using the R and MSE metrics. In addition, a qu prediction of the mixture with 30% water content was performed according to the curing times. The experimental and predicted qu values for the curing times were compared and presented.

1. Introduction

One of the most significant challenges encountered in geotechnical studies is problematic soils with high swelling, settlement, and liquefaction potential, as well as low strength. When such soils are present at a project site, engineers commonly apply various soil improvement methods to enhance their geotechnical properties. Among these, the use of stabilizing additives remains one of the most traditional, cost-effective, and straightforward approaches. In this method, pozzolanic reactions are induced by incorporating additives such as slaked lime (SL), fly ash, silica fume, marble dust, pumice, tuff (T), and cement into the soil, aiming to improve its geotechnical behavior.
There are numerous studies on soil stabilization [1,2,3,4,5,6,7,8,9,10,11,12]. While these studies predominantly use additives such as fly ash, lime, and silica fume, the use of natural materials like pumice, perlite, and T in soil stabilization has been investigated in only a limited number of studies [13,14,15,16,17,18,19].
Another method used to improve the engineering properties of soils is the incorporation of reinforcing fibers. In recent years, fibers developed through technological advancements have increasingly been adopted in soil reinforcement studies. Among these fibers, which possess superior engineering properties and high performance, are polypropylene, glass, and carbon fibers. One type of fiber that has seen significant growth in production and application fields in recent years is the environmentally friendly basalt fiber (BF), which is derived from basalt rock.
The raw material for BF, basalt, is abundant and easily accessible. BF exhibits a high modulus of elasticity, excellent thermal resistance, high corrosion resistance, biological stability, and chemical inertness [20]. These properties have contributed to the widespread use of BF in various sectors, including construction, automotive, and chemical industries. Moreover, the increasing use of BF in geotechnical studies in recent years has led to increased scientific research focusing on the reinforcement of clayey soils with BF.
Gao et al. [21] reported that the optimal BF content for enhancing the strength of clayey soil was 0.25%, with a fiber length of 12 mm. Ndepete and Sert [22] and Kenan and Özocak [23] noted that the highest strength values in silty soils were achieved with a fiber content of 1.5%. Sungur et al. [24] found that, for low-plasticity clayey soil, the maximum shear strength was obtained at 1.5% BF content and 15 mm fiber length. In their study, Gürocak and Aslan Topçuoğlu [25] prepared low-plasticity kaolin clay (K) samples by adding BF at 1%, 2%, and 3% content, with a fiber length of 24 mm, along with water contents of 20%, 25%, 30%, and 35%. They conducted unconfined compression tests on these samples and concluded that the BF content of 1% and a water content of 25% resulted in the maximum strength improvement. Zhao et al. [26] indicated that the reinforcing effect of basalt chopped fiber on red clay was mainly due to its enhancement of cohesion, while its contribution to the increase in internal friction angle was limited. Jia et al. [27] reported that, in silty clay reinforced with BF, especially at a fiber content of 0.2%, the shear strength of the silty clay increased significantly. Song et al. [28] noted that the addition of BF significantly improved the soil’s shear and compressive strength, with the highest strength gain observed at 0.3% BF content. Chen et al. [29] stated that BFs are effective in improving the swelling and shrinkage characteristics of cement-stabilized soils, enhancing soil strength, and increasing resistance to wet–dry cycles.
Özdemir et al. [30] used 1% BF and 9% lime in K and found that the strength increased by 5.5 times after a curing period of 28 days. In a study by Wang et al. [31] involving the use of lime and BF reinforcement in expansive soil, the researchers reported qu of the soil was 5.7 times higher with 6% lime and 0.3% BF compared to untreated soil. Boz et al. [32] prepared samples using various proportions of lime and BF and found that the maximum strength increase was achieved in samples containing 9% lime and 0.75% BF with a fiber length of 19 mm after 90 days of curing. Cao et al. [33] reported that the addition of 0.6% BF to soil stabilized with cement and fly ash resulted in the highest qu value. Ma et al. [34] conducted a study on low-plasticity expansive clay and determined that the highest strength improvement occurred in samples containing 10% fly ash, 8% sand, and 0.4% BF. Similarly, Shen [35] found that samples prepared with 4% lime and 0.3% BF in silty soil exhibited the highest values of shear strength, California bearing ratio, and qu.
Until recently, traditional statistical methods have been commonly used to evaluate experimental results in soil improvement studies. However, with the advent of intelligent techniques such as genetic algorithms, fuzzy logic, and artificial neural networks (ANNs), researchers have begun exploring their applicability for analyzing experimental data. Although limited, there are a few studies in the literature addressing this topic. In a study by Tabarsa et al. [36], two artificial intelligence (AI)-based models—ANN and support vector machines (SVMs)—were utilized to predict the strength properties of soils treated with cement, lime, and rice husk ash under varying conditions. The findings demonstrated that these models provided accurate predictions of the qu of the soils. Another study was conducted by Chumacero et al. [37] where the researchers assessed the changes in soil properties of gravelly clay by using natural hydraulic lime, plastic, and metallic fiber additives through an AI model. According to this model, it was suggested that dominant materials like lime should be reduced. Garg et al. [38] developed models using the extreme learning machine (ELM) to calculate the strength of soil reinforced with various fibers. It was stated that the compressive strength of the reinforced soil could be reasonably predicted using ELM models. Tiwari and Satyam [39] investigated the impact of pond ash and polypropylene fiber on soil strength, reporting that the developed ANN model provided accurate predictions of the soil’s mechanical properties. Ndepete et al. [40] analyzed the behavior of BF-reinforced silty soil using machine learning models, considering varying fiber ratios and lengths. Their findings highlighted that fiber length and cell pressure play a crucial role in predicting the maximum deviator stress. Sungur et al. [41] used the adaptive neuro-fuzzy inference system (ANFIS) to predict the shear strength of samples reinforced with varying glass fiber ratios and water contents. The model performed best when 80% of the data was used for training and 20% for testing. Sert et al. [42] studied highly plastic clay reinforced with BF at varying ratios, fiber lengths, and water contents, achieving the highest strength (~880 kPa) with 24 mm fibers at 1% and 2% ratios with 15% water content. The researchers stated that the decision tree regression showed superior performance in predicting stress and strain.
In the study by Jeremiah et al. [43], the application of ANNs in the geotechnical analysis of clay stabilized with cement, lime, geopolymers, and by-product cementitious materials was evaluated. It demonstrated that supervised ANN models are highly effective for high-performance clay stabilization, as evidenced by their high R2 values and low MAE, RMSE, and MSE metrics. In another study conducted by Onyelowe et al. [44], ANN and fuzzy-logic-based soft computing techniques were applied to evaluate the consistency limits, compressibility, and mechanical strength properties of expansive clay soil blended with hydrated-lime activated rice husk ash (HARHA). The predictive accuracies of the models were compared using MAE, RMSE, and the coefficient of determination metrics. The results indicated values of 0.2750, 0.4154, and 0.9983 for the ANN model and 0.3737, 0.6654, and 0.9894 for the fuzzy logic model, respectively. Both models demonstrated robust performance and provided reliable and satisfactory solutions for optimizing the use of solid waste derivatives in enhancing soil mechanical properties for engineering applications.
Tinoco et al. [45] presented an ML-based approach to predict the qu and tensile strength of soil–binder–water mixtures reinforced with short fibers. In the study, four different ML algorithms (ANN, support vector machines, random forest, and multiple regression) were utilized to estimate the mechanical properties of fiber-reinforced soil–binder–water mixtures. The developed predictive models were able to estimate the compressive and tensile strength of the soil–water–binder–fiber mixtures with high accuracy (R2 > 0.95 for the ANN algorithm). Raja et al. [46] conducted a comprehensive and detailed comparison of eight data-driven machine learning models—ANN, LMSR, GPR, ENRR, LKS, M-5 model trees, AMT, and RF—for predicting the California bearing ratio (CBR) of subgrade soil reinforced with geosynthetic layers. Based on external validation techniques and a multi-criteria evaluation approach, the analysis revealed that the ANN, LKS, AMT, and RF models demonstrated high accuracy and model stability in predicting the CBR of geosynthetically reinforced soil.
In the study performed by Rabbani et al. [47], optimized models were employed to develop a unified approach for predicting the shear strength of soil. In this context, three different optimization algorithms (GA, MPA, and PSO) were applied to improve the bias and weights of the learning parameters of ANNs, resulting in the development of three optimized ANN models (ANN-GA, ANN-MPA, and ANN-PSO). The results of the study revealed that the GA produced the most reliable ANN model. The study by Duong and Tran [48] focused on the development of ANN-based models for the preliminary prediction of seepage velocity and piping resistance in fiber-reinforced soils. The findings demonstrated that the ANN models provided high accuracy and reliability in predicting both seepage velocity and piping resistance.
In the research conducted by Vahedi and Koohmishi [49], the effect of plastic polyethylene terephthalate (PET) on the strength of clay soils was evaluated, and both untreated and lime-treated samples were examined. In this context, the XGBoost machine learning (ML) model was used to identify the most influential factors affecting the strength of clay soils. According to the model’s predictions, PET content and lime percentage were determined to be the most significant parameters contributing to the strength of the clay soil. In the study conducted by Thapa et al. [50], the stabilization of fine-grained soils using nano-silica (NS) was investigated, and the qu was predicted using advanced machine learning techniques. The study emphasized that the proposed approach demonstrated the high effectiveness of ANNs in determining the optimal values for soil stabilization. Kumar and Sinha [51] focused on developing predictive models for qu in soil–fly ash mixtures reinforced with multi-walled carbon nanotubes (MWCNTs). The findings highlighted the LASSO model as the most balanced and robust option in terms of accuracy, generalization ability, and interpretability. Sharma et al. [52] developed predictive models based on ANNs to estimate the geotechnical properties of lime-stabilized mountain soils. The results indicate that ANN-based models demonstrate superior predictive capabilities compared to traditional statistical methods such as multiple linear regression.
In the literature, most studies have focused on the use of a single pozzolanic additive or a combination of two. However, studies on chemical stabilization and mechanical reinforcement using pozzolanic additives in conjunction with BF are limited. Moreover, there is no systematic investigation into the changes in soil strength when BF, SL, and T are used together under different moisture contents. In addition, the use of artificial intelligence methods such as ANNs in geotechnical engineering to predict the effects of individual and combined additives based on varying additive ratios, moisture content, and curing times has not been sufficiently explored.
To this end, changes in the qu of K samples containing BF, T, and SL were analyzed, considering the curing time, and the mix ratios and curing durations that provide the best strength improvement were evaluated using ANNs. Using ANNs can significantly reduce time, effort, and cost. The resulting ANN models, based on the defined dataset, may serve as a practical and efficient tool for researchers in predicting qu values.

2. Materials and Methods

In this study, a series of laboratory experiments were carried out on mixtures prepared by using different proportions of SL and T additives in BF-reinforced K. The materials used and the experimental studies performed are described in the following sections.

2.1. Materials

Kaolin is a clay mineral primarily composed of kaolinite, which forms through the in situ weathering of granite and other magmatic or volcanic rocks. The untreated kaolin used in this study was obtained from a clay quarry in Sındırgı, Balıkesir, Türkiye. T used as an additive material was collected from a formation cropped out in the north of the city of Gümüşhane (northern Türkiye). The formation was first called the Kızılkaya Formation by Güven [53]. According to the XRF analysis results conducted by Aslan Topçuoğlu [54], T had the following oxide contents: SiO2 at 69.10%, Al2O3 at 20.70%, Fe2O3 at 0.47%, MgO at 0.19%, CaO at 0.76%, Na2O at 0.39%, K2O at 1.43%, TiO2 at 0.29%, MnO at less than 0.01%, P2O5 at 0.06%, SO3 at 0.90%, Cr2O3 at less than 0.01%, Sr at 0.024%, and loss on ignition of 5.50%. Since the SiO2 content of the T is higher than 63% (69.10%), the T belonging to the Kızılkaya Formation has an acidic character. According to ASTM C 618 (2012), for a material to exhibit pozzolanic properties, the combined percentage of SiO2, Al2O3, and Fe2O3 must be greater than 70%, SO3 must be less than 5%, and the loss on ignition must be less than 6%. When these values are compared with the XRF analysis results of the T used, it indicates that the T possesses pozzolanic properties. SL was added to initiate pozzolanic reactions.
The SL used in the study was obtained from a chemical supplier.
Another material used in the study is BF. This fiber is obtained from basalt, which is a dark-colored, fine-grained volcanic rock. Basalt, a hard and dense rock found widely throughout the world, is of magmatic origin and melts when heated, like thermoplastic materials. When examined chemically, the major component forming basalt is SiO2, and the second major component is Al2O3 [55]. The BF used in this study is 24 mm in length and sourced from a commercial supplier. Its technical specifications, provided by the manufacturer, include a diameter of 15 ± 1.5 µm and a tensile strength of 3000 MPa.

2.2. Sample Preparation

T was collected through fieldwork in the Gümüşhane region (Türkiye), and the blocks transported to the laboratory were soil and sieved using a No. 200 sieve. After the kaolin was oven-dried at 105 °C for 24 h, a predetermined amount was dry-mixed using a mixer with BF (pre-separated using a compressor), SL, and T. Distilled water was sprayed evenly onto the mixtures at contents of 25%, 30%, and 35%, followed by additional mixing. Since the optimum water content of the untreated kaolin was 25%, the mixtures were prepared at this level and nearby values of 30% and 35%. This selection accounts for the fact that adding SL and T increases the optimum water demand of the mixture, making compaction more difficult and increasing disintegration risk. Therefore, the water contents were selected as 25%, 30%, and 35%.
Manual mixing was applied periodically to ensure the homogeneous distribution of BF, SL, and T and to prevent fiber agglomeration. All mixtures were prepared using a fixed BF content of 1%, while SL and T were varied at 3%, 6%, 9% and 10%, 20%, 30%, respectively. Higher T proportions were preferred over SL due to its environmentally friendly nature, aiming to enhance soil strength while minimizing SL usage. The aim was to achieve sufficient improvement in soil strength while using less SL. The duration of the mixing process was chosen as 10 min to ensure a complete and homogeneous mixture. The optimum BF ratio at which qu value is maximum was determined as 1% in the study conducted by Gürocak and Aslan Topçuoğlu [25]. Therefore, the BF reinforcement rate was chosen as 1%. Sample codes and explanations are provided in Table 1, while mixture proportions are given in Table 2.

2.3. Methods

Standard Proctor and unconfined compression tests were conducted on both untreated and additive-reinforced samples. The experiments were performed in the Rock-Soil Mechanics Laboratory, Department of Geological Engineering, Fırat University, Elazığ, Türkiye. According to Aslan Topçuoğlu and Gürocak [56], the liquid limit, plastic limit, and plasticity index of the K were determined as 45%, 24%, and 21%, respectively. Based on the Unified Soil Classification System (USCS), the soil was classified as low-plasticity clay (CL). The maximum dry density (γdmax) of unreinforced K was 13.01 kN/m3, and the optimum water content (ɷopt) was 25.00% [56].
Water (25%, 30%, and 35%), BF (1% by dry weight), SL (3%, 6%, and 9% by dry weight), and T (10%, 20%, and 30% by dry weight) were added to the K. A total of 96 standard Proctor tests were performed on 15 mixtures before curing and 17 mixtures after curing, in accordance with ASTM D 698 [57] standards. Cylindrical samples obtained from the Proctor tests were prepared for unconfined compression testing for each water content and additive ratio. Cylindrical specimens obtained from Proctor-compacted mixtures were then subjected to unconfined compression testing to determine the qu for each water content and additive ratio.
In this study, qu values were measured in cylindrical samples with 24 mm long BFs and varying SL and T contents, compacted via the Proctor method at water contents of 25%, 30%, and 35%. The purpose of adding water in three different proportions during the preparation of the mixtures is to determine the water ratio that provides the maximum increase in qu values. Once the optimal water content was identified, unconfined compression tests were repeated after 28, 42, and 56 days of curing using mixtures prepared at that content. In the literature, a curing period of 28 days (4 weeks) has generally been preferred [58,59]. However, curing periods of 42 days (6 weeks) and 56 days (8 weeks) were also applied to determine the potential changes in the strength of the substrate due to the extended curing time. The unconfined compression tests were performed on a total of 288 samples following the ASTM D2166M-16 [60] standard on samples whose length was twice the diameter (Figure 1), and the average qu values obtained from the experiments are given in Table 3. The qu values for Samples 1 and 2, as given in Table 3, were compiled from the study by Gürocak and Aslan Topçuoğlu [25], while the qu values for samples 3 to 17 were determined through the unconfined compression tests conducted.

3. Experimental Analysis

The experimental results were evaluated in two parts: before and after curing.

3.1. Changes in Unconfined Compressive Strength Before Curing

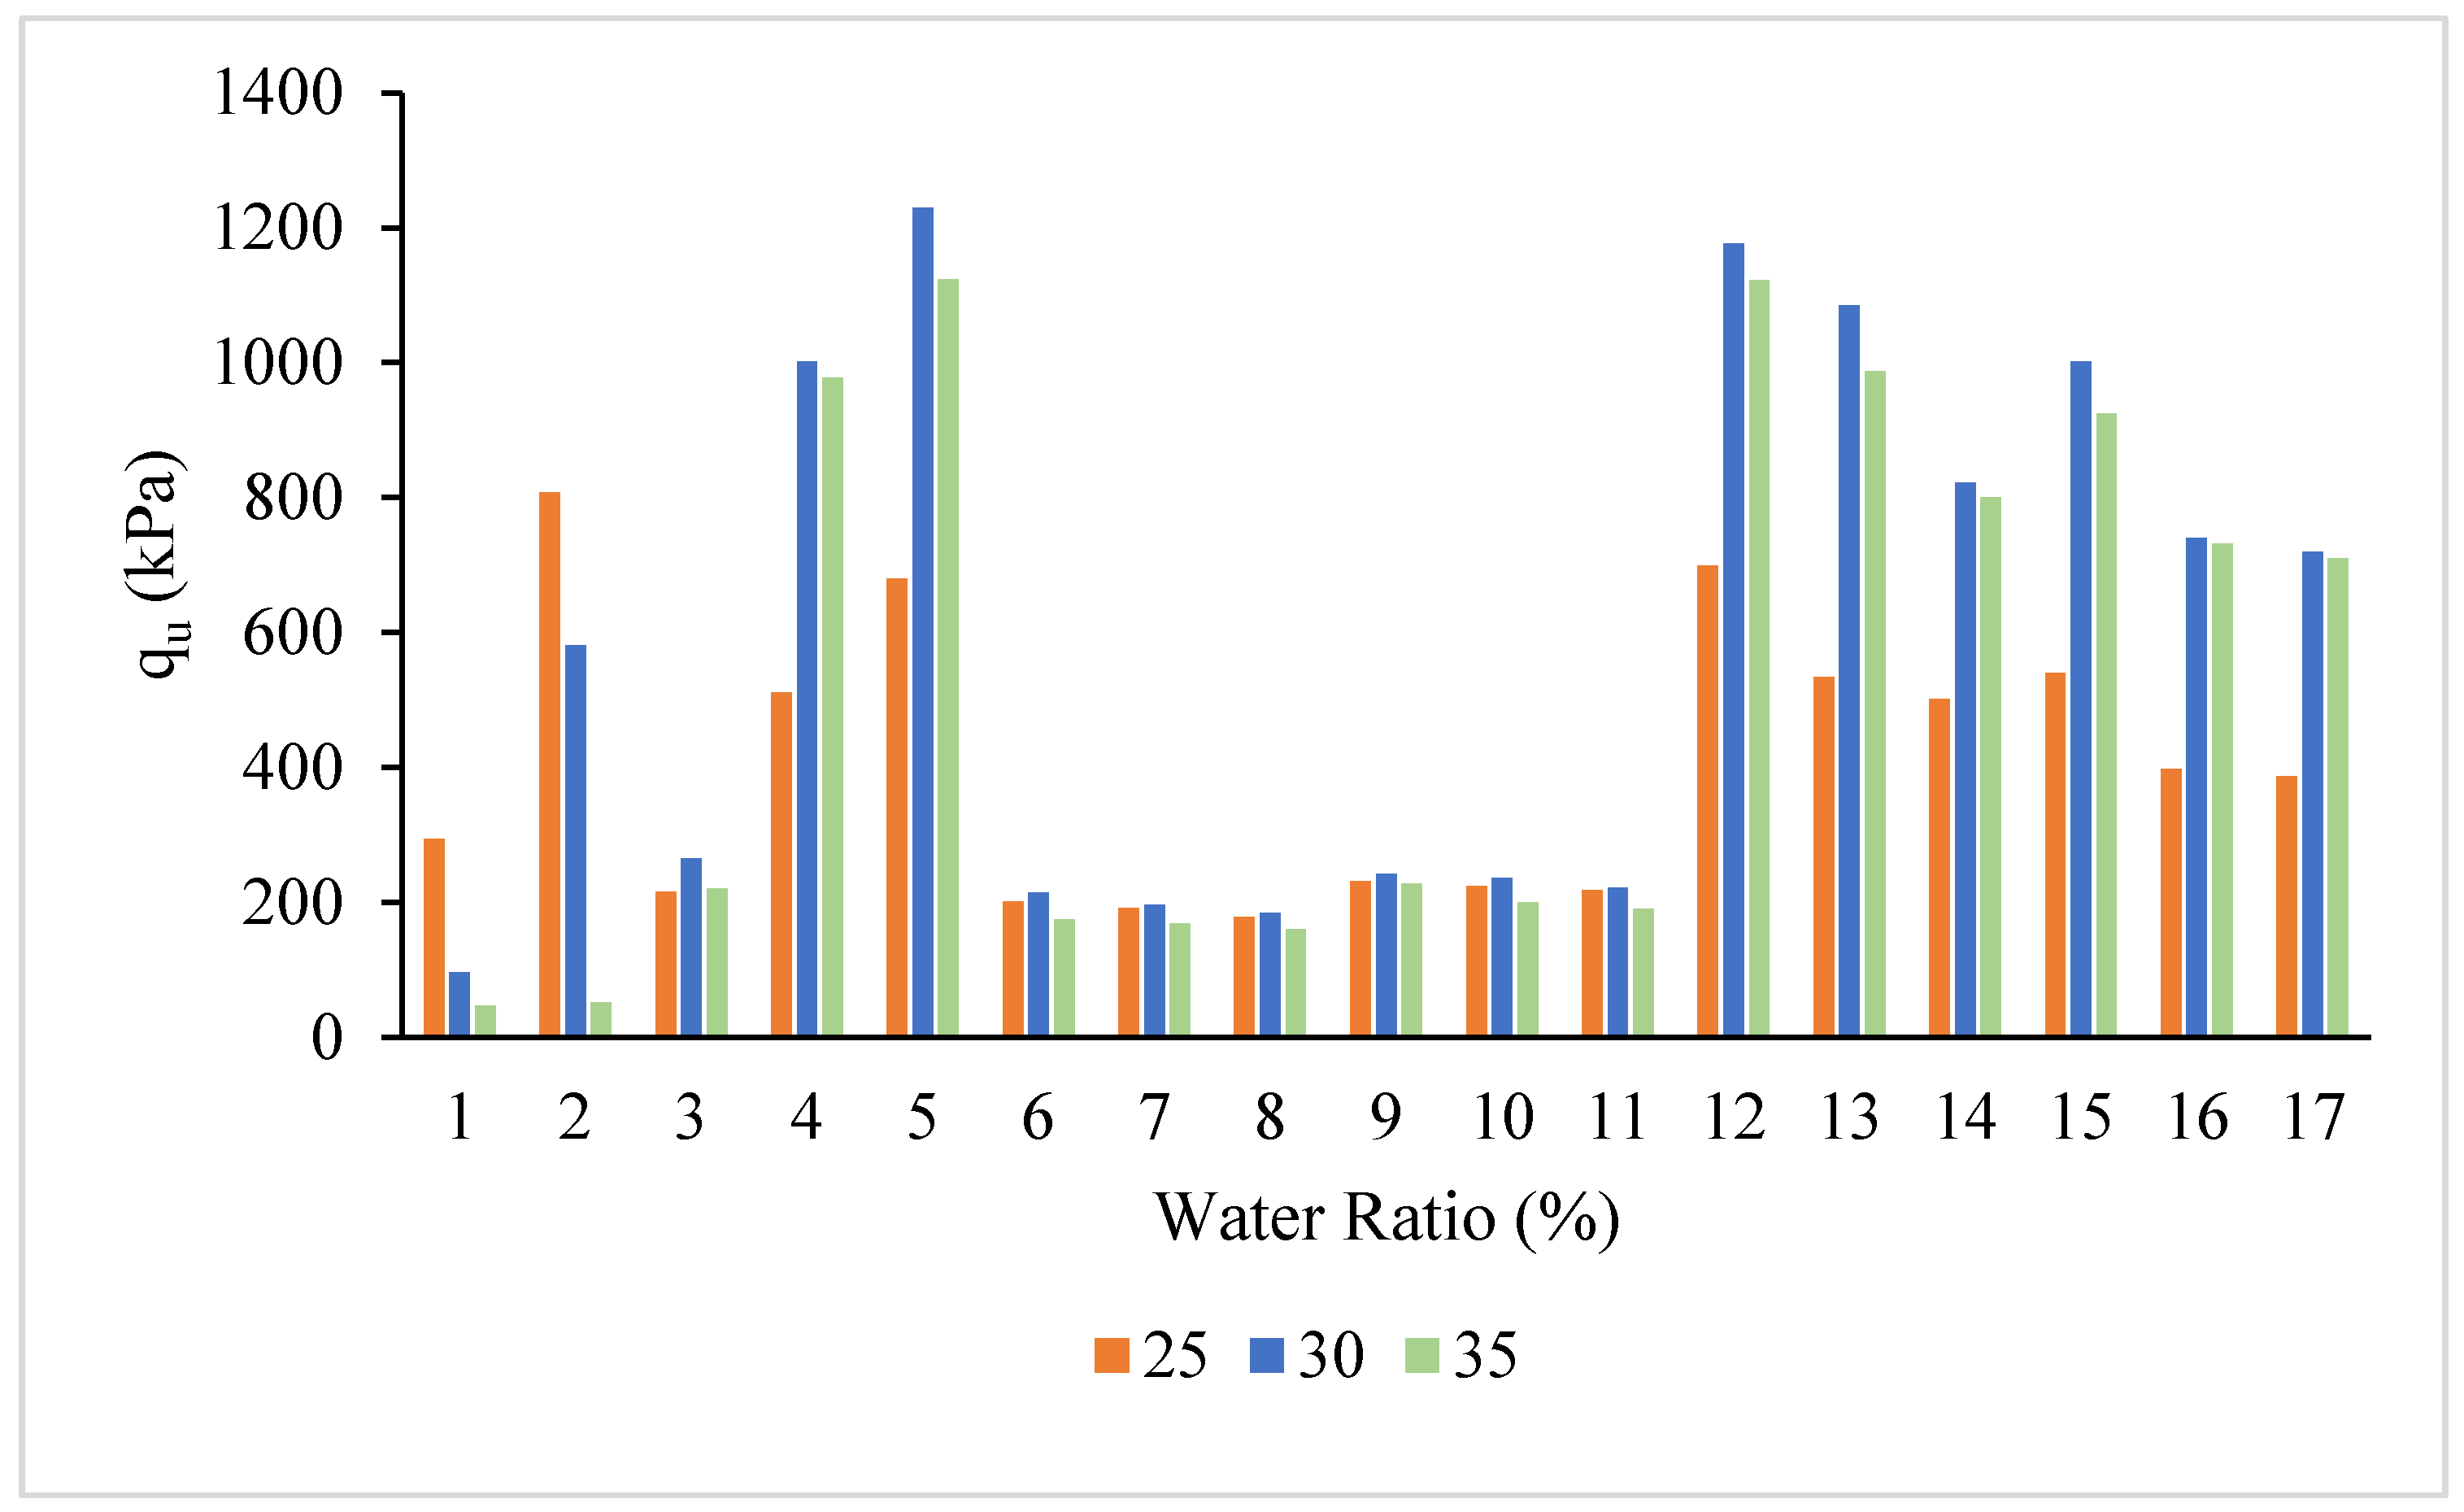
In the samples prepared with 25% water content before curing, the qu values ranged between 178.25 and 807.40 kPa, with the maximum qu value observed in Sample 2. For the samples prepared with 30% water content, the qu values ranged between 184.11 and 1229.23 kPa, and the maximum qu value was identified in Sample 5. In the samples prepared with 35% water content, the qu values ranged between 51.89 and 1124.05 kPa, with the maximum qu value again observed in Sample 5. The relationship between water content and qu for the samples before curing is shown in Figure 2.
Table 3 shows that the highest qu values occurred in samples with 30% water content. Therefore, all 17 mixtures were re-prepared at 30% water content, and unconfined compression tests were performed after 28, 42, and 56 days of curing. Thus, the changes caused by SL and T as additives in BF-reinforced K on the qu before and after curing were revealed.

3.2. Changes in Unconfined Compressive Strength After Curing

Based on the experimental results, negligible changes were observed in qu values of the unreinforced and 1% BF-reinforced samples after curing. After 28 days of curing, qu values of the mixtures, excluding Samples 1 and 2, ranged from 198.75 to 3597.13 kPa. The maximum qu value was observed in Sample 5, while the minimum qu value was identified in Sample 8. After 42 days of curing, the qu values ranged from 208.11 to 3943.56 kPa, with the maximum qu value observed in Sample 5 and the minimum in Sample 8. In the samples cured for 56 days, the maximum qu value was 4731.80 kPa in Sample 5, while the minimum qu value was 220.74 kPa in Sample 8.
In all samples, the qu values increased with curing time, with the highest strengths observed at 56 days. The sample with the lowest qu values at curing periods of 28, 42, and 56 days was Sample 8, which contained 1% BF and 30% T. It was observed that increasing T content led to a decrease in qu, indicating that 10% T is the optimal level. In Sample 5, where the maximum qu value was observed after curing, 1% BF and 9% SL were used. The use of 9% SL significantly increased the qu values. Another sample where the qu values showed a significant increase was Sample 12. The qu values before curing and after 28, 42, and 56 days of curing were 1176.11, 2615.20, 3432.45, and 4250.53 kPa, respectively. In Sample 12, 1% BF, 6% SL, and 10% T were added to the K. Compared to Sample 5, Sample 12 used less SL by incorporating T, yet still achieved substantial strength improvement (Table 4). In general evaluation, specimens containing only T did not exhibit a significant increase in qu values after curing, and a relatively low value of 302.87 kPa was recorded. However, specimens with only SL showed a substantial increase in qu values, reaching as high as 4731.80 kPa. In specimens where T and SL were used together, the maximum qu value was 4250.53 kPa, indicating a significantly high strength. As a result, the highest qu values were obtained when only SL was used.
It has been reported in studies where both BF and various additives were used [30,31,32,33,34] that the strength values increased significantly compared to untreated soil. These studies also emphasized the role of curing in contributing to this increase [30,32]. In this regard, the present study is consistent with the literature, as the addition of BF and additives, along with curing, resulted in a noticeable improvement in strength values.
When all data are evaluated together, after the curing application, the qu values of BF-reinforced K in all T, SL, and T+SL additive-treated samples increased compared to the untreated K. The strength increase can be explained by the reaction products formed as a result of reactions between clay minerals and additive materials after the addition of additives, as well as the interlocking effect between the fibers and soil particles. In this sense, it can be said that it is compatible with the data obtained from studies in the literature [34,35]. Since T does not have plastic properties, their usage of more than 10% in the mixture reduces the qu values. For this reason, the optimum T ratio was determined to be 10%.
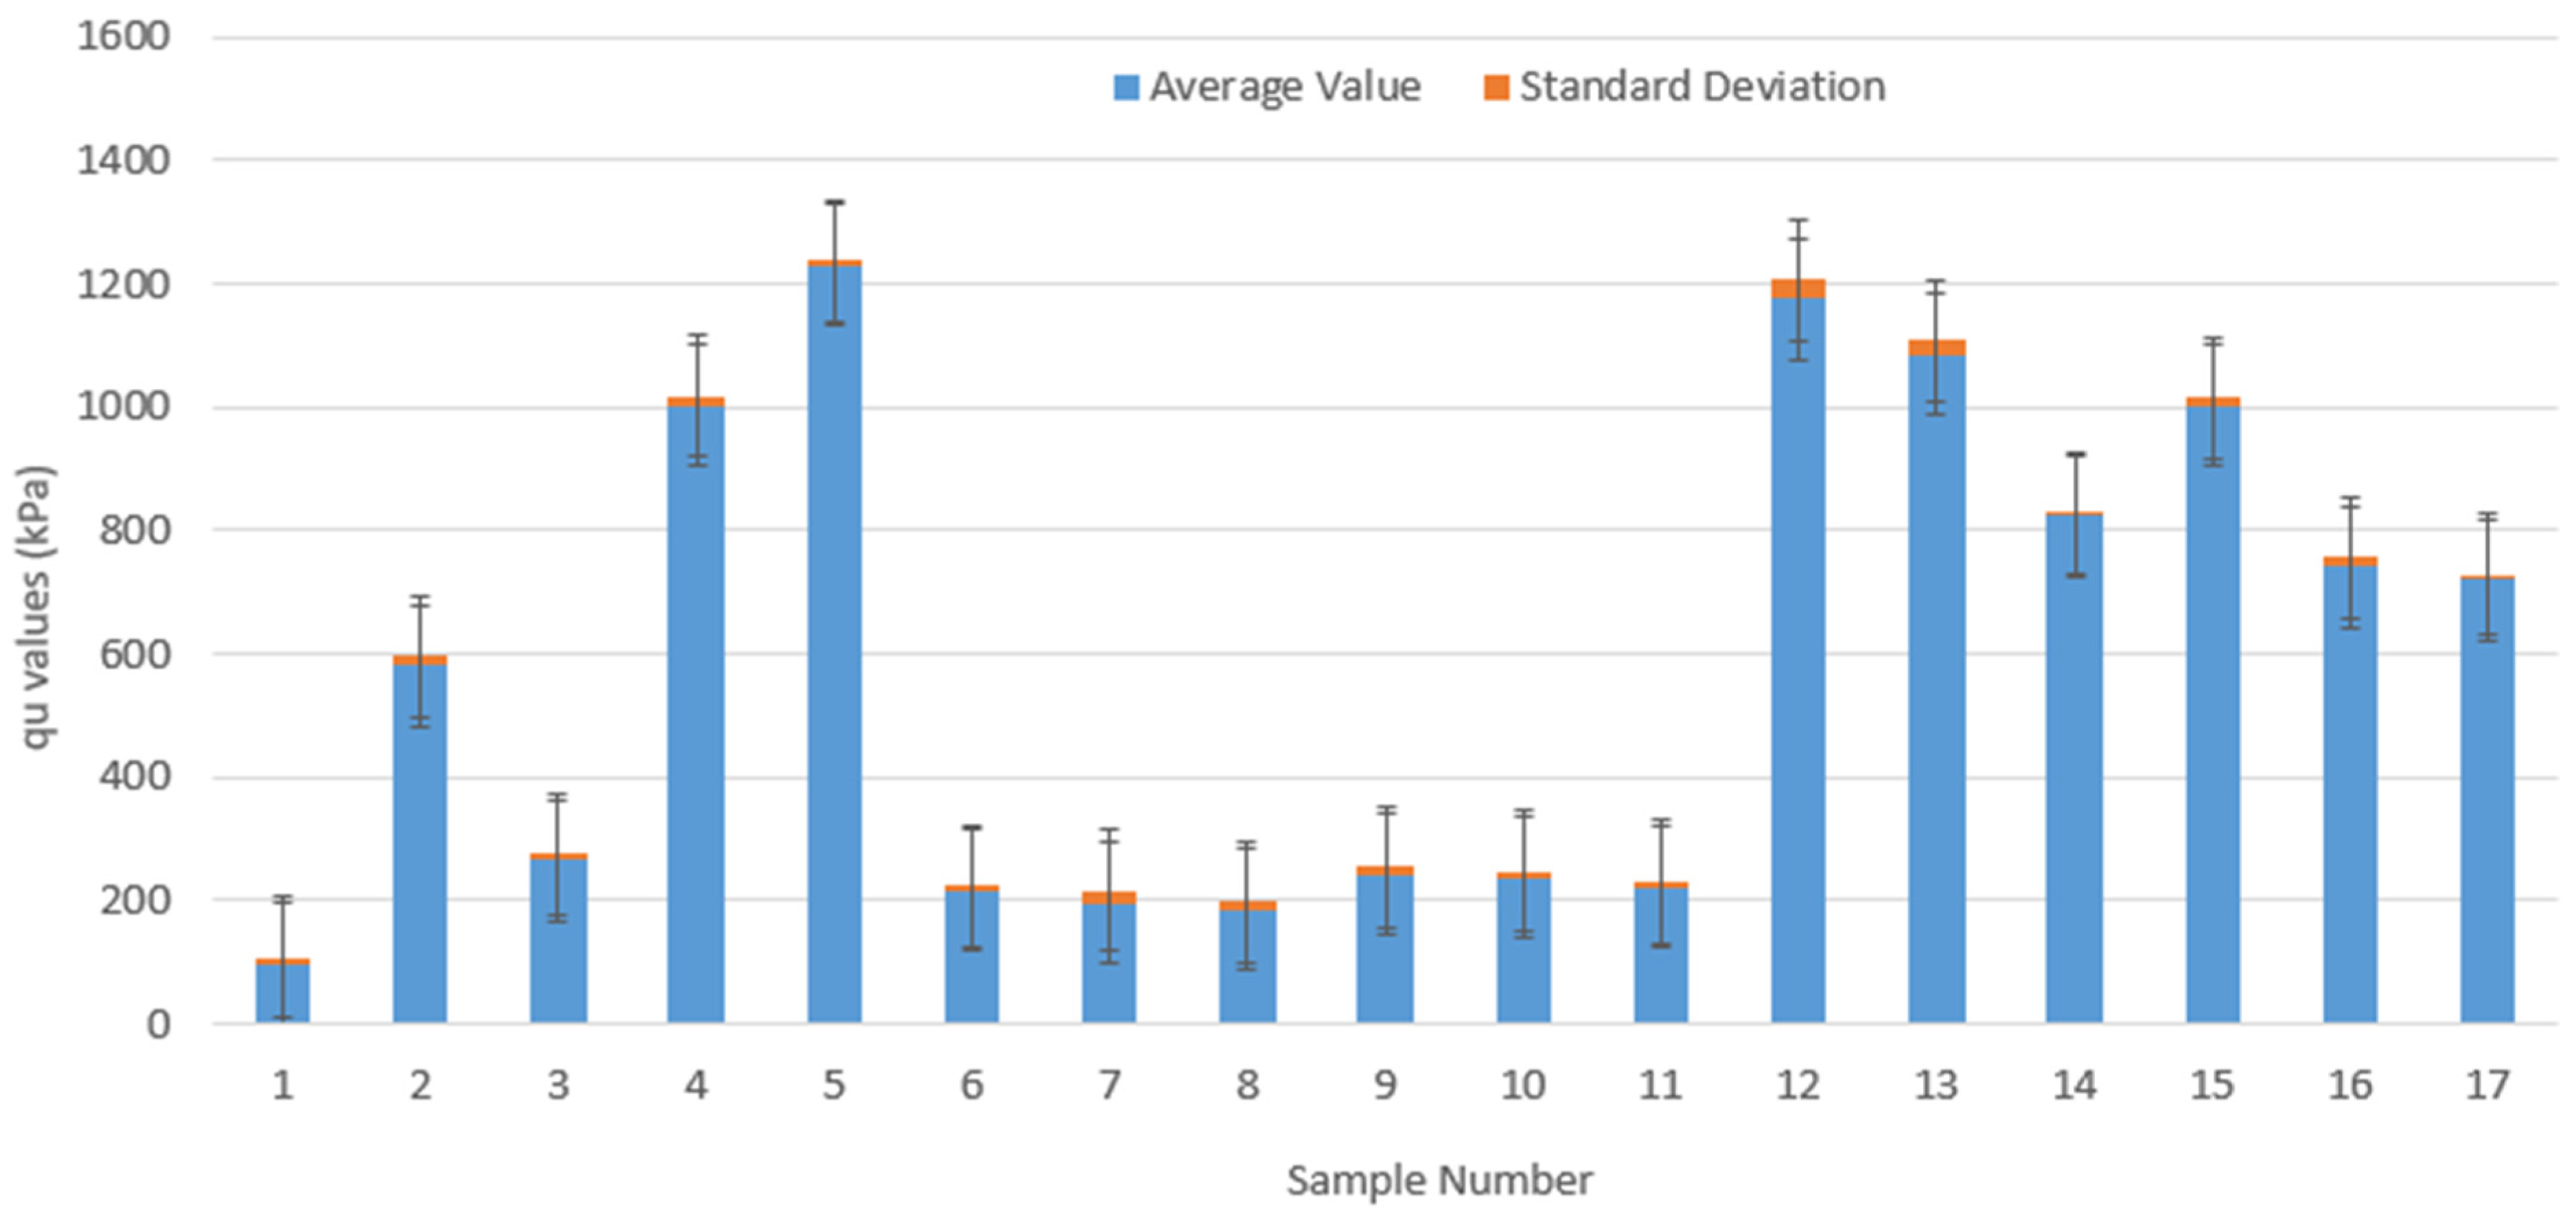
Each experimental condition was tested in triplicate (n = 3), and mean values are reported. Standard deviations were calculated to assess variability. For pre-curing these results are presented as error bars in Figure 3 and as a list in Table 5 to reflect the statistical reliability of the results.
To statistically evaluate whether the observed differences in compressive strength (qu) among treatment groups were significant, a one-way analysis of variance (ANOVA) was conducted. This inferential analysis focused on comparing the qu values across experimental groups based on additive type (SL and T). The ANOVA results revealed a highly significant difference between group means (F(2, 609) = 401.24, p < 0.0001), confirming that the type and combination of additives had a statistically meaningful effect on soil strength.
These findings demonstrate that the performance improvements observed in treated samples are not only visually apparent but also supported by statistical evidence. The detailed ANOVA results are presented in Table 6.

4. ANN-Based Strength Prediction for Basalt-Fiber-Reinforced Clay

AI is a scientific discipline that is widely applied across multiple sectors, including healthcare, education, defense, energy, and engineering, due to its capability to perform complex tasks [61,62,63,64]. AI techniques encompass a range of algorithms, each possessing distinct characteristics and designed to solve specific problems. Among these, ANNs are widely preferred in engineering applications because of their effectiveness in modeling nonlinear relationships [61,65].
The structure of an ANN, which is designed based on the imitation of biological neural systems, consists of three main components:
  • Input layer, where data is fed into the system,
  • Hidden layer, where input data is processed based on its features,
  • Output layer, where the processed data is presented after being analyzed by the neurons in the hidden layer.
The qu values of K reinforced with BF, and modified with SL and T, obtained experimentally, were used as input data for the ANN. Given the complex and potentially nonlinear interactions among the input parameters (such as varying proportions of SL, T, BF, K, and water), the ANN model was chosen for its robust capability to model such relationships. Additionally, the ANN has demonstrated strong predictive performance in similar geotechnical and materials engineering studies, which further supports its suitability for the current problem.
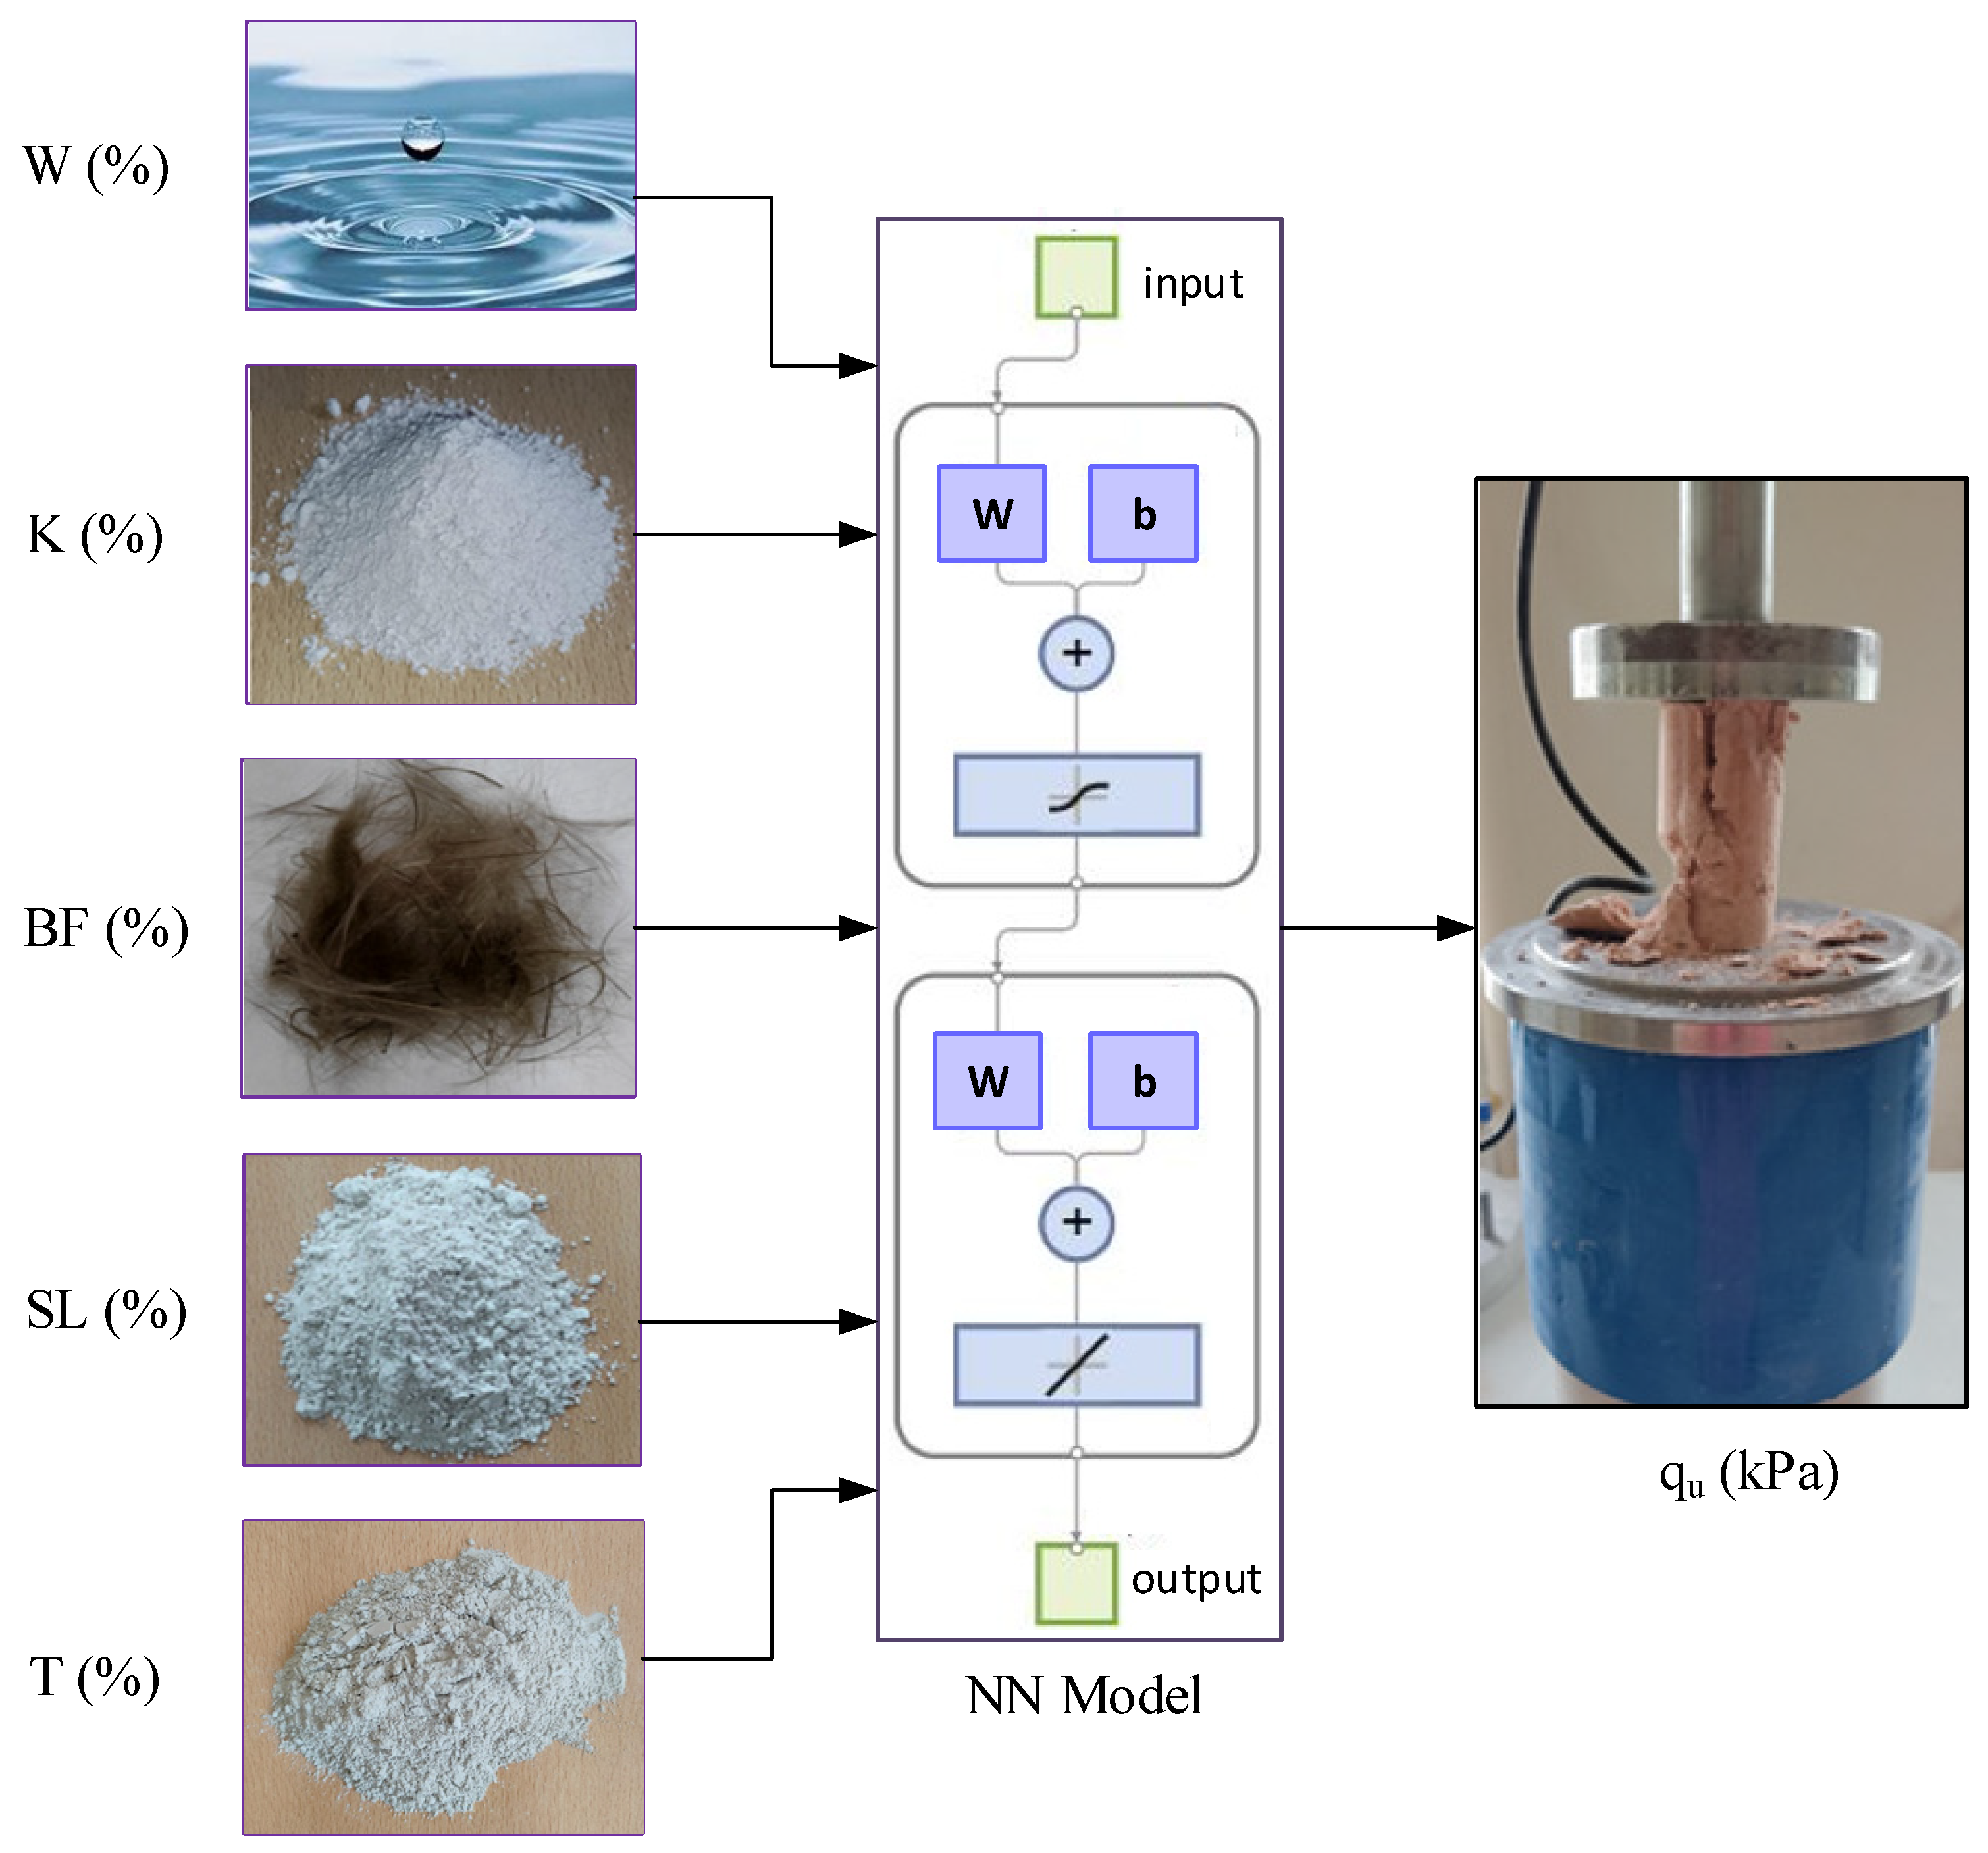
The model was trained using variations in the ratios of SL, T, BF, K, and water, with qu as the output variable. The ANN architecture used in this study, illustrated in Figure 4, consisted of five inputs (SL, T, BF, K, and W) and one output (qu).
Although increasing the number of hidden layers can improve learning capacity, it also introduces greater computational complexity and extended processing time [61,65]. In this study, a two-layer feedforward network with sigmoid activation in the hidden layer and a linear activation in the output layer was employed. The number of hidden neurons was determined empirically through trial and error, with 20 neurons yielding the best results.
The model was trained using a total of 204 experimental data points, of which 184 were allocated for training and 10 each for validation and testing. The data were randomly distributed, and training was performed using the Levenberg–Marquardt algorithm over 55 epochs.
It should be noted that no normalization or scaling was applied to the input variables. Preliminary tests showed that the ANN model yielded higher prediction accuracy when trained on raw (unscaled) data.
The choice of network structure and training algorithm was guided by both empirical testing and existing literature. The Levenberg–Marquardt backpropagation algorithm was preferred due to its fast convergence and effectiveness for function approximation problems. The use of a two-layer structure and 20 hidden neurons represented the optimal balance between model complexity and prediction performance, as confirmed by cross-validation results.
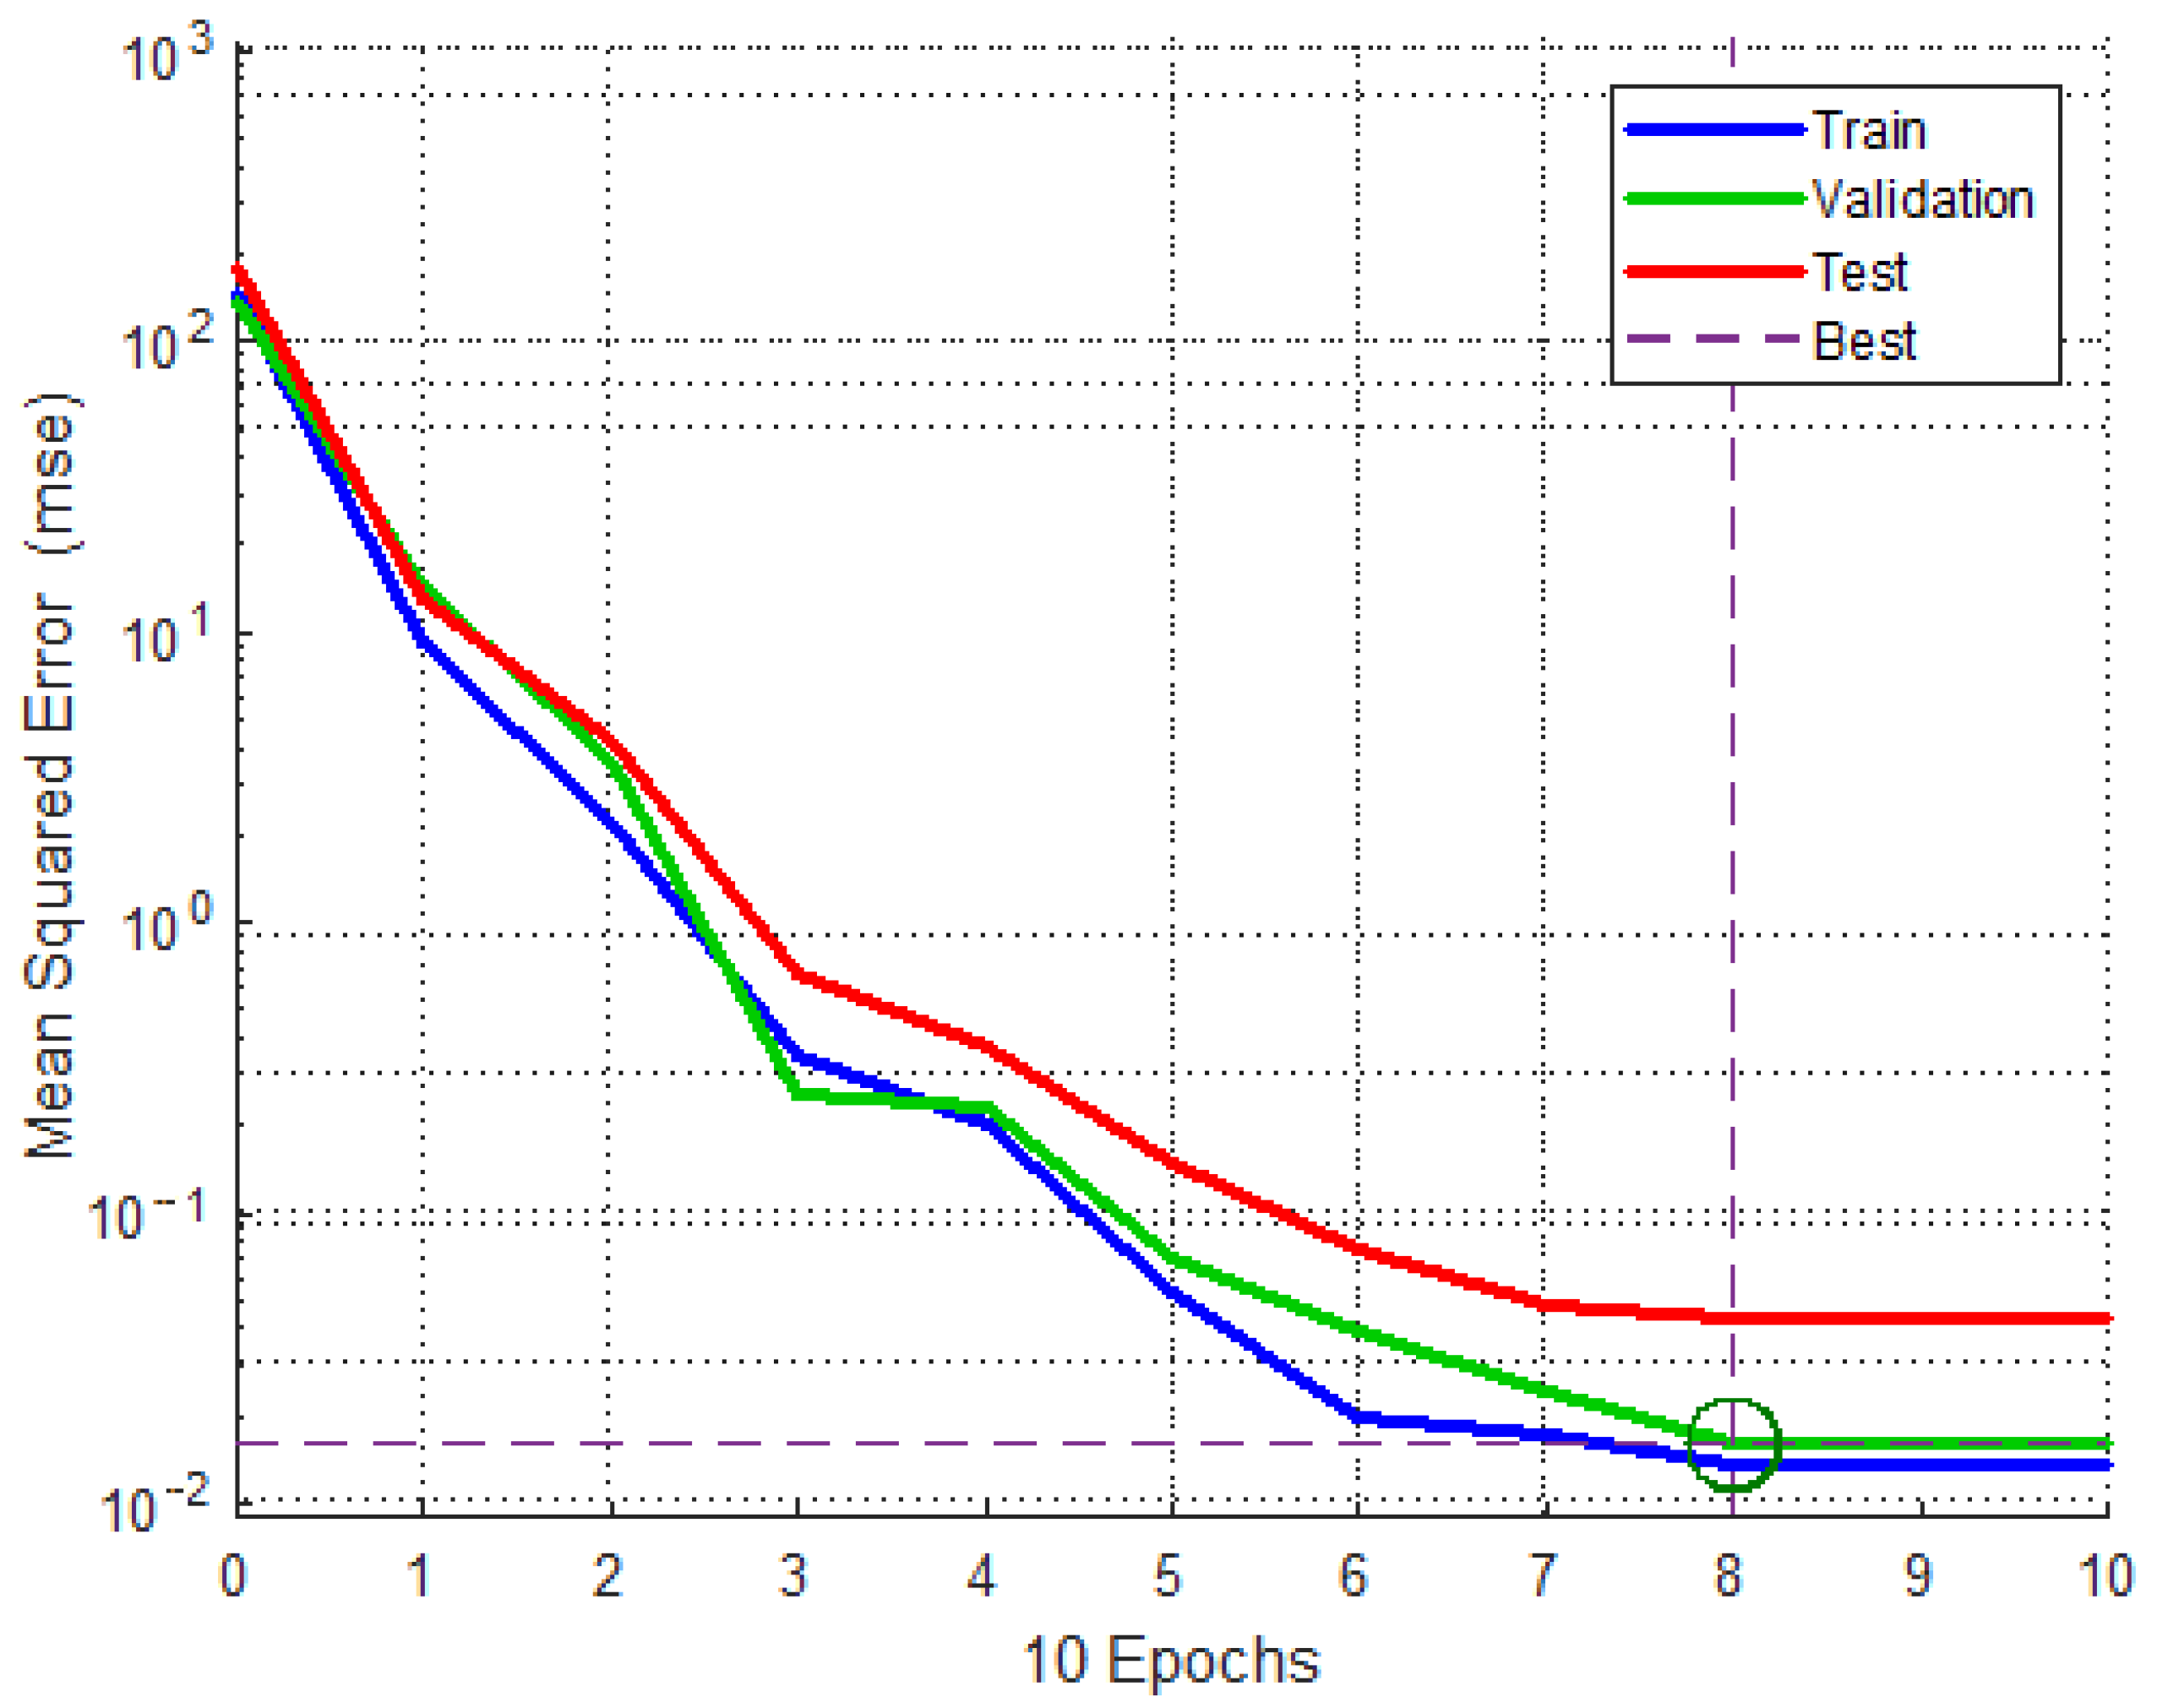
The details and results of the 5-fold cross-validation, which further support the robustness of the ANN model, are provided at the end of Section 4. After the training, the model has demonstrated the ability to quickly and reliably predict qu values with the given input data. The best validation performance plot of the model obtained from the study is presented in Figure 5. As can be seen from the figure, the model achieved its best performance at epoch 8.
Subsequently, to assess the model’s prediction accuracy and its alignment with experimental data, the regression coefficient (R) and mean squared error (MSE) metrics were used to evaluate the performance of the ANN model.
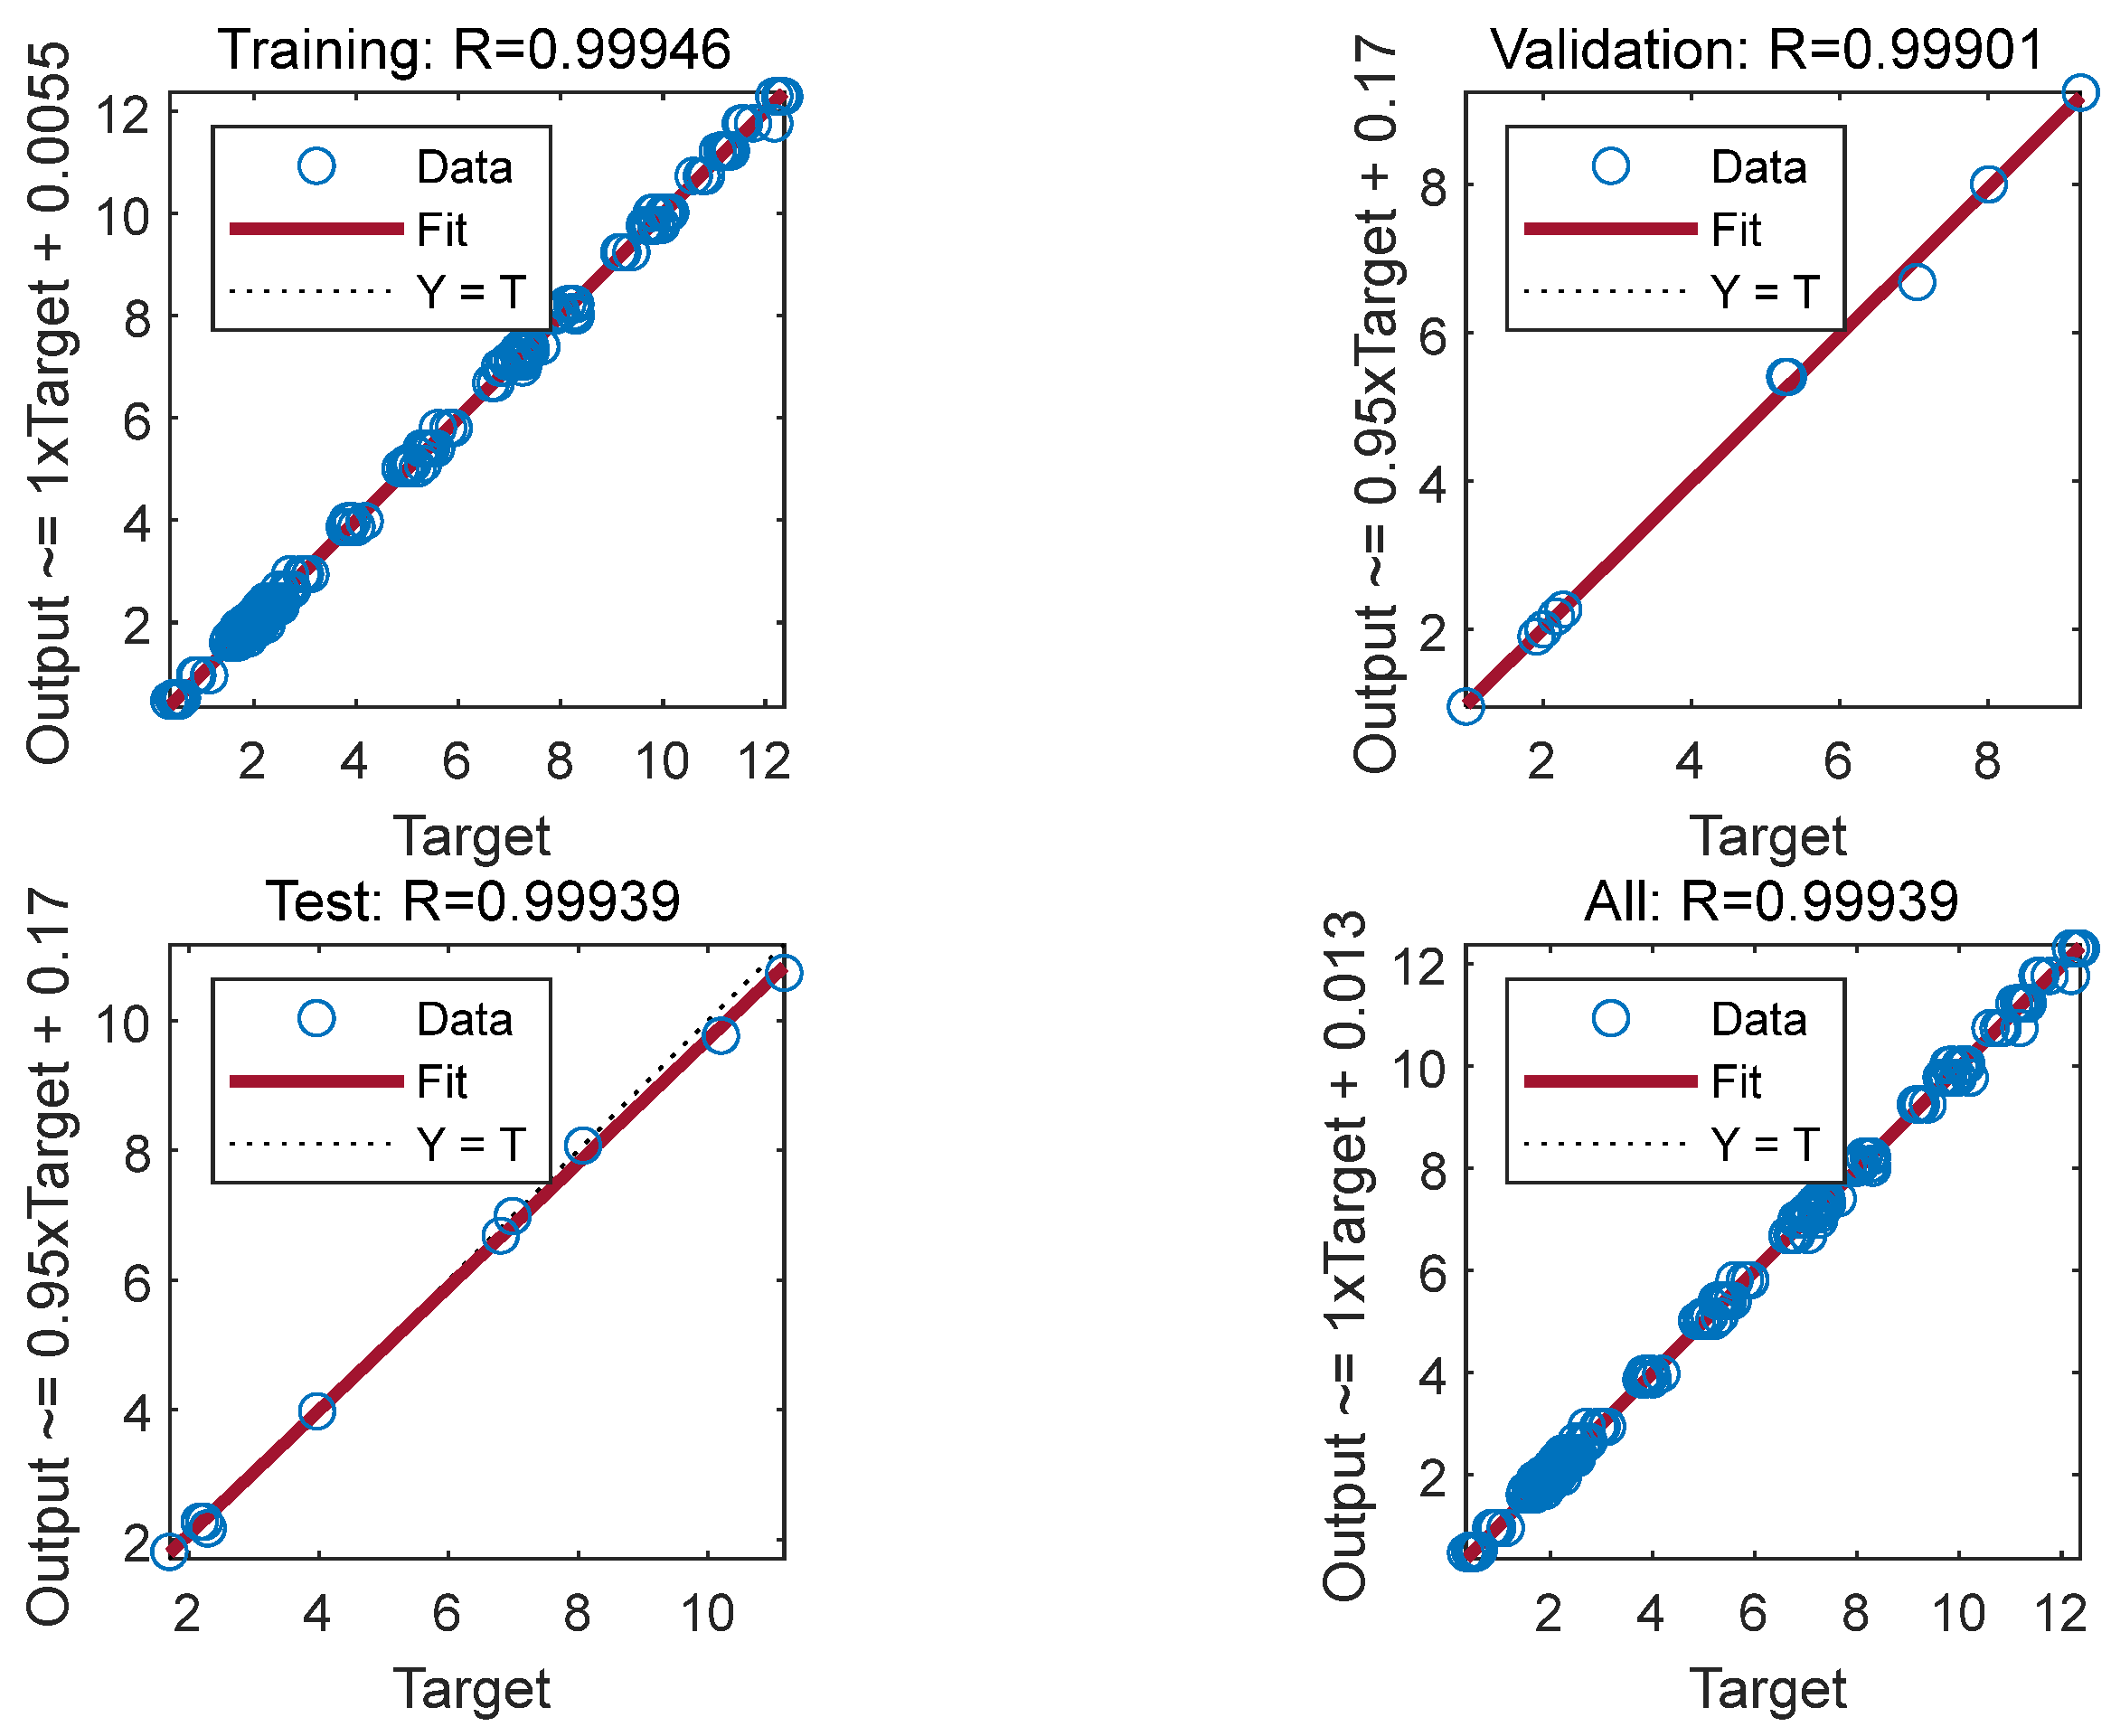
R is an important indicator that shows the degree of agreement between the model’s predictions and the actual values. A value of R close to 1 indicates that the model operates with high accuracy. As shown in Figure 6, the R value was obtained as 0.99 for all datasets, confirming the reliability of the model.
Another metric, MSE, which measures the average squared difference between predicted and actual values, was also calculated. A lower MSE indicates better accuracy. The MSE value obtained was 0.0137, further confirming the model’s predictive strength.
In earlier sections, it was shown that the highest qu was obtained at 30% water content, which led to a dedicated curing study at that level. In addition to ANN predictions based on mixtures with five different additive combinations, a second prediction study was performed, focusing on pre-cure (day 0) and post-cure (days 28, 42, and 56) strength evaluations at 30% water content.
A total of 204 (51 data points for each curing condition) experimental data points were used for this purpose. For the training validity and testing purposes of the model, the distribution of the data was 90%, 5%, and 5%, respectively, and 20 hidden cells were used. The ANN model has a total of five inputs consisting of the number of curing days, K, BF, SL, and T. At the output, the qu value predicted by the ANN was obtained depending on the curing time of the mixture with 30% water content.
In Figure 7, the Simulink-based ANN model is given, where the qu is predicted depending on the curing status (days 0, 28, 42, and 56) of the mixture with 30% water content.
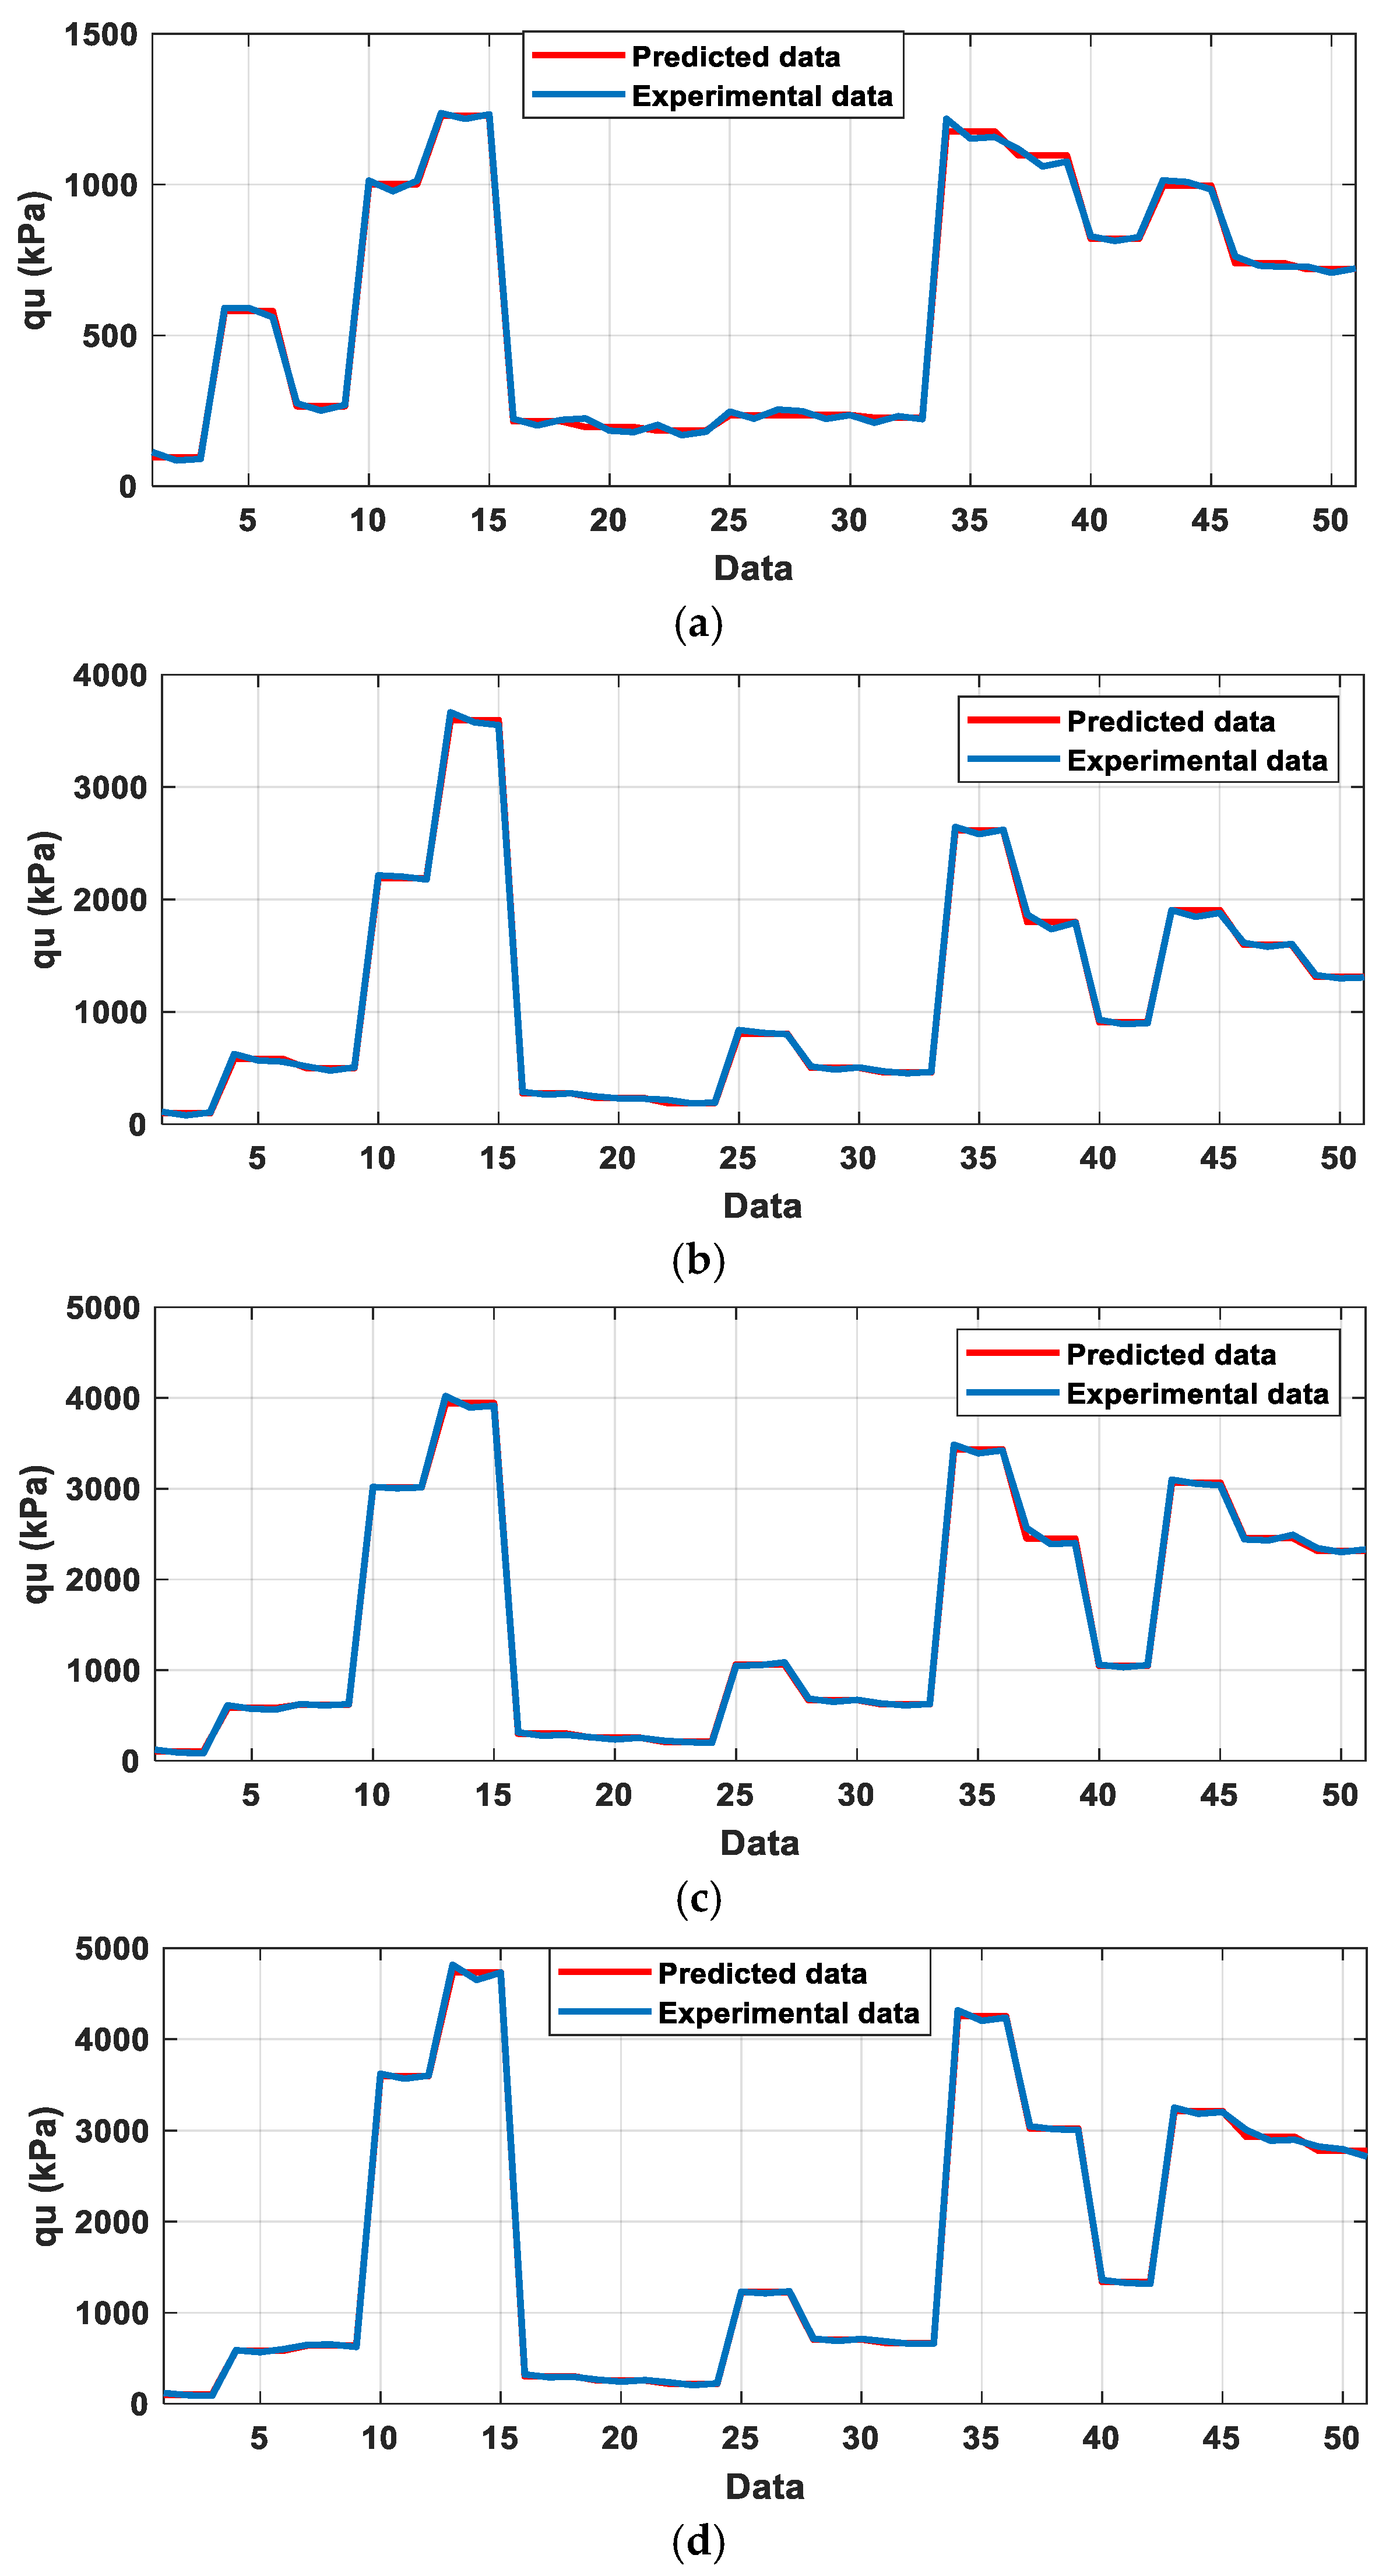
The graphs comparing the prediction results made with the ANN model and the experimental results for pre-cure and post-cure are given in Figure 8.
When Figure 8 is examined, it is seen that the prediction value obtained from the ANN follows the experimental data. This indicates that the ANN model is capable of capturing the underlying trends and nonlinear relationships present in the data. The close alignment between predicted and experimental values suggests a good level of accuracy and model performance.
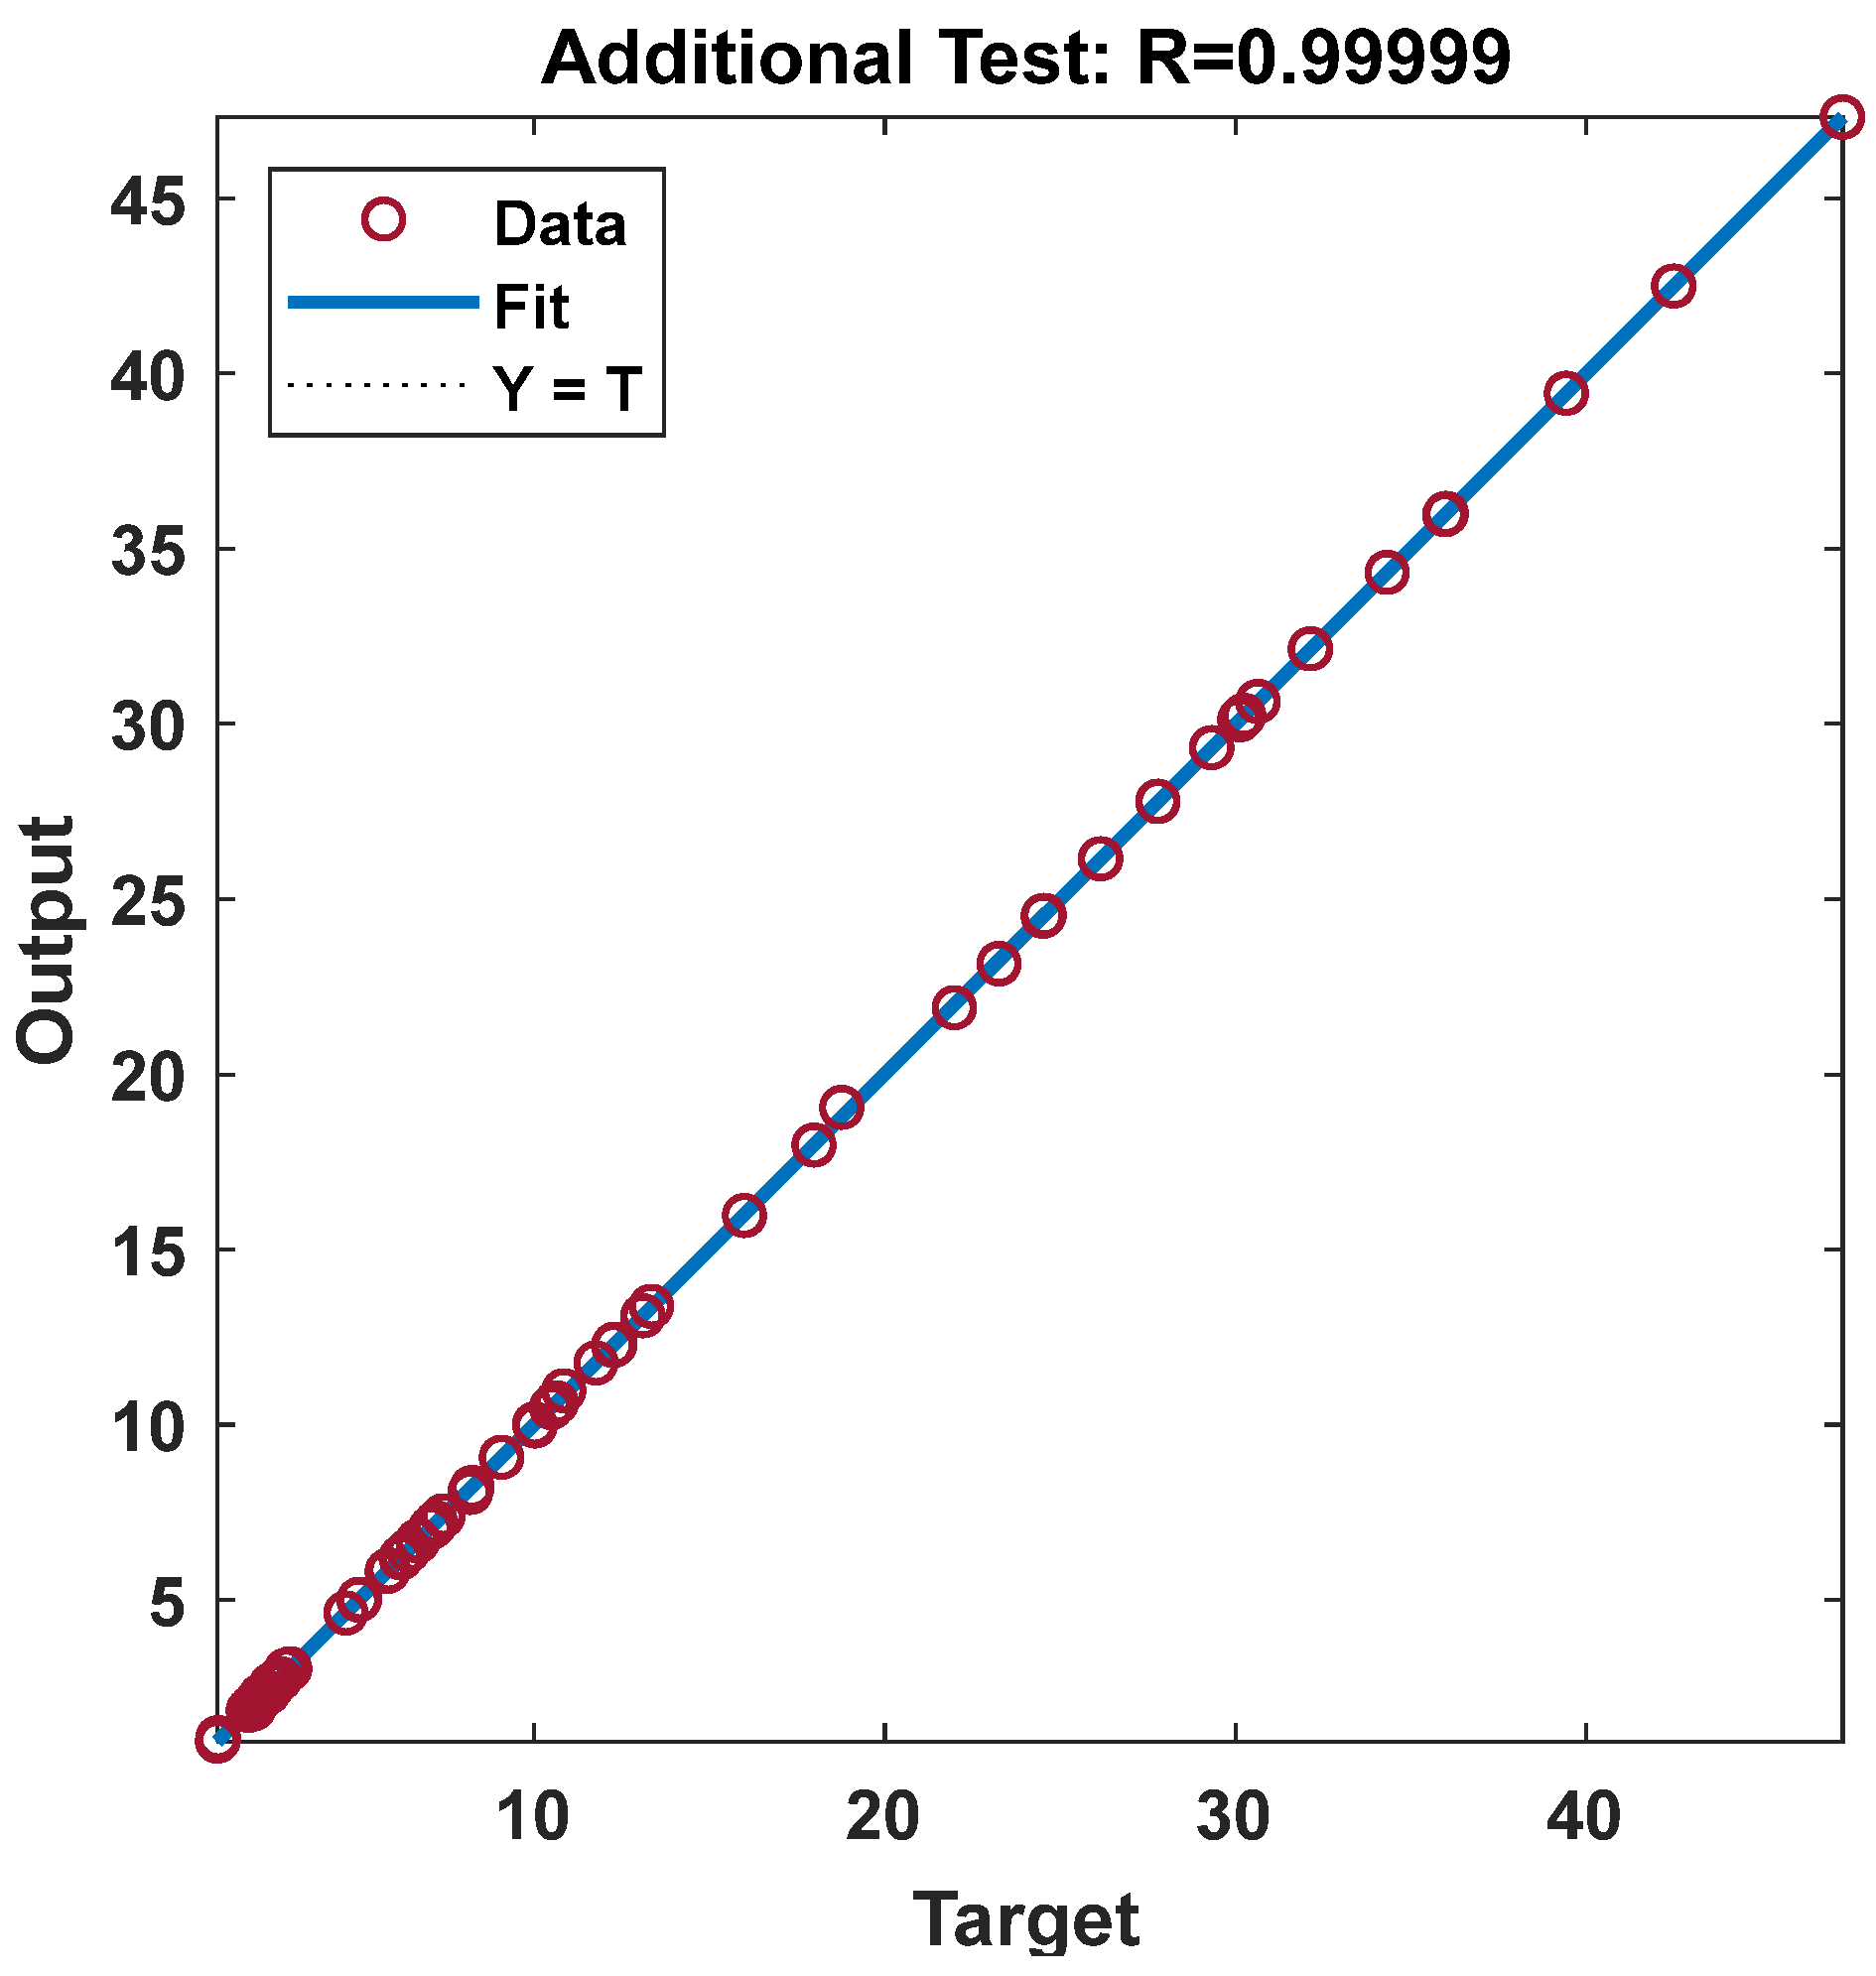
To prove the performance of the pre-cure and post-cure compressive strength prediction made with the ANN, the model was tested using unseen data not involved in the training process. The test regression curve that shows the prediction success of the ANN model is seen in Figure 9, and the R value of the ANN prediction made with the test data is 0.99, and the MSE value is 0.0024. These results demonstrate the strong predictive capability of the model when exposed to unseen data. The high R value and low MSE indicate a well-generalized model. The axes of the graph presented in Figure 9 represent the output and target data numbers used for testing the model.
To further assess the generalization performance and reliability of the ANN model, a 5-fold cross-validation approach was adopted [61]. This statistical technique involves randomly dividing the dataset into five equal subsets. In each iteration, the model is trained on four subsets and tested on the remaining one, ensuring that each subset is used once as the test set. The average of the performance metrics across all folds provides a more robust and unbiased estimate of the model’s predictive capability.
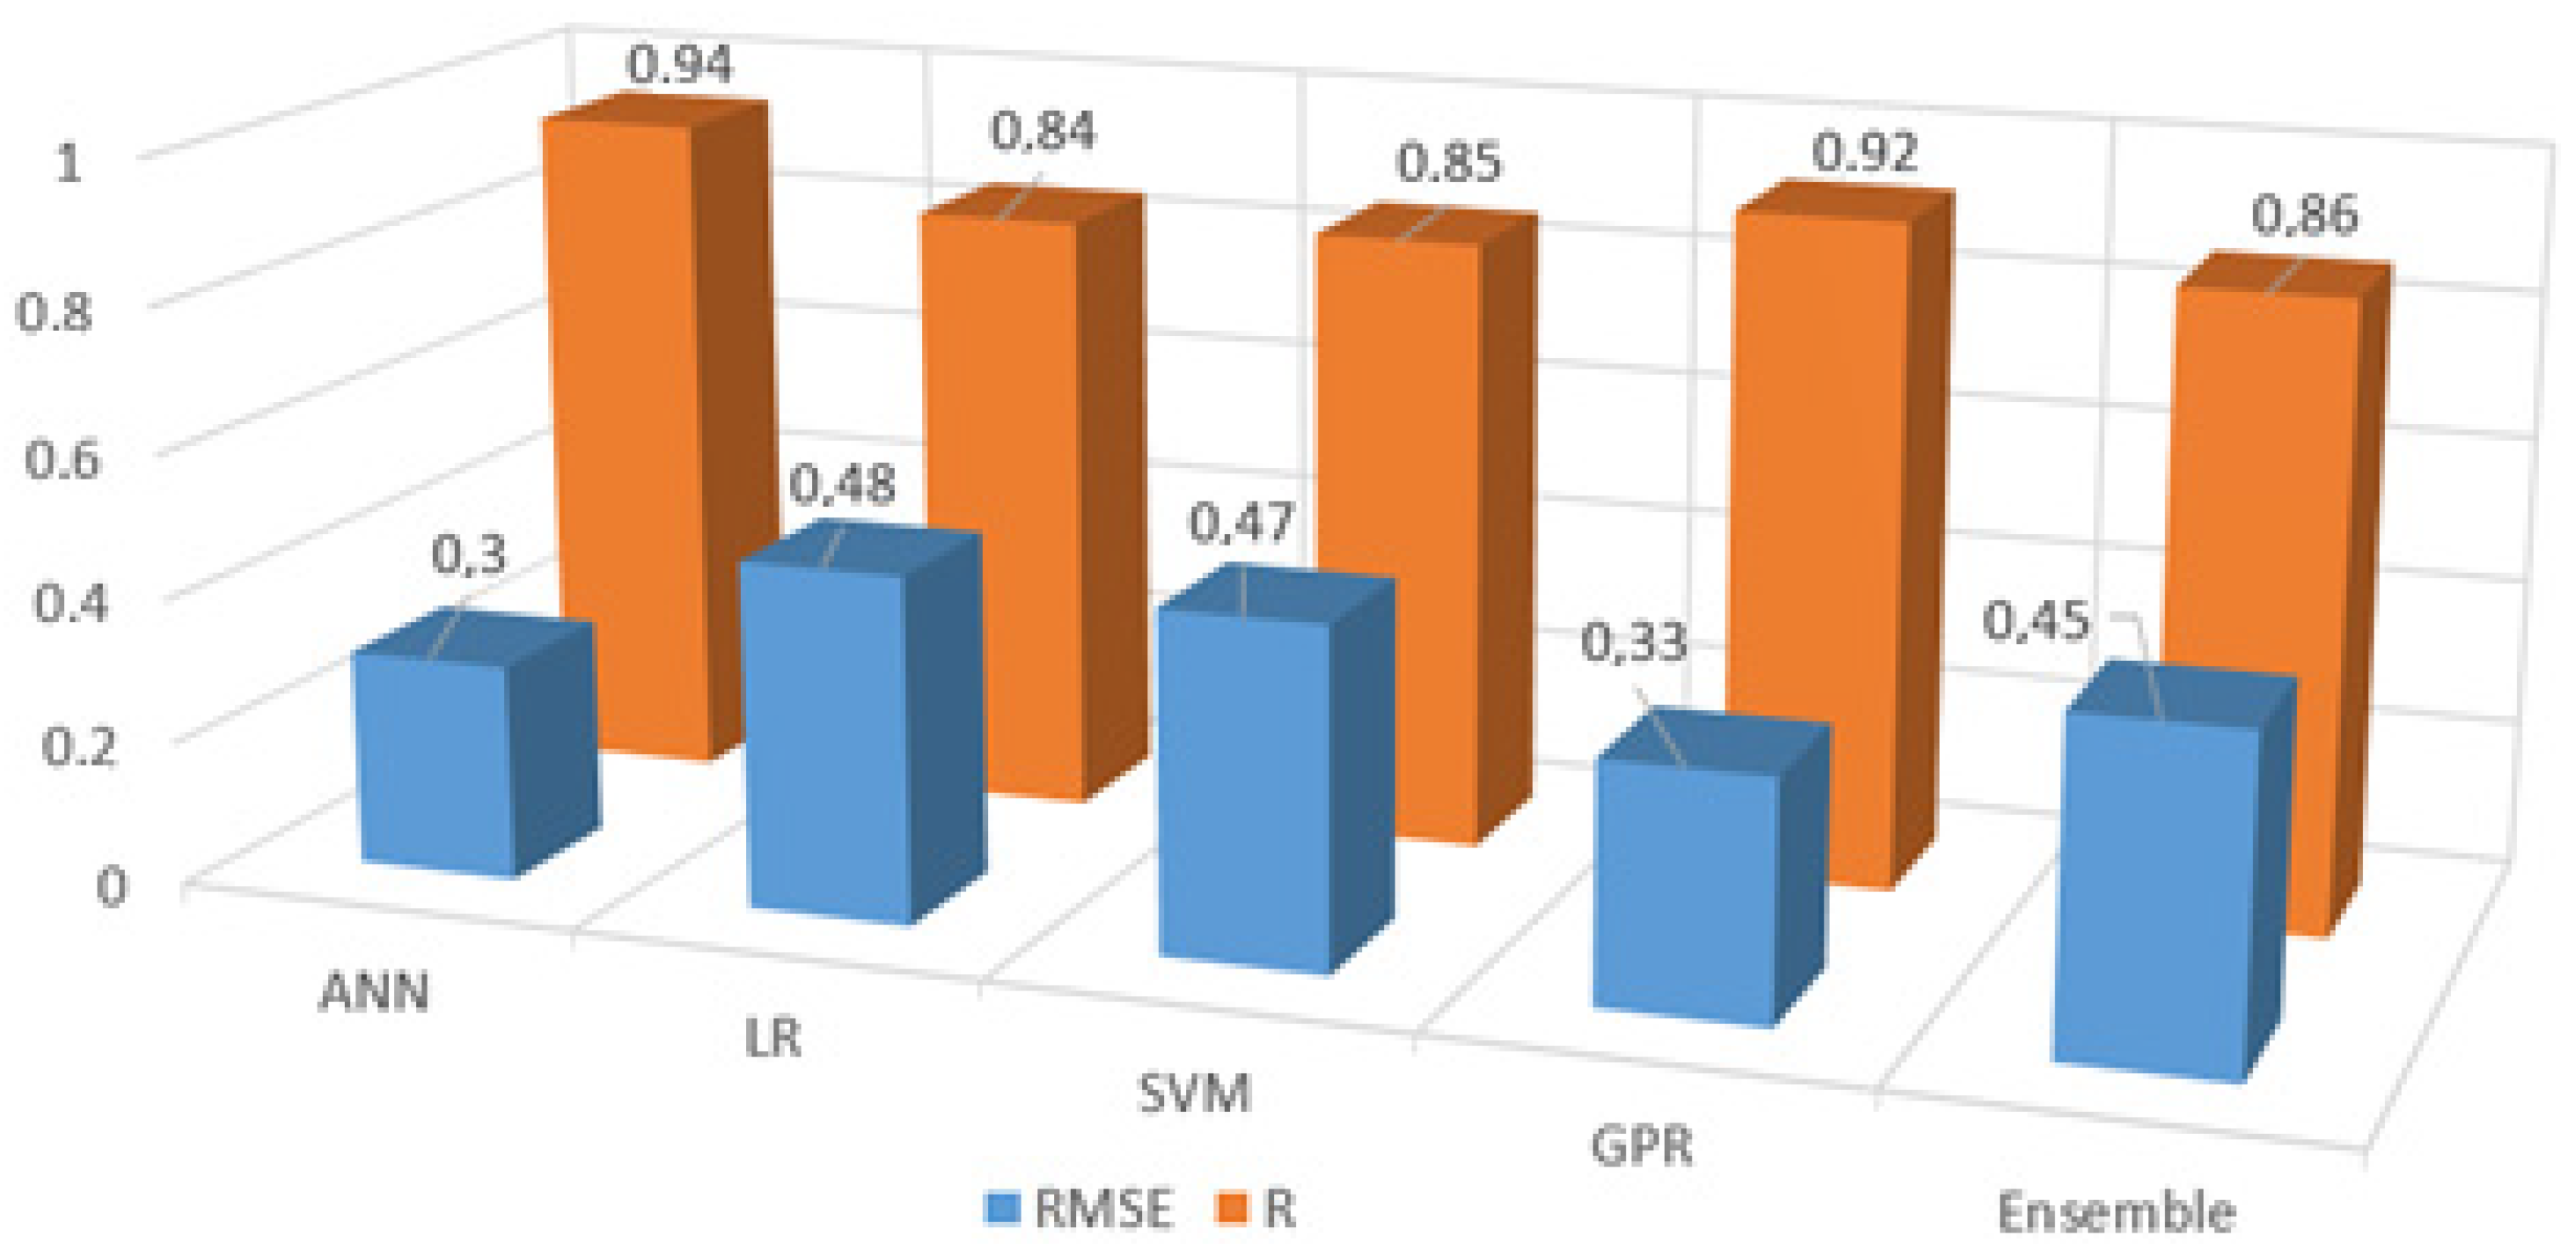
In addition to ANNs, other commonly used machine learning algorithms—linear regression (LR), SVM, Gaussian process regression (GPR), and ensemble methods—were also evaluated using the same procedure for comparative purposes. The performance metrics, including root mean square error (RMSE) and R, were calculated for each model and are summarized in Figure 10. The ANN model outperformed the others, achieving the highest correlation coefficient (R = 0.94) and one of the lowest RMSE values (0.30), demonstrating its superior ability to predict compressive strength reliably.
The 5-fold cross-validation was conducted using MATLAB 2022b Version’s Regression Learner App. While the platform provides reliable average performance metrics, it does not offer access to fold-specific results such as standard deviation or individual fold errors. Therefore, only the overall model accuracy metrics (R = 0.94 and RMSE = 0.30) could be reported. These values provide meaningful insight into the model’s generalization capability and support its robustness across different data subsets.
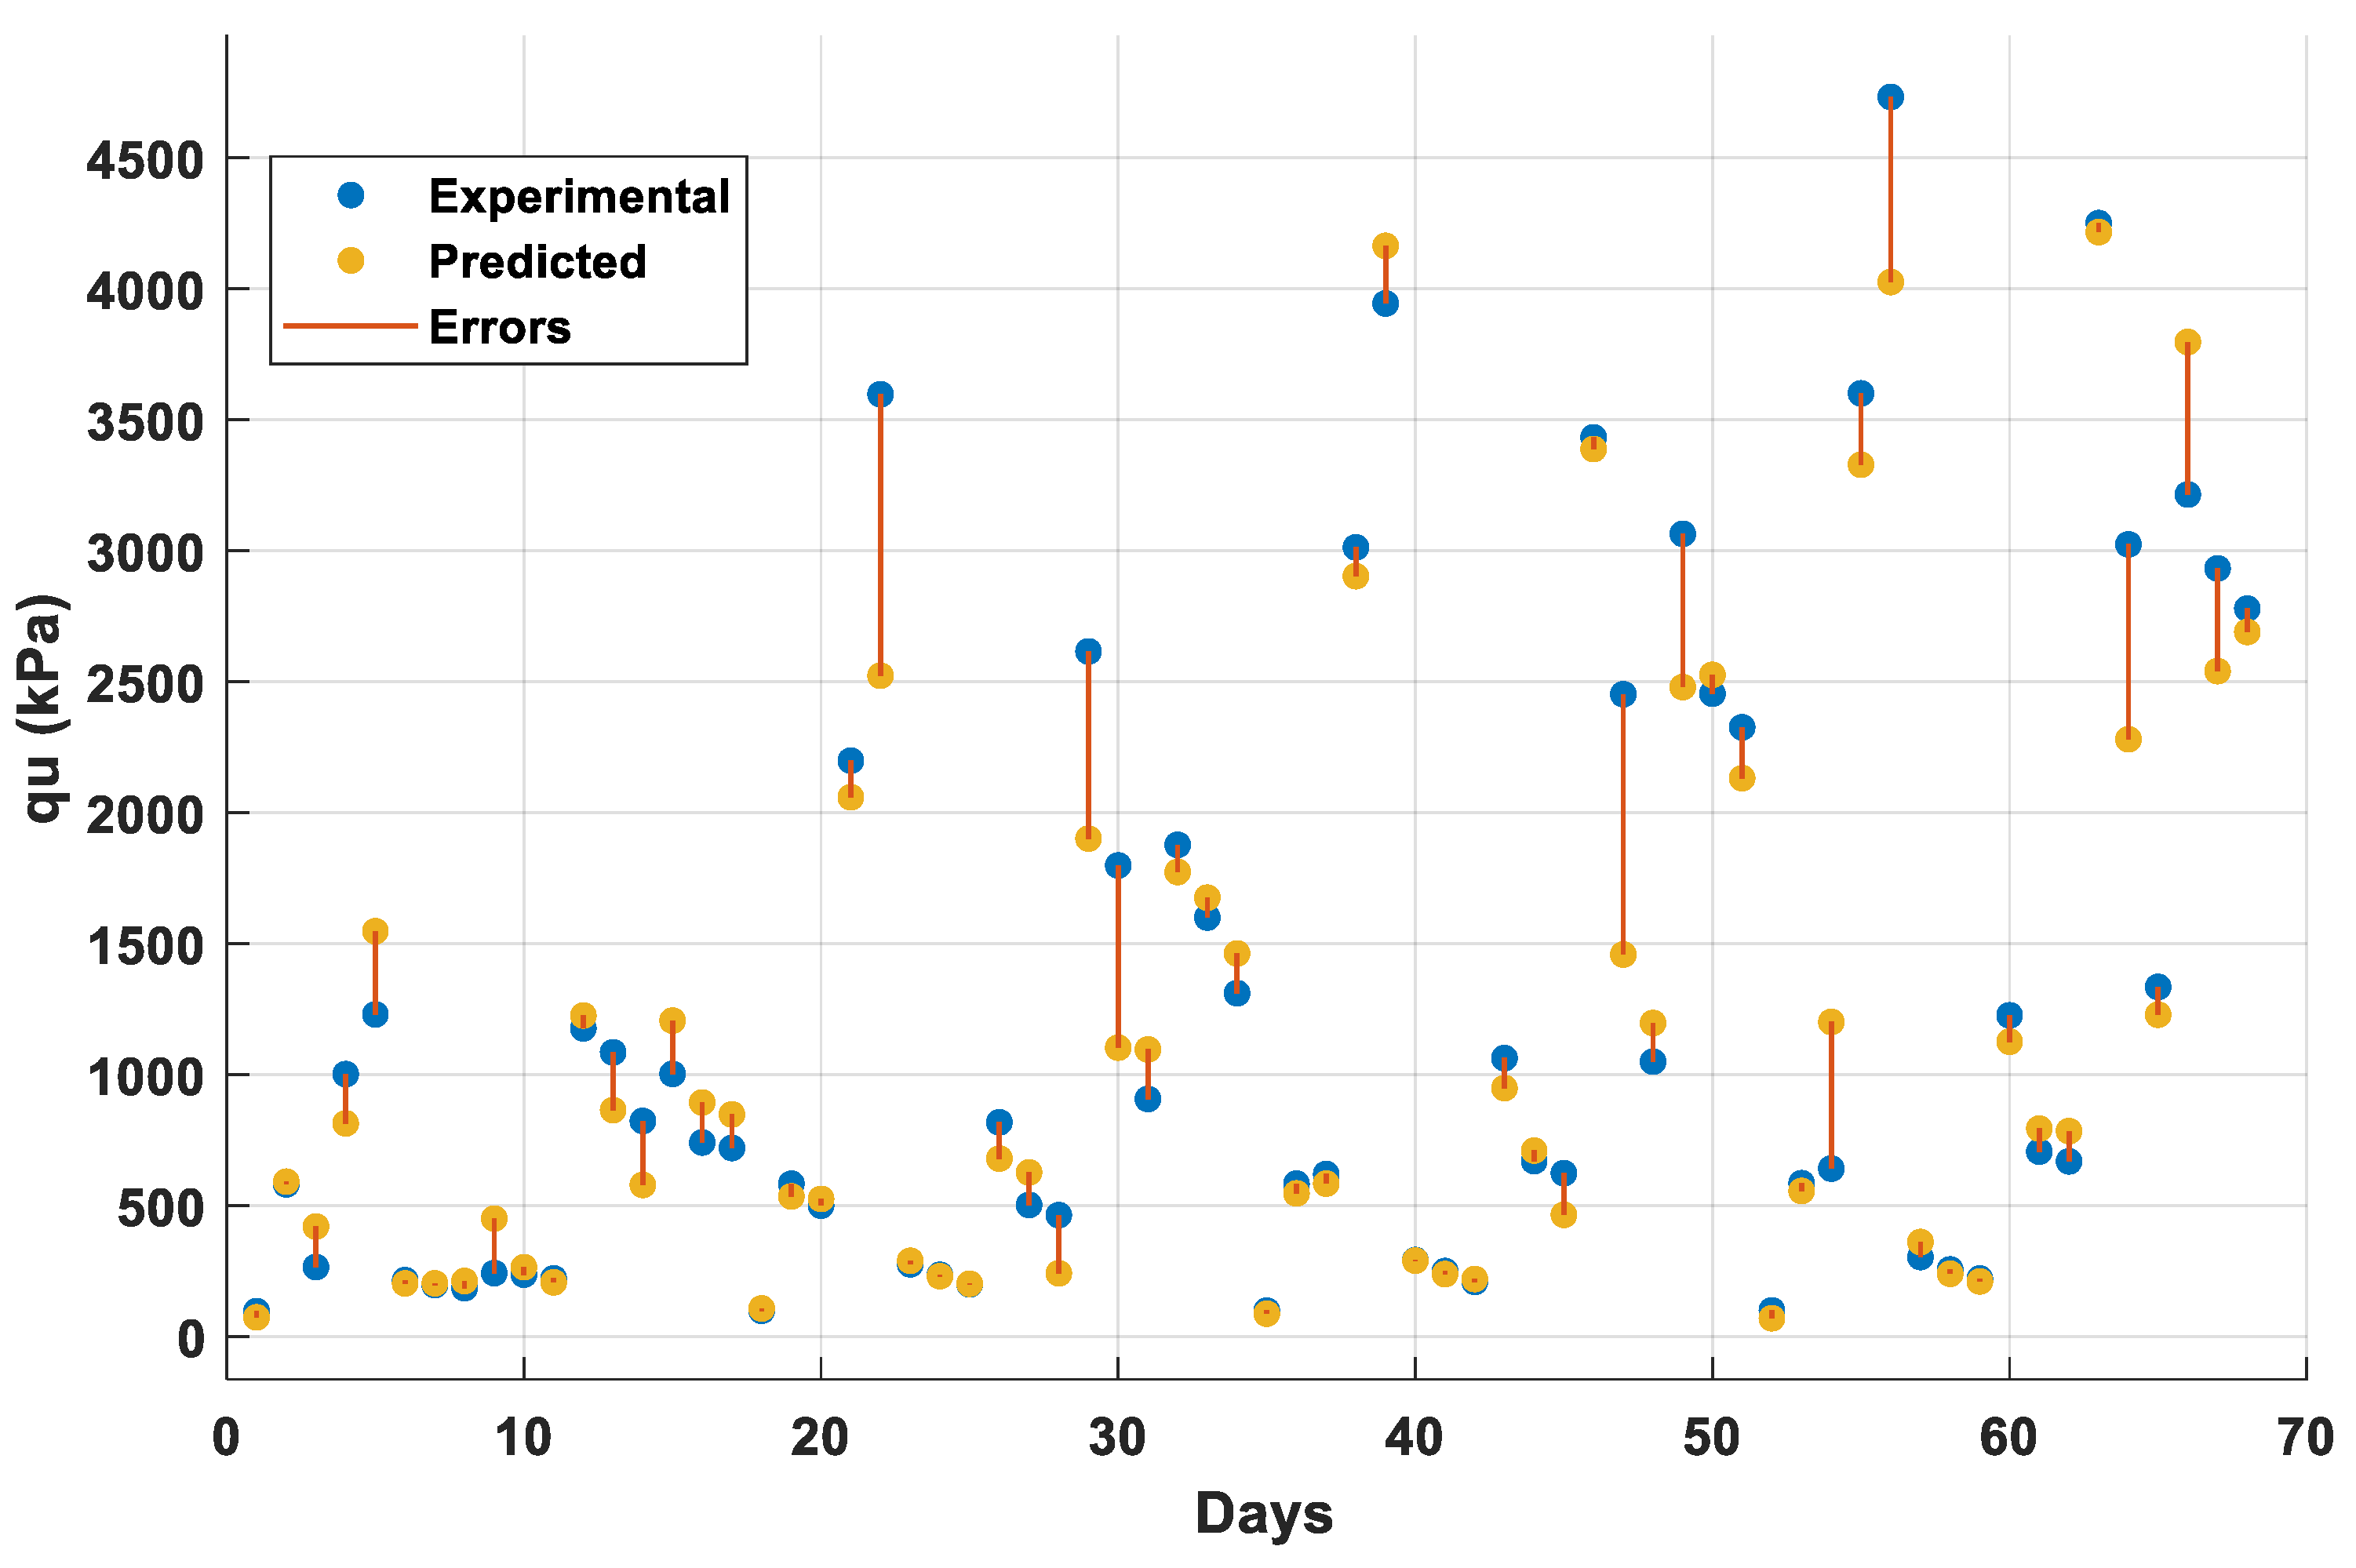
Finally, Figure 11 illustrates the consistency between the predicted and experimental results. To visualize the variability between experimental and predicted results, Figure 11 includes error bars that visualize the experimental and predicted variation. These bars help to evaluate the consistency and reliability of the model predictions. The vertical lines represent the absolute differences between the predicted and experimental values for each data point, providing a visual measure of prediction error. This visualization complements the statistical evaluation and helps assess the model’s pointwise accuracy across the curing period.

5. Conclusions

In this study, 24 mm long BFs (1%) and SL (3%, 6%, 9% dry weight) and T (10%, 20%, 30% dry weight) were added to the K, and the changes in the qu values of the prepared mixtures before curing and after 28, 42, and 56 days of curing were determined. The mixtures were initially prepared at water contents of 25%, 30%, and 35%, and the highest strength values were obtained in samples prepared with 30% water content as a result of the unconfined compression tests conducted on the samples. Therefore, all the mixtures were re-prepared with 30% water content, and experiments were conducted on these samples after curing for 28, 42, and 56 days. According to the experimental results, especially after curing, the qu values of BF-reinforced K improved significantly with the inclusion of T, SL, and combined T+SL additives. In all samples, the highest strength values were determined after 56 days of curing.
When all test results are examined, it is seen that the highest qu value occurs in Sample 5 (4731.80 kPa). However, in Sample 12, the qu value was found to be 4250.53 kPa, and this value is quite high. Compared to Sample 5, where the SL ratio is excessive, it has been revealed that T, which is economical, natural, and abundant in nature, and most importantly environmentally friendly, could be used with a lower SL ratio, as in Sample 12, by taking into account environmental factors and costs. For this reason, the use of Ts, which are abundant in nature and do not cause any harm to the environment, with reinforcement with superior properties such as BF, is of great importance both economically and ecologically. In several geotechnical studies utilizing T with different properties [66,67,68], it has also been stated that T possesses environmentally friendly characteristics.
Experimental studies require significant time and financial resources, making it essential to explore alternative methods that can streamline the process while maintaining accuracy. Reducing the reliance on physical testing through the implementation of AI techniques can enhance efficiency by minimizing labor requirements, shortening processing times, and lowering overall costs.
ANN models accurately predicted qu values across varied mixtures, validated by high R (0.99) and low MSE (0.0137), confirming model reliability. These results confirm the model’s high reliability and strong correlation with experimental data. The corresponding regression curve of the ANN model was also presented to illustrate its prediction capability.
Furthermore, additional ANN-based predictions were performed for the mixture with a 30% water content, which has the highest experimental compressive strength. The compressive strength was estimated for multiple curing stages (pre-curing, 28, 42, and 56 days). A comparative analysis between the experimental values and the ANN-predicted results was performed with graphical representations provided to demonstrate the model’s consistency and predictive effectiveness across different curing days. A good coherence is observed between the predicted and the experimental results of compressive strength.
The optimum BF, SL, T, water content, and curing time determined in this study are suitable for a low-plasticity clay type with the characteristics shown in this research. Therefore, further studies should be conducted for different soil types. Expanding the dataset through new studies by varying BF length and content, SL and T ratios, curing times, and water content will also improve the performance of artificial intelligence models.
Nevertheless, it is important to acknowledge several limitations of the present study. The dataset used for ANN modeling comprises 204 experimental data points, which, while sufficient for initial model training, may limit statistical generalization and increase the potential risk of overfitting. Although 5-fold cross-validation was performed to mitigate this, further validation using larger and more diverse datasets would strengthen model robustness. Second, the experimental results and the ANN model were derived from a specific type of low-plasticity clay under controlled laboratory conditions. Therefore, the applicability of the model to other clay types, site-specific soils, or varying environmental conditions (e.g., temperature, salinity, pH) remains uncertain. Finally, the strength characteristics may also be influenced by field-related factors such as compaction method, in situ moisture variation, or long-term environmental effects, which were not accounted for in this study. These aspects should be explored in future research to improve the generalizability and field relevance of AI-based strength prediction models.

Author Contributions

Conceptualization, data curation, methodology and writing—original draft, Y.A.T. and Z.B.D.; Validation, writing—review & editing, supervision and project administration Z.G. and H.G.; Investigation, Y.A.T.; Resources, Y.A.T. and Z.G.; Software, Z.B.D. and H.G.; Funding acquisition, Z.G. All authors have read and agreed to the published version of the manuscript.

Funding

This research was funded by the Scientific Research Projects Coordination Unit of Fırat University (FÜBAP), grant number MF.24.122.

Data Availability Statement

The original contributions presented in the study are included in the article, further inquiries can be directed to the corresponding author.

Conflicts of Interest

The authors declare no conflicts of interest to report regarding the present study.

References

  1. Hossain, K.M.A.; Mol, L. Some engineering properties of stabilized clayey soils incorporating natural pozzolans and industrial wastes. Constr. Build. Mater. 2011, 25, 3495–3501. [Google Scholar] [CrossRef]
  2. Driss, A.A.E.; Harichane, K.; Ghrici, M.; Mohammed, A.S. Enhancing geotechnical properties of expansive clay with lime and natural pozzolana: Experimental and microstructural analysis. Arab. J. Sci. Eng. 2025, 1–23. [Google Scholar] [CrossRef]
  3. Azadegan, O.; Jafari, S.H.; Li, J. Compaction characteristics and mechanical properties of lime/cement treated granular soils. Electron. J. Geotech. Eng. 2012, 17, 2275–2284. [Google Scholar]
  4. Lin, B.; Cerato, A.B.; Madden, A.S.; Madden, M.E.E. Effect of fly ash on the behavior of expansive soils: Microscopic analysis. Environ. Eng. Geosci. 2013, 19, 85–94. [Google Scholar] [CrossRef]
  5. Mahamedi, A.; Khemissa, M. Cement stabilization of compacted expansive clay. Online J. Sci. Technol. 2013, 3, 33–38. [Google Scholar]
  6. Voottipruex, P.; Jamsawang, P. Characteristics of expansive soils improved with cement and fly ash in Northern Thailand. Geomech. Eng. 2014, 6, 437–453. [Google Scholar] [CrossRef]
  7. Asgari, M.R.; Baghebanzadeh Dezfuli, A.; Bayat, M. Experimental study on stabilization of a low plasticity clayey coil with cement/lime. Arab. J. Geosci. 2015, 8, 1439–1452. [Google Scholar] [CrossRef]
  8. Goodarzi, A.R.; Goodarzi, S.; Akbari, H.R. Assessing geo-mechanical and micro-structural performance of modified expansive clayey soil by silica fume as ındustrial waste. Iran. J. Sci. Technol.-Trans. Civ. Eng. 2015, 39, 333–350. [Google Scholar]
  9. Zhu, J.; Saberian, M.; Perera, S.T.A.M.; Roychand, R.; Li, J.; Wang, G. Reusing COVID-19 disposable nitrile gloves to improve the mechanical properties of expansive clay subgrade: An innovative medical waste solution. J. Clean. Prod. 2022, 375, 134086. [Google Scholar] [CrossRef]
  10. Aslan Topçuoğlu, Y.; Gürocak, Z. Changes in the strength of high-plasticity clays after stabilization: An experimental study. Iran. J. Sci. Technol. Trans. Civ. Eng. 2023, 47, 1109–1123. [Google Scholar] [CrossRef]
  11. Al-Gharbawi, A.S.; Najemalden, A.M.; Fattah, M.Y. Expansive soil stabilization with lime, cement, and silica fume. Appl. Sci. 2022, 13, 436. [Google Scholar] [CrossRef]
  12. Raja, K.; Venkatachalam, S.; Vishnuvardhan, K.; Krishnan, R.S.R.; Selvan, V.T.; Vetriselvan, N. A review on soil stabilization using rice husk ash and lime sludge. Mater. Today Proc. 2022, 65, 1205–1212. [Google Scholar] [CrossRef]
  13. Bulut, Ü. Pozzolanic Activity of Perlite. Ph.D. Thesis, İstanbul Technical University, İstanbul, Turkey, 2007. [Google Scholar]
  14. Kavlak, Y. Use of Isparta-Gelincik Pumice in Stabilization of Highway Flexible Pavement Subgrade. Master’s Thesis, Süleymen Demirel University, Isparta, Turkey, 2008. [Google Scholar]
  15. Bulut, Ü.; Tanaçan, L. Pozzolanic activity of perlite. İTÜ Derg. Archit. Plan. Des. 2009, 8, 81–89. [Google Scholar]
  16. Çalik, U.; Şadoglu, E. Engineering properties of expansive clayey soil stabilized with lime and perlite. Geomech. Eng. 2014, 6, 403–418. [Google Scholar] [CrossRef]
  17. Yılmaz, F. Fineness effect of pozzolanic additive on strength in soil stabilization. AKU J. Sci. Eng. 2017, 17, 1048–1054. [Google Scholar] [CrossRef]
  18. Çimen, Ö.; Coşan, F.Ş. Volkanik tüf ve amorf silikanin kilin mühendislik özelliklerine etkisi. Mühendislik Bilim. Ve Tasarım Derg. 2019, 7, 459–466. [Google Scholar] [CrossRef]
  19. Çimen, Ö.; Dereli, B.; Keleş, E. Comparison of the effect of pumice of three different regions to high plasticity clay. BEU J. Sci. 2020, 9, 427–433. [Google Scholar]
  20. Czigány, T.; Vad, J.; Pölöskei, K. Basalt fiber as a reinforcement of polymer composites. Period. Polytech. Mech. Eng. 2005, 49, 3–14. [Google Scholar]
  21. Gao, L.; Hu, G.; Xu, N.; Fu, J.; Xiang, C.; Yang, C. Experimental study on unconfined compressive strength of basalt fiber reinforced clay soil. Adv. Mater. Sci. Eng. 2015, 561293. [Google Scholar] [CrossRef]
  22. Ndepete, C.P.; Sert, S. Use of basalt fibers for soil improvement. Acta Phys. Pol. 2016, 130, 355–356. [Google Scholar] [CrossRef]
  23. Kenan, A.; Özocak, A. Bazalt fiber katkısının siltli zeminlerin kayma direncine etkisi. In Proceedings of the 2nd International Symposium on Natural Hazards and Disaster Management, Melbourne, Australia, 26–27 July 2018; pp. 918–924. [Google Scholar]
  24. Sungur, A.; Yazıcı, M.F.; Keskin, S.N. Experimental research on the engineering properties of basalt fiber reinforced clayey soil. Eur. J. Sci. Technol. Spec. Issue 2021, 28, 895–899. [Google Scholar]
  25. Gürocak, Z.; Aslan Topçuoğlu, Y. The effect of basalt fiber use on the unconfined compressive strength of low plasticity clay. Gümüşhane Univ. J. Sci. Technol. 2023, 13, 688–701. [Google Scholar]
  26. Zhao, N.; Wu, H.; Huang, Z. Strength behavior of red clay reinforced by basalt chopped fiber. Arab. J. Geosci. 2021, 14, 15. [Google Scholar] [CrossRef]
  27. Jia, Y.; Zhang, J.S.; Wang, X.; Ding, Y.; Chen, X.B.; Liu, T. Experimental study on mechanical properties of basalt fiber-reinforced silty clay. J. Cent. South Univ. 2022, 29, 1945–1956. [Google Scholar] [CrossRef]
  28. Song, Y.; Geng, Y.; Dong, S.; Ding, S.; Xu, K.; Yan, R.; Liu, F. Study on mechanical properties and microstructure of basalt fiber-modified red clay. Sustainability 2023, 15, 4411. [Google Scholar] [CrossRef]
  29. Chen, J.; Mu, J.; Chen, A.; Long, Y.; Zhang, Y.; Zou, J. Experimental Study on the Properties of Basalt Fiber–Cement-Stabilized Expansive Soil. Sustainability 2024, 16, 7579. [Google Scholar] [CrossRef]
  30. Özdemir, T.; Polat, G.E.; Azdeniz, O.; Boz, A.; Sezer, A. Strength properties of clay soil reinforced with basalt fiber and lime. In Proceedings of the 16th National Congress of Soil Mechanics and Foundation Engineering, Osaka, Japan, 12–16 September 2016; Volume 16, pp. 1025–1035. [Google Scholar]
  31. Wang, Y.; Sun, S.; Ye, W.; Li, F.; Ding, H. Laboratory test of expansive soil improved by lime–basalt fiber reinforcement. In Proceedings of the Transportation Research Congress 2016: Innovations in Transportation Research Infrastructure, Beijing, China, 6–8 June 2016. [Google Scholar]
  32. Boz, A.; Sezer, A.; Özdemir, T.; Hızal, G.E.; Azdeniz Dolmacı, O. Mechanical properties of lime-treated clay reinforced with different types of randomly distributed fibers. Arab. J. Geosci. 2018, 11, 122. [Google Scholar] [CrossRef]
  33. Cao, Z.; Ma, O.; Wang, H. Effect of basalt fiber addition on static-dynamic mechanical behaviors and microstructure of stabilized soil compositing cement and fly ash. Hindawi Adv. Civ. Eng. 2019, 1–20. [Google Scholar] [CrossRef]
  34. Ma, Q.Y.; Cao, Z.M.; Yuan, P. Experimental research on microstructure and physical-mechanical properties of expansive soil stabilized with fly ash, sand, and basalt fiber. Adv. Mater. Sci. Eng. 2018, 1–13. [Google Scholar] [CrossRef]
  35. Shen, M. Laboratory experimental study on improvement of silty soil lime and basalt fiber in Hangjiahu. J. Innov. Dev. 2023, 2, 115–118. [Google Scholar] [CrossRef]
  36. Tabarsa, A.; Latifi, N.; Osouli, A.; Bagheri, Y. Unconfined compressive strength prediction of soils stabilized using artificial neural networks and support vector machines. Front. Struct. Civ. Eng. 2021, 15, 520–536. [Google Scholar] [CrossRef]
  37. Chumacero, J.M.G.; Torres, P.L.A.; La Portilla, C.C.C.; Perez, S.P.M. Influence of artificial intelligence on the optimization of the dosage of natural hydraulic lime, plastic and metallic fibers on the geological characteristics of a treated soil. Rev. Ing. De Construcción 2023, 38. [Google Scholar] [CrossRef]
  38. Garg, A.; Bordoloi, S.; Mondal, S.; Ni, J.J.; Sreedeep, S. investigation of mechanical factor of soil reinforced with four types of fibers: An integrated experimental and extreme learning machine approach. J. Nat. Fibers 2020, 17, 650–664. [Google Scholar] [CrossRef]
  39. Tiwarii, N.; Satyam, N. Coupling effect of pond ash and polypropylene fiber on strength and durability of expansive soil subgrades: An integrated experimental and machine learning approach. J. Rock Mech. Geotech. Eng. 2021, 13, 1101–1112. [Google Scholar] [CrossRef]
  40. Ndepete, C.P.; Sert, S.; Beycioğlu, A.; Katanalp, B.Y.; Eren, E.; Bağrıaçık, B.; Topolinski, S. Exploring the effect of basalt fibers on maximum deviator stress and failure deformation of silty soils using ANN, SVM and FL supported by experimental data. Adv. Eng. Softw. 2022, 172, 103211. [Google Scholar] [CrossRef]
  41. Sungur, A.; Yazıcı, M.F.; Keskin, N. Prediction of the shear strength of glass fiber-reinforced clay soil by adaptive neuro-fuzzy inference system (ANFIS). El-Cezeri 2022, 9, 1255–1264. [Google Scholar]
  42. Sert, S.; Arslan, E.; Ocakbaşı, P.; Ekinci, E.; Garip, Z.; Özocak, A.; Bol, E.; Ndepete, C.P. Stabilization of expansive clays with basalt fibers and prediction of strength by machine learning. Arab. J. Sci. Eng. 2024, 49, 13651–13670. [Google Scholar] [CrossRef]
  43. Jeremiah, J.J.; Abbey, S.J.; Booth, C.A.; Kashyap, A. Results of application of artificial neural networks in predicting geo-mechanical properties of stabilised clays—A review. Geotechnics 2021, 1, 147–171. [Google Scholar] [CrossRef]
  44. Onyelowe, K.C.; Alaneme, G.U.; Onyia, M.E.; Bui Van, D.; Diomonyeka, M.U.; Nnadi, E.; Ogbonna, C.; Odum, L.O.; Aju, D.E.; Abel, C.; et al. Comparative modeling of strength properties of hydrated-lime activated rice-husk-ash (HARHA) modified soft soil for pavement construction purposes by artificial neural network (ANN) and fuzzy logic (FL). J. Kejuruter. 2021, 33, 365–384. [Google Scholar]
  45. Tinoco, J.; Correia, A.A.S.; Venda Oliveira, P.J. Soil-cement mixtures reinforced with fibers: A data-driven approach for mechanical properties prediction. Appl. Sci. 2021, 11, 8099. [Google Scholar] [CrossRef]
  46. Raja, M.N.A.; Shukla, S.K.; Khan, M.U.A. An intelligent approach for predicting the strength of geosynthetic-reinforced subgrade soil. Int. J. Pavement Eng. 2022, 23, 3505–3521. [Google Scholar] [CrossRef]
  47. Rabbani, A.; Samui, P.; Kumari, S. Optimized ANN-based approach for estimation of shear strength of soil. Asian J. Civ. Eng. 2023, 24, 3627–3640. [Google Scholar] [CrossRef]
  48. Duong, N.T.; Tran, K.Q. Estimation of seepage velocity and piping resistance of fiber-reinforced soil by using artificial neural network-based approach. Neural Comput. Appl. 2023, 35, 2443–2455. [Google Scholar] [CrossRef]
  49. Vahedi, J.; Koohmishi, M. Assessing the strength of lime-treated clayey soil reinforced with PET: A ML-based data-derived approach. Results Eng. 2025, 25, 103913. [Google Scholar] [CrossRef]
  50. Thapa, I.; Ghani, S.; Asteris, P.G. Neural network coupled with nature-inspired optimization algorithms for prediction of microstructural and mechanical properties of nano-silica treated fine-grained soil. Model. Earth Syst. Environ. 2025, 11, 69. [Google Scholar] [CrossRef]
  51. Kumar, A.; Sinha, S. Machine learning-based hybrid regularization techniques for predicting unconfined compressive strength of soil reinforced with multiple additives. Multiscale Multidiscip. Model. Exp. Des. 2025, 8, 228. [Google Scholar] [CrossRef]
  52. Sharma, L.K.; Umrao, R.K.; Singh, R.; Singh, T.N. Artificial Neural Network Approach to Evaluate Geotechnical Properties of Lime-Treated Mountain Soil: A Slope Stabilization Perspective. Transp. Infrastruct. Geotechnol. 2025, 12, 1–37. [Google Scholar] [CrossRef]
  53. Güven, I.H. (General Directorate of Mineral Research and Exploration, Ankara, Turkey). Doğu Pontidler’in Jeolojisi ve 1/250,000 Ölçekli Kompliasyonu. Report of the General Directorate of Mineral Research and Exploration. Unpublished work. 1993. [Google Scholar]
  54. Aslan Topçuoğlu, Y. The Effect of Different Additive Materials on the Engineering Properties of Soils. Ph.D. Thesis, Fırat University, Elazığ, Turkey, 2020. [Google Scholar]
  55. Jamshaid, H.; Mishra, R. A green material from rock: Basalt fiber-a review. J. Text. Inst. 2015, 107, 923–937. [Google Scholar] [CrossRef]
  56. Aslan Topçuoğlu, Y.; Gürocak, Z. The effect of basalt fiber reinforcement at different ratios on the unconfined compressive strength of kaolin. Niğde Ömer Halisdemir Üniversitesi Mühendislik Bilim. Derg. 2024, 13, 169–175. [Google Scholar] [CrossRef]
  57. ASTM D698-12e2; Standard Test Methods for Laboratory Compaction Characteristics of Soil Using Standard Effort. ASTM International: West Conshohocken, PA, USA, 2012.
  58. Aydın, S. Improvement of the Geotechnical Properties of Yenikent (Ankara) Settlement Area Clays with Lime and Fly Ash. Master’s Thesis, Gazi University, Ankara, Turkey, 2010. [Google Scholar]
  59. Ghabaee, S. Curing Time Effects on the Bearing Capacity of Stabilized Bentonite with Lime. Master’s Thesis, Istanbul Technical University, Istanbul, Turkey, 2015. [Google Scholar]
  60. ASTM D2166M-16; Standard Test Method for Unconfined Compressive Strength of Cohesive Soil. ASTM International: West Conshohocken, PA, USA, 2016.
  61. Guldemir, N.H.; Alkan, A. Classification of optical coherence tomography images via deep learning. Firat Univ. J. Eng. Sci. 2021, 33, 607–615. [Google Scholar]
  62. Sengur, D. Pedagogical othering and suicide: A preventive model proposal with machine learning approaches. Int. Online J. Educ. Sci. 2023, 15, 414–427. [Google Scholar]
  63. Demir, T.; Duranay, Z.B.; Demirel, B.; Yildirim, B. Artificial neural network evaluation of concrete performance exposed to elevated temperature with destructive-non-destructive tests. Neural Comput. Appl. 2024, 36, 17079–17093. [Google Scholar] [CrossRef]
  64. Alqahtani, F. Ai-powered image security: Utilizing autoencoders for advanced medical image encryption. CMES-Comput. Model. Eng. Sci. 2024, 141, 1709. [Google Scholar] [CrossRef]
  65. Duranay, Z.B. Neural network based harmonic elimination in single-phase inverters. COMPEL-Int. J. Comput. Math. Electr. Electron. Eng. 2023, 42, 543–564. [Google Scholar] [CrossRef]
  66. Rabab’ah, S.R.; Taamneh, M.M.; Abdallah, H.M.; Nusier, O.K.; Ibdah, L. Effect of adding zeolitic tuff on geotechnical properties of lime-stabilized expansive soil. KSCE J. Civ. Eng. 2021, 25, 4596–4609. [Google Scholar] [CrossRef]
  67. Yilmaz, F.; Kuvat, A.; Kamiloğlu, H.A. Optimizing and investigating durability performance of sandy soils stabilized with alkali activated waste tuff-fly ash mixtures. Sādhanā 2023, 48, 185. [Google Scholar] [CrossRef]
  68. Abutaqa, A.; Mohsen, M.O.; Aburumman, M.O.; Senouci, A.; Taha, R.; Maherzi, W.; Qtiashat, D. Eco-Sustainable Cement: Natural Volcanic Tuffs’ Impact on Concrete Strength and Durability. Buildings 2024, 14, 2902. [Google Scholar] [CrossRef]
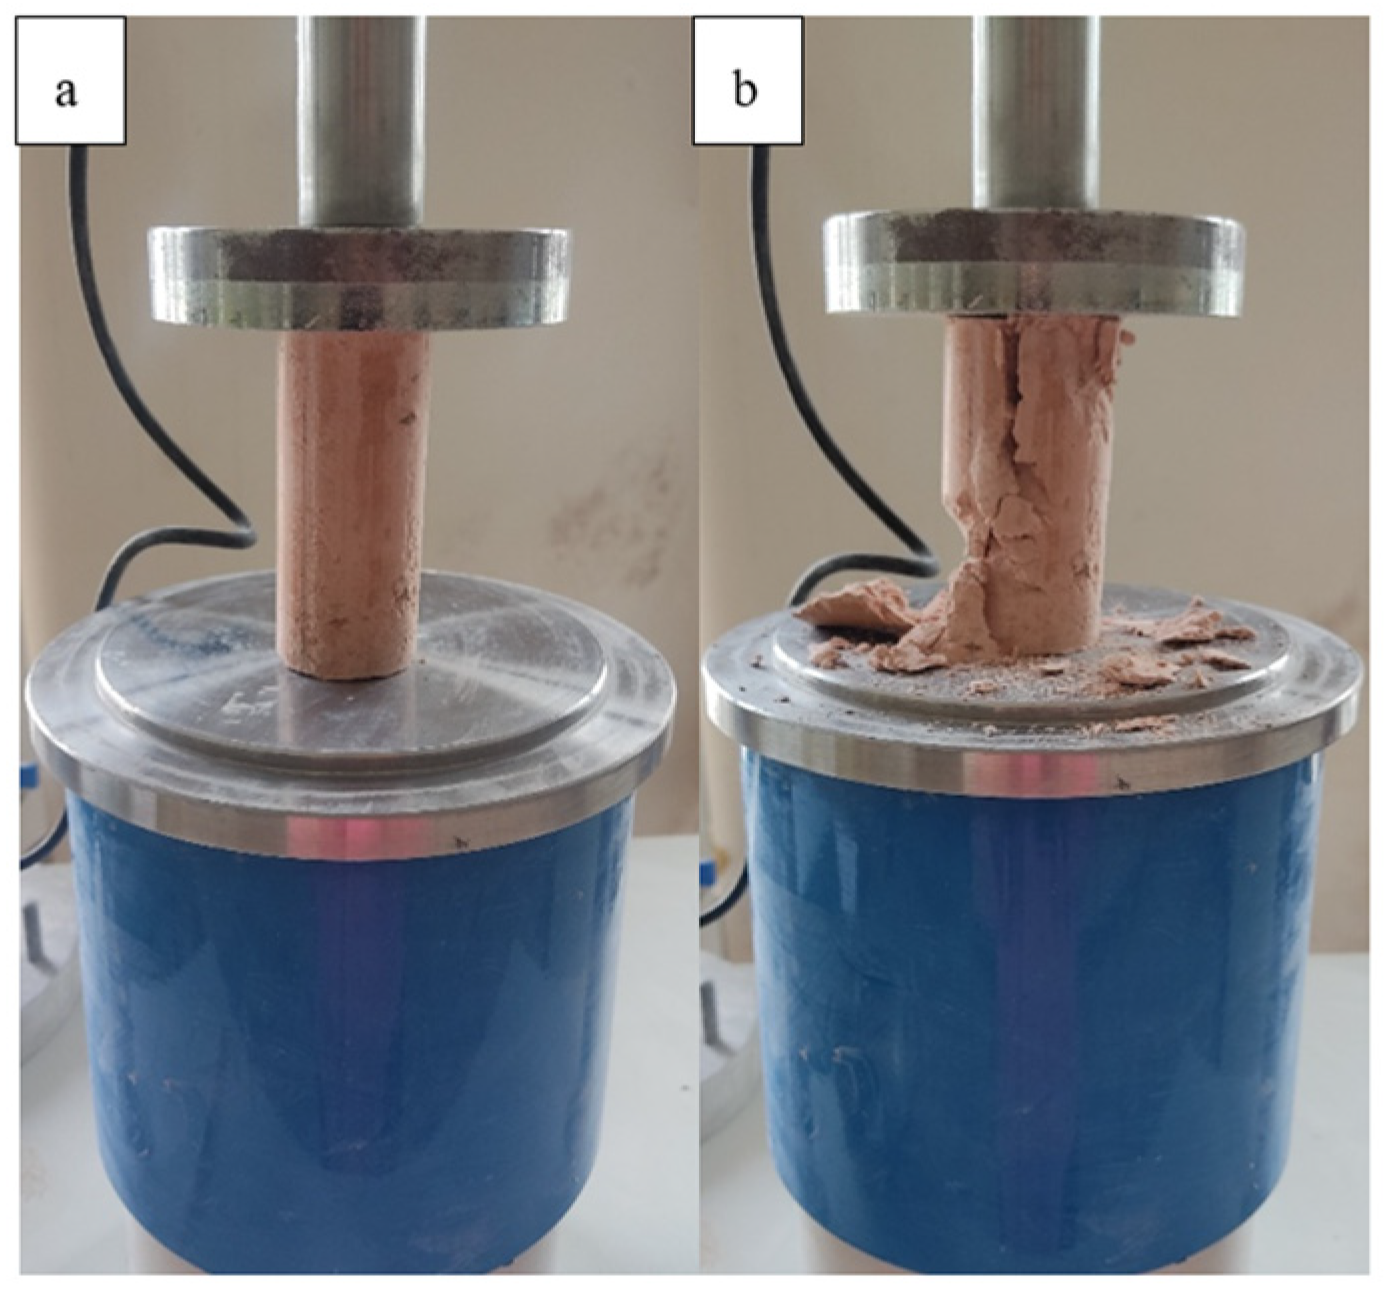
Figure 1. Samples (a). before and (b). after the unconfined compression test.
Buildings 15 02433 g001
Figure 2. The water ratio–qu relationship of the samples before curing.
Buildings 15 02433 g002
Figure 3. Experimental results for pre-curing with error bars representing ±1 standard deviation for each measurement.
Buildings 15 02433 g003
Figure 4. The ANN Simulink model used in the study.
Buildings 15 02433 g004
Figure 5. Best validation performance plot of the model.
Buildings 15 02433 g005
Figure 6. Regression plot of the model.
Buildings 15 02433 g006
Figure 7. Simulink-based ANN model for estimating qu values from additive contents and curing duration.
Buildings 15 02433 g007
Figure 8. Comparison between predicted and experimental compressive strength values for (a) pre-curing, (b) 28 days of curing, (c) 42 days of curing, and (d) 56 days of curing.
Buildings 15 02433 g008
Figure 9. The prediction success of the ANN model.
Buildings 15 02433 g009
Figure 10. Comparison of artificial intelligence models (ANN, LR, SVM, GPR, Ensemble) based on 5-fold cross-validation results in terms of RMSE and R values.
Buildings 15 02433 g010
Figure 11. Comparison of experimental and ANN-predicted qu values over curing days.
Buildings 15 02433 g011
Table 1. Sample codes and explanations.
Sample
Number
Sample CodeExplanations
1 KClay
2 K + BF 1%Clay + Basalt Fiber (1%)
3 K + BF 1% + SL 3%Clay + Basalt Fiber (1%) + Slaked Lime (3%)
4 K + BF 1% + SL 6%Clay + Basalt Fiber (1%) + Slaked Lime (6%)
5 K + BF 1% + SL 9%Clay + Basalt Fiber (1%) + Slaked Lime (9%)
6 K + BF 1% + T 10%Clay + Basalt Fiber (1%) + Tuff (10%)
7 K + BF 1% + T 20%Clay + Basalt Fiber (1%) + Tuff (20%)
8 K + BF 1% + T 30%Clay + Basalt Fiber (1%) + Tuff (30%)
9 K + BF 1% + SL 3% + T 10%Clay + Basalt Fiber (1%) + Slaked Lime (3%) + Tuff (10%)
10 K + BF 1% + SL 3% + T 20%Clay + Basalt Fiber (1%) + Slaked Lime (3%) + Tuff (20%)
11 K + BF 1% + SL 3% + T 30%Clay + Basalt Fiber (1%) + Slaked Lime (3%) + Tuff (30%)
12 K + BF 1% + SL 6% + T 10%Clay + Basalt Fiber (1%) + Slaked Lime (6%) + Tuff (10%)
13 K + BF 1% + SL 6% + T 20%Clay + Basalt Fiber (1%) + Slaked Lime (6%) + Tuff (20%)
14 K + BF 1% + SL 6% + T 30%Clay + Basalt Fiber (1%) + Slaked Lime (6%) + Tuff (30%)
15 K + BF 1% + SL 9% + T 10%Clay + Basalt Fiber (1%) + Slaked Lime (9%) + Tuff (10%)
16 K + BF 1% + SL 9% + T 20%Clay + Basalt Fiber (1%) + Slaked Lime (9%) + Tuff (20%)
17 K + BF 1% + SL 9% + T 30%Clay + Basalt Fiber (1%) + Slaked Lime (9%) + Tuff (30%)
Table 2. Clay and additive ratios used in mixtures.
Sample
Number
Sample CodeK (%)BF (%)SL (%)T (%)
1K100000
2K + BF 1%99100
3K + BF 1% + SL 3%96130
4K + BF 1% + SL 6%93160
5K + BF 1% + SL 9%90190
6K + BF 1% + T 10%891010
7K + BF 1% + T 20%791020
8K + BF 1% + T 30%691030
9K + BF 1% + SL 3% + T 10%861310
10K + BF 1% + SL 3% + T 20%761320
11K + BF 1% + SL 3% + T 30%661330
12K + BF 1% + SL 6% + T 10%831610
13K + BF 1% + SL 6% + T 20%731620
14K + BF 1% + SL 6% + T 30%631630
15K + BF 1% + SL 9% + T 10%801910
16K + BF 1% + SL 9% + T 20%701920
17K + BF 1% + SL 9% + T 30%601930
Table 3. qu values of mixtures prepared in different water contents before curing.
Sample
Number
Sample CodeUnconfined Compressive Strength, qu (kPa)
Water Ratio (%)
253035
1 K294.0896.0747.09
2 K + BF 1%807.40580.5351.89
3 K + BF 1% + SL 3%215.75264.78220.41
4 K + BF 1% + SL 6%510.371001.21977.02
5 K + BF 1% + SL 9%680.281229.231124.05
6 K + BF 1% + T 10%201.52214.65175.25
7 K + BF 1% + T 20%190.88195.87168.54
8 K + BF 1% + T 30%178.25184.11160.87
9 K + BF 1% + SL 3% + T 10%231.58241.58227.14
10 K + BF 1% + SL 3% + T 20%223.81235.74200.30
11 K + BF 1% + SL 3% + T 30%217.30221.40190.68
12 K + BF 1% + SL 6% + T 10%698.771176.111121.87
13 K + BF 1% + SL 6% + T 20%534.201084.57987.59
14 K + BF 1% + SL 6% + T 30%501.32822.48800.57
15 K + BF 1% + SL 9% + T 10%540.111002.19924.41
16 K + BF 1% + SL 9% + T 20%397.59740.02731.02
17 K + BF 1% + SL 9% + T 30%386.75719.10710.31
Table 4. The qu values of samples before and after curing.
Sample
Number
Sample CodePost-Curing
Unconfined Compressive Strength, qu
(kPa)
28 Days42 Days56 Days
1 K97.8998.3599.21
2 K + BF 1%582.99583.14584.95
3 K + BF 1% + SL 3%499.42619.97640.72
4 K + BF 1% + SL 6%2198.143012.553600.47
5 K + BF 1% + SL 9%3597.133943.564731.80
6 K + BF 1% + T 10%275.23291.54302.87
7 K + BF 1% + T 20%235.12249.58255.65
8 K + BF 1% + T 30%198.75208.11220.74
9 K + BF 1% + SL 3% + T 10%817.251062.431225.88
10 K + BF 1% + SL 3% + T 20%501.87669.08705.53
11 K + BF 1% + SL 3% + T 30%462.97623.15668.18
12 K + BF 1% + SL 6% + T 10%2615.203432.454250.53
13 K + BF 1% + SL 6% + T 20%1797.952451.753023.83
14 K + BF 1% + SL 6% + T 30%906.411048.861334.24
15 K + BF 1% + SL 9% + T 10%1876.733063.953214.08
16 K + BF 1% + SL 9% + T 20%1599.192454.042932.13
17 K + BF 1% + SL 9% + T 30%1310.302325.482778.73
Table 5. The average and standard deviation values of qu.
Average Values of qu
264.781001.211229.23214.65195.87184.11241.58235.74221.41176.111084.57822.481002.19740.02719.1
Standard Deviations of qu
10.4916.418.319.6320.4114.1312.9210.458.929.7124.096.7712.9915.628.69
Table 6. One-way ANOVA results for qu values across treatment groups.
Source of VariationSum of Squares (SS)Degrees of FreedomMean SquareF-Value
Between Groups 33,137,057.17216,568,528.58401.24
Within Groups 25,147,826.9360941,293.64
Total 58,284,884.09611
Disclaimer/Publisher’s Note: The statements, opinions and data contained in all publications are solely those of the individual author(s) and contributor(s) and not of MDPI and/or the editor(s). MDPI and/or the editor(s) disclaim responsibility for any injury to people or property resulting from any ideas, methods, instructions or products referred to in the content.