Article

Seismic Demand Prediction in Laminated Bamboo Frame Structures: A Comparative Study of Intensity Measures for Performance-Based Design

1
College of Civil Engineering, Nanjing Forestry University, Nanjing 210037, China
2
Jiangsu Carbon Sequestration Materials and Structural Technology of Bamboo & Wood Research Center, Nanjing 210037, China
*
Author to whom correspondence should be addressed.
Buildings 2025, 15(12), 2039; https://doi.org/10.3390/buildings15122039
Submission received: 7 May 2025 / Revised: 5 June 2025 / Accepted: 10 June 2025 / Published: 13 June 2025

Abstract

:
Engineered laminated bamboo frame structures have seen notable advancements in China, driven by their potential in sustainable construction. However, accurately predicting their seismic performance remains a pivotal challenge. Structural and non-structural damage caused by earthquakes can severely compromise building operability, lead to substantial economic losses, and disrupt safe evacuation processes, collectively exacerbating disaster impacts. To address this, three laminated bamboo frame models (3-, 4-, and 5-story) were developed, integrating energy-dissipating T-shaped steel plate beam–column connections. Two engineering demand parameters—peak inter-story drift ratio (PIDR) and peak floor acceleration (PFA)—were selected to quantify seismic responses under near-field and far-field ground motions. The study systematically evaluates suitable intensity measures for these parameters, emphasizing efficiency and sufficiency criteria. Regarding efficiency, the applicable intensity measures for PFA differ from those for PIDR. The measures for PFA tend to focus more on acceleration amplitude-related measures such as peak ground accelerations (PGA), sustained maximum acceleration (SMA), effective design acceleration (EDA), and A95 (the acceleration at 95% Arias intensity), while the measures for PIDR are primarily based on spectral acceleration-related measures such as Sa(T1) (spectral acceleration at fundamental period), etc. Concerning sufficiency, significant differences exist in the applicable measures for PFA and PIDR, and they are greatly influenced by ground motion characteristics.

1. Introduction

In 2020, China’s construction industry contributed 50.9% of the nation’s total carbon emissions across its entire value chain, as documented in the 2022 Building Energy and Emissions Report [1]. The development of engineered bamboo structures is a primary means for the construction industry to reduce carbon emissions. In recent years, there has been a notable increase in the development of engineered laminated bamboo frame structures in China (Xiao, 2024 [2]; Huang et al., 2023, [3]). Despite their potential, comprehensive seismic testing of these structures under severe earthquake conditions remains limited, leaving their seismic performance under strong shaking uncertain. During severe earthquakes, damage to building components may result in structural failure or collapse, causing significant economic losses. Previous studies on earthquake damage have shown that the economic impact of non-structural component failures far exceeds that of structural damage (Senel et al., 2024 [4]; Devin and Fanning, 2019 [5]; Ozmen et al., 2013 [6]). Consequently, precise evaluation of earthquake-induced loads on laminated bamboo frames—including structural elements and non-structural systems—is essential for ensuring seismic resilience under extreme ground motions.
Damage to structural components is typically assessed using inter-story drift, which is a commonly used structural performance indicator in standards (GB50005, 2017 [7]). In evaluating the seismic demands of non-structural components, the peak inter-story drift ratio (PIDR), and peak floor acceleration (PFA) can be selected as metrics for measurement (Taghavi and Miranda, 2003 [8]; Devin and Fanning, 2019 [5]; Zhang and He, 2019 [9]). Deformation-sensitive non-structural components, such as partition walls, are quantified using the peak inter-story drift ratio (PIDR) as a primary damage indicator. PFA serves as a critical indicator for predicting damage in acceleration-sensitive non-structural elements (e.g., rigid partitions or equipment), as established by Reinoso and Miranda [10] and FEMA P-58-2 [11]. Consequently, PIDR and PFA were integrated into this study to comprehensively assess structural and non-structural damage within laminated bamboo frames under seismic loading.
Effective intensity measures (IMs), serving as critical bridges between seismic hazard inputs and structural outputs, play a pivotal role in minimizing prediction uncertainties for laminated bamboo frames subjected to severe earthquakes. Research indicates that the applicability of IMs varies markedly across structural typologies and their target demand parameters (e.g., inter-story drift or floor acceleration) [12,13,14]. Furthermore, the performance of these metrics is highly sensitive to seismic event features, including near-field pulse effects and far-field record characteristics [15]. Driven by advancements in performance-based earthquake engineering, IM selection frameworks now encompass diverse structural systems, including super-tall buildings (Zhang et al., 2019 [9]; Lu et al., 2013 [16]), typical reinforced concrete frame structures (Muho, 2024 [17]), reinforced concrete frame structures with seismic isolation bearings (Güneş, 2024 [18]), liquid storage tanks (Sengar et al., 2025 [19]), transmission towers (Liu et al., 2024 [20]), urban shield tunnels (Shen, 2025 [21]), and high-speed railway bridges (Wen et al., 2024 [22]). However, there is limited research on ground motion intensity measures specifically for laminated bamboo frame structures, particularly regarding the assessment of the seismic response of different types.
This article evaluates seismic demands on both structural and non-structural components in laminated bamboo frame structures using PIDR and PFA as engineering performance demand parameters. Three laminated bamboo frame structures with varying numbers of floors are considered to reflect the impact of structural height. Furthermore, to accurately assess the structural responses under seismic conditions, this research investigates optimal intensity measures by prioritizing efficiency and sufficiency criteria to quantify seismic demands across structural and non-structural subsystems in engineered bamboo frames. Ground motions with distinct characteristics—specifically pulse-like near-field events and far-field records—were systematically incorporated to evaluate their impact on parameter selection.

2. Structural Model and Selection of Ground Motions

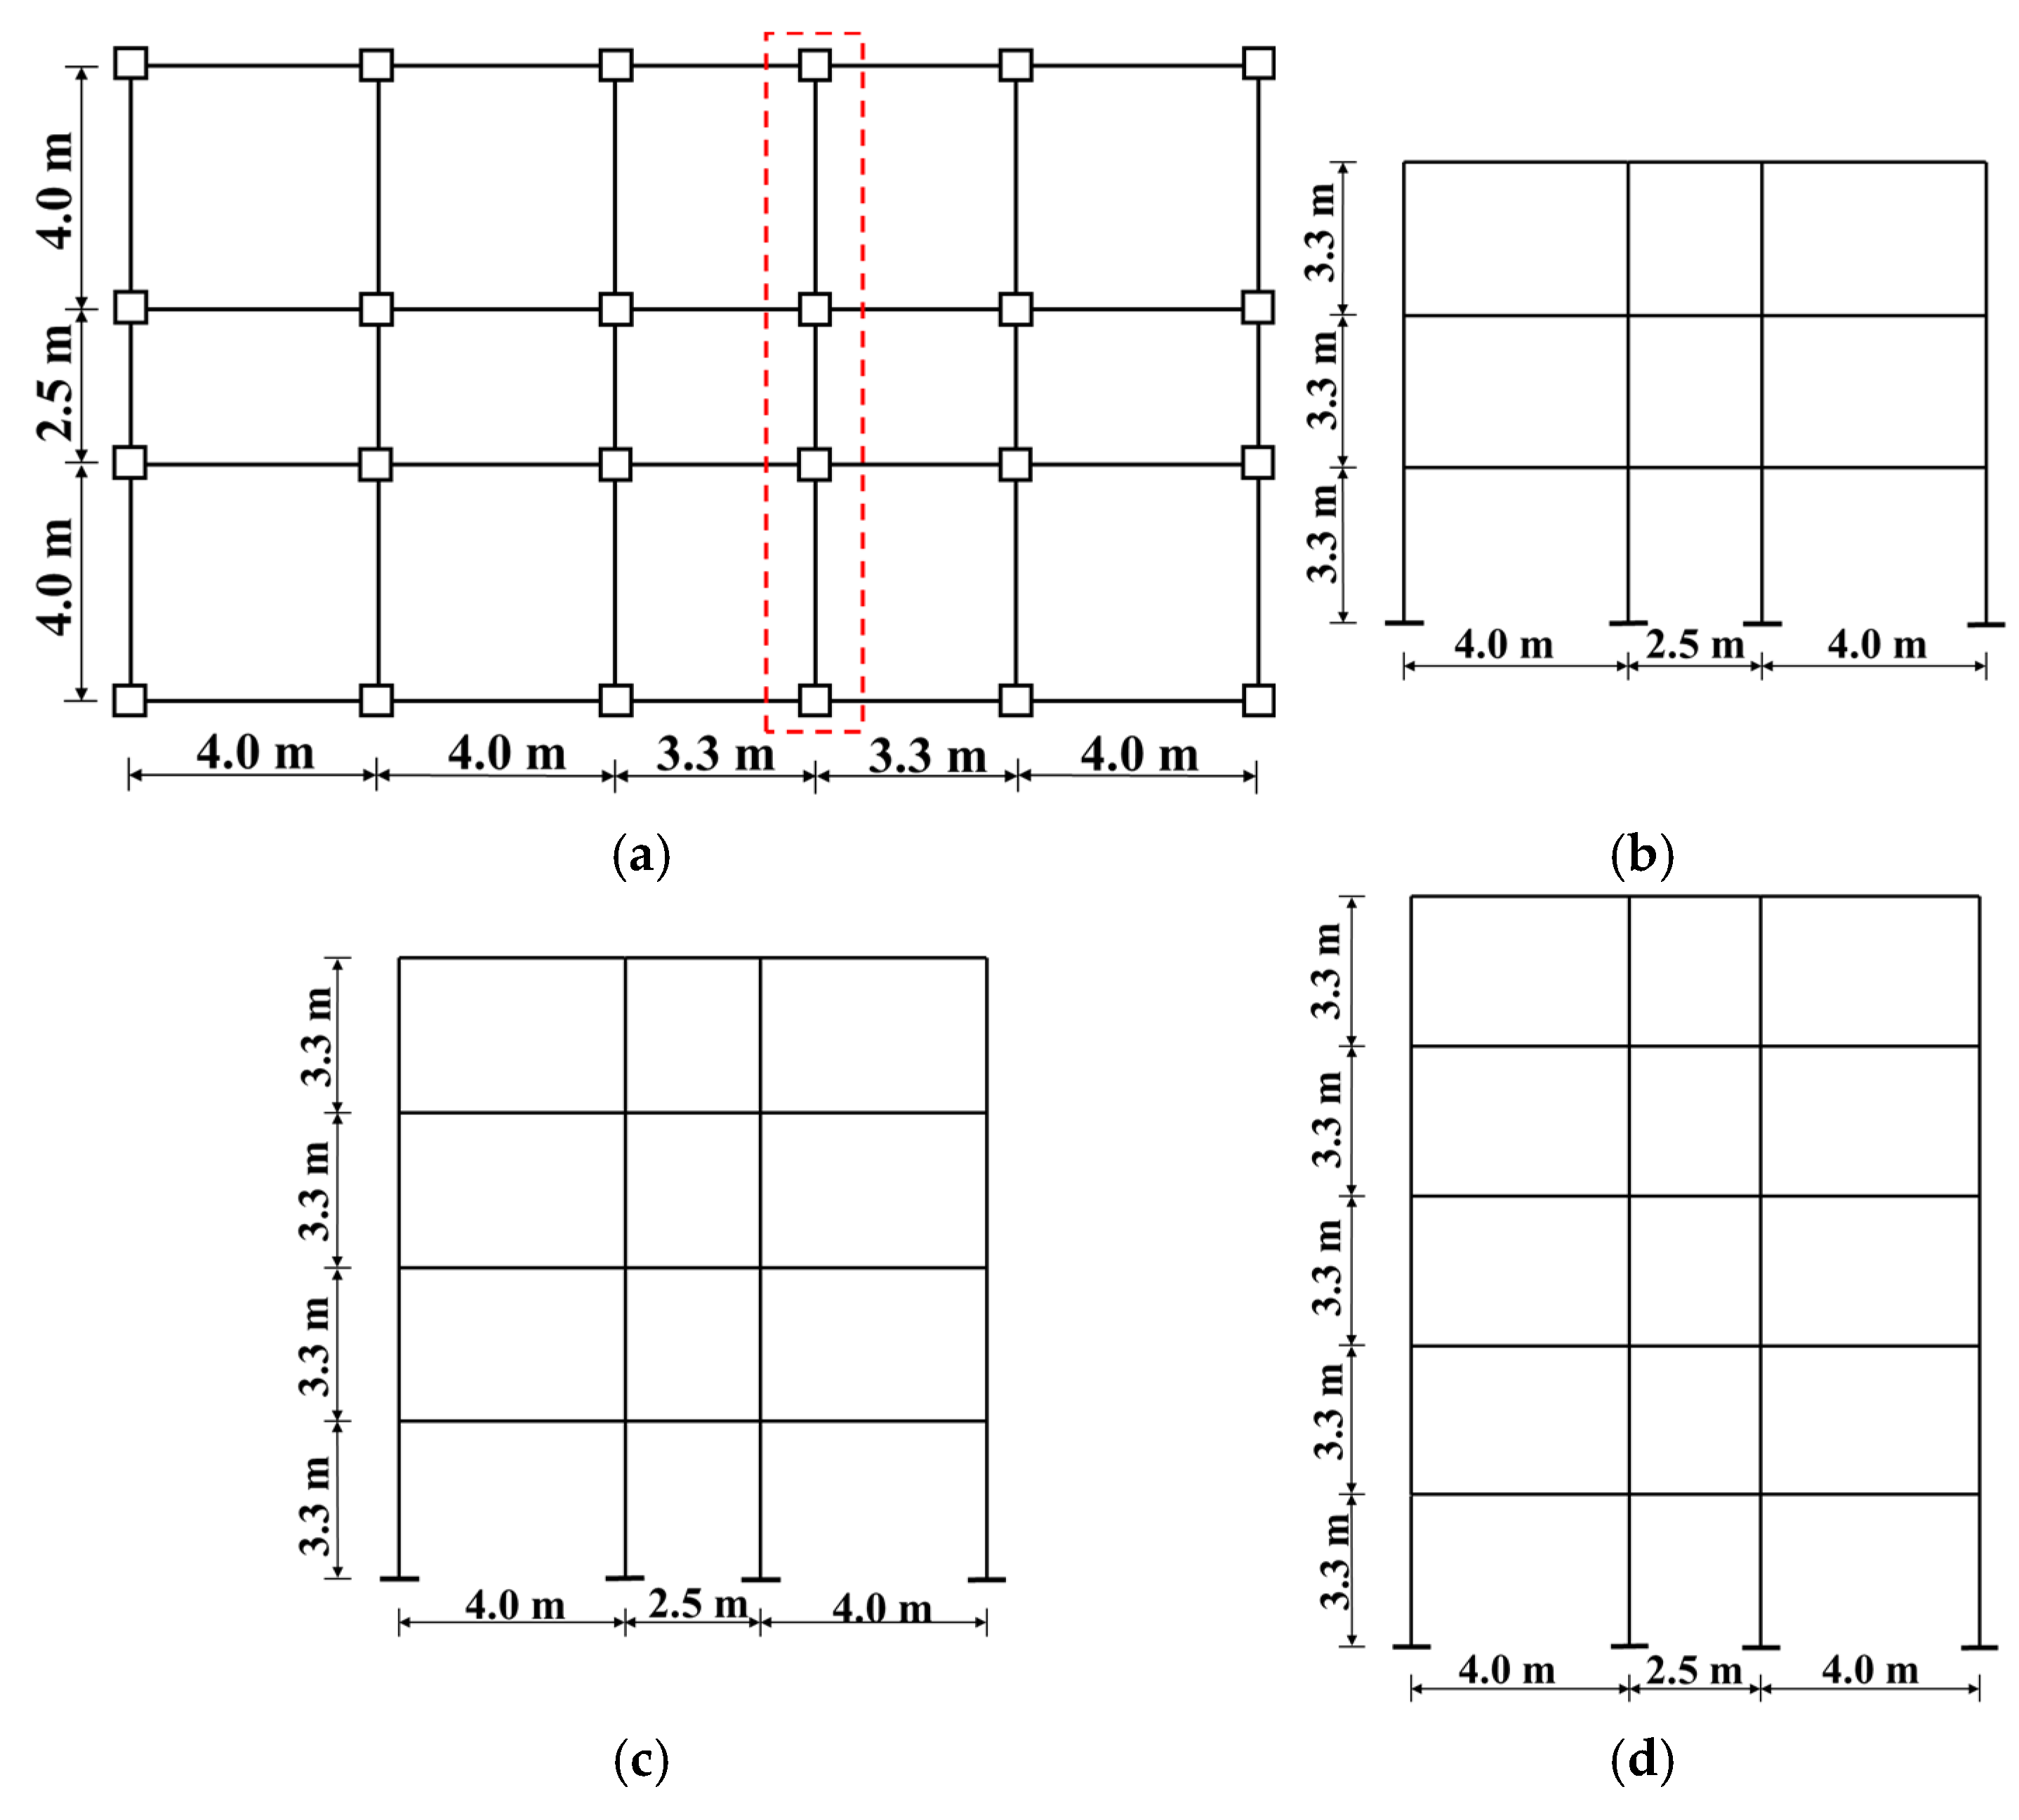
2.1. Laminated Bamboo Frame Structure

As shown in Figure 1, three laminated bamboo frame structures with 3, 4, and 5 stories were selected for structural response analysis. These structures are designed to withstand seismic precautionary intensity level 8 and are located on a Type II site within the first seismic design group. The seismic precautionary intensity level 8 corresponds to a peak ground acceleration of 0.4 g for a rare earthquake event. A site class of II indicates that the soil has medium stiffness. The seismic design group represents the impact of factors such as the epicentral distance on seismic forces, with the first seismic design group indicating a near epicenter distance. All three structures have identical floor plans. The buildings have heights of 9.9 m, 13.2 m, and 16.5 m, with each floor measuring 3.3 m. The roof supports a dead load of 1.0 kPa and a live load of 2.0 kPa, while the floors below carry a permanent load of 1.5 kPa and a live load of 2.0 kPa. The basic wind pressure is 0.35 kPa. The beam section for these frames is 100 mm by 250 mm, while the column sections vary: 400 mm × 400 mm for the 5-story and 4-story structures, and 300 mm × 300 mm for the 3-story structure. The floor system uses engineered bamboo composite hollow slabs, as suggested by Huang et al. (2024 [3]). As shown in Figure 2, the beam–column joints are equipped with T-shaped steel plates and bolted connections, which are known for their effective energy dissipation (Leng et al., 2020 [23]). In accordance with established specifications for timber, engineered bamboo, and seismic design, the load-bearing capacities of the beams and columns, as well as the beam-column joints, have been verified (T/CECS 1101, 2022 [24]; GB50068, 2019 [25]; GB 55002, 2021 [26]; GB/T 51226, 2017 [27]; Eurocode 5, 2003 [28]; GB50005, 2017 [7]; GB/T 50708, 2012 [29]; GB50017, 2017 [30]). The 5-story laminated bamboo frame’s design methodology, including joint specifications and load-bearing calculations, follows the framework outlined by Zhang et al. [31]. While the 3- and 4-story structures adopt identical joint parameters (refer to [31] for details), their overall design processes are omitted here for brevity.
To enhance computational efficiency, two-dimensional finite element models of the three laminated bamboo frames were constructed within the OpenSees platform, version 2.0, [32], with primary emphasis on the red-highlighted frame (Figure 1). In the modeling of timber/bamboo structures, nonlinearity (e.g., hysteresis, pinching, degradation) is confined to the connections (joints/fasteners), while members (beams/columns) are modeled as linear elastic elements (Rinaldin et al., 2013 [33]; Aloisio et al., 2020 [34]; Cao et al., 2022 [35]; Zhang et al., 2024 [31]). In this study, columns and beams were represented by elastic beam–column members, assigned a Young’s modulus of 13.180 GPa according to experimental validations by Leng et al. [23]. The Pinching4 material model (Table 1) was applied to zero-length joint elements, calibrated against experimental data from Figure 3. A Rayleigh damping ratio of 3% was implemented while considering geometric nonlinearities through P-delta effects. Lightweight wall panels were incorporated in the model; however, their connections to the frame were idealized as non-structural elements to exclude stiffness contributions. The first five vibration periods (T1, T2,..., T5) for each structure are provided in Table 2.

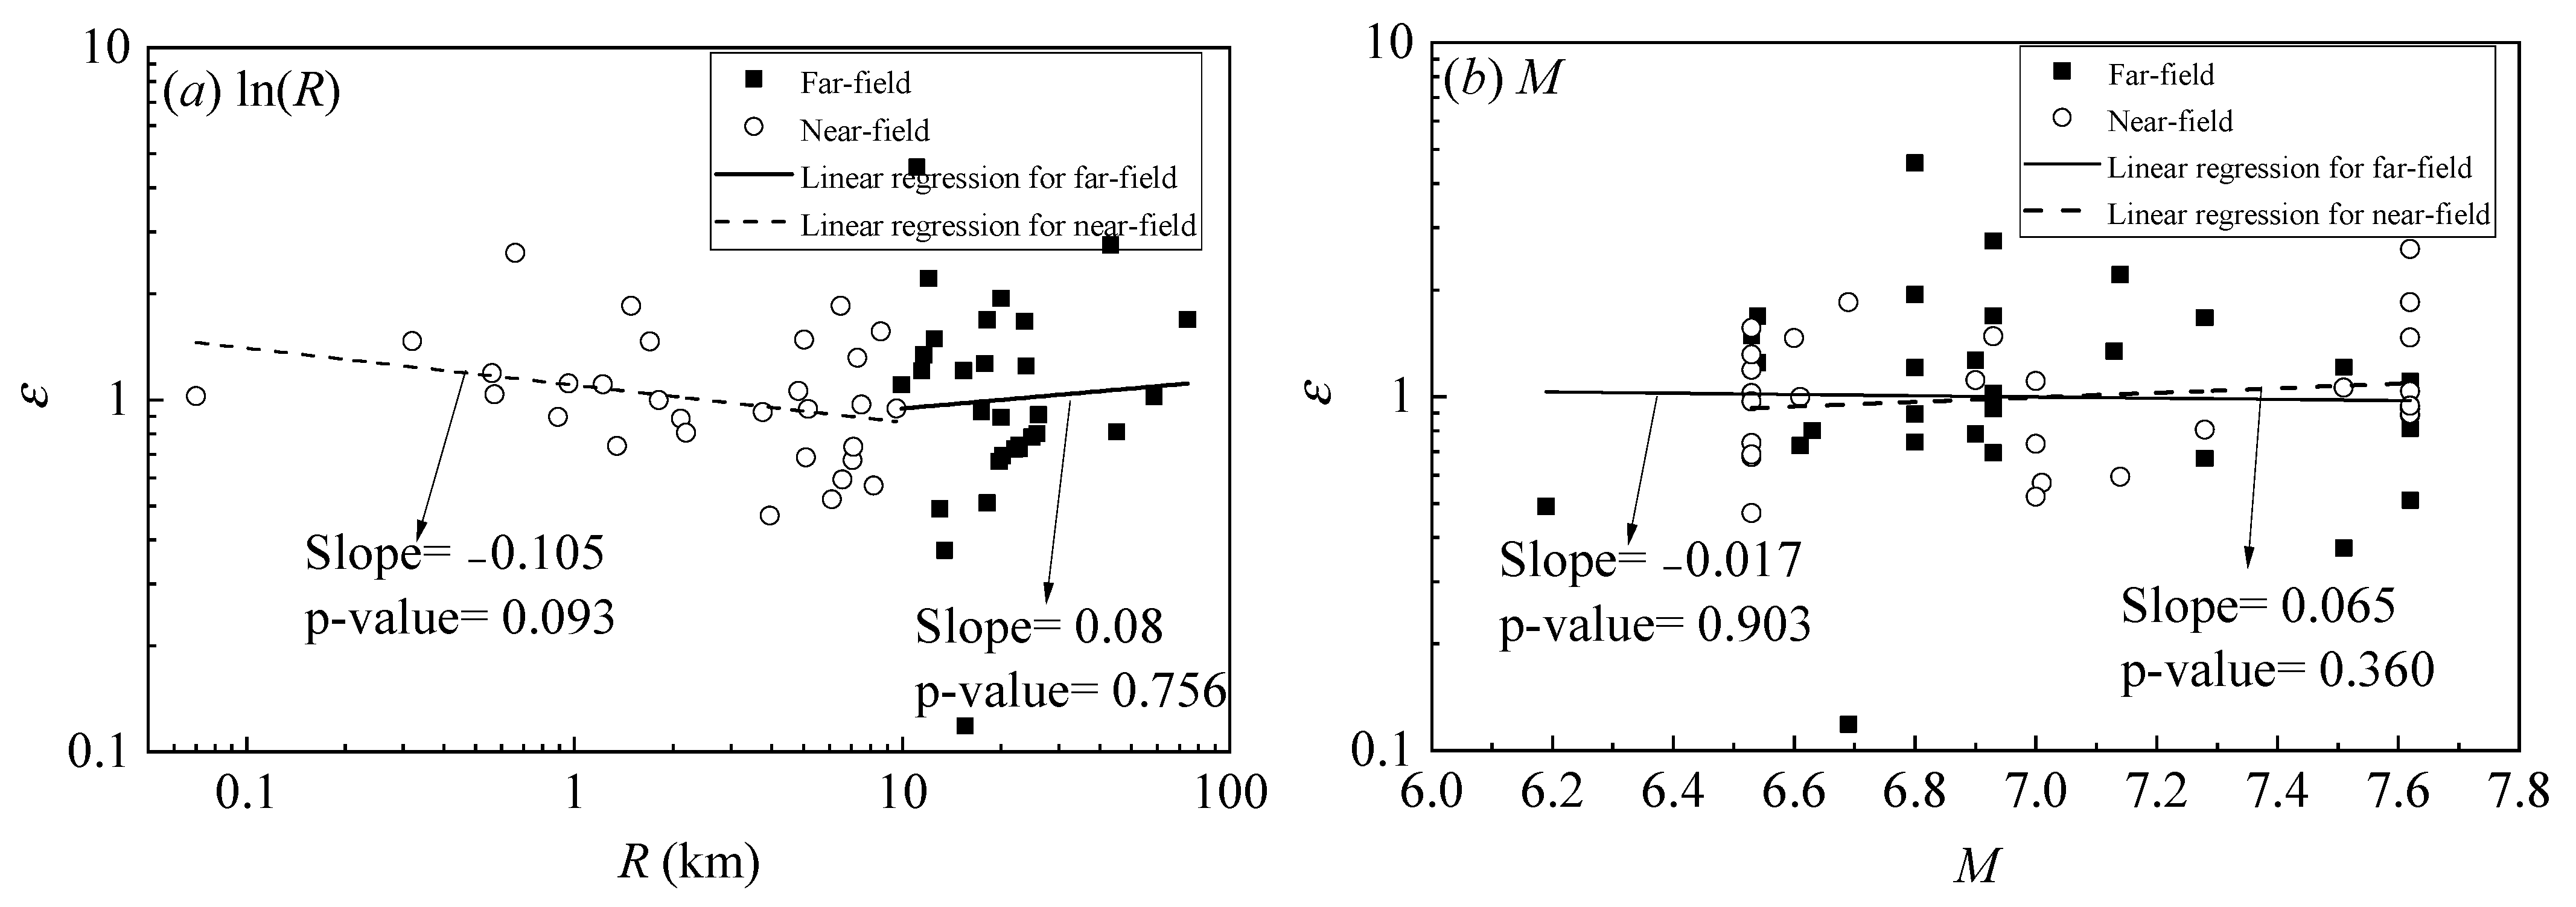
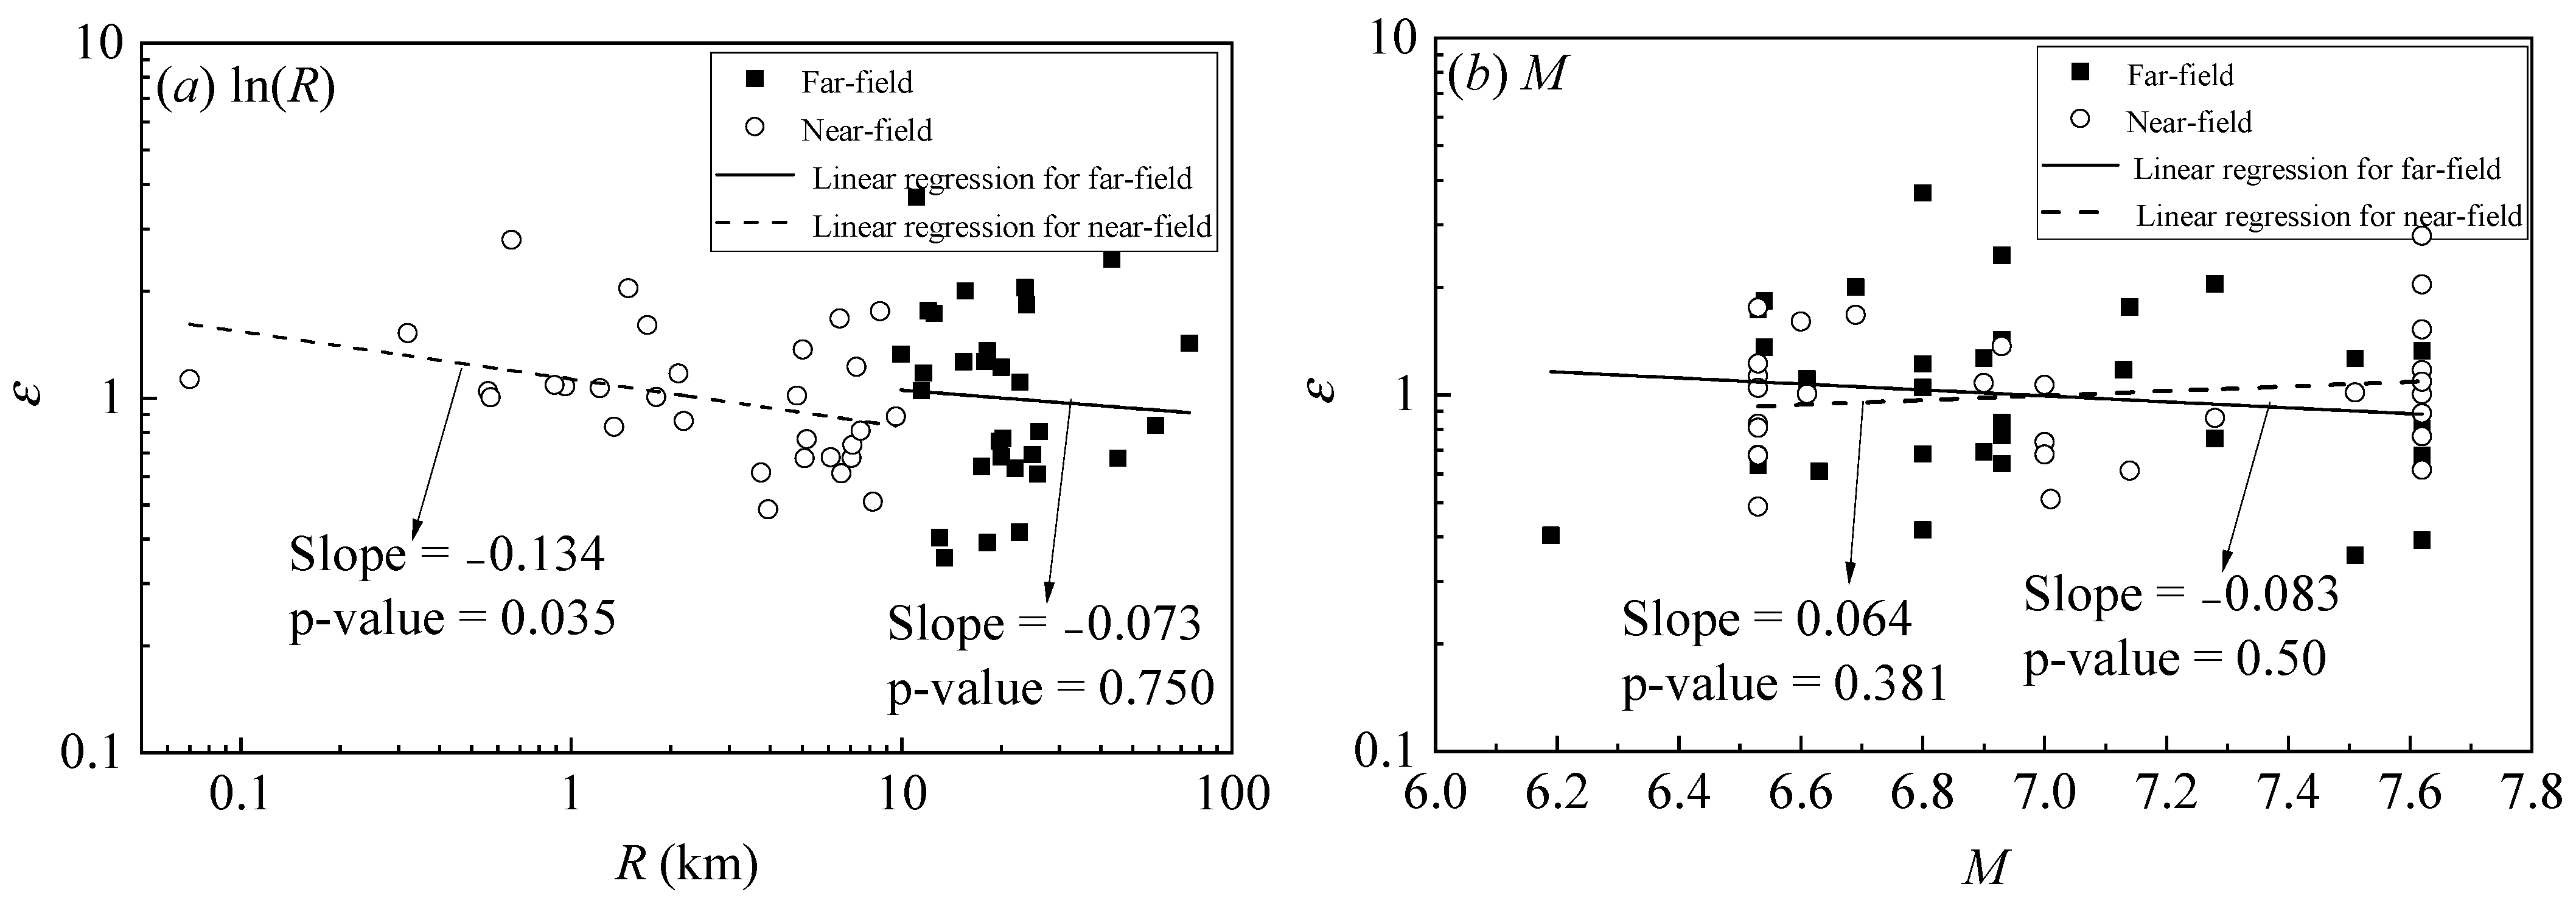
2.2. Selection of Far-Field and Near-Field Ground Motion Records

Two distinct ground motion datasets (30 records each) were selected, categorized as pulse-like near-field and far-field events, to account for aleatory variability. Pulse-like ground motions in the near-field dataset were identified using Baker’s wavelet-based filtering methodology [36]. Table 3 summarizes the seismic event parameters, including moment magnitude (M) and source-to-site distance (R), with a 10 km threshold between near-field and far-field records defined per FEMA P695 guidelines [37]. The ground motion records were curated from the PEER database [38], while detailed selection criteria and metadata are accessible in prior studies [9,39].

3. Seismic Response and Selection of Intensity Measures

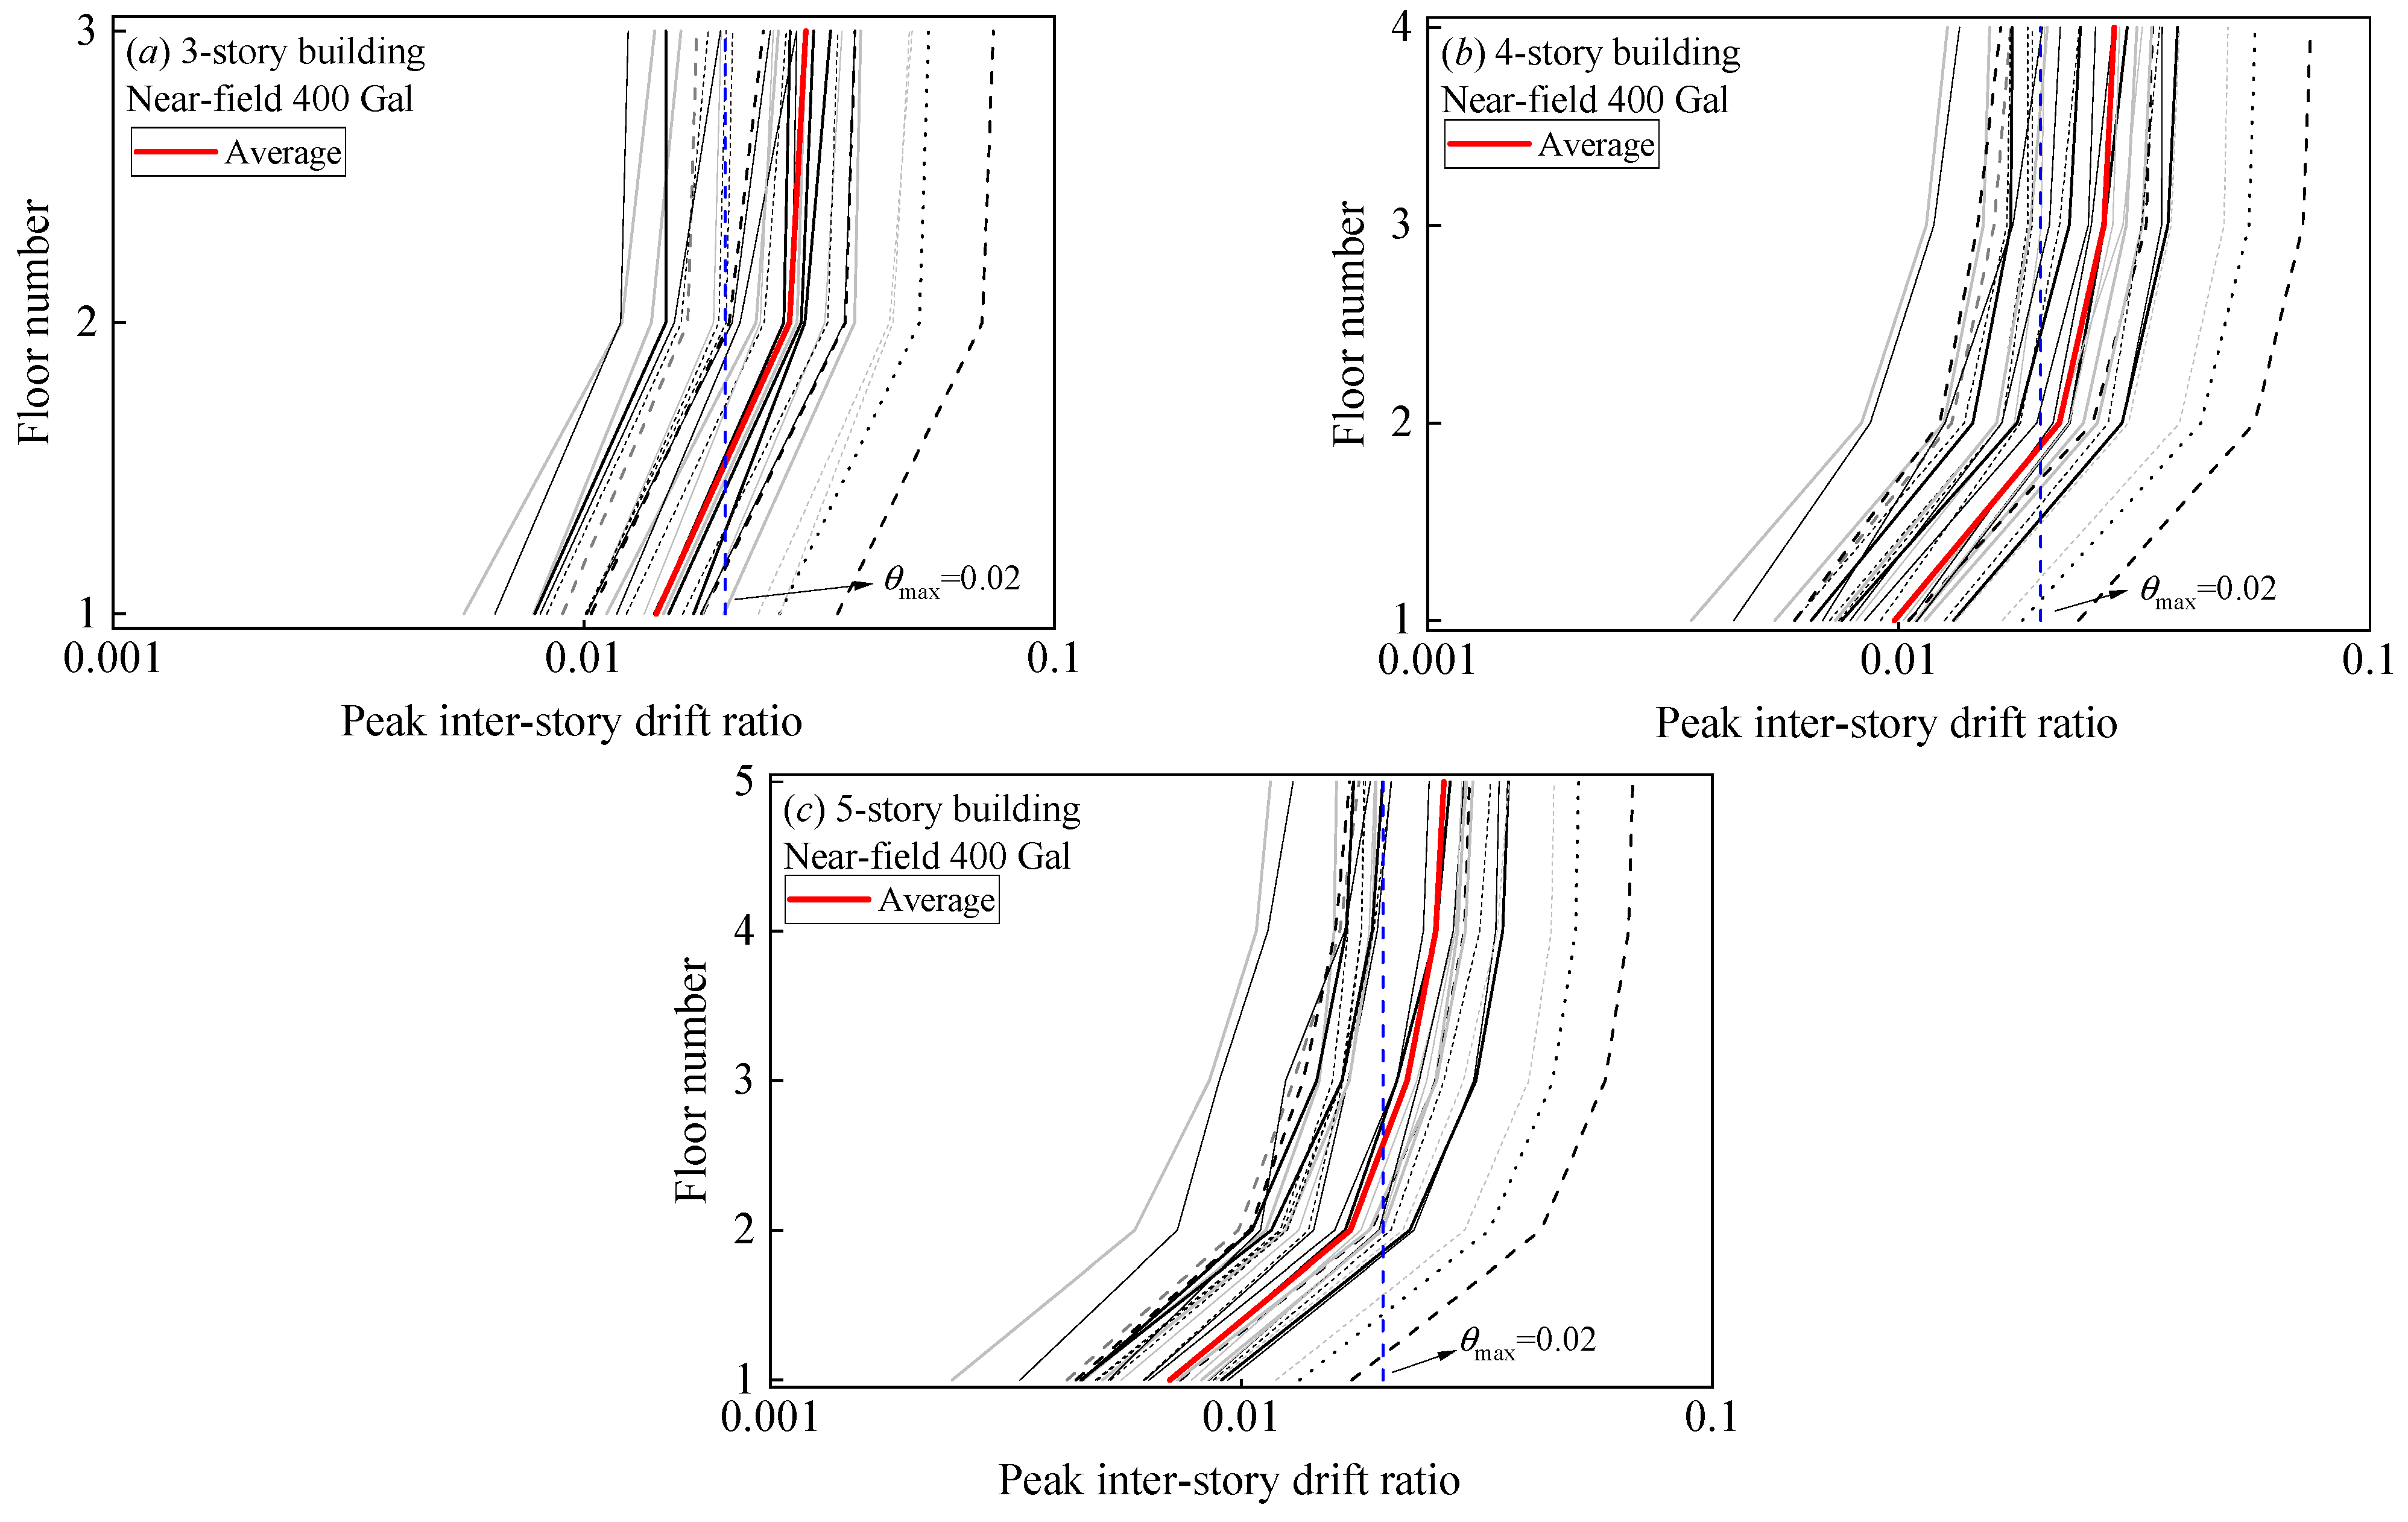
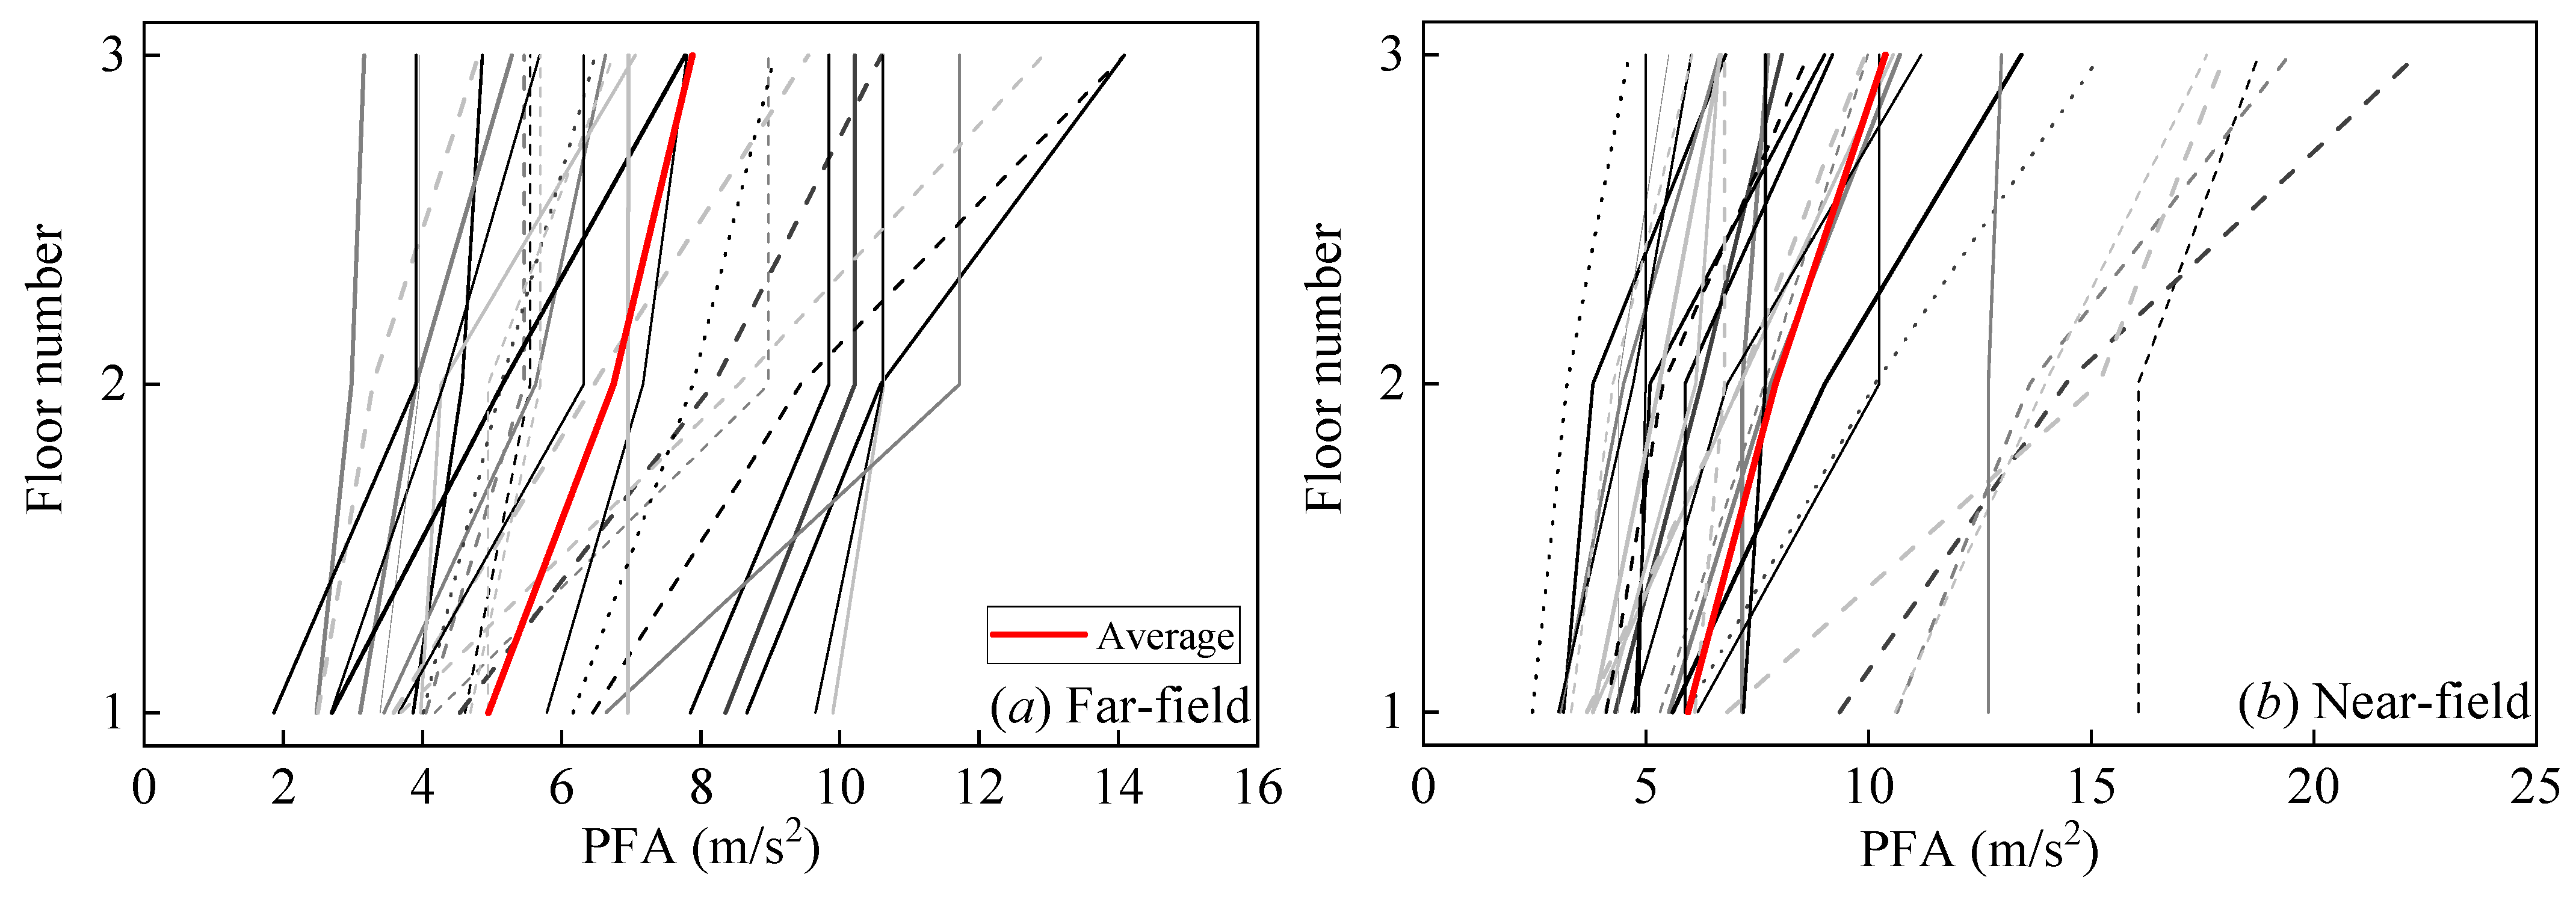
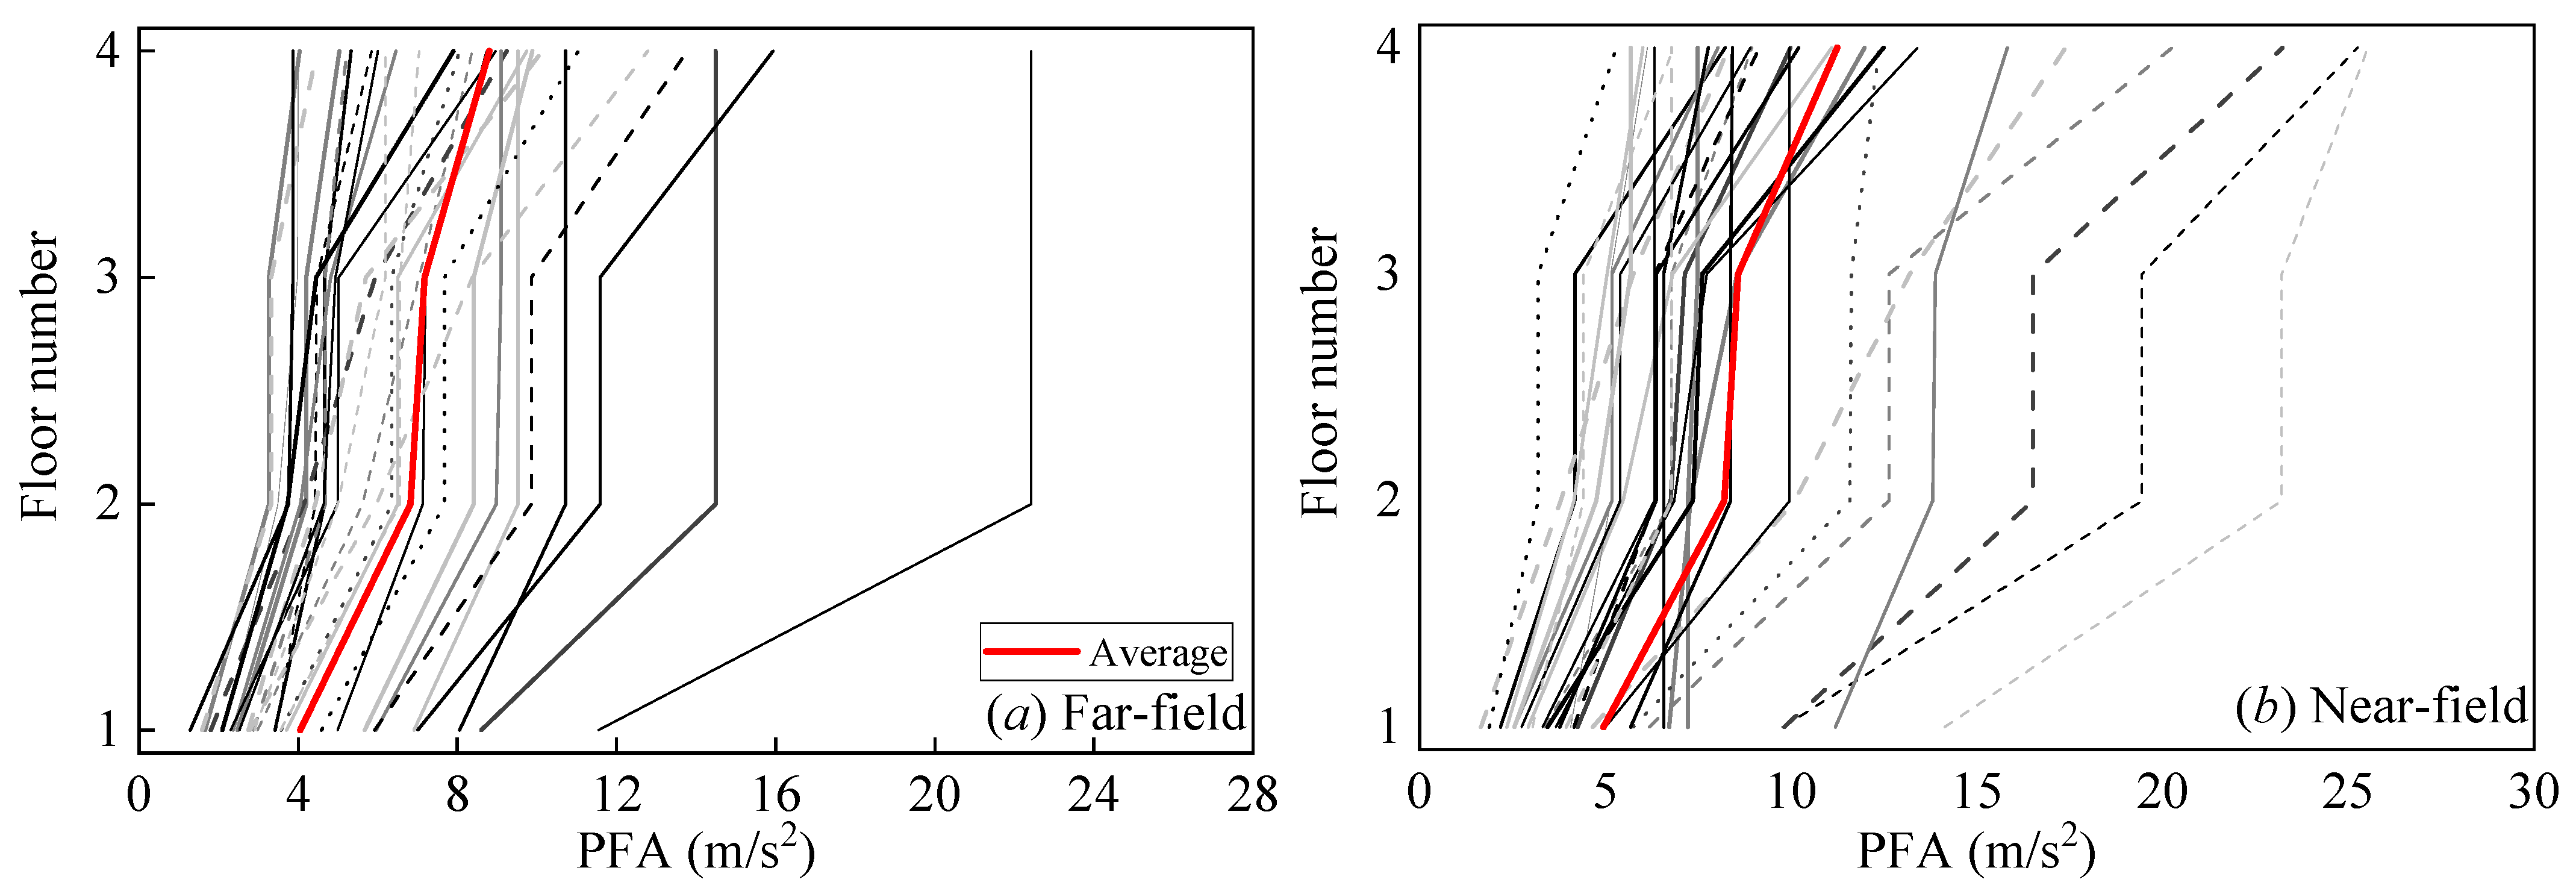
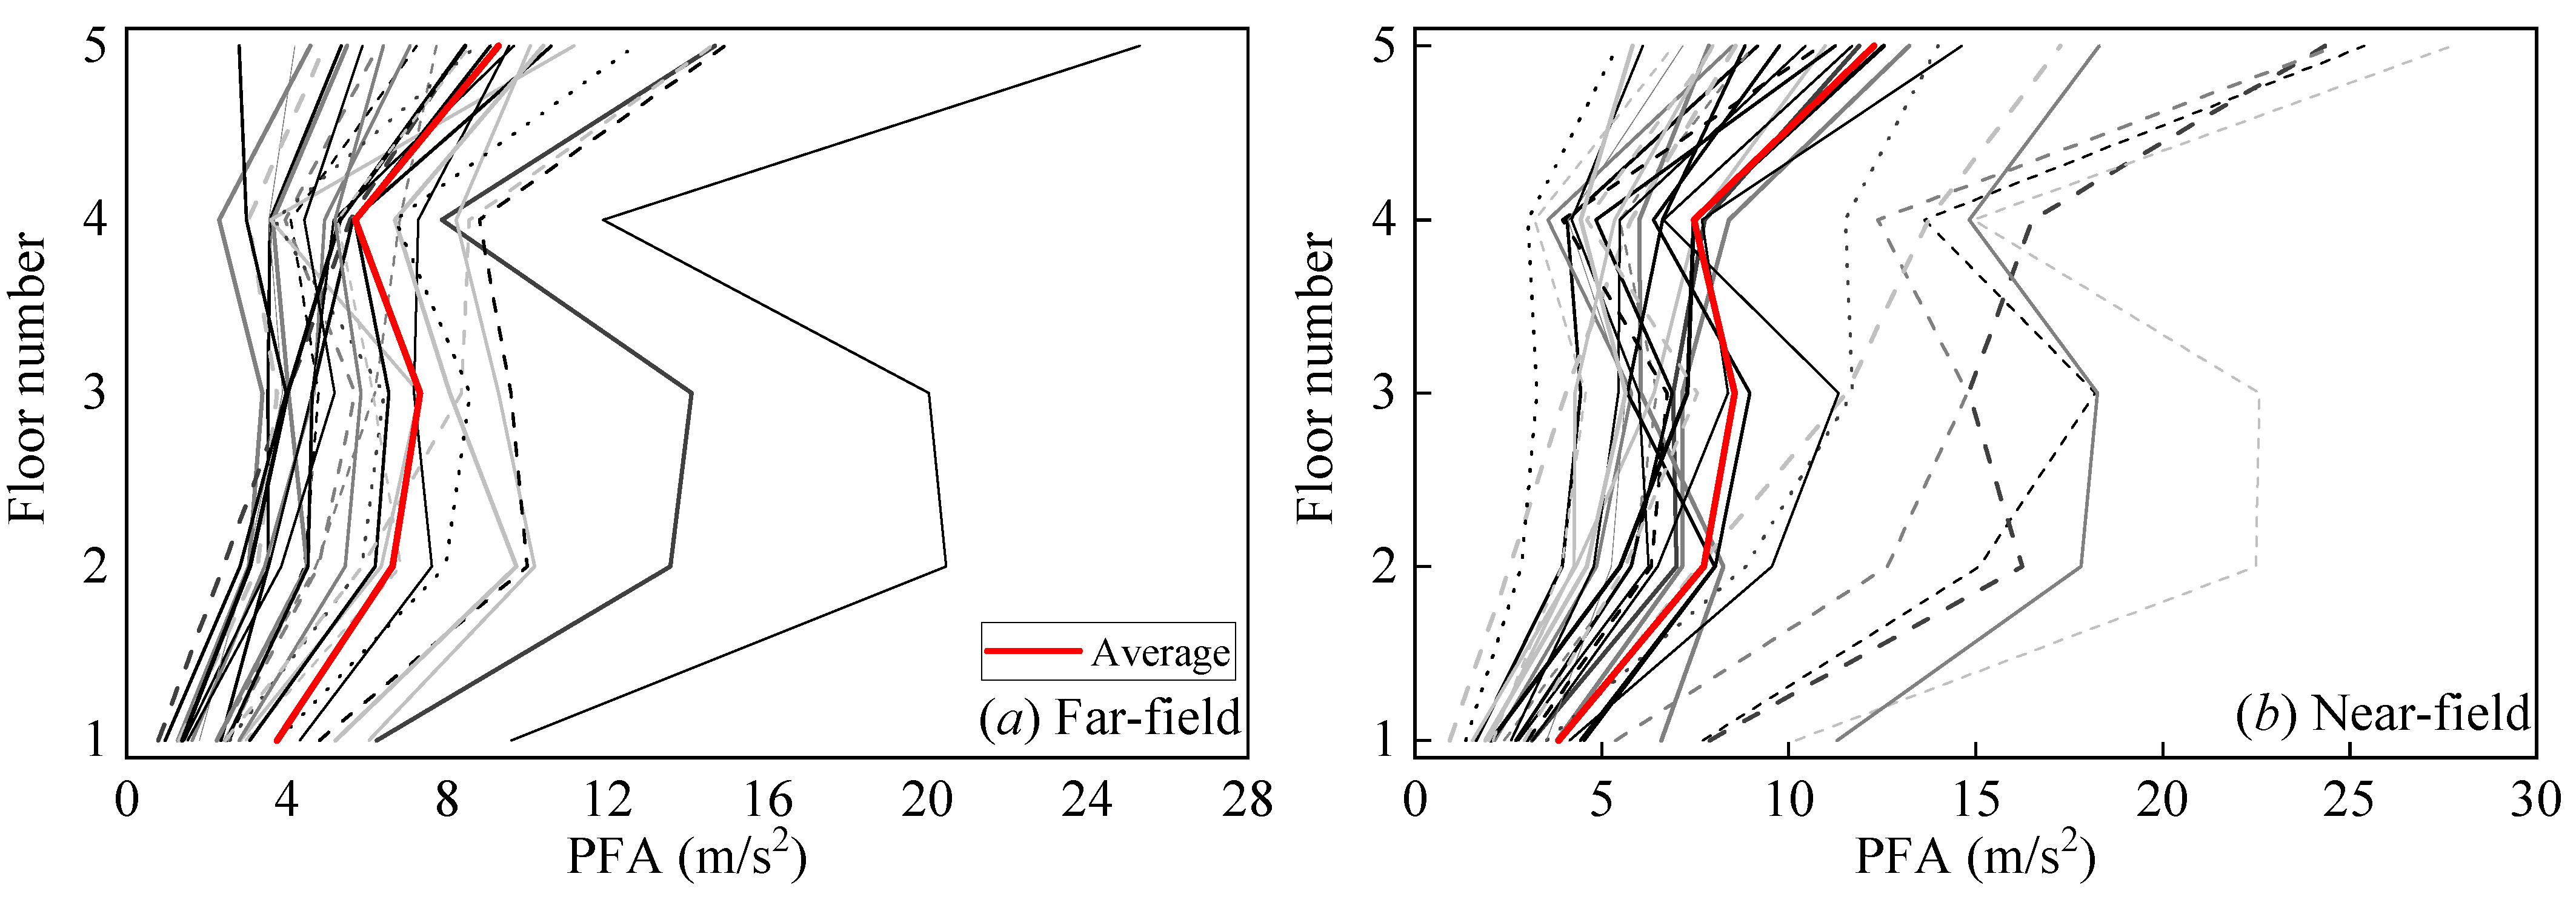
3.1. Seismic Response

For the three laminated bamboo frame structures, Figure 4 and Figure 5 show the distribution of PIDR along the floors of the structure under far-field and near-field ground motions, respectively. The peak ground accelerations (PGA) of these ground motion records were amplitude-modulated to 400 Gal, corresponding to the intensity of major earthquakes in the region where the structures are located. Analysis revealed a dominant first-mode vibration pattern in laminated bamboo frames, consistent across both near-field and far-field seismic inputs (Zhang et al., 2024 [31]). A marked increase in structural displacement was observed under near-field ground motions relative to far-field events, as illustrated in Figure 4 and Figure 5.

3.2. Selection of Intensity Measures and Its Evaluation Criteria

The results of probabilistic seismic vulnerability assessments are significantly affected by the choice of seismic intensity measures. Different measures can alter the correlation between seismic hazard intensity and structural damage. For laminated bamboo frame structures, primarily influenced by first-mode vibrations, intensity measures related to seismic motion amplitude and spectral acceleration at the first-mode period are preferred. Twenty-five measures were selected, as detailed in Table 4. These include peak ground acceleration (PGA), peak ground velocity (PGV), peak ground displacement (PGD), SMA, SMV, EDA, and the velocity-to-acceleration ratio (V/A). SMA and SMV are abbreviations for sustained maximum acceleration and sustained maximum velocity, respectively, and correspond to the third peaks in the seismic acceleration and velocity histories. High-frequency components above 8–9 Hz are deemed negligible and filtered out, with the peak value identified as EDA. The Arias intensity measure uses total hysteretic energy dissipation per unit mass, while Sarma and Yang (1987 [40]) propose the acceleration at 95% Arias intensity as the A95 measure.
Table 4 includes seismic intensity measures such as spectral acceleration Sa(T1), spectral velocity Sv(T1), and spectral displacement Sd(T1) at the first vibrational period. Additionally, it lists combination-type measures based on Sa(T1) that account for higher-order modes, including S a 12 , S a 123 , IM12, IM123, SN2, S12, S123, and S ¯ a . Some measures consider softening periods, like S*, IM-CR, IM-SR, INP, SN1, or both effects, as with Sa,gm(Ti). Parameters for these combinations are aligned with structural dynamics: S* uses Tf = 2T1 and α = 0.5; IM-CR and IM-SR use RIM = 2 and α = 0.5; INP has α = 0.4 and TN = 2T1; IM12 uses periods T1 and T2 with β = 0.5; IM123 employs T1, T2, and T3 with β = 1/3 and γ = 1/3; SN1 uses C = 1.5 and α = 0.5, while SN2 has β = 0.75. Referring to S a 12 and S a 123 , the measure S12 uses α = 0.8 and β = 0.2, while S123 employs α = 0.8, β = 0.15, and γ = 0.05; S ¯ a , using the first two vibration periods (n = 2), is equivalent to IM12; Sa,gm(Ti) involves five combination terms: (Ti)5 = {T2m, min[(T2m + T1m)/2, 1.5T2m], T1m, 1.5T1m, 2T1m}, with T1m and T2m representing T1 and T2, respectively.
A robust evaluation framework is critical for selecting appropriate intensity measures. Key criteria proposed in prior studies include efficiency, sufficiency, proficiency, scaling robustness, hazard computability, and practicality (Bojórquez and Iervolino, 2011 [46]; Jalayer et al., 2012 [52]; Padgett et al., 2008 [53]; Tothong and Luco, 2007 [54]; Giovenale et al., 2004 [55]; Mackie and Stojadinović, 2001 [56]). Among these, efficiency and sufficiency have emerged as primary considerations in IM selection. The relationship between engineering demand parameters (DMs) and IMs is typically modeled through a power function (Equation (1)), where coefficients a and b are determined via regression analysis and ε|IM represent residual errors. The residuals refer to the differences between the actual observed values and the predicted values from the regression model. This nonlinear relationship can be linearized as shown in Equation (2). Efficiency quantifies the predictive capability of an IM through the logarithmic standard deviation βDM|IM between observed and predicted demands (Equation (3)), where lower βDM|IM values correspond to superior IM performance. In Equation (3), DMi and IMi represent the seismic response and seismic intensity measure corresponding to the i-th record, respectively, and m denotes the number of seismic motions. Sufficiency requires structural responses at a given intensity level to be statistically independent of ground motion characteristics (e.g., magnitude M and epicenter distance R). This criterion is evaluated through p-values derived from regressing residual term ln(ε|IM) against seismic parameters M or ln(R), with p-value < 0.05 indicating insufficiency.
D M = a I M b ( ε I M )
l n ( D M ) = ln a + b ln ( I M ) + ln ( ε I M )
β D M IM = i = 1 m ( l n ( D M i ) l n ( a I M i b ) ) 2 m 2

4. Intensity Measures Suitable for PFA

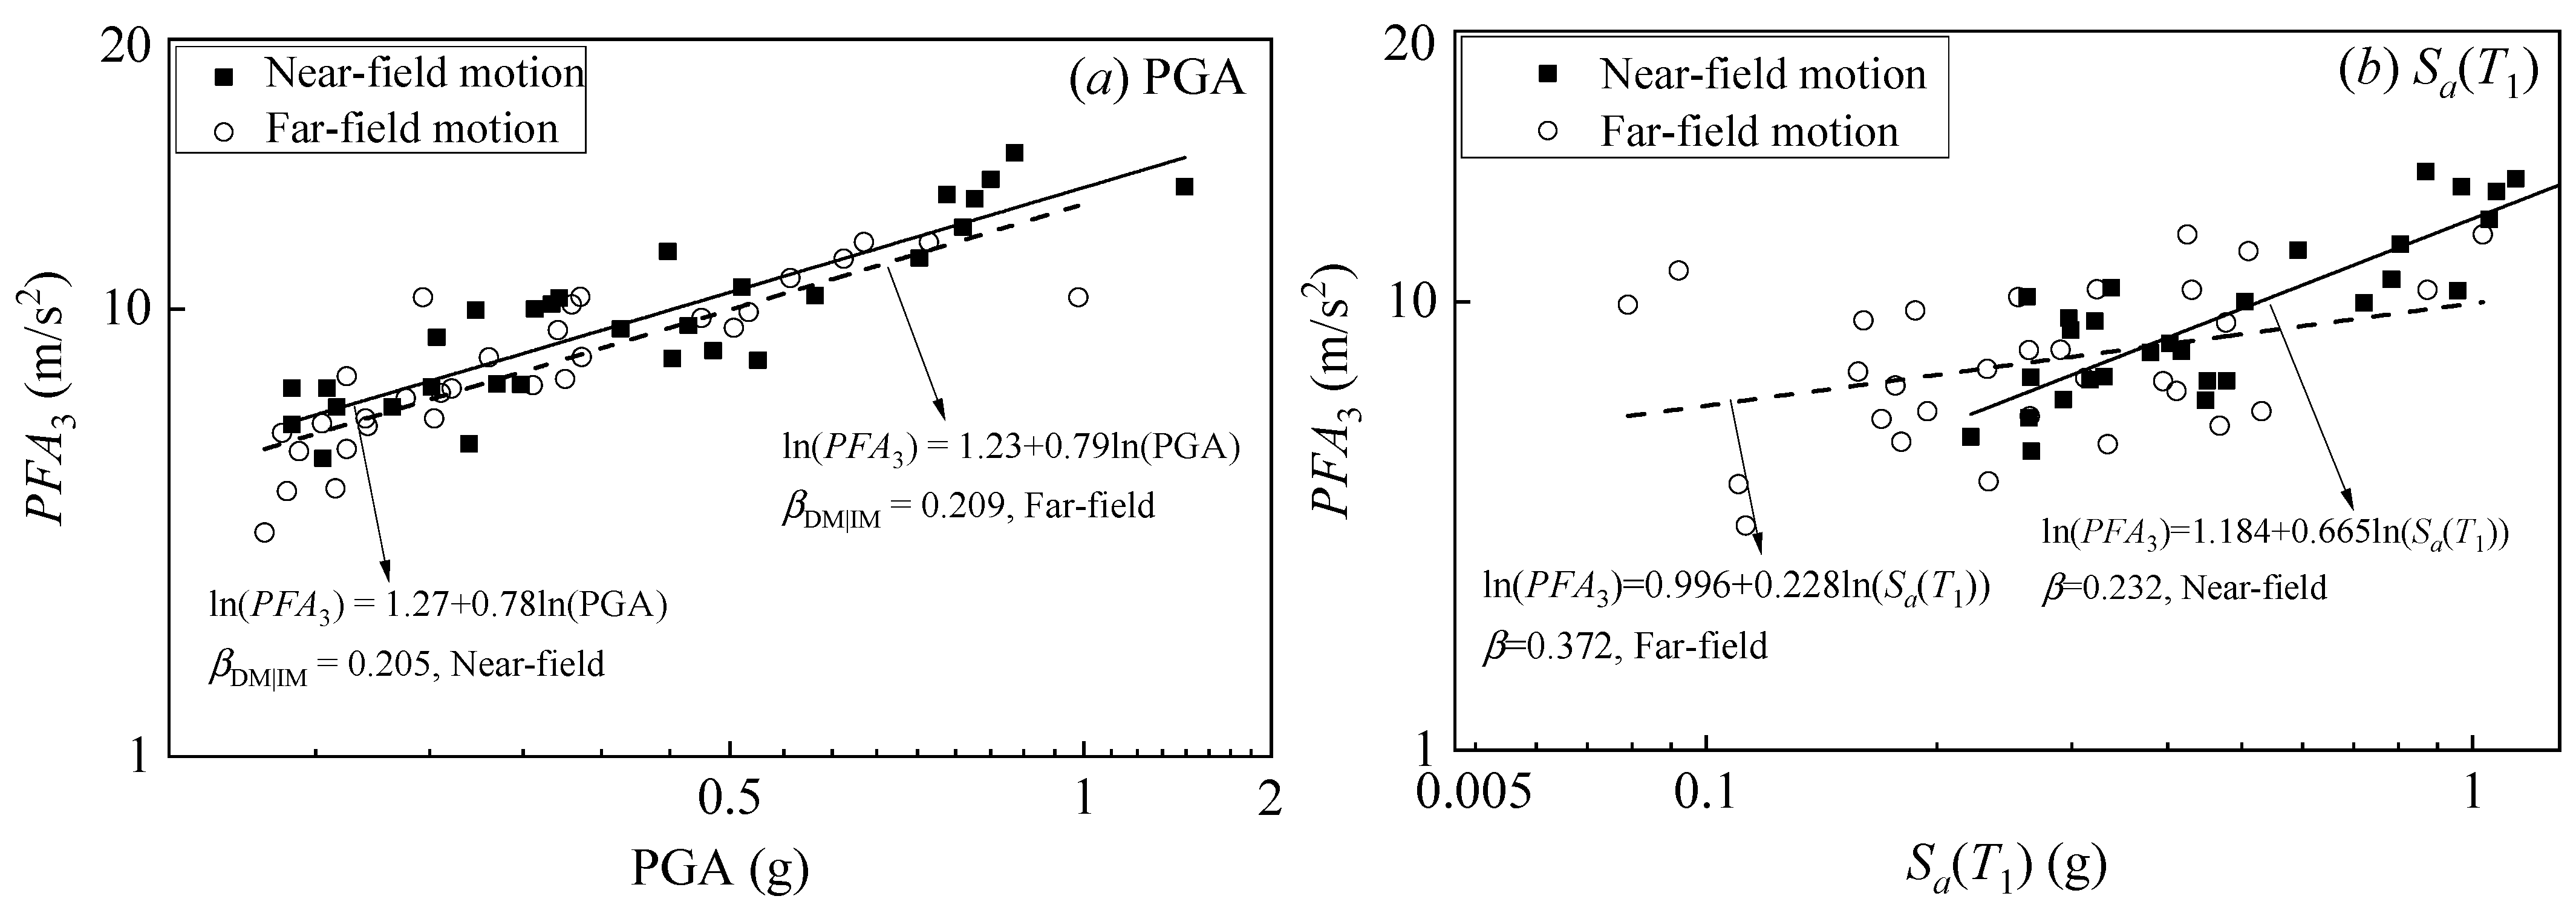
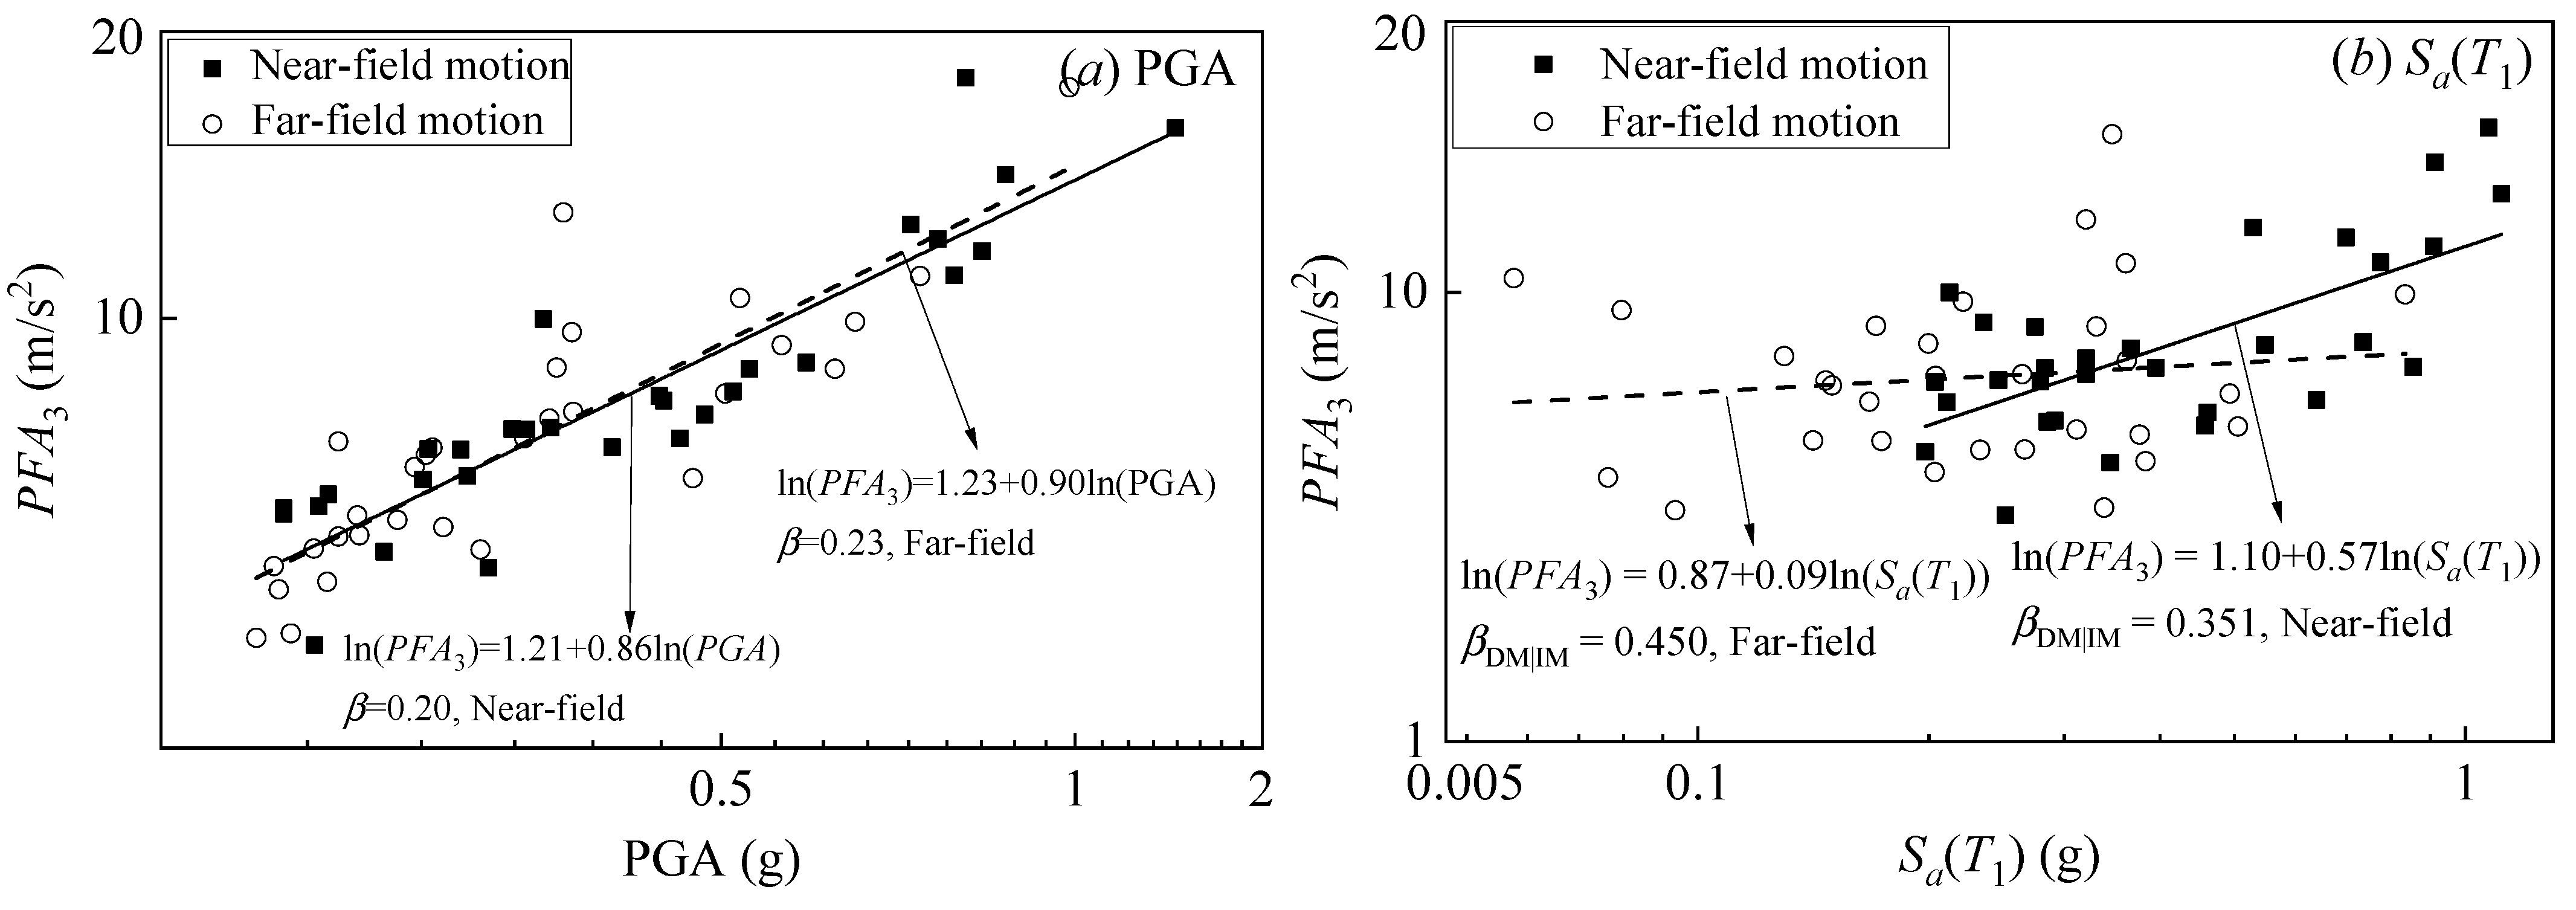
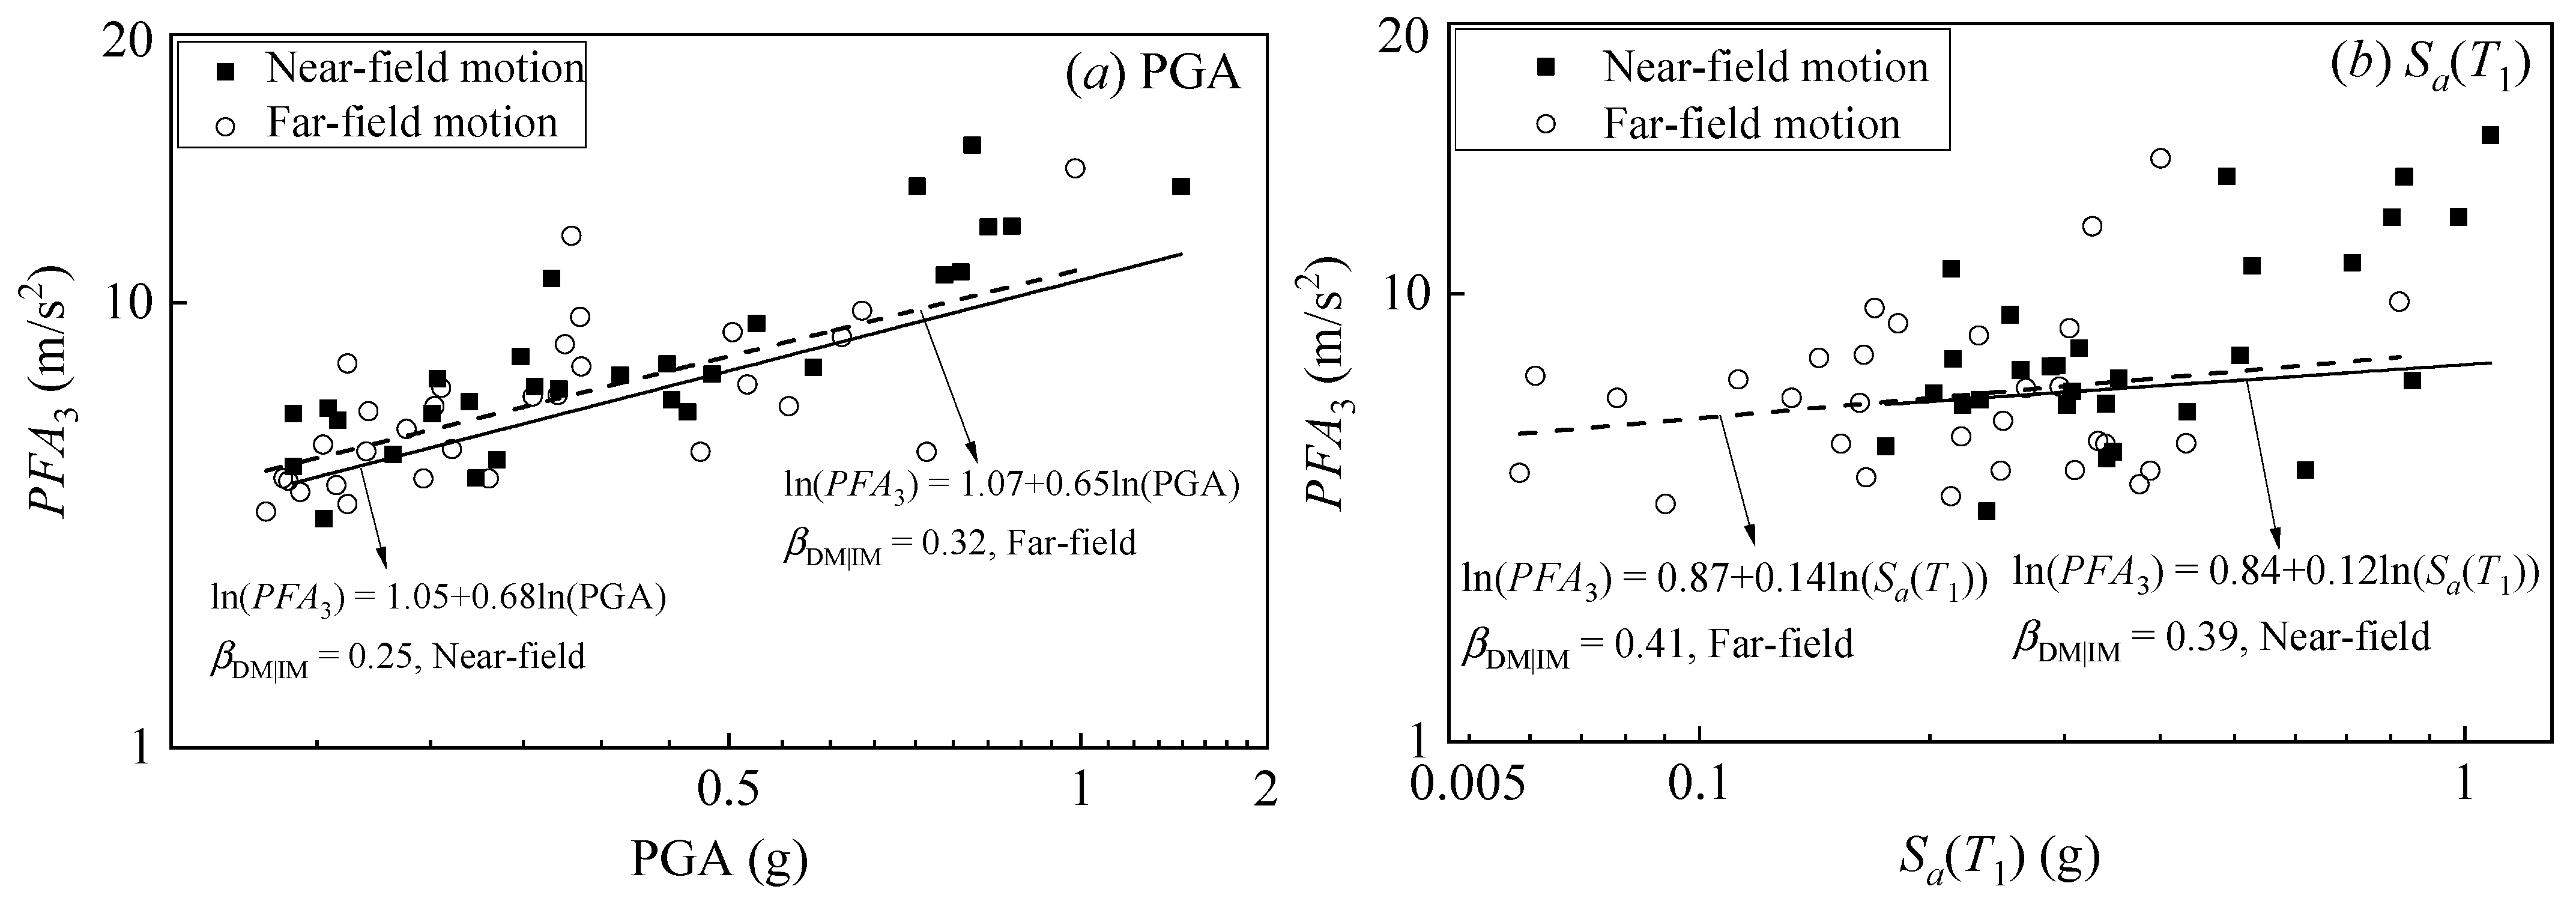
4.1. Efficiency of IMs in Estimating PFA

Figure 6, Figure 7 and Figure 8 illustrate the distribution of peak floor accelerations (PFAs) at different levels for the 3-, 4-, and 5-story laminated bamboo frame structures, respectively. These results were obtained under near-field and far-field seismic excitations without amplitude scaling. For the three-story laminated bamboo frame, the maximum floor accelerations are concentrated on the third floor under both near-field and far-field seismic motions. In the case of the four-story structure, the maximum accelerations occur primarily on the fourth floor, followed by the second and third floors. For the five-story laminated bamboo frame structure, under far-field ground motions, the maximum floor accelerations are primarily distributed on the 3rd and 5th floors, while under near-field seismic excitation, they are mainly distributed on the 5th floor. For a more detailed analysis, the maximum floor acceleration on the third floor (referred to as PFA3) for each structure was selected as the research focus. Figure 9, Figure 10 and Figure 11 present the linear regression analysis results between PFA3 and the intensity measures PGA and Sa(T1) for the 3-, 4-, and 5-story laminated bamboo frame structures, respectively. The research results indicate that, whether under far-field or near-field pulse-type ground motions, compared to Sa(T1), the correlation between PGA and PFA3 is more significant, demonstrating higher efficiency (manifested as smaller βDM|IM values).
Considering the similar dynamic characteristics of the three structures, the trend in seismic response and intensity measures observed across structures with varying story counts is closely aligned. Thus, the 5-story laminated bamboo frame structure is used as an example. Figure 12 shows the distribution of the standard deviation βDM|IM between the intensity measures and PFAs along the height direction of the 5-story structure. A closer examination reveals a strong correlation between the βDM|IM values of different seismic intensity measures and the height of the structural floors. Generally, as floor height increases, the βDM|IM values decrease. Notably, at higher floors, the differences in βDM|IM values between various measures become more pronounced, especially under near-field earthquake conditions. To highlight the intensity measures with lower βDM|IM values, these are marked in each figure. From the perspective of βDM|IM, measures that are strongly correlated with PFA are consistent for both near-field and far-field conditions. The intensity measures shown in Figure 12 can be divided into three distinct sections with clear boundaries.
As shown in Figure 12, in the left part of each figure, the βDM|IM values are observed to be minimal. And the corresponding seismic intensity measures demonstrate the highest efficiency. Under far-field ground motions, the left part of Figure 12a includes intensity measures such as IM123, SMA, PGA, A95 and EDA. PGA, A95, and EDA are all measures extracted from acceleration time histories, roughly or approximately equivalent to peak ground acceleration. Under the influence of near-field ground motions, IM123 significantly outperforms other indicators and occupies the entire left part on its own. Through comparative analysis, it can be observed that the efficiency of various intensity measures is greatly influenced by the location of the floor level. Due to the influence of the floor height, IM12 results in the smallest βDM|IM among all intensity measures on the fifth floor of the structure.
Under far-field ground motions, the middle part of Figure 12a includes seismic intensity indicators such as IM12 ( S ¯ a ), S a 123 , and S a 12 . For near-field ground motions, the middle part includes SMA, PGA, A95, and EDA, and measures considering higher-order modes such as IM12 ( S ¯ a ), S a 123 , and S a 12 . Even though A95, EDA and IM12 are classified into the middle part compared to far-field ground motions, they still exhibit similar βDM|IM values as those observed under far-field conditions. This indicates that these indicators maintain a high level of stability in their correlation with PFA under different seismic motion characteristics.
The other intensity measures in Figure 12 (indicated by gray lines) are all classified into the right-hand side part. These intensity measures include Sa(T1), Sv(T1), and Sd(T1), as well as S*, IM-CR, IM-SR, and INP based on Sa(T1) considering the effects of softening period. These intensity measures have been proven to have a good correlation with inter-story drift ratios, which also indicates that intensity measures with high efficiency for inter-story drift ratios may not necessarily be suitable for peak floor acceleration.
Combining the results of the above analyses, it can be concluded that floor position and the spectral characteristics of ground acceleration significantly influence the correlation between the IMs and PFA, with variations observed across different floors. Additionally, while the correlation between each measure and PFA changes in near-field and far-field scenarios, the measures that are highly correlated with PFA remain consistent in both contexts. These measures mainly include acceleration amplitude-based indices such as SMA, PGA, A95 and EDA, as well as Sa(T1)-based indices that consider higher mode effects, such as IM123, IM12 ( S ¯ a ), S a 123 , and S a 12 .

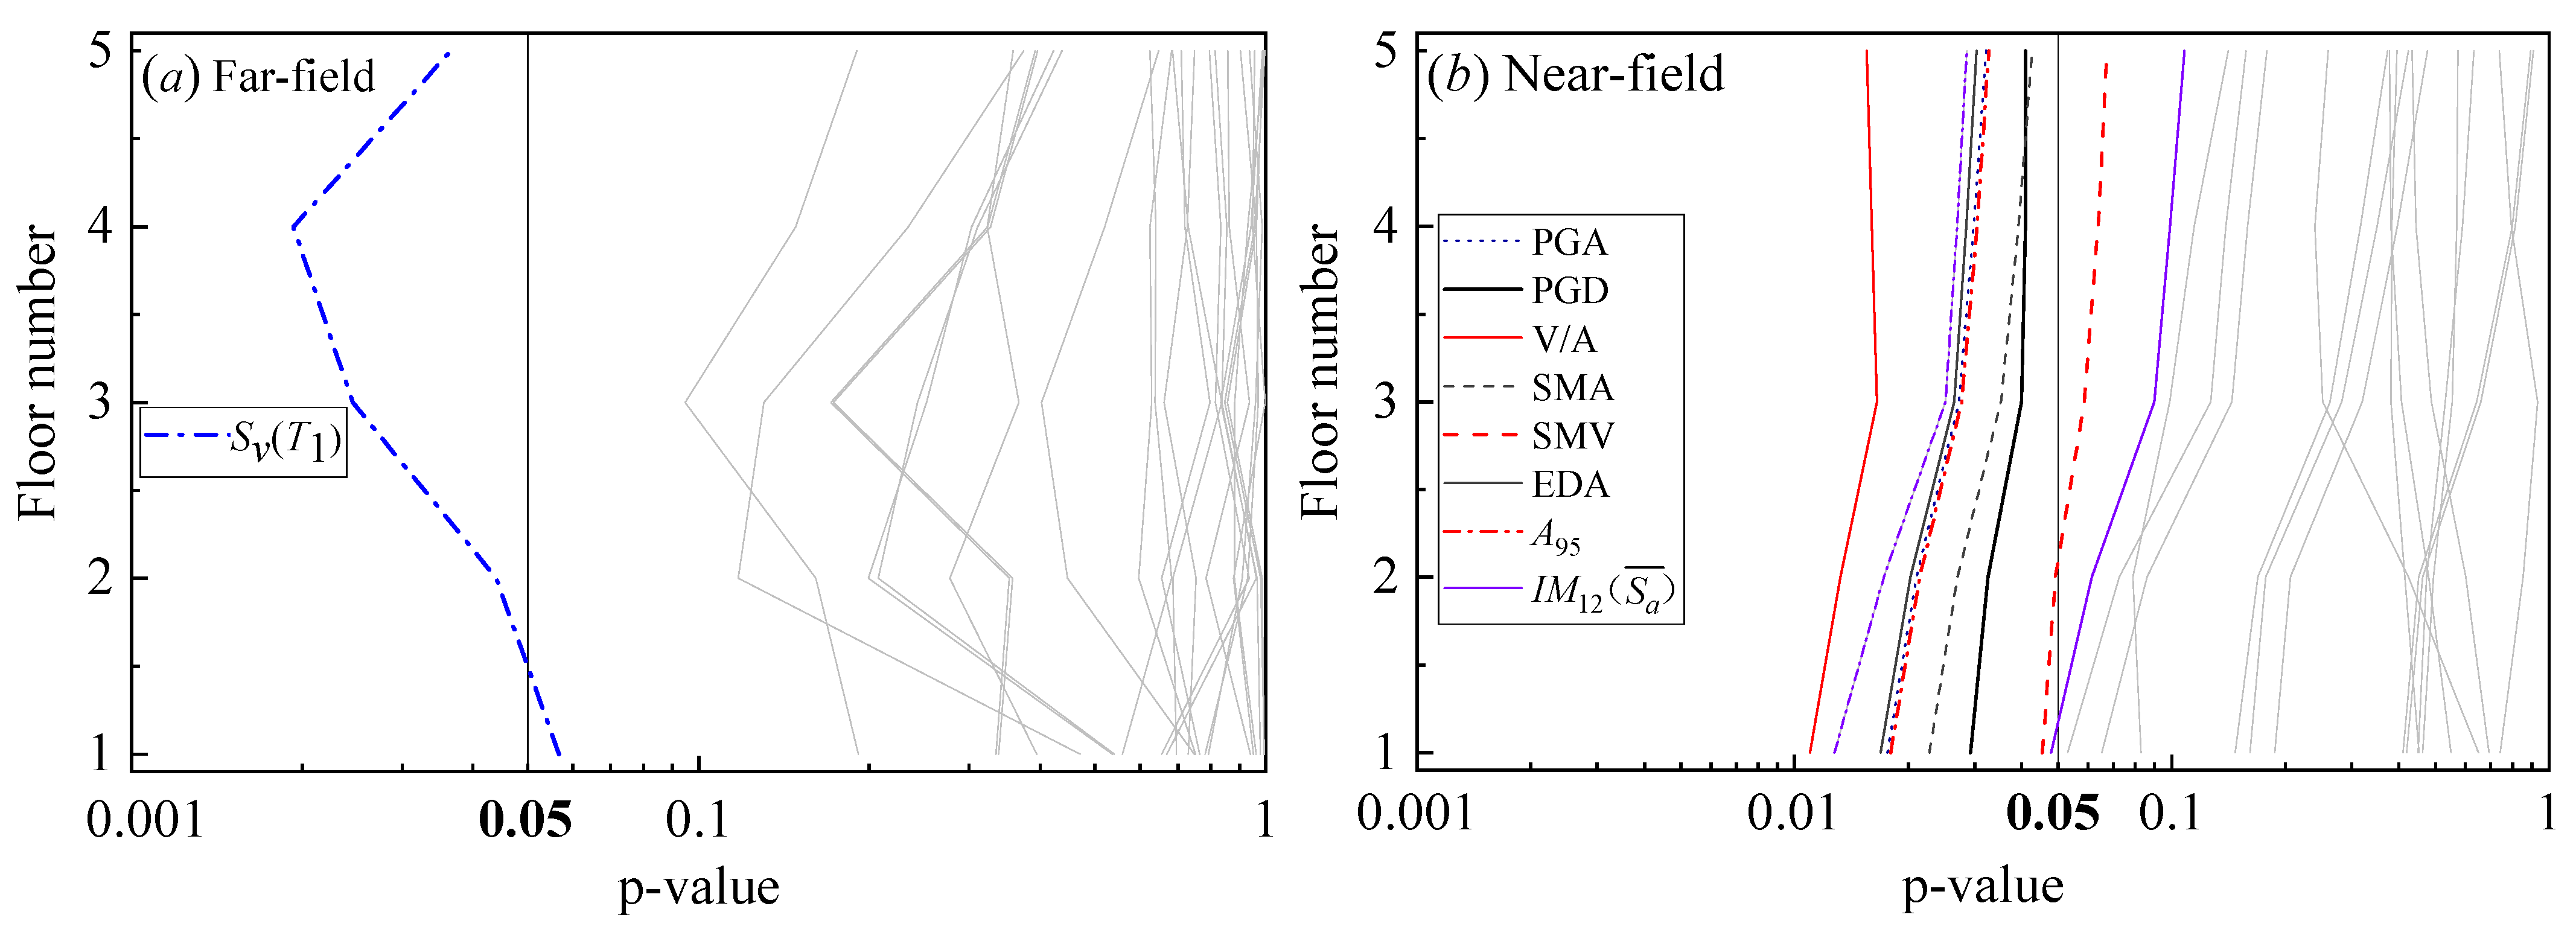
4.2. Sufficiency of IMs in Estimating PFA

Taking the PFA at the third floor (PFA3) of the laminated bamboo structure as an example, Figure 13, Figure 14 and Figure 15 present the p-values of ln(ε|PGA) in the regression analysis of ln(ε|PGA) on M and ln(R) for three different structures. Here, the residual error ln(ε|PGA) is derived from the regression analysis between PFA3 and PGA, as detailed in the analysis of Figure 9, Figure 10 and Figure 11, respectively. By comparing the effects of far-field earthquakes and near-field pulse-type earthquakes, it can be observed that there is no significant correlation (i.e., p-value greater than 0.05) between the residual ln(ε|PGA) and ln(R) or M. This result effectively demonstrates the sufficiency of PGA.
Taking the five-story structure as an example, Figure 16 shows the distribution of p-values for the regression analysis of the residual ln(ε|IMi) of each selected seismic intensity measures against ln(R) along the height direction of the laminated bamboo frame structure. Under the action of far-field earthquakes, all IMs did not show a significant dependence on the epicentral distance ln(R) on each floor (all p-values exceeded 0.05). This indicates that these intensity measures show the sufficiency of epicentral distance R along the whole height of the laminated bamboo frame structure under the action of far-field earthquake. Under the effect of near-field earthquakes, SMA, IM123 and IM12 ( S ¯ a ) demonstrated insufficiency with respect to epicentral distance R in the mid-to-low floors of the laminated bamboo frame structure. IM12 ( S ¯ a ) and S a 12   demonstrated insufficiency with respect to epicentral distance R in the high floors of the laminated bamboo frame structure.
Figure 17 displays the distribution of p-values obtained from regression analysis of the residuals ln(ε|IMi) with respect to the earthquake magnitude M for the selected intensity measures in the five-story structure. As shown in Figure 17a, under the influence of far-field earthquakes, only the residual of SMA in the first and second floors of the laminated bamboo frame structure exhibit a slight dependency on the earthquake magnitude M. This phenomenon indicates that under far-field seismic conditions, this measure is not sufficient. However, when considering the effect of near-field ground motion, as shown in Figure 17b, the residuals of PGV and S* significantly depend on the earthquake magnitude M over the entire height range of the structure. The intensity measures circled in red in Figure 17b are not sufficient for both the bottom and top floors with respect to the earthquake magnitude M. These measures include INP, IM-CR, Sa,gm(Ti), Sv(T1), S12, S123 and SN1, etc. In conclusion, under the influence of near-field earthquakes, many seismic intensity measures are not sufficient with respect to earthquake magnitude M. These intensity measures are mostly based on spectral acceleration considering the effect of softening period or considering higher-mode effects. Compared to far-field earthquakes, this insufficiency may stem from the limited range of earthquake magnitudes in the selected near-field ground motions. However, in Section 4.1, intensity measures such as SMA, PGA, EDA, A95, IM12( S ¯ a ) and IM123, which have high efficiency, still demonstrate good sufficiency with respect to the earthquake magnitude M along the entire height of the laminated bamboo frame structure under the influence of near-field ground motion. PGD and V/A also exhibit good sufficiency with respect to earthquake magnitude M under the influence of near-field ground motion.

5. Intensity Measures Suitable for PIDR

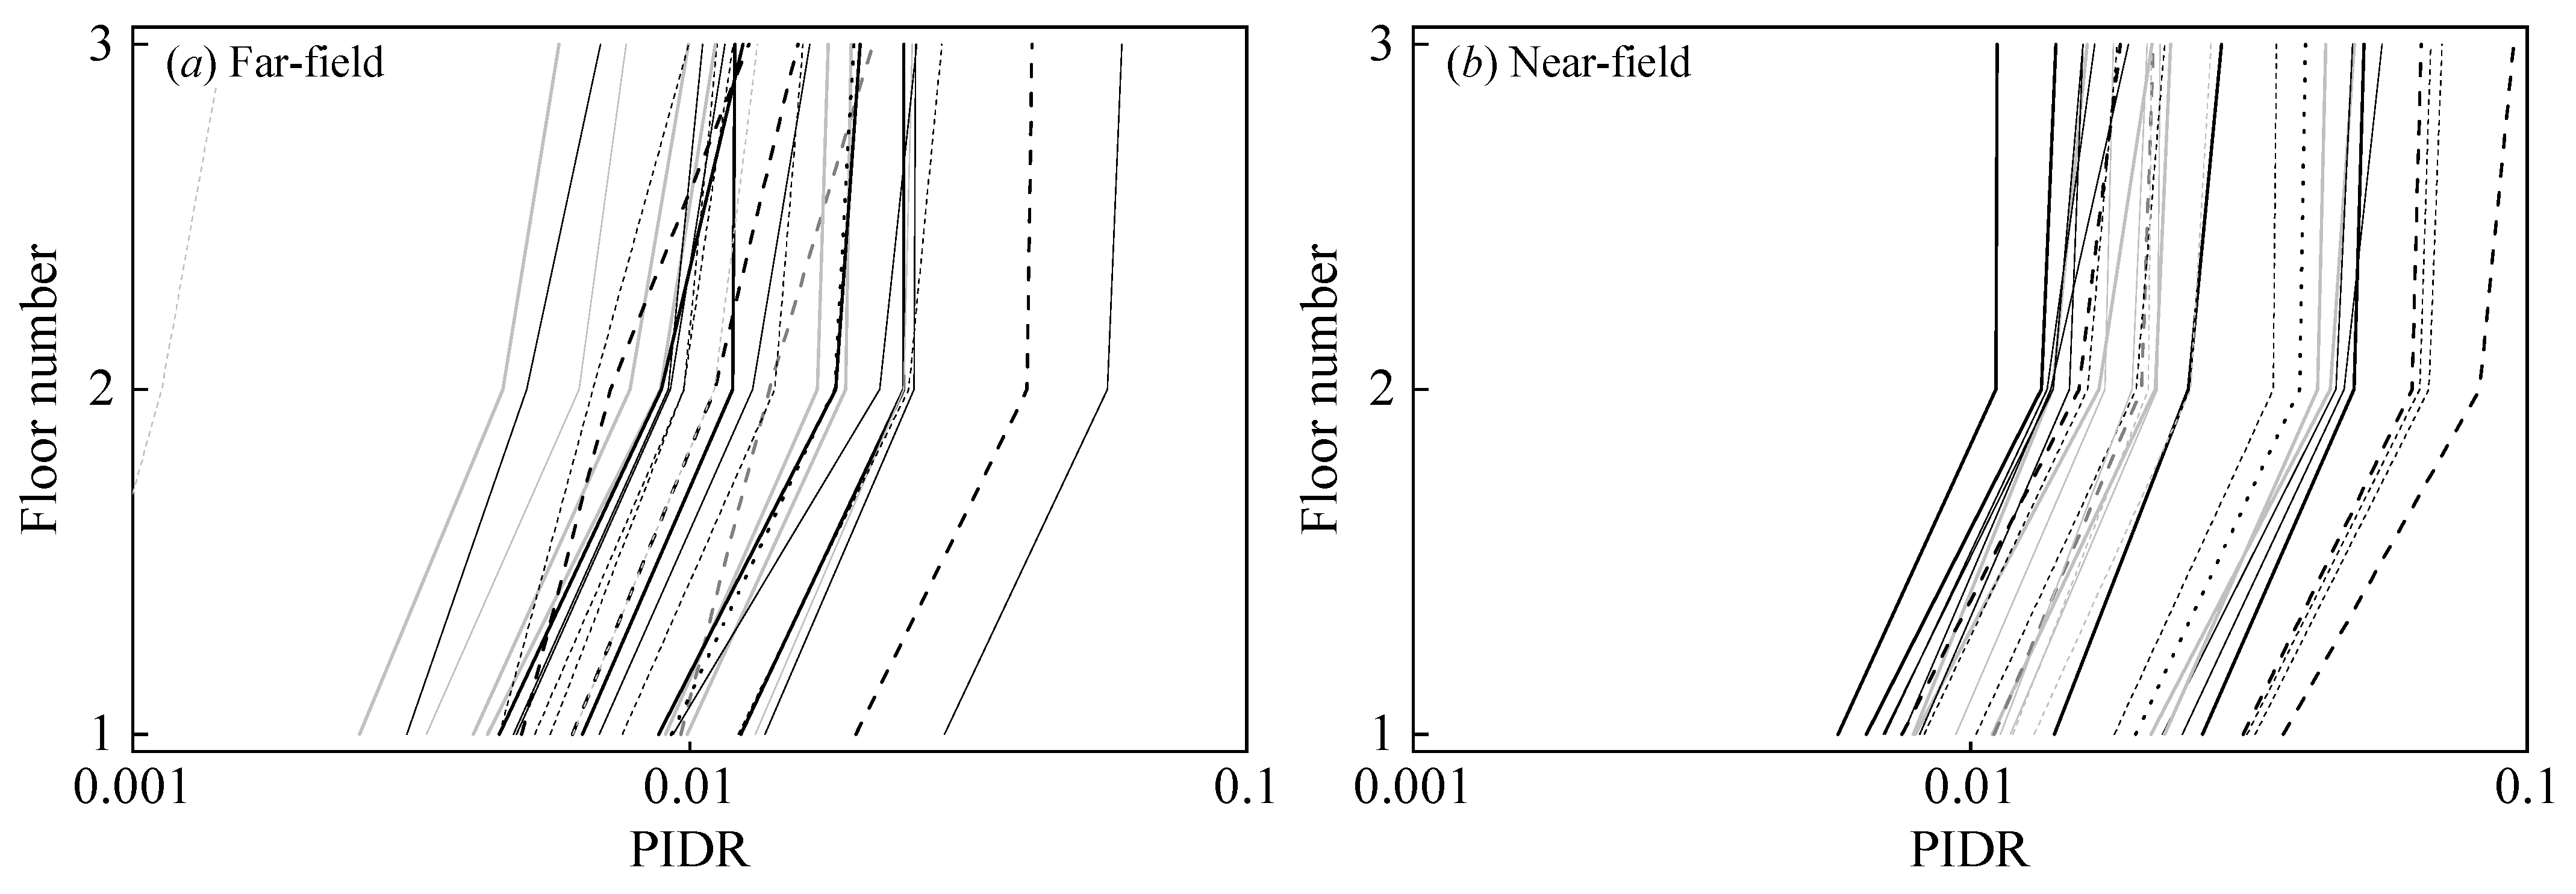
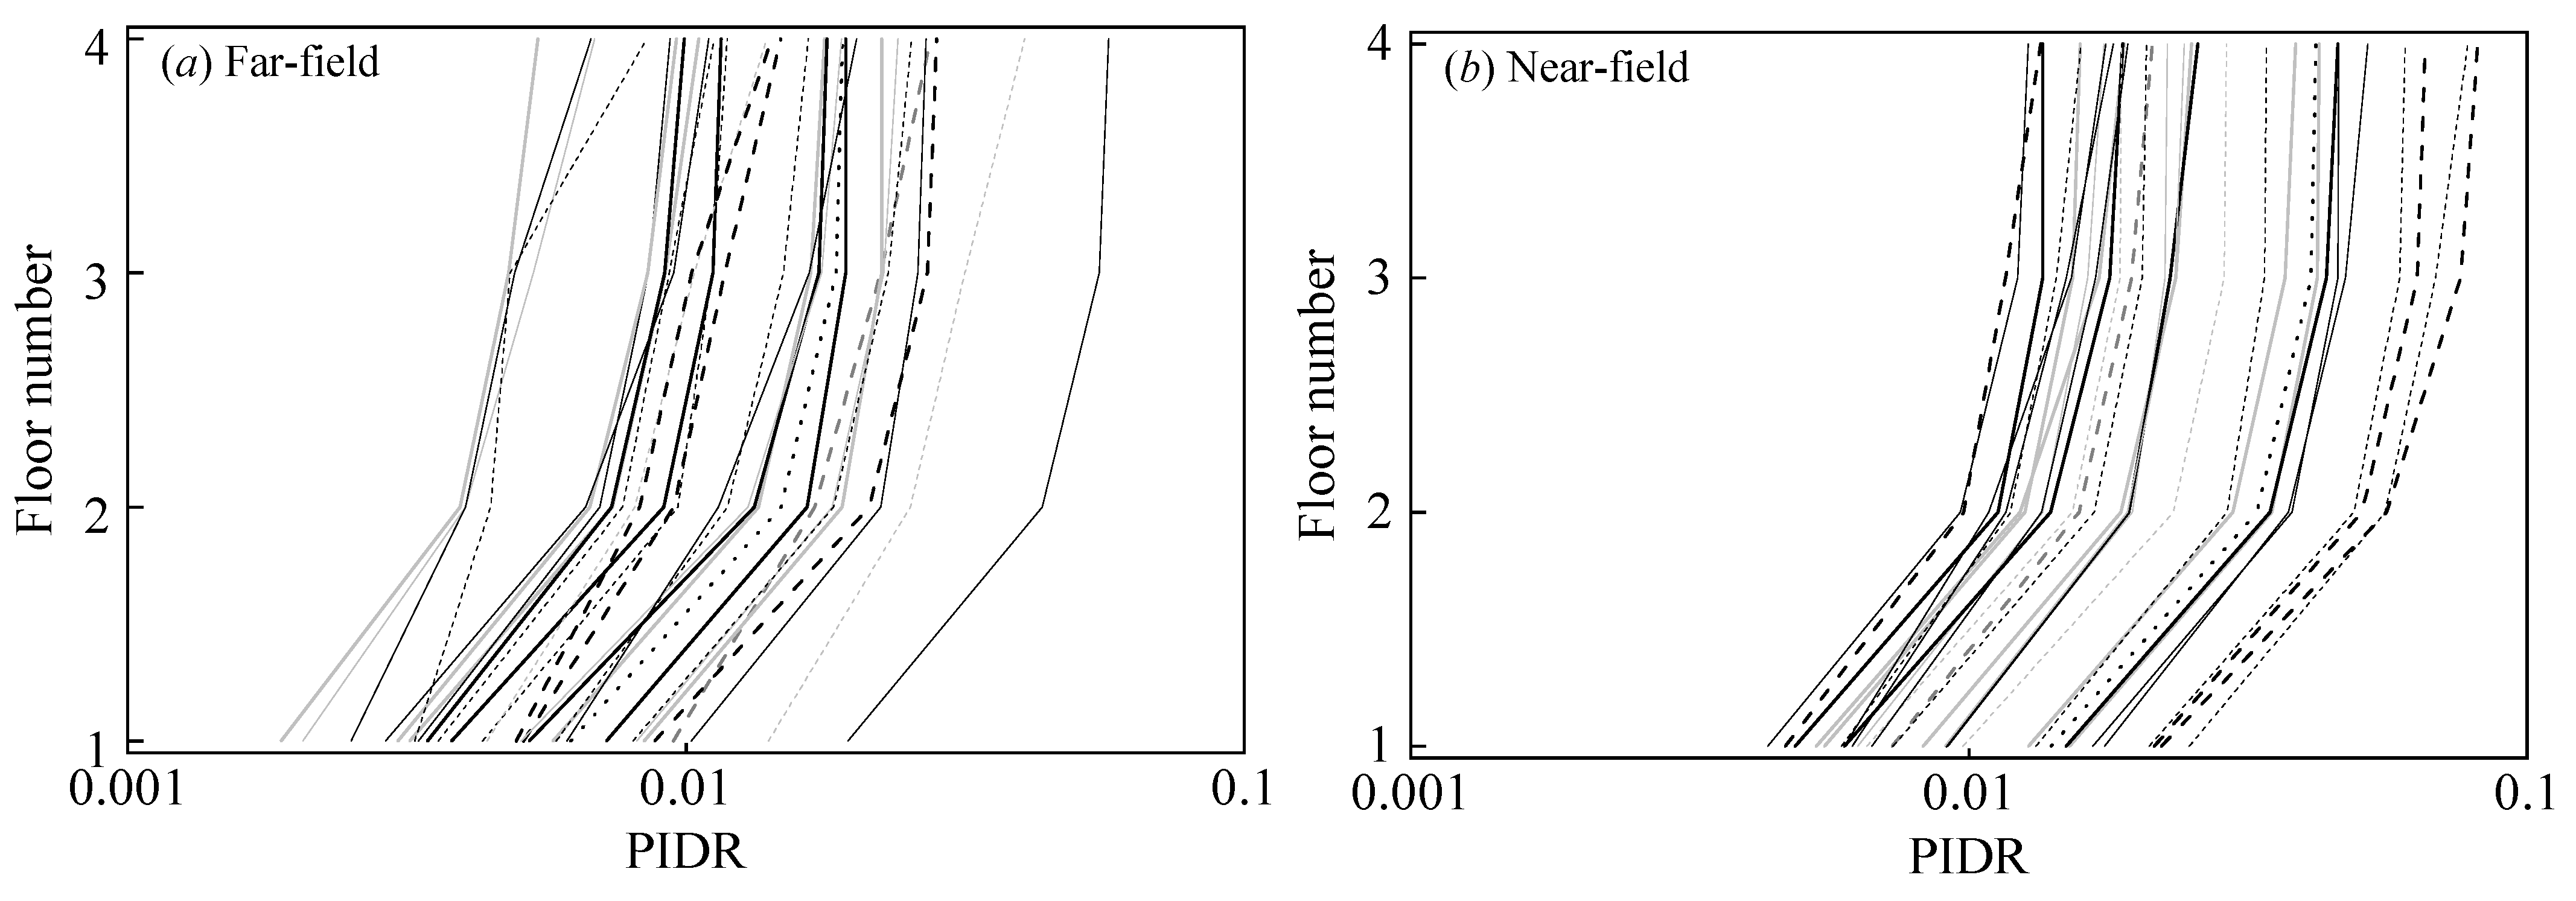
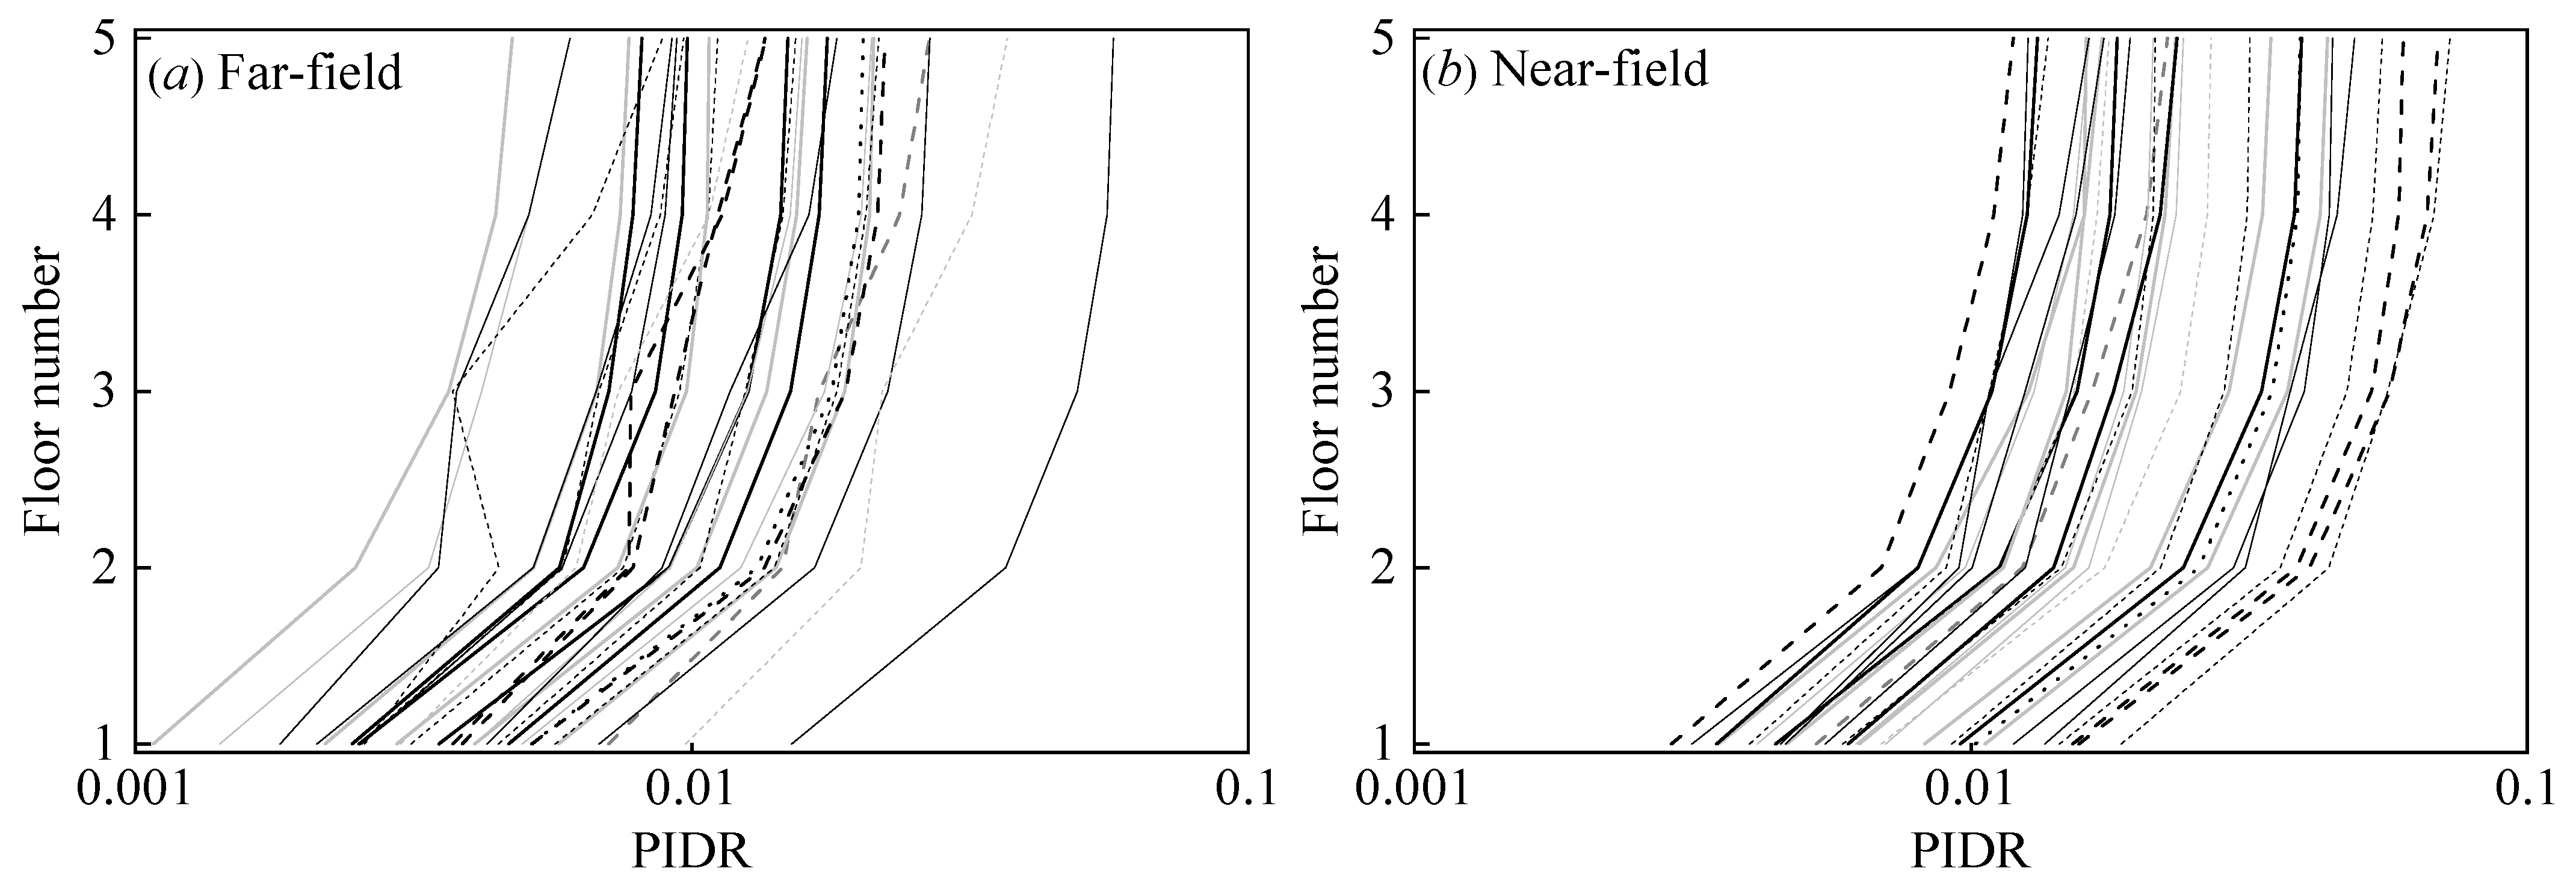
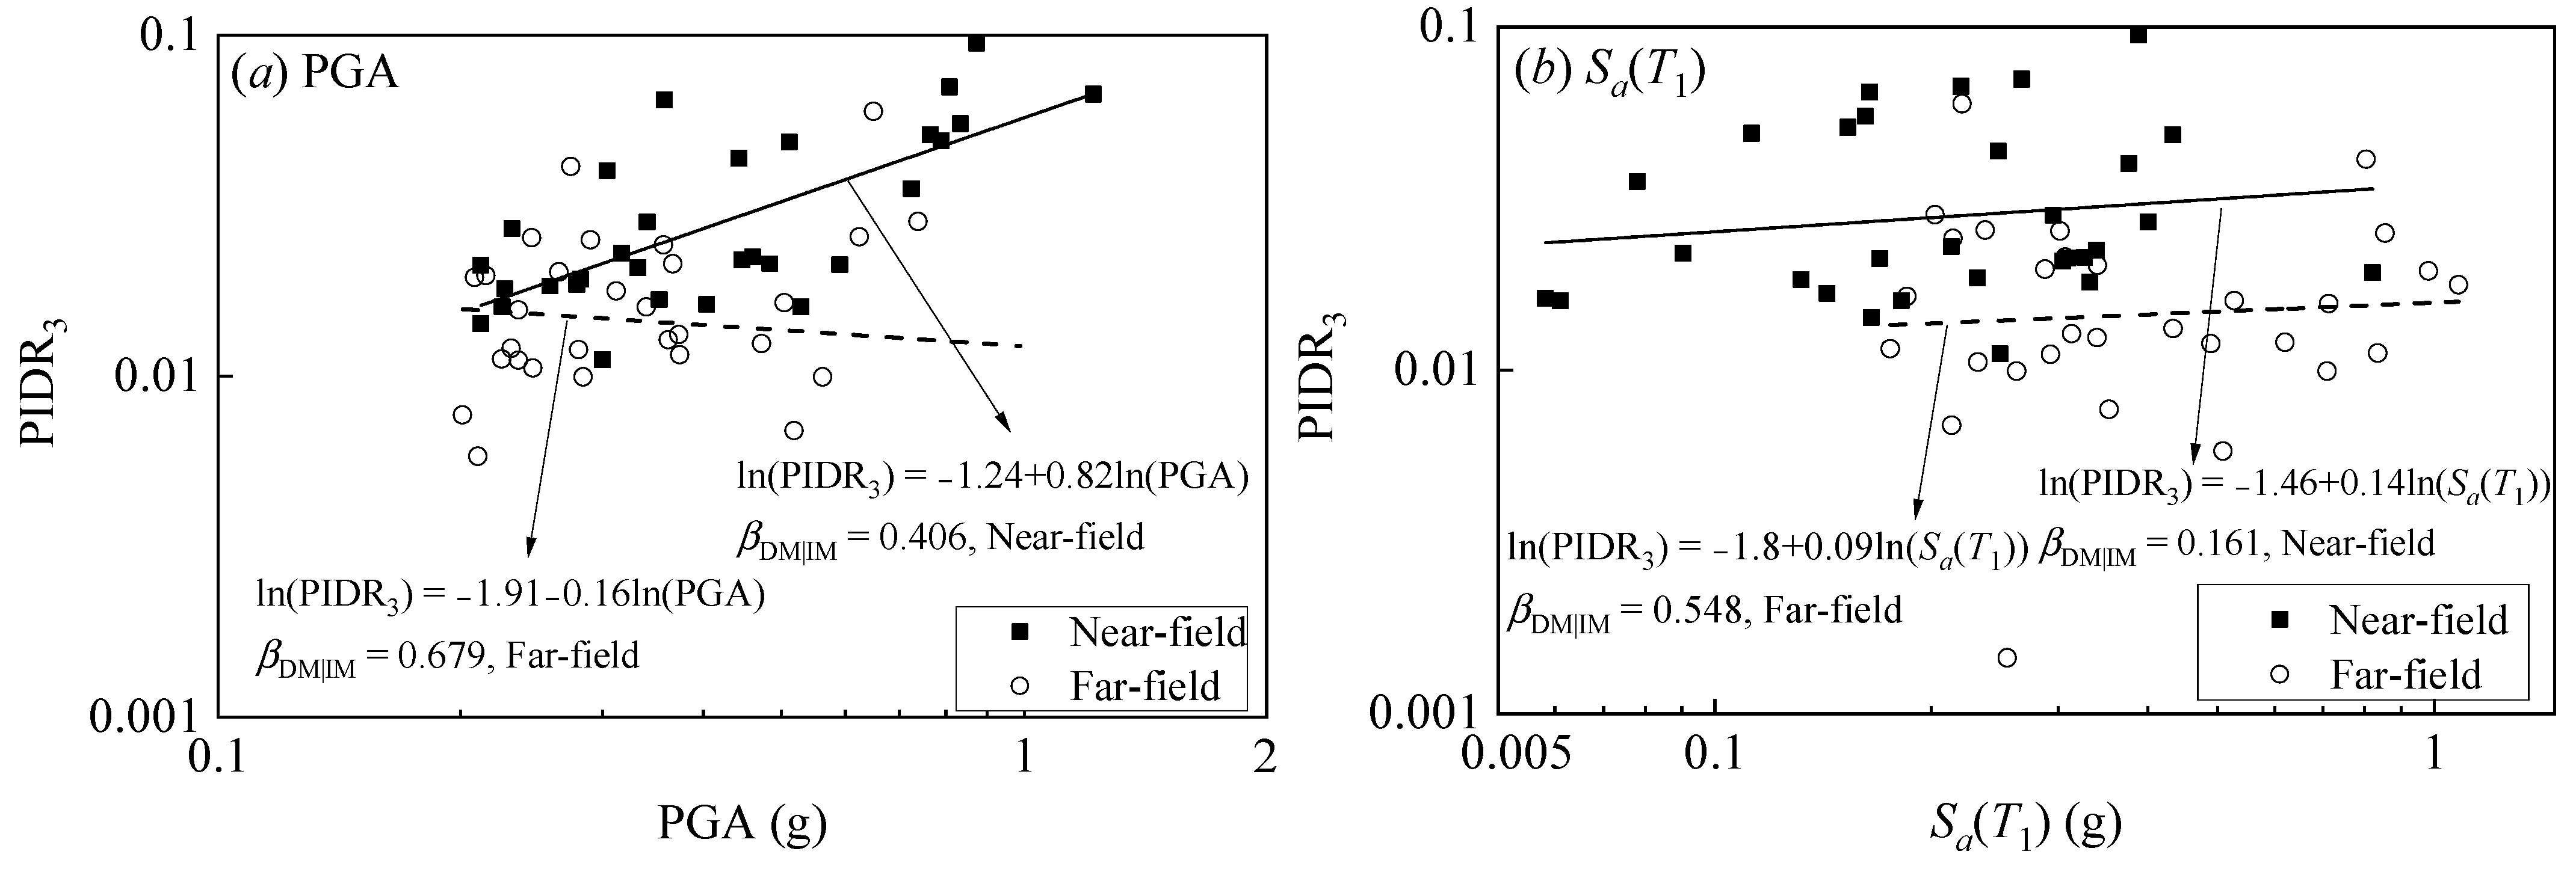
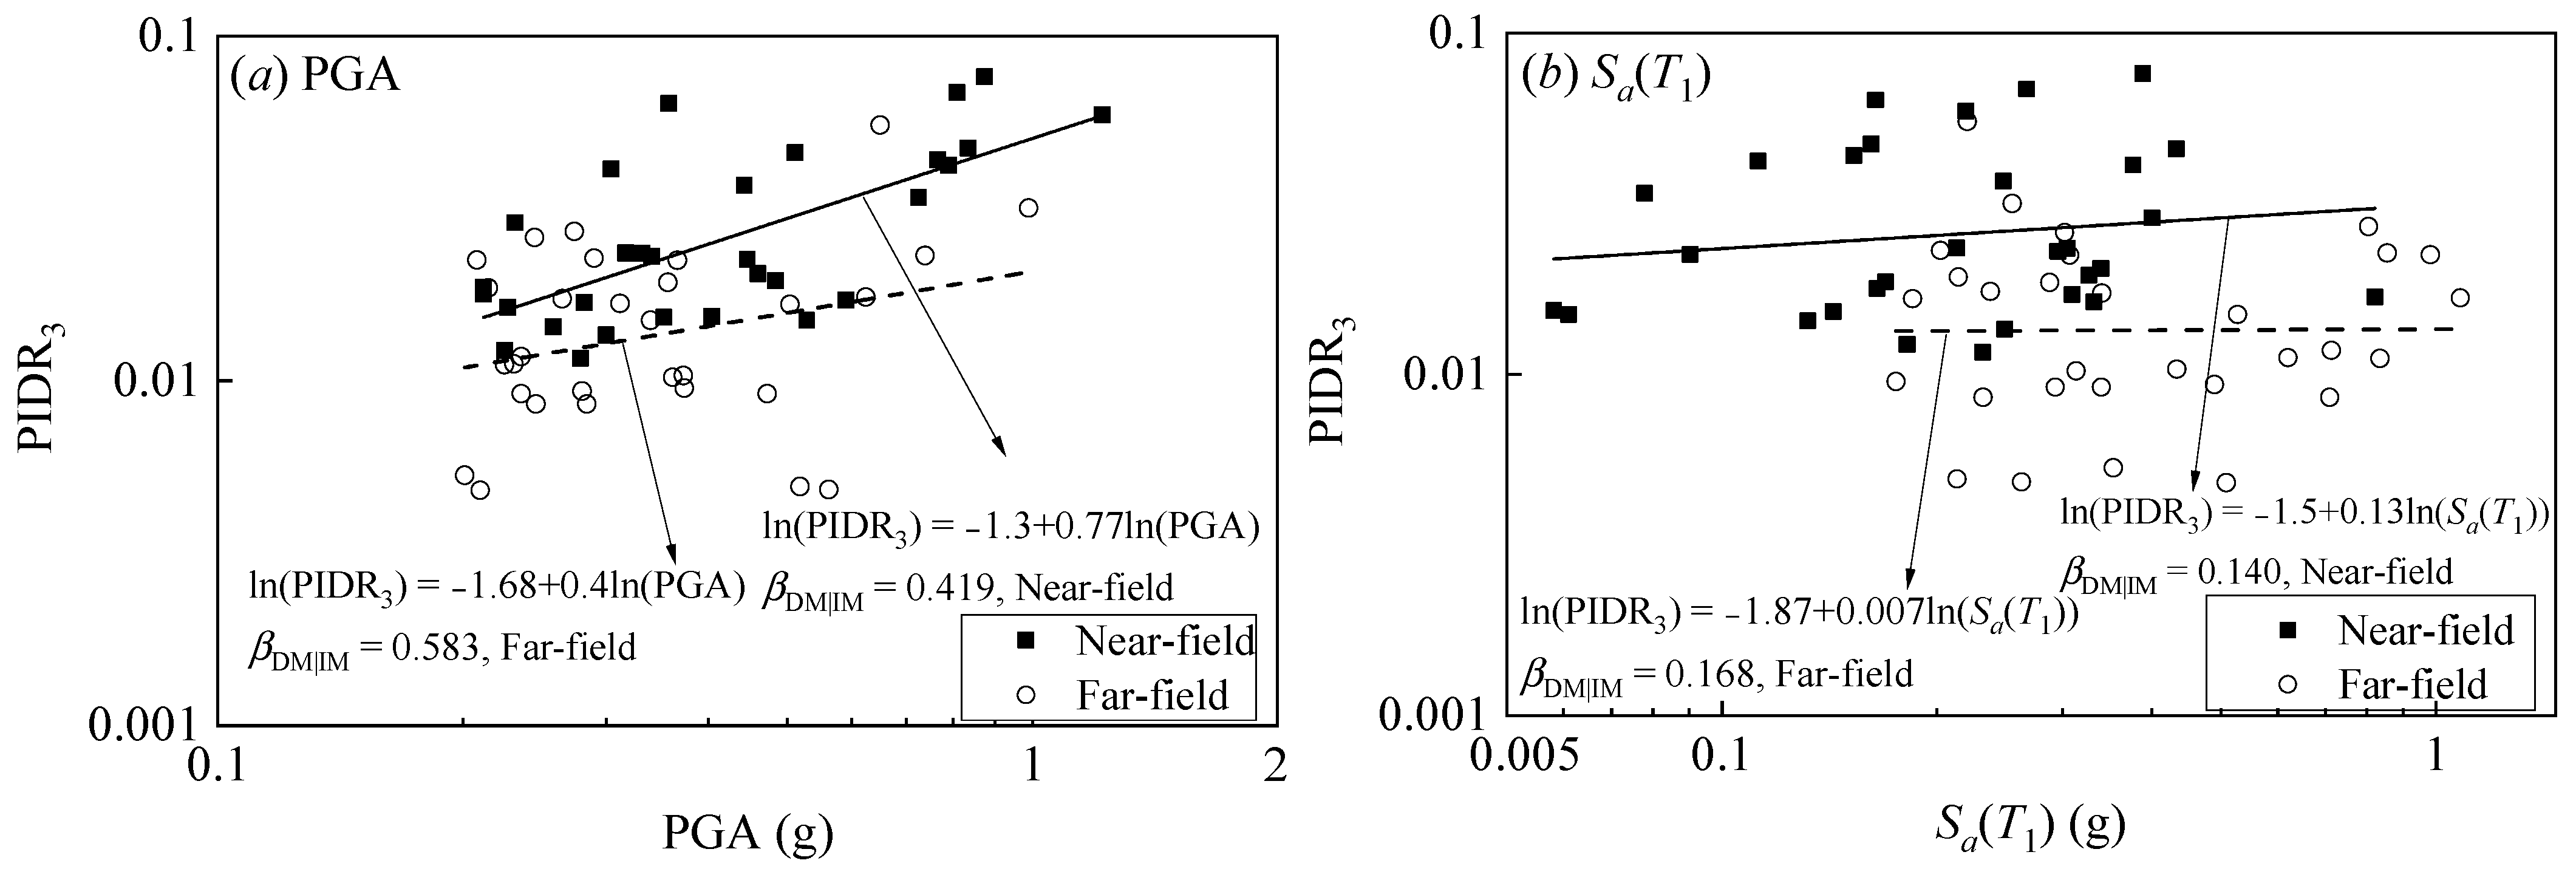
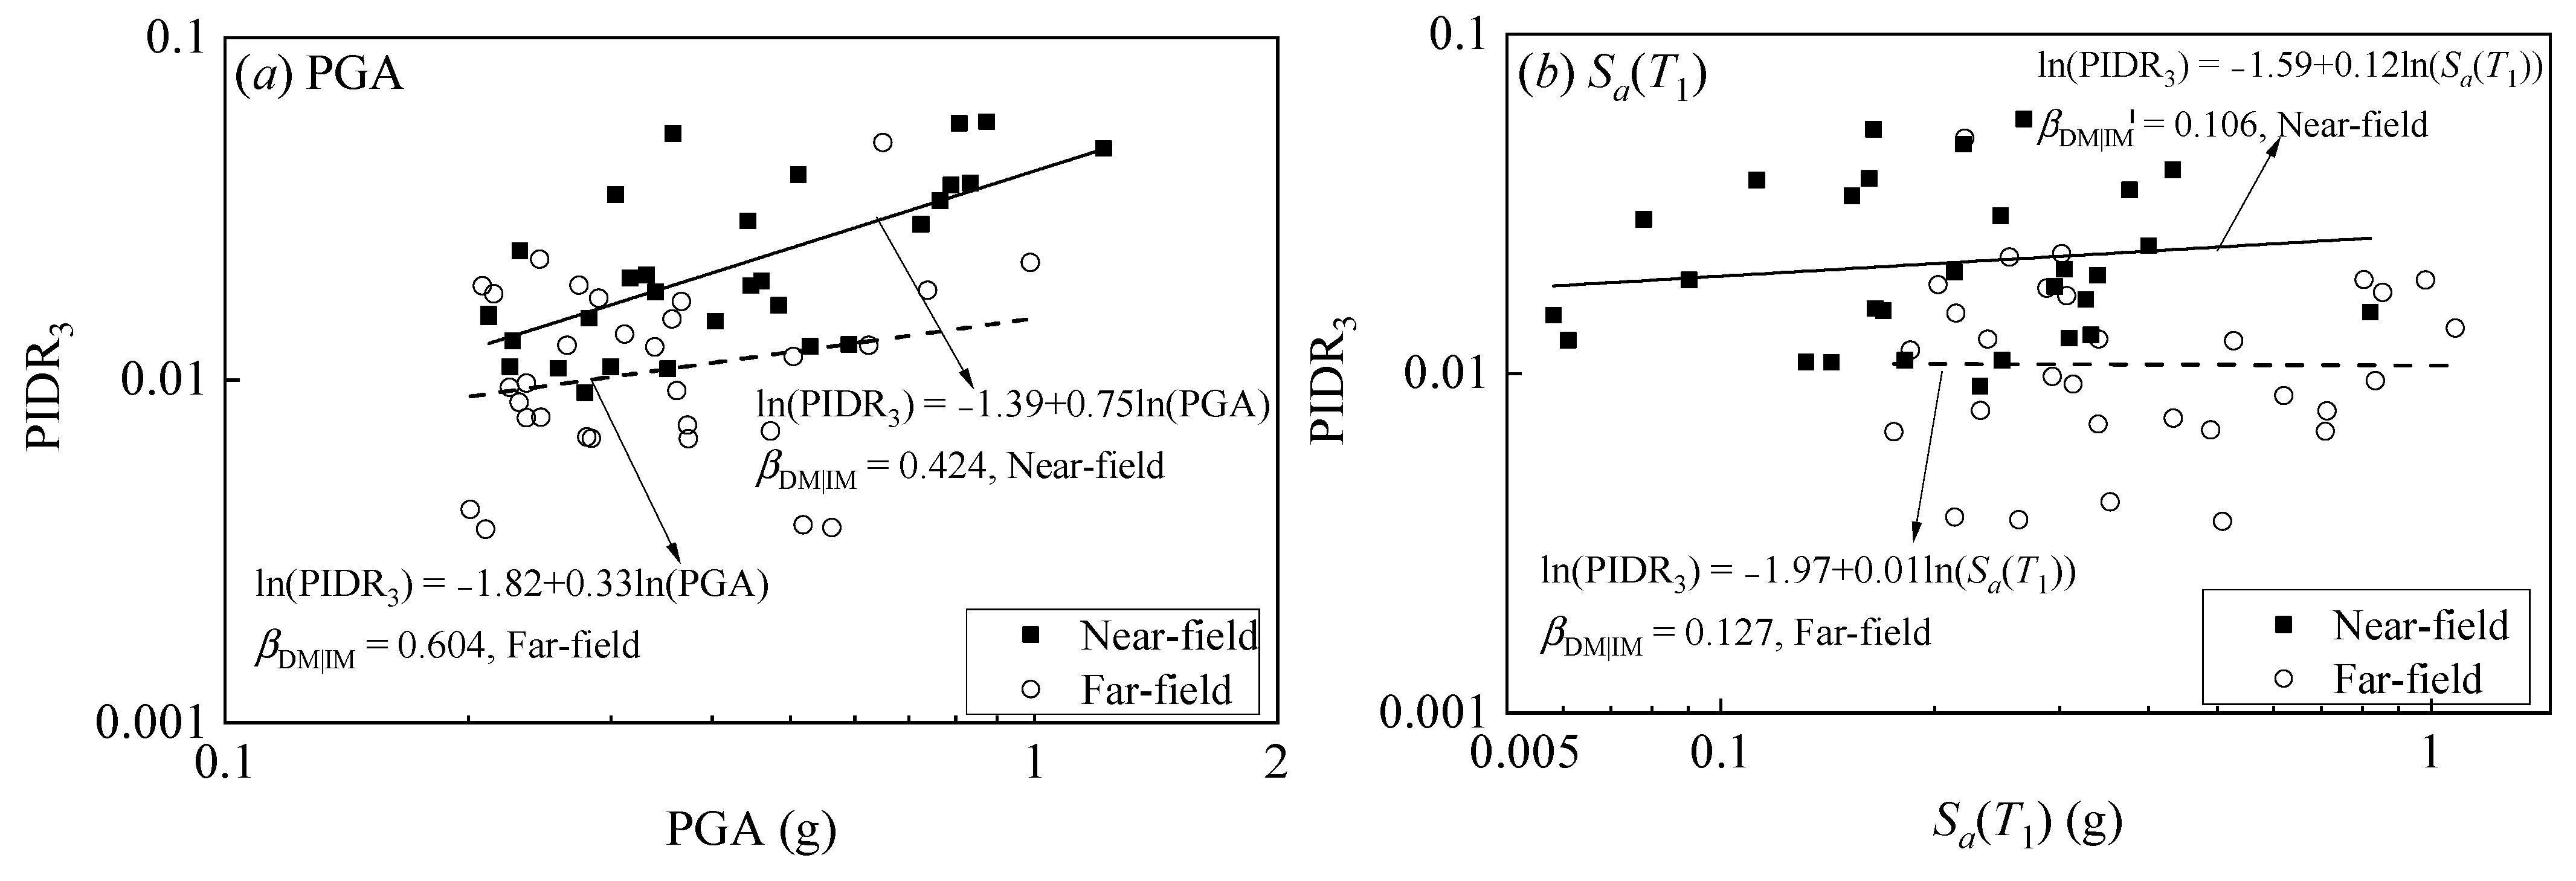
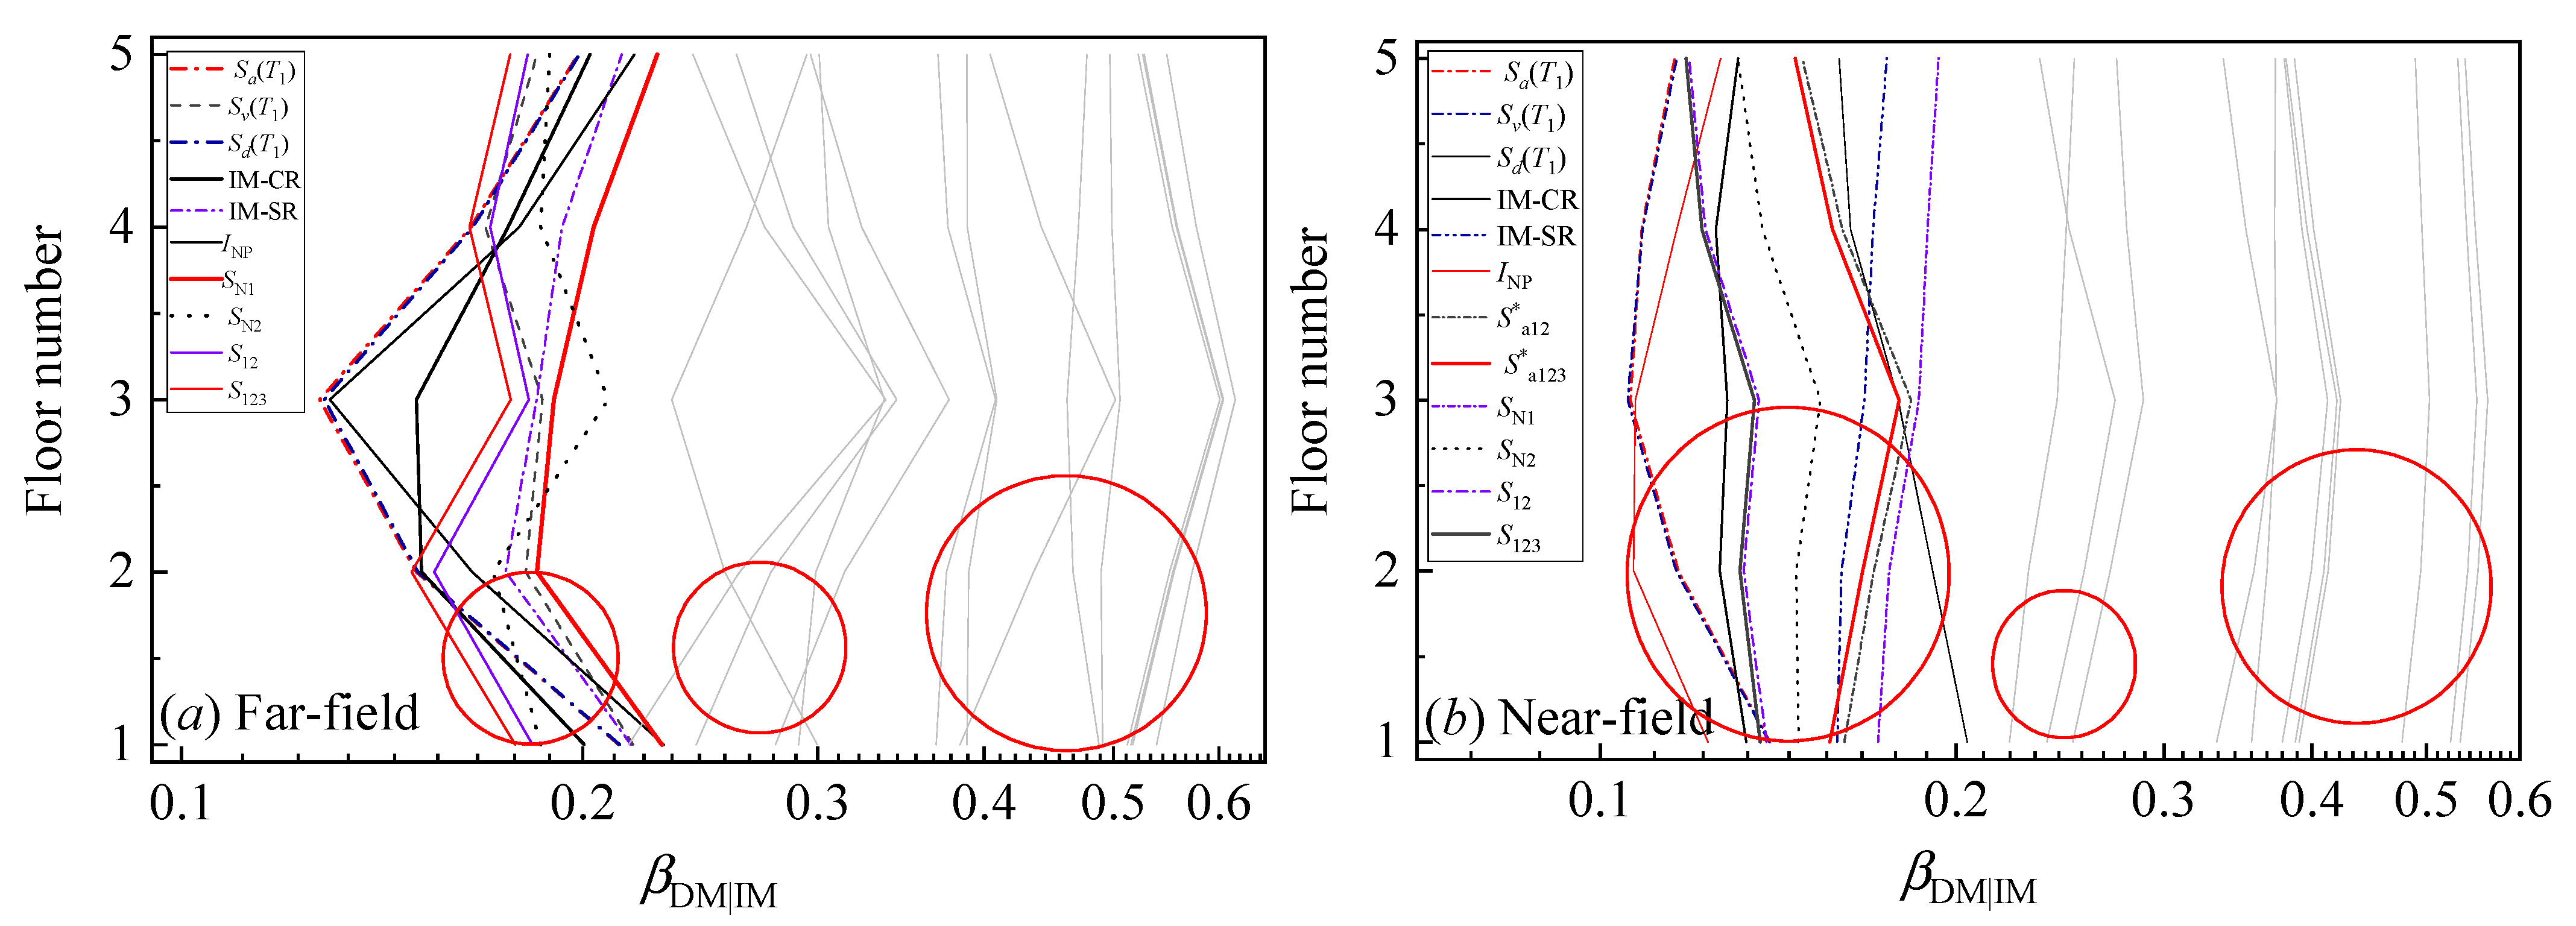
5.1. Efficiency of IMs in Estimating PIDR

Figure 18, Figure 19 and Figure 20 illustrate the distribution of PIDR along the height of the 3-, 4-, and 5-story laminated bamboo frame structures, respectively. For laminated bamboo frame structures, the PIDR typically increases progressively with the height of the structure, irrespective of far-field or near-field conditions. Only a few seismic records display irregular characteristics. This highlights the significant influence of the first mode of vibration, as previously mentioned. Focusing on the PIDR of the third story of the laminated bamboo frame structure (hereafter referred to as PIDR3), Figure 21, Figure 22 and Figure 23 present a detailed linear regression analysis of PIDR3 in relation to the seismic intensity indices PGA and Sa(T1) for 3-, 4-, and 5-story structures, respectively. In comparing the effects of far-field earthquake and near-field pulse-type earthquake, it is evident that, compared to PGA, the correlation between Sa(T1) and the PIDR3 is more significant, demonstrating higher efficiency (reflected by smaller values of βDM|IM). This phenomenon is closely linked to the vibration characteristics of laminated bamboo frame structures, primarily governed by the first mode of vibration (Zhang et al., 2024 [31]). Compared to PGA, Sa(T1) better reflects the fundamental dynamic properties of the structure.
Taking the 5-story structure as an example, Figure 24 illustrates in detail the distribution of the standard deviation βDM|IM, which represents the variability between different seismic intensity measures and PIDR, across the height of the 5-story laminated bamboo frame structure. From the two figures, it can be observed that some measures exhibit significant variations in the values of βDM|IM along the vertical direction of the floors. The figures are marked to identify measures with lower βDM|IM values. Based on the magnitude of βDM|IM, the measures in the figures can generally be divided into three parts.
As shown in Figure 24, the seismic intensity measures displayed on the left side of the diagram have the smallest values of βDM|IM, which also indicates that these seismic intensity measures are the most efficient. Under the effect of far-field ground motion, the IMs on the left side, including the first mode spectral acceleration Sa(T1) and the spectral displacement Sd(T1), exhibit the highest effectiveness. This may be related to the dynamic characteristics of laminated bamboo frame structures, which are primarily governed by the first mode period. In addition, Sa(T1) and Sd(T1) are approximately linearly proportional, thus showing a correlation that is similar to the structural response (Zhang et al., 2018 [39]). At the same time, the spectral velocity measure Sv(T1) also exhibits high effectiveness. Some intensity measures that considered higher-order vibration modes based on Sa(T1), such as S12, S123 SN1 and SN2, as well as intensity measures considering softening periods like IM-CR, IM-SR and INP, also achieved relatively high effectiveness. Under the effect of near-field ground motions, the left part of Figure 24b includes Sa(T1), Sd(T1) and Sv(T1). In addition, intensity measures such as S12, S123, and INP,along with higher-order vibration mode metrics like S a 12 , S a 123 , and SN2 based on Sa(T1), as well as IM-CR, IM-SR, and SN1, which account for softening periods, all exhibit low βDM|IM values.
For far-field earthquakes, the intensity measures in the middle part of Figure 24a include S*, S a 123 , S a 12 , IM12 ( S ¯ a ) and Sa,gm(Ti). In near-field ground motions, the intensity measures in the middle part of Figure 24b include S*, IM12 ( S ¯ a ) and Sa,gm(Ti). The remaining measures in Figure 24 are all categorized in the right-hand section. Under both far-field and near-field seismic actions, the right-hand portion includes seismic intensity measures analyzed earlier in this document, which exhibit higher efficiency for PFA, such as PGA, SMA, EDA, and A95. These measures all demonstrate lower effectiveness correlating with peak inter-story drift angles.
After in-depth comparison, it can be concluded that there is a significant difference between the seismic intensity measures for PIDR and those used to measure PFA. Under the influence of far-field ground motions and near-field pulse-type ground motions, indicators such as Sa(T1), S12 and S123 all exhibit higher efficiency for PIDR. Additionally, intensity measures such as Sd(T1), Sv(T1), SN2, IM-CR and INP also demonstrate a good correlation with PIDR under the effects of far-field ground motion or near-field pulse-type ground motion. It can be observed that these indicators are almost related to spectral acceleration. However, the IMs that show better correlation with PFA are all acceleration-related, such as PGA, SMA, EDA, and A95, as well as Sa(T1)-based indices that consider higher mode effects, such as IM123, IM12( S ¯ a ), S a 123 and S a 12 .

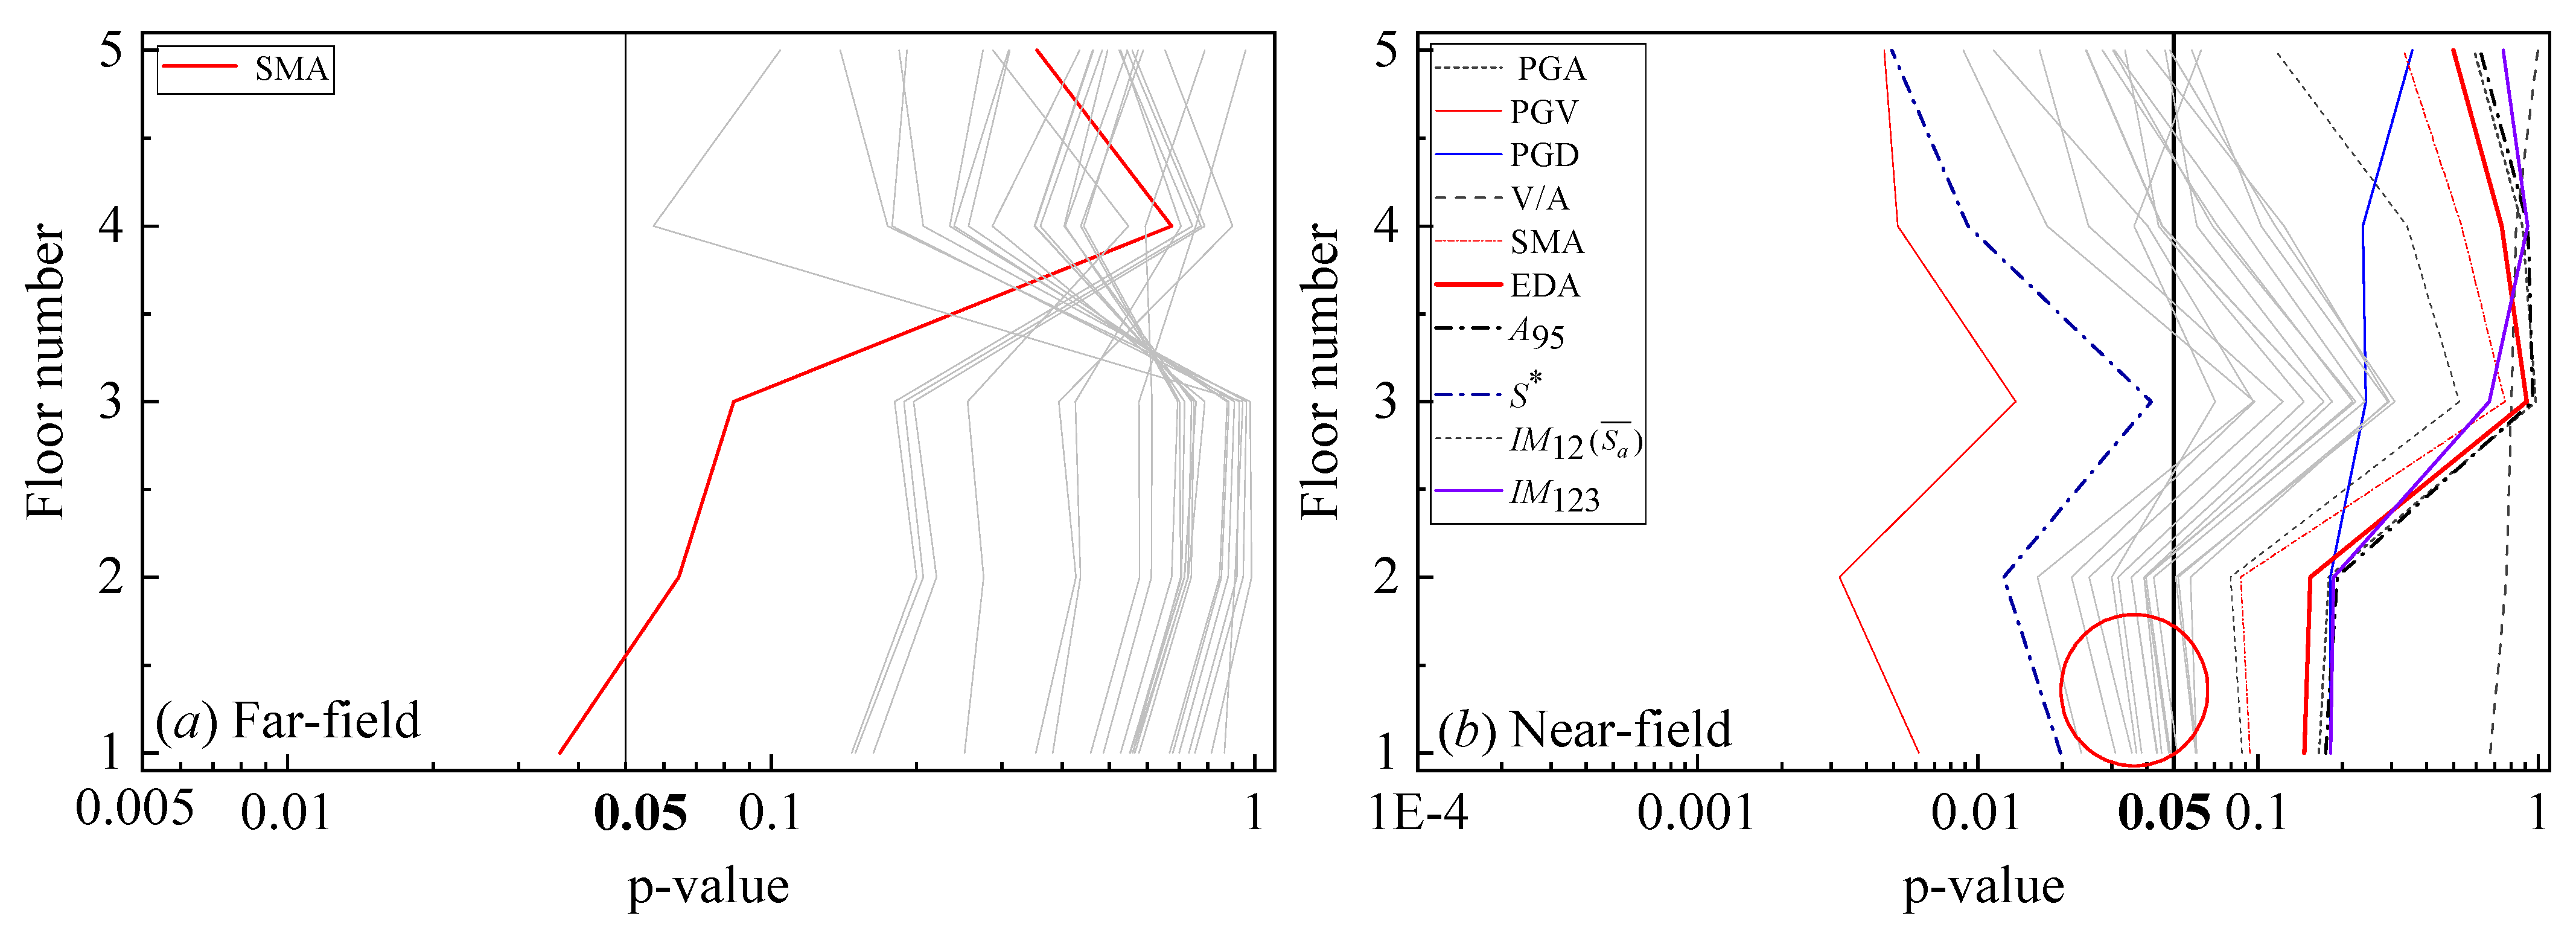
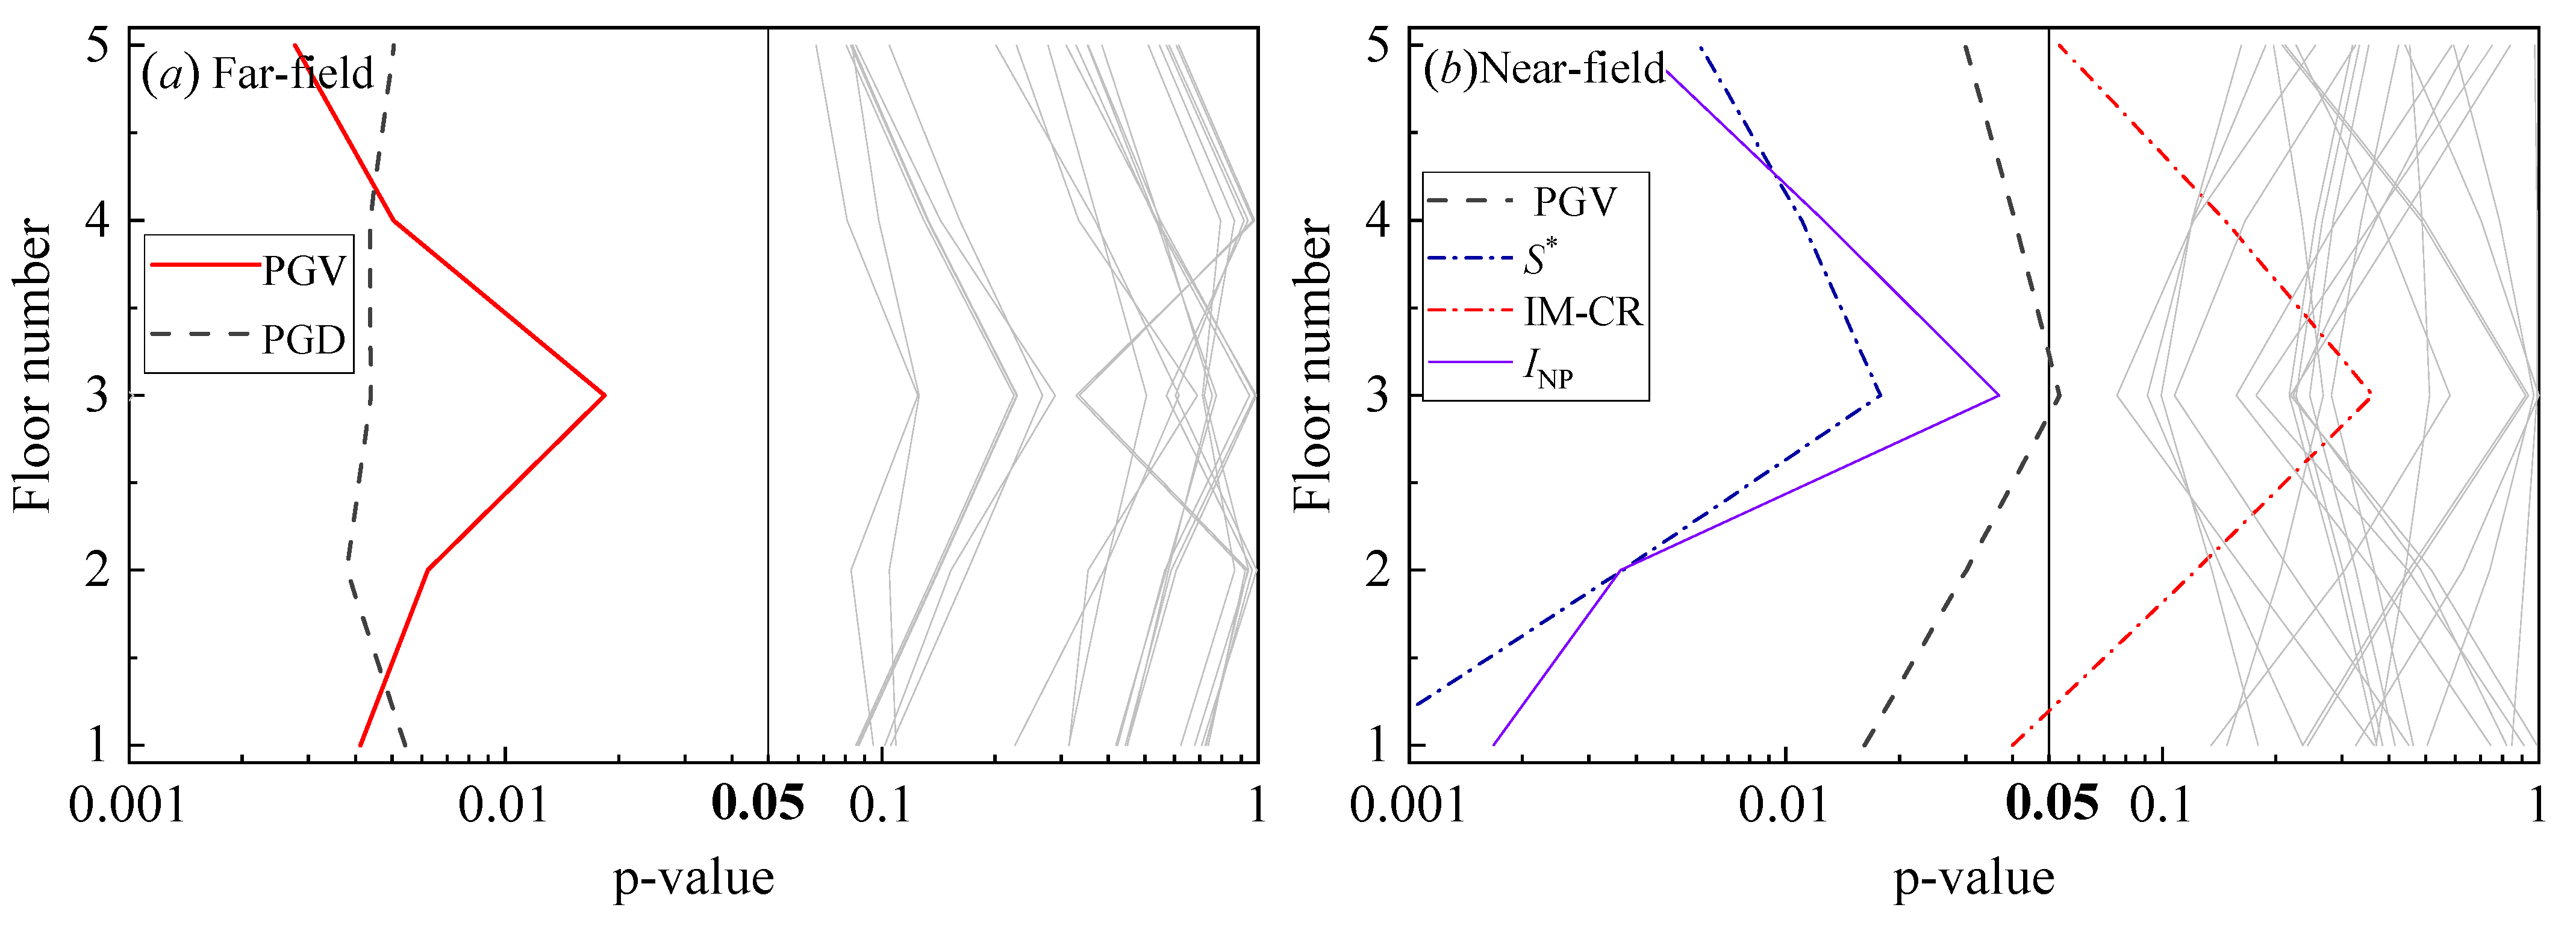
5.2. Sufficiency of IMs in Estimating PIDR

Taking the PIDR on the third floor (PIDR3) of the laminated bamboo frame structure as an example, Figure 25, Figure 26 and Figure 27, respectively, show the p-value results of the regression analysis for the three structures, respectively, where M and ln(R) serve as independent variables, and ln(ε|PGA) as the dependent variable. The residual error ln(ε|PGA) mentioned here originates from the regression analysis between PIDR3 and PGA, as specifically shown in Figure 22 and Figure 23. Under the influence of near-field ground motions, a significant dependence can be observed between the residuals ln(ε|PGA) and ln(R) (i.e., p-value less than 0.05), indicating the insufficiency of PGA with respect to the epicentral distance R. As for the magnitude M, PGA has sufficiency under both types of ground motions (Figure 25b, Figure 26b and Figure 27b).
Taking the 5-story structure as an example, Figure 28 presents the distribution of p-values obtained from the regression analysis of the residuals ln(ε|IMi) with respect to the ln(R) along the height of the laminated bamboo frame structure. It can be observed that the sufficiency of some seismic intensity measures is correlated with the height of the floors. Under the influence of far-field earthquakes, Sv(T1) demonstrates insufficiency with respect to the epicentral distance R across almost the entire 5-story structure, which are identified as highly efficient in Section 5.1. Under the influence of near-field ground motions, intensity measures such as V/A, IM12 ( S ¯ a ), PGA, PGD, A95, S ¯ a and EDA demonstrate insufficiency with respect to the epicentral distance R across all floor heights. Conversely, SMV and IM12 ( S ¯ a ) exhibit insufficiency at the lower floors of the five-story laminated bamboo frame structure.
Figure 29 displays the p-values from the regression analysis of the residuals ln(ε|IMi) against the magnitude M along the structural height for the selected seismic intensity measures in the 5-story structure. As shown in Figure 29a, under the influence of far-field ground motions, PGV and PGD significantly depend on the magnitude M across the entire structural height, indicating that both of them are insufficient under far-field earthquakes. According to Figure 29b, under the influence of near-field ground motions, INP and S* are not sufficient along the entire floor height. PGV is inadequate on almost all floors. Moreover, in Section 5.1 above, IM-CR, which is proved to be highly efficient considering the effect of softening period, shows a little inadequacy in the first layer under the influence of near-field ground motions.

6. Conclusions

This study analyzes the seismic demands of three laminated bamboo frame structures, each with 3, 4, and 5 stories, under near-field and far-field seismic motions. It uses PFA and PIDR as engineering performance demand parameters. Additionally, the study identifies appropriate seismic intensity measures for evaluating the seismic demands of laminated bamboo frame structures, considering both efficiency and sufficiency. The principal conclusions are as follows:
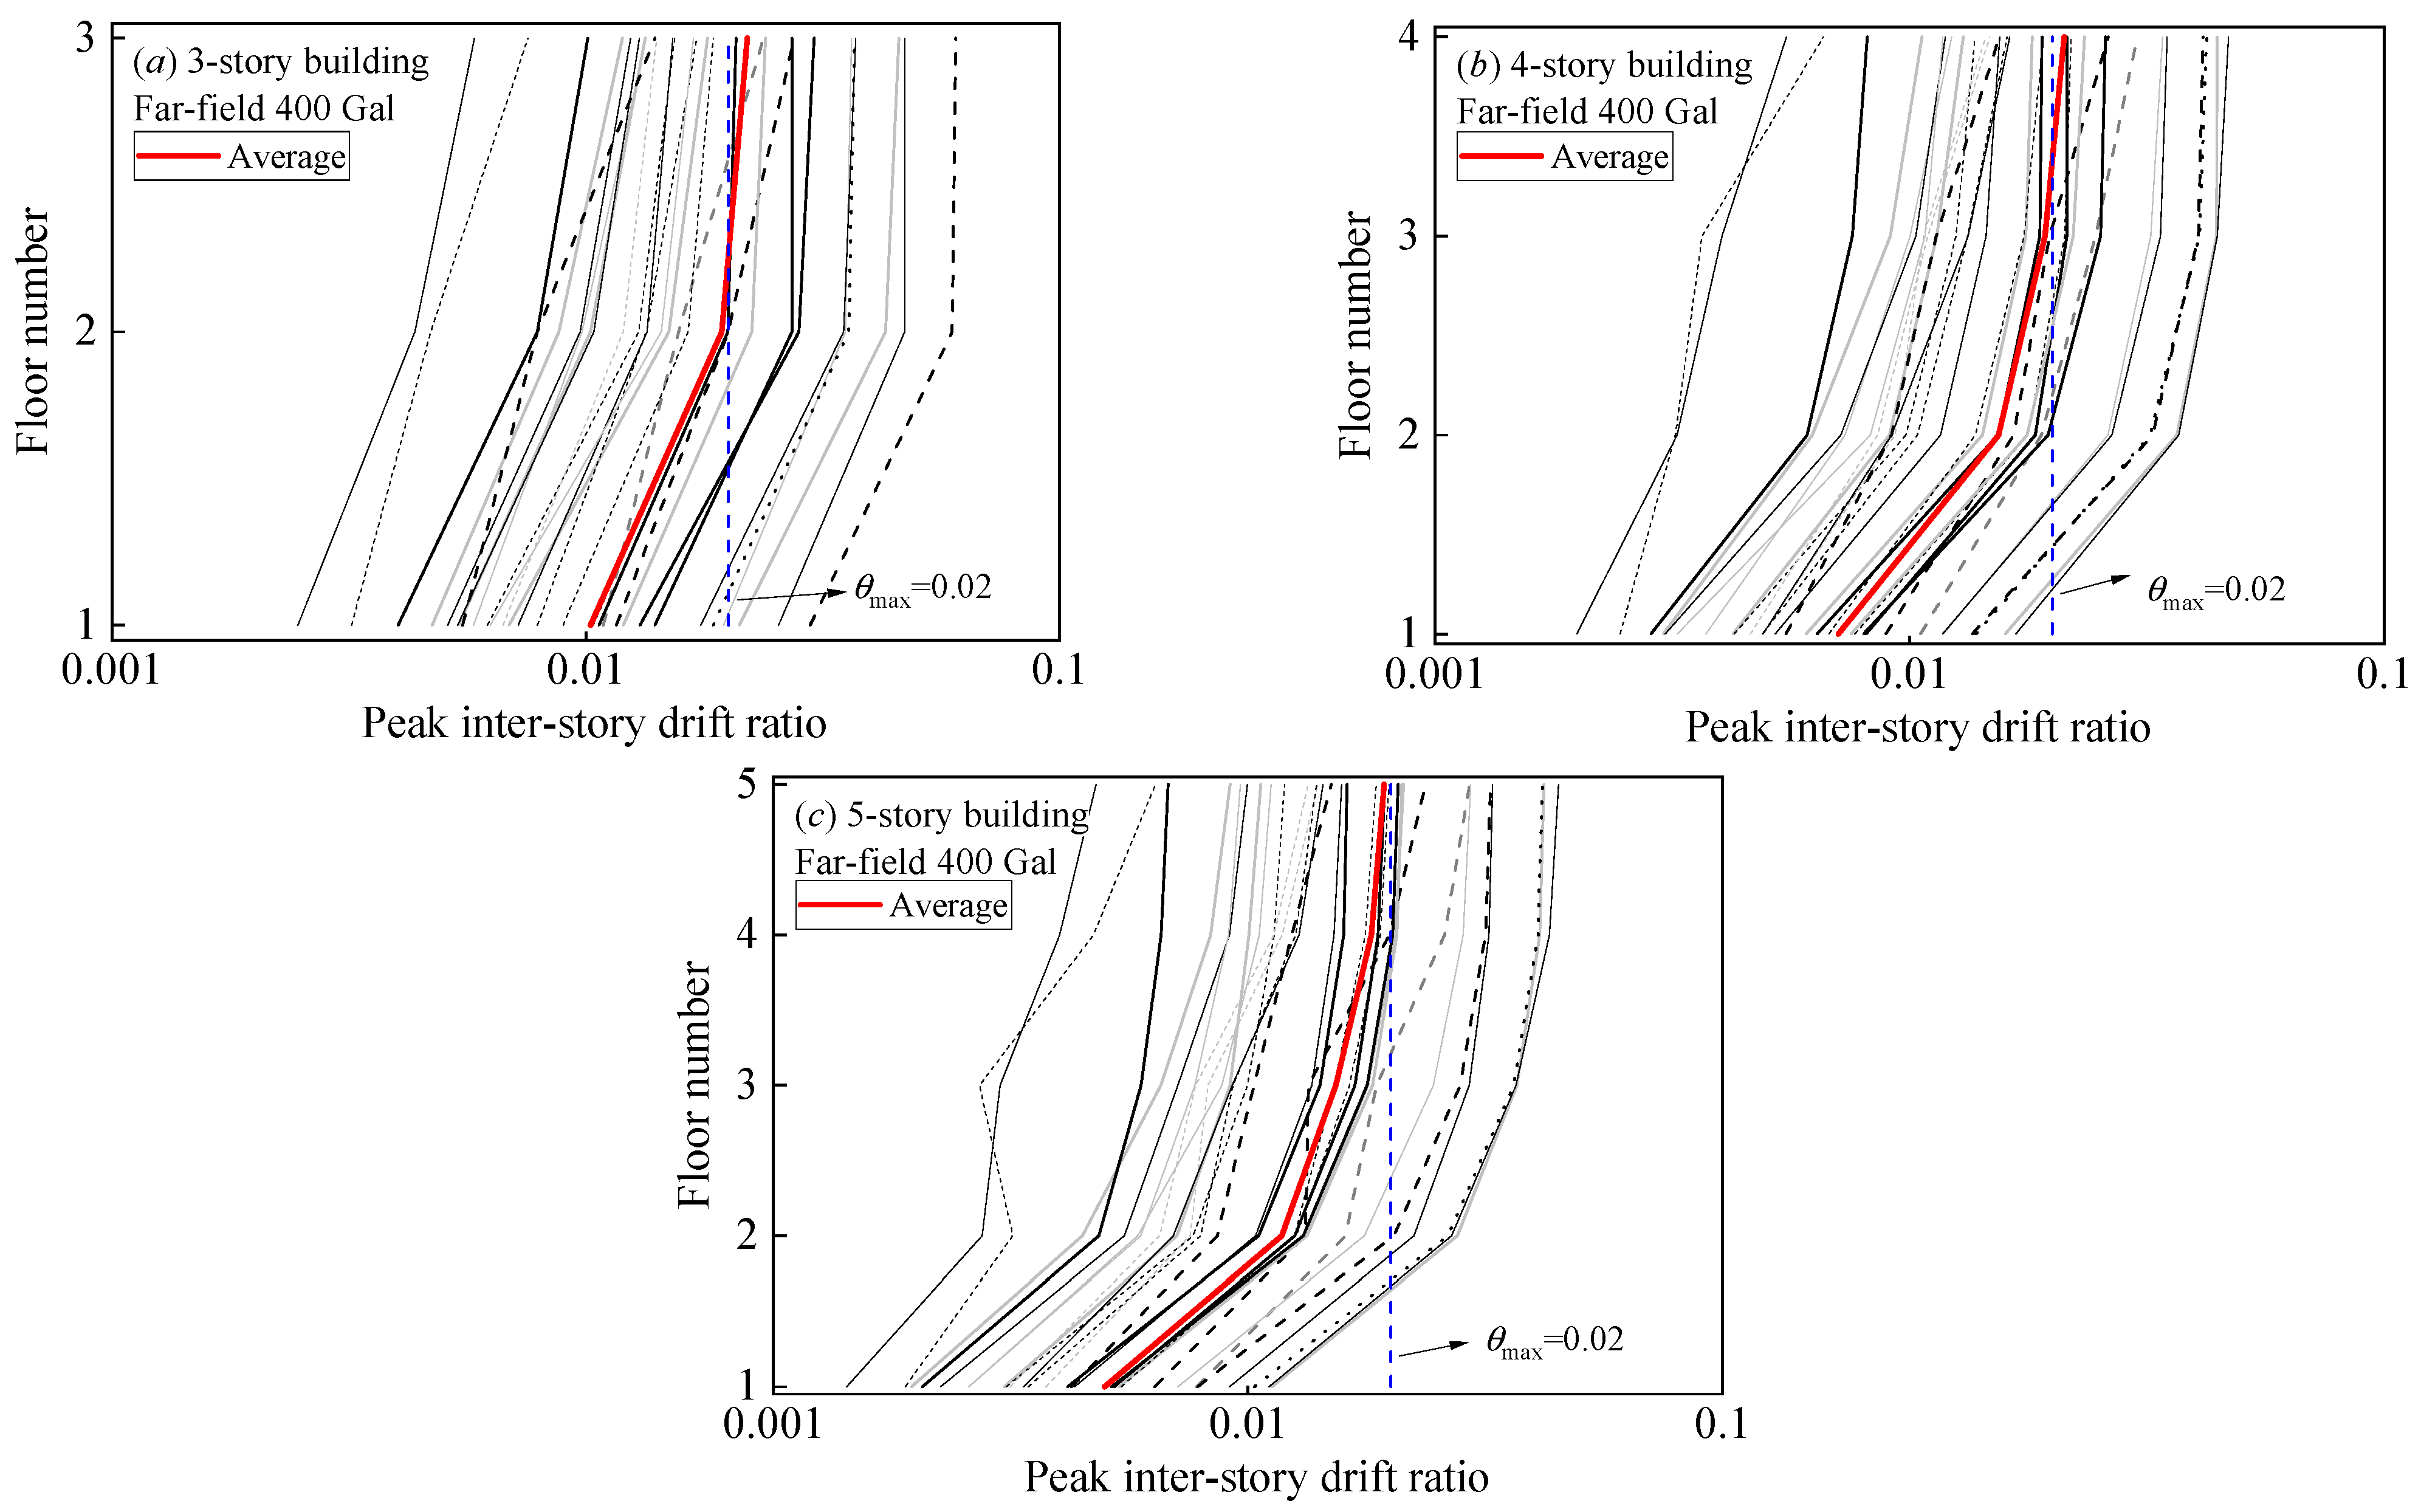
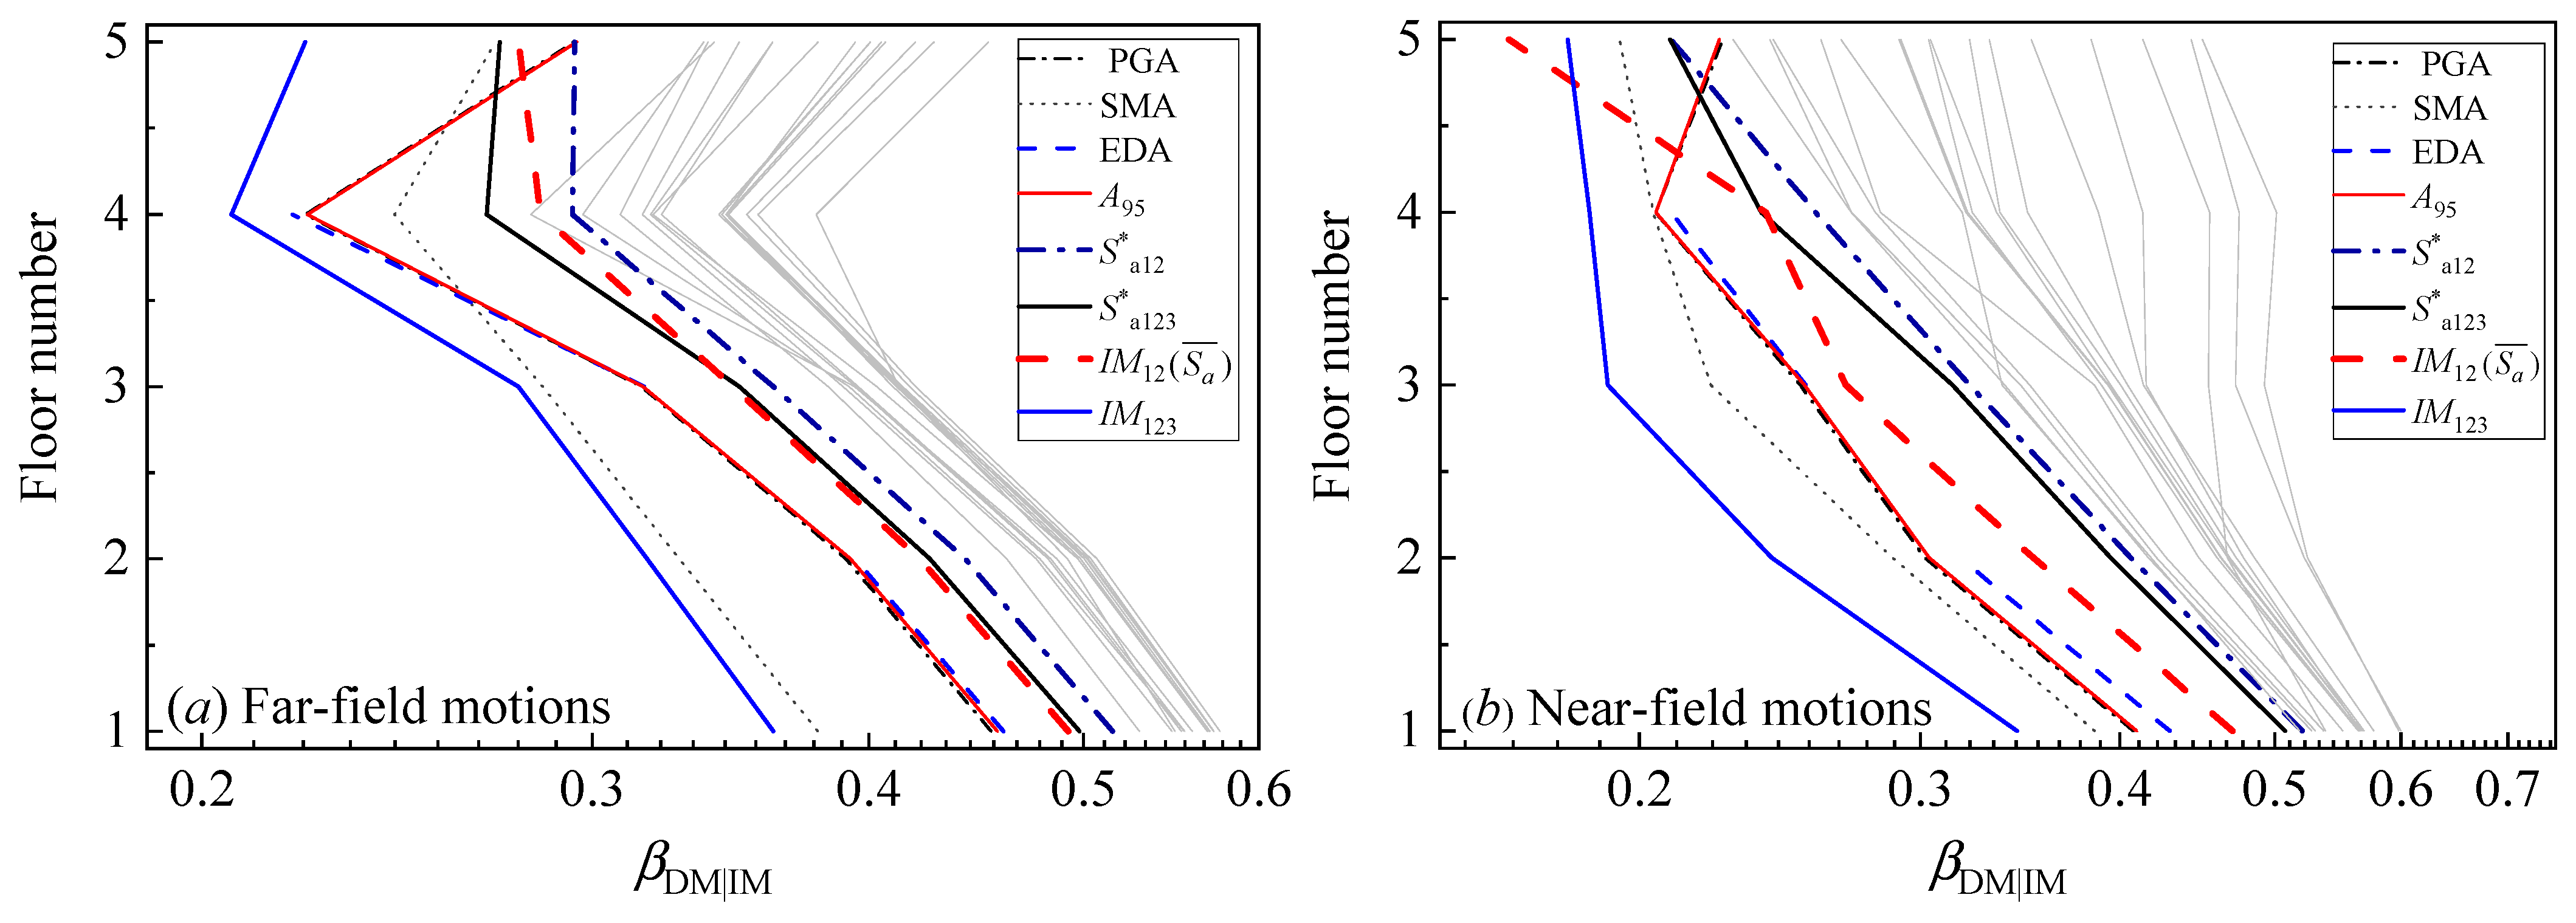
  • The structural response of three bamboo frame structures under both near-field and far-field ground motions is primarily dominated by the first mode of vibration. The type of ground motion significantly influences the selection of seismic intensity measures for PFA and PIDR. Specific seismic intensity measures may become more prominent depending on the type of ground motion, and the building height also affects the performance of these seismic intensity measures. From an efficiency perspective, acceleration-related measures are more suitable for evaluating PFA, while spectral acceleration-related measures are better suited for assessing PIDR. Regarding sufficiency, the trends are not particularly distinct.
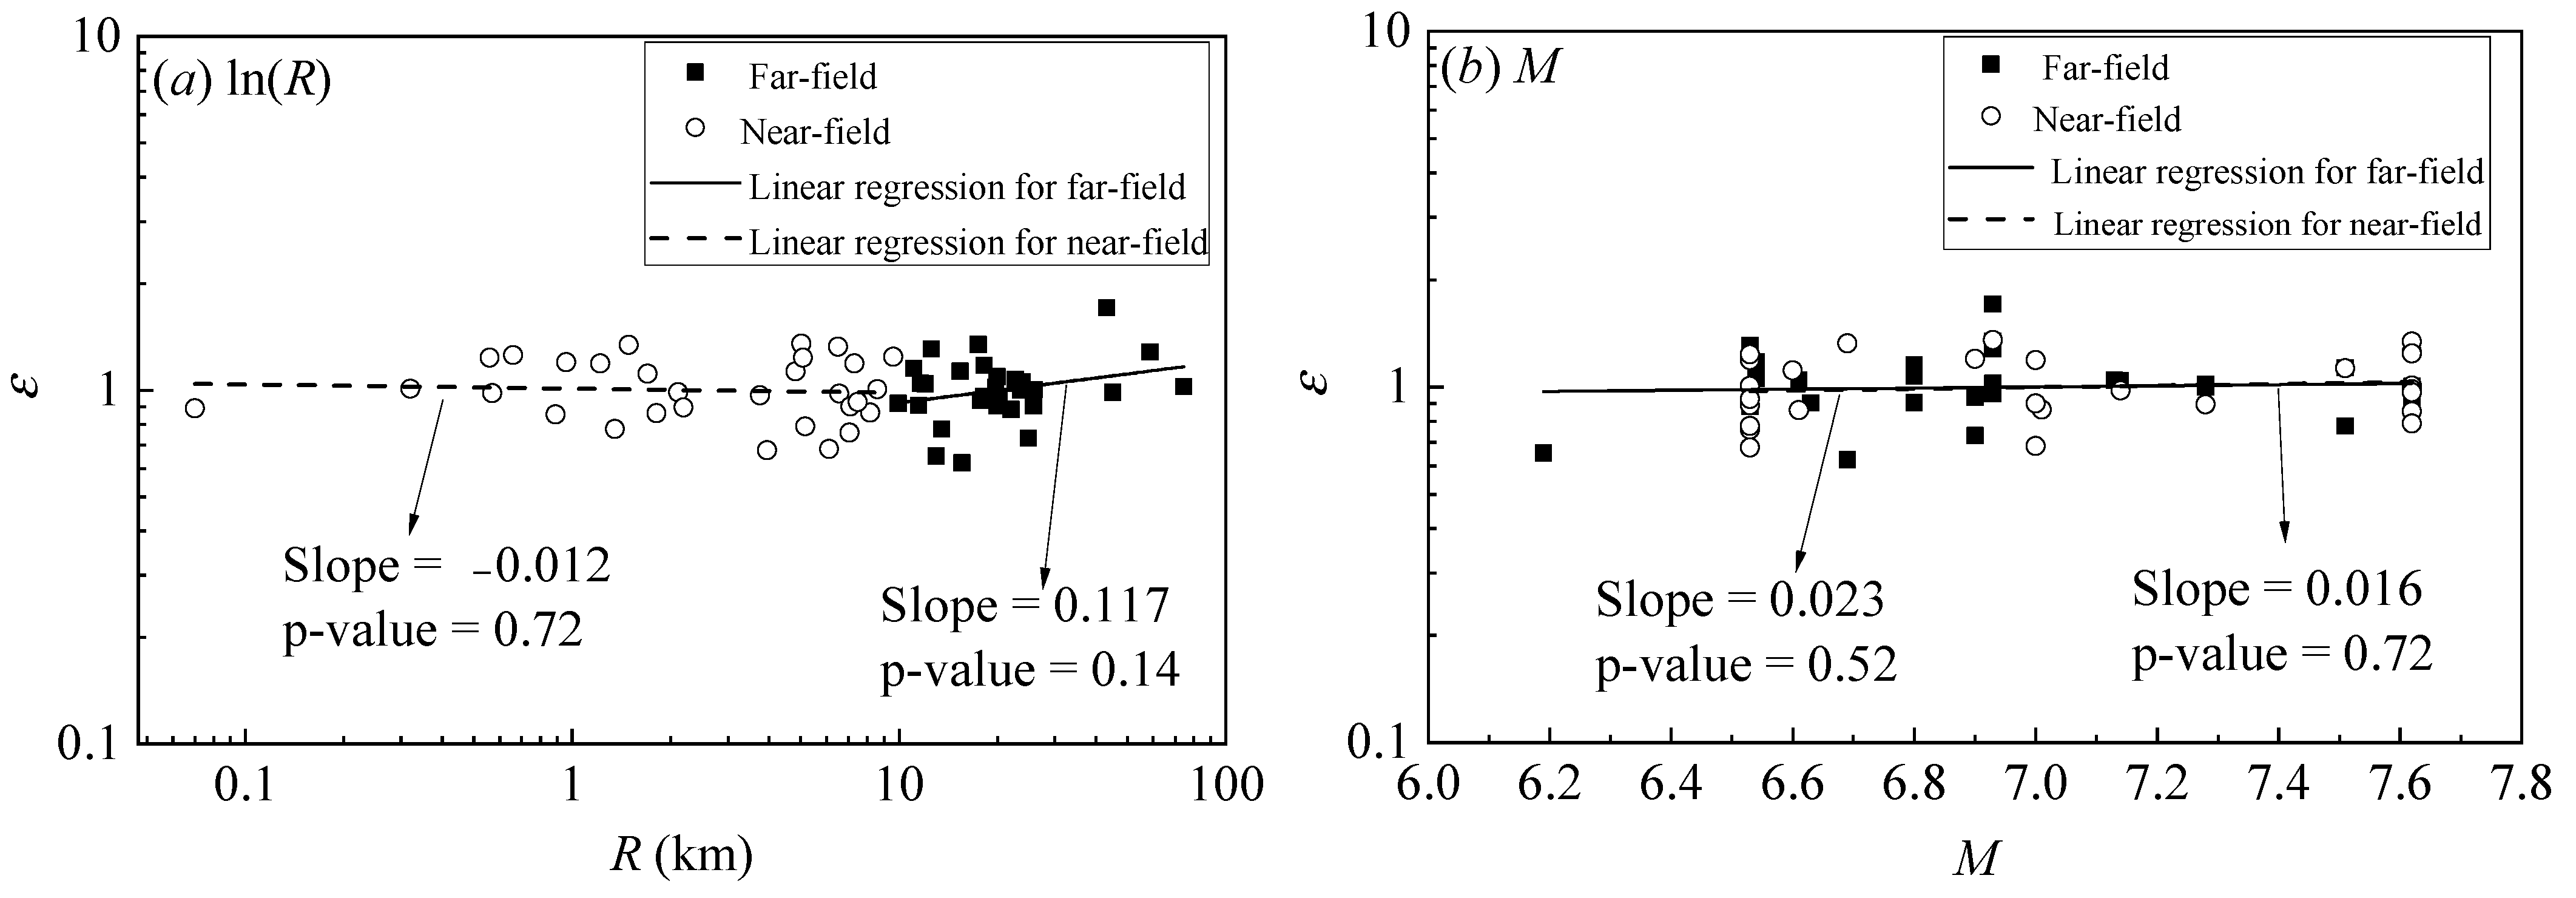
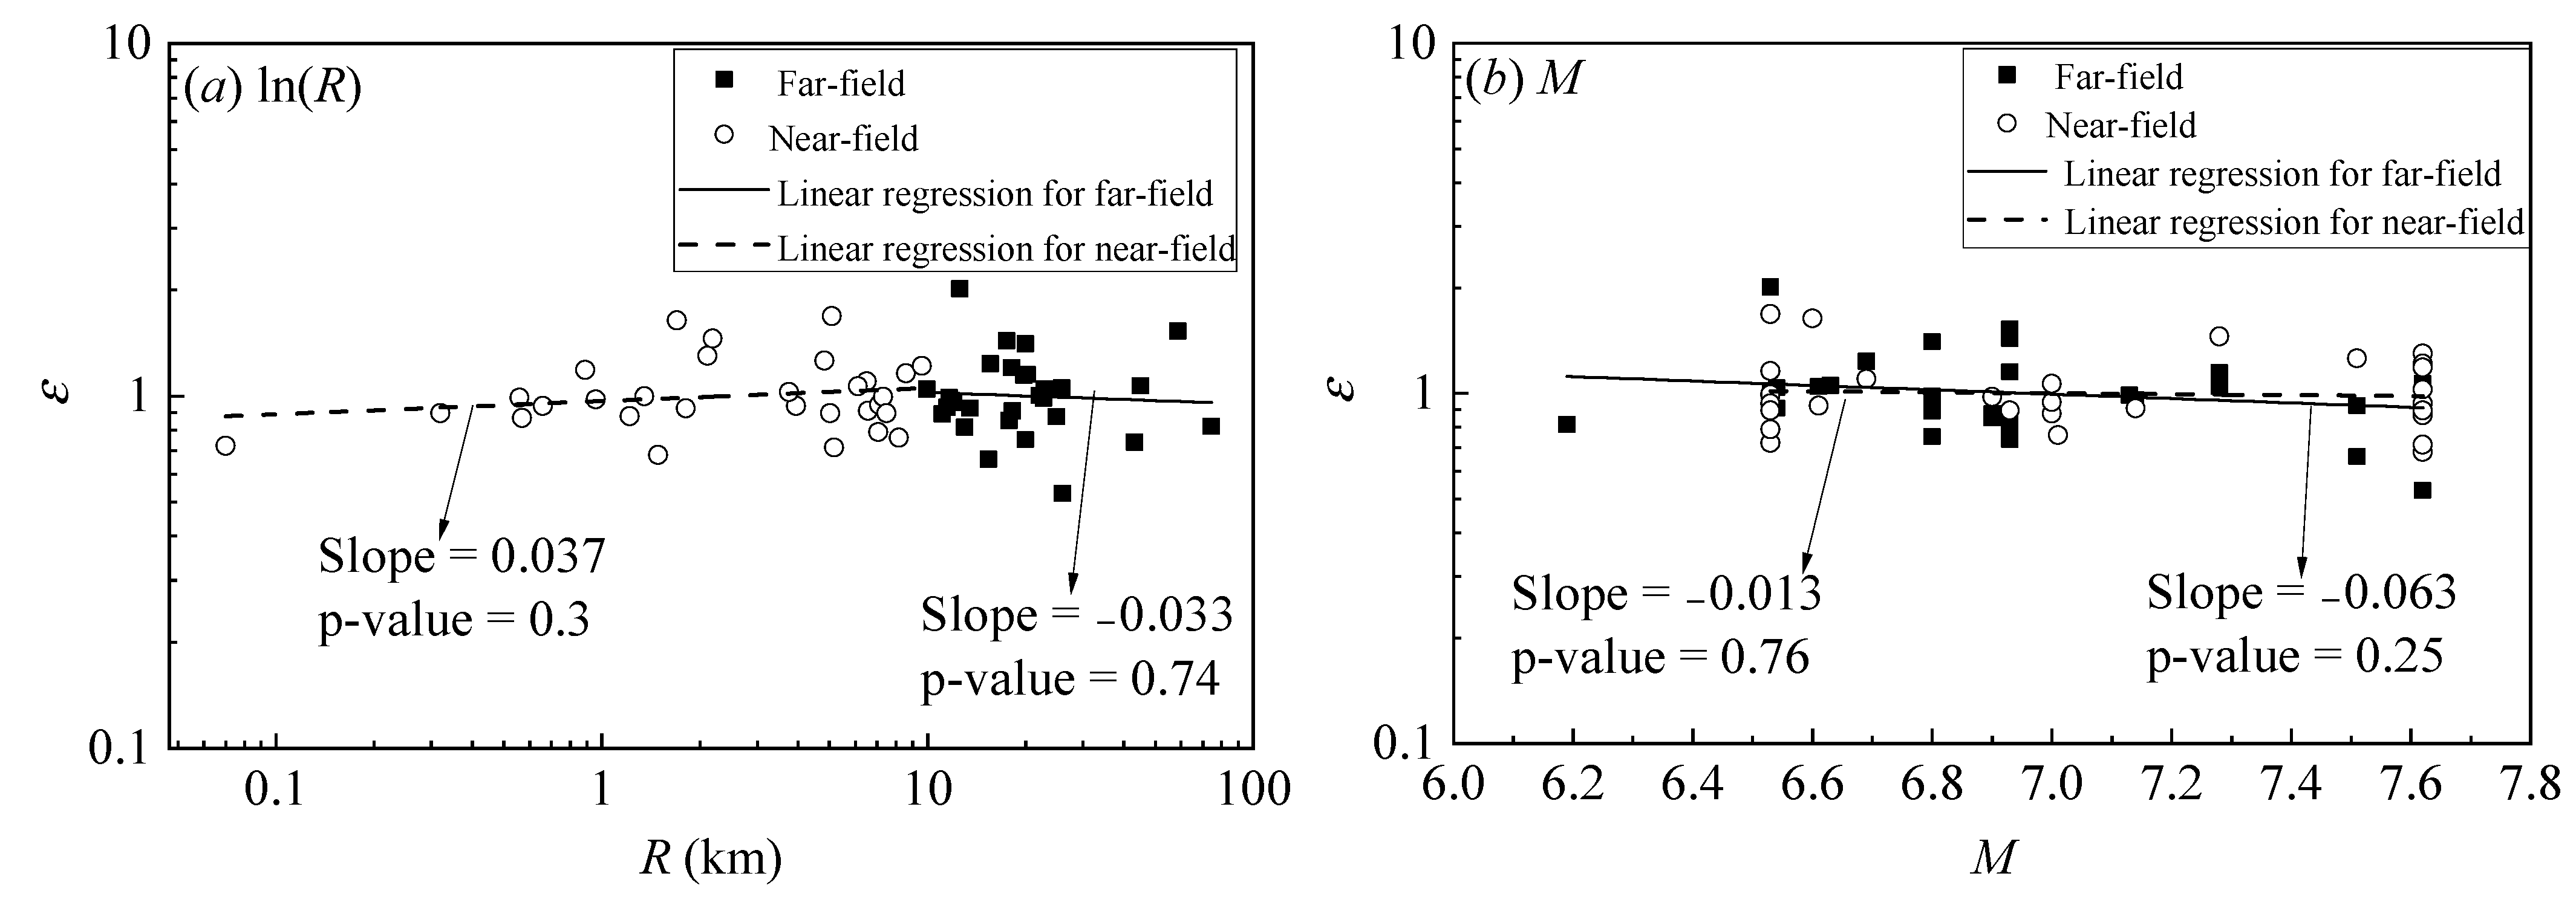
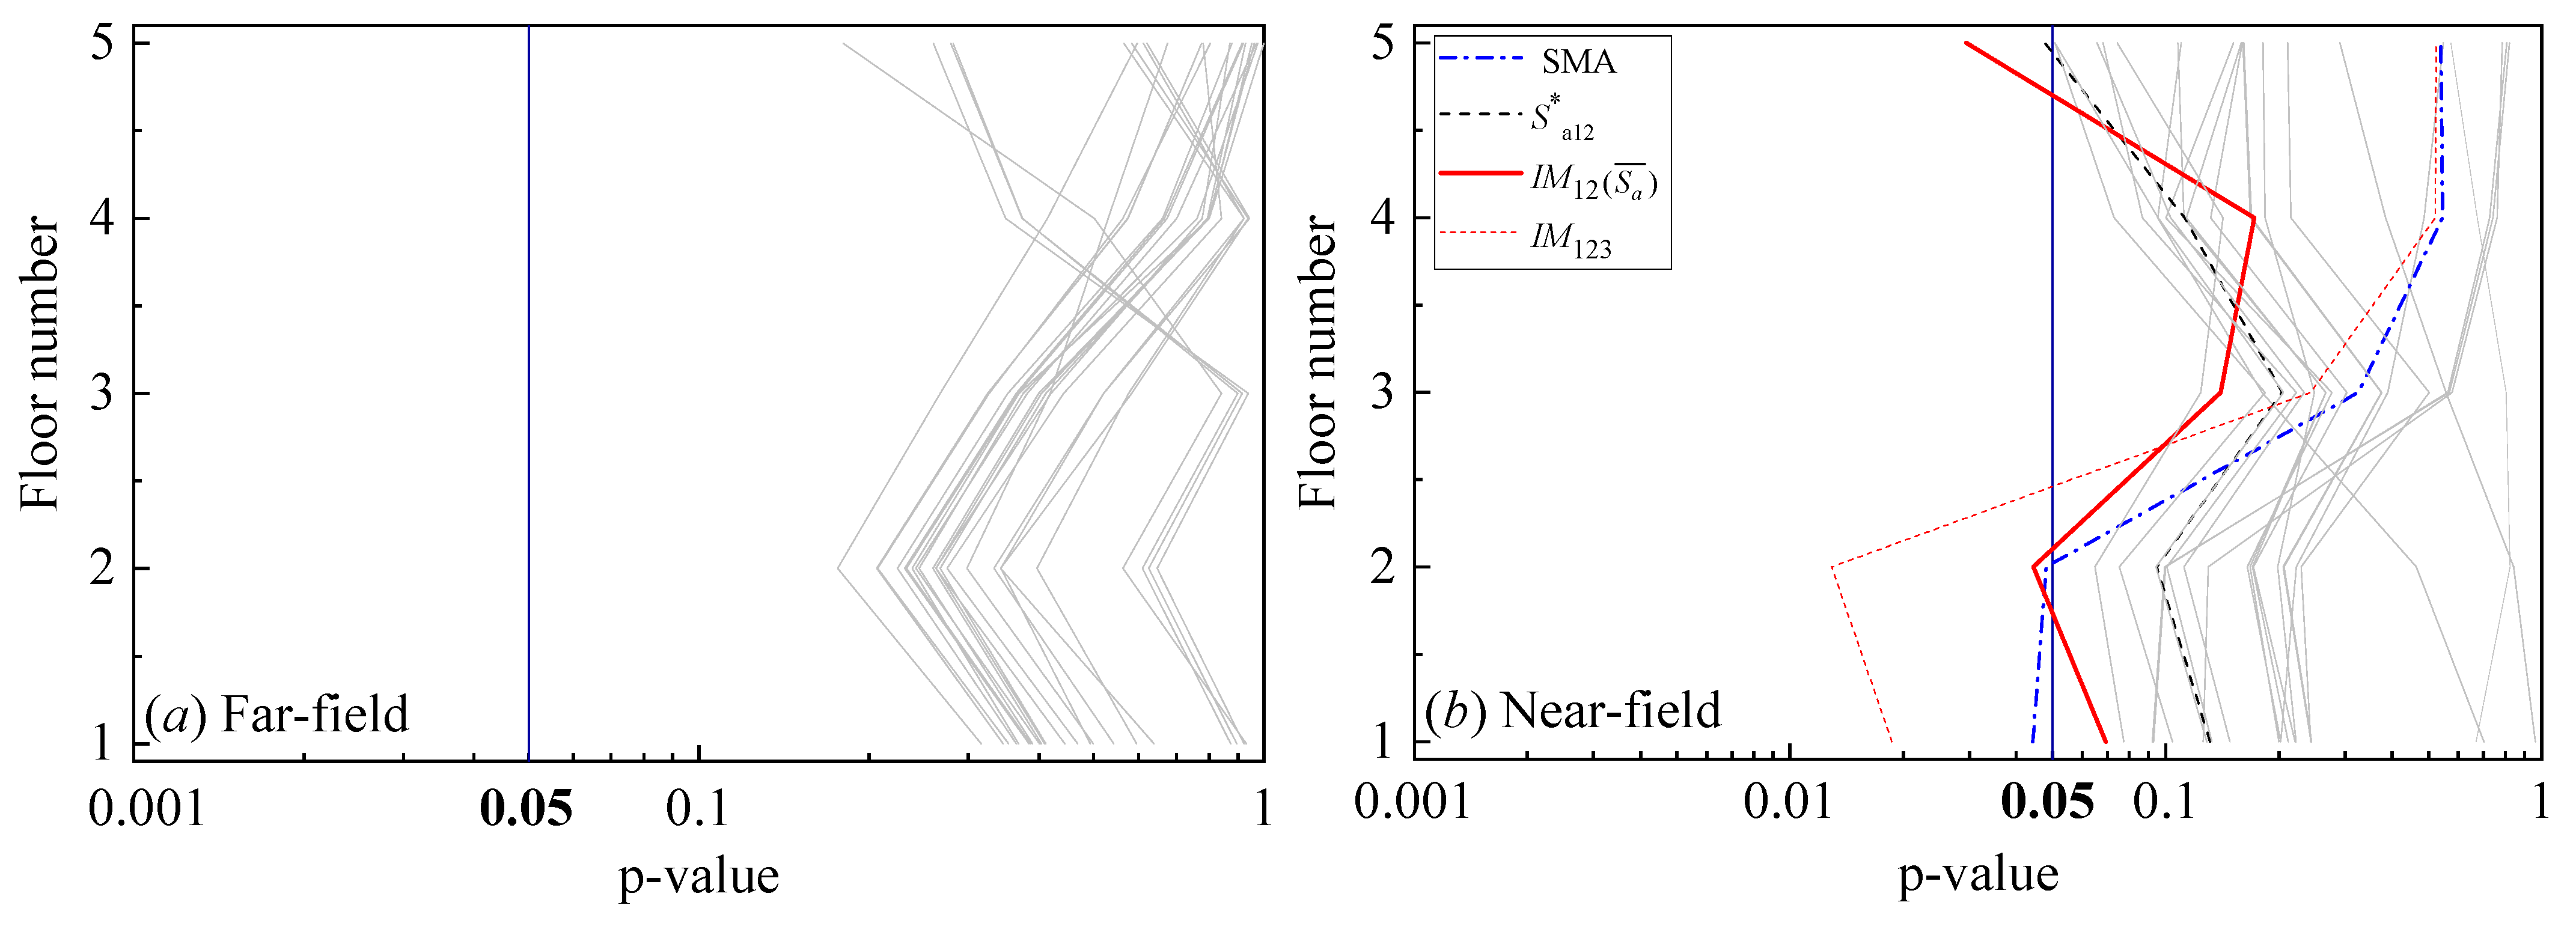
  • In the case of PFA, efficiency evaluations highlighted substantial variations in the effectiveness of different intensity measures across different structural heights. Under the action of far-field ground motion and near-field pulse-type ground motion, IM123, SMA, PGA, A95 and EDA all maintain stable efficiency for PFA. From the sufficiency standpoint, for the epicentral distance R, all intensity measures maintain sufficiency throughout the height of the structure under far-field earthquake conditions, while under near-field seismic excitations, SMA, IM123, and IM12( S ¯ a ), measures exhibit insufficiency in the mid-to-low floors of the structure. Additionally, IM12( S ¯ a ) demonstrates insufficiency with respect to epicentral distance R in the upper floors of the structure.
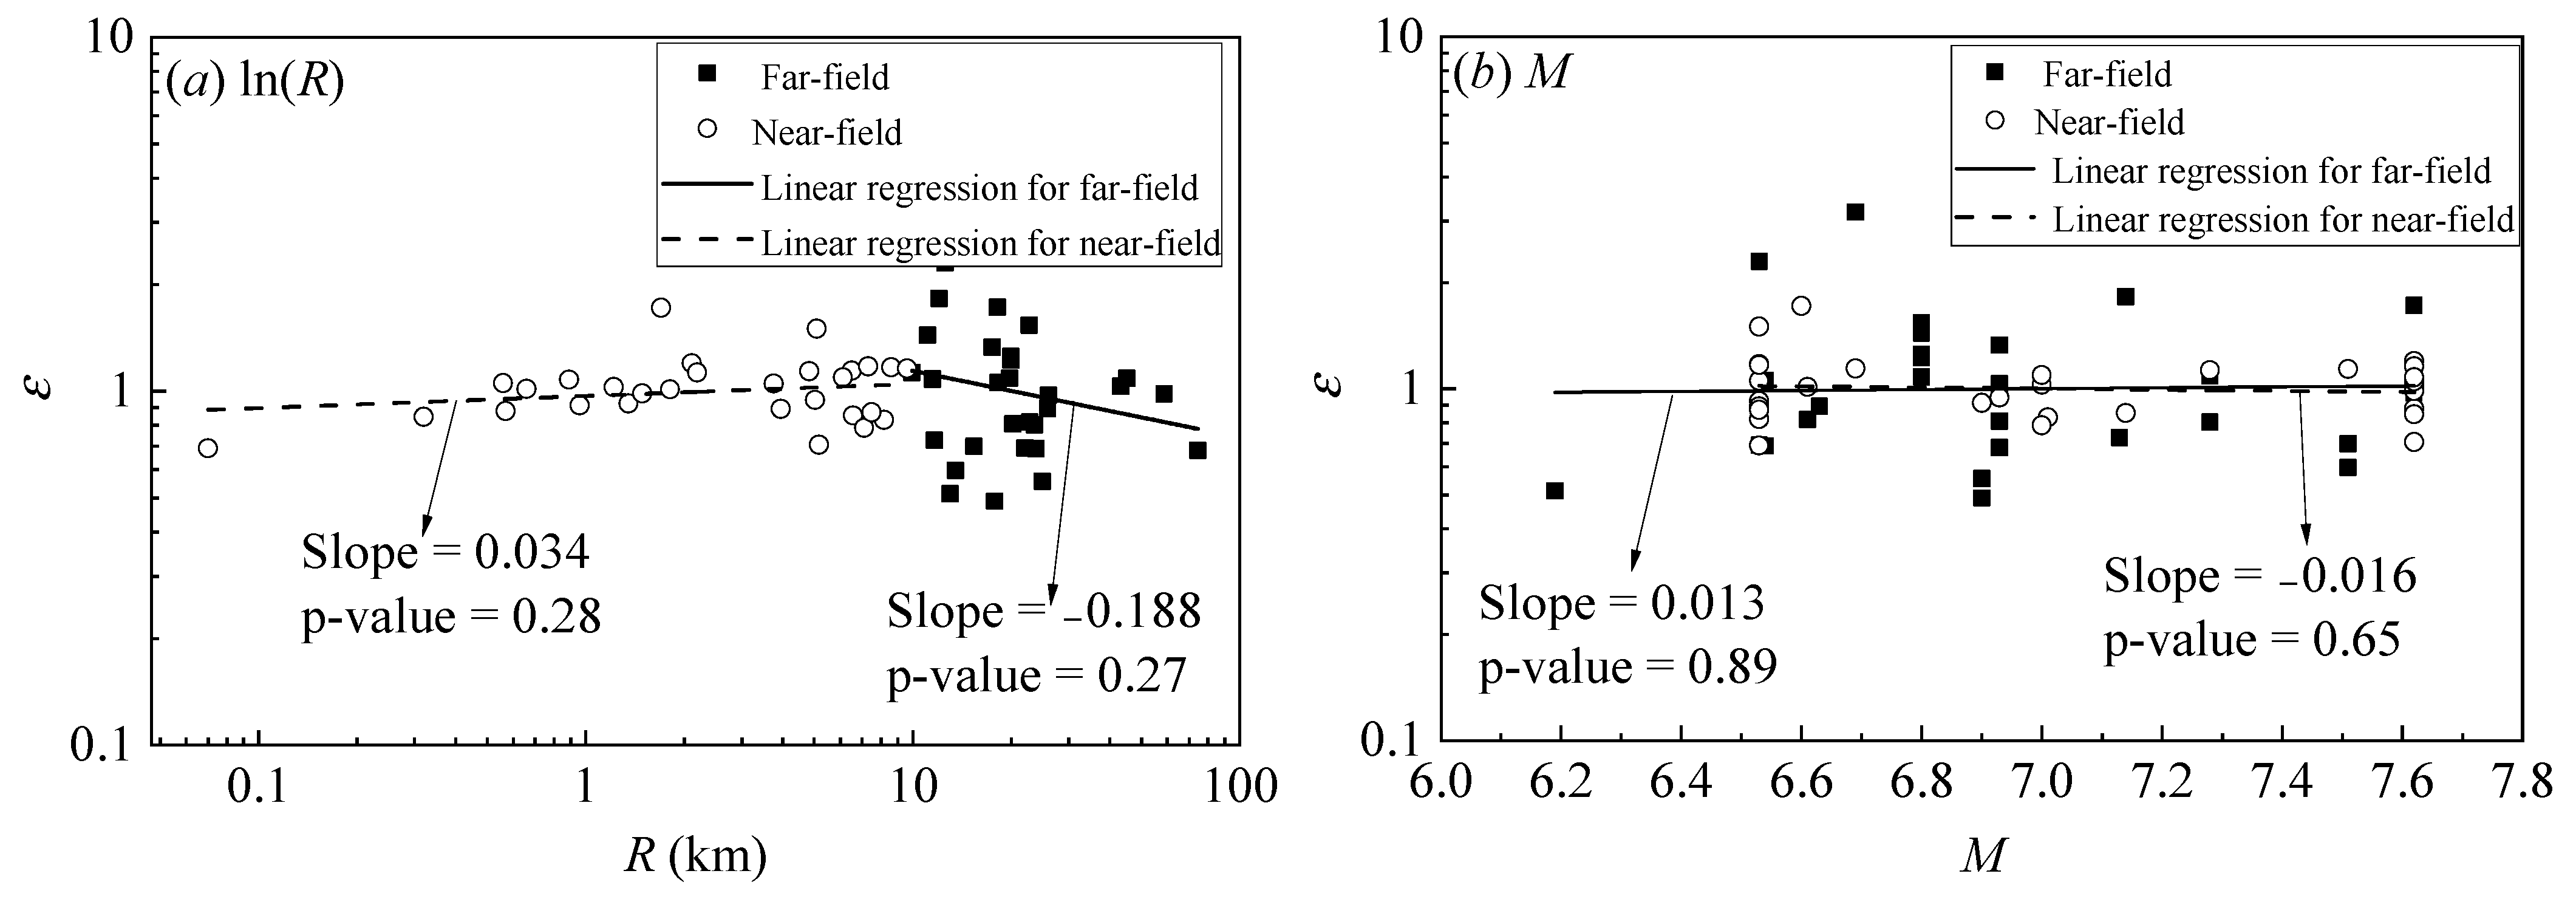
  • The seismic intensity measures applicable to PIDR differ from those for PFA. In terms of efficiency, several measures, including Sa(T1), S12 and S123, demonstrate effectiveness for PIDR under both far-field and near-field pulse-type ground motions. Regarding sufficiency, the adequacy of many seismic intensity measures is closely related to the height of the structure. For epicentral distance R, under far-field ground motions, only Sv(T1) shows insufficiency, while many measures exhibit insufficiency for R under near-field ground motions. For magnitude M, under far-field seismic motion, PGV and PGD display a dependency on M, while under near-field seismic motion, PGV, IM-CR, INP, and S* all show insufficiency for M.
In the course of this study, the number of selected ground motions was limited, and they were not well-matched with the standard spectra, nor were the effects of different site conditions considered. Additionally, the impact of ground motion scaling was not taken into account, nor was the influence of specific structural damage states on the selection of seismic intensity measures considered.

Author Contributions

Conceptualization, Y.Z.; Methodology, Y.G. and J.Z. (Jinglong Zhang); Software, J.Z. (Jingpu Zhang) and Y.G.; Validation, K.Z.; Formal analysis, J.Z. (Jingpu Zhang) and K.Z.; Investigation, Y.G. and J.Z. (Jinglong Zhang); Data curation, J.Z. (Jingpu Zhang) and J.Z. (Jinglong Zhang); Writing—original draft, Y.Z. and K.Z.; Writing—review and editing, Y.Z.; Visualization, Y.G.; Supervision, Y.Z. and K.Z.; Project administration, K.Z.; Funding acquisition, Y.Z. All authors have read and agreed to the published version of the manuscript.

Funding

This research was financially supported by the National Natural Science Foundation of China (52108457; 52108150), Qingdao Science Foundation (23-2-1-102-zyyd-jch), Natural Science Foundation of Shandong Province (ZR2024QE393), the China Postdoctoral Science Foundation (2023M741731), Natural Science Foundation of Jiangsu Province (BK20230400) and Jiangsu Undergraduate Innovation Training Program (202310298022Z).

Data Availability Statement

Data and material for producing the presented results will be made available upon request.

Conflicts of Interest

The authors declare no conflicts of interest.

References

  1. China Association of Building Energy Efficiency. 2022 Research Report of China Building Energy Consumption and Carbon Emissions; China Association of Building Energy Efficiency: Beijing, China, 2022. (In Chinese) [Google Scholar]
  2. Xiao, Y.; Wu, R.J.; Chen, J.X. Research and application progress of multi-story tall engineered bamboo structures. Build. Struct. 2024, 54, 156–161. (In Chinese) [Google Scholar] [CrossRef]
  3. Huang, D.; Zhu, J.; Shen, Y. Design of a 3-storey frame building using engineered bamboo composite (EBC). Eng. Struct. 2024, 300, 117230. [Google Scholar] [CrossRef]
  4. Senel, S.M.; Kayhan, A.H.; Palanci, M.; Demir, A. Assessment of Damages in Precast Industrial Buildings in the Aftermath of Pazarcık and Elbistan Earthquakes. J. Earthq. Eng. 2024, 1–30. [Google Scholar] [CrossRef]
  5. Devin, A.; Fanning, P. Non-structural elements and the dynamic response of buildings: A review. Eng. Struct. 2019, 187, 242–250. [Google Scholar] [CrossRef]
  6. Ozmen, H.B.; Inel, M.; Cayci, B.T. Engineering implications of the RC building damages after 2011 Van earthquakes. Earthq. Struct. 2013, 5, 297–319. [Google Scholar] [CrossRef]
  7. GB50005-2017; Standard for Design of Timber Structures. China Architecture & Building Press: Beijing, China, 2017. (In Chinese)
  8. Taghavi, S.; Miranda, M.M. Response Assessment of Nonstructural Building Elements; Pacific Earthquake Engineering Research Center: Berkeley, CA, USA, 2003. [Google Scholar]
  9. Zhang, Y.; He, Z. Appropriate ground motion intensity measures for estimating the earthquake demand of floor acceleration-sensitive elements in super high-rise buildings. Struct. Infrastruct. Eng. 2019, 15, 467–483. [Google Scholar] [CrossRef]
  10. Reinoso, E.; Miranda, E. Estimation of floor acceleration demands in high-rise buildings during earthquakes. Struct. Des. Tall Spec. Build. 2005, 14, 107–130. [Google Scholar] [CrossRef]
  11. FEMA. Seismic Performance Assessment of Buildings: Volume 2—Implementation Guide (FEMA P-58-2); Applied Technology Council: Washington, DC, USA, 2012. [Google Scholar]
  12. Riddell, R. On ground motion intensity indices. Earthq. Spectra 2007, 23, 147–173. [Google Scholar] [CrossRef]
  13. Ye, L.; Ma, Q.; Miao, Z.; Guan, H.; Zhuge, Y. Numerical and comparative study of earthquake intensity indices in seismic analysis. Struct. Des. Tall Spec. Build. 2013, 22, 362–381. [Google Scholar] [CrossRef]
  14. Ebrahimian, H.; Jalayer, F.; Lucchini, A.; Mollaioli, F.; Manfredi, G. Preliminary ranking of alternative scalar and vector intensity measures of ground shaking. Bull. Earthq. Eng. 2015, 13, 2805–2840. [Google Scholar] [CrossRef]
  15. Zhang, Y.; Ouyang, X.; Sun, B.; Shi, Y.; Wang, Z. A comparative study on seismic fragility analysis of RC frame structures with consideration of modeling uncertainty under far-field and near-field ground motion excitation. Bull. Earthq. Eng. 2022, 20, 1455–1487. [Google Scholar] [CrossRef]
  16. Lu, X.; Ye, L.; Lu, X.; Li, M.; Ma, X. An improved ground motion intensity measure for super high-rise buildings. Sci. China Technol. Sci. 2013, 56, 1525–1533. [Google Scholar] [CrossRef]
  17. Muho, E.V.; Kalapodis, N.A.; Beskos, D.E. Multi-modal and multi-level structure-specific spectral intensity measures for seismic evaluation of reinforced concrete frames. Bull. Earthq. Eng. 2024, 22, 6955–6989. [Google Scholar] [CrossRef]
  18. Güneş, N. A vector-valued ground motion intensity measure for base-isolated buildings in far-field regions. Struct. Des. Tall Spec. Build. 2024, 33, e1940. [Google Scholar] [CrossRef]
  19. Sengar, K.K.; Saha, S.K.; Gade, M. Evaluation of appropriate intensity measures for seismic performance assessment of base-isolated liquid storage tanks. J. Loss Prev. Process Ind. 2025, 94, 105581. [Google Scholar] [CrossRef]
  20. Liu, J.; Meng, X.; Tian, L.; Yang, M.; Jin, Q.; Shao, G. Multi-metric evaluation of the optimal intensity measure for mainshock-aftershock fragility analysis of transmission towers. Eng. Struct. 2024, 308, 118020. [Google Scholar] [CrossRef]
  21. Shen, Y.; El Naggar, M.H.; Zhang, D.; Huang, Z.; Du, X. Optimal intensity measure for seismic performance assessment of shield tunnels in liquefiable and non-liquefiable soils. Undergr. Space 2025, 21, 149–163. [Google Scholar] [CrossRef]
  22. Wen, T.; Jiang, L.; Jiang, L.; Zhou, W.; Du, Y. Optimal intensity measure selection in incremental dynamic analysis: Methodology improvements and application to a high-speed railway bridge. Bull. Earthq. Eng. 2024, 22, 2059–2083. [Google Scholar] [CrossRef]
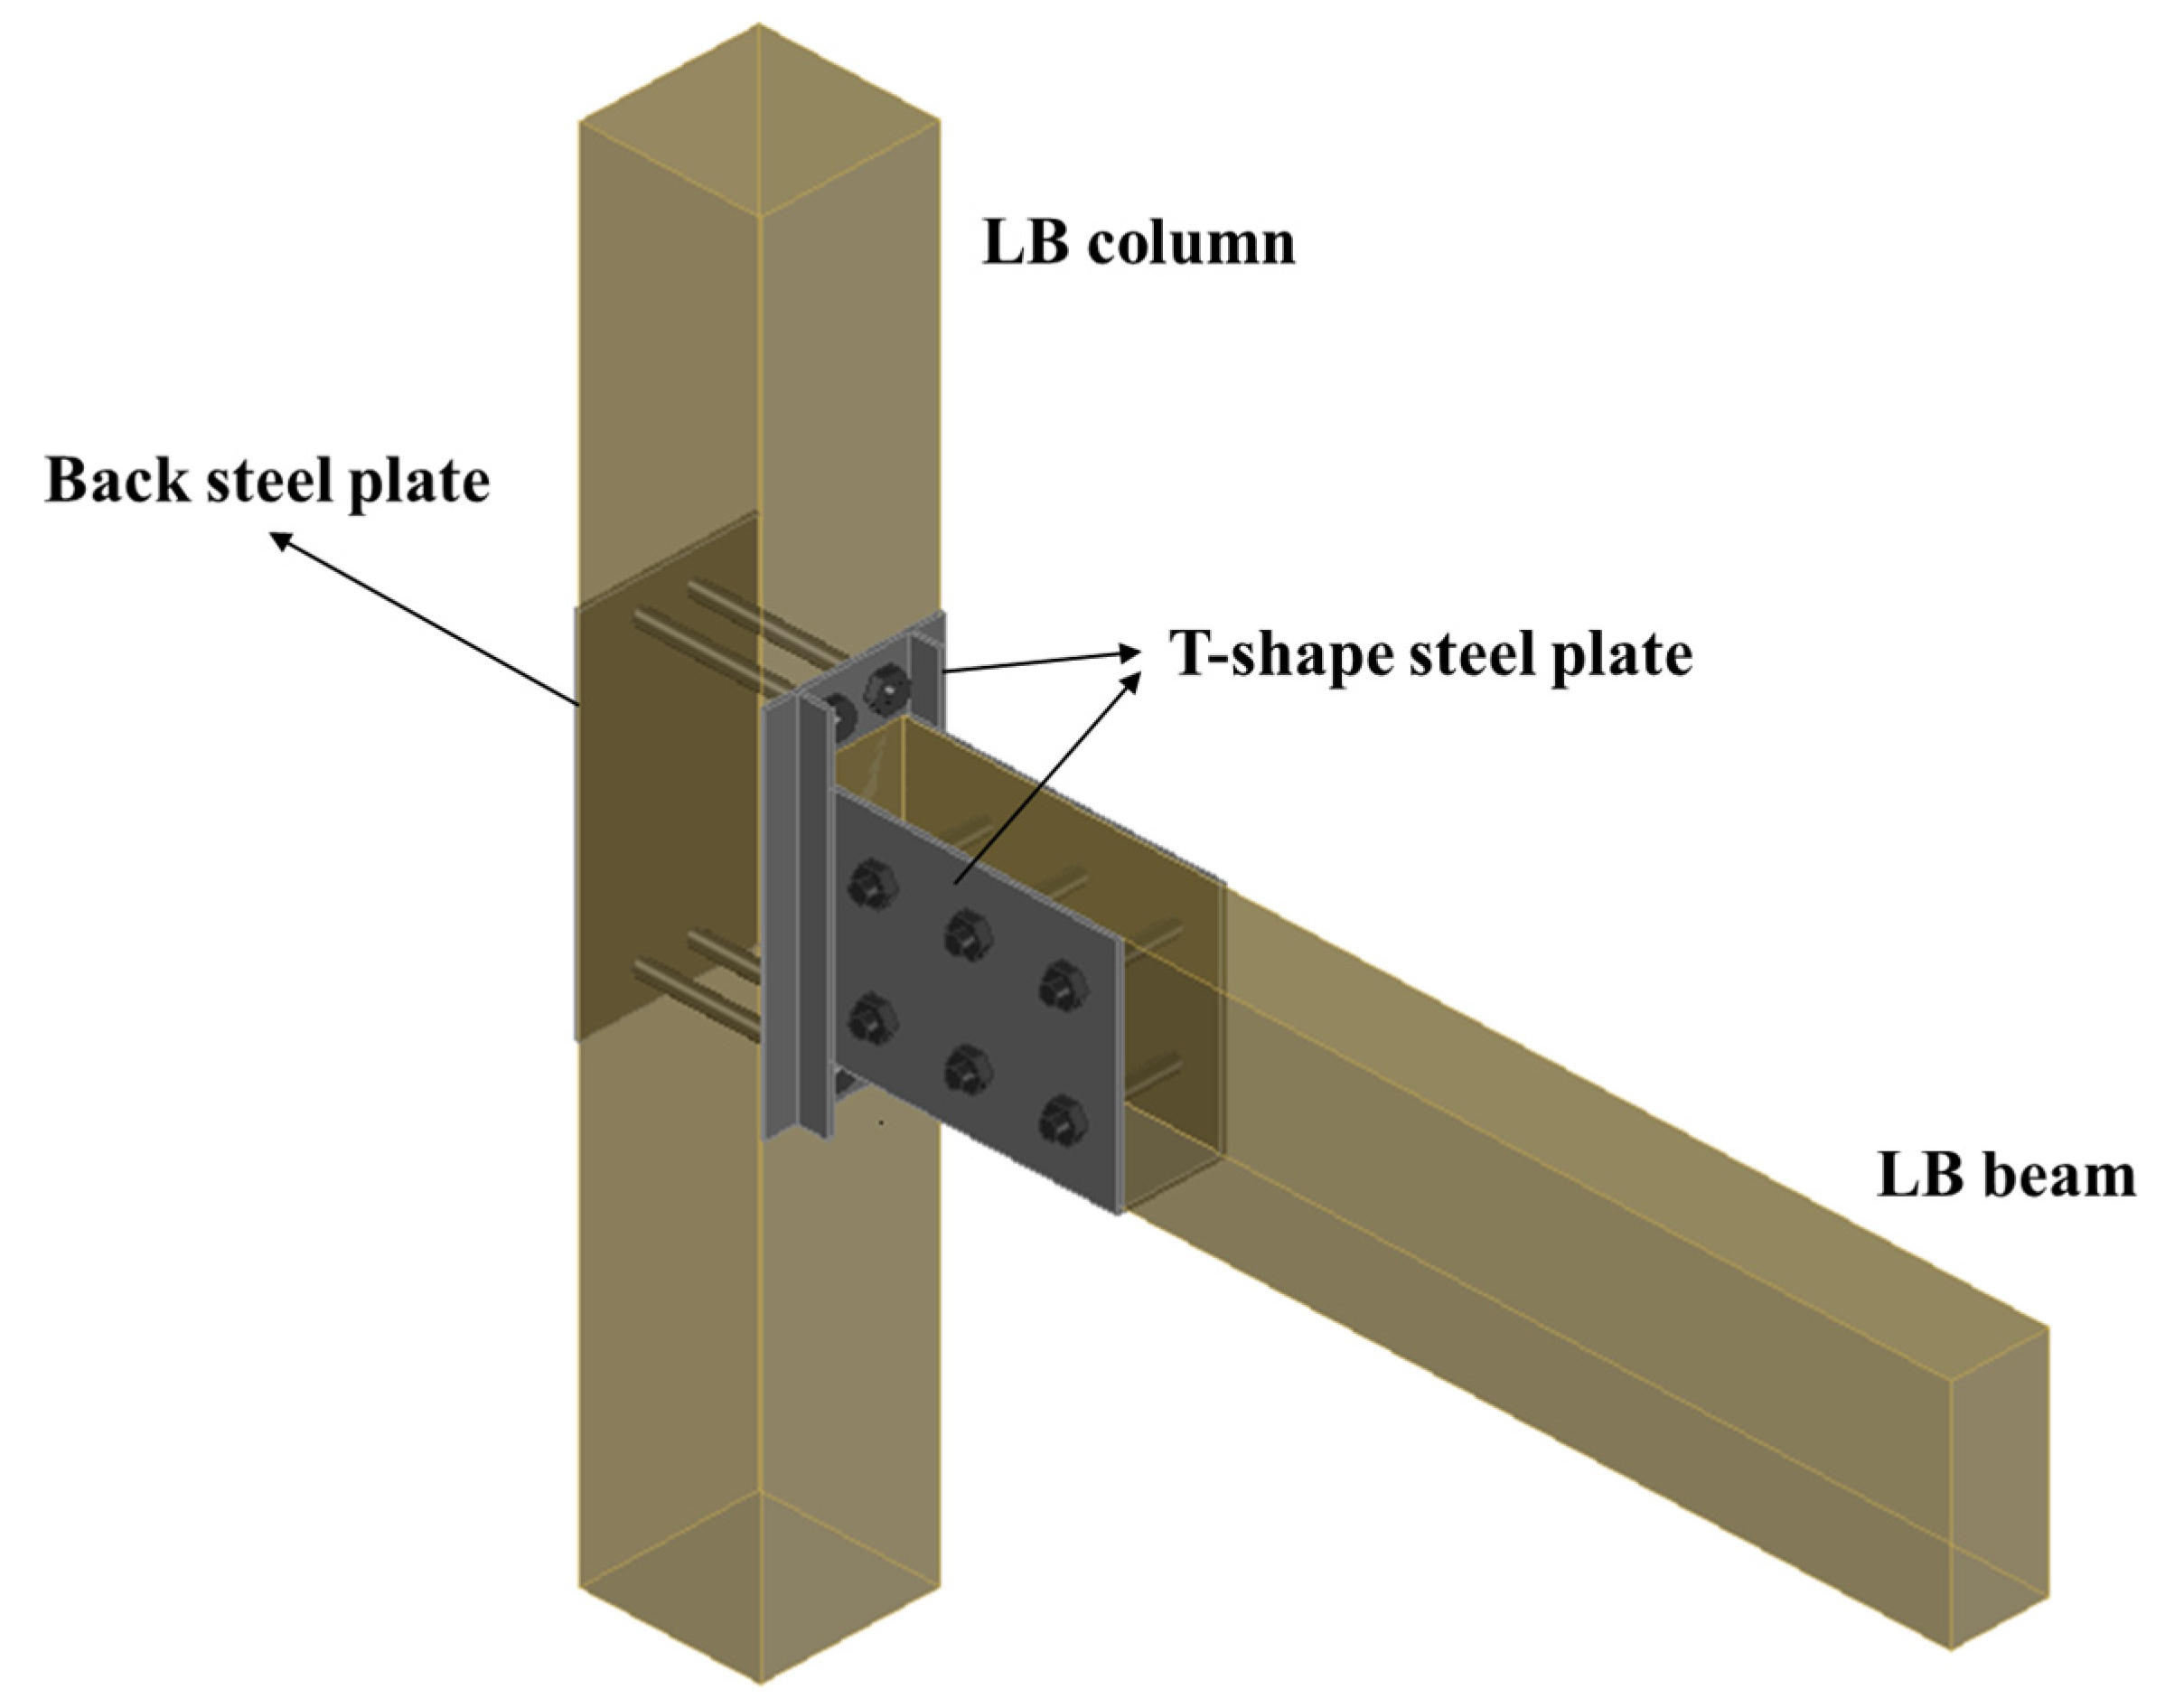
  23. Leng, Y.; Xu, Q.; Harries, K.A.; Chen, L.; Liu, K.; Chen, X. Experimental study on mechanical properties of laminated bamboo beam-to-column connections. Eng. Struct. 2020, 210, 110305. [Google Scholar] [CrossRef]
  24. T/CECS 1101-2022; Standard for Design of Engineered Bamboo Structures. China Planning Press: Beijing, China, 2022. (In Chinese)
  25. GB50068-2018; Unified Standard for Reliability Design of Building Structures. China Architecture & Building Press: Beijing, China, 2019. (In Chinese)
  26. GB 55002-2021; General Code for Seismic Precaution of Buildings and Municipal Engineering. China Architecture & Building Press: Beijing, China, 2021. (In Chinese)
  27. GB/T 51226-2017; Technical Standard for Multi-Story and High Rise Timber Buildings. China Architecture & Building Press: Beijing, China, 2017. (In Chinese)
  28. EN 1995-1-1:2003; Eurocode 5: Design of Timber Structures–Part 1-1: General Rules and Rules for Buildings. CEN: Brussels, Belgium, 2003.
  29. GB/T 50708-2012; Technical Code of Glued Laminated Timber Structures. China Architecture & Building Press: Beijing, China, 2012. (In Chinese)
  30. GB 50017-2017; Standard for Design of Steel Structures. China Architecture & Building Press: Beijing, China, 2017. (In Chinese)
  31. Zhang, Y.; Zhang, J.; Zhang, J.; Zheng, K.; Wei, Y. Comparative analysis of seismic response and vulnerability of laminated bamboo frame structure under near-field and far-field earthquake actions. Structures 2024, 69, 107321. [Google Scholar] [CrossRef]
  32. Mazzoni, S.; McKenna, F.; Scott, M.H.; Fenves, G.L. Open System for Earthquake Engineering Simulation (OpenSees) Command Language Manual; Pacific Earthquake Engineering Research Center: Berkeley, CA, USA, 2011; Available online: http://opensees.berkeley.edu/wiki/index.php/Command_Manual (accessed on 1 January 2024).
  33. Rinaldin, G.; Amadio, C.; Fragiacomo, M. A Component Approach for the Hysteretic Behaviour of Connections in Cross-laminated Wooden Structures. Earthq. Eng. Struct. Dyn. 2013, 42, 2023–2042. [Google Scholar] [CrossRef]
  34. Aloisio, A.; Alaggio, R.; Köhler, J.; Fragiacomo, M. Extension of Generalized Bouc-Wen Hysteresis Modeling of Wood Joints and Structural Systems. J. Eng. Mech. 2020, 146, 04020001. [Google Scholar] [CrossRef]
  35. Cao, J.; Xiong, H.; Cui, Y. Seismic Performance Analysis of Timber Frames Based on a Calibrated Simplified Model. J. Build. Eng. 2022, 46, 103701. [Google Scholar] [CrossRef]
  36. Baker, J.W. Quantitative classification of near-fault ground motions using wavelet analysis. Bull. Seismol. Soc. Am. 2007, 97, 1486–1501. [Google Scholar] [CrossRef]
  37. FEMA. Quantification of Building Seismic Performance Factors (FEMA P-695); Applied Technology Council: Washington, DC, USA, 2009. [Google Scholar]
  38. Ancheta, T.D.; Darragh, R.B.; Stewart, J.P.; Seyhan, E.; Silva, W.J.; Chiou, B.S.J.; Wooddell, K.E.; Graves, R.W.; Kottke, A.R.; Boore, D.M.; et al. NGA-West2 database. Earthq. Spectra 2014, 30, 989–1005. [Google Scholar] [CrossRef]
  39. Zhang, Y.; He, Z.; Yang, Y. A spectral-velocity-based combination-type earthquake intensity measure for super high-rise buildings. Bull. Earthq. Eng. 2018, 16, 643–677. [Google Scholar] [CrossRef]
  40. Sarma, S.; Yang, K. An evaluation of strong motion records and a new parameter A95. Earthq. Eng. Struct. Dyn. 1987, 15, 119–132. [Google Scholar] [CrossRef]
  41. Sucuoǧlu, H.; Nurtuǧ, A. Earthquake ground motion characteristics and seismic energy dissipation. Earthq. Eng. Struct. Dyn. 1995, 24, 1195–1213. [Google Scholar] [CrossRef]
  42. Nuttli, O.W. The Relation of Sustained Maximum Ground Acceleration and Velocity to Earthquake Intensity and Magnitude; Miscellaneous Paper S-71-1, Report 16; U.S. Army Corps of Engineers, Waterways Experiment Station: Vicksburg, MS, USA, 1979. [Google Scholar]
  43. Benjamin, J.R. A Criterion for Determining Exceedances of the Operating Basis Earthquake; EPRI Report NP-5930; Electric Power Research Institute: Palo Alto, CA, USA, 1988. [Google Scholar]
  44. Cordova, P.P.; Deierlein, G.G.; Mehanny, S.S.; Cornell, C.A. Development of a Two-Parameter Seismic Intensity Measure and Probabilistic Assessment Procedure. In Proceedings of the Second US-Japan Workshop on Performance-Based Earthquake Engineering Methodology for Reinforced Concrete Building Structures, Sapporo, Japan, 11–13 September 2000; pp. 187–206. [Google Scholar]
  45. Mehanny, S.S. A broad-range power-law form scalar-based seismic intensity measure. Eng. Struct. 2009, 31, 1354–1368. [Google Scholar] [CrossRef]
  46. Bojórquez, E.; Iervolino, I. Spectral shape proxies and nonlinear structural response. Soil Dyn. Earthq. Eng. 2011, 31, 996–1008. [Google Scholar] [CrossRef]
  47. Shome, N.; Cornell, C.A. Probabilistic Seismic Demand Analysis of Non-Linear Structures; Report No. RMS-35; Stanford University: Stanford, CA, USA, 1999. [Google Scholar]
  48. Vamvatsikos, D.; Cornell, C.A. Developing efficient scalar and vector intensity measures for IDA capacity estimation by incorporating elastic spectral shape information. Earthq. Eng. Struct. Dyn. 2005, 34, 1573–1600. [Google Scholar] [CrossRef]
  49. Lin, L.; Naumoski, N.; Saatcioglu, M.; Foo, S. Improved intensity measures for probabilistic seismic demand analysis. Part 2: Application of the improved intensity measures. Can. J. Civ. Eng. 2011, 38, 89–99. [Google Scholar] [CrossRef]
  50. Zhou, Y.; Su, N.; Lu, X. Study on intensity measure of incremental dynamic analysis for high-rise structures. J. Build. Struct. 2013, 34, 53–60. (In Chinese) [Google Scholar]
  51. Kazantzi, A.K.; Vamvatsikos, D. Intensity measure selection for vulnerability studies of building classes. Earthq. Eng. Struct. Dyn. 2015, 44, 2677–2694. [Google Scholar] [CrossRef]
  52. Jalayer, F.; Beck, J.; Zareian, F. Analyzing the sufficiency of alternative scalar and vector intensity measures of ground shaking based on information theory. J. Eng. Mech. 2012, 138, 307–316. [Google Scholar] [CrossRef]
  53. Padgett, J.E.; Nielson, B.G.; Desroches, R. Selection of optimal intensity measures in probabilistic seismic demand models of highway bridge portfolios. Earthq. Eng. Struct. Dyn. 2008, 37, 711–725. [Google Scholar] [CrossRef]
  54. Tothong, P.; Luco, N. Probabilistic seismic demand analysis using advanced ground motion intensity measures. Earthq. Eng. Struct. Dyn. 2007, 36, 1837–1860. [Google Scholar] [CrossRef]
  55. Giovenale, P.; Cornell, C.A.; Esteva, L. Comparing the adequacy of alternative ground motion intensity measures for the estimation of structural responses. Earthq. Eng. Struct. Dyn. 2004, 33, 951–979. [Google Scholar] [CrossRef]
  56. Mackie, K.; Stojadinović, B. Probabilistic seismic demand model for California highway bridges. J. Bridge Eng. 2001, 6, 468–481. [Google Scholar] [CrossRef]
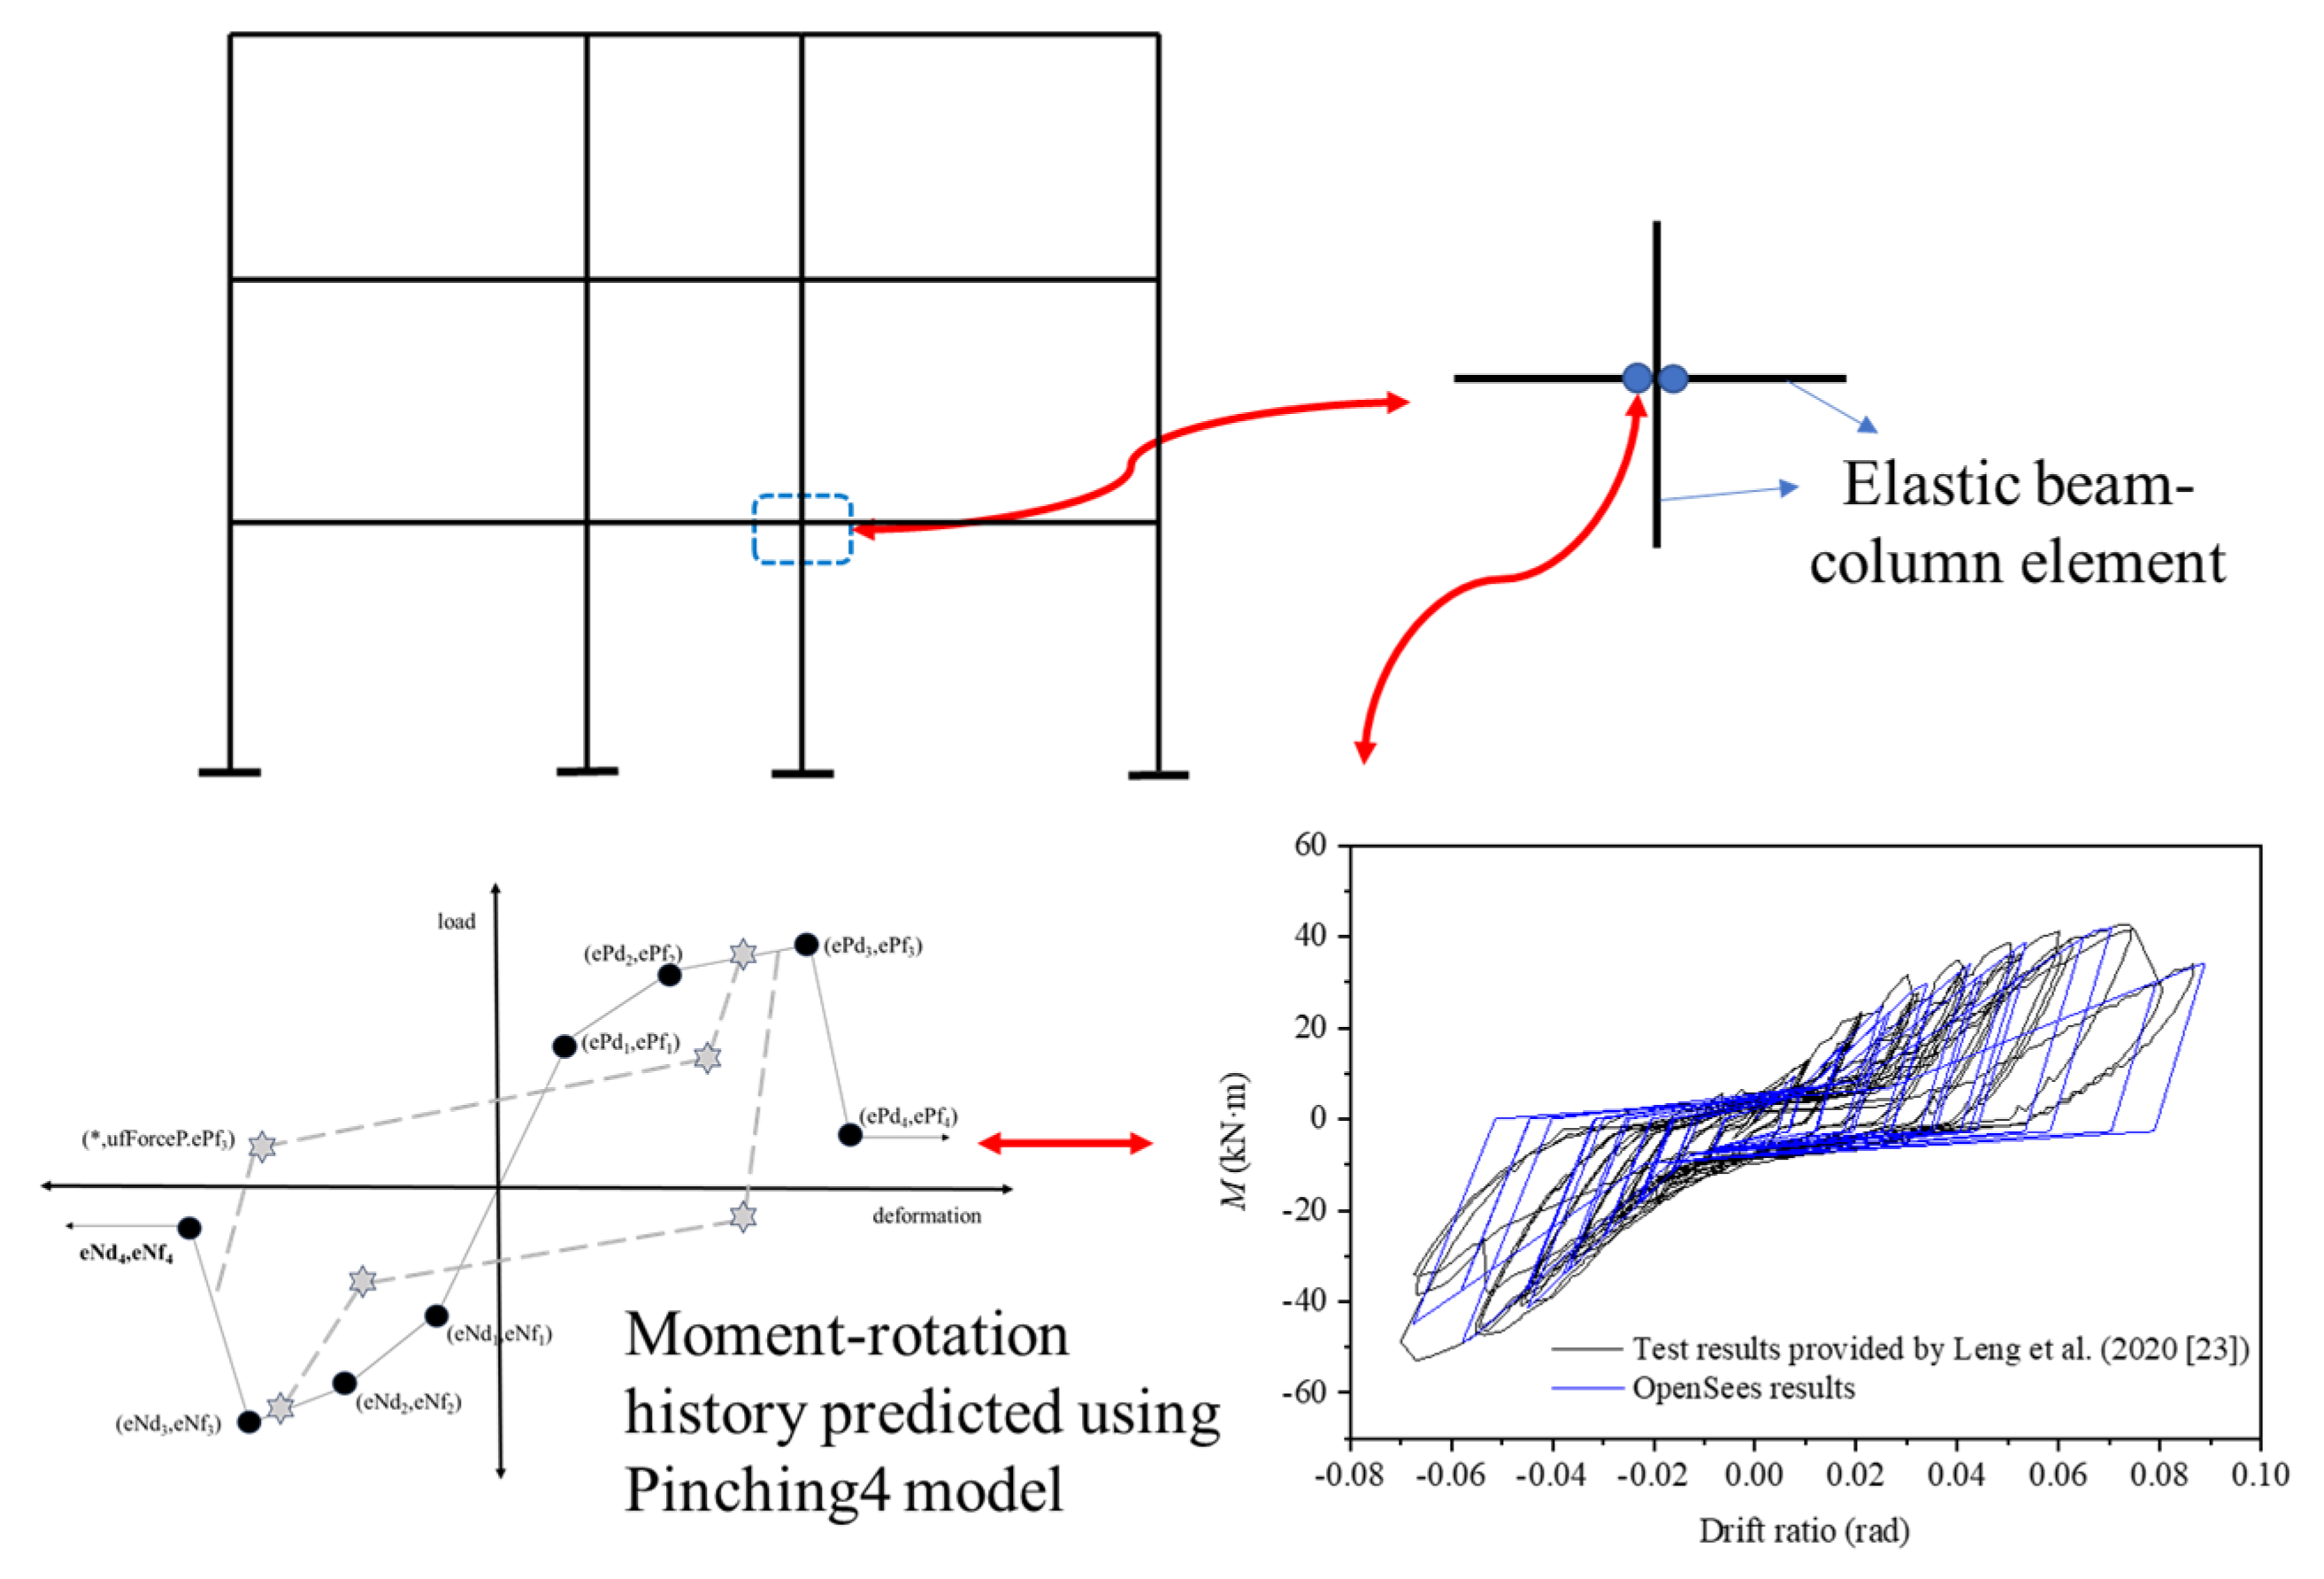
Figure 1. Structural configurations of three engineered bamboo frames for seismic performance assessment: (a) plan view; (b) elevation view of the 3-story frame; (c) elevation view of the 4-story frame; (d) elevation view of the 5-story frame.
Buildings 15 02039 g001
Figure 2. Beam–column joints with T-shaped steel plate bolted connections (Leng et al., 2020 [23]).
Buildings 15 02039 g002
Figure 3. Numerical simulation process for laminated bamboo frame structure in OpenSees (Leng et al., 2020 [23]; Zhang et al., 2024 [31]).
Buildings 15 02039 g003
Figure 4. PIDR distribution of these three bamboo frame structures under far-field earthquakes: (a) 3-story building; (b) 4-story building; (c) 5-story building.
Buildings 15 02039 g004
Figure 5. PIDR distribution of these three bamboo frame structures under near-field earthquakes: (a) 3-story building; (b) 4-story building; (c) 5-story building.
Buildings 15 02039 g005
Figure 6. Distribution of PFAs along the structural height of the 3-story structure: (a) far-field ground motion; (b) near-field ground motion.
Buildings 15 02039 g006
Figure 7. Distribution of PFAs along the structural height of the 4-story structure: (a) far-field ground motion; (b) near-field ground motion.
Buildings 15 02039 g007
Figure 8. Distribution of PFAs along the structural height of the 5-story structure: (a) far-field ground motion; (b) near-field ground motion.
Buildings 15 02039 g008
Figure 9. Regression analyses of PFA3 on PGA and Sa(T1) of the 3-story structure: (a) PGA; (b) Sa(T1).
Buildings 15 02039 g009
Figure 10. Regression analyses of PFA3 on PGA and Sa(T1) of the 4-story structure: (a) PGA; (b) Sa(T1).
Buildings 15 02039 g010
Figure 11. Regression analyses of PFA3 on PGA and Sa(T1) of the 5-story structure: (a) PGA; (b) Sa(T1).
Buildings 15 02039 g011
Figure 12. βDM|IM between IMs and PFA along the 5-story laminated bamboo frame structure: (a) far-field ground motion; (b) near-field ground motion.
Buildings 15 02039 g012
Figure 13. Regression analysis of the residuals ln(ε|PGA) on ln(R) and M for the PFA3 of the 3-story structure: (a) ln(R); (b) M.
Buildings 15 02039 g013
Figure 14. Regression analysis of the residuals ln(ε|PGA) on ln(R) and M for the PFA3 of the 4-story structure: (a) ln(R); (b) M.
Buildings 15 02039 g014
Figure 15. Regression analysis of the residuals ln(ε|PGA) on ln(R) and M for the PFA3 of the 5-story structure: (a) ln(R); (b) M.
Buildings 15 02039 g015
Figure 16. p-values corresponding to the regression of the residuals ln(ε|IMi) on ln(R) with respect to PFA: (a) far-field ground motion; (b) near-field ground motion.
Buildings 15 02039 g016
Figure 17. p-values corresponding to the regression of the residuals ln(ε|IMi) on M with respect to PFA: (a) far-field ground motion; (b) near-field ground motion.
Buildings 15 02039 g017
Figure 18. Distribution of peak inter-story drift ratio along the structural height of the 3-story structure: (a) far-field ground motion; (b) near-field ground motion.
Buildings 15 02039 g018
Figure 19. Distribution of peak inter-story drift ratio along the structural height of the 4-story structure: (a) far-field ground motion; (b) near-field ground motion.
Buildings 15 02039 g019
Figure 20. Distribution of peak inter-story drift ratio along the structural height of the 5-story structure: (a) far-field ground motion; (b) near-field ground motion.
Buildings 15 02039 g020
Figure 21. Regression analyses of PIDR3 on PGA and Sa(T1) of the 3-story structure: (a) PGA; (b) Sa(T1).
Buildings 15 02039 g021
Figure 22. Regression analyses of PIDR3 on PGA and Sa(T1) of the 4-story structure: (a) PGA; (b) Sa(T1).
Buildings 15 02039 g022
Figure 23. Regression analyses of PIDR3 on PGA and Sa(T1) of the 5-story structure: (a) PGA; (b) Sa(T1).
Buildings 15 02039 g023
Figure 24. βDM|IM between IMs and PIDR along the structural height of the 5-story structure: (a) far-field ground motion; (b) near-field ground motion.
Buildings 15 02039 g024
Figure 25. Regression analyses of the residuals ln(ε|PGA) on ln(R) and M regarding the PIDR of the 3rd story in the 3-story structure: (a) ln(R); (b) M.
Buildings 15 02039 g025
Figure 26. Regression analyses of the residuals ln(ε|PGA) on ln(R) and M regarding the PIDR of the 3rd story in the 4-story structure: (a) ln(R); (b) M.
Buildings 15 02039 g026
Figure 27. Regression analyses of the residuals ln(ε|PGA) on ln(R) and M regarding the PIDR of the 3rd story in the 5-story structure: (a) ln(R); (b) M.
Buildings 15 02039 g027
Figure 28. p-values corresponding to the regression of the residuals ln(ε|IMi) on ln(R) with respect to PIDR in the case of 5-story frame structure: (a) far-field ground motion; (b) near-field ground motion.
Buildings 15 02039 g028
Figure 29. p-values corresponding to the regression of the residuals ln(ε|IMi) on M with respect to PIDR in the case of 5-story frame structure: (a) far-field ground motion; (b) near-field ground motion.
Buildings 15 02039 g029
Table 1. The parameters used in of Pinching4 model (Zhang et al., 2024 [31]).
ParametersDefinitionParametersDefinition
$ePf1, $ePf2, $ePf3, $ePf421.0, 38.0, 43.0, 34.0$ePd1, $ePd2, $ePd3, $ePd40.017, 0.050, 0.076, 0.086
$eNf1, $eNf2, $eNf3, $eNf4−32.0, −45.0, −53.0, −42.0$eNd1, $eNd2, $eNd3, $eNd4−0.035, −0.049, −0.067, −0.080
$rDispP, $rDispN0.3 0.3$gK1, $gK2, $gK3, $gK4, $gKLim0.0 0.0 0.0 0.0 −2.0
$fFoceP, $fFoceN0.2 0.2$gD1, $gD2, $gD3, $gD4, $gDLim0.5 0.5 1.0 1.0 0.25
$uForceP, $uForceN0.001 0.05$gF1, $gF2, $gF3, $gF4, $gFLim0.0 0.0 0.0 0.0 0.0
$gE10.0$dmgTypeenergy
Table 2. First five vibration periods for each frame structure.
Frame StructureVibration Periods
T1T2T3T4T5
3-story1.230.280.120.040.04
4-story1.410.290.110.060.04
5-story1.500.290.110.060.05
Table 3. Selected ground motion records [9,39].
No.Near-Field RecordsFar-Field Records
YearEarthquakeFile NamesMR (km)YearEarthquakeFile NamesMR (km)
11971San FernandoSFERN/PUL1646.611.811971San FernandoSFERN/PEL0906.6122.77
21979Imperial Valley-06IMPVALL.H/H-EMO0006.530.071979Imperial Valley-06IMPVALL.H/H-DLT2626.5322.03
31979Imperial Valley-06IMPVALL.H/H-E041406.537.051979Imperial Valley-06IMPVALL.H/H-E111406.5312.56
41979Imperial Valley-06IMPVALL.H/H-E061406.531.351984Morgan HillMORGAN/G030906.1913.02
51979Imperial Valley-06IMPVALL.H/H-E071406.530.561987Superstition Hills-02SUPER.B/B-ICC0006.5418.20
61992Cape MendocinoCAPEMEND/PET0007.018.181987Superstition Hills-02SUPER.B/B-IVW3606.5423.85
71994Northridge-01NORTHR/RRS2286.696.501989Loma PrietaLOMAP/A020436.9343.23
81995KobeKOBE/KJM0006.90.961989Loma PrietaLOMAP/AND2506.9320.26
91999KocaeliKOCAELI/YPT0607.514.831989Loma PrietaLOMAP/OHW0006.9374.26
101999Chi-ChiCHICHI/TCU052-E7.620.661989Loma PrietaLOMAP/SFO0006.9358.65
111999Chi-ChiCHICHI/TCU065-E7.620.571992LandersLANDERS/CLW-LN7.2819.74
121999Chi-ChiCHICHI/TCU068-E7.620.321992LandersLANDERS/YER2707.2823.62
131999Chi-ChiCHICHI/TCU101-E7.622.111995KobeKOBE/ABN0906.924.85
141999Chi-ChiCHICHI/TCU102-E7.621.491995KobeKOBE/FKS0906.917.85
151999DuzceDUZCE/DZC1807.146.581999KocaeliKOCAELI/ARE0007.5113.49
161989Loma PrietaLOMAP/LEX0006.935.021999KocaeliKOCAELI/DZC1807.5115.37
172003BamBAM/BAM-L6.61.701999Chi-ChiCHICHI/CHY101-E7.629.94
182010DarfieldDARFIELD/GDLCN55W71.221999Chi-ChiCHICHI/TCU045-E7.6226.00
192010DarfieldDARFIELD/LINCN23E77.111999DuzceDUZCE/BOL0007.1412.04
202010DarfieldDARFIELD/TPLCN27W76.111999Hector MineHECTOR/HEC0007.1311.66
211979Imperial Valley-06IMPVALL.H/H-ECC0026.537.311989Loma PrietaLOMAP/WAH0006.9317.47
221979Imperial Valley-06IMPVALL.H/H-E100506.538.601994Northridge-01NORTHR/TAR3606.6915.60
231979Imperial Valley-06IMPVALL.H/H-E051406.533.951999Chi-ChiCHICHI/TCU088-E7.6218.16
241979Imperial Valley-06IMPVALL.H/H-EDA2706.535.091999Chi-ChiCHICHI/TCU095-E7.6245.18
251979Imperial Valley-06IMPVALL.H/H-HVP2256.537.502004NiigataNIIGATA/NIG023EW6.6325.82
261992LandersLANDERS/LCN2607.282.192007Chuetsu-okiCHUETSU/65005EW6.822.74
271999Chi-ChiCHICHI/CHY024-E7.629.622007Chuetsu-okiCHUETSU/65025EW6.811.09
281999Chi-ChiCHICHI/TCU049-E7.623.762007Chuetsu-okiCHUETSU/65056EW6.820.03
291999Chi-ChiCHICHI/TCU075-E7.620.892007Chuetsu-okiCHUETSU/65057EW6.820.00
301999Chi-ChiCHICHI/TCU082-E7.625.162007Chuetsu-okiCHUETSU/6CB51EW6.811.48
Table 4. Selected ground motion intensity measures.
No.IMReference
1Peak ground acceleration, PGAN.A.
2Peak ground velocity, PGVN.A.
3Peak ground displacement, PGDN.A.
4PGV/PGA, V/ASucuoǧlu and Nurtuǧ, 1995 [41]
5Sustained maximum acceleration, SMANuttli, 1979 [42]
6Sustained maximum velocity, SMV
7Effective design acceleration, EDABenjamin J. R., & Associates, 1988 [43]
8A95Sarma & Yang, 1987 [40]
9Sa(T1)N.A.
10Sv(T1)N.A.
11Sd(T1)N.A.
12 S = ( S a ( T 1 ) ) 1 α ( S a ( T f ) ) α Cordova et al., 2001 [44]
13 IM CR = S a ( T 1 ) 1 α S a ( R IM 3 T 1 ) α Mehanny, 2009 [45]
14 IM SR = S a ( T 1 ) 1 α S a ( R IM T 1 ) α
15 I N p = S a ( T 1 ) N p a
N p = S a ( T 1 ) S a ( T N ) N / S a ( T 1 )
Bojórquez and Iervolino, 2011 [46]
16 S a 12 = 0.80 S a ( T 1 ) + 0.20 S a ( T 2 ) Shome and Cornell, 1999 [47]
17 S a 123 = 0.80 S a ( T 1 ) + 0.15 S a ( T 2 ) + 0.05 S a ( T 3 )
18 I M 12 = S a ( τ a , 5 % ) 1 β S a ( τ b , 5 % ) β Vamvatsikos and Cornell, 2005 [48]
19 I M 123 = S a ( τ a , 5 % ) 1 β γ S a ( τ b , 5 % ) β S a ( τ c , 5 % ) γ
20 N p = S a ( T 1 ) S a ( T N ) N / S a ( T 1 )
S N 1 = S a ( T 1 ) α S a ( C T 1 ) 1 α
Lin et al., 2011 [49]
21 S N 2 = S a ( T 1 ) β S a ( T 2 ) 1 β
22 S 12 = [ S a ( T 1 ) ] α [ S a ( T 2 ) ] β Zhou et al., 2013 [50]
23 S 123 = [ S a ( T 1 ) ] α [ S a ( T 2 ) ] β [ S a ( T 3 ) ] γ
24 S ¯ a = i = 1 n S a ( T 1 ) n   n = 0.39 T 1   +   1.15 , 1 s   <   T 1     10 s 1 ,   T 1     1 s Lu et al., 2013 [16]
25 S a , g m ( T i ) = i = 1 n S a ( T i ) 1 / n Kazantzi and Vamvatsikos, 2015 [51]
Disclaimer/Publisher’s Note: The statements, opinions and data contained in all publications are solely those of the individual author(s) and contributor(s) and not of MDPI and/or the editor(s). MDPI and/or the editor(s) disclaim responsibility for any injury to people or property resulting from any ideas, methods, instructions or products referred to in the content.

