Article

Structural Behavior Analyses and Simple Calculation of Asynchronous-Pouring Construction in PC Composite Girder Bridges with Corrugated Webs for Sustainability

1
School of Civil and Environmental Engineering, Changsha University of Science and Technology, Changsha 410114, China
2
Key Laboratory for Green Construction and Maintenance of Bridges and Buildings of Hunan Province, Changsha 410114, China
3
BCEG Civil Engineering Co., Ltd., Beijing 100015, China
4
Research Institute of Highway, Ministry of Transport, Beijing 110088, China
5
Hunan Water Planning & Design Institute Co., Ltd., Changsha 410153, China
*
Authors to whom correspondence should be addressed.
Buildings 2025, 15(14), 2434; https://doi.org/10.3390/buildings15142434
Submission received: 10 June 2025 / Revised: 25 June 2025 / Accepted: 4 July 2025 / Published: 11 July 2025

Abstract

Asynchronous-pouring construction (APC) technology employs a suspended hanging basket directly supported by corrugated steel webs (CSWs) with high shear strength, significantly enhancing construction efficiency. To further elucidate the characteristics of APC and promote its application in prestressed concrete (PC) composite box girder bridges with CSWs, this study analyzes the sustainable development of APC from two aspects, including environmental impact and economic performance. Finite element models of APC and traditional balanced cantilever construction (TBCC) were established for the case bridge with a main span of 105 m. The stress distribution and deflection of the main girder in the cantilever construction state are compared with field measurements, and the variations in stress and deflection in typical sections during construction are analyzed. Additionally, a simplified theoretical method is proposed for calculating stress and deflection in PC composite girder bridges during the cantilever construction stage using APC. Results demonstrate that APC demonstrates significant advantages in reducing economic costs and minimizing long-term environmental impacts. Furthermore, this method ensures acceptable stress and deflection throughout construction. The proposed simplified formula for CSW deflection in the maximum segment agrees well with both measured data and finite element results, providing a valuable reference for deflection calculation in APC applications.

1. Introduction

Prestressed concrete (PC) box girder bridges with corrugated steel webs (CSWs) utilize lighter and thinner steel webs instead of traditional concrete or flat steel webs, offering advantages such as reduced weight, high shear resistance, and efficient prestress application, leading to widespread adoption in China and globally [1,2,3,4,5]. While traditional balanced cantilever construction (TBCC) remains the dominant method for long-span PC box girder bridges with CSWs, it suffers from drawbacks such as excessive form traveler weight and limited workspace during construction. Asynchronous-pouring construction (APC) has emerged as a promising alternative due to its sustainability and superior construction efficiency [6,7,8], APC enables simultaneous construction of the top slab, bottom slab, and CSWs, tripling the working platform, and allows hanging baskets to traverse directly on the CSWs. This technique significantly accelerates construction progress and reduces carbon emissions form on-site mechanical equipment operations. Additionally, the lighter weight of the hanging baskets decreases steel consumption, making APC an environmentally friendly and sustainable construction technique. Several bridges in China, including the Toudaohe Bridge, Xiaoqing River Bridge, and Feilong Bridge, have successfully employed APC [9,10,11,12].
Existing research has primarily focused on the mechanical behavior of steel girders, including bending [13,14,15,16], shear [17,18,19,20,21,22,23], torsion [24,25,26], andfatigue [27,28,29] with limited studies on APC technology. Dai et al. [30] investigated CSW mechanical behavior and stress states during APC through model tests. Peng et al. [31] derived a correction formula for CSW deflection during APC, addressing excessive local deformation. Ren et al. [32] compared APC and TBCC via finite element analysis, revealing that APC induces larger girder deflection, greater camber requirements, and higher CSW shear stress during construction, though concrete slab stresses remained comparable. Deng et al. [33,34] conducted full-scale static load tests on the Fenghua River Bridge under critical APC conditions, identifying key stress zones. Furthermore, through comparative experimental studies using two sets of double-cantilever beam models and finite element analysis, they systematically investigated the mechanical characteristics of multi-cell single-box girders with corrugated steel webs under both TBCC and APC methods. Zuo [35] detailed APC processes and hanging basket design, verifying the structural strength and stiffness of the hanging basket.
While the APC method has seen initial applications in engineering practices, existing research has predominantly focused on summarizing key construction techniques and verifying structural safety reliability. Insufficient attention has been paid to its advantages in terms of low-carbon sustainability and economic efficiency. According to recent statistics, China’s carbon emissions accounted for 31% of the global total [36], ranking first worldwide, and projections indicate this figure will continue its upward trajectory until 2030. Against this backdrop, the “Dual Carbon” goals (peaking carbon emissions by 2030 and achieving carbon neutrality by 2060) have become central to national strategic development. As a critical sector for emission reduction, the construction industry contributes over 40% of global greenhouse gas emissions [37], exhibiting the highest carbon output and resource consumption among all industrial sectors. Particularly noteworthy is the significant emission reduction potential of bridges as vital transportation infrastructure components. APC delivers multiple benefits through optimized construction processes: (1) substantial reductions in building material consumption and (2) enhanced construction efficiency, thereby decreasing on-site energy consumption including worker commuting and machinery operation. Moreover, there is a lack of dedicated simplified theoretical methods for calculating the stress-deformation specific to this process. Given the significant differences in construction procedures and hanging basket configurations between APC and TTBC, these distinctions inevitably lead to variations in structural performance during the construction process. Although finite element simulations can accurately predict APC responses, their reliance on specialized simulation software, complex modeling, time-consuming computations, and the inability to facilitate real-time optimization of construction parameters have hindered on-site applications. Therefore, it is essential to analyze the structural behavior characteristics during APC and subsequently develop a simplified calculation theory that captures the unique load transfer mechanism of asynchronous construction while enabling rapid dynamic parameter adjustments to meet engineering requirements.
This study adopts a research framework of “low-carbon economic advantage analysis—structural safety verification—simplified calculation method introduction.” First, through comparison with TBCC, the study highlights the significant advantages of APC in terms of low-carbon sustainability and economic cost. Second, this study examines the global structural response of APC through Damogou to validate the structural reliability of this construction technique based on a bridge case study. Finite element models of APC and TBCC are developed in finite element (FE) analysis software—Midas Civil 2019 v [2.1] and results show that the derived formula demonstrates close agreement with finite element simulations and measured data across all construction stages, offering a practical tool for APC deflection prediction and design optimization. Finally, based on the construction characteristics of APC, a simplified calculation method for predicting APC structural stress-deformation is proposed. Comparisons with numerical simulation results and field-measured data confirm that the formula meets engineering accuracy requirements. The three dimensions work in concert to advance both the reliable application of APC technology and the translation of its low-carbon benefits into practice.

2. Practical Bridge Project

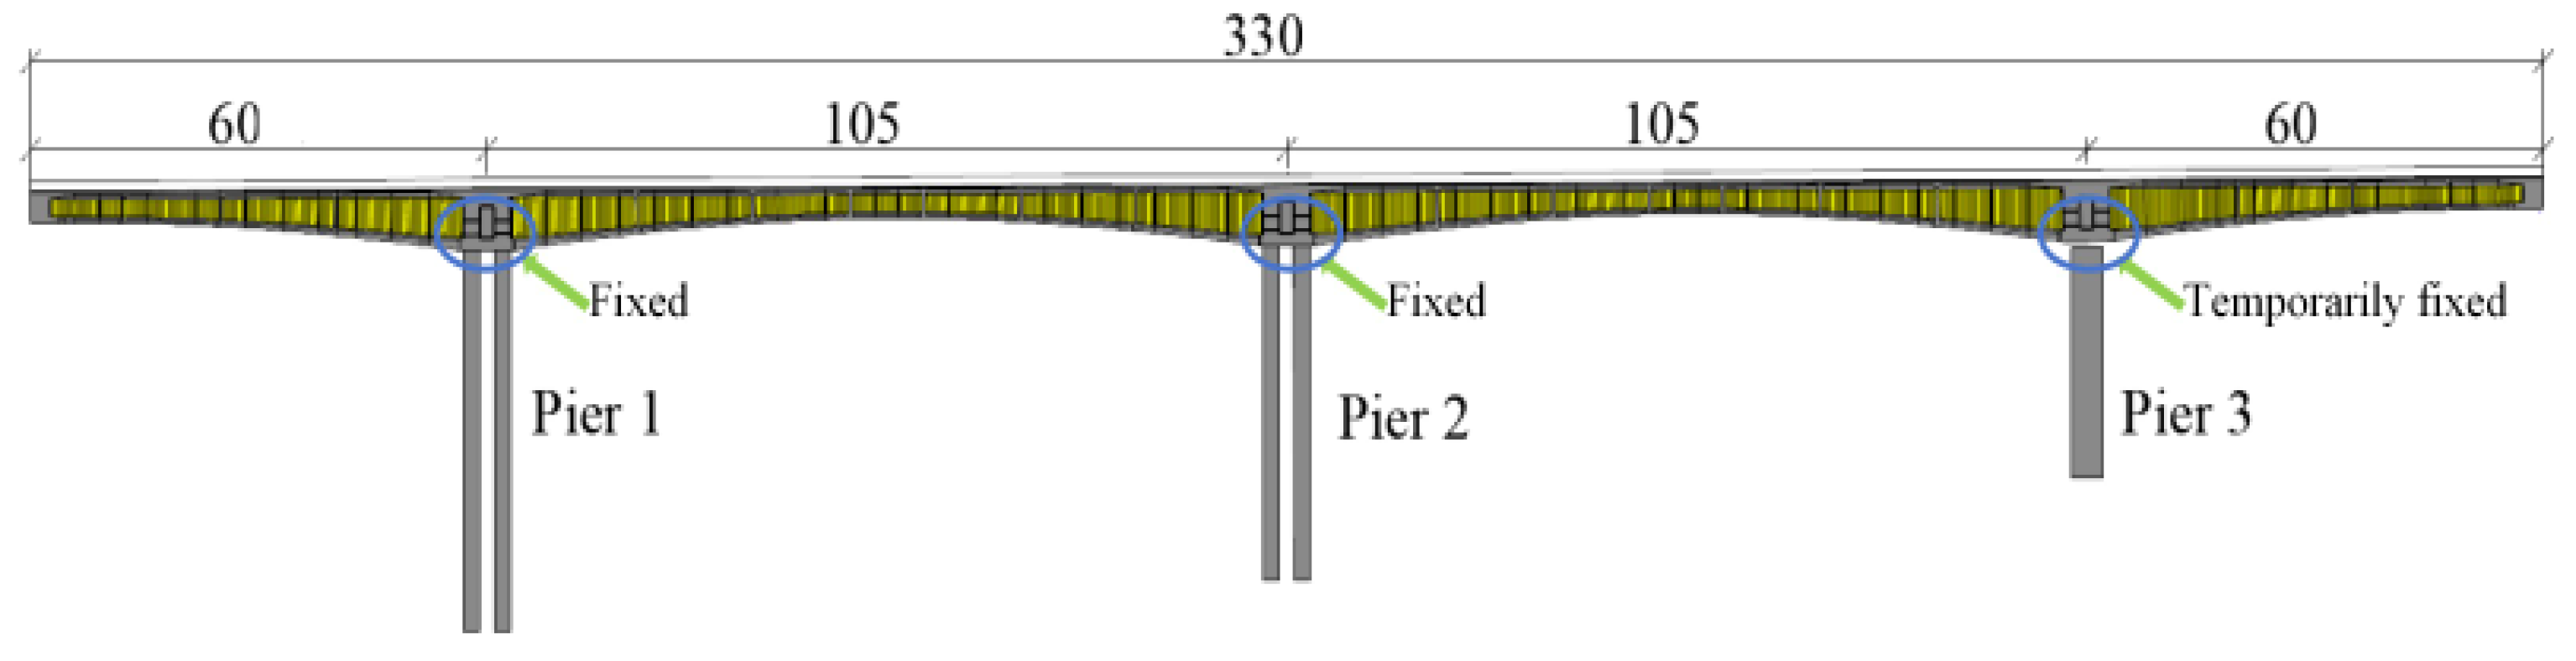
2.1. Bridge Overview
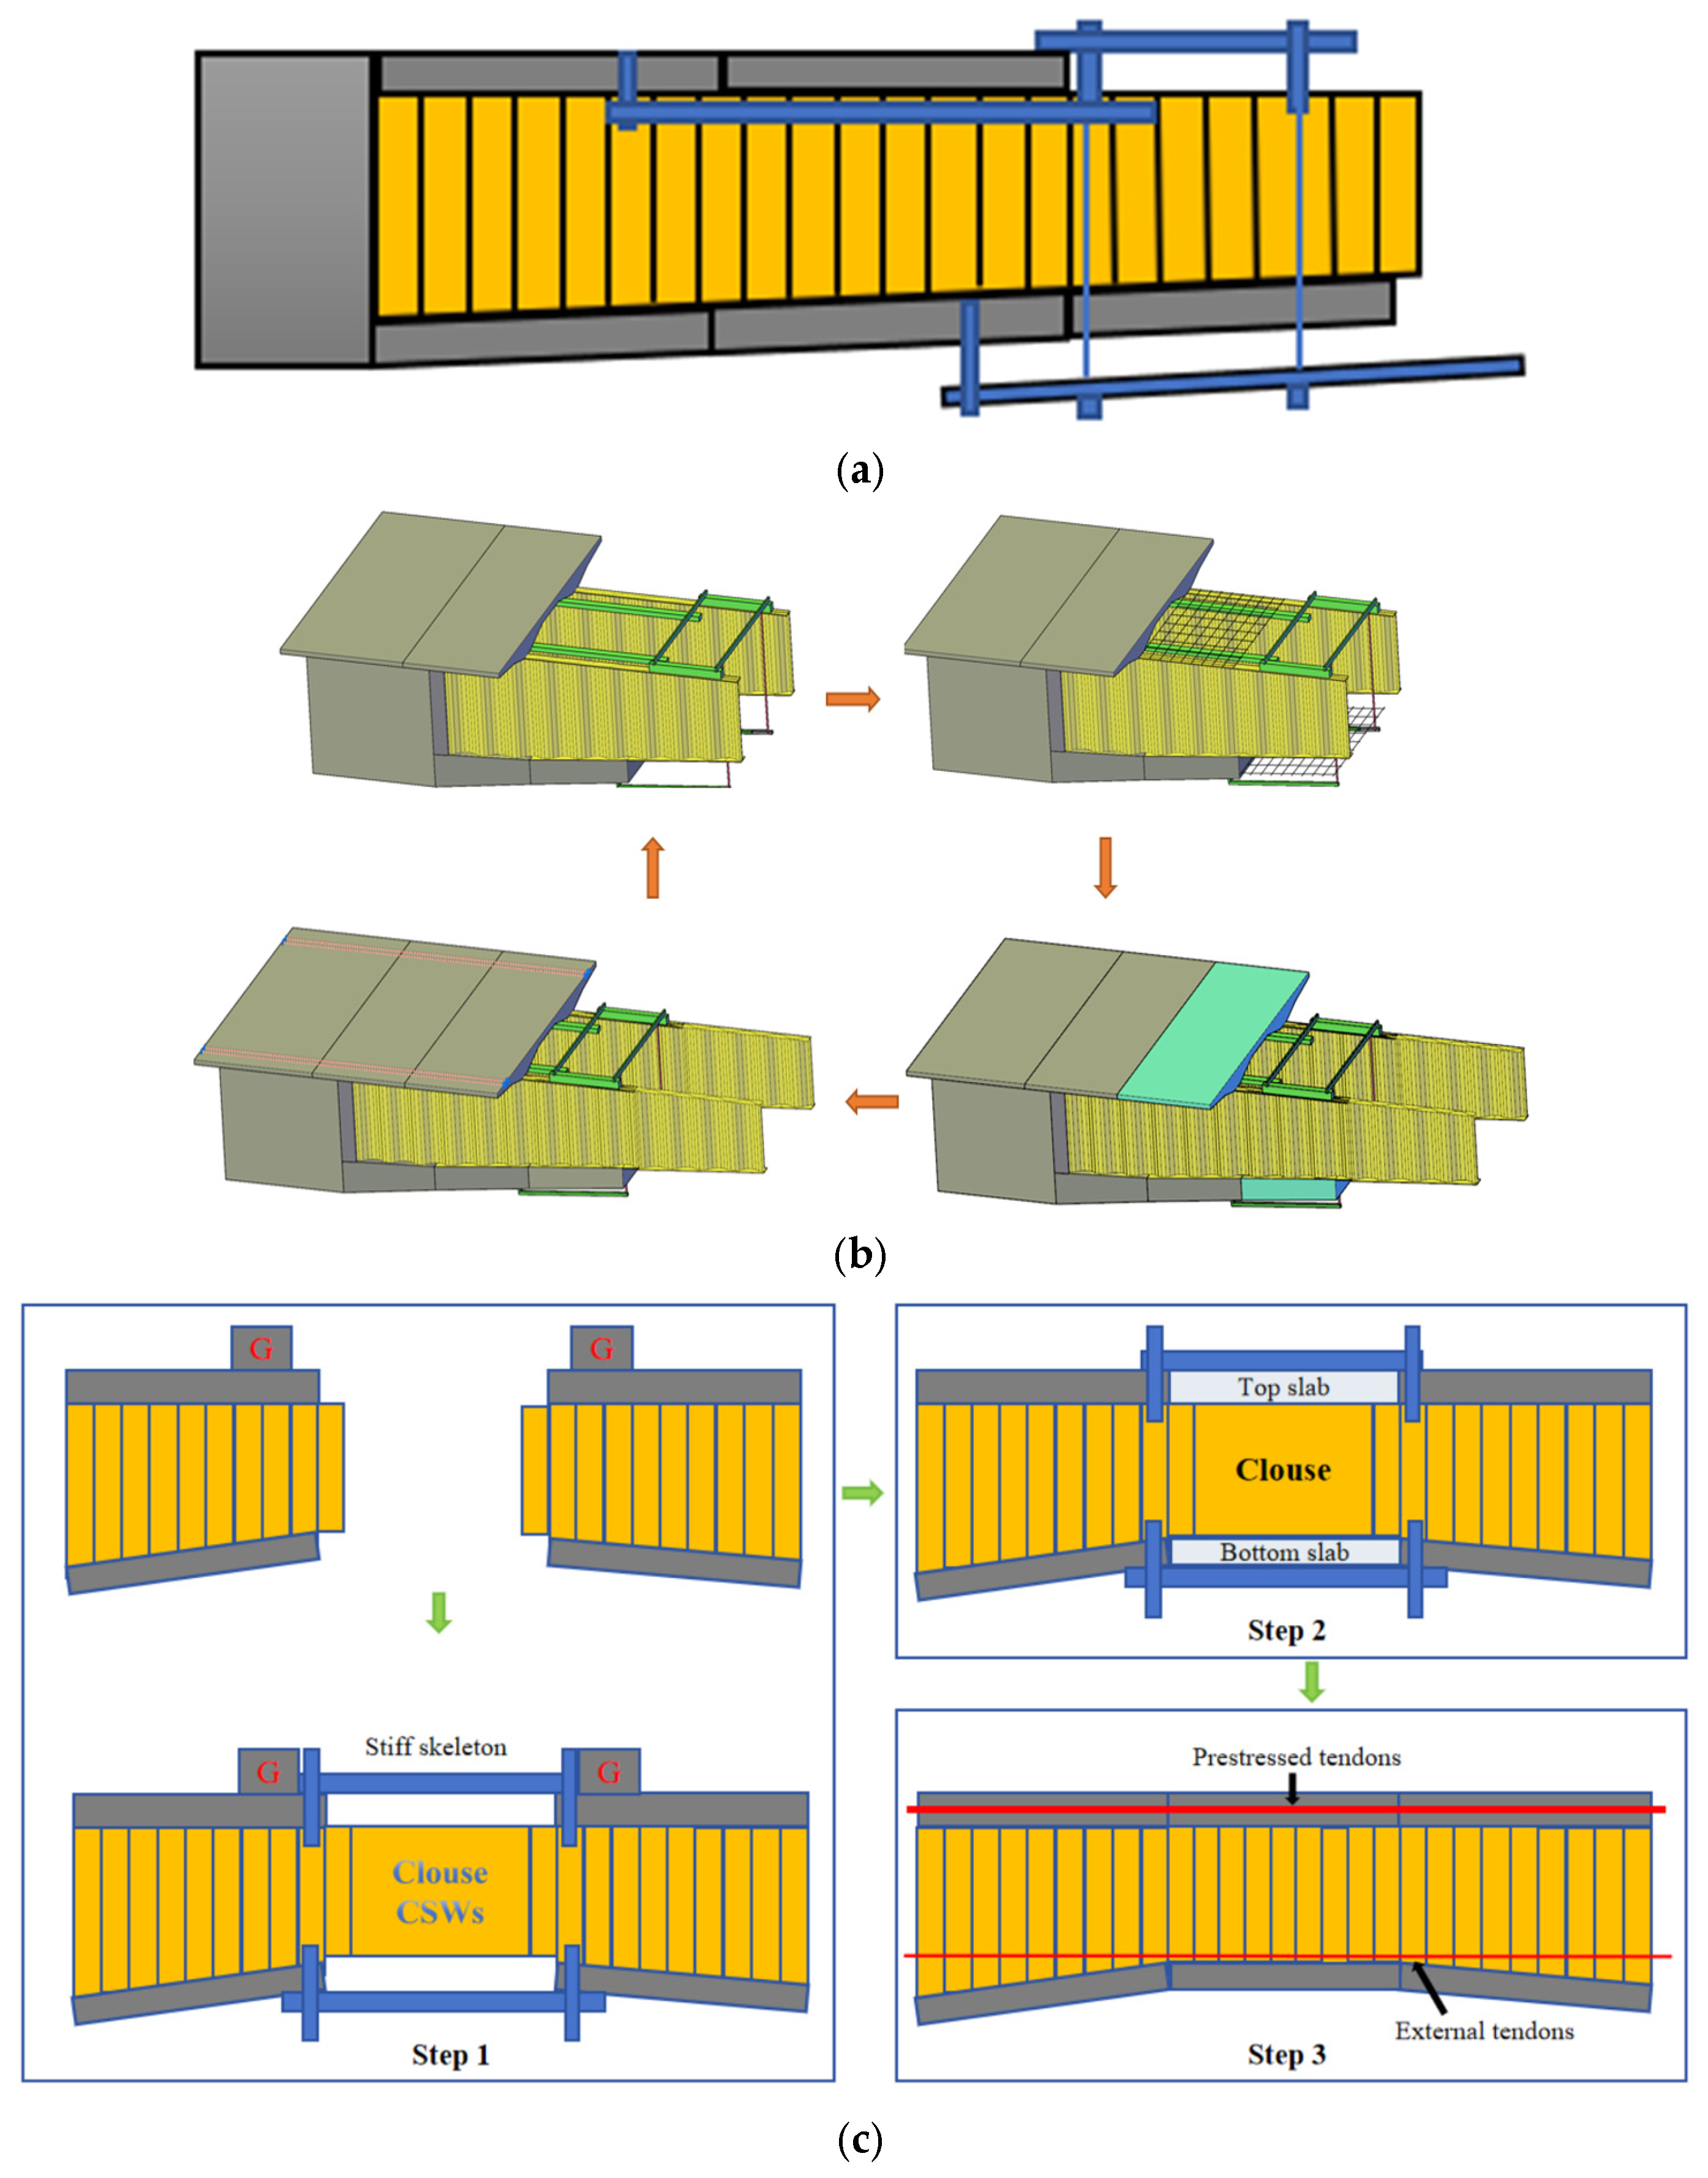
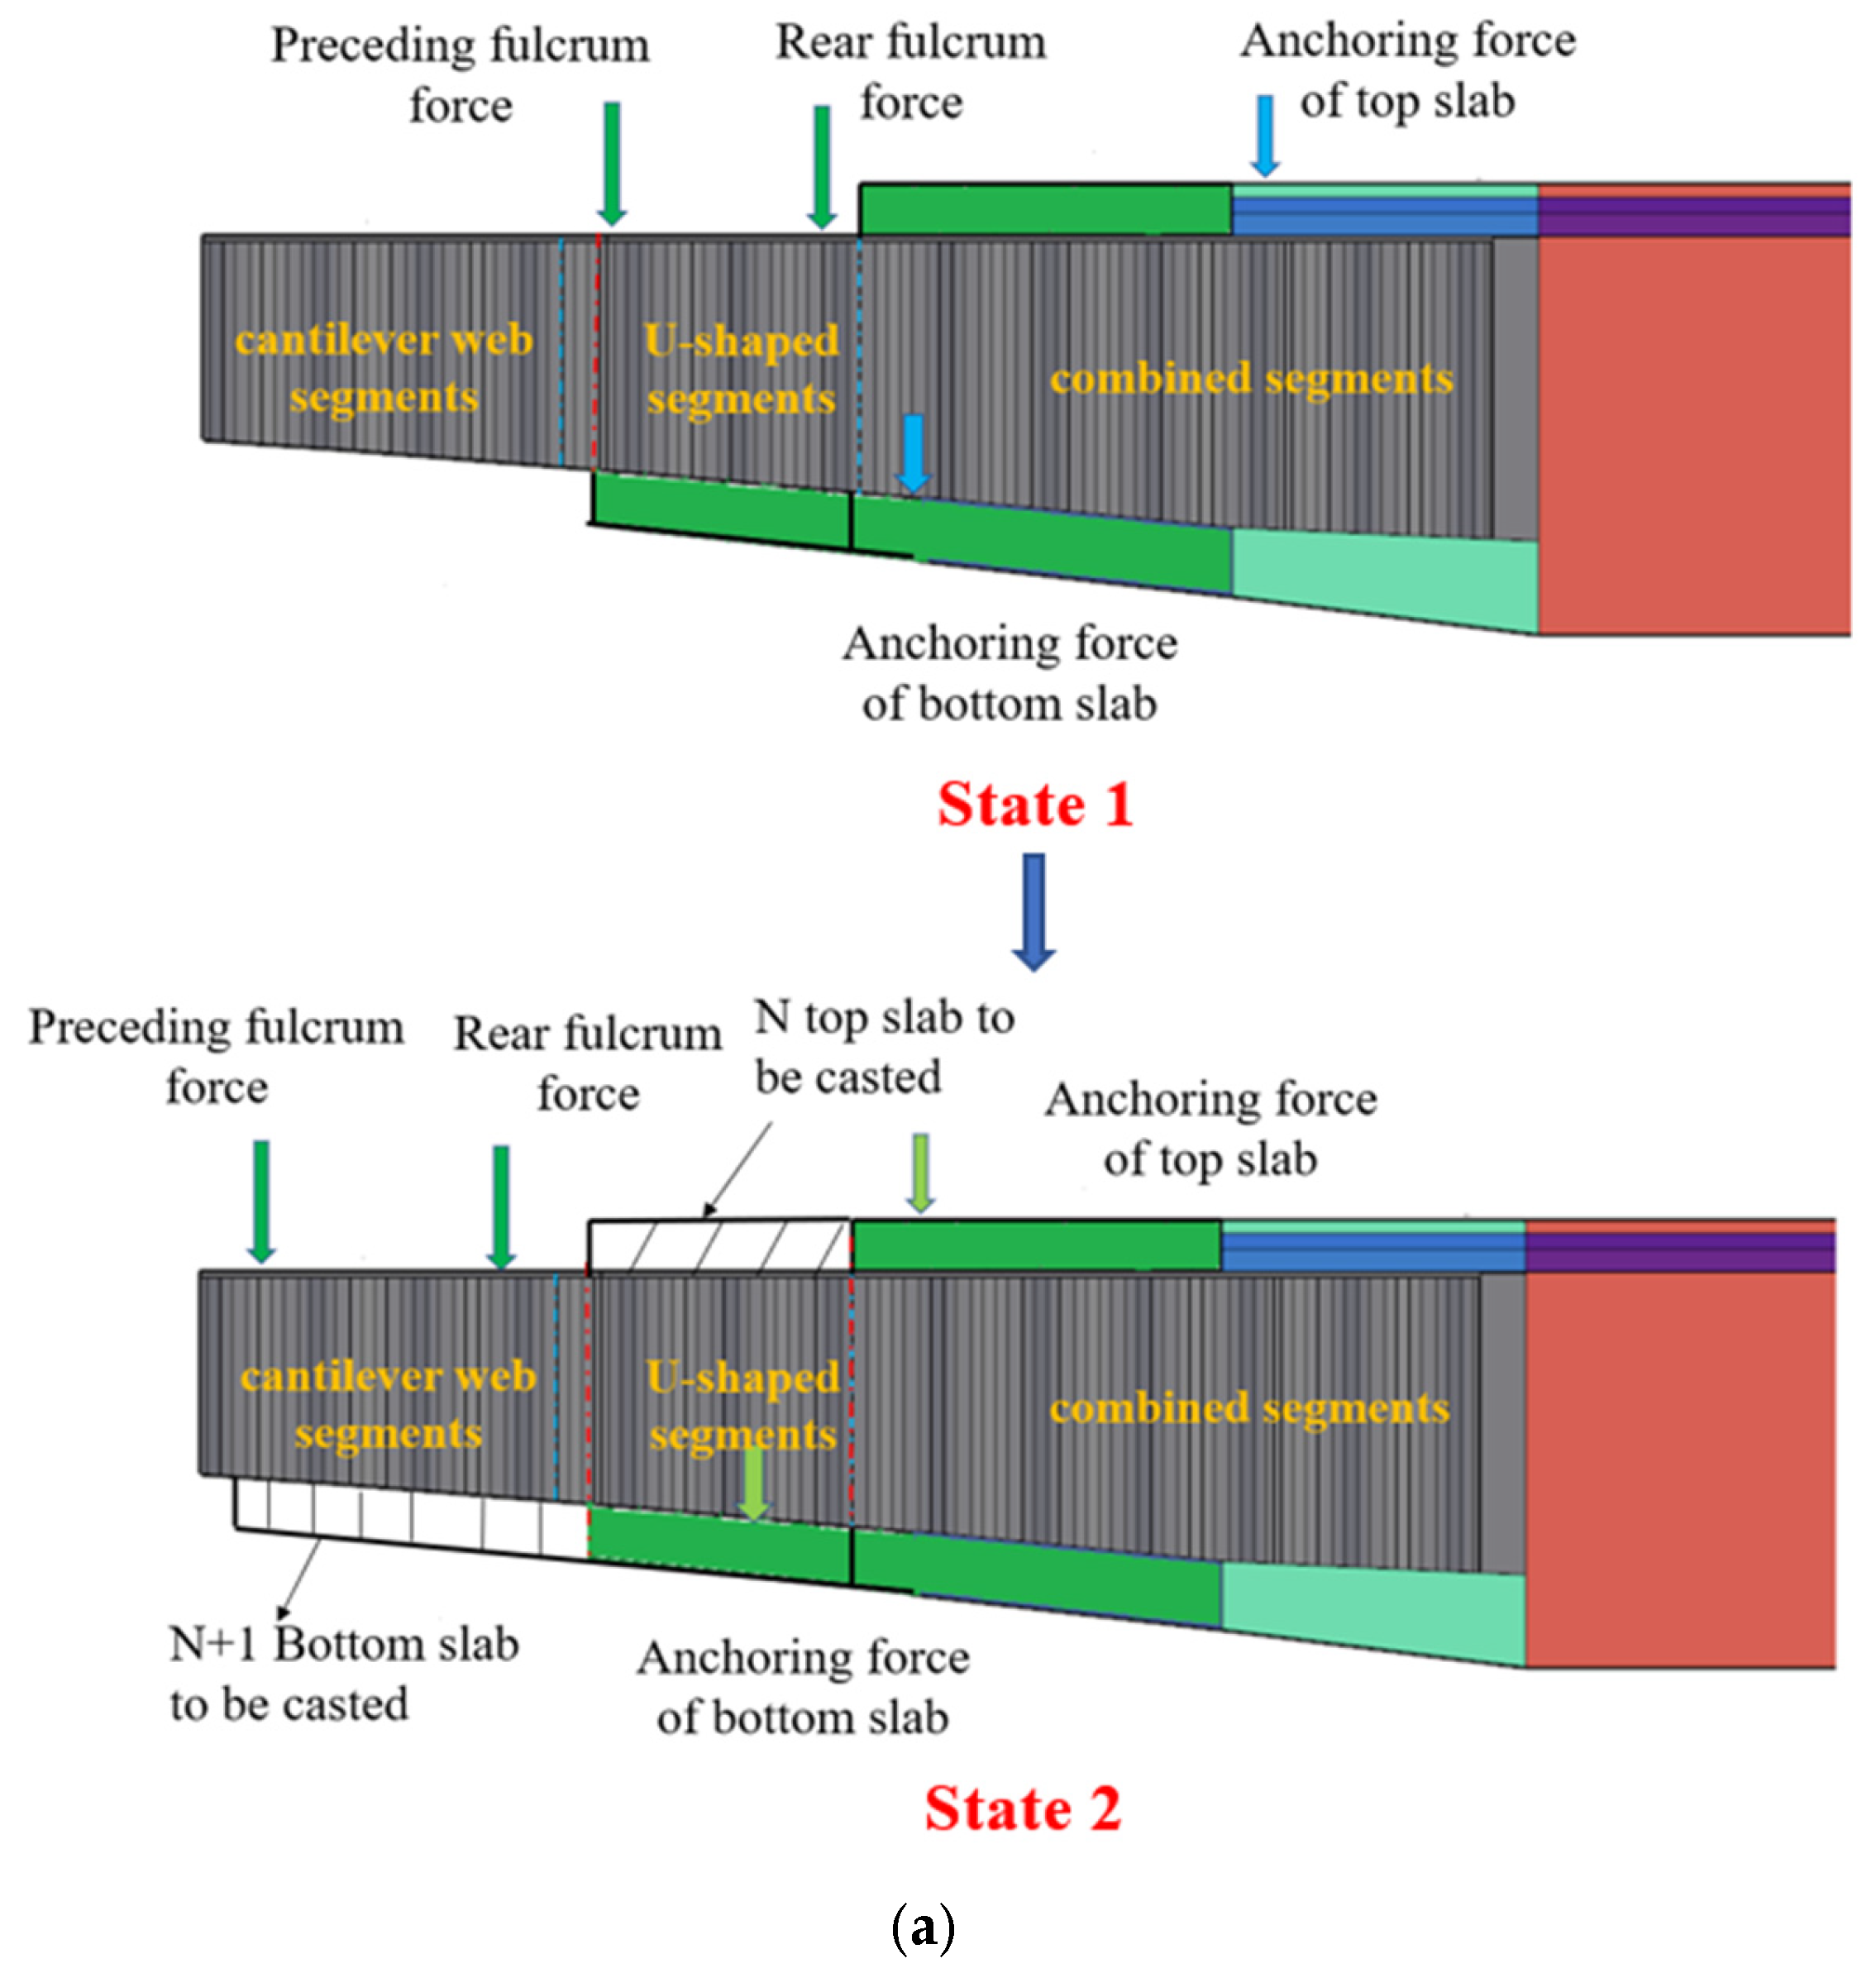
The case study bridge is a four-span continuous PC box girder with CSWs, located in Damogou, Beijing, China. The main bridge has a total length of 330 m, comprising two 60 m side spans and two 105 m middle spans (Figure 1). The girder cross-section is a single-cell, single-chamber box with straight CSWs. The top slab width is 13.75 m, and the bottom slab width is 7.25 m, with a 3.25 m cantilever. The girder height varies parabolically from 3.5 m at the side supports to 7.0 m at the mid-supports.
During the cantilever construction stage, Piers 1 and 2 are rigidly connected to the main girder, while Pier 3 is temporarily fixed. Upon reaching the closure segment, the temporary fixation at Pier 3 will be removed and replaced with a movable support. The cantilever segments are divided into nine sections: 4.7 m (Segment 0–1) + 5 × 4.8 m + 3 × 6.4 m (Segments 2–9), as illustrated in Figure 2. Segments 0–1 were cast in situ on temporary brackets, while Segments 2–9 employed APC to accelerate construction progress.

2.2. APC Technology

The APC method leverages the high shear strength of CSWs, which serve as the primary load-bearing structure for the hanging basket. The CSWs’ upper/lower flange plates and dual-row PBL connectors form an I-section with high shear and bending resistance. Unlike traditional balanced cantilever construction (TBCC), APC utilizes the CSWs as guide beams for hanging basket movement (Figure 3a). The basket is directly supported on the CSWs, enabling integrated jacking and moving. This approach expands working platforms from one to three (top slab, bottom slab, and CSWs), significantly improving efficiency.
The APC cycle for standard segments (Figure 3b) proceeds as follows:
  • Positioning: The hanging basket moves to Segment N; formwork is installed for the bottom slab (N) and top slab (N − 1).
  • Reinforcement: Rebar is bound and welded concurrently for the bottom slab (N) and top slab (N − 1).
  • Concreting: The bottom slab (N) and top slab (N − 1) are poured simultaneously, while CSWs for Segment N + 1 are installed during curing.
  • Post-Tensioning and Cycle Advance: After the concrete strength meets requirements, Segment N’s tendons are tensioned. The basket then advances to Segment N+1, repeating the cycle.
The APC closure (Figure 3c) proceeds as follows:
  • Step1: Apply counterweights on both sides of the closure segment, install pushing devices at the top and bottom slabs of the closure section to exert horizontal forces, and connect the stiff skeleton to ensure construction safety while simultaneously completing the connection of the corrugated steel webs in the closure segment.
  • Step2: Pouring the concrete of the bottom and top slabs, releasing the counterweights simultaneously, and then removing the jacking devices when the concrete reaches sufficient strength.
  • Step3: Remove the stiff skeleton and sequentially tension the prestressed tendons and external prestressed tendons in the closure segment.

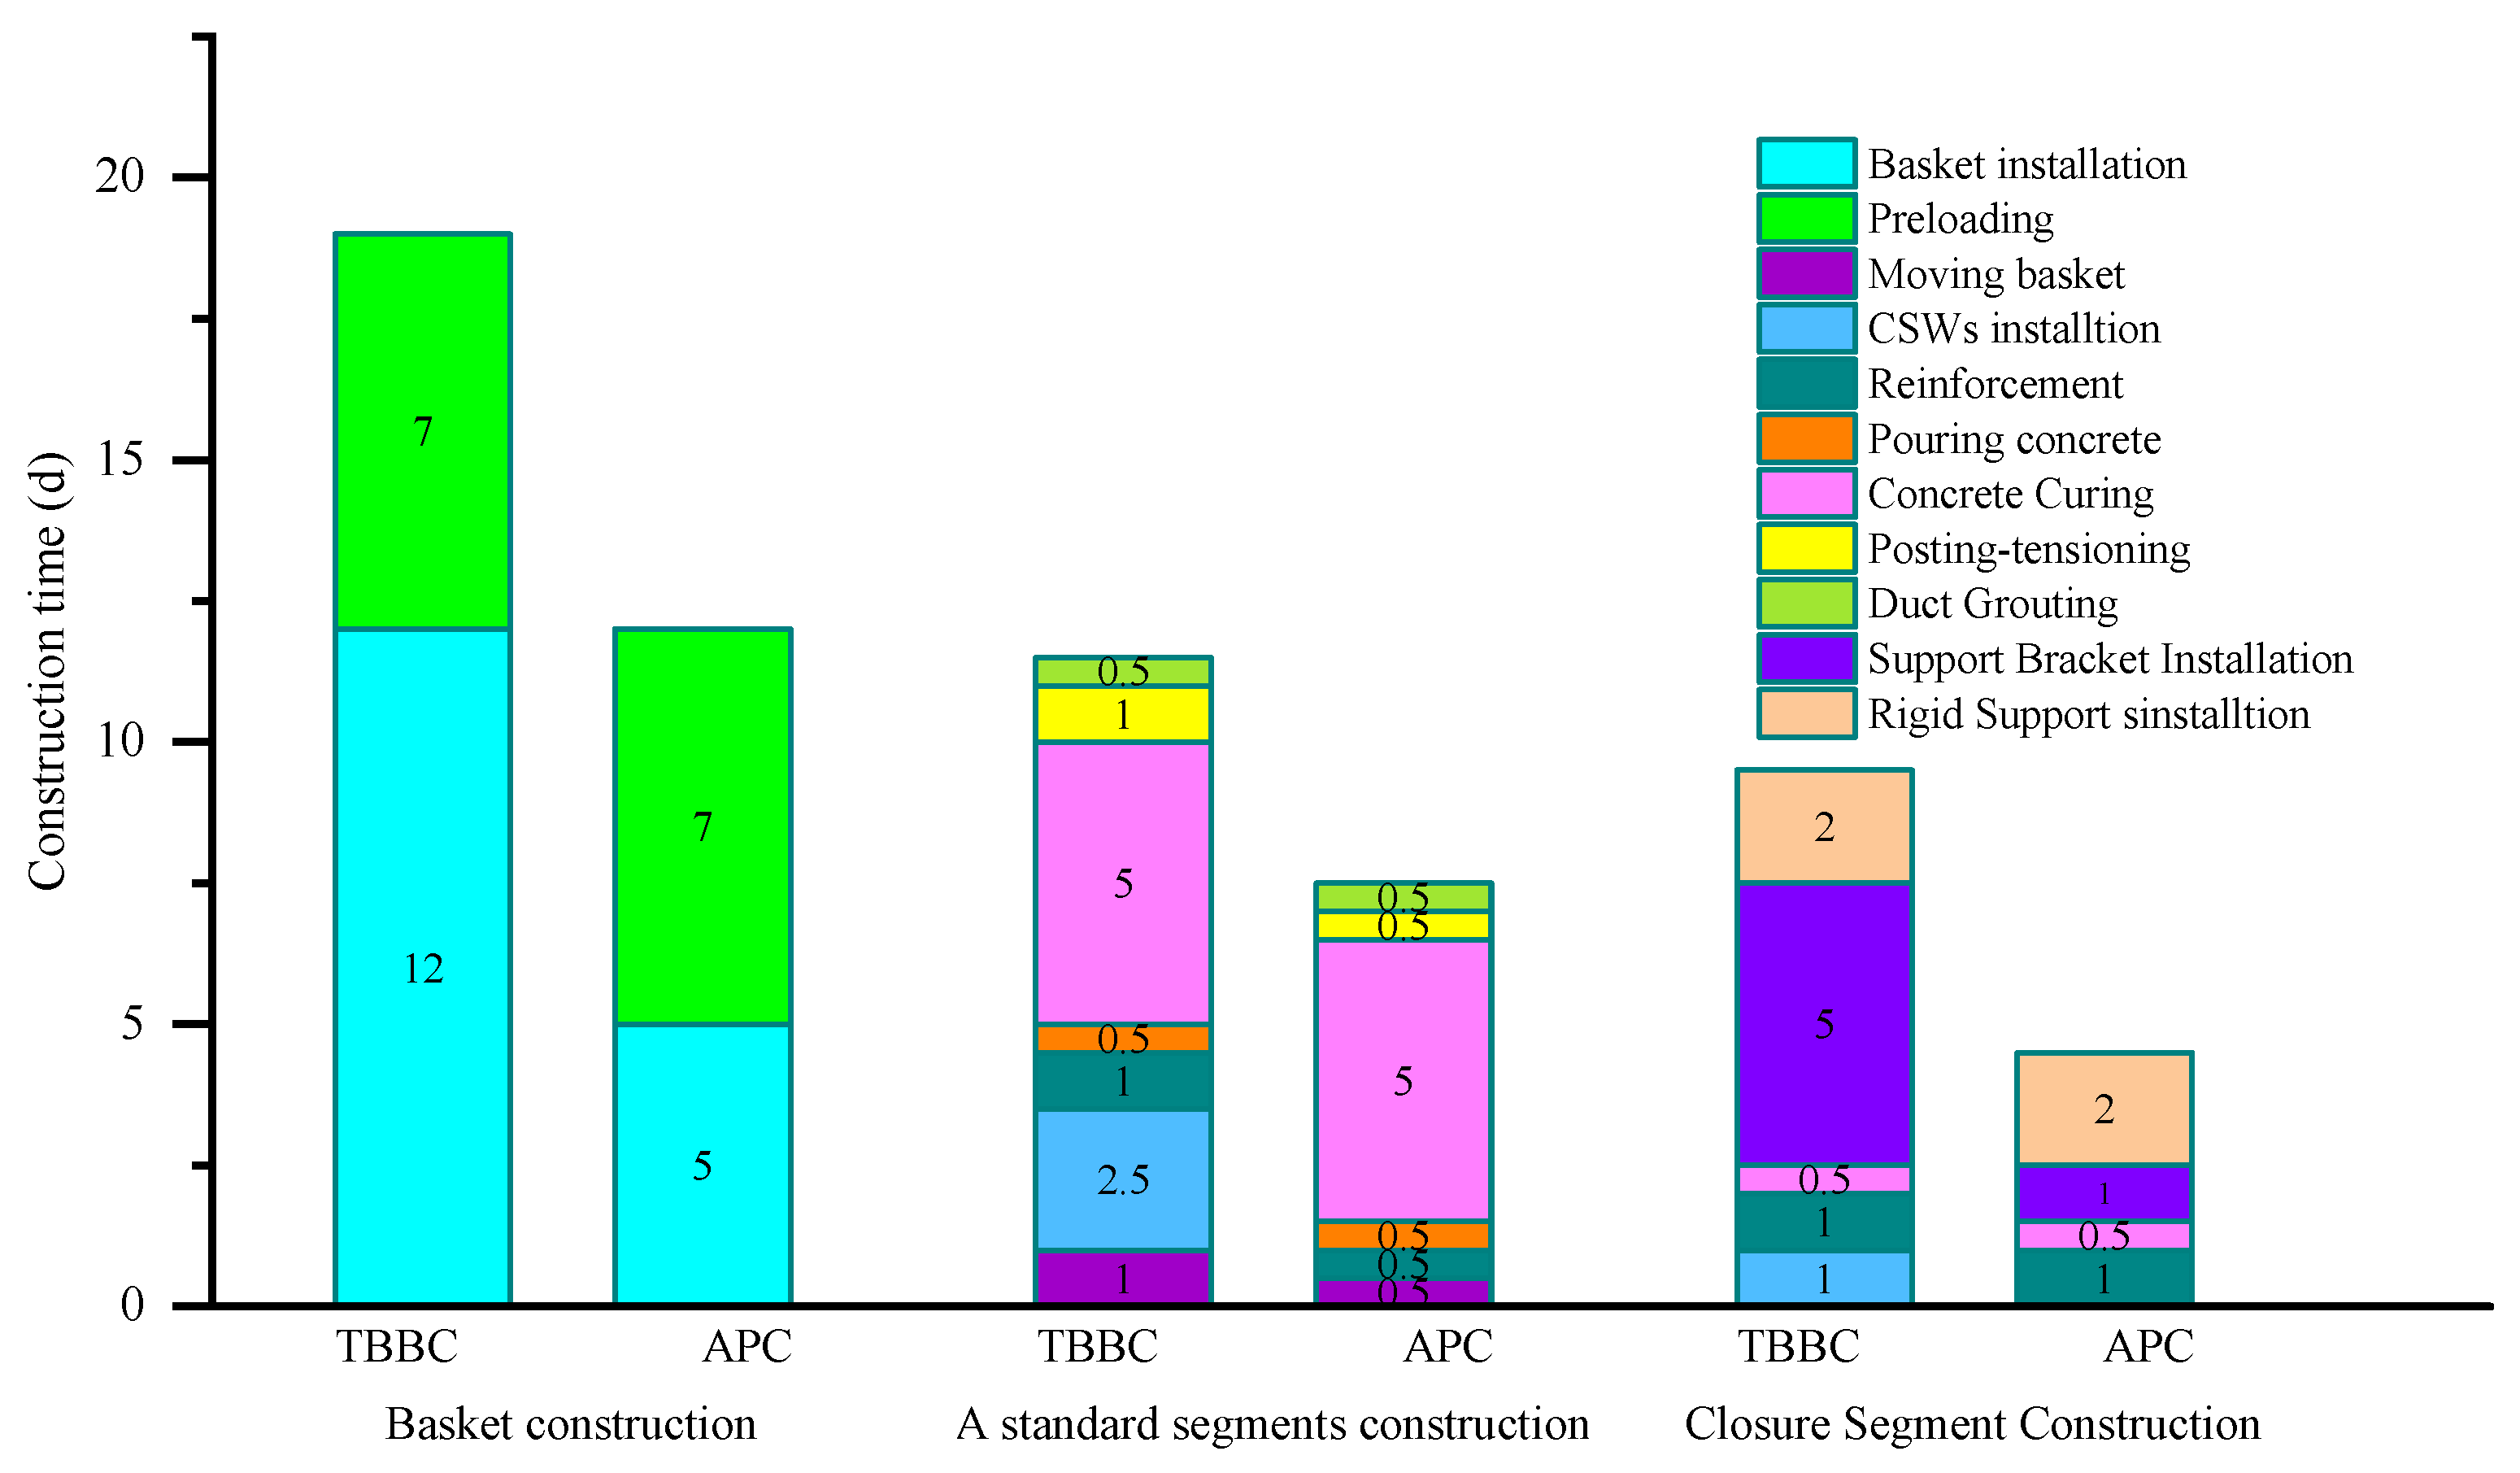
3. Environmental and Economic Sustainability Comparison Between APC and TTBC

3.1. Environmental Impact

Considering that both construction methods employ identical primary structural materials for the bridge, this study evaluates the environmental impacts of different construction technologies by focusing on the material consumption in the hanging basket systems. Based on comparable bridge projects, the lightweight APC hanging basket reduces the self-weight to 34~51% of TBCC hanging baskets [8]. In this specific project, a single TBCC hanging basket weighs at least 100 tons, whereas the APC counterpart can be optimized to approximately 50 tons.
From a steel production perspective, manufacturing one ton of steel requires 187 kWh of electricity and 4.4 tons of water, while emitting approximately 3030 kg of CO2 [38], resulting in substantial ecological burdens. According to these conversion factors, the Damogou Bridge case study—featuring an innovative dual-separated-girder superstructure that necessitates four simultaneous hanging baskets for casting nine cantilever segments—shows that the APC method reduces the total hanging basket weight by 200 tons compared to TBCC. This translates to significant environmental benefits: a 37,400 kWh reduction in electricity consumption, 880 tons of saved water, and 606 tons of CO2 emission reductions.
The comparative data highlight that APC technology, through its lightweight hanging basket design, not only decreases resource consumption during construction but also alleviates the ecological pressures associated with conventional methods. This approach, balancing efficiency and sustainability, establishes a green development pathway for corrugated steel web composite bridges, advancing bridge engineering while contributing significantly to green, low-carbon infrastructure development, aligning with global sustainability goals and circular economy principles.

3.2. Economic Cost

As illustrated in Figure 4 the adoption of the Advanced Prefabricated Cantilever (APC) method demonstrates significant time-saving advantages compared to the Traditional Traveling Basket Cantilever (TTBC) approach, achieving approximately 37%, 30%, and 53% reductions in construction duration for hanging basket installation, individual segment casting, and closure segment construction, respectively. A comprehensive comparison of project timelines reveals that the conventional TTBC method required 19 days for basket installation and preloading, 11.5 days per cast segment (totaling nine segments), and 9.5 days per closure (with eight symmetrical closures executed sequentially from side spans to mid-span), resulting in an aggregate construction period of 198.5 days (19 + 11.5 × 9 + 9.5 × 8). In contrast, the implementation of the APC method reduced these durations to 12 days for basket installation, 8 days per cast segment, and 4.5 days per closure, culminating in a total construction period of 120 days (12 + 8 × 9 + 4.5 × 8). This represents a substantial time saving of 78.5 days (39.5% reduction), conclusively demonstrating the APC method’s superior efficiency in construction scheduling and its significant economic advantages through considerable cost savings. The marked improvements across all critical construction phases—including a 36.8% reduction in assembly time, 30.4% acceleration in segment casting, and 52.6% efficiency gain in closure operations provide compelling evidence for the technical and financial benefits of adopting this advanced construction methodology for cantilever bridges.
The Damogou Bridge requires four hanging basket systems working simultaneously to complete the construction of nine cantilever segments. Compared to the TTBC, the APC demonstrates significant material savings, reducing steel usage by 200 metric tons. The price per ton of steel is 3450 RMB/t [39]. APC achieves an approximately 690,000 RMB cost reduction in hanging basket fabrication, and it yields total cost savings of approximately CNY 3.045 million (as shown in Table 1), highlighting its substantial economic advantages in material efficiency and construction cost optimization. The remarkable steel quantity reduction, coupled with the considerable savings in both equipment and labor costs, underscores the technical and financial benefits of adopting the APC methodology for large-scale cantilever bridge construction projects.

4. Mechanical Performance Comparison of APC and TBCC in Cantilever Construction Stage

To evaluate the influence of asynchronous-pouring construction (APC) on structural stress and deflection during cantilever construction, finite element (FE) models of APC and TBCC were developed based on the Damogou Bridge case study. Field measurements, including strain gauges and deflection monitoring, were conducted to validate the models. Three critical sections (sections 1, 4, and 7) along the mid-span girder of Pier 1 were selected for stress analysis (Figure 2). By comparing on-site data with FE results, the structural responses of both construction methods were systematically assessed.

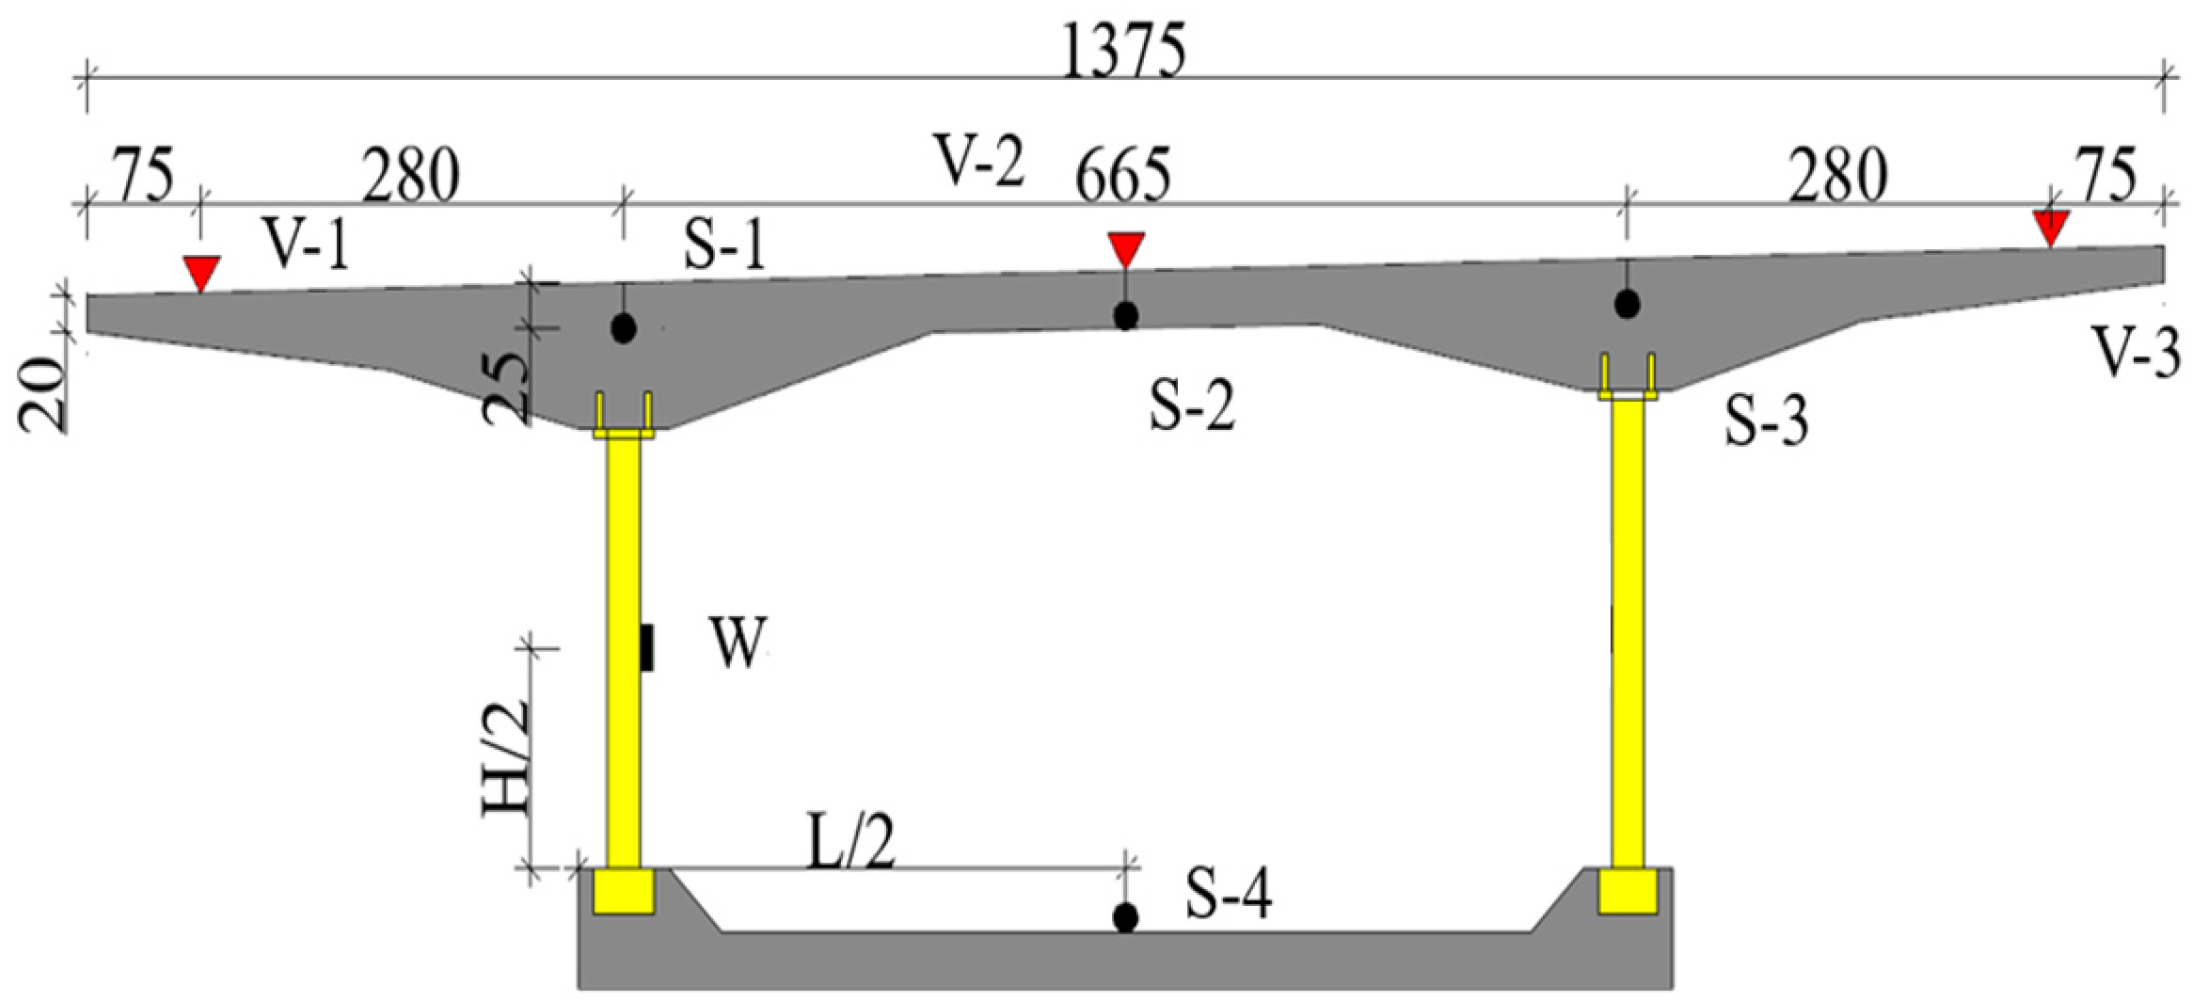
4.1. On-Site Measurement Arrangement

Three elevation control points (V-1, V-2, V-3) were installed on the girder’s top surface (Figure 5). A total station measured absolute elevations under each construction stage to determine deflection changes. Embed strain gauges and surface-mounted strain gauges were deployed at sections 1, 4, and 7 (Figure 2, sections A~C) to capture stress evolution. The JMZX-215HAT embedded strain gauge is suitable for internal strain measurement in concrete structures, with a measurement range of ±1500 με and a sensitivity of 0.1 με. The JMZX-212HAT surface-mounted wire strain gauge has a strain measurement range of ±2500 με and a strain resolution of 0.1 με.
Before concrete pouring, three embedded strain gauges (S-1 to S-3) were longitudinally tied to the top slab structural reinforcement, and one embedded strain gauge (S-4) was longitudinally tied to the bottom slab structural reinforcement along the bridge’s longitudinal direction (Figure 6b). One surface-mounted strain gauge (W-1) was welded longitudinally and another (W-2) vertically on the upper part of the corrugated steel web (Figure 6a). All measurement points were located in the right roadway’s mid-span region of Pier 1.

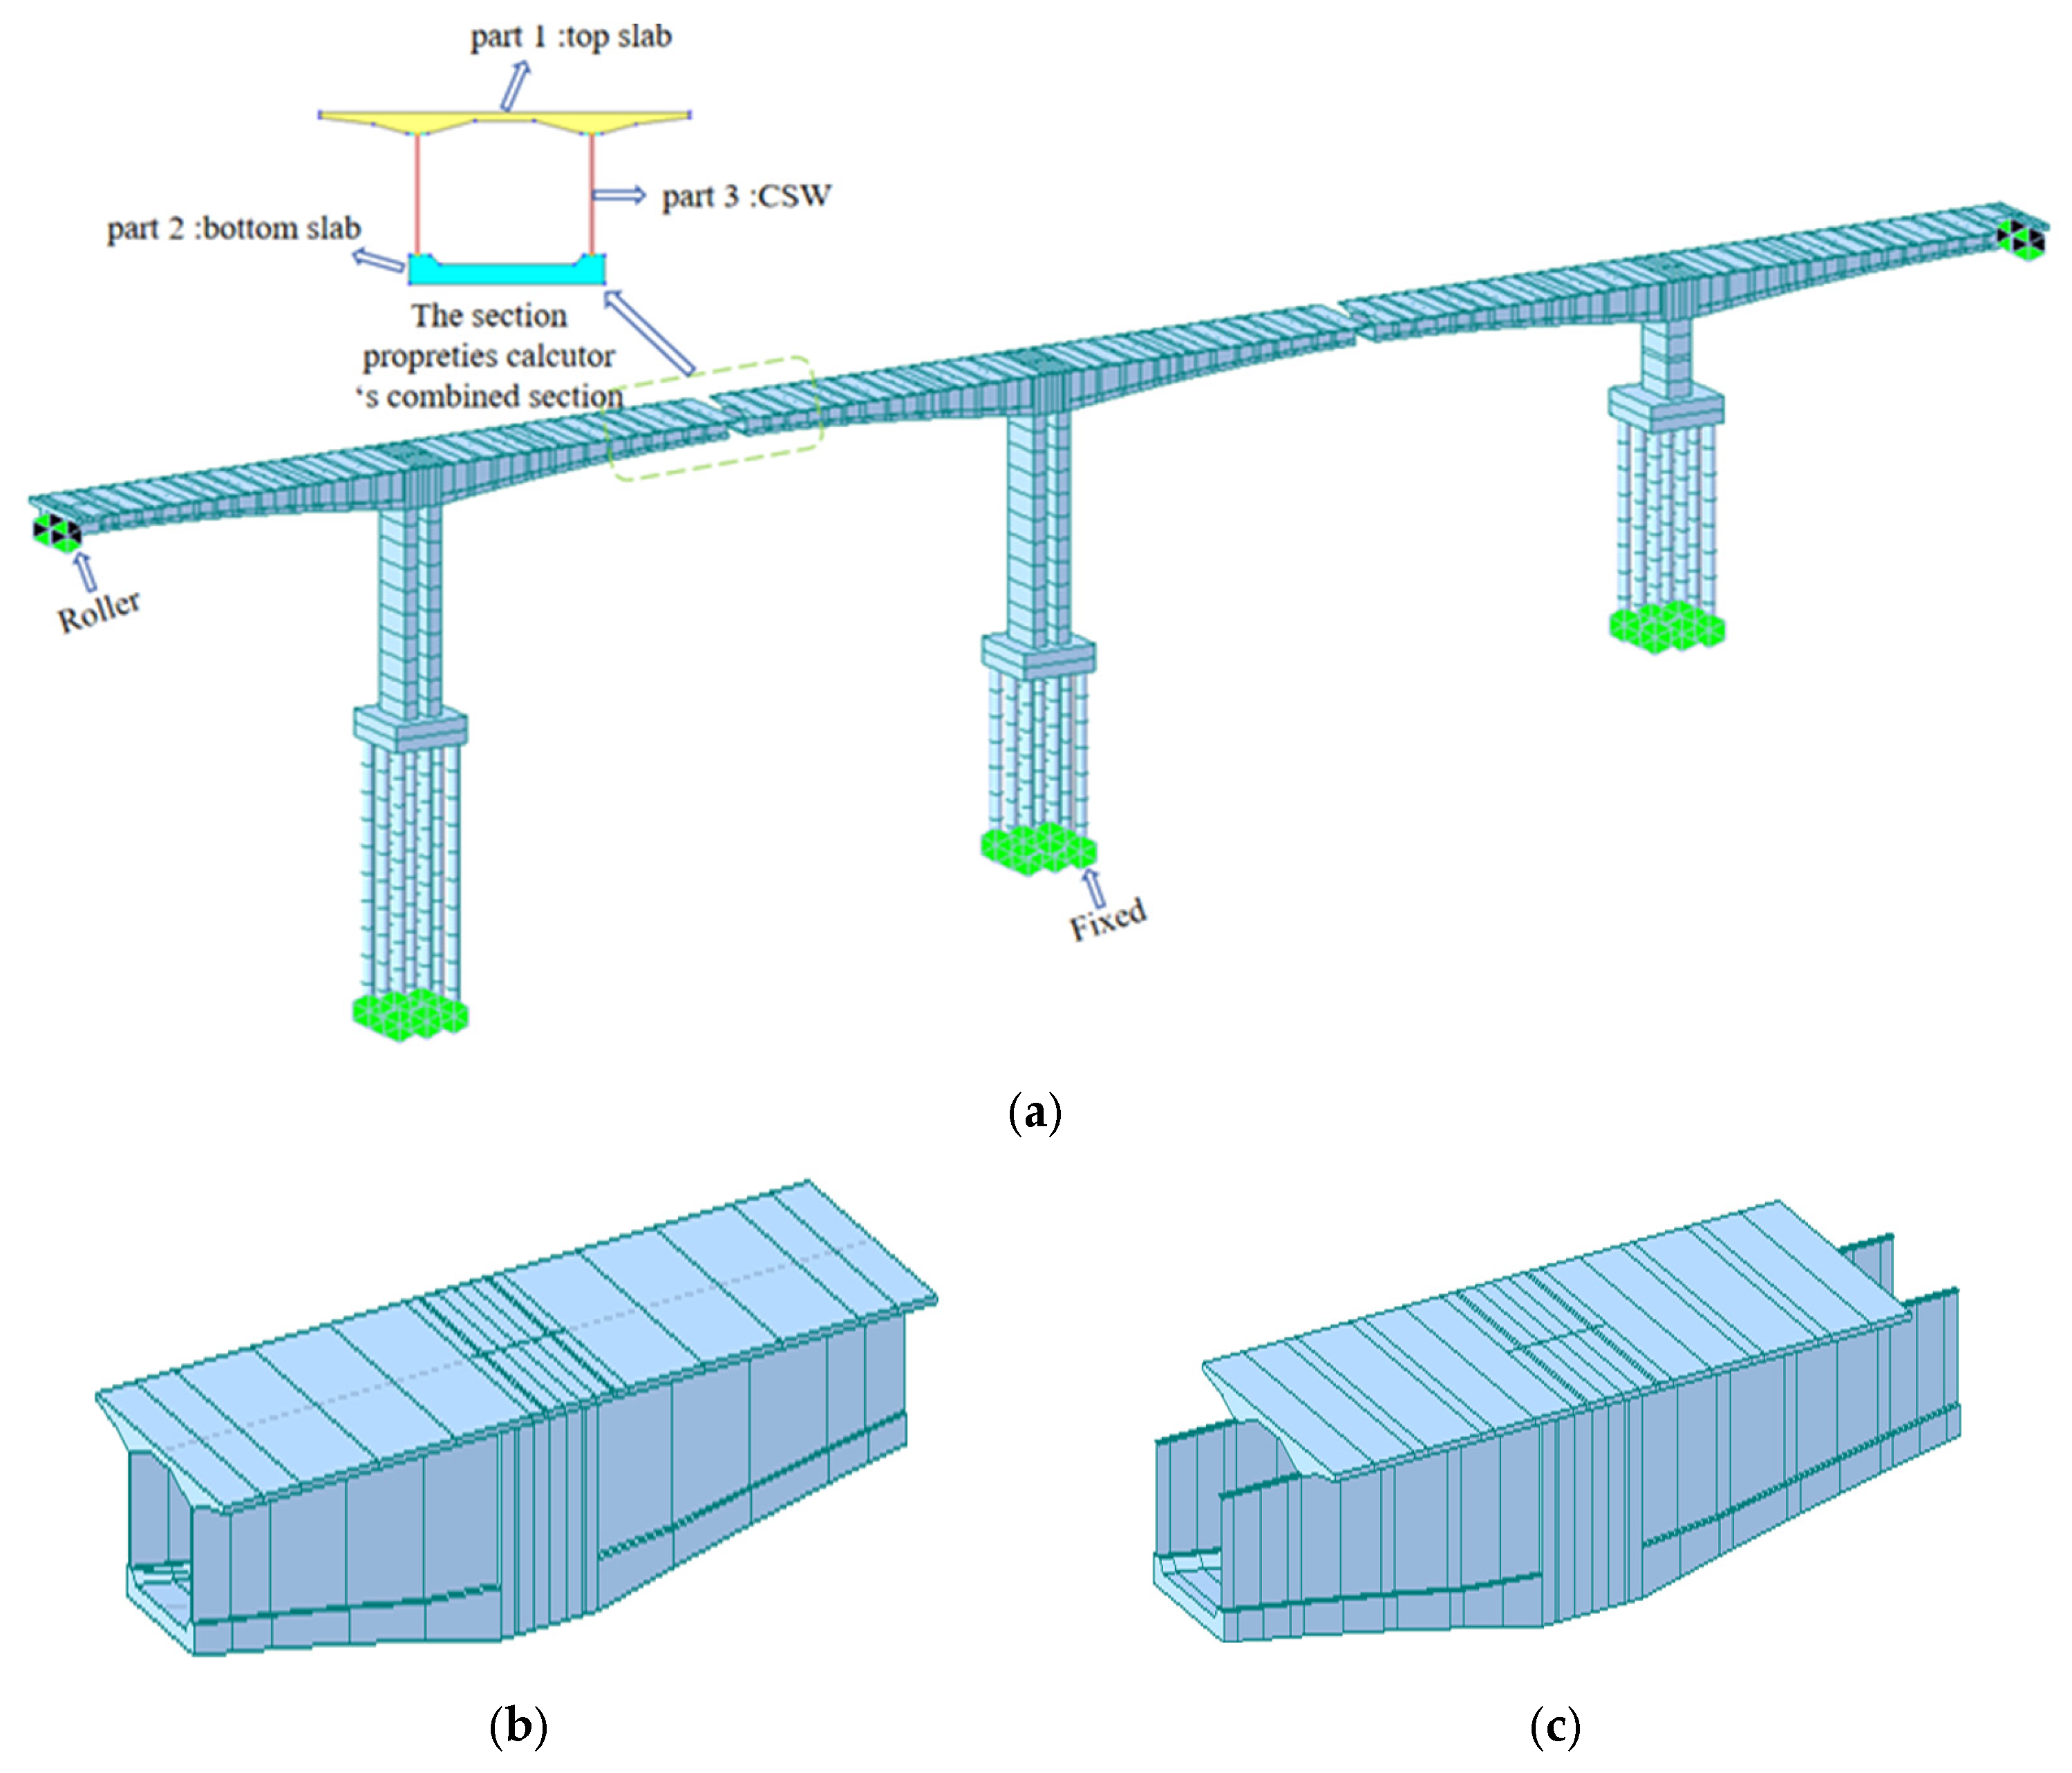
4.2. Finite Element Model

The cantilever construction processes for both APC and TBCC were simulated using FE software—Midas Civil 2019 v [2.1]. Key modeling assumptions include the following:
  • Non-structural elements (e.g., formwork, diaphragms) were simplified as concentrated or linear loads.
  • Identical geometric parameters, prestressing tendons, material properties, and boundary conditions were maintained for both models.
Primary differences between models consisted of
  • Hanging basket loads (45 t for APC vs. 100 t for TBCC).
  • Construction stage definitions.
The construction sequence was divided into 18 distinct stages:
  • Stage 1: construction of Segment 0#.
  • Stage 2: cast-in-place construction of Segment 1#.
  • Stages 3–18: cantilever construction of standard Segments 2#–9#.
For APC modeling, each standard segment construction was further divided into
  • Wet concrete pouring phase;
  • Prestressing tendon tensioning phase.
The APC process was simulated using the FE software Midas Civil 2019 v [2.1], with the global bridge model was meshed with 524 nodal points and 478 finite elements according to its structural configuration, as illustrated in Figure 7a. The corrugated steel webs were equivalently converted into flat steel plates based on equivalent stiffness [6]. A fixed boundary condition is applied at the pier bases, with rigid connections established at the pier-to-girder interfaces, complemented by roller-supported end conditions for the side spans. It should be noted that when modeling the composite section with CSWs, special consideration must be given to APC, which differs from TBBC. Since different components of the cross-section are activated at various construction stages, the section properties calculator in Midas Civil must be utilized to define the geometric dimensions and material properties of each constituent part, and the composite section components are assigned to different construction phases and activated sequentially using Midas Civil’s built-in construction stage joint section functionality. Figure 7b,c shows the completed finite element models for both construction methods. Table 2 summarizes the key mechanical properties used in the finite element models.

4.3. Validation of APC Finite Element Model

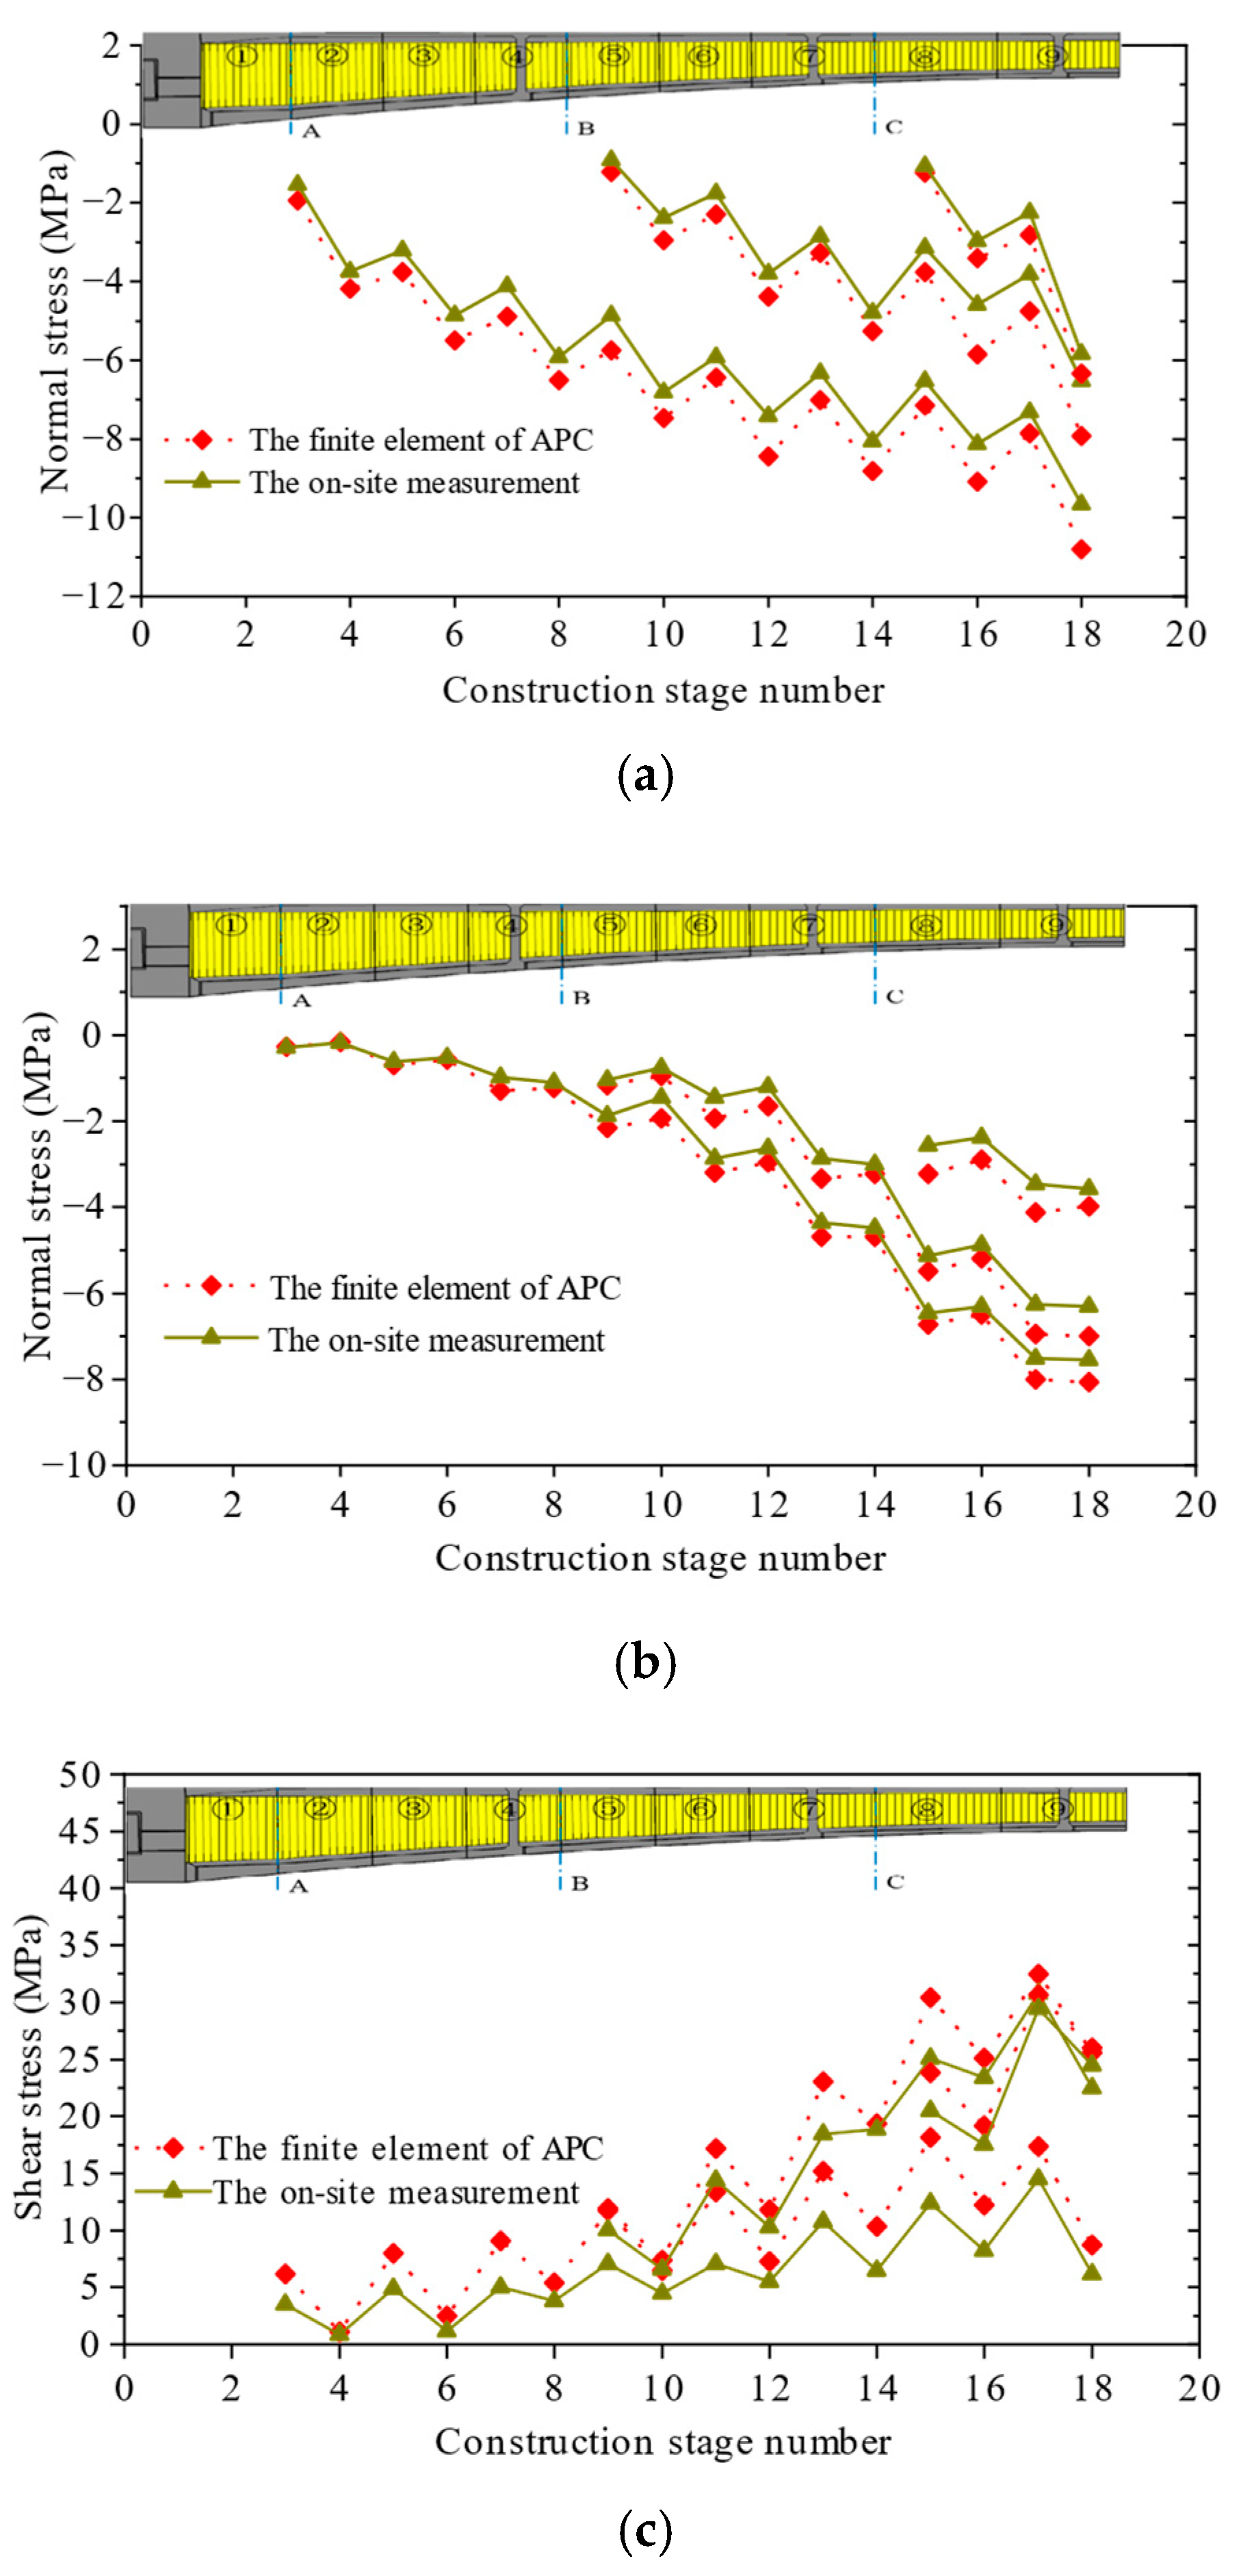
4.3.1. Structural Stress

Figure 8 demonstrates excellent agreement between the finite element analysis results and field measurements during the cantilever construction stage. The normal stresses in both top and bottom slabs show characteristic cyclic variations under the alternating effects of pouring wet concrete and subsequent prestressing operations. Each prestressing application increases top slab compressive stresses while reducing bottom slab compressive stresses, whereas pouring wet concrete produces the opposite effect, with more pronounced variations observed in the top slabs. The shear stresses of CSW exhibit a stepwise increase pattern throughout construction, where the stress increment induced by concrete placement exceeds the reduction caused by prestressing at each construction stage, resulting in a net cumulative increase in shear stresses over the entire cantilever construction process.
During cantilever construction, field measurements of top slab compressive stress for the APC method demonstrate close agreement with finite element analysis results, showing maximum deviations ≤ 1.2 MPa. The normal stresses at section C of both bottom slabs reach their maximum differential value of approximately 0.5 MPa after the concrete pouring of Segment 8.
Notably, the measured shear stress in section A is 18.11 MPa and the on-site measured value at section A’s web maximum shear stress is 19.49 MPa, with a difference of 7.6% between the two. In sections B and C, excluding specific operational conditions at CSW shear stress measurement points, the maximum discrepancy between FE model using APC and field measurements reached approximately 4.6 MPa, corresponding to an 18.4% relative error. This variation primarily stems from multiple influencing factors including ambient temperature fluctuations, variable construction loading conditions, and potential measurement inaccuracies in strain gauge instrumentation. All shear stress values are significantly lower than the design shear strength (170 MPa), demonstrating compliance with specification requirements. This finding suggests that intensive monitoring of CSW shear stresses may not be necessary during cantilever construction stages.
From the comparative analysis between measured values and finite element calculations, it can be concluded that the finite element simulation results show excellent agreement with the field measurements, demonstrating the reliability of the FE model.

4.3.2. Main Girder Deflection

Table 3 presents and compares the deflection results for each section following concrete pouring and prestressing operations from the FE model for APC and field measurements. The data demonstrate that deflection variations in the main girder become progressively more pronounced with increasing cantilever length for both evaluation methods.
Both the finite element analysis for APC and field measurements record their peak deflections after Segment 8 pouring, measuring 20.7 mm and 22.5 mm, respectively. This difference occurs because the APC method requires only top slab concrete placement at the maximum cantilever segment (Segment 9), resulting in marginally reduced deflection compared to Segment 8.
The analysis reveals strong agreement between finite element predictions for APC and field-measured deflections following concrete pouring operations. However, observed deflections during post-tensioning typically measure slightly lower than APC model predictions, primarily due to practical construction factors such as potential grouting deficiencies that may cause prestress losses.

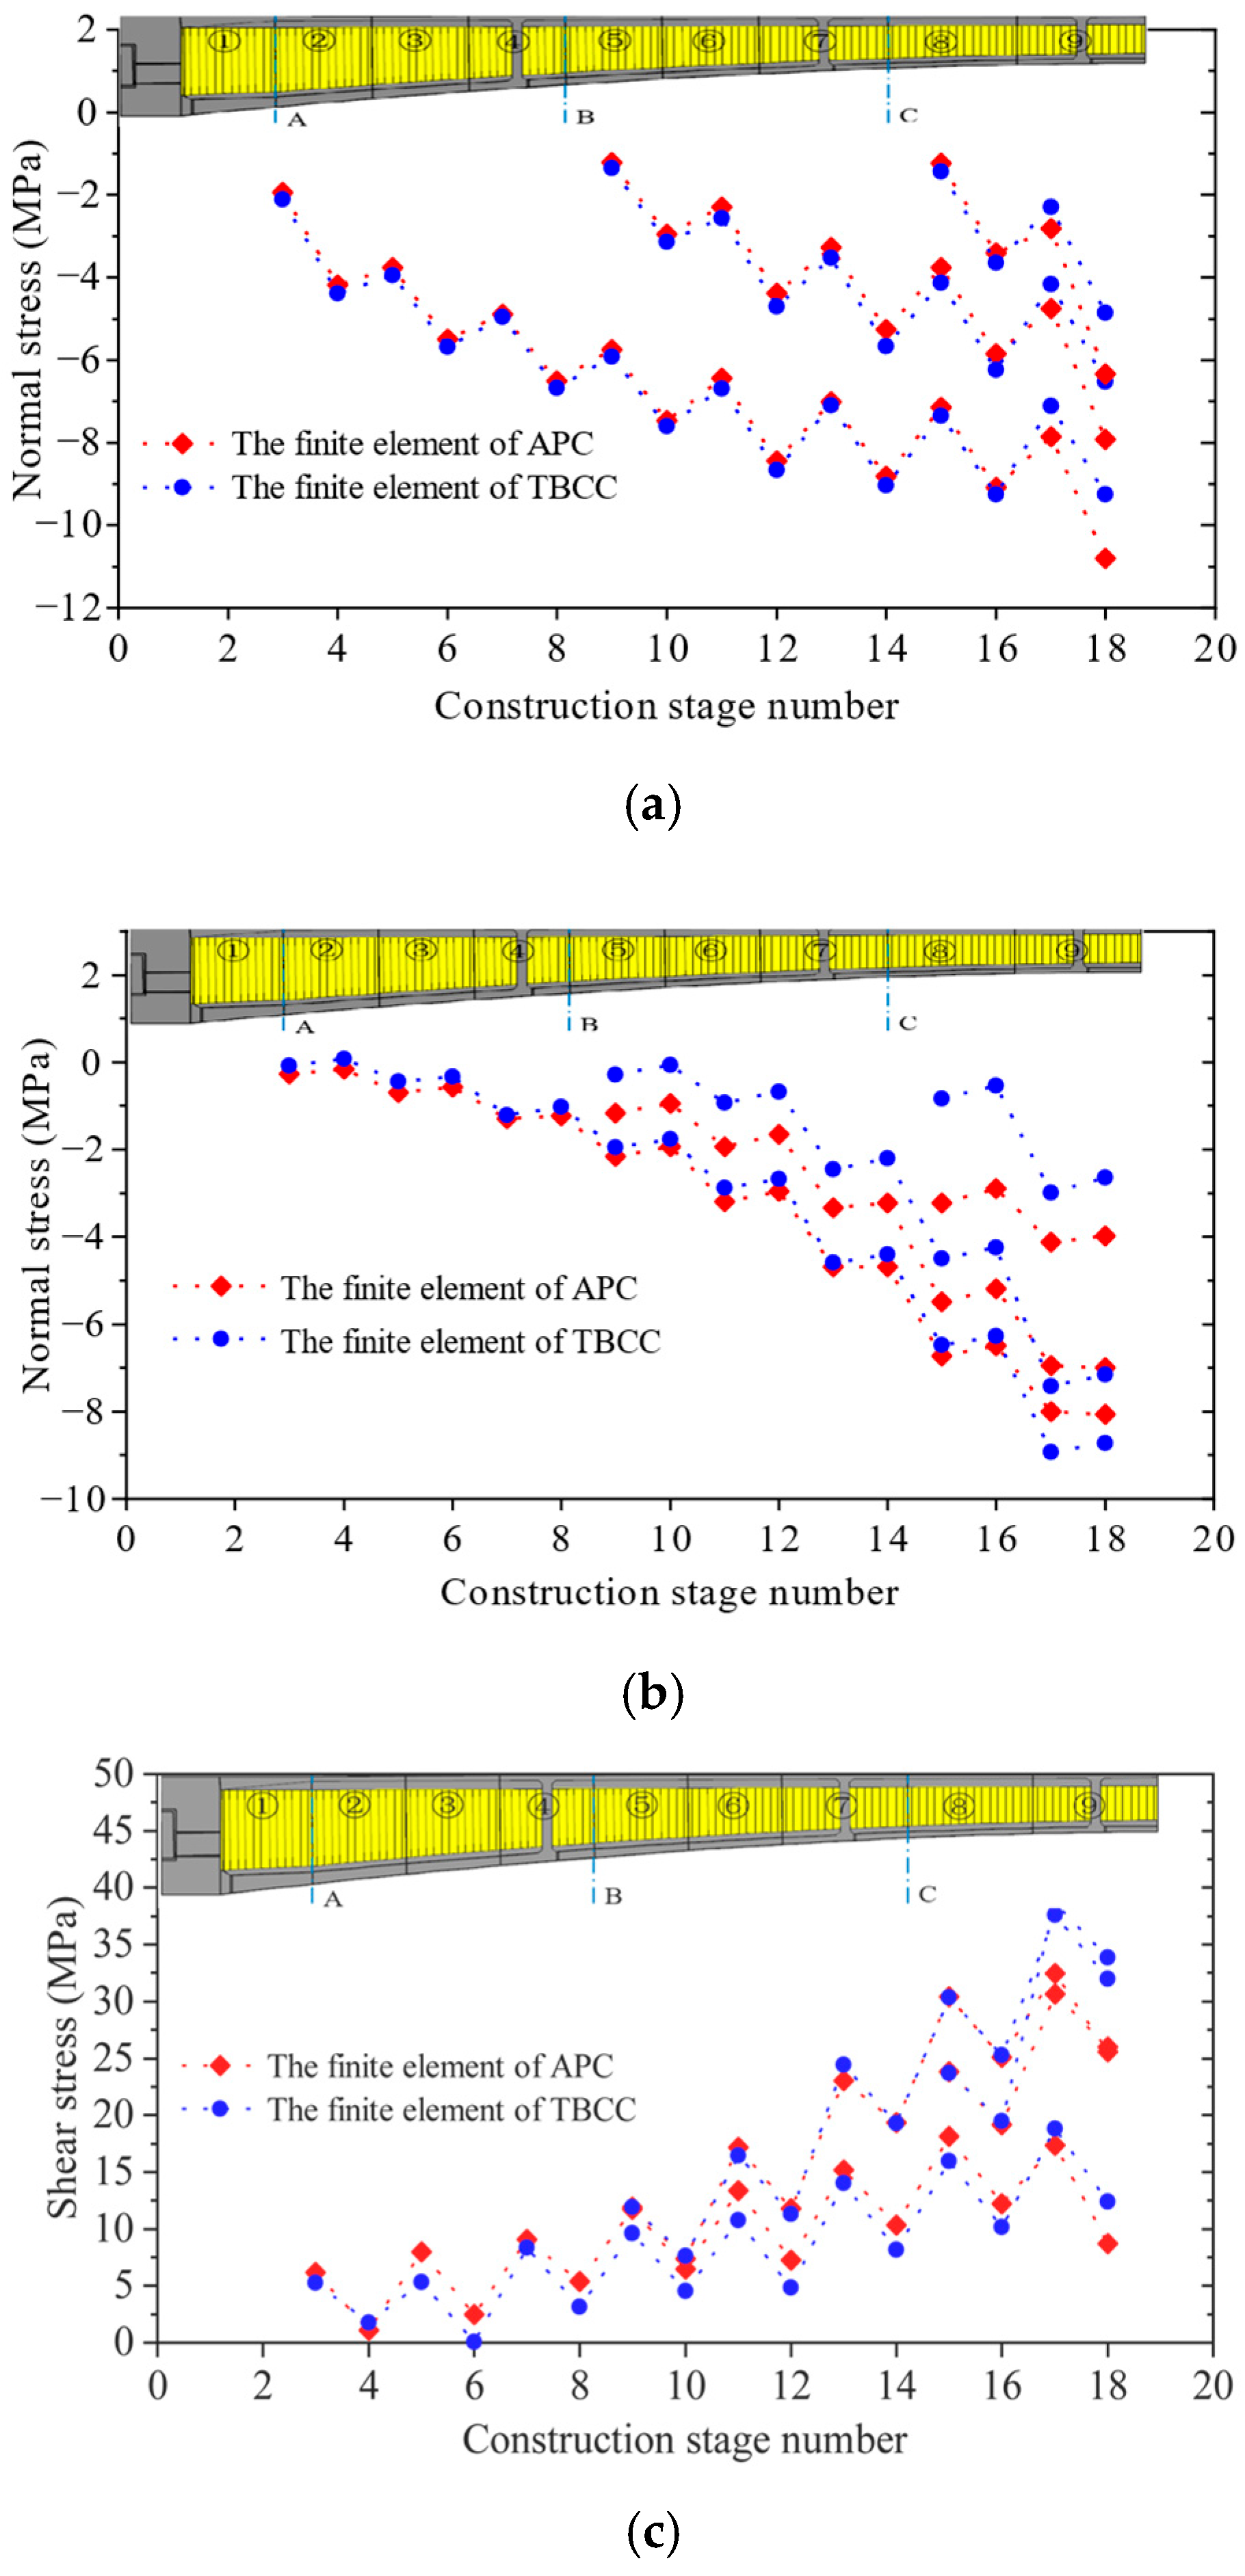
4.4. Comparative Analysis of Stress and Deflection

4.4.1. Normal Stress in Top Slabs

Figure 9a presents the variation in normal stress in the concrete top slab during cantilever construction, comparing results from the APC finite element model and TBBC finite element model. The prestressing effect induces compressive stress in the top slab, with maximum values of 10.80 MPa, 7.92 MPa, and 6.34 MPa for the three critical sections in the APC model. Corresponding values for the TBBC model were 9.25 MPa, 6.34 MPa, and 4.85 MPa. Calculated stresses remained below the design limit of 25.3 MPa, satisfying the specification requirements [40].
During cantilever construction, both construction methods exhibit consistent stress patterns across cross-sections during segment construction: compressive stress decreases following concrete pouring but increases after tendon tensioning. This response confirms that prestressing effects dominate over self-weight effects from cantilever progression, producing greater post-tensioning compressive stresses than those induced by wet concrete weight alone. Consequently, top slab compressive stress progressively increases with cantilever extension.
The APC method’s three active working platforms (N − 1, N, and N + 1) incorporate more N-section bottom slab and N + 1-section CSW components than TBBC, resulting in lower top slab compressive stresses. During early construction stages, the APC’s greater bottom slab concrete volume produces shorter effective segment lengths in TBBC, reducing both (1) tensile stresses from hanging basket and wet concrete loads on the top slab and (2) compressive stresses from bottom slab effects.
In later construction phases, the TBBC’s heavier hanging basket reduces bending moment differences between two methods, causing convergence of top slab tensile stress magnitudes. Both methods ultimately demonstrate similar top compressive stress development trends with comparable variation amplitudes, all remaining within specified allowable limits.

4.4.2. Normal Stress in Bottom Slabs

Figure 9b presents the development of bottom slab compressive stresses during cantilever construction, comparing results from the APC and TBBC finite element models. The bottom slabs in sections A~C consistently experienced compressive stresses. The finite element analysis yielded maximum compressive stresses of 8.06 MPa, 7.00 MPa, and 4.12 MPa for A~C sections using APC, with stresses of 8.93 MPa, 7.42 MPa, and 2.99 MPa using TBBC, all below the 25.3 MPa design limit and compliant with specifications.
For sections 1–8, APC induces greater bottom slab compressive stress than TBBC. This relationship reverses in section 9 (largest cantilever segment), where TBBC produces higher stresses. Post-tensioning of Segments 1–8 results in more stable stress variations in APC compared to TBBC.
These findings demonstrate that APC provides superior structural stiffness during cantilever construction; wet concrete pouring dominates bottom slab stress development more significantly than tendon tensioning effects; and APC exhibits more gradual stress variations, confirming its technical advantages over TBBC.
Both methods show fundamentally similar compressive stress development patterns in the bottom slab, validating their engineering applicability while highlighting APC’s superior performance characteristics.

4.4.3. Shear Stress of CSWs

Figure 9c illustrates the development of shear stresses in CSWs throughout the construction process, comparing results from the FE model using APC or TBBC. The maximum shear stresses at sections A–C obtained from the FE model using APC are 18.11 MPa, 30.67 MPa, and 32.48 MPa, respectively, and from the FE model using TBBC are 18.83 MPa, 38.62 MPa, and 37.60 MPa, respectively.
The finite element analysis for APC demonstrated CSW stress variation magnitudes of 17.01 MPa, 25.08 MPa, and 11.49 MPa across the complete cantilever construction sequence. By comparison, the finite element results for TBBC exhibited corresponding variation magnitudes of 18.77 MPa, 31.02 MPa, and 19.16 MPa. This comparative analysis clearly indicates that the APC method produces comparatively more moderate CSW shear stress fluctuations during construction.

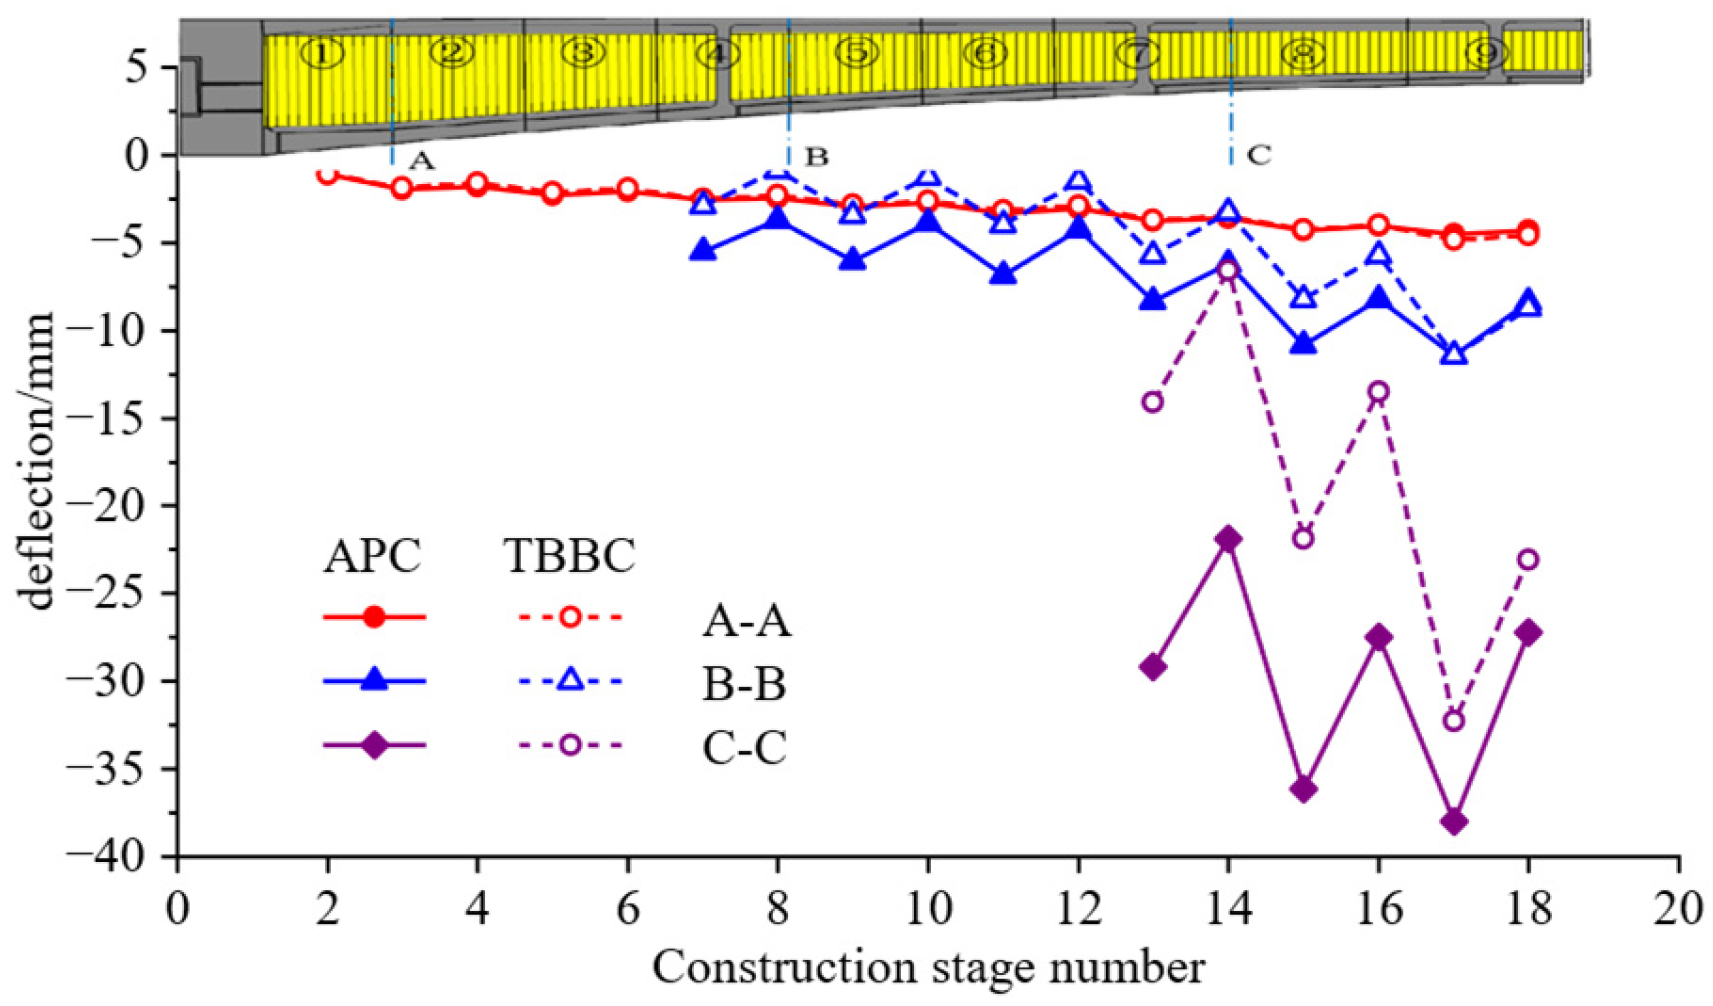
4.4.4. Deflection of the Main Girder

Figure 10 presents the development of deflection at corresponding cross-sections during construction stages, comparing the APC finite element model with the TTBC finite element model. The maximum deflections at three critical sections obtained from APC finite element analysis are 4.6 mm, 11.5 mm, and 38.0 mm, respectively, while those from TTBC are 4.8 mm, 11.5 mm, and 32.3 mm, respectively.
During individual cantilever segment construction, both methods show similar deflection behavior: the deflection increases after wet concrete pouring and decreases upward when prestressing is applied. The deflection patterns converge as the cantilever extends, with minimal differences observed near the pier (where deflections differ by less than 2 mm) but increasingly significant discrepancies developing toward the cantilever tip (reaching 5.7 mm difference at the farthest section). This behavior stems from accumulated displacement effects—longer segments experience greater cumulative displacements, thereby amplifying the deflection differences at cantilever ends while maintaining comparable behavior near supports.

5. Simple Calculation for APC in Cantilever Construction Stage

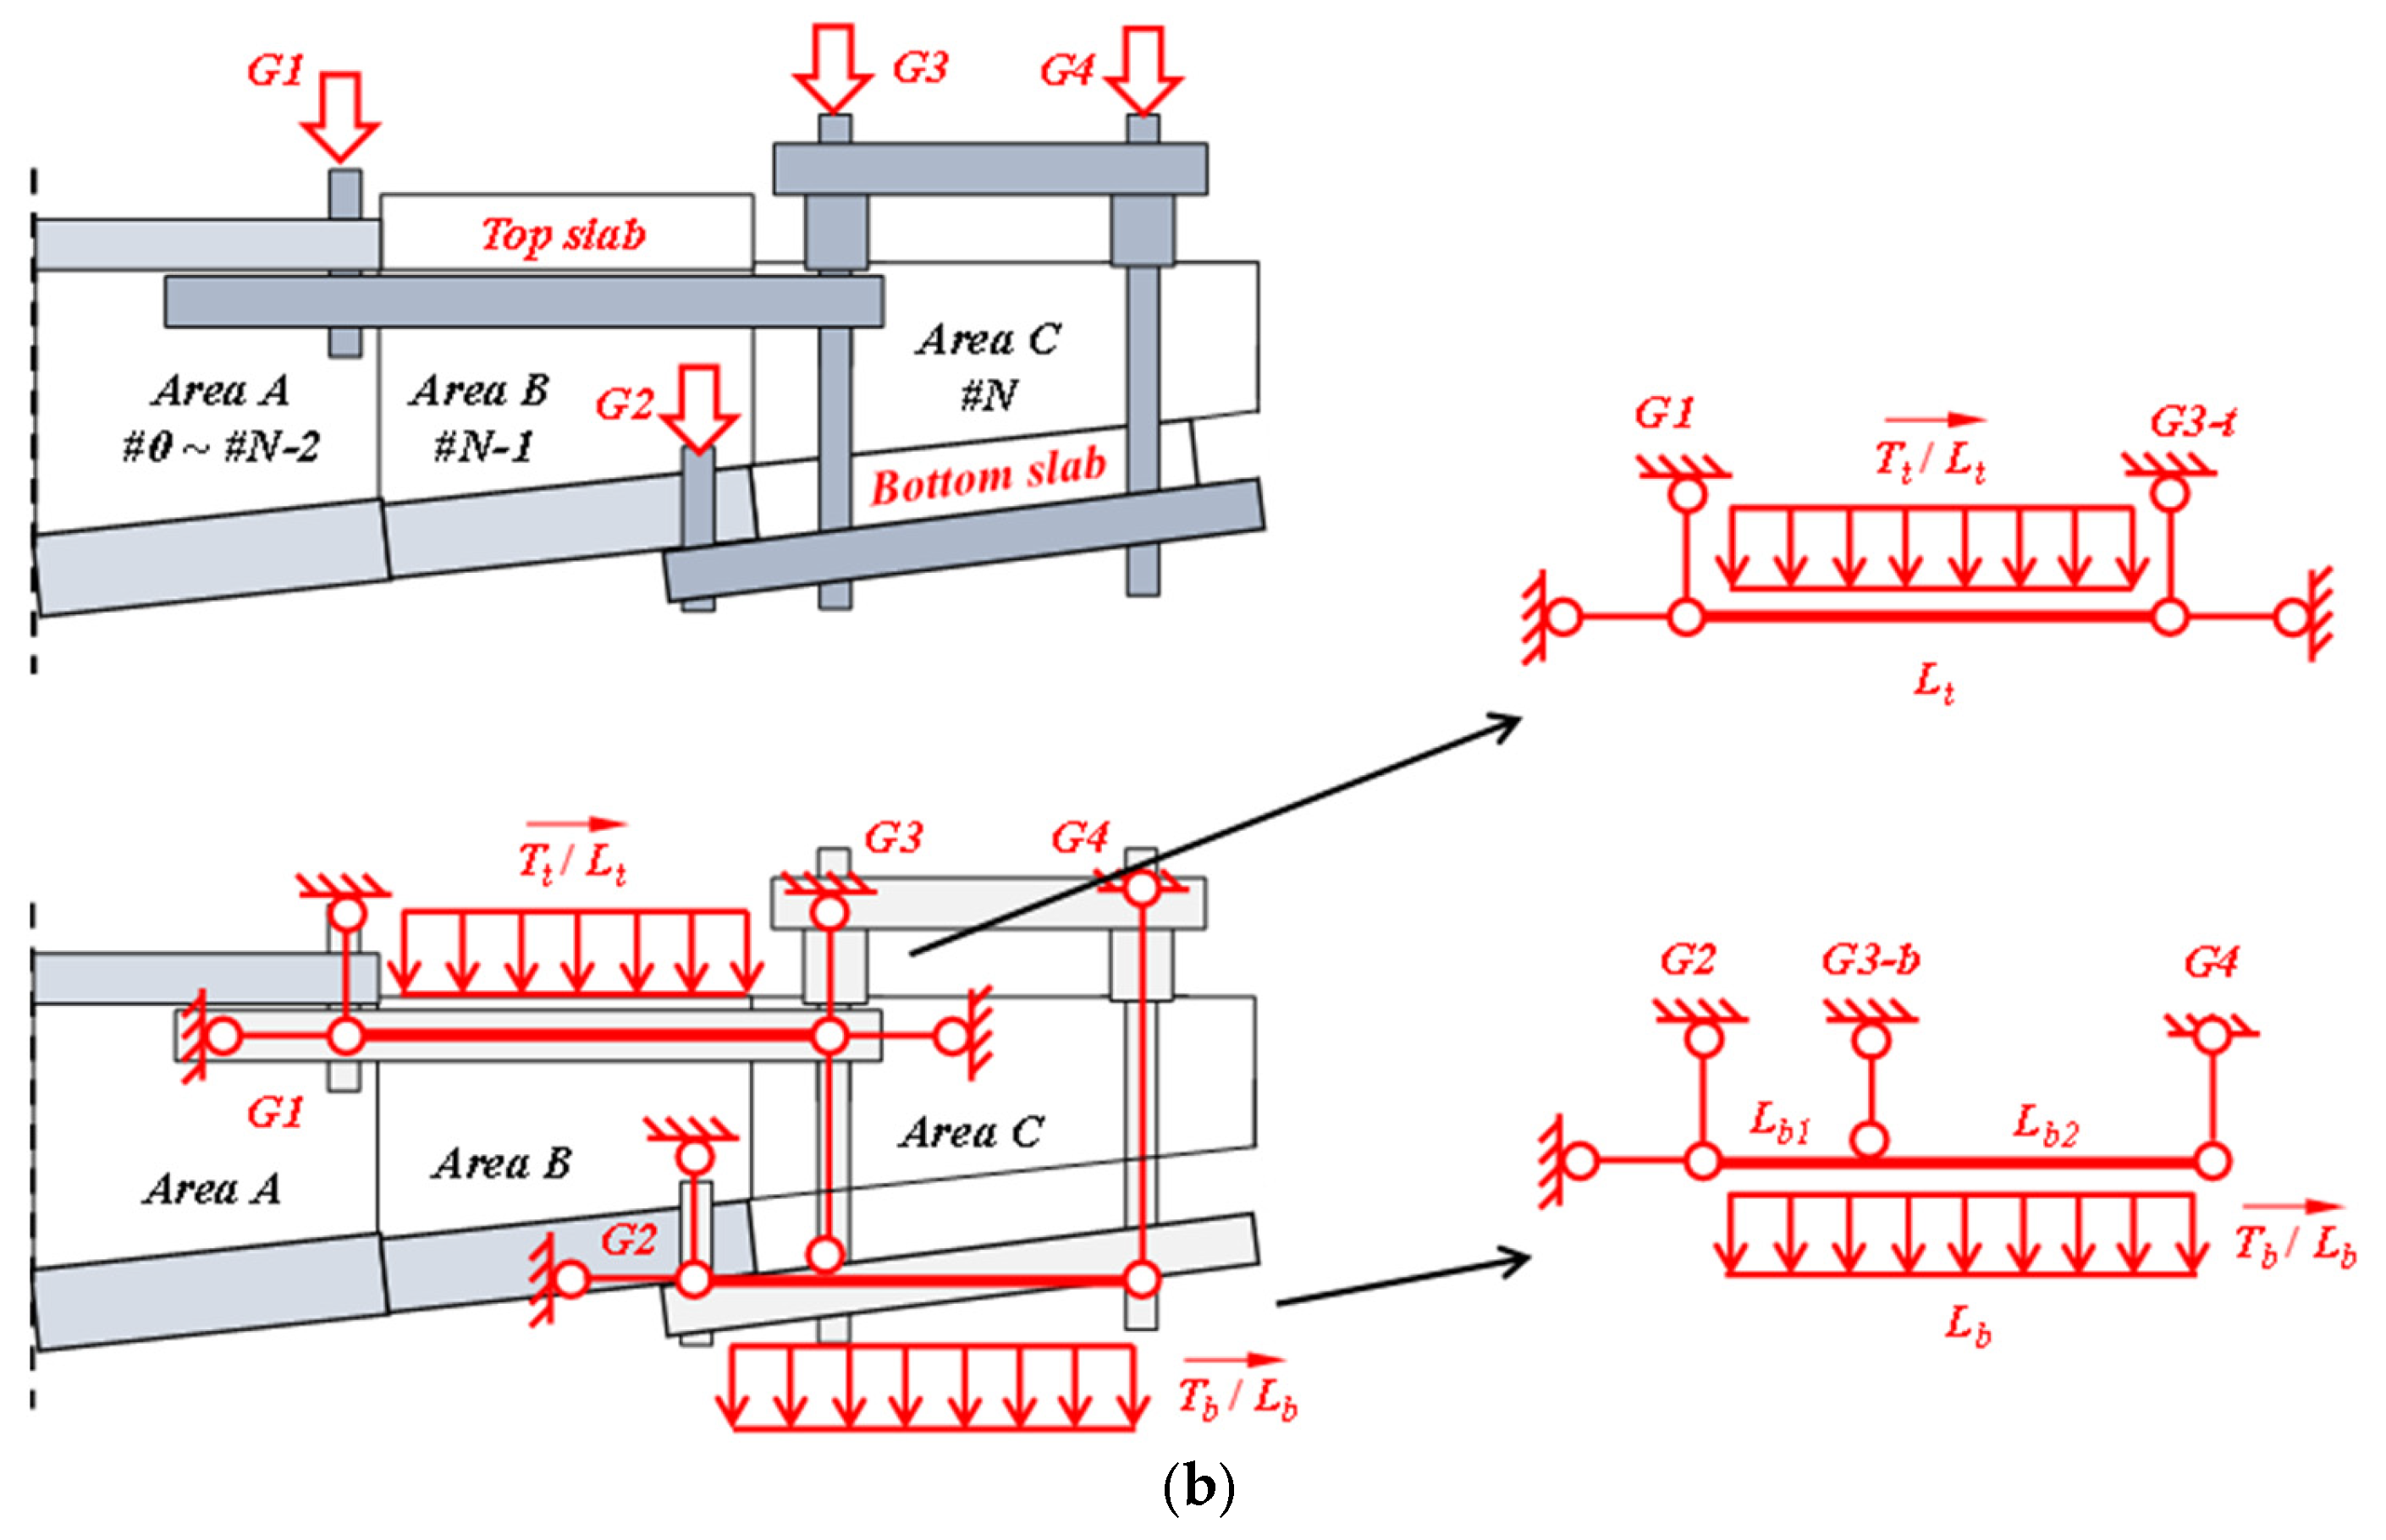
5.1. Asynchronous Cantilever Structure Partition

The asynchronous cantilever structure comprises three distinct regions (Figure 11): a full-composite segment, U-shaped segment, and cantilever web segment. Thus, the hanging basket loading configuration involves two operational states: State 1, prior to basket advancement, and State 2, following basket advancement (during wet concrete pouring).
The support points G1 and G2 are anchored at the ends of Area A and Area B, respectively. The construction loads (including the weight of t concrete and the self-weight of the hanging basket) are distributed as a uniformly distributed load and transmitted to the cantilever segments through the hanging basket support points G1 to G4. Assuming the construction loads on the top slab of segment N 1 and the bottom slab of segment N are Tt and Tb, respectively, the supports G1~G4 can be equivalently treated as fixed hinge bearings; this allows the calculation of equivalent concentrated forces for each support point. So G1~G4 which can be calculated by Equation (1):
G 1 = 1 2 T t G 2 = T b 8 L b L b 1 3 L b 1 2 L b 2 2 + L b 1 L b 2 G 3 = G 3 t + G 3 b = 1 2 T t + 1 8 T b 1 + L b 2 L b 1 L b 2 G 4 = T b 8 L b L b 2 3 L b 2 2 L b 1 2 + L b 1 L b 2
where G1 is the top slab anchor force; G2 is the bottom slab anchor force; G3 is the rear support force; G4 is the front support force; Gt is the wet weight of the top slab; and Gb represents the wet weight of the bottom slab.

5.2. Calculation Assumption

The simplified calculation method adopts the following fundamental assumptions:
(1)
Cross-section simplification:
  • The variable composite cross-section segment is idealized as an equivalent uniform cross-section one.
  • Simpson’s integration formula is employed, dividing the composite region into an even number of segments to compute the equivalent moment of inertia.
  • Both U-shaped and cantilever web segments, owing to their limited lengths, are treated as uniform cross-section beams for moment of inertia calculations.
(2)
Bending behavior considerations:
  • Corrugated steel webs (CSWs) are assumed to contribute negligibly to bending resistance.
  • Composite segment region: only concrete top and bottom slabs are considered for bending strength.
U-shaped segment region: bending stiffness incorporates the concrete bottom slab plus CSW upper and lower flanges.
Cantilever web segment: bending stiffness accounts solely for CSW upper and lower flanges.
(3)
Shear stress distribution:
  • Uniform shear stress distribution across the cross-section is assumed.
(4)
Load application:
  • All applied loads are converted into equivalent concentrated forces and bending moments.
These loads are applied at their respective structural locations.
(5)
Material behavior:
  • The structure remains entirely within the elastic deformation range.
  • A perfect bond condition exists between concrete slabs and CSWs (no interfacial slip).
(6)
Decomposition of deformations:
  • No interaction between bending and shear deformations is considered.
  • Total deflection represents the linear superposition of both bending and shear deformation components.

5.3. Structural Stress Calculation

5.3.1. Normal Stress in Concrete Slabs

The CSWs exhibit an accordion effect, allowing longitudinal contraction under bending moments while providing negligible bending resistance. Therefore, the bending moment from construction loads is assumed to be entirely resisted by the concrete flange slabs.
For the composite region (cross-section shown in Figure 12), the normal stress (σ) in the flange under bending moment (M) and axial force (N) is calculated as
σ 1 = N A + M ( h t y t ) I
where b1 and t1 denote the width and thickness of the top concrete slab, respectively; b2 and t2 denote the width and thickness of the bottom concrete slab, respectively; A represents the cross-sectional area; I is the moment of inertia of the cross-section; and hc1 and ht represent the distances from the neutral axis to the top surface of the top slab and the bottom surface of the bottom slab, respectively.

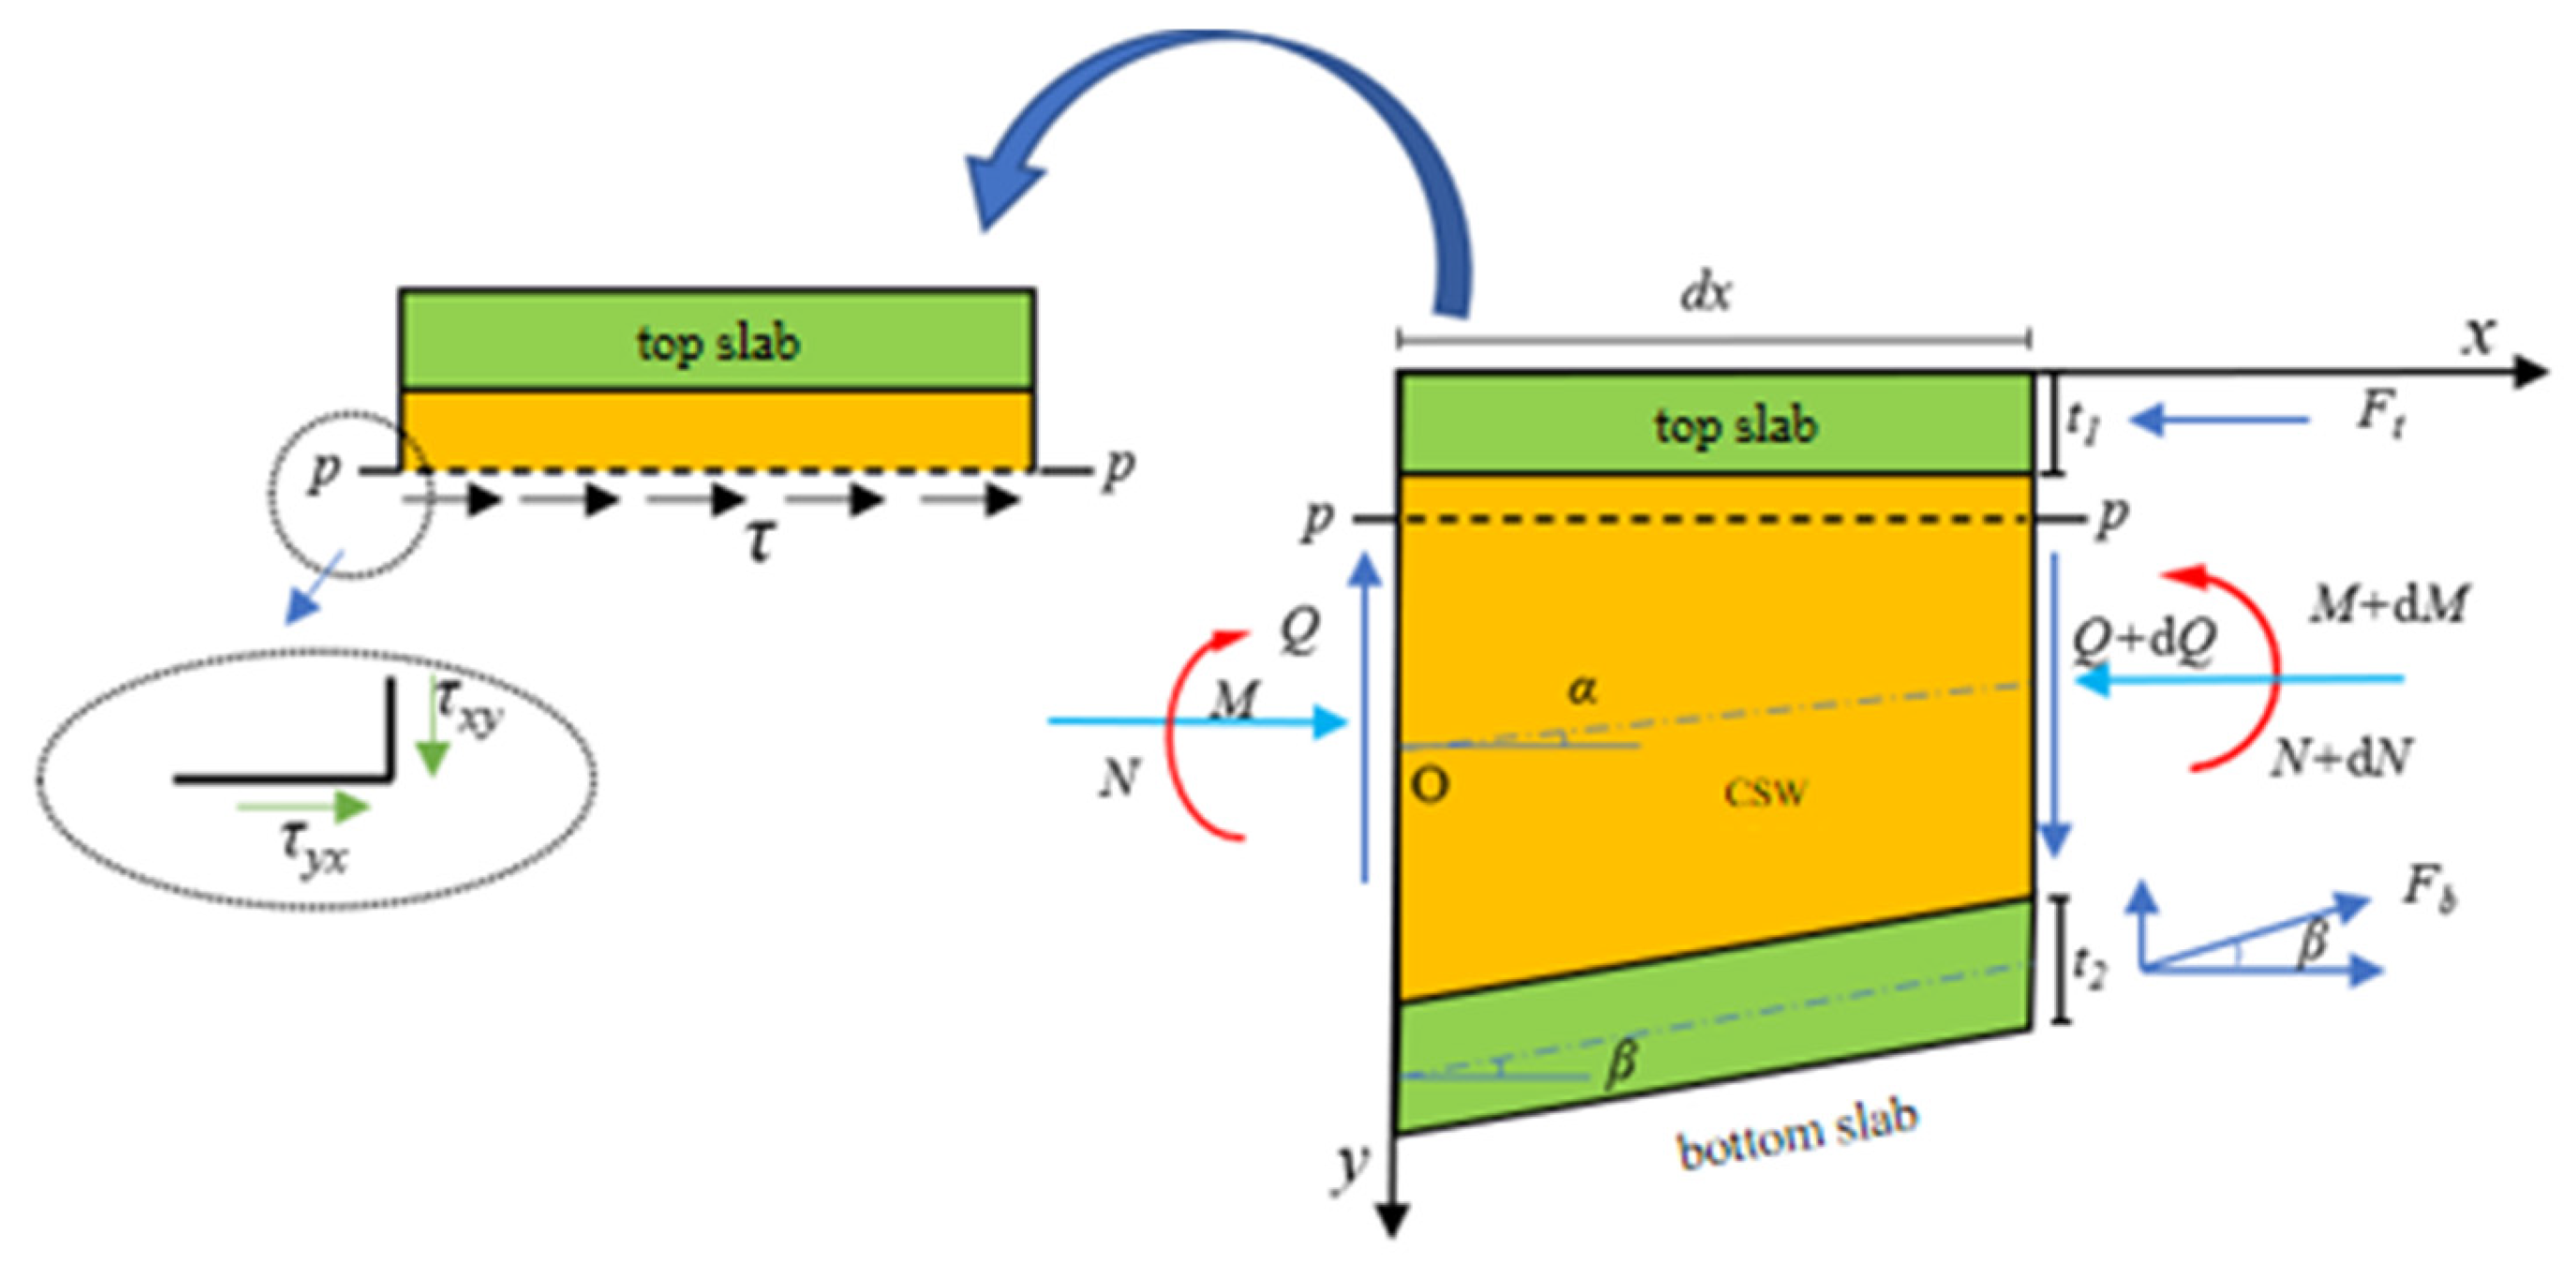
5.3.2. Shear Stress in CSWs

The asynchronous cantilever structure represents a variable cross-section beam where the bottom slab inclination affects the shear stress distribution and carries partial shear force, reducing web shear stress. Figure 13 presents an infinitesimal element extracted from the composite segment region of the asynchronous cantilever structure, analyzed under the following internal force equilibrium conditions: applied bending moment (M); axial force (N), and shear force (Q). The geometric parameters in Figure 13 are defined as follows: α represents the horizontal inclination angle between centroids of end sections, while β denotes the inclination angle of the bottom slab.
Considering moment equilibrium about centroid O of the left end section, the following applies:
d M d x = Q + N tan α
τ = 1 b ( y ) d T d x
where b is the width of the cross-section at the point where shear stress is calculated, and T is the horizontal resultant force above the calculation point.
T = 0 y b ( y ) σ d y = N A p A + M I S p
where Ap is the cross-sectional area above the point where shear stress is calculated; yp is the distance from the calculation point to the top surface of the flange slab; yc is the distance from the centroid of the cross-sectional area; and Sp is the first moment of area Aa with respect to the centroidal axis of the infinitesimal segment cross-section.
Substituting Equation (5) into Equation (4) yields
τ = τ Q + τ M + τ N
τ Q = Q S p I b
τ N = N b ( 1 A d A p d x A p A 2 d A d x + S p I tan α )
τ M = M I b ( d S p d x S t I d I d x )
Equations (5)–(8) represent the shear stress formula for variable cross-section beams, showing contributions from shear force, axial force, and bending moment.
For web locations, t1 < y < ht2, there is
d A d x = b 2 d t 2 d x
d h t d x = tan α
d I d x = 2 b 1 t 1 ( h t t 1 2 ) d h d x + b 2 ( h b t 2 ) 2 d t b d x = 2 S 1 d h d x + 2 S 1 d t b d x
Substituting Equations (9)–(11) into Equations (7) and (8) gives
τ N = N t w ( A p A 2 b 2 d t 2 d x + S p I tan α )
τ M = b 2 t 2 tan α 2 S t I ( S t d h d x + S 1 d t 2 d x )
Area integration of shear stress components yields
A τ Q d A = Q
A τ N d A = 0
A τ M d A = 0
The analysis demonstrates that shear stresses resulting from both the axial force and bending moment form a self-equilibrating force system [41]. When subjected to bending moment, the top slab experiences purely horizontal tensile stress, the inclined lower flange develops inclined compressive stress, and the vertical component of this compressive stress manifests as shear stress in the bottom slab. Consequently, the bottom flange exhibits non-zero shear stress.
The bottom slab’s shear force equals the algebraic sum of the top slab and web shear force. These two components act in opposing directions. Alternatively, the bottom slab’s shear force can be determined equivalently from the cross-sectional bending moment.
The bending moment M can be represented by an equivalent force couple, comprising Ft acting at the top slab centroid and Fb acting at the bottom slab centroid.
Applying the principle of force equivalence, the horizontal force imposed by M on the bottom slab is given by
F b M = F t M = M ( h 1 2 t 1 1 2 t 2 )
The horizontal force exerted on the bottom slab by the axial force N can be expressed as
F b N = N A b 2 t 2
Given the uniform distribution of shear stress across the web, the corresponding shear stress can be expressed as follows, where Asw is the area of web:
τ = Q w A s w = Q ( F b M + F b N ) A s w

5.4. Deflection Calculation

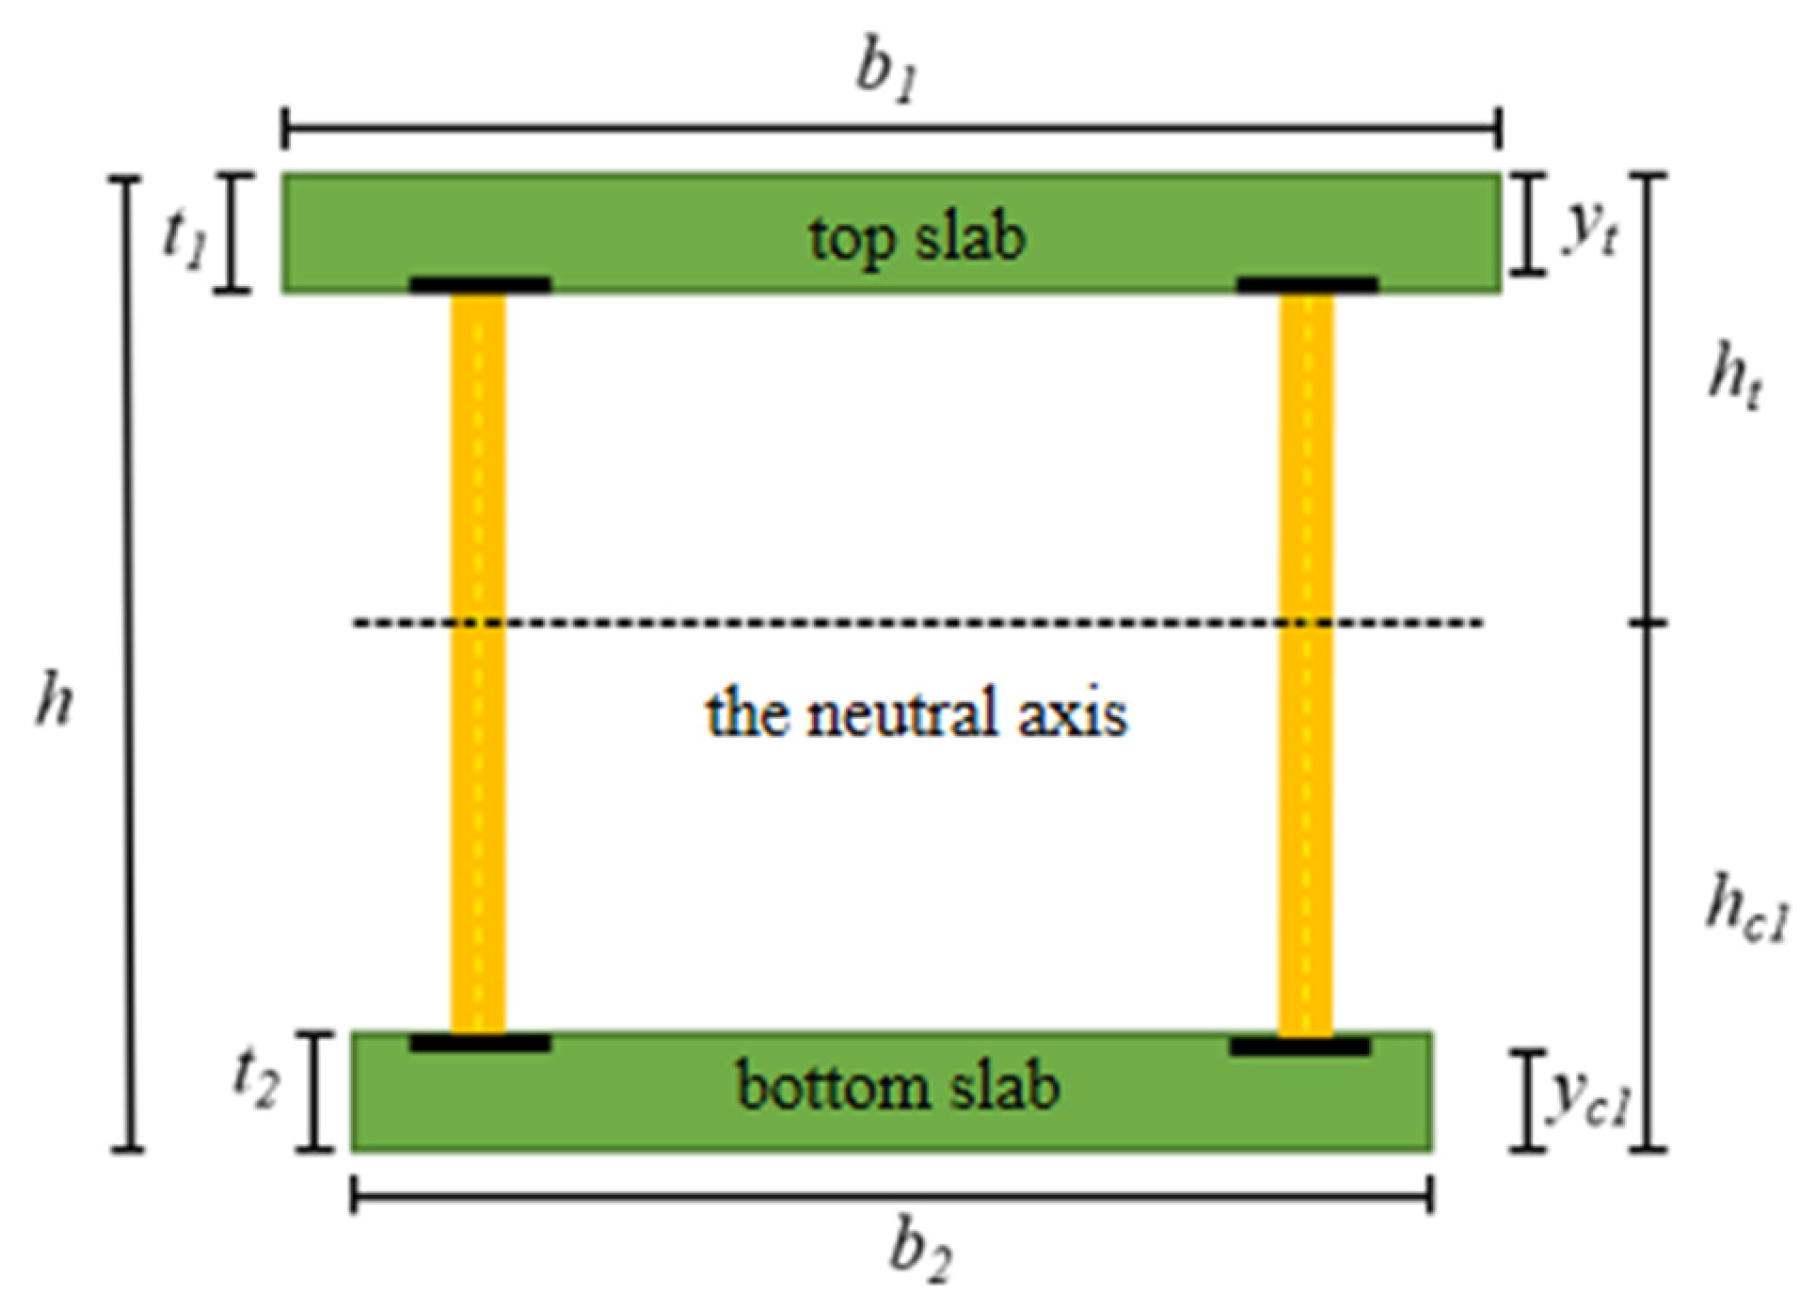
5.4.1. Equivalent Inertia Moment of Asynchronous Cantilever Structure

For clarity in analysis, the structural components are classified as Region A: composite segment; Region B: U-shaped segment; and Region C: cantilever web segment. In Region A, the variable cross-section beam exhibits non-constant moment of inertia distribution along the bridge’s longitudinal axis. To facilitate computation, an equivalent uniform cross-section beam is established following the principle of equivalent bending deformation, and the transformation employs Simpson’s integration formula to convert the non-prismatic section to an equivalent prismatic section. As shown in Figure 14, LA represents the total length of Region A, which is subdivided into n equal segments along the longitudinal axis, while Ii indicates the cross-sectional moment of inertia at nodal point Li.
According to the Simpson integral formula, it can be obtained as
0 L A f L d L L A 3 n [ f ( L 0 ) + 4 × ( f ( L 1 ) + f ( L 3 ) +   + f ( L n 1 ) + 2 × f ( L 2 ) + f ( L 4 ) + +   f ( L n 2 ) ) + f ( L n ) ]
where yi = f (Li) is the value of the integrand f (L) at each point of L = Li, and n must be an even number.
According to this assumption, the construction loads can be equated to moments and concentrated forces acting on the corresponding areas, and the total bending moment at any position Li is given by
M L i = P L i + M P
where P and Mp are the concentrated force and moment at the end position of the combined segment areas.
According to Castigliano’s Second Theorem, the bending deflection δ of a cantilever beam under concentrated force P and moment MP can be written as follows:
δ = 0 L A M L i E I i · M L i P d L i = 0 L A P L i 2 + M P L i E I i d L i
Let f L i = P L i 2 + M P L i E I i , and substitute it into Equation (20); the bending deformation at the end of Region A is calculated as
δ 1 = L A 3 n E 4 H O + 2 H E + P L A 2 + M P L A I n
Based on the deformation calculation formula for prismatic from material mechanics, the bending deformation at the cantilever end can be written as
δ e q = 1 E I C e q ( P L A 3 3 + M L A 2 2 )
Equating the deformations δeq = δ1, the expression for the equivalent moment of inertia ICeq for Region A is calculated as
I C e q = n 2 L A · 2 P L A 3 + 3 M P L A 2 4 H O + 2 H E + P L A 2 + M P L A I n
For Regions B and C, which have shorter lengths, the moment of inertia is taken as the average of the cross-sectional moments of inertia at the two ends.

5.4.2. Deflection Calculation Formula of CSW

The simplified bending deflection calculation diagram is shown in Figure 15, and vertical bending deflection can be obtained by multiplying the Mp diagram with the M1 diagram using diagram multiplication; thus, the bending deflection calculation formula is as follows:
h b = 1 E C I A ( A a W a ) + 1 E C I B ( A b W b ) + 1 E S I S ( A c W c )
where hb is the bending deflection; IA is equivalent inertia moment in the combined segment region; IB is inertia moment of the U-shaped segment; IC is inertia moment of the cantilever web segment; EC and ES are elastic modulus of the concrete and elastic modulus of steel, respectively; and FA, FB, and FC and MA, MB, and MC are the concentrated forces and moments acting on each segment area, respectively. In the Mp diagram, Aa, Ab, and Ac are the corresponding areas in the diagram; in the M1 diagram, Wa, Wb, and Wc are the values of the vertical coordinates of the centroid corresponding to Aa, Ab, and Ac in the Mp diagram, respectively.
The shear deflection calculation formula can be expressed as
h s = F L η G S A
where hs is the shear deflection; GS is the shear modulus of CSWs; η is the reduction factor of the shear modulus of CSWs; and A is the cross-sectional area. The total shear deflection is obtained by summing up the shear deflection of each segment.

5.5. Validation of Calculation Formula

5.5.1. The Stress of Slabs and CSWs

Taking the maximum cantilever segment as a calculation example, the variation in flange normal stress and shear stress of CSWs under different working conditions for a single cycle construction segment is calculated and compared with the calculated values from the Midas Civil model. The calculation results are shown in Table 4, Table 5 and Table 6. As can be seen from these tables, under the working conditions of the hanging basket moving forward and pouring the wet weight of weight, the stress values obtained by the simplified formula are in very good agreement with those obtained from the FE model. In the working condition of tensioning prestress, the discrepancy between the calculated and simulated values may be primarily caused by slight variations in the hanging basket load application points between the two analytical approaches. Overall, the simplified formula for calculating the concrete normal stress still demonstrates satisfactory accuracy.

5.5.2. The Vertical Deflection of CSWs

Taking the construction of the segment with seven top and eight bottom sections as an example, calculate the change in deflection at the front end of the web under four working conditions in a single segment cycle, The cross-section parameters and construction oadings are provided in Table A1 and Table A2 of Appendix A.
The vertical deflection values at the free end of CSWs under different working conditions were obtained by substituting the corresponding load forces and composite section moments of inertia into Equations (27) and (28), and Table 7 presents the comparison between calculated and measured values. The calculated results demonstrate good agreement with measured data under conditions of moving the basket and pouring top and bottom slabs, with deviations of 3.8% and 2.2%, respectively. Under the working condition of tension, a discrepancy of 1.3 mm was observed, which may be attributed to field measurement accuracy or insufficient prestressing tension.

6. Conclusions

This study evaluated the construction costs and environmental impacts of the advanced APC method and examined the structural mechanical behavior and alignment control of the Damogou Bridge during asynchronous construction, combining numerical simulation, field monitoring, and theoretical analysis. The conclusions are as follows:
(1)
The APC method demonstrated significant advantages over TBBC, achieving a 200-ton reduction in steel consumption, shortening the total construction period by 78.5 days (39.5% reduction), and realizing total cost savings of 3.045 million RMB (including both material and labor costs), making it a green and sustainable construction method.
(2)
The analysis of APC reveals that the main girder’s stress distribution and deflection characteristics, resulting from the combined action of self-weight and prestressing effects, demonstrate systematic variations while maintaining compliance with all applicable design specifications.
(3)
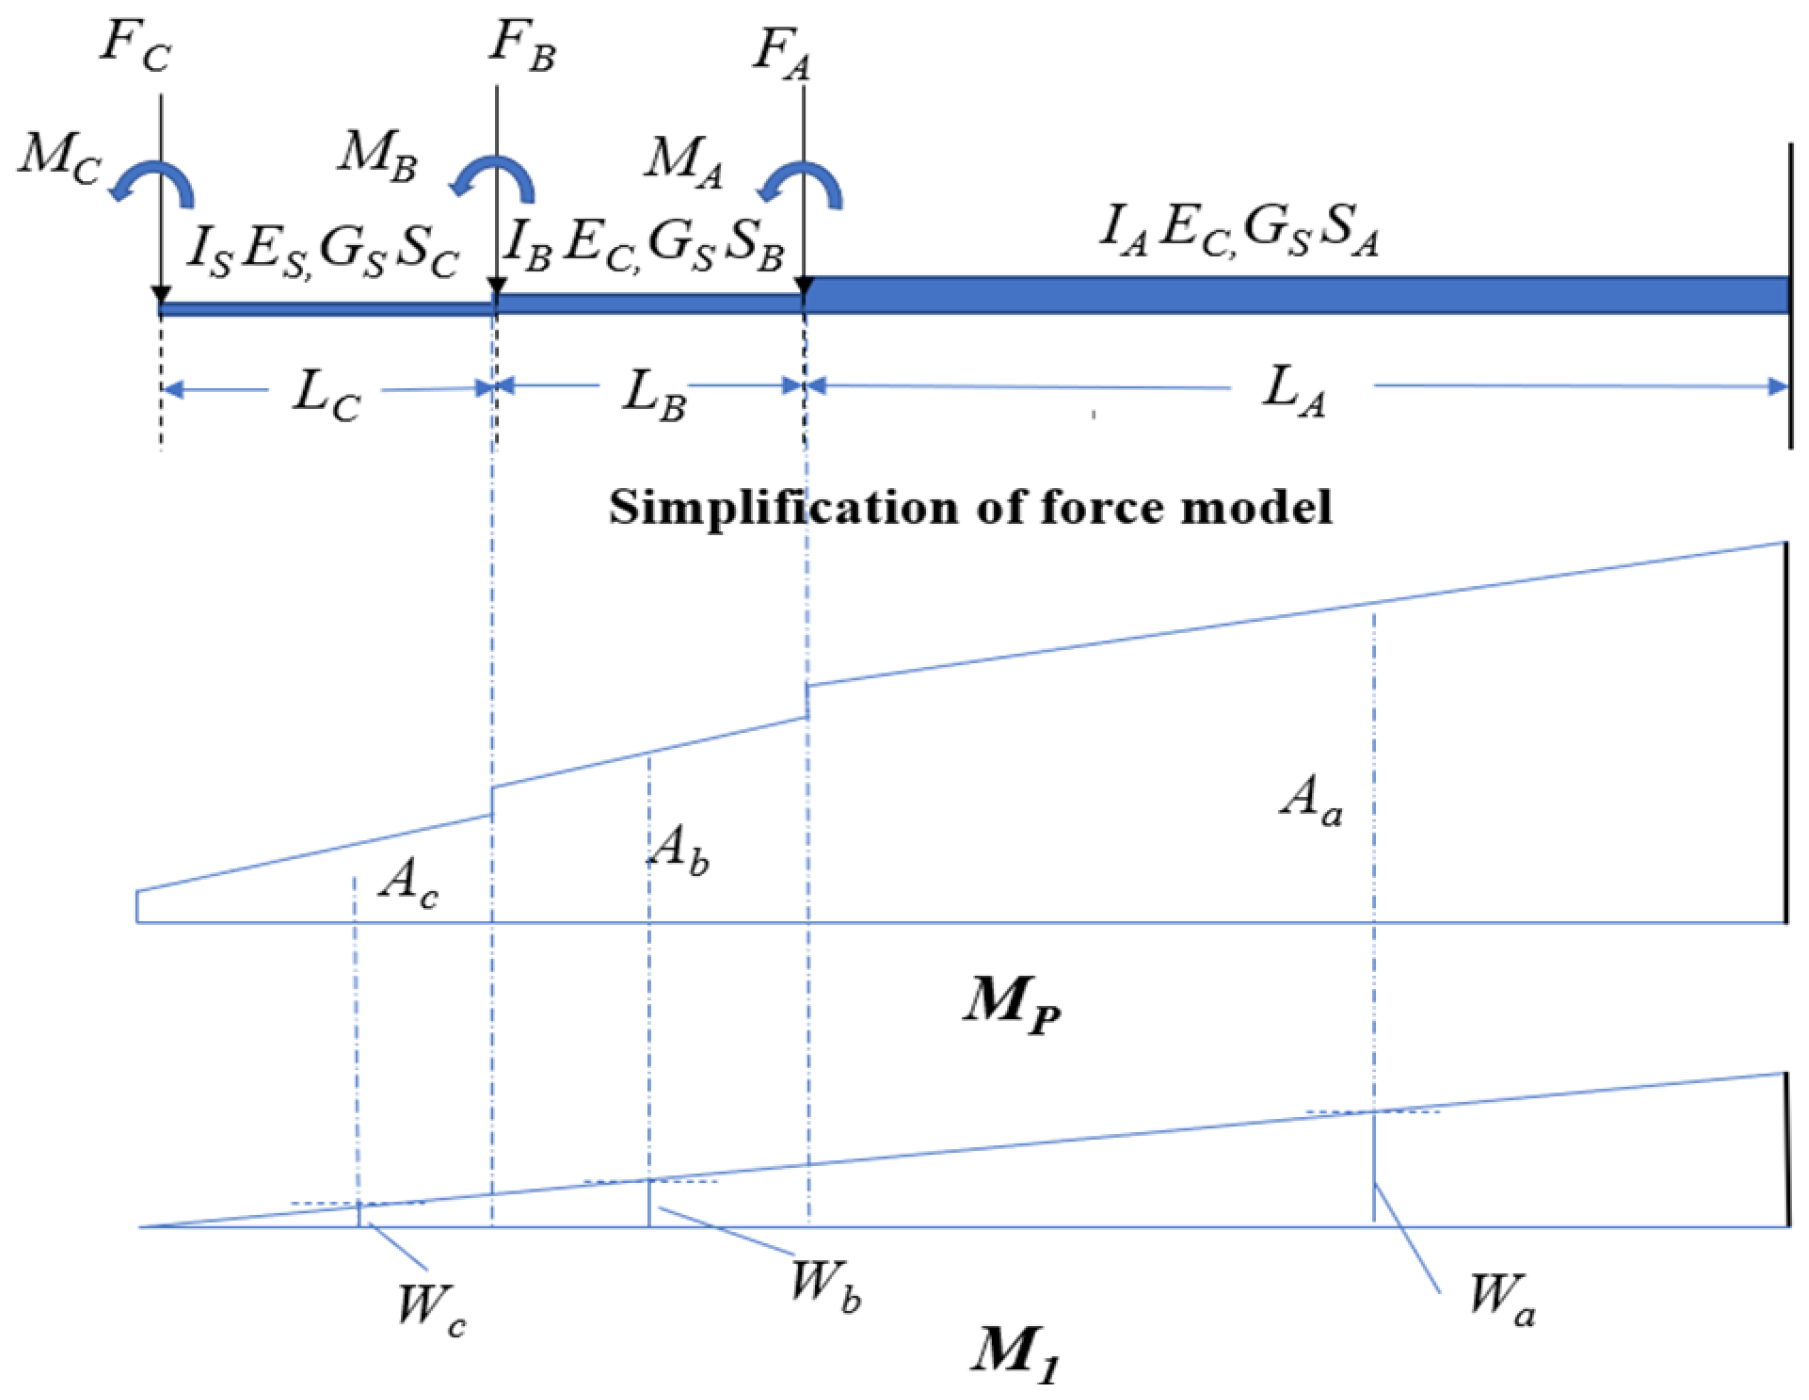
The structural response under APC involves coupled flexural–shear behavior. For analytical purposes, the structure is divided into three distinct flexural behavior regions based on composite action, a combined segment, U-shaped segment, and cantilever web segment, when calculating the bending deformation. Shear deformation may be conservatively assumed to be resisted solely by the corrugated webs.
(4)
The proposed simplified stress formulation demonstrates satisfactory agreement with Midas Civil finite element results for both web shear stresses and flange normal stresses across construction stages during the cyclic segmental erection process.
(5)
Based on the partitioned asynchronous construction model, the composite variable cross-sectional segments are equivalently transformed into uniform-section beams following Simpson’s integration formula. The derived simplified formula for cantilever tip deflection demonstrates high computational accuracy, with deviations between analytical predictions and finite element (FE) simulations. The maximum observed deviation was limited to acceptable engineering tolerances.

Author Contributions

Investigation: J.H., B.G. (Bo Gan), B.L. and B.G. (Bo Liu); methodology: J.H., B.L., W.L. and B.G. (Bo Gan); formal analysis: J.H., B.G. (Bo Gan), B.G. (Bo Liu), and S.F.; writing—original draft: B.G. (Bo Gan); writing—review and editing: J.H.; All authors have read and agreed to the published version of the manuscript.

Funding

This research received no external funding.

Data Availability Statement

The original contributions presented in this study are included in the article. Further inquiries can be directed at the corresponding author.

Conflicts of Interest

Author Baojun Guo was employed by the company BCEG Civil Engineering Co., Ltd. Author Weisheng Lu was employed by the company Hunan Water Planning & Design Institute Co., Ltd. The remaining authors declare that the research was conducted in the absence of any commercial or financial relationships that could be construed as a potential conflict of interest.

Appendix A. Calculation Parameters in Section 5.5.2

Table A1. Cross-sectional properties during the APC process of Segment #7.
Area AArea BArea C
LA (mm)IA (mm4)ASA (mm2)LB (mm)IB (mm4)ASB (mm2)LC (mm)IS (mm4)ASC (mm2)
Working condition 128,8008.769 × 1013153,01064001.041 × 101299,57288005.209 × 101082,520
Working condition 228,8008.834 × 1013153,01064001.041 × 101299,57288005.209 × 101082,520
Working condition 328,8008.897 × 1013153,01064001.041 × 101299,57288005.209 × 101082,520
Working condition 435,2007.666 × 1013142,70064008.816 × 101182,52072004.556 × 101079,320
Table A2. Construction loads during the APC process of Segment #7.
Area AArea BArea C
Working condition 1FA (N)2.4 × 10⁵FB (N)6.6 × 10⁵
MA (N·mm)6.72 × 10⁸
Working condition 2FA(N)1 × 10⁵FB (N)1.4 × 10⁵FC (N)6.6 × 10⁵
MA (N·mm)8 × 10⁷MF2 (N·mm)1.12 × 10⁸
Working condition 3FA (N)6.5 × 10⁵FB (N)2.44 × 10⁵FC(N)1.63 × 10⁶
MA(N·mm)5.2 × 108MB (N·mm)1.952 × 10⁸
Working condition 4MA (N·mm)2.04 × 10¹⁰

References

  1. Elgaaly, M.; Seshadri, A.; Hamilton, R.W. Bending strength of steel beams with corrugated webs. J. Struct. Eng. 1997, 123, 772–782. [Google Scholar]
  2. Machimdamrong, C.; Watanabe, E.; Utsunomiya, T. Analysis of corrugated steel web girders by an efficient beam bending theory. Struct. Eng./Earthq. Eng. 2004, 21, 131s–142s. [Google Scholar]
  3. Deng, W.Q.; Zhou, M.; Hassanein, M.F.; Zhang, J.; Liu, D.; An, L. Growth of prestressed concrete bridges with corrugated steel webs in China. Proc. Inst. Civ. Eng. 2017, 171, 77–84. [Google Scholar]
  4. Chan, C.L.; Khalid, Y.A.; Sahari, B.B.; Hamouda, A.M.S. Finite element analysis of corrugated web beams under bending. J. Constr. Steel. Res. 2015, 58, 1391–1406. [Google Scholar]
  5. He, J.; Wang, S.H.; Liu, Y.; Dai, L.; TAN, C. The development of composite bridges with corrugated steel webs in China. Proc. Inst. Civ. Eng. Struct. Build. 2021, 174, 28–44. [Google Scholar]
  6. He, J.; LI, X.; LI, C.X. A novel asynchronous-pouring-construction technologies for prestressed concrete box girder bridges with corrugated steel webs. Structures 2020, 27, 1940–1950. [Google Scholar]
  7. Feng, S.D.; He, J.; Lin, W.W.; Li, C.Y.; Shao, Y.B.; Hassanein, M.F. Simplified deflection calculation method for PC box girder bridges with corrugated steel webs using asynchronous-pouring-construction technology. J. Constr. Steel Res. 2024, 214, 108482. [Google Scholar]
  8. Zhou, M.; Liu, Y.Y.; Wang, K.J.; Hassanein, M.F. New Asynchronous-Pouring Rapid-Construction Technologies for Long-Span Prestressed Concrete Box Girder Bridges with Corrugated Steel Webs. J. Constr. Eng. Manage 2020, 146, 05019021. [Google Scholar]
  9. Wang, D.; Wang, L.; Tang, C. Mechanical Characteristic Analysis of Corrugated Steel Webs Using Asynchronous Construction Technologies. J. Civ. Eng. 2021, 25, 185–196. [Google Scholar]
  10. Zhu, F.Q.; Jin, G.L.; Deng, W.Q.; Liu, D.; Zhang, J.D. Study on Asynchronous Construction Technologies for Long Span Composite Girder Bridge with Corrugated steel Webs. Mod. Transp. Technol. 2022, 19, 5–59+92. [Google Scholar]
  11. Tang, Y.S.; Lou, T.S.; Zhang, Y.; Wang, S.H.; Liu, Y.Q. Design of Main Bridge of Feilong Bridge in Hengzhou. World Bridges 2024, 52, 17–22. [Google Scholar]
  12. Luo, T.Y.; Zhang, Y.; Zhang, K.Q.; Liu, Y.Q.; Wang, S.H. Feilong Bridge, China: A super-long-span composite bridge with corrugated steel webs. Proc. Inst. Civ. Eng.-Civ. Eng. 2025, 178, 118–125. [Google Scholar]
  13. Cafolla, J.; Johnson, R.P. Local flange buckling in plate girders with corrugated webs. Proc. Inst. Civ. Eng. Struct. Build. 1997, 122, 148–156. [Google Scholar]
  14. Ledziewski, K.J.M. Influence of Corrugated Web Geometry on Mechanical Properties of I-Beam: Laboratory Tests. Materials 2021, 15, 277. [Google Scholar] [CrossRef] [PubMed]
  15. Luo, Z.L.; Wang, S.H.; Wang, J.J.; Yuan, H.Y. Research on flexural performance of composite girders with different shear connection degrees. Structures 2025, 77, 109144. [Google Scholar]
  16. Wu, F.; Fan, Z.; He, L.; Liu, S.; Zuo, J.; Yang, F. Comparative study of the negative bending behaviour of corrugated web steel–concrete composite beams using NC, ECC and UHPC. Eng. Struct. 2023, 283, 115925. [Google Scholar]
  17. Metwally, A.E.; Loov, R.E. Corrugated steel webs for prestressed concrete girders. Mater. Struct. 2003, 36, 127–134. [Google Scholar]
  18. Nie, J.G.; Zhu, L.; Tan, L. Shear strength of trapezoidal corrugated steel webs. China Civ. Eng. J. 2013, 46, 97–109. [Google Scholar]
  19. He, J.; Wang, S.H.; Liu, Y.Q.; Wang, D.; Xin, H. Shear behavior of steel I-girder with stiffened corrugated web, Part II: Numerical study. Thin-Walled Struct. 2020, 147, 106025. [Google Scholar]
  20. Wang, K.J.; Zhou, M.; Hassanein, M.; Zhong, J.; Ding, H.S.; An, L. Study on Elastic Global Shear Buckling of Curved Girders with Corrugated Steel Webs: Theoretical Analysis and FE Modelling. Appl. Sci. 2018, 8, 2457. [Google Scholar]
  21. Yuan, H.X.; He, K.X.; Gao, L.Q.; Wang, A.D.; Du, X.X. Shear behaviour and design of bolted steel girders with trapezoidal corrugated webs. J. Constr. Steel Res. 2024, 216, 108573. [Google Scholar]
  22. Li, Z.; Pasternak, H.; Robra, J.; Wang, J. Shear buckling resistance of sinusoidal corrugated web girders with stiffened openings: Analysis, Experiment, Simulation and Design guidance. Thin-Walled Struct. 2025, 215, 113368. [Google Scholar]
  23. Zhou, M.; Chai, J.L. Modified Calculation on Shear Stress in the Hogging Moment Regions of Tapered Girder Bridges with Corrugated Steel Webs. J. Struct. Eng. 2025, 151, 04025087. [Google Scholar]
  24. Zhu, Y.B.; Wan, S.; Shen, K.J.; Zhou, P.; Wang, X. Theoretical study on the nonlinear performance of single-box multi-cell composite box-girder with corrugated steel webs under pure torsion. Constr. Steel Res. 2021, 178, 106487. [Google Scholar]
  25. Huang, H.M.; Zhang, Y.H.; Ji, W.; Luo, K. Theoretical Study and Parametric Analysis on Restrained Torsion of Composite Box Girder Bridge with Corrugated Steel Webs. J. Bridge Eng. 2022, 27, 04022118. [Google Scholar]
  26. Zhang, H.; Chen, Y.; Pan, J.; Dong, J.; Zhao, Q. Torsional behavior of super-span composite box girder with corrugated steel webs. Structures 2024, 68, 107045. [Google Scholar]
  27. Zhang, H.P.; Liu, H.J.; Deng, Y.; Cao, Y.; He, Y.B.; Liu, Y.; Deng, Y. Fatigue behavior of high-strength steel wires considering coupled effect of multiple corrosion-pitting. Corros. Sci. 2025, 244, 112633. [Google Scholar]
  28. Chen, F.H.; Liu, X.; Zhang, H.P.; Luo, Y.; Lu, N.W.; Liu, Y.; Xiao, X.H. Assessment of fatigue crack propagation and lifetime of double-sided U-rib welds considering welding residual stress relaxation. Ocean Eng. 2025, 332, 121400. [Google Scholar]
  29. Zhang, H.P.; Deng, Y.; Cao, Y.; Chen, F.H.; Luo, Y.; Xiao, X.H.; Deng, Y.H.; Liu, Y. Field testing, analytical, and numerical assessments on the fatigue reliability on bridge suspender by considering the coupling effect of multiple pits. Struct. Infrastruct. Eng. 2025, 1–16. [Google Scholar] [CrossRef]
  30. Dai, H.; Zheng, G.H.; Du, S. Model test of asynchronous construction for corrugated steel web PC box girder. China Harb. Eng. 2021, 41, 50–54. [Google Scholar]
  31. Peng, D.L.; Yang, J.; Zheng, X. Study on local deformation of corrugated steel web in asynchronous suspension construction. J. Transp. Sci. Eng. 2021, 37, 89–94. [Google Scholar]
  32. Ren, H.C.; Chen, L.P.; Luo, Q.D.; Zhang, M.L. Analysis of Main Girder Cantilever Construction of Gexi Bridge on Wentai Expressway. Bridge Constr. 2021, 51, 138–143. [Google Scholar]
  33. Deng, W.Q.; Liu, D.; Xiong, Y.Q.; Zhang, J.D. Experimental study on asynchronous construction for composite bridges with corrugated steel webs. J. Constr. Steel Res. 2019, 157, 93–102. [Google Scholar]
  34. Deng, W.Q.; Xia, H.S.; Zha, S.; Pei, H.T.; Liu, D.; Zhang, J.D.; Gu, J.C. Experimental study on asynchronous construction for composite bridges with CSWs: Comparative study. Case Stud. Constr. Mater. 2024, 20, e02776. [Google Scholar]
  35. Zuo, S.H. Key Techniques of Design and Using Asynchronous Form Travelers to Construct West Qingxi Road Bridge. World Bridges 2022, 50, 44–50. [Google Scholar]
  36. Project Team on the Strategy and Pathway for Peaked Carbon Emissions and Carbon Neutrality. Analysis of a Peaked Carbon Emission Pathway in China Toward Carbon Neutrality. Engineering 2021, 7, 1673–1677. [Google Scholar]
  37. Leimbach, M.; Kriegler, E.; Roming, N.; Schwanitz, J. Future growth patterns of world regions–A GDP scenario approach. Glob. Environ. Change 2017, 42, 215–225. [Google Scholar]
  38. Yepes, V.; Martí, J.V.; García-Segura, T. Cost and CO2 emission optimization of precast–prestressed concrete U-beam road bridges by a hybrid glowworm swarm algorithm. Autom. Constr. 2015, 9, 123–134. [Google Scholar]
  39. China Iron & Steel Association. Available online: https://t.hk.uy/bS4j (accessed on 23 May 2025).
  40. Ministry of Communication of China (MOC). Specification for Design of Highway Reinforced Concrete and Prestressed Concrete Bridges and Culverts, (JTG 3362–2018); China Communications Press: Beijing, China, 2018; pp. 8–9. [Google Scholar]
  41. Zhou, M.; Liu, Z.; Zhang, J.; An, L.; He, Z. Equivalent computational models and deflection calculation methods of box girders with corrugated steel webs. Eng. Struct. 2016, 127, 615–634. [Google Scholar]
Figure 1. Bridge span arrangement (unit: m).
Buildings 15 02434 g001
Figure 2. Segment division of composite girders with CSWs (unit: cm).
Buildings 15 02434 g002
Figure 3. APC structure and construction workflow diagram: (a) schematic of APC hanging basket system; (b) construction steps of standard segments using APC; and (c) closure process.
Buildings 15 02434 g003
Figure 4. Comparison of construction time.
Buildings 15 02434 g004
Figure 5. The deflection and stress measurements of composite box girder.
Buildings 15 02434 g005
Figure 6. Strain gauges arrangement: (a) strain gauges of CSWs and (b) strain gauges of concrete flange slabs.
Buildings 15 02434 g006
Figure 7. Finite element model: (a) the global bridge finite element model; (b) finite element model of TBCC; and (c) finite element model of APC.
Buildings 15 02434 g007
Figure 8. Comparison of stress between the finite element and the on-site measurements: (a) the normal stress of top slab; (b) the normal stress of top slab; and (c) the shear stress of CSW.
Buildings 15 02434 g008
Figure 9. Comparison of stress between the finite element of TBBC and APC: (a) the normal stress of top slab; (b) the normal stress of top slab; and (c) the shear stress of CSW.
Buildings 15 02434 g009
Figure 10. Comparison of stress between the finite element of TBBC and APC.
Buildings 15 02434 g010
Figure 11. Equivalent model: (a) force diagram of asynchronous cantilever structure and (b) construction loads of APC method.
Buildings 15 02434 g011aBuildings 15 02434 g011b
Figure 12. Force equilibrium diagram of a composite beam differential element.
Buildings 15 02434 g012
Figure 13. Force equilibrium diagram of a composite beam infinitesimal element.
Buildings 15 02434 g013
Figure 14. Schematic diagram of non-prismatic beam with even number of equal divisions.
Buildings 15 02434 g014
Figure 15. Simplified bending deflection calculation diagram.
Buildings 15 02434 g015
Table 1. Comparison of cost.
Item① APC② TTBCPrice②-①
Steel for basket installation cost400 t200 t3450 RMB/t690,000 RMB
Labor cost198.5 d120 d30,000 RMB/d2,355,000 RMB
Table 2. Mechanical properties of finite element model materials.
Mechanical PerformanceConcrete Flange SlabCSWSteel Stranded
Elastic modulus/GPa35.5206195
Tension strength/MPa-3101860
Shear strength/MPa-170-
Poisson ratio0.20.30.3
Unit weight/(kN·m−3)2678.578.5
Table 3. Comparison of the main girder deflection.
Work
Conditions
Pouring Wet Weight of Concrete (mm)Tensioning Prestressed Tendons (mm)
FAPCTESTFAPCTEST
2#0.90.51.31.0
3#1.11.01.11.6
4#2.12.42.02.3
5#3.43.63.13.6
6#6.16.95.36.1
7#13.214.28.08.2
8#20.722.511.29.6
9#19.519.725.212.3
Note: FAPC is the finite element calculation of APC; TEST is measurement values.
Table 4. The variation values of normal stress on the concrete top flanges.
Segment NumberMove the Hanging Basket Forward/MPaPouring Concrete/MPaTensioning Prestress/MPa
FEEqFEEqFEEq
2#0.080.091.511.41−2.03−1.74
3#0.100.091.441.32−2.08−1.73
4#0.120.101.321.18−2.14−1.71
5#0.120.111.151.00−2.18−1.70
6#0.140.120.910.75−2.21−1.68
7#0.160.130.470.44−2.22−1.66
Note: FE is the finite element calculation value; Eq is formula calculation value. Negative values indicate compressive stress.
Table 5. The variation values of normal stress on the concrete bottom flanges.
Segment NumberMove the Basket
Forward/MPa
Pouring
Concrete/MPa
Tension/MPa
(a) FE(b) Eq|(a) − (b)|(a) FE(b) Eq|(a) − (b)|(a) FE(b) Eq|(a) − (b)|
2#−0.11−0.110−1.99−1.790.20−0.26−0.190.07
3#−0.14−0.130.01−2.02−1.850.17−0.28−0.230.05
4#−0.17−0.160.01−2.00−1.840.16−0.30−0.280.02
5#−0.20−0.190.01−1.85−1.710.14−0.32−0.340.02
6#−0.24−0.230.01−1.55−1.390.16−0.34−0.400.06
7#−0.29−0.280.01−0.84−0.900.06−0.34−0.480.14
Note: FE is the finite element calculation value; Eq is formula calculation value. Negative values indicate compressive stress; positive values indicate tensile stress.
Table 6. The variation values of shear stress on CSWs.
Segment NumberMove the Hanging Basket Forward/MPaPouring Concrete/MPaTensioning Prestress/MPa
FEEqFEEqFEEq
2#−0.11−0.11−1.99−1.79−0.26−0.19
3#−0.14−0.13−2.02−1.85−0.28−0.23
4#−0.17−0.16−2.00−1.84−0.30−0.28
5#−0.20−0.19−1.85−1.71−0.32−0.34
6#−0.24−0.23−1.55−1.39−0.34−0.40
7#−0.29−0.28−0.84−0.90−0.34−0.48
Note: FE is the finite element calculation value; Eq is formula calculation value. Negative values indicate compressive stress; positive values indicate downward shear stress.
Table 7. Comparison between calculated and measured vertical deflection values.
Working Conditions(a) Bend (mm)(b) Shear (mm)(c) Total (mm)(d) Measured (mm)Error
Move the basket forward11.80.712.5133.80%
Pouring top and bottom slabs21.95.227.1283.20%
Tension6.3/6.3526.0%
Disclaimer/Publisher’s Note: The statements, opinions and data contained in all publications are solely those of the individual author(s) and contributor(s) and not of MDPI and/or the editor(s). MDPI and/or the editor(s) disclaim responsibility for any injury to people or property resulting from any ideas, methods, instructions or products referred to in the content.

