
Porosity Analysis and Thermal Conductivity Prediction of Non-Autoclaved Aerated Concrete Using Convolutional Neural Network and Numerical Modeling

 ,
,  ,
,  , ,
, ,  , , ,
, , ,  ,
,  and
and 
Abstract
1. Introduction
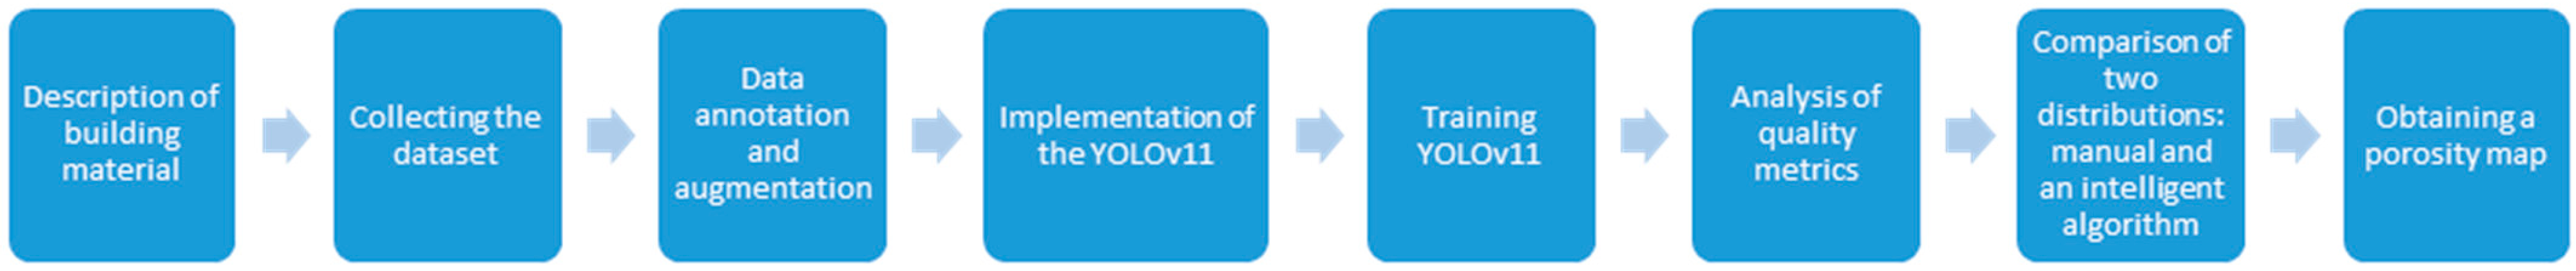
- →
- Collecting an experimental database of pictures of aerated concrete products and marking them;
- →
- Conducting the process of augmentation to expand the set of representative data;
- →
- Justification of the selected method for localizing the pores of aerated concrete products;
- →
- Building the optimal algorithm of the CNN YOLOv11 to implement a method for the determination of pore characteristics;
- →
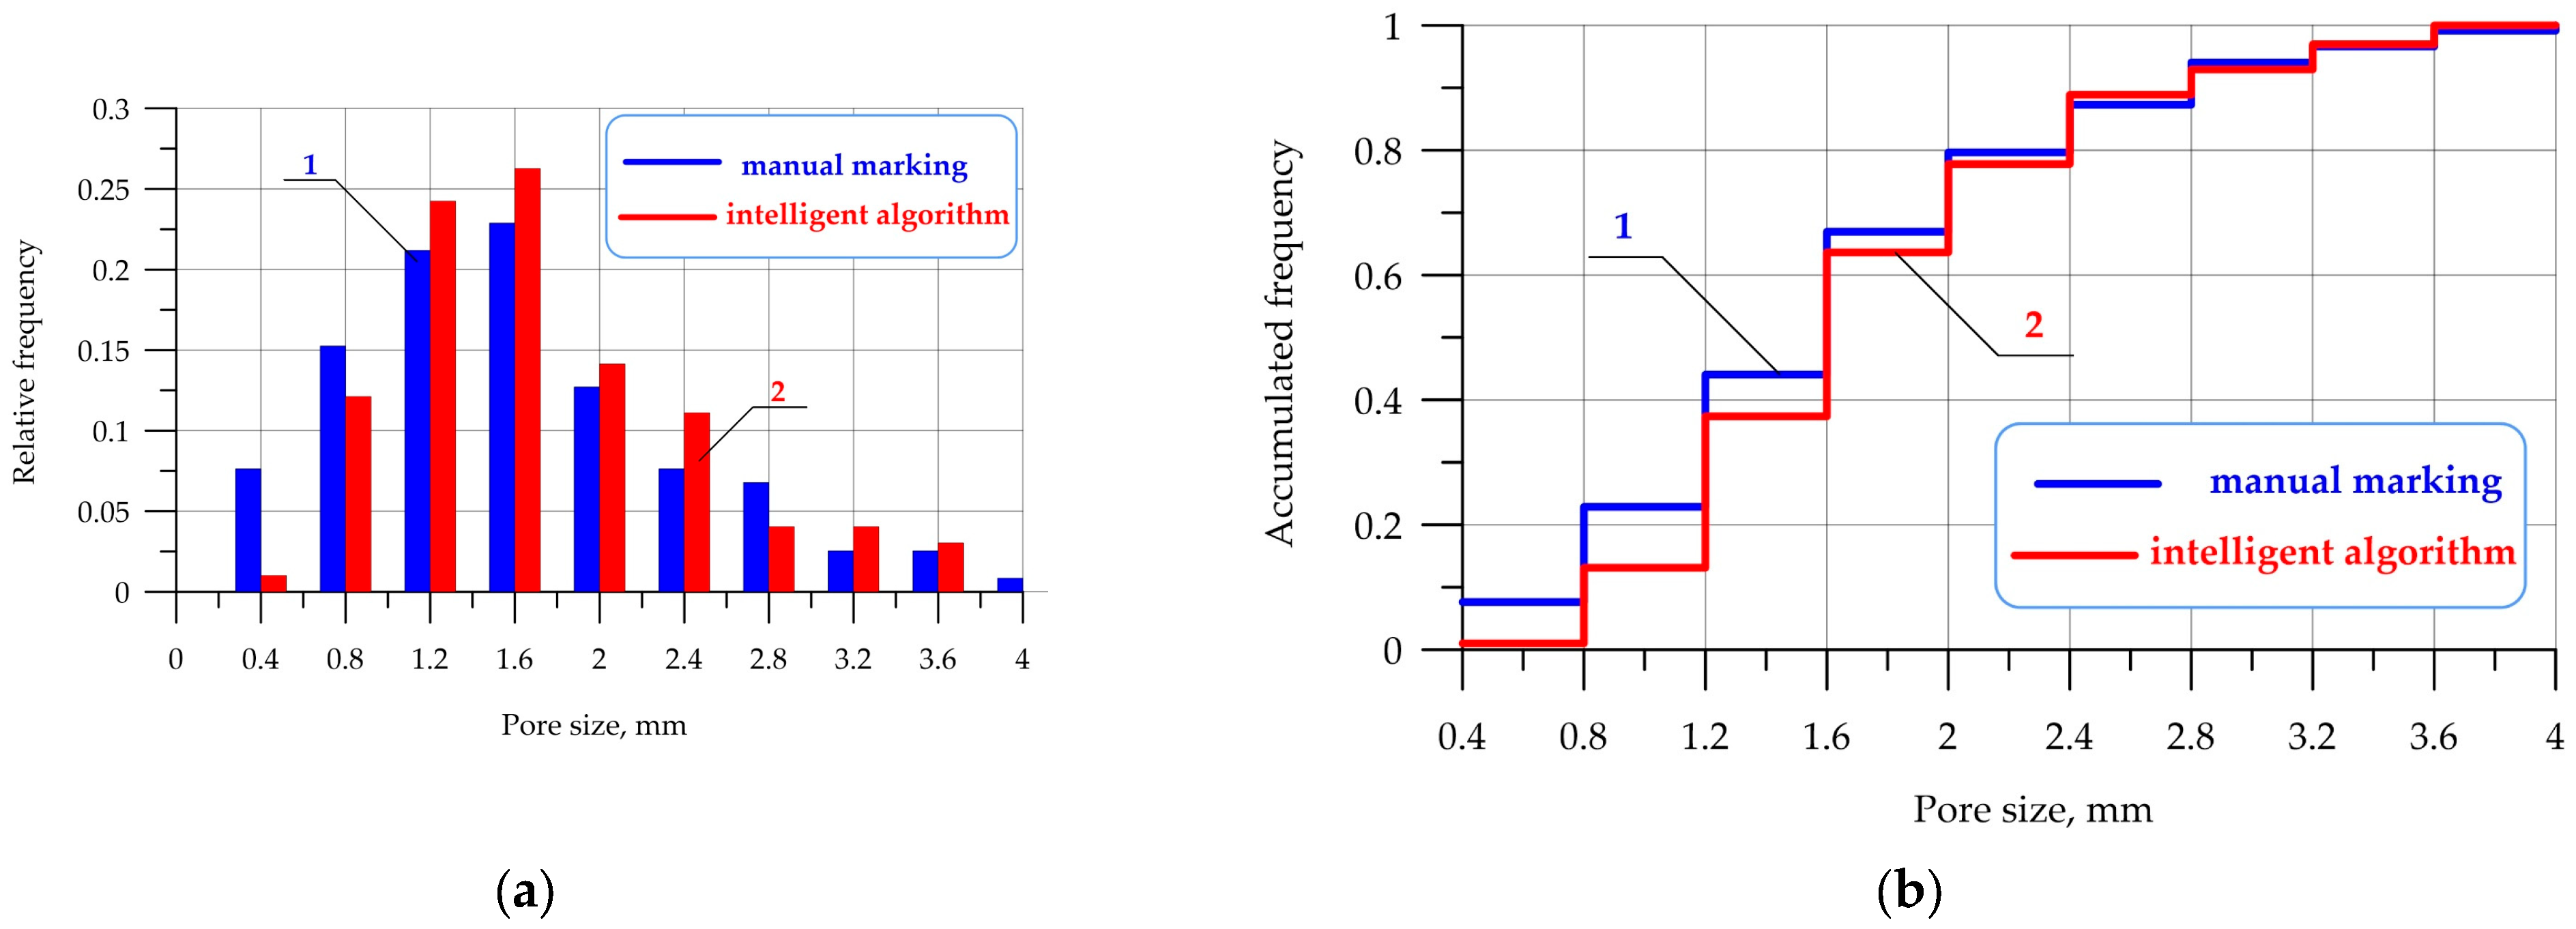
- Comparison of two empirical distributions using Hellinger distance and Kolmogorov–Smirnov criteria;
- →
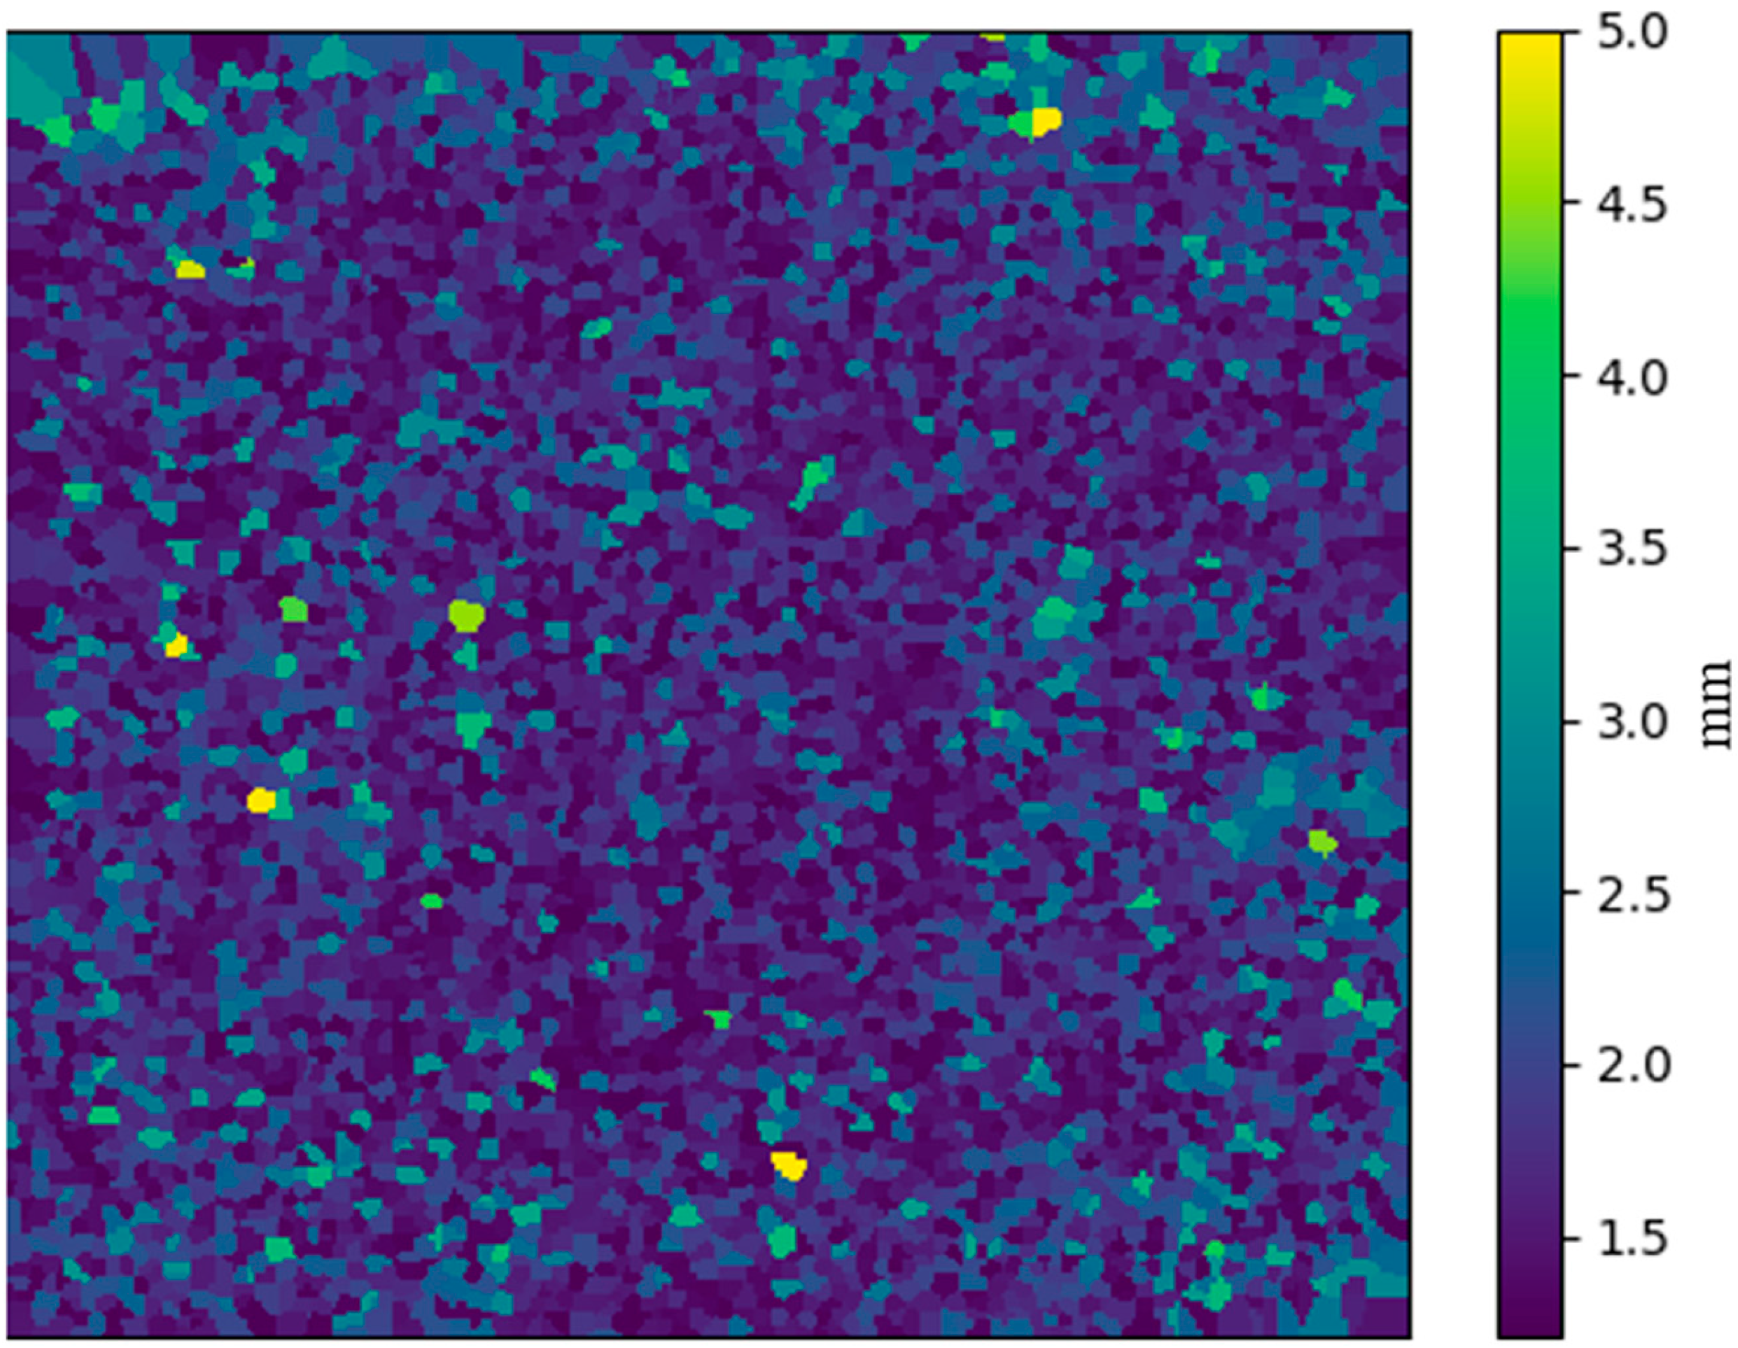
- Creation of a “heat map” of porosity based on the conclusions of the intelligent model.
2. Materials and Methods
2.1. Composition, Properties and Structure of the Studied Aerated Concrete Samples
2.2. Data Annotation and Augmentation
2.3. Implementation of the YOLOv11 CNN
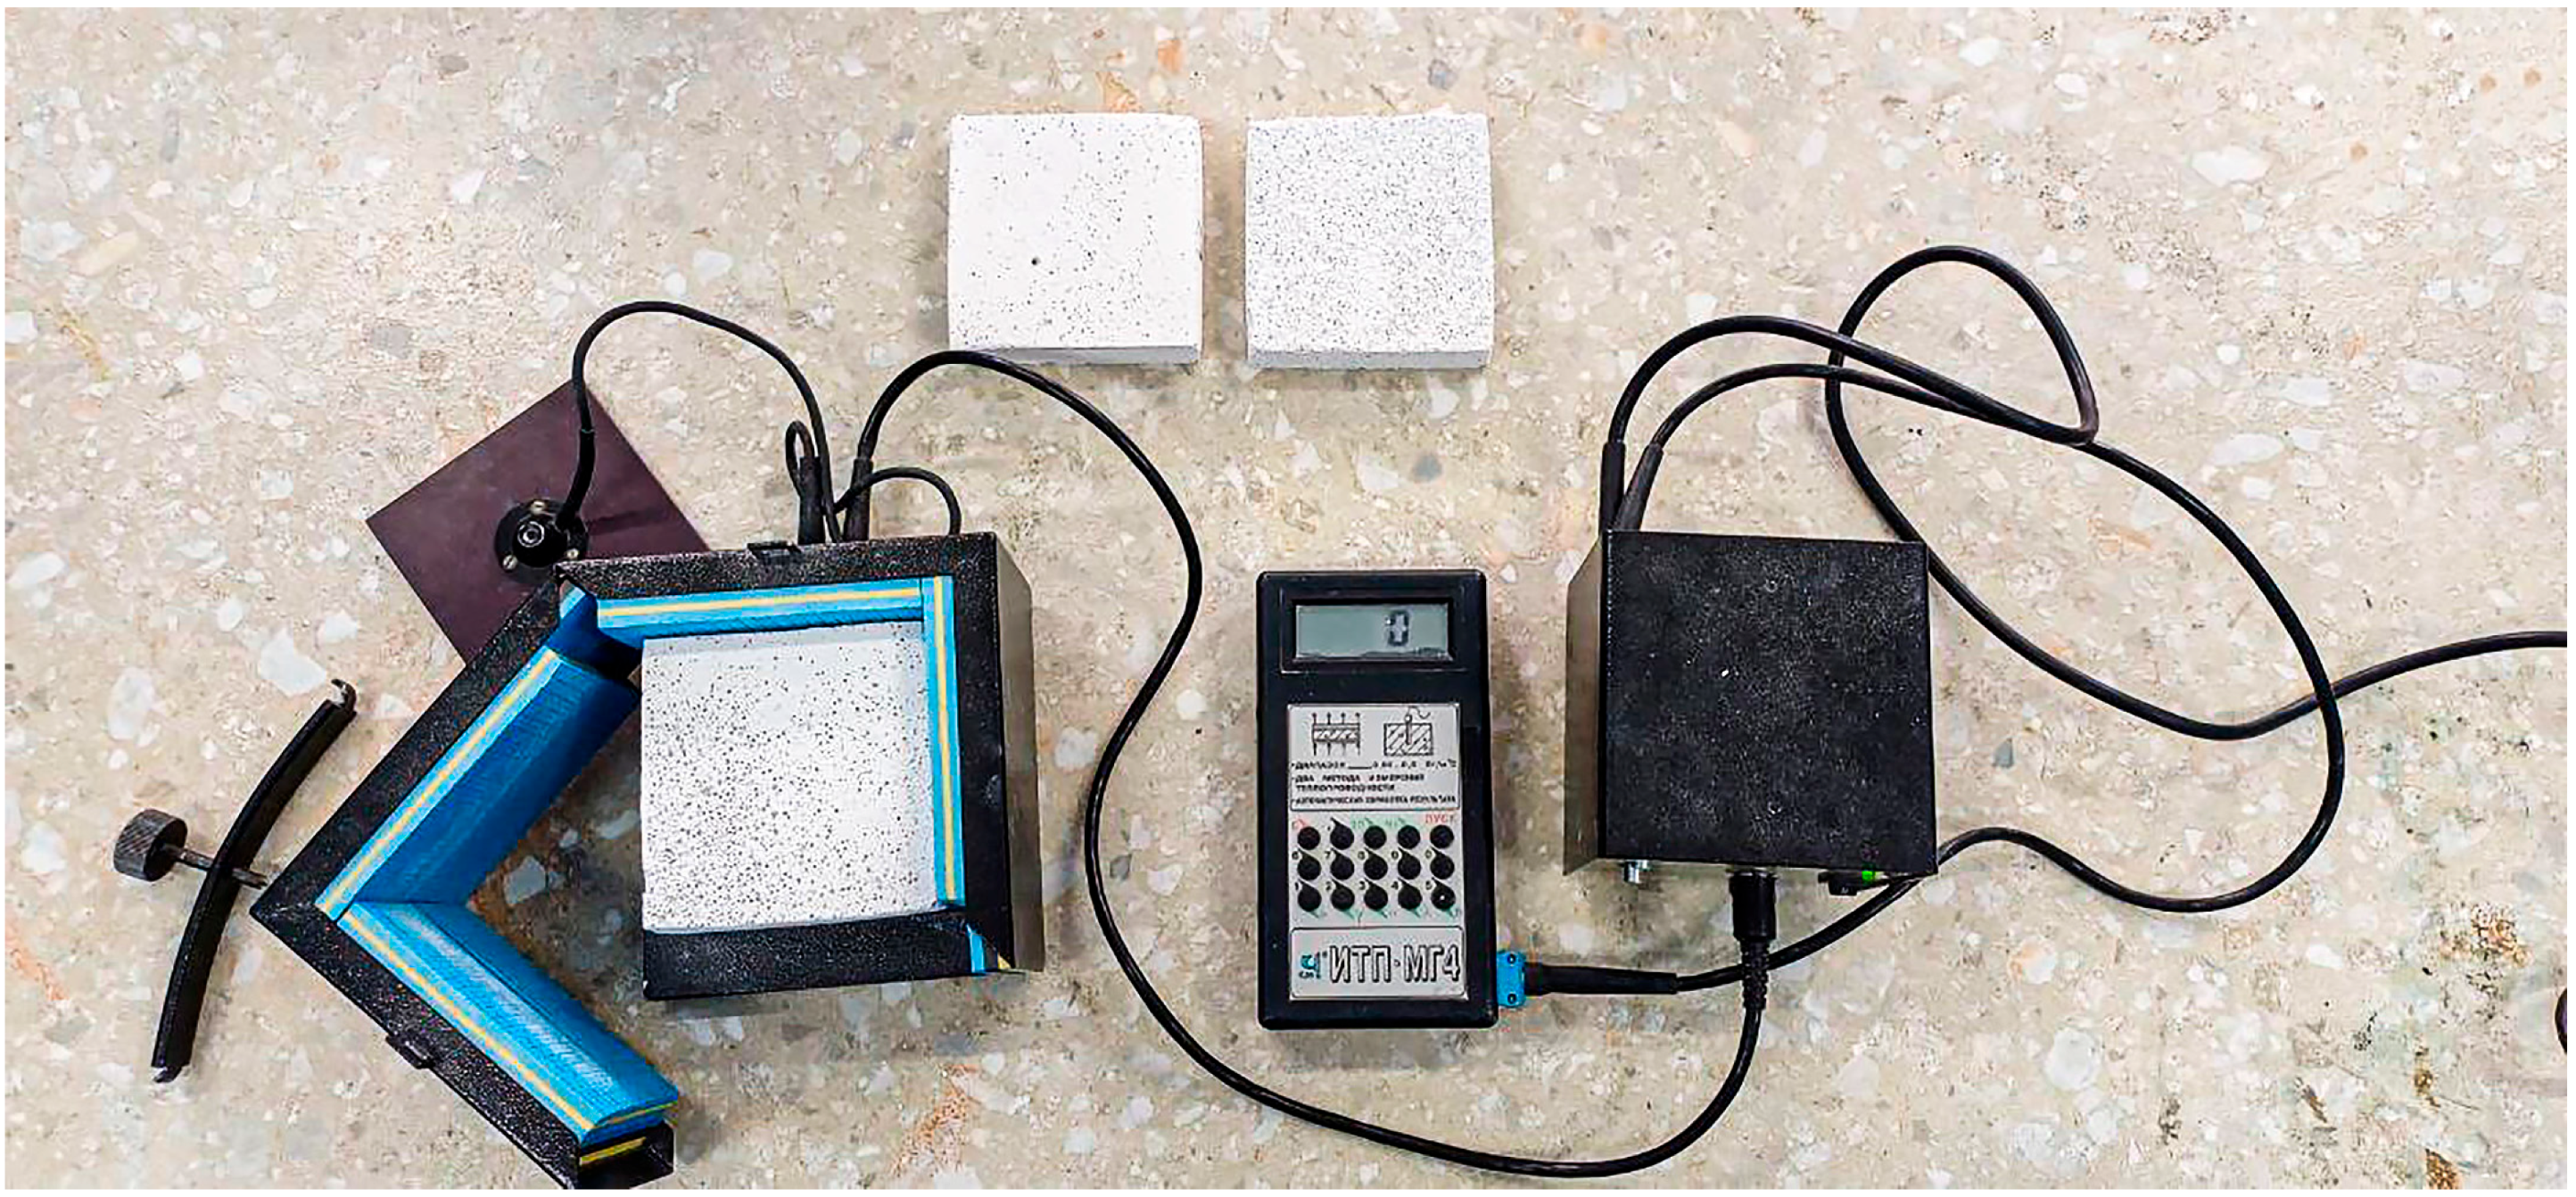
2.4. Experimental Determination of the Aerated Concrete’s Thermal Conductivity
3. Results and Discussion
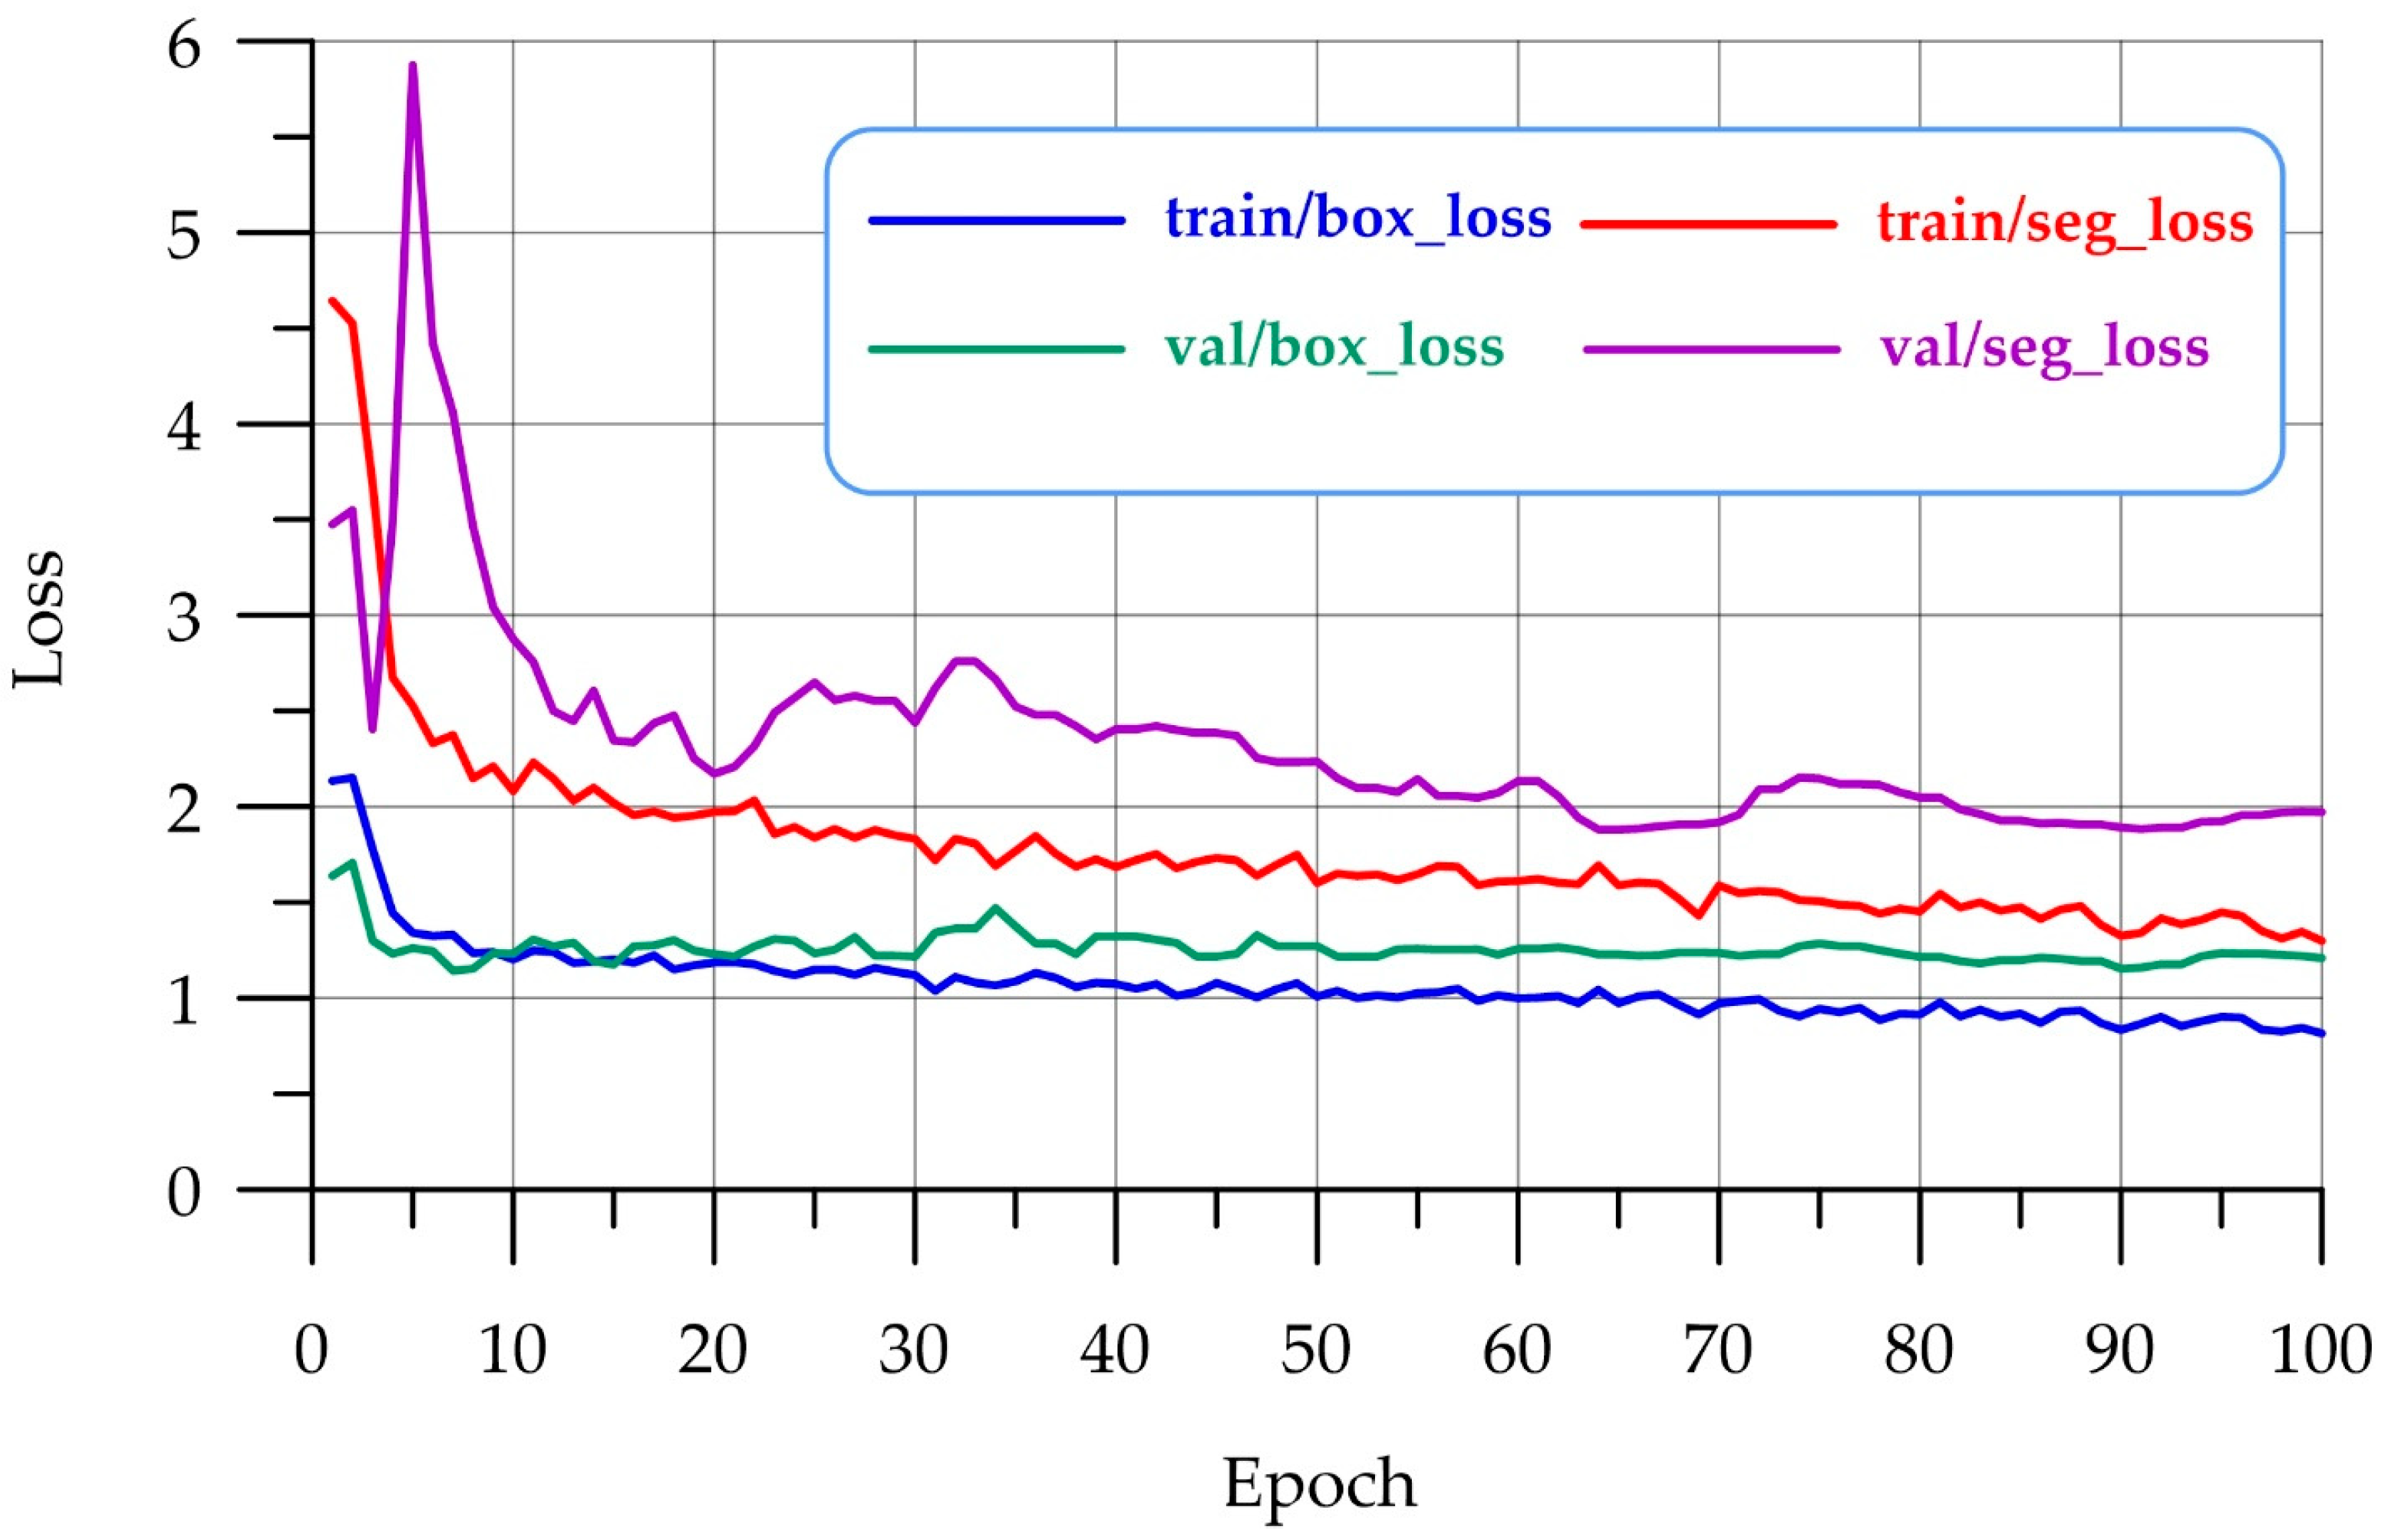
3.1. Training CNN YOLOv11
3.2. Comparison of Two Distributions Using Hellinger Distance and Kolmogorov–Smirnov Criteria
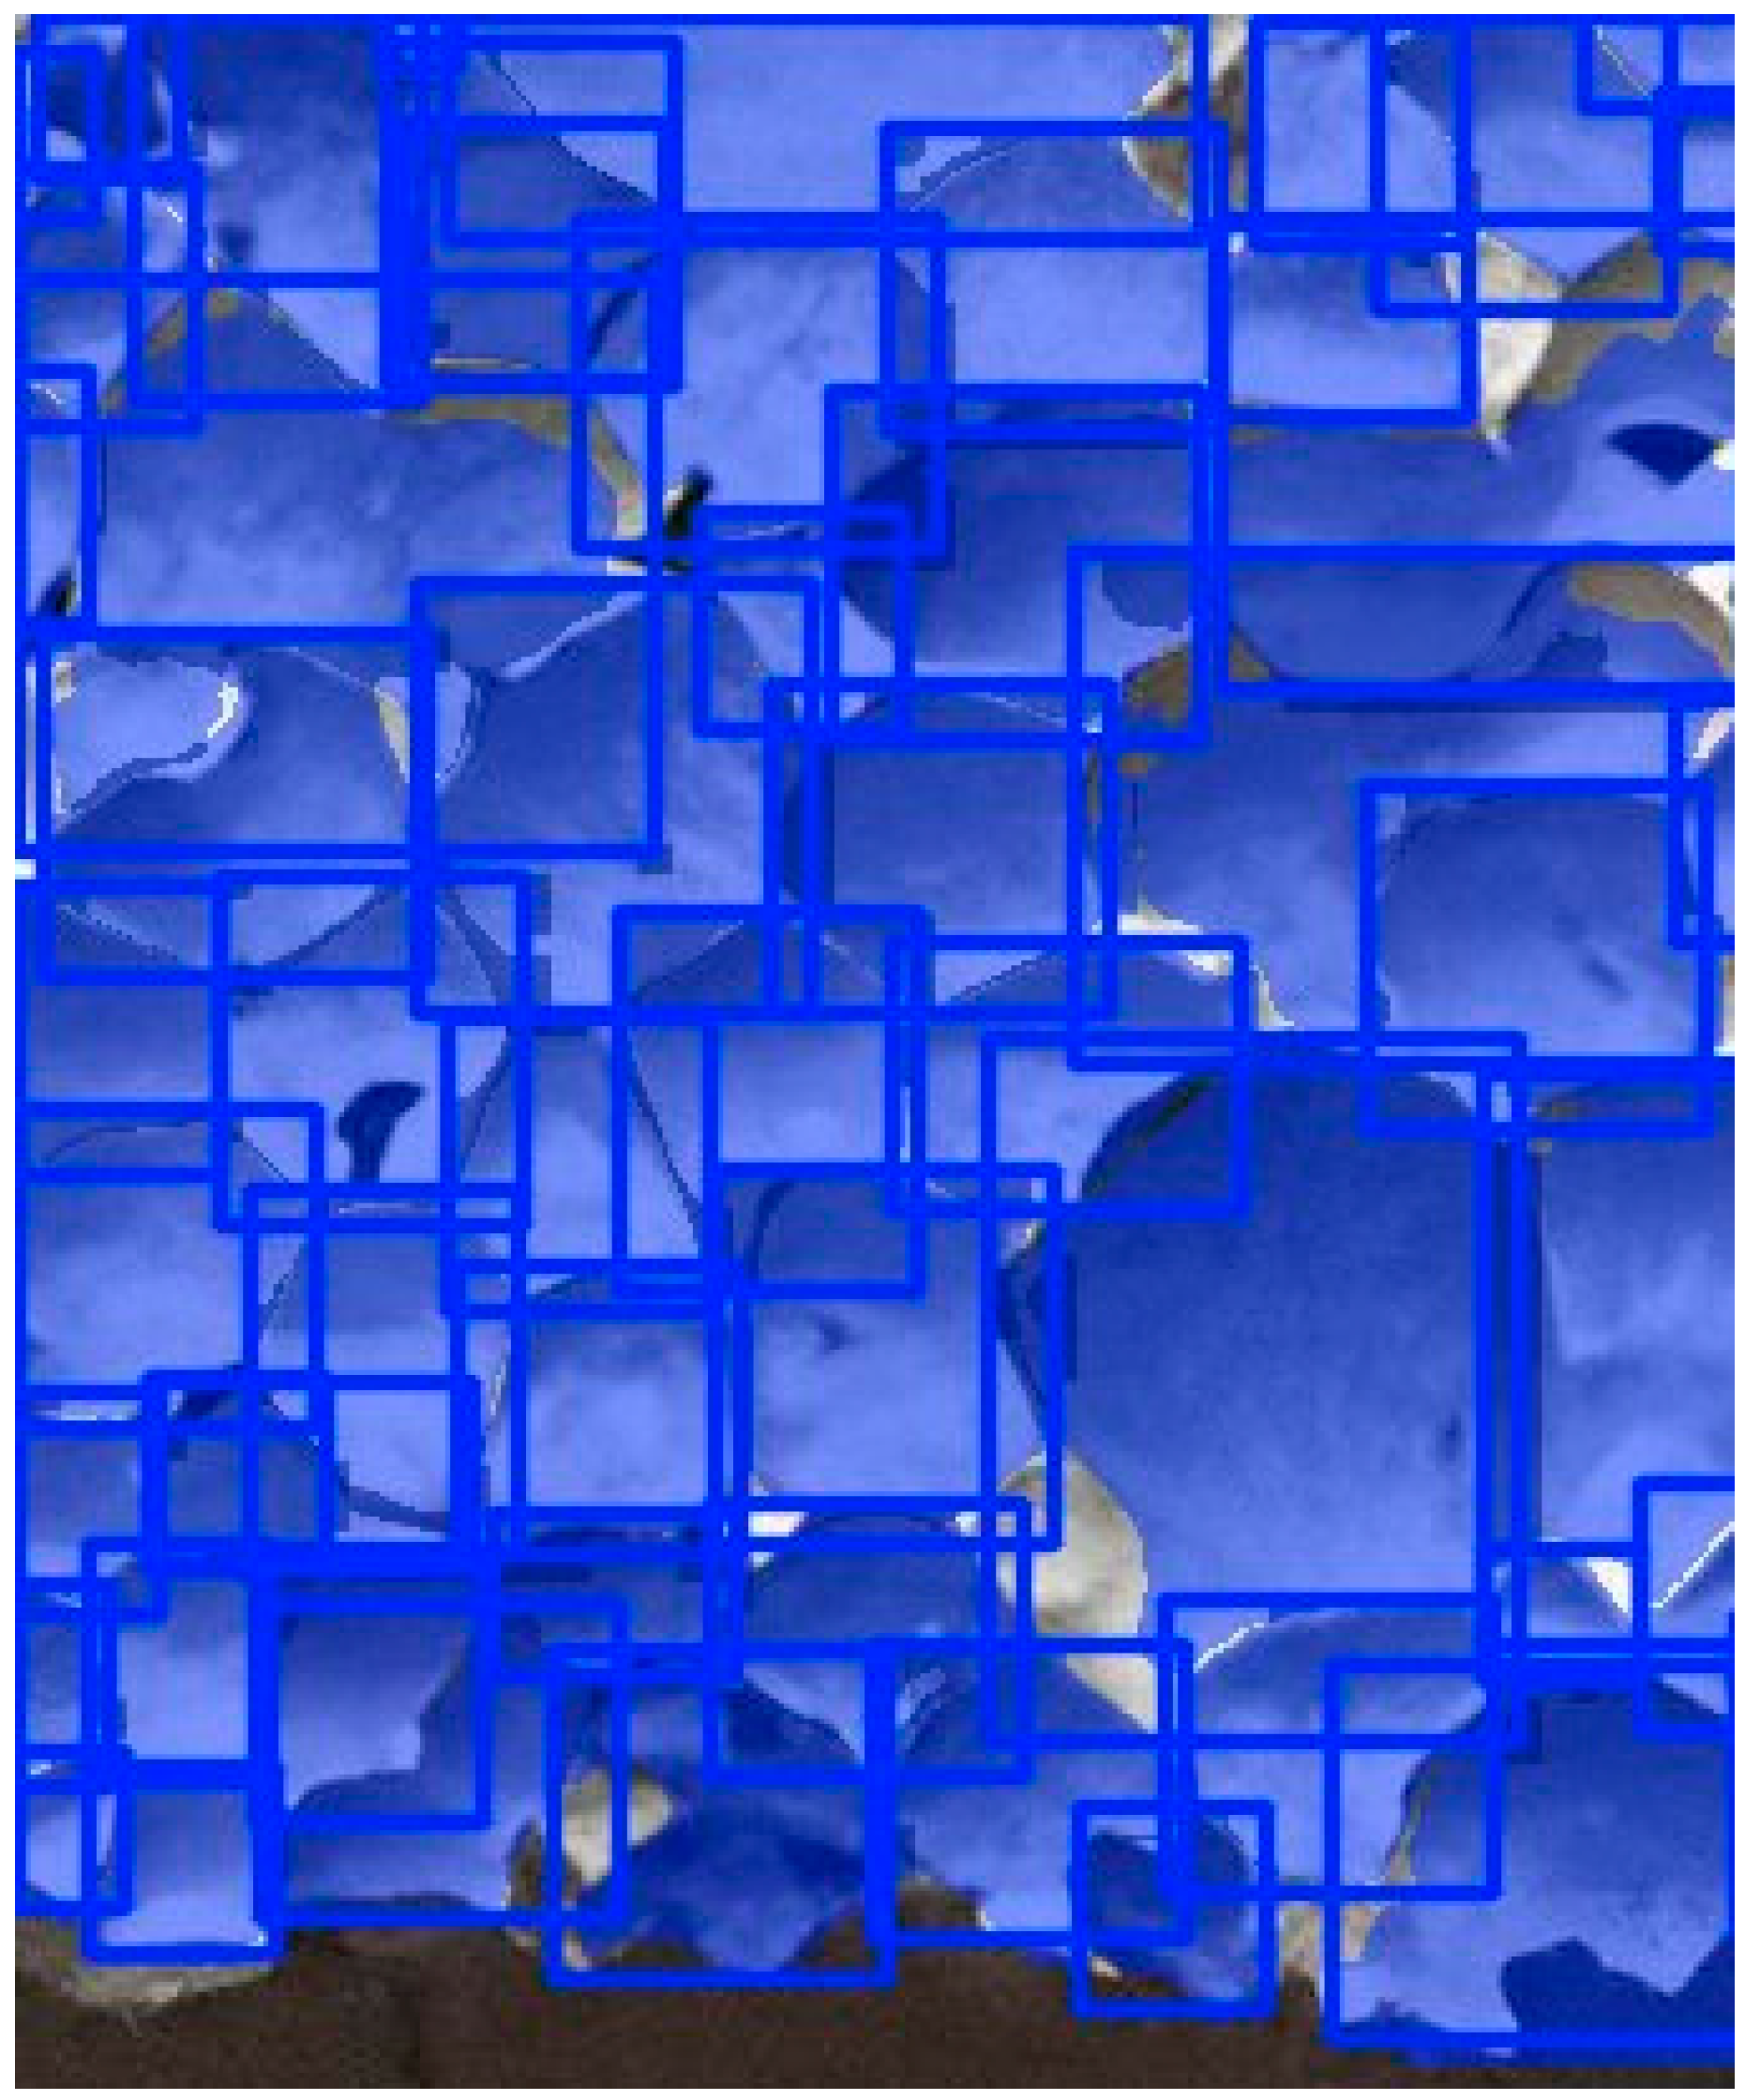
3.3. Obtaining a Porosity Map
3.4. Thermal Conductivity Prediction
3.5. Discussion
4. Conclusions
- −
- Applying the developed algorithm to other building materials with a cellular structure;
- −
- Expanding the number of predicted mechanical characteristics of the material, such as its elastic modulus, strength, acoustic properties, and others;
- −
- Implementing the developed model in a modern computer vision application for the quality control of building materials, products, and structures at various stages of their life cycle.
Author Contributions
Funding
Data Availability Statement
Acknowledgments
Conflicts of Interest
References
- Yang, L.; Allen, G.; Zhang, Z.; Zhao, Y. Achieving On-Site Trustworthy AI Implementation in the Construction Industry: A Framework Across the AI Lifecycle. Buildings 2025, 15, 21. [Google Scholar] [CrossRef]
- Regona, M.; Yigitcanlar, T.; Xia, B.; Li, R.Y.M. Opportunities and Adoption Challenges of AI in the Construction Industry: A PRISMA Review. J. Open Innov. Technol. Mark. Complex. 2022, 8, 45. [Google Scholar] [CrossRef]
- Rabbi, A.B.K.; Jeelani, I. AI integration in construction safety: Current state, challenges, and future opportunities in text, vision, and audio based applications. Autom. Constr. 2024, 164, 105443. [Google Scholar] [CrossRef]
- Park, J.; Kang, D. Artificial Intelligence and Smart Technologies in Safety Management: A Comprehensive Analysis Across Multiple Industries. Appl. Sci. 2024, 14, 11934. [Google Scholar] [CrossRef]
- Mandičák, T.; Behúnová, A.; Mésároš, P. Artificial Intelligence in the Sustainable Design and Manufacturing of Products in Civil Engineering in the Context of Industry 4.0. Machines 2024, 12, 919. [Google Scholar] [CrossRef]
- Babushkina, N.E.; Lyapin, A.A. Solving the Problem of Determining the Mechanical Properties of Road Structure Materials Using Neural Network Technologies. Adv. Eng. Res. 2022, 22, 285–292. [Google Scholar] [CrossRef]
- Rosemeyer, J.; Pinzone, M.; Metternich, J. Digital Assistance Systems to Implement Machine Learning in Manufacturing: A Systematic Review. Mach. Learn. Knowl. Extr. 2024, 6, 2808–2828. [Google Scholar] [CrossRef]
- Li, J.; Liu, Z.; Han, G.; Demian, P.; Osmani, M. The Relationship Between Artificial Intelligence (AI) and Building Information Modeling (BIM) Technologies for Sustainable Building in the Context of Smart Cities. Sustainability 2024, 16, 10848. [Google Scholar] [CrossRef]
- Qin, R.; Cui, P.; Muhsin, J. Research Progress of Automation Ergonomic Risk Assessment in Building Construction: Visual Analysis and Review. Buildings 2024, 14, 3789. [Google Scholar] [CrossRef]
- Borovkov, A.I.; Vafaeva, K.M.; Vatin, N.I.; Ponyaeva, I. Synergistic Integration of Digital Twins and Neural Networks for Advancing Optimization in the Construction Industry: A Comprehensive Review. Constr. Mater. Prod. 2024, 7, 7. [Google Scholar] [CrossRef]
- Haruna, S.I.; Ibrahim, Y.E.; Hassan, I.H.; Al-shawafi, A.; Zhu, H. Bond Strength Assessment of Normal Strength Concrete–Ultra-High-Performance Fiber Reinforced Concrete Using Repeated Drop-Weight Impact Test: Experimental and Machine Learning Technique. Materials 2024, 17, 3032. [Google Scholar] [CrossRef]
- Stel’makh, S.A.; Shcherban’, E.M.; Beskopylny, A.N.; Mailyan, L.R.; Meskhi, B.; Razveeva, I.; Kozhakin, A.; Beskopylny, N. Prediction of Mechanical Properties of Highly Functional Lightweight Fiber-Reinforced Concrete Based on Deep Neural Network and Ensemble Regression Trees Methods. Materials 2022, 15, 6740. [Google Scholar] [CrossRef]
- Inqiad, W.B. Estimation of 28-Day Compressive Strength of Self-Compacting Concrete Using Multi Expression Programming (MEP): An Artificial Intelligence Approach. Eng. Proc. 2023, 56, 212. [Google Scholar] [CrossRef]
- Chepurnenko, A.S.; Kondratieva, T.N.; Deberdeev, T.R.; Akopyan, V.F.; Avakov, A.A.; Chepurnenko, V.S. Prediction of Rheological Parameters of Polymers Using the CatBoost Gradient Boosting Algorithm. Polym. Sci. Ser. D 2024, 17, 121–128. [Google Scholar] [CrossRef]
- Yang, X.; Wang, J.; Dong, M. SDCB-YOLO: A High-Precision Model for Detecting Safety Helmets and Reflective Clothing in Complex Environments. Appl. Sci. 2024, 14, 7267. [Google Scholar] [CrossRef]
- Han, J.; Li, Z.; Cui, G.; Zhao, J. EGS-YOLO: A Fast and Reliable Safety Helmet Detection Method Modified Based on YOLOv7. Appl. Sci. 2024, 14, 7923. [Google Scholar] [CrossRef]
- Liu, L.; Guo, Z.; Liu, Z.; Zhang, Y.; Cai, R.; Hu, X.; Yang, R.; Wang, G. Multi-Task Intelligent Monitoring of Construction Safety Based on Computer Vision. Buildings 2024, 14, 2429. [Google Scholar] [CrossRef]
- Farouk, A.M.; Naganathan, H.; Rahman, R.A.; Kim, J. Exploring the Economic Viability of Virtual Reality in Architectural, Engineering, and Construction Education. Buildings 2024, 14, 2655. [Google Scholar] [CrossRef]
- Pracucci, A. Designing Digital Twin with IoT and AI in Warehouse to Support Optimization and Safety in Engineer-to-Order Manufacturing Process for Prefabricated Building Products. Appl. Sci. 2024, 14, 6835. [Google Scholar] [CrossRef]
- Khan, A.M.; Tariq, M.A.; Rehman, S.K.U.; Saeed, T.; Alqahtani, F.K.; Sherif, M. BIM Integration with XAI Using LIME and MOO for Automated Green Building Energy Performance Analysis. Energies 2024, 17, 3295. [Google Scholar] [CrossRef]
- Adewale, B.A.; Ene, V.O.; Ogunbayo, B.F.; Aigbavboa, C.O. A Systematic Review of the Applications of AI in a Sustainable Building’s Lifecycle. Buildings 2024, 14, 2137. [Google Scholar] [CrossRef]
- Beskopylny, A.N.; Shcherban’, E.M.; Stel’makh, S.A.; Mailyan, L.R.; Meskhi, B.; Razveeva, I.; Kozhakin, A.; Beskopylny, N.; El’shaeva, D.; Artamonov, S. Method for Concrete Structure Analysis by Microscopy of Hardened Cement Paste and Crack Segmentation Using a Convolutional Neural Network. J. Compos. Sci. 2023, 7, 327. [Google Scholar] [CrossRef]
- Ge, Y.; Jiang, D.; Sun, L. Wood Veneer Defect Detection Based on Multiscale DETR with Position Encoder Net. Sensors 2023, 23, 4837. [Google Scholar] [CrossRef] [PubMed]
- Liu, J.; Yang, Z.; Qi, H.; Jiao, T.; Li, D.; Wu, Z.; Zheng, N.; Xu, S. Deep learning-assisted automatic quality assessment of concrete surfaces with cracks and bugholes. Adv. Eng. Inform. 2024, 62, 102577. [Google Scholar] [CrossRef]
- Zhangabay, N.; Chepela, D.; Tursunkululy, T.; Zhangabay, A.; Kolesnikov, A. Analysis of the effect of porosity on thermal conductivity with consideration of the internal structure of arbolite. Constr. Mater. Prod. 2024, 7, 4. [Google Scholar] [CrossRef]
- Panfilov, A.V.; Yusupov, A.R.; Korotkiy, A.A.; Ivanov, B.F. On the Control of the Technical Condition of Elevator Ropes Based on Artificial Intelligence and Computer Vision Technology. Adv. Eng. Res. 2022, 22, 323–330. [Google Scholar] [CrossRef]
- Kondratieva, T.N.; Chepurnenko, A.S. Prediction of the Strength of the Concrete-Filled Tubular Steel Columns Using the Artificial Intelligence. Mod. Trends Constr. Urban Territ. Plan. 2024, 3, 40–48. [Google Scholar] [CrossRef]
- Tanyildizi, H. Deep learning–based prediction of compressive strength of eco-friendly geopolymer concrete. Environ. Sci. Pollut. Res. 2024, 31, 41246–41266. [Google Scholar] [CrossRef]
- Al Ali, M.; Shimoda, M.; Naguib, M. Optimizing Additive Manufacturable Structures with Computer Vision to Enhance Material Efficiency and Structural Stability. Modelling 2024, 5, 1286–1297. [Google Scholar] [CrossRef]
- Silva, J.M.; Wagner, G.; Silva, R.; Morais, A.; Ribeiro, J.; Mould, S.; Figueiredo, B.; Nóbrega, J.M.; Cruz, P.J.S. Real-Time Precision in 3D Concrete Printing: Controlling Layer Morphology via Machine Vision and Learning Algorithms. Inventions 2024, 9, 80. [Google Scholar] [CrossRef]
- Qi, Y.; Ding, Z.; Luo, Y.; Ma, Z. A Three-Step Computer Vision-Based Framework for Concrete Crack Detection and Dimensions Identification. Buildings 2024, 14, 2360. [Google Scholar] [CrossRef]
- Luo, K.; Kong, X.; Zhang, J.; Hu, J.; Li, J.; Tang, H. Computer Vision-Based Bridge Inspection and Monitoring: A Review. Sensors 2023, 23, 7863. [Google Scholar] [CrossRef] [PubMed]
- Del Savio, A.A.; Luna Torres, A.; Cárdenas Salas, D.; Vergara Olivera, M.A.; Urday Ibarra, G.T. Detection and Evaluation of Construction Cracks through Image Analysis Using Computer Vision. Appl. Sci. 2023, 13, 9662. [Google Scholar] [CrossRef]
- Perez, H.; Tah, J.H.M. Towards Automated Measurement of As-Built Components Using Computer Vision. Sensors 2023, 23, 7110. [Google Scholar] [CrossRef]
- Kim, B.; Cho, S. Automated Multiple Concrete Damage Detection Using Instance Segmentation Deep Learning Model. Appl. Sci. 2020, 10, 8008. [Google Scholar] [CrossRef]
- Beskopylny, A.N.; Shcherban’, E.M.; Stel’makh, S.A.; Mailyan, L.R.; Meskhi, B.; Razveeva, I.; Kozhakin, A.; El’shaeva, D.; Beskopylny, N.; Onore, G. Detecting Cracks in Aerated Concrete Samples Using a Convolutional Neural Network. Appl. Sci. 2023, 13, 1904. [Google Scholar] [CrossRef]
- Huang, C.; Zhou, Y.; Xie, X. Intelligent Diagnosis of Concrete Defects Based on Improved Mask R-CNN. Appl. Sci. 2024, 14, 4148. [Google Scholar] [CrossRef]
- Al-Zaidawi, S.M.K.; Bosse, S. A Pore Classification System for the Detection of Additive Manufacturing Defects Combining Machine Learning and Numerical Image Analysis. Eng. Proc. 2023, 58, 122. [Google Scholar] [CrossRef]
- Malche, T.; Tharewal, S.; Dhanaraj, R.K. Automated Damage Detection on Concrete Structures Using Computer Vision and Drone Imagery. Eng. Proc. 2023, 58, 60. [Google Scholar] [CrossRef]
- Sobol, B.V.; Soloviev, A.N.; Vasiliev, P.V.; Lyapin, A.A. Modeling of Ultrasonic Flaw Detection Processes in the Task of Searching and Visualizing Internal Defects in Assemblies and Structures. Adv. Eng. Res. 2023, 23, 433–450. [Google Scholar] [CrossRef]
- Chen, Q.; Wen, X.; Lu, S.; Sun, D. Corrosion Detection for Large Steel Structure base on UAV Integrated with Image Processing System. IOP Conf. Ser. Mater. Sci. Eng. 2019, 608, 012020. [Google Scholar] [CrossRef]
- Beskopylny, A.N.; Stel’makh, S.A.; Shcherban’, E.M.; Razveeva, I.; Kozhakin, A.; Meskhi, B.; Chernil’nik, A.; Elshaeva, D.; Ananova, O.; Girya, M.; et al. Computer Vision Method for Automatic Detection of Microstructure Defects of Concrete. Sensors 2024, 24, 4373. [Google Scholar] [CrossRef] [PubMed]
- Qayyum, W.; Ehtisham, R.; Bahrami, A.; Mir, J.; Khan, Q.U.Z.; Ahmad, A.; Özkılıç, Y.O. Predicting characteristics of cracks in concrete structure using convolutional neural network and image processing. Front. Mater. 2023, 10, 1210543. [Google Scholar] [CrossRef]
- Bangaru, S.S.; Wang, C.; Zhou, X.; Hassan, M. Scanning electron microscopy (SEM) image segmentation for microstructure analysis of concrete using U-net convolutional neural network. Autom. Constr. 2022, 144, 104602. [Google Scholar] [CrossRef]
- Suo, L.; Wang, Z.; Liu, H.; Cui, L.; Sun, X.; Qin, X. Innovative Deep Learning Approaches for High-Precision Segmentation and Characterization of Sandstone Pore Structures in Reservoirs. Appl. Sci. 2024, 14, 7178. [Google Scholar] [CrossRef]
- Li, D.; You, S.; Liao, Q.; Lei, G.; Liu, X.; Chen, W.; Li, H.; Liu, B.; Guo, X. Permeability Prediction of Nanoscale Porous Materials Using Discrete Cosine Transform-Based Artificial Neural Networks. Materials 2023, 16, 4668. [Google Scholar] [CrossRef]
- Jia, M.; Huang, W.; Li, Y. Quantitative Characterization of Pore Structure Parameters in Coal Based on Image Processing and SEM Technology. Energies 2023, 16, 1663. [Google Scholar] [CrossRef]
- Angiulli, G.; Burrascano, P.; Ricci, M.; Versaci, M. Advances in the Integration of Artificial Intelligence and Ultrasonic Techniques for Monitoring Concrete Structures: A Comprehensive Review. J. Compos. Sci. 2024, 8, 531. [Google Scholar] [CrossRef]
- Nguyen, C.L.; Nguyen, A.; Brown, J.; Byrne, T.; Ngo, B.T.; Luong, C.X. Optimising Concrete Crack Detection: A Study of Transfer Learning with Application on Nvidia Jetson Nano. Sensors 2024, 24, 7818. [Google Scholar] [CrossRef]
- Shang, L.; Zhang, Z.; Tang, F.; Cao, Q.; Yodo, N.; Pan, H.; Lin, Z. Deep Learning Enriched Automation in Damage Detection for Sustainable Operation in Pipelines with Welding Defects under Varying Embedment Conditions. Computation 2023, 11, 218. [Google Scholar] [CrossRef]
- Arafin, P.; Issa, A.; Billah, A.H.M.M. Performance Comparison of Multiple Convolutional Neural Networks for Concrete Defects Classification. Sensors 2022, 22, 8714. [Google Scholar] [CrossRef]
- Ichi, E.; Jafari, F.; Dorafshan, S. SDNET2021: Annotated NDE Dataset for Subsurface Structural Defects Detection in Concrete Bridge Decks. Infrastructures 2022, 7, 107. [Google Scholar] [CrossRef]
- Zheng, Y.; Wang, S.; Zhang, P.; Xu, T.; Zhuo, J. Application of Nondestructive Testing Technology in Quality Evaluation of Plain Concrete and RC Structures in Bridge Engineering: A Review. Buildings 2022, 12, 843. [Google Scholar] [CrossRef]
- Kang, H.; Zhou, F.; Gao, S.; Xu, Q. Crack Detection of Concrete Based on Improved CenterNet Model. Appl. Sci. 2024, 14, 2527. [Google Scholar] [CrossRef]
- Li, J.; Lu, X.; Zhang, P.; Li, Q. Intelligent Detection Method for Concrete Dam Surface Cracks Based on Two-Stage Transfer Learning. Water 2023, 15, 2082. [Google Scholar] [CrossRef]
- Xu, Y.; Li, Y.; Zheng, X.; Zheng, X.; Zhang, Q. Computer-Vision and Machine-Learning-Based Seismic Damage Assessment of Reinforced Concrete Structures. Buildings 2023, 13, 1258. [Google Scholar] [CrossRef]
- Razveeva, I.; Kozhakin, A.; Beskopylny, A.N.; Stel’makh, S.A.; Shcherban’, E.M.; Artamonov, S.; Pembek, A.; Dingrodiya, H. Analysis of Geometric Characteristics of Cracks and Delamination in Aerated Concrete Products Using Convolutional Neural Networks. Buildings 2023, 13, 3014. [Google Scholar] [CrossRef]
- Beskopylny, A.N.; Shcherban’, E.M.; Stel’makh, S.A.; Mailyan, L.R.; Meskhi, B.; Razveeva, I.; Kozhakin, A.; El’shaeva, D.; Beskopylny, N.; Onore, G. Discovery and Classification of Defects on Facing Brick Specimens Using a Convolutional Neural Network. Appl. Sci. 2023, 13, 5413. [Google Scholar] [CrossRef]
- Samchenko, S.V.; Korshunov, A.V. Formation of Cellular Concrete Structures Based on Waste Glass and Liquid Glass. Buildings 2024, 14, 17. [Google Scholar] [CrossRef]
- Stel’makh, S.A.; Shcherban’, E.M.; Beskopylny, A.N.; Mailyan, L.R.; Meskhi, B.; Shilov, A.A.; Mailyan, A.L.; Zakieva, N.I.; Chernil’nik, A.; El’shaeva, D. Structural Formation and Properties of Eco-Friendly Foam Concrete Modified with Coal Dust. J. Compos. Sci. 2023, 7, 519. [Google Scholar] [CrossRef]
- Ioana, A.; Paunescu, L.; Constantin, N.; Rucai, V.; Dobrescu, C.; Pasare, V.; Istrate, A. High-Strength and Heat-Insulating Cellular Building Concrete Based on Calcined Gypsum. Materials 2023, 16, 118. [Google Scholar] [CrossRef]
- Zhang, H.; Trottier, C.; Sanchez, L.F.M.; Allard, A. An Integrated Framework for Image Acquisition, Processing, and Analysis Procedures for Automated Damage Evaluation of Concrete Surfaces. Materials 2024, 17, 813. [Google Scholar] [CrossRef]
- Abgaz, Y.; Rocha Souza, R.; Methuku, J.; Koch, G.; Dorn, A. A Methodology for Semantic Enrichment of Cultural Heritage Images Using Artificial Intelligence Technologies. J. Imaging 2021, 7, 121. [Google Scholar] [CrossRef]
- Razveeva, I.F.; Kozhakin, A.N.; Khasykov, B.A.; Girya, M.M.; Sitdikov, A.D.; Onore, G.S. BrightnessBooster. Russian Federation Computer Program 2024619486. 23 April 2024. Available online: https://new.fips.ru/registers-doc-view/fips_servlet?DB=EVM&DocNumber=2024619486&TypeFile=html (accessed on 5 January 2025).
- Khanam, R.; Hussain, M. YOLOv11: An Overview of the Key Architectural Enhancements. arXiv 2024. [Google Scholar] [CrossRef]
- GOST 7076; Building Materials and Products. Method of Determination of Steady-State Thermal Conductivity and Thermal Resistance. Russian National Standard (GOST): Moscow, Russia, 1999. Available online: https://docs.cntd.ru/document/1200005006?ysclid=mbz9nz44wo724635017 (accessed on 8 June 2025).
- ASTM C518; Standard Test Method for Steady-State Thermal Transmission Properties. American Society for Testing and Materials (ASTM): West Conshohocken, PA, USA, 2023. Available online: https://www.intertek.com/building/standards/astm-c518/ (accessed on 8 June 2025).
- Szeliski, R. Computer Vision: Algorithms and Applications, 2nd ed.; Springer: Cham, Switzerland, 2022; 925p. [Google Scholar] [CrossRef]
- Krantz, S.G.; Srinivasa, A.S.R.; Rao, C.R. (Eds.) Handbook of Statistics. In Artifical Intelligence; Elsevier B.V.: Amsterdam, The Netherlands, 2023; Volume 49, 242p, Available online: https://www.sciencedirect.com/handbook/handbook-of-statistics/vol/49/suppl/C (accessed on 8 June 2025).
- Wikipedia. Available online: https://en.wikipedia.org/wiki/Log-normal_distribution (accessed on 8 June 2025).
- Sokhansefat, G.; Moradian, M.; Finnell, M.; Behravan, A.; Ley, M.; Lucero, C.; Weiss, W. Using X-ray Computed Tomography to Investigate Mortar Subjected to Freeze-Thaw Cycles. Cem. Concr. Compos. 2020, 108, 103520. [Google Scholar] [CrossRef]
- Mahmud, B.U.; Hong, G.Y.; Mamun, A.A.; Ping, E.P.; Wu, Q. Deep Learning-Based Segmentation of 3D Volumetric Image and Microstructural Analysis. Sensors 2023, 23, 2640. [Google Scholar] [CrossRef] [PubMed]
- Gaviria-Hdz, J.F.; Medina, L.J.; Mera, C.; Chica, L.; Sepulveda-Cano, L.M. Assessment of segmentation methods for pore detection in cellular concrete images. In Proceedings of the 2019 XXII Symposium on Image, Signal Processing and Artificial Vision (STSIVA), Bucaramanga, Colombia, 24–26 April 2019; pp. 1–5. [Google Scholar] [CrossRef]
- Reedy, C.L.; Reedy, C.L. High-resolution micro-CT with 3D image analysis for porosity characterization of historic bricks. Herit Sci 2022, 10, 83. [Google Scholar] [CrossRef]
- Markin, S.; Sahmenko, G.; Korjakins, A.; Mechtcherine, V. The Impact of Production Techniques on Pore Size Distribution in High-Strength Foam Concrete. Infrastructures 2025, 10, 14. [Google Scholar] [CrossRef]
- Zhang, P.; Ding, J.; Guo, J.; Wang, F. Fractal Analysis of Cement-Based Composite Microstructure and Its Application in Evaluation of Macroscopic Performance of Cement-Based Composites: A Review. Fractal Fract. 2024, 8, 304. [Google Scholar] [CrossRef]
- Rao, S.M.; Acharya, I.P. Mercury Intrusion Porosimetry Studies with Geopolymers. Indian Geotech. J. 2017, 47, 495–502. [Google Scholar] [CrossRef]
- Yudin, V.V.; Shurygina, M.P.; Egorikhina, M.N.; Aleynik, D.Y.; Linkova, D.D.; Charykova, I.N.; Kovylin, R.S.; Chesnokov, S.A. Pore Structure Tuning of Poly-EGDMA Biomedical Material by Varying the O-Quinone Photoinitiator. Polymers 2023, 15, 2558. [Google Scholar] [CrossRef] [PubMed]
- Zheng, S.; Yao, Y.; Zhang, S.; Liu, Y.; Yang, J. Insights into Multifractal Characterization of Coals by Mercury Intrusion Porosimetry. Energies 2019, 12, 4743. [Google Scholar] [CrossRef]
- Zeng, Q.; Li, K.; Fen-Chong, T.; Dangla, P. Pore structure of cement pastes through NAD and MIP analysis. Adv. Cem. Res. 2016, 28, 23–32. [Google Scholar] [CrossRef]
- Chen, R.; Dou, T.; Shi, X.; Lin, M.; Yang, Q. Mechanism of Pore Structure Evolution in Tight Sandstone Subjected to ScCO2–H2O Treatment. Processes 2025, 13, 896. [Google Scholar] [CrossRef]


| Raw Materials | Property | Value |
|---|---|---|
| Portland cement grade CEM I 42.5N JSC “CEMROS” (Voronezh, Russia) | Setting times (min) -Start -End | 190 240 |
| Standard consistency of cement paste (%) | 26.0 | |
| Compressive strength at 28 days (MPa) | 52.8 | |
| Bending strength at 28 days (MPa) | 6.0 | |
| Quartz sand (Don Resource, Kagalnik, Russia) | Bulk density (kg/m3) | 1335 |
| Apparent density (kg/m3) | 2587 | |
| The content of dust and clay particles (%) | 0.03 | |
| Content of clay in lumps (%) | 0 | |
| Aluminum powder PAP-1 OOO “SKIF” (Saint Petersburg, Russia) | Bulk density of powder (g/cm3) | 0.3 |
| Content of active aluminum (%) | 92 | |
| Gypsum molding produced by Magma LLC (Moscow, Russia) | Bulk density (kg/m3) | 650 |
| Fineness of grinding, residue on a sieve with a clear cell size of 0.2 mm (%) | 0.8 | |
| Ultimate compressive strength of prism samples 2 h (MPa) | 7.3 | |
| Ultimate flexural strength of prism samples at 2 h (MPa) | 4.1 | |
| Lime produced by Roskhimprom LLC (Rostov-on-Don, Russia) | Content of active CaO and MgO (%) | 94.5 |
| Slaking rate (min) | 17 | |
| Content of hydrated water (%) | 2.1 |
| Component Name | Content (wt.%) |
|---|---|
| Portland cement | 26 |
| Quartz sand | 32 |
| Aluminum powder | 0.1 |
| Lime | 4.3 |
| Molding gypsum | 2.5 |
| Water | 35.1 |
| № | Modifications | Example |
|---|---|---|
| 1 | Merging |  |
| 2 | Vertical and horizontal mapping |  |
| 3 | Shifting the image along the Ox and Oy axes in a random order |  |
| 4 | Rotation of the picture by 90°, 180°, and 270° |  |
| 5 | Brightness, contrast and saturation changes |  |
| № | Characteristics | Value |
|---|---|---|
| 1 | Number of images in the training set | 70 |
| 2 | Number of images in the validation set | 20 |
| 3 | Number of images in the test set | 10 |
| 4 | MiniBatchSize | 5 |
| 5 | Number of epochs | 100 |
| 6 | Learning rate | 0.001 |
| 7 | Solver | Adam solver |
| Number | Sizes, cm | Volume, cm3 | Mass, g | Density, kg/m3 | Porosity | Thermal Conductivity, W/(m·K) |
|---|---|---|---|---|---|---|
| 1 | 10 × 10 × 2.1 | 210 | 117.0 | 557.1 ± 11.1 | 0.786 | 0.109 ± 0.006 |
| 2 | 115.0 | 547.6 ± 10.9 | 0.789 | 0.114 ± 0.007 | ||
| 3 | 109.5 | 521.4 ± 10.4 | 0.799 | 0.111 ± 0.006 |
| Porosity | Experimental Density, kg/m3 | Predicted Density, kg/m3 | Experimental Thermal Conductivity,W/(m·K) | Predicted Thermal Conductivity, W/(m·K) |
|---|---|---|---|---|
| 0.786 | 542.0 | 555.7 | 0.111 | 0.114 |
Disclaimer/Publisher’s Note: The statements, opinions and data contained in all publications are solely those of the individual author(s) and contributor(s) and not of MDPI and/or the editor(s). MDPI and/or the editor(s) disclaim responsibility for any injury to people or property resulting from any ideas, methods, instructions or products referred to in the content. |
© 2025 by the authors. Licensee MDPI, Basel, Switzerland. This article is an open access article distributed under the terms and conditions of the Creative Commons Attribution (CC BY) license (https://creativecommons.org/licenses/by/4.0/).
Share and Cite
Beskopylny, A.N.; Shcherban’, E.M.; Stel’makh, S.A.; Elshaeva, D.; Chernil’nik, A.; Razveeva, I.; Panfilov, I.; Kozhakin, A.; Madenci, E.; Aksoylu, C.; et al. Porosity Analysis and Thermal Conductivity Prediction of Non-Autoclaved Aerated Concrete Using Convolutional Neural Network and Numerical Modeling. Buildings 2025, 15, 2442. https://doi.org/10.3390/buildings15142442
Beskopylny AN, Shcherban’ EM, Stel’makh SA, Elshaeva D, Chernil’nik A, Razveeva I, Panfilov I, Kozhakin A, Madenci E, Aksoylu C, et al. Porosity Analysis and Thermal Conductivity Prediction of Non-Autoclaved Aerated Concrete Using Convolutional Neural Network and Numerical Modeling. Buildings. 2025; 15(14):2442. https://doi.org/10.3390/buildings15142442
Chicago/Turabian StyleBeskopylny, Alexey N., Evgenii M. Shcherban’, Sergey A. Stel’makh, Diana Elshaeva, Andrei Chernil’nik, Irina Razveeva, Ivan Panfilov, Alexey Kozhakin, Emrah Madenci, Ceyhun Aksoylu, and et al. 2025. "Porosity Analysis and Thermal Conductivity Prediction of Non-Autoclaved Aerated Concrete Using Convolutional Neural Network and Numerical Modeling" Buildings 15, no. 14: 2442. https://doi.org/10.3390/buildings15142442
APA StyleBeskopylny, A. N., Shcherban’, E. M., Stel’makh, S. A., Elshaeva, D., Chernil’nik, A., Razveeva, I., Panfilov, I., Kozhakin, A., Madenci, E., Aksoylu, C., & Özkılıç, Y. O. (2025). Porosity Analysis and Thermal Conductivity Prediction of Non-Autoclaved Aerated Concrete Using Convolutional Neural Network and Numerical Modeling. Buildings, 15(14), 2442. https://doi.org/10.3390/buildings15142442