1. Introduction
The subway cross-passage connects two tunnels, facilitating drainage, ensuring fire safety, and playing a critical role in the safe operation of subway tunnels. Artificial ground freezing (AGF) is a widely used reinforcement technique in subway cross-passage construction. This method involves freezing natural soil in water-rich geological conditions to form artificial frozen soil, thereby enhancing the soil’s strength, water resistance, and integrity. The process results in the formation of a freezing curtain, which effectively protects the excavation of underground projects. The AGF method presents significant advantages over traditional reinforcement techniques in conditions with high groundwater content, and this study adopts a combined approach that integrates weak soil [
1]. However, the inherent characteristics of freezing technology induce water phase transitions during the process, leading to soil freezing and swelling. During thawing, water transitions from solid to liquid, resulting in soil thawing and settlement. Excavation under the protection of the frozen curtain further disturbs the soil, inevitably causing additional stress and displacement in both the soil and adjacent structures. Although cross-passage stress is simpler than tunnel stress, the construction of the cross-passage will change the stress distribution of the tunnel, resulting in stress concentration and the formation of unfavorable tensile stress [
2,
3,
4].
Under complex geological and hydrological conditions, particularly in water-rich environments, uneven settlement caused by freezing and thawing significantly increases construction risks for cross-passages [
5,
6,
7]. If the effects of the freezing method fail to meet design specifications, it can jeopardize the safety of underground structures and surface buildings, potentially leading to catastrophic accidents [
1,
8].
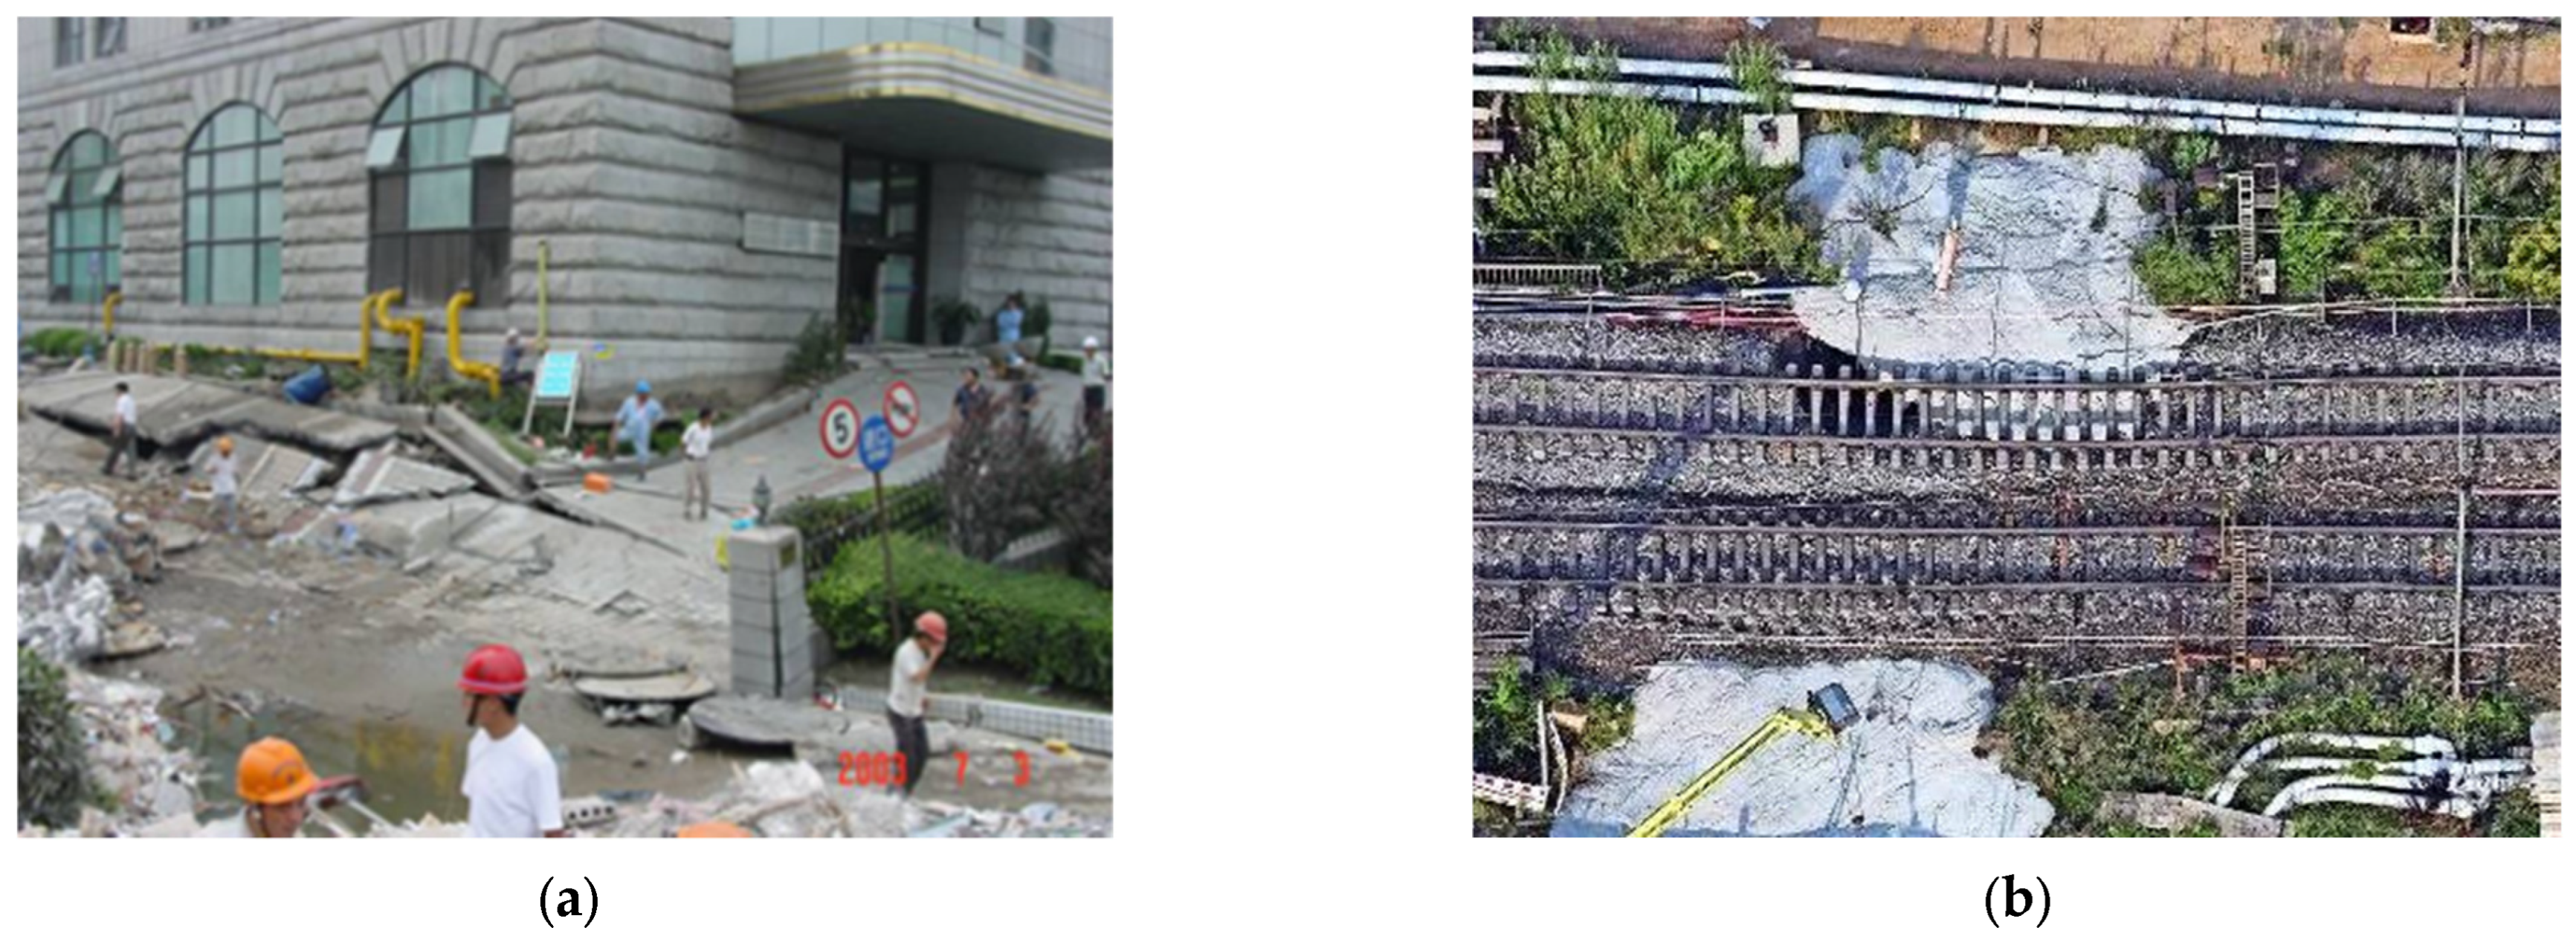
Figure 1a illustrates a severe ground collapse in the cross-river tunnel of Line 4, Shanghai Railway Transportation, caused by insufficient freezing tubes, inadequate tube length, and insufficient freezing time.
Figure 1b depicts the collapse of a shield-method tunnel beneath a railroad in the Rhine Valley, Rastatt region, Germany, during freezing method construction. As these adverse phenomena are present throughout the entire AGF construction process, a systematic study of the complete process of cross-passage construction under AGF reinforcement conditions will provide a deeper understanding of the impact mechanisms of adverse phenomena, such as frost heave and freeze–thaw, on construction. This study will also aid in optimizing the construction plan, effectively controlling construction risks, ensuring project quality and safety, and offering valuable guidance for similar projects.
The frost heave and freeze–thaw settlement of foundations are critical to the stability of the foundation and the safety of engineering structures. Theoretical research on frost heave and freeze–thaw settlement helps to understand changes in the mechanical and hydraulic properties of soil. Research in [
9] proposed a new method based on micromechanical principles to evaluate soil deformation caused by frost heave forces, revealing the unique inclusion morphology in frozen soil. Zhang et al. developed an analytical solution for frost heave force that incorporates freeze–thaw cycle damage and the transverse anisotropy of the surrounding rock [
10]. Sun et al. explored the spatiotemporal distribution of temperature and moisture under long-term freeze–thaw cycles by establishing a coupled hydro-thermal-mechanical model [
11]. To mitigate the effects of frost heave and freeze–thaw settlement, it is essential to understand and predict soil temperature field distributions. Theoretical analytical models are crucial for predicting the distribution of soil temperature fields, frozen wall thickness, strength, and other key parameters. In recent years, numerous domestic and international scholars have conducted extensive theoretical explorations on the effects of frozen temperature fields. Hu et al. developed analytical models for the temperature field distribution of single-tube, double-tube, and annular frozen walls using the mirror method, potential function superposition method, and conformal mapping method, respectively [
12,
13]. Li et al. developed an analytical model to characterize the steady-state temperature field in linear three-pipe freezing systems operating under hydrodynamic conditions. Their model introduced the concept of “superposition length ratio” as a quantitative measure of the thermal interaction between adjacent freezing pipes [
14]. Building upon this work, Yang et al. subsequently derived an analytical solution for the steady-state temperature field in arc-shaped three-pipe liquid nitrogen freezing systems under adiabatic boundary conditions [
15]. Shao et al. simplified the double-row pipe freezing problem into a single-row pipe problem through a special transformation and further derived the analytical solution for the freezing temperature field of double-loop pipes [
16].
However, these analytical models are often difficult to apply directly in practical engineering due to the complexity and uncertainty of field conditions, and actual validation is required to ensure their accuracy. In this context, laboratory experiments have become an important means of validation. Therefore, experimental studies play a critical role in validating and improving theoretical models, particularly in studying the distribution patterns of freezing temperatures and soil deformation [
17,
18,
19], providing valuable data support and practical validation [
20]. Some scholars have conducted large-scale model tests: Qi et al. and Cai et al. designed large-scale model experiments focusing on gravel soil layers and subway tunnel freezing problems, respectively, investigating the impact of seepage and frost heave deformation patterns, and revealing the relationship between the formation time of frozen walls and soil displacement [
21,
22,
23].
Different geological conditions have varying impacts on freezing construction, and field conditions are difficult to replicate, necessitating repeated experiments that are time-consuming, labor-intensive, and costly. Consequently, numerous researchers have employed field monitoring and numerical simulation methods to investigate AGF construction. The authors of [
24,
25] conducted field measurement studies on the cross-passage of the Shanghai Yangtze River Tunnel and the southern shield tunnel of the Shuanghe Lake Station on Zhengzhou Metro Line 17, respectively, investigating frost heave pressure and temperature distribution during tunnel construction. Advances in computer technology have established numerical simulation as a vital tool for investigating the effects of artificial ground freezing, enabling researchers to model frozen soil curtain formation, temperature field evolution, and environmental impacts. Early research focused primarily on single-physical-field analysis: a Guangzhou Metro case study employed 2D finite element methods to quantify the linear relationship between freezing duration and soil temperature, providing a numerical foundation for predicting freezing effects [
26]. Similarly, another study analyzed frozen soil behavior based solely on temperature field considerations, neglecting soil deformation induced by phase transitions [
27]. Subsequently, research evolved toward multi-field coupling approaches. Pioneering work developed a three-field coupling model that integrated freezing, temperature, and stress fields, revealing the dynamic characteristics of frost heave force distribution in both space and time [
28]. This advancement was followed by the application of thermal-hydro-mechanical coupling models to simulate frozen soil behavior [
29]. Further progress was made with the development of a coupled numerical model that incorporated ice–water phase transitions, with its applicability validated under water flow interference conditions using the Harbin Metro project [
30]. Most recently, Zheng et al. and Wu et al. have expanded the analytical scope of multi-field interactions by examining thermo-mechanical coupling deformation and energy conversion efficiency, ultimately establishing a comprehensive coupled framework encompassing “water-thermal-mechanical-energy” processes [
31,
32]. In terms of the engineering applicability of models, Fu et al. developed a three-dimensional transient model for the Nanning Metro cross-passage and found through parameter sensitivity analysis that the thermal conductivity of the stratum significantly contributes to freezing efficiency [
33]. Current numerical simulation techniques can partially replicate field conditions and reveal key patterns significant for predicting on-site freezing temperature fields and surface settlement. However, establishing a “field monitoring–numerical simulation” dynamic comparison mechanism is crucial to further ensure the engineering applicability of numerical models. In fact, numerous domestic and international scholars have conducted in-depth research and analysis of AGF technology by combining field measurement data with numerical simulation methods. Multi-field coupling models are an effective means for analyzing AGF technology and can significantly improve the accuracy and reliability of predictions by comprehensively considering the coupling of thermal and mechanical problems. Yan et al. and Song et al. used in situ monitoring data from subway projects in Suzhou, Guangzhou, Chengdu, and Shanghai, and significantly reduced the prediction error of three-dimensional refined numerical models through a comparative method of “field monitoring–numerical simulation.” These advancements indicate that numerical simulation has evolved from a single predictive tool to a comprehensive analysis platform integrating mechanism revelation, parameter optimization, and engineering feedback [
34,
35,
36,
37].
In summary, scholars have conducted studies on cross-passage freezing construction through theoretical analysis, field measurements, and numerical simulations. However, existing numerical models for freezing temperature fields often rely on simplified assumptions to ensure model convergence, resulting in discrepancies between simulations and actual field conditions. This limitation substantially reduces the accuracy and practical applicability of models’ predictions. While some studies have considered the effects of freezing pipe deviations on temperature field distribution, they frequently overlook the critical influence of pipe deflection—a common occurrence in projects due to oblique installation angles during construction. This simplification can lead to substantial errors in thermal and mechanical response predictions. To overcome these limitations, the present study introduces a comprehensive three-dimensional numerical model based on detailed field-measured data from an artificial ground freezing project of a double-line circular cross-river shield tunnel in Wuhan, China. Using FLAC3D 6.0 software, the model integrates freezing pipe deflection, thermo-mechanical coupling effects, and ice–water phase changes throughout the entire freezing construction process. This approach enables a more realistic simulation of the temperature, displacement, and stress fields during the active freezing, maintenance freezing, and natural thawing stages, providing more reliable predictions for engineering practice and advancing the understanding of artificial ground freezing mechanisms in complex underground construction projects.
2. Project Overview and Freezing Temperature Monitoring
2.1. Project Overview
This study focuses on a two-lane circular cross-river shield tunnel project located in Wuhan, China, with a total length of 1400 m, an inner diameter of 5.5 m, and a distance of 13 m between the central axes of the tunnels. The segmental lining of the tunnel is constructed using C30 reinforced concrete with a thickness of 350 mm. To enhance the safety and efficiency of the tunnel, the project designed five cross-passages and an interval wastewater pumping station.
Both the No. 3 cross-passage and the pumping station are situated beneath the river’s center. The tunnel elevation at the cross-passage location is −23.486 m on the left line and −23.737 m on the right line. The No. 3 cross-passage is 9.5 m long, with an average depth of 20.29 m, and headroom dimensions of 6.8 m (length) × 2.1 m (width) × 2.55 m (height). The pumping station has a headroom volume of 22.18 m3 and dimensions of 3.8 m (length) × 2.1 m (width) × 2.78 m (height). Both the cross-passage and the pumping station are lined with composite lining. The initial support system uses an I18 I-beam frame combined with 250 mm-thick shotcrete. The pumping station’s bottom plate is constructed using C40 cast-in-place reinforced concrete with a thickness of 800 mm.
Figure 2 illustrates the engineering geological profile of the No. 3 cross-passage and pumping station. The soil layers, listed from top to bottom, are silty fine sand, medium sand, silty fine sand, medium-coarse gravel sand, and decomposed argillaceous siltstone. The soil layer where the cross-passage is situated primarily comprises silty fine sand and gravelly medium-coarse sand. Given the high water content of this sandy soil layer, the freezing method was employed to reinforce the soil around the cross-passage, yielding effective stabilization. However, since the tunnel is situated in a high-head aquifer, it is subjected to significant water pressure. Excavation of the cross-passage and pumping station requires exposing the palm surface, which poses risks if the freezing method is not effective. There is a potential for soil flow or sand-layer water influx due to destabilization of the excavation surface, leading to substantial construction risks. Therefore, monitoring the freezing pipe temperature and conducting detailed numerical simulations throughout the construction process are essential.
2.2. Freezing Design
Based on extensive engineering practice and relevant code requirements, in order to ensure the integrity and uniformity of the frozen wall at the cross-passage and pumping station, the freezing pipes are arranged by drilling from both sides of the left and right line tunnels.
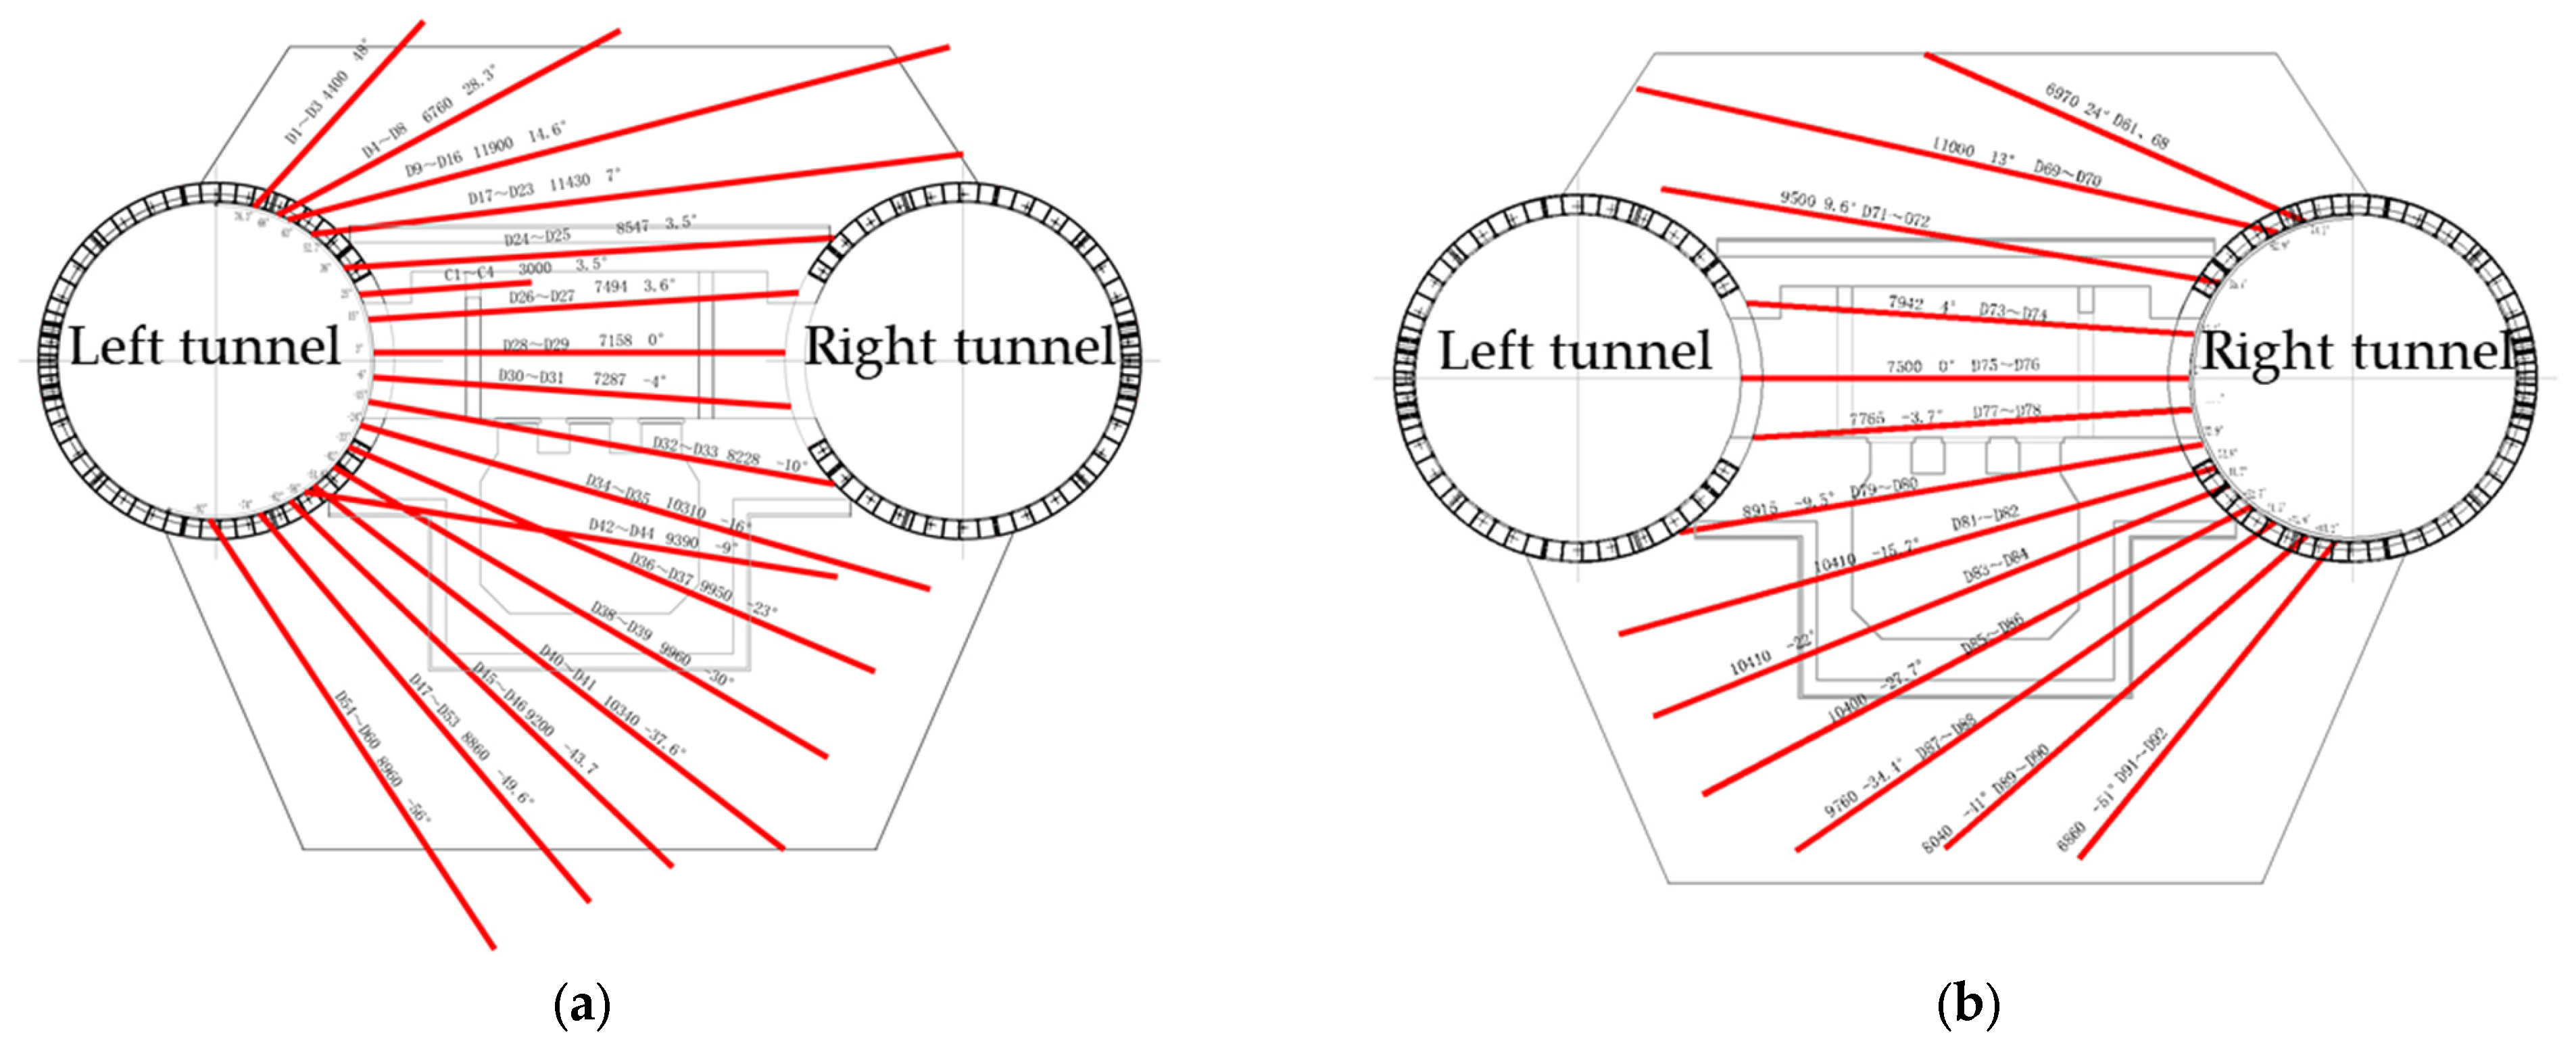
Figure 3 shows the layout of the freezing pipes for the cross-passage and pumping station. As shown in
Figure 3a, 60 freezing pipes are installed on the left tunnel line. The length of these pipes ranges from 2.5 m to 11.9 m, with inclination angles between −56° and 48°. Similarly, as depicted in
Figure 3b, 46 freezing pipes are installed on the right tunnel line, with lengths between 6.97 m and 11.0 m and inclination angles from −51° to 24°. The deflection of freezing pipes alters inter-pipe distances and spatial distribution, directly impacting heat conduction pathways and creating geometric deviation effects that significantly influence thermal and mechanical field performance. The freezing pipes are low-carbon seamless steel pipes with a diameter of 89 mm and a wall thickness of 8 mm. The compressive strength is no less than 0.8 MPa, exceeding 1.5 times the saltwater pressure at the freezing face.
The entire freezing and consolidation process is divided into two phases: the active freezing period and the maintenance freezing period. To form the design-specified freezing curtain during the active freezing period, the brine temperature was maintained below −28 °C, in compliance with regulatory [
38] requirements, sustained for 45 days with a single freezing pipe flow rate of no less than 5 m
3/h. In freezing method construction, the strict control of brine temperature stands as a crucial measure to guarantee project safety. During this phase, the freezing zone initially expanded outward from each freezing pipe, forming freezing columns around them. As freezing time progressed, these columns expanded further and intersected to gradually form a continuous freezing curtain. The active freezing period concluded when the freezing curtain thickness reached 3.1 m and the average ground stratum temperature fell below −10 °C. At this stage, the frozen soil strength design indices were as follows: compressive strength of 3.5 MPa, flexural strength of 1.8 MPa, and shear strength of 1.5 MPa. The thickness of the freezing curtain and the strength of frozen soil are critical factors for ensuring construction safety. The designed freezing curtain thickness and frozen soil strength in this project meet the regulatory [
38] requirements.
Following the active freezing phase, to ensure the safe construction of the cross-passage and pumping station, the brine temperature was maintained below −25 °C. Additionally, the temperature difference between the desalted water and the brine loop was kept within 2 °C to ensure effective coldness supplementation and stability of the frozen area. To align with construction progress, the maintenance freezing period was set to 20 days.
2.3. Field Monitoring
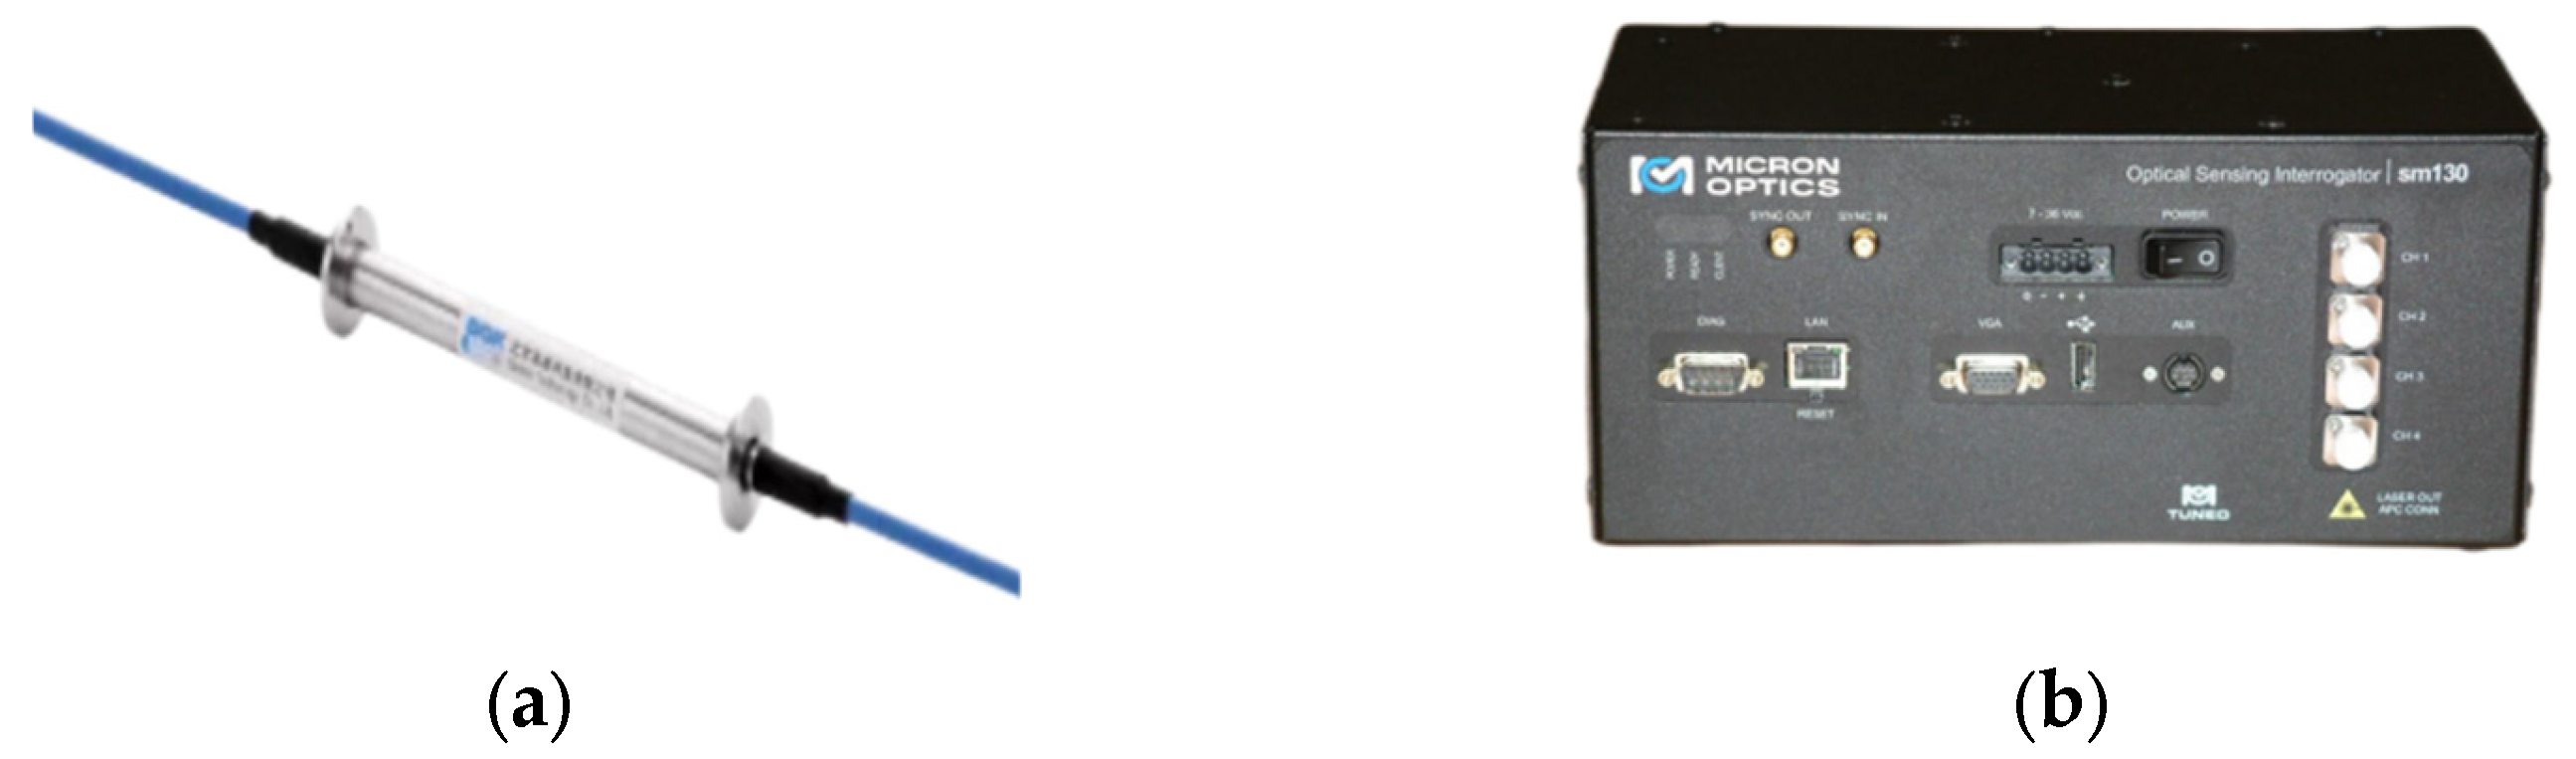
Temperature monitoring is a critical aspect of ensuring construction safety for the cross-passage and pumping station. To monitor the effects of freezing construction in real time, a temperature sensing system was employed to measure temperature change trends in real time. The system includes a BGK-FBG4000 fiber grating temperature-compensated strain gauge, manufactured by the American Geokon Company (Lebanon, NH, USA), and an SM130-700 fiber grating demodulator from American Micron Optics Company (Atlanta, GA, USA).
Figure 4 shows the BGK-FBG4000 strain gauge, which measures temperatures ranging from −50 °C to 150 °C with a precision of 0.1 °C, making it capable of accurately detecting temperature changes with high performance. The SM130-700 fiber grating demodulator, shown in
Figure 5, served as the core component for data acquisition and processing. It features four optical channels capable of receiving signals in the wavelength range of 1510–1590 nm, with a maximum scanning frequency of 2 kHz, ensuring real-time and accurate data acquisition. Additionally, the system offers data recording, analysis, and alarm functions, facilitating real-time processing and storage of monitoring data. These capabilities provided essential measured data support for subsequent analysis and research.
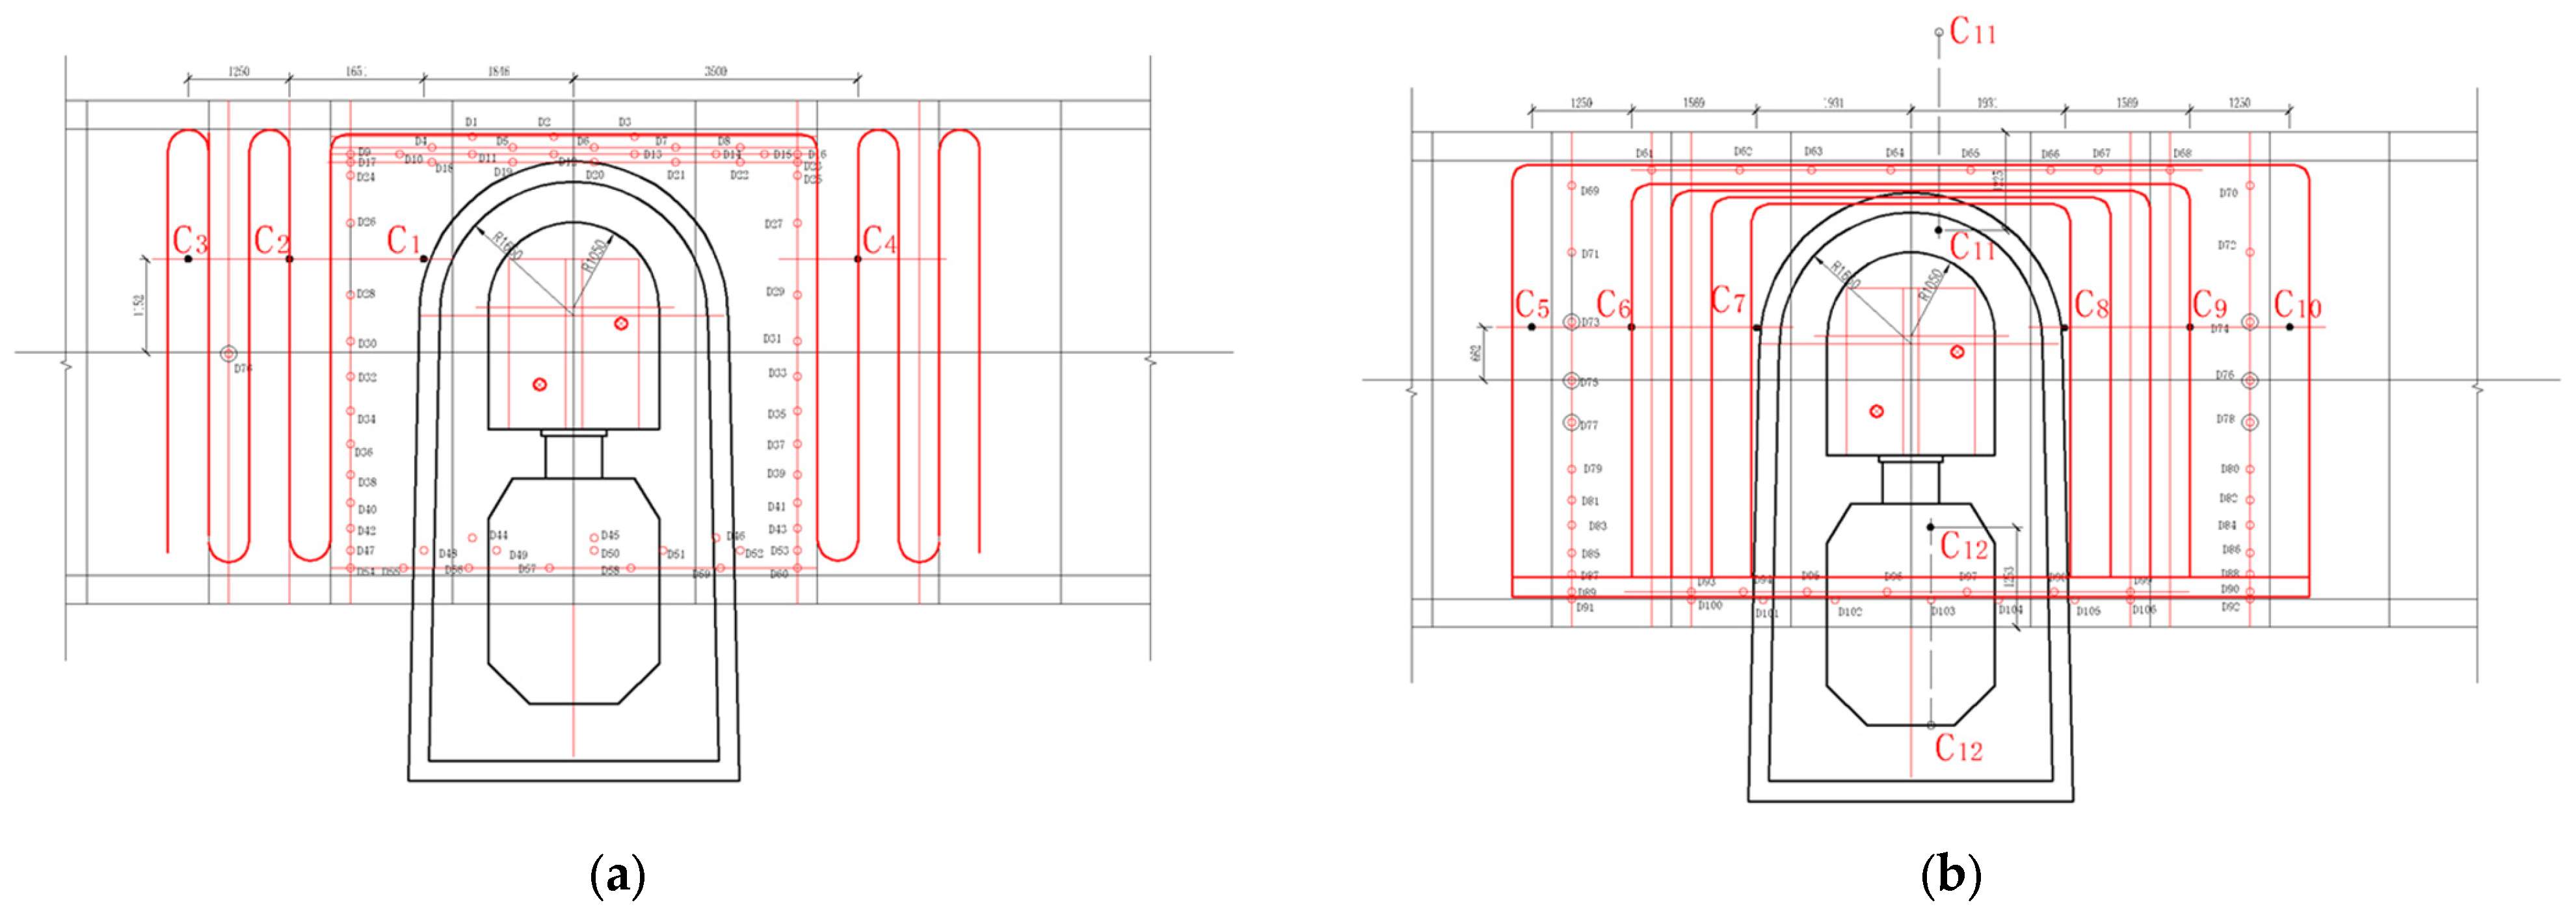
Figure 5 illustrates the arrangement of temperature measurement tubes in the cross-passage of this project. To ensure accurate and complete monitoring data, four pre-buried sensor temperature measurement tubes, labeled C1, C2, C3, and C4, extended from the left line to the right line of the tunnels. Similarly, six pre-buried sensor temperature measurement tubes, labeled C5, C6, C7, C8, C9, and C10, extended from the right tunnel line to the left tunnel line. Additionally, two temperature measurement tubes were positioned along the tunnel’s centerline, with one located in the tunnel’s upper section (labeled C11) and the other in the lower section (labeled C12).
To maintain a high sensor survival rate in the freezing monitoring tubes, three temperature measurement points were evenly distributed within each temperature monitoring tube. For instance, the points in tube C1 were numbered C1-1, C1-2, and C1-3. This arrangement resulted in 36 temperature measurement points throughout the project. These measurement points encompassed the entire freezing curtain, ensuring comprehensive temperature monitoring.
2.4. Field Temperature Monitoring Results
To analyze trends in the stratum temperature field, data from representative temperature measurement tubes were selected for comparative analysis.
Figure 6 shows the temperature variation curves of the monitoring points in the temperature measuring tubes C1–C12 over the freezing period. The temperature measuring tubes C1–C3 were drilled from the left tunnel line to the right and were located on the right side of the cross-passage. The temperature measuring tubes C5–C10 were drilled from the left tunnel line to the right, among which C5–C7 were located on the left side of the cross-passage, while C8–C10 were on the right side of the cross-passage. Additionally, temperature measuring tubes C11 and C12 were located above and below the centerline of the cross-passage, respectively.
Figure 6 illustrates that the temperature change trends during the freezing period were consistent across all temperature measuring points. In the early phase of active freezing, when temperatures in the soil remained above 0 °C, no phase change occurred in the soil moisture, and the temperature of the freezing pipe surface was significantly lower than that of the surrounding soil. During this period, the moisture in the soil flowed toward the freezing pipe and released heat, thereby cooling the surrounding soil. Additionally, the flow of water also helped transfer heat from other areas of the soil to the freezing pipe surface. This process caused a rapid decrease in soil temperature, which followed an approximately linear trend over time as freezing progressed. In the intermediate stage of active freezing, as the temperature dropped below 0 °C, soil moisture underwent a phase change to form ice crystals, causing the rate of temperature decrease to slow. When active freezing reached the later stage, as freezing time increased, the frozen soil curtain was formed, providing waterproofing and load-bearing capabilities. During the maintenance freezing period, although heat dissipation occurred during tunnel excavation, continuous freezing ensured that the soil temperature remained below the design threshold of −10 °C. In the early thawing phase, despite freezing ceasing, temperatures near the measuring tube continued to decline slightly due to residual cold brine, only starting to rise after 67 days. This indicates that the freezing effect of the frozen soil wall persisted over time. When the temperature of the frozen soil wall significantly differed from the external temperature, the temperature rise accelerated.
Figure 6a shows that the temperature at each measurement point of tubes C1 and C2 was higher than that of tube C3. The proximity of tubes C1 and C2 to the freezing pipe was evident, leading to a more rapid decrease in temperature at these locations and causing the surrounding soil to reach the design temperature more quickly. Similarly,
Figure 6b indicates that the temperatures at tubes C6 and C7 were lower and decreased more rapidly compared to tube C5. The positions of tubes C6 and C7, located on the inner side of the frozen wall near the cross-passage and pumping station, resulted in a smaller volume of soil involved in heat conduction and greater heat exchange with the freezing pipe. This combination accelerated the inward development of the frozen wall. In contrast, tube C5 was situated on the outer side of the freezing wall, where the range of soil participating in heat exchange was wider. Therefore, it can be seen that the freezing wall developed faster inward than outward.
Figure 6e compares the temperature changes of tubes C2 and C9. The temperature at tube C2 was significantly lower than that at tube C9 when both temperatures fell below 0 °C. According to the layout of the freezing pipes, tube C2 was situated directly above tube C9, in a region where the freezing pipe density in the upper soil of the cross-passage was higher. This observation confirmed that areas with a higher density of freezing pipes experienced lower temperatures during the same freezing duration.
A comparative analysis of temperature measurement tubes indicated that the density of freezing pipes significantly affected the freezing efficiency and temperature distribution. A higher density of freezing pipes created a more efficient heat exchange network, increasing the heat flow density within the freezing zone and accelerating heat transfer from the soil to the freezing pipes. However, external factors, such as construction activities in the cross-passage and groundwater flow, may induce temperature fluctuations. Construction activities can disturb the surrounding soil, affecting heat conduction pathways, while groundwater flow can carry heat away, potentially slowing the rate of temperature decline.
To gain a deeper understanding of the complex physical processes involved in cross-passage and pumping station construction using the freezing method, particularly the evolution of the temperature and displacement fields, a refined numerical simulation model needs to be developed to incorporate various factors and conditions of the actual project. These include the layout of freezing pipes, material properties, boundary conditions, and potential dynamic changes during construction. This comprehensive analysis of the interaction between the temperature and displacement fields provides a theoretical foundation for optimizing freezing construction design and enhancing project safety and cost efficiency.
4. Analysis of Fine Numerical Simulation Results
The coupled temperature-stress time-course calculations were carried out in FLAC3D based on the aforementioned calculation conditions. This section discusses the mechanical response of the full construction process during the three phases of active freezing, maintenance freezing, and thawing.
4.1. Active Freezing
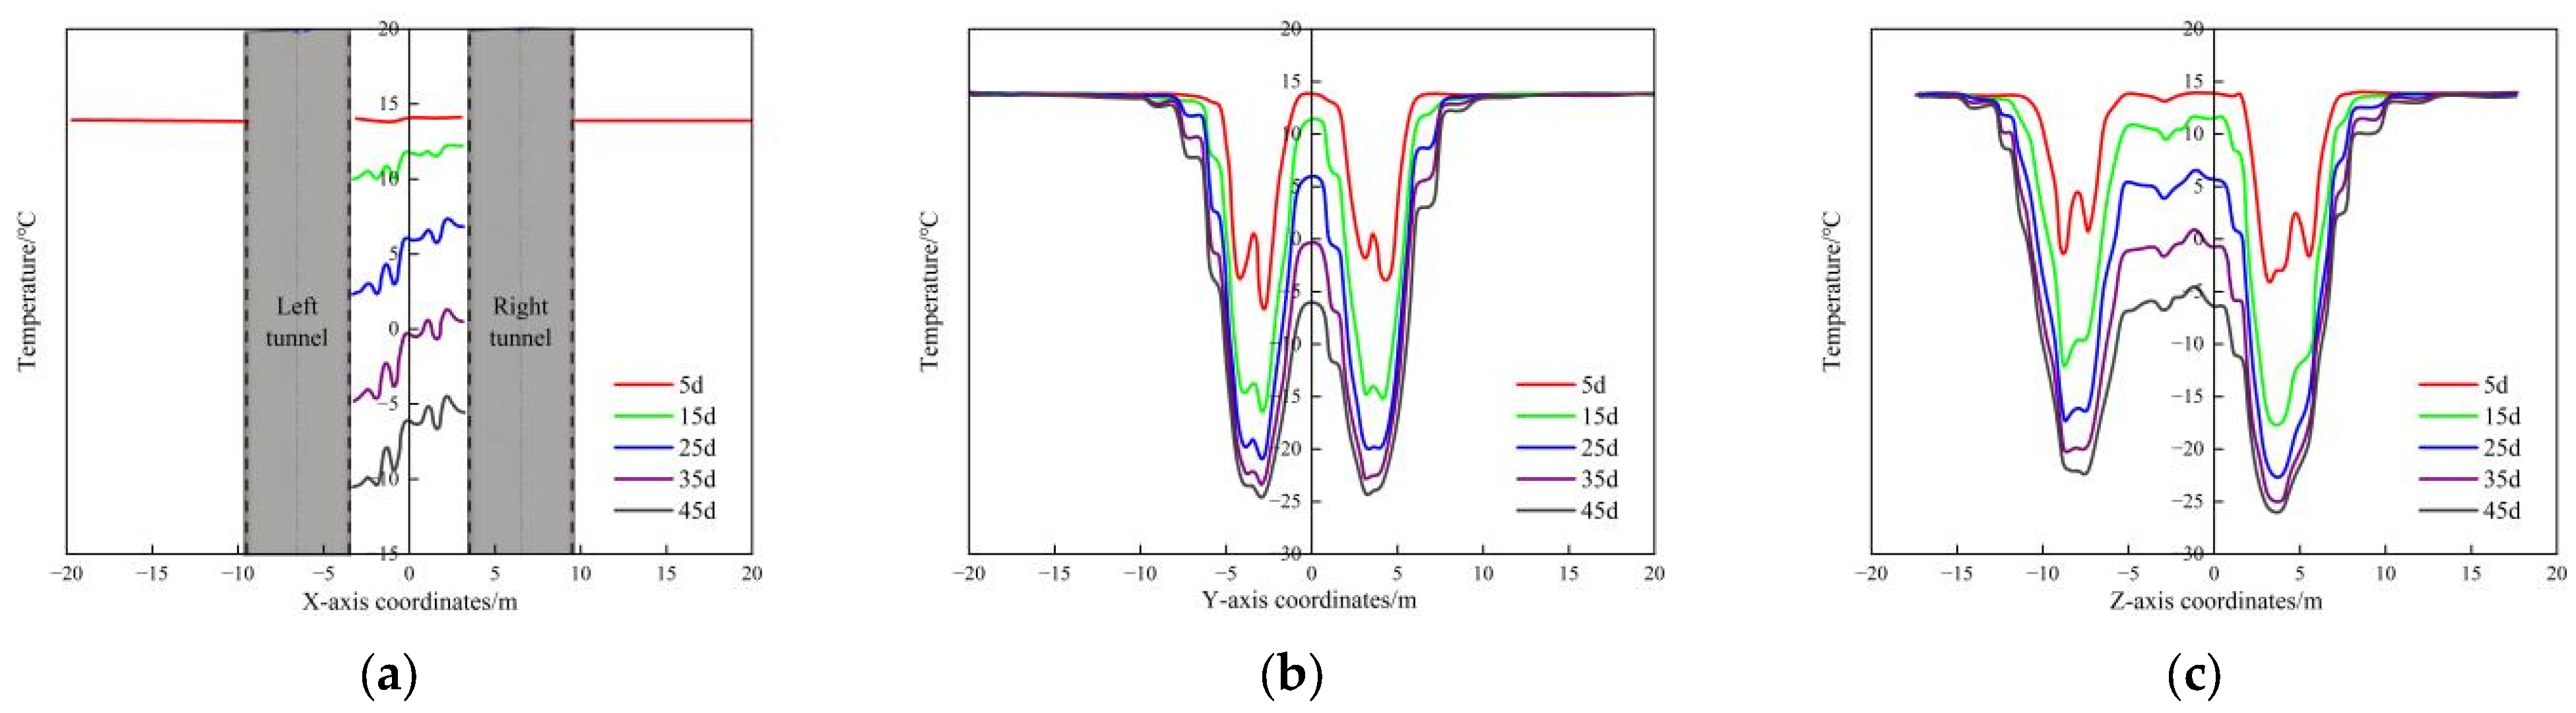
To illustrate the changes in temperature, displacement, and stress in various parts of the soil during the freezing process, particularly in the critical excavation area of the cross-passage, three measurement lines were established at the center of the numerical model along the x-, y-, and z-axes. The x-direction measurement line corresponds to the x-axis when y = 0 and z = 0, the y-direction measurement line corresponds to the y-axis when x = 0 and z = 0, and the z-direction measurement line corresponds to the z-axis when x = 0 and y = 0. All three measurement lines passed through the center of the excavation site of the cross-passage.
Figure 8 and
Table 3 present the temperature change curve over time during the active freezing period, and the corresponding temperature field distribution, respectively. From
Figure 8a, it can be observed that the temperature of the soil around the left tunnel was significantly lower than that around the right tunnel.
Table 3 shows that the temperature drop rate of the soil inside the frozen wall was greater than that of the soil outside, and the development rate of the frozen wall inward was higher than that outward. Together,
Figure 8 and
Table 3 demonstrate that, under the same freezing time, the temperature of the soil around the freezing pipe was significantly lower than that at the excavation site of the cross-passage, and the temperature of the upper soil in the cross-passage was lower than that of the lower soil. According to the freezing pipe layout scheme presented in this study, the density of freezing pipes in the left tunnel was greater than that in the right tunnel, and the density of freezing pipes in the upper soil of the cross-passage was greater than that in the lower soil. It can, therefore, be concluded that areas with a higher density of freezing pipes experienced lower temperatures over the same freezing period, and the soil in these areas froze first. This indicates that the interaction between the freezing pipes significantly affected the temperature changes. Therefore, the design of the freezing pipe’s length and deflection is critical to the success of the freezing construction.
Figure 8 compares the temperature trends along the three measurement lines (x, y, and z) over time. As the freezing time increased, the interval between the temperature curves gradually decreased, and the soil temperature change can be categorized into three stages: In the initial stage (0 to 15 days), the large temperature difference between the freezing pipe and the soil resulted in rapid heat conduction, causing a rapid decrease in soil temperature; in the middle stage (15 to 35 days), the soil continued to freeze, and as the temperature difference decreased, the rate of temperature decline slowed. In the final stage (35 to 45 days), the soil became fully frozen, and a smooth, uniform frozen curtain gradually formed. However,
Figure 8a shows that the temperature drop rate between 15 and 45 days was faster, which may be due to the delayed response of the soil farther from the freezing pipe to the changes in temperature within the frozen wall. The temperature change in this portion of the soil was primarily influenced by the temperature of the surrounding frozen soil.
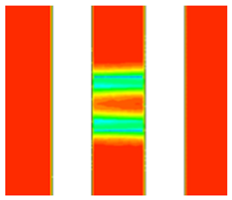
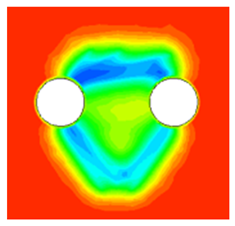
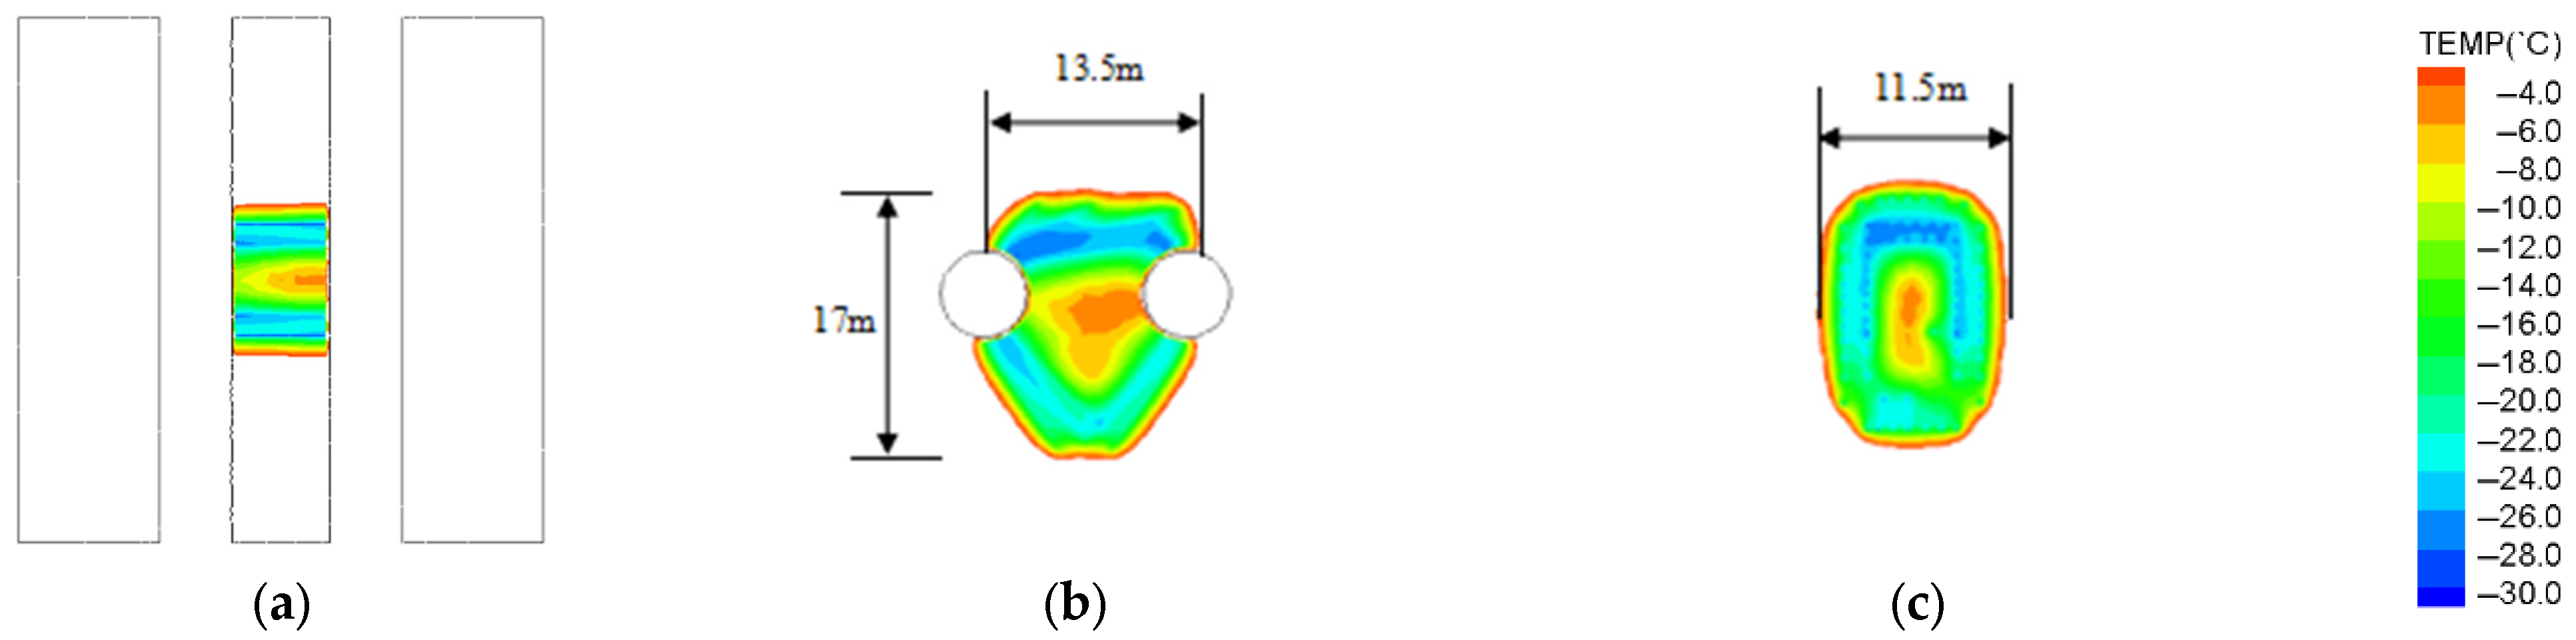
Figure 9 presents the cloud diagram of the freezing curtain after 45 days of active freezing. After 45 days of active freezing, a closed freezing curtain formed near the freezing pipe, with surrounding temperatures ranging from −25 to −20 °C, meeting the design requirements for a complete frozen curtain. Meanwhile, the temperature of the soil in the excavated area of the cross-passage ranged from −10 to −5 °C, satisfying the design criteria for soil strength. The frozen area dimensions reached 11.5 m in width and 17 m in height, with the thickness of the frozen curtain measuring 3.7 m, exceeding the design requirement of 3.1 m. These results confirm that, after 45 days of active freezing, a sufficiently strong and thick freezing curtain was established in the excavation area.
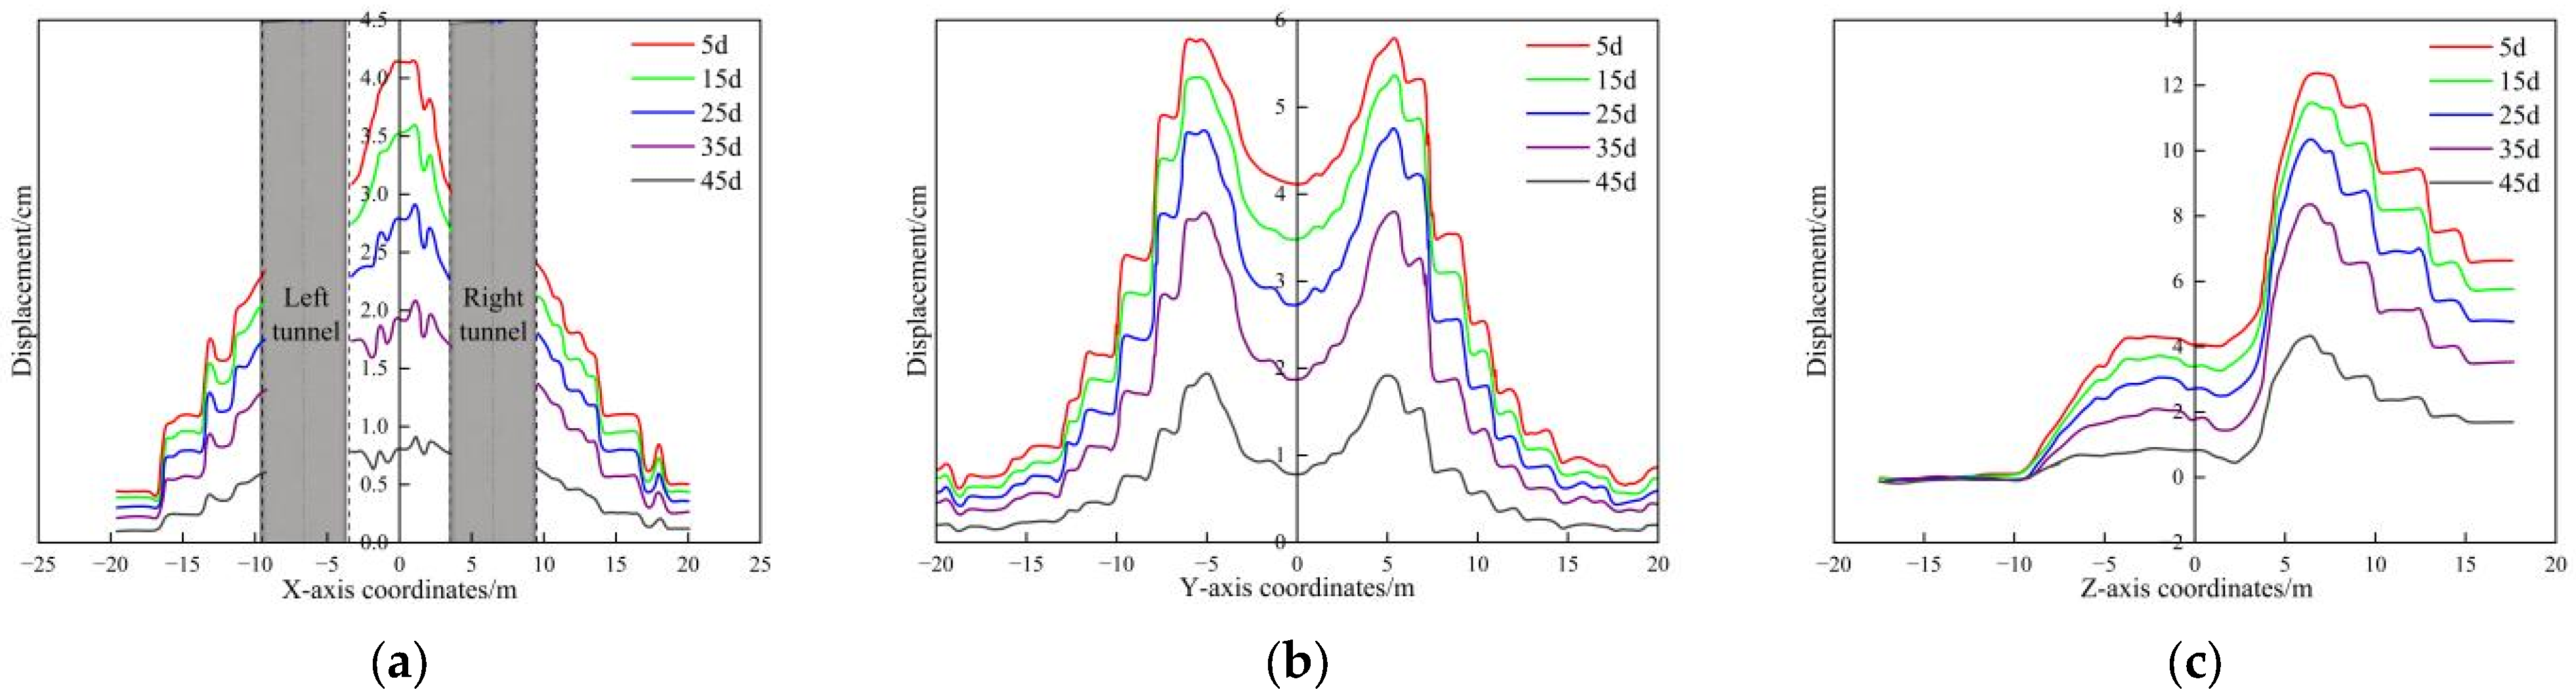
Figure 10 illustrates the variation in the displacement field over time along each measurement line during active freezing. As freezing time progressed, the intervals between displacement curves gradually decreased, indicating that frost heave deformation of the soil accelerated rapidly in the initial stage of active freezing. However, after 25 days, the rate of frost heave deformation slowed, aligning with the observed temperature trends. A comparison of
Figure 8a and
Figure 10a revealed that, within the first 25 days of active freezing, despite the soil along the central line of the cross-passage not being fully frozen, the maximum displacement reached 2.85 cm. This phenomenon is primarily due to two main mechanisms: (1) frost heave in the freezing pipe area generates outward expansion forces that propagate to and displace the centerline soil, even when unfrozen, and (2) the freezing process alters soil mechanical properties near the pipes, disrupting the original stress equilibrium and causing stress redistribution that continuously displaces the centerline soil.
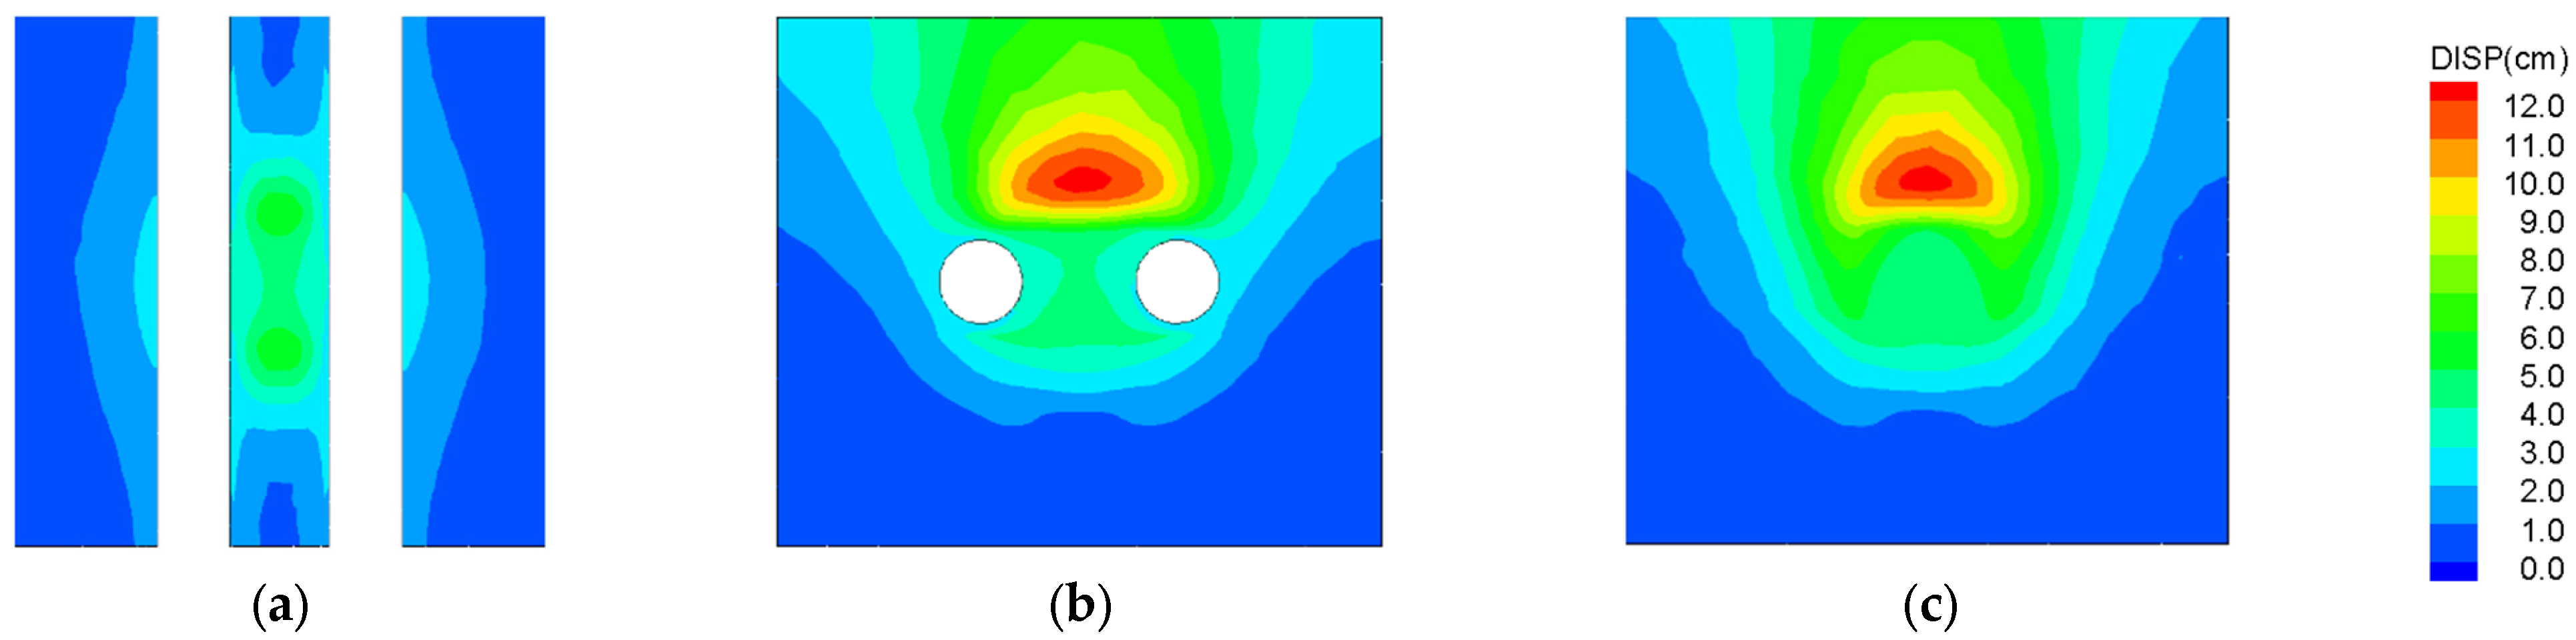
Figure 11 presents a contour map illustrating frost heave deformation in the soil after 45 days of active freezing. Deformation due to frost heave occurred in the soil above the artificial freezing zone of the cross-passage. Soil located near the freezing pipes experienced significant frost heave, while soil farther from the pipes was less affected. Beyond a certain distance, no frost heave occurred. The maximum displacement caused by frost heave was observed in the fine sand layer at the center of the cross-passage, where the modulus of elasticity was smallest. This maximum displacement reached approximately 12 cm. The frost heave displacement of the soil in the areas near the left and right tunnels was reduced compared with the soil in the excavation area due to the restraint of the shield tunnel.
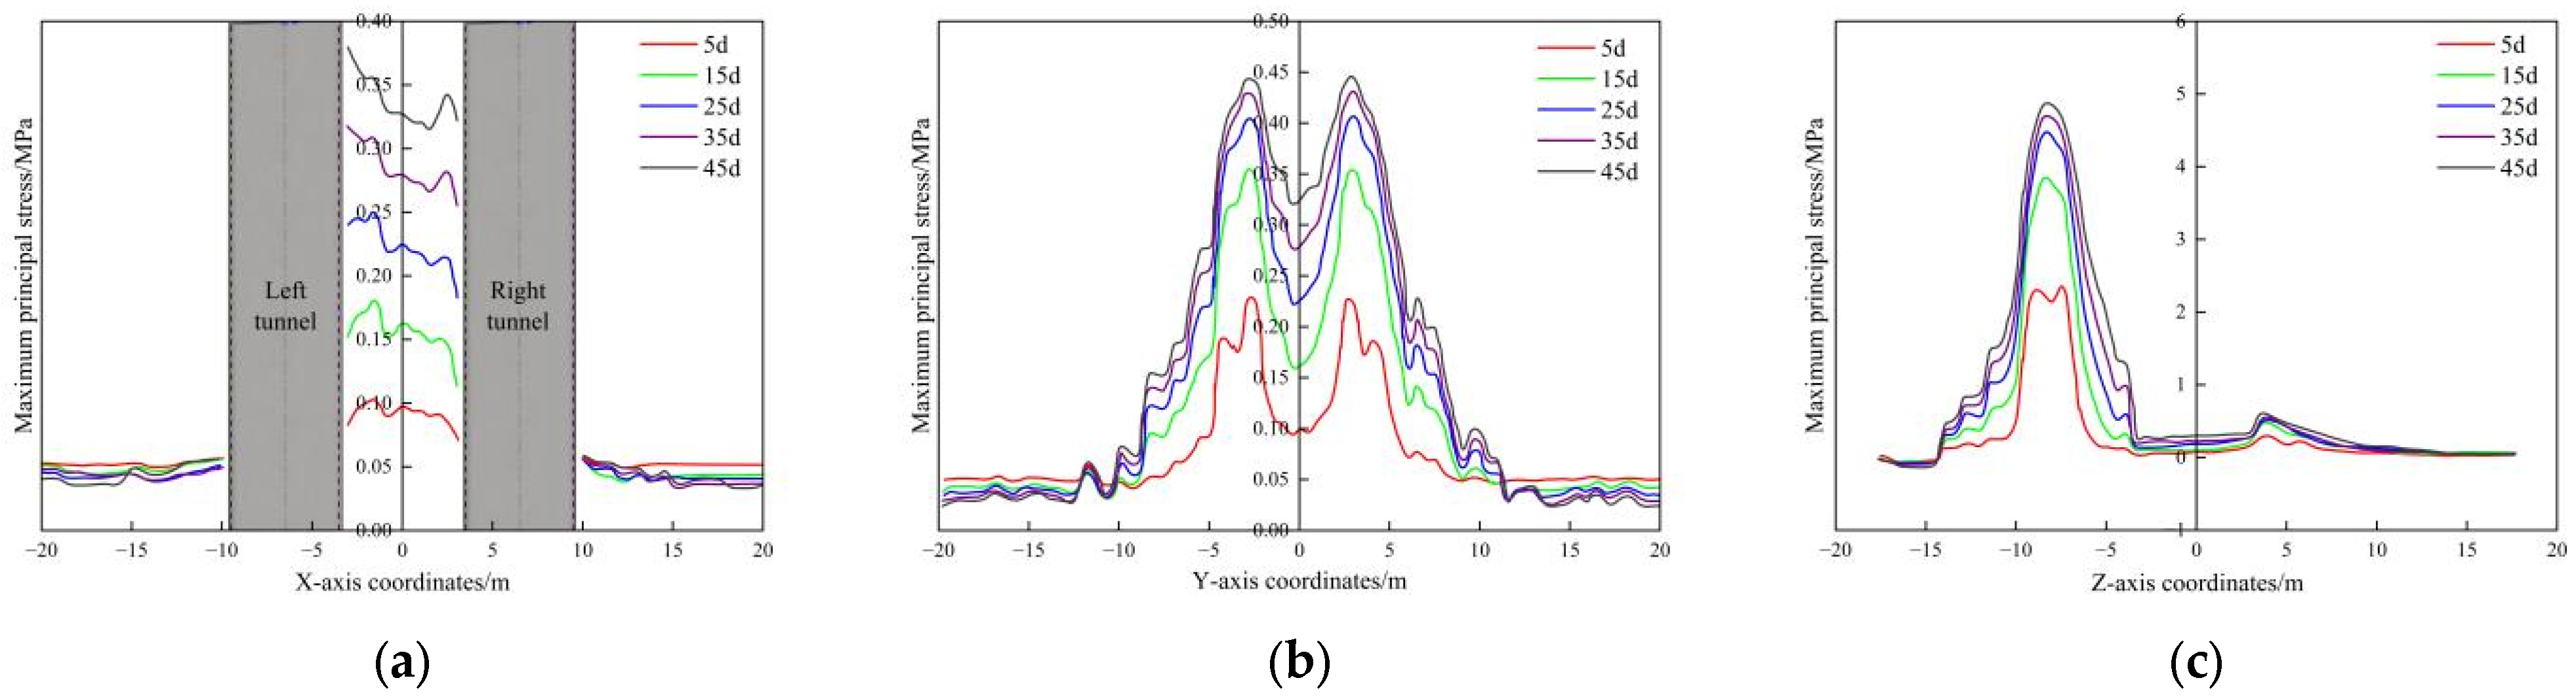
In this study, the maximum principal stress index was employed to characterize the evolution of the soil stress state during active freezing. This index is particularly appropriate, as the tensile strength of both frozen soil and concrete is significantly lower than their compressive strength. As illustrated in
Figure 12 and
Figure 13, the spacing between the stress curves progressively narrowed with the increasing freezing time. This trend suggests that soil stress rose rapidly in the early stages of active freezing, followed by a deceleration in the rate of increase. Nonetheless, the overall stress distribution status remained relatively stable throughout the freezing process. This behavior is consistent with the observed temperature and displacement profiles.
Figure 12a,b reveal a clear negative correlation between soil stress and temperature: as freezing duration increased and temperature decreased, soil stress increased. Additionally, soil stress was more sensitive to temperature variations, and stress dissipation occurred at a faster rate than displacement dissipation with increasing distance from the frozen zone.
Figure 13 presents a cloud diagram of the soil’s maximum principal stress after 45 days of freezing. Soil adjacent to the freezing pipes experienced significant stress due to freezing-induced expansion, while soil farther from the pipe was less affected. Beyond a certain distance, the soil remained largely unaffected by freezing expansion. Based on
Figure 12c and
Figure 13c, the moderately weathered mudstone layer exhibited significant stress due to frost heave, with a maximum principal stress of approximately 4.7 MPa. This can be attributed to the significantly higher elastic modulus of moderately weathered mudstone, which was about 45 times greater than that of gravel medium coarse sand. Under the constraint condition of deformation, the stress distribution was proportional to the elastic modulus of each material, resulting in the high-modulus mudstone bearing greater frost heave stress under temperature variations. However, it should be noted that this stress level remained well below the saturated uniaxial compressive strength of the moderately weathered mudstone (18.3 MPa, as specified in the geological survey). In contrast, the frost heave stress in the medium-coarse sand layer ranged from 350 kPa to 450 kPa, which is substantially lower due to its reduced elastic modulus and different deformation characteristics. This significant stress differential between geological layers highlights the substantial influence of material properties and geological conditions on frost heave stress distribution.
During the active freezing stage, the segment, characterized by a high modulus of elasticity, restricted freezing-induced deformation in the soil. Due to deformation coordination conditions, approximately 5 MPa of stress was generated in the segment near the freezing area, with the stress primarily concentrated around the freezing pipes region. Therefore, it is essential to implement robust temporary support measures and other protective strategies within the tunnel before commencing construction of the cross-passage.
Numerical simulation offers significant advantages in analyzing the freezing excavation process of the cross-passage, particularly in efficiently adjusting design parameters and performing comparative optimization. For the freezing method, active freezing duration is a critical design parameter.
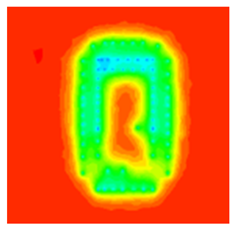
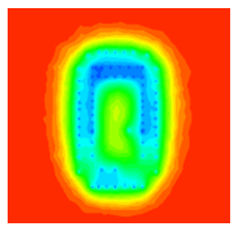
Figure 14 presents a temperature cloud diagram of the freezing zone after the excavation of the cross-passage and pumping station under active freezing durations of 45, 50, and 55 days.
The parameter influence analysis indicated that increasing the freezing time from 45 to 50 or 55 days had minimal impact on extending the freezing zone. In terms of freezing curtain size and soil temperature change, the extended freezing duration did not result in notable differences, but significantly increased energy consumption, including brine circulation, equipment operation, and labor costs. As the freezing zone achieved after 45 days of active freezing met the design requirements for the thickness of the freezing curtain, further increases in freezing time did not significantly improve safety performance or economic efficiency. Therefore, from the perspective of design optimization, a 45-day active freezing time is sufficient, and further extension is unnecessary.
4.2. Maintenance Freezing
Following the 45-day active freezing phase, the excavation of the cross-passage and the pumping station will be completed within the subsequent 20 days. During this stage, the freezing system will sustain the freezing strength of soils to ensure excavation safety. According to the design scheme, excavation of the cross-passage progressed from the left line tunnel to the right line tunnel, with timely support provided during excavation. During the excavation process, the removal of frozen soil in the excavation zone inevitably caused internal force redistribution and displacement deformation within the frozen curtain and controlling these deformations during excavation is crucial for ensuring project safety and minimizing environmental impact.
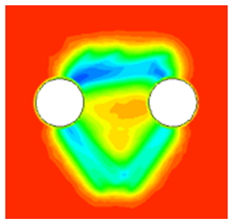
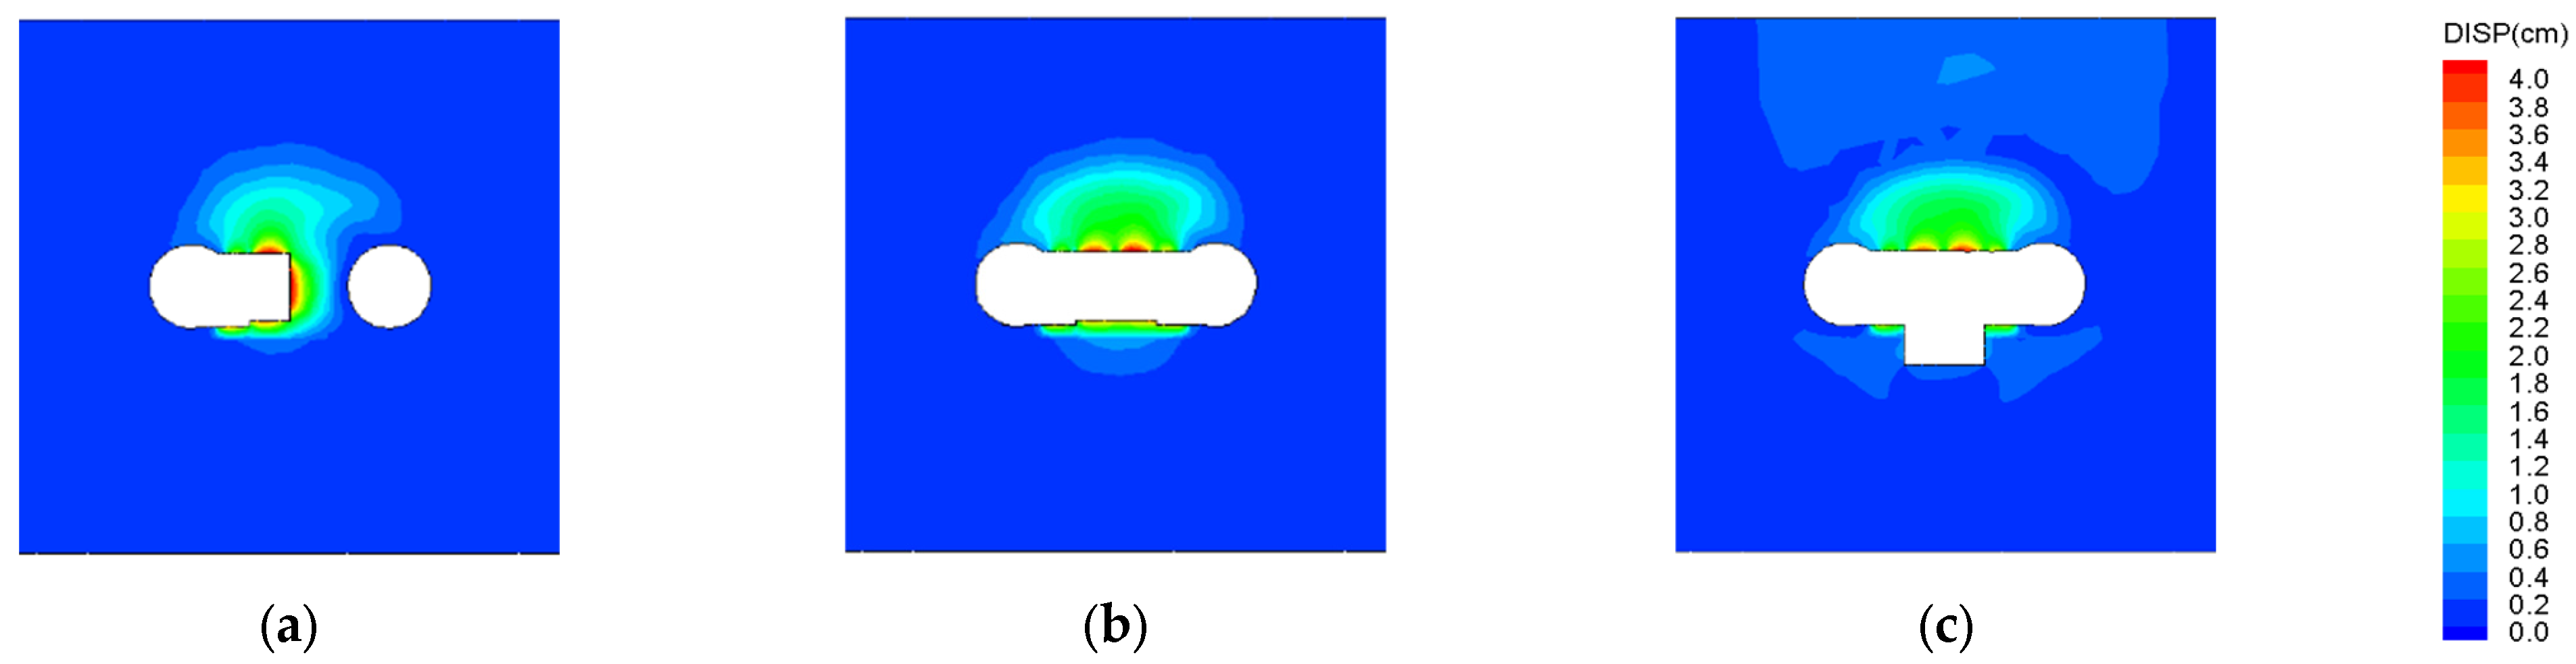
Figure 15 presents the cloud diagram of soil deformation during the excavation of the cross-passage. To highlight the impact of excavation on displacement, the displayed displacements exclude those caused by frost expansion. The cloud diagram revealed that, when the cross-passage was excavated halfway, the maximum deformation occurred at the tunnel face, with a displacement of approximately 4 cm and an influence range of about 3 m. Upon completing the excavation and initial lining support, the maximum symmetric displacement occurred at the midsection of the tunnel top and gradually attenuated unevenly toward both sides, with a displacement value of approximately 3.4 cm.
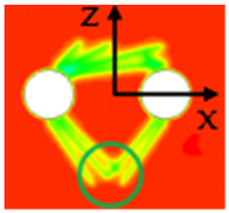
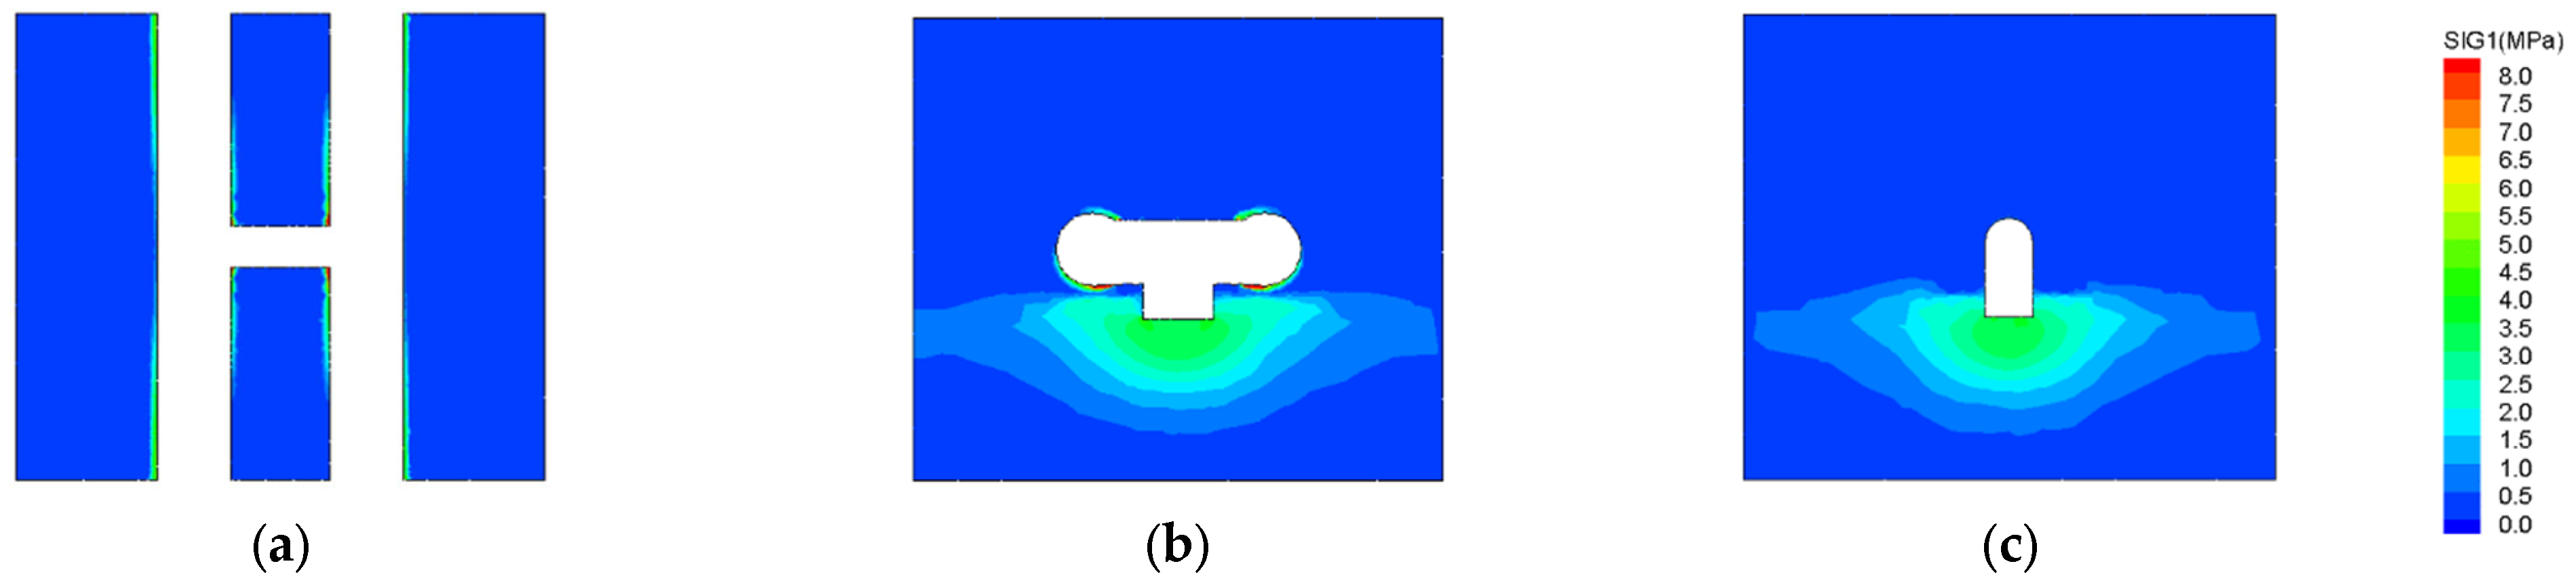
Figure 16 illustrates the changes in the soil stress field during the excavation of the cross-passage and the pumping station. The excavation of the cross-passage led to an increase in the maximum principal stress in the tunnel and surrounding soil, with a significant rise in the weak area at the intersection of the cross-passage and the tunnel, where a two-way free surface was formed. Stress concentration in this region was evident, with the principal stress increasing from 5 MPa to 8 MPa, representing an approximate 60% increase. Therefore, it is essential to reinforce these areas to ensure stability.
Additionally, excavation of the cross-passage caused a redistribution of stress, leading to a more uniform stress distribution in the lower frozen soil region due to the unloading effect, with a slight increase in the influence range of the principal stress. The pumping station, located in moderately weathered mudstone with favorable mechanical properties, experienced minimal changes in the magnitude and distribution of principal stress during excavation.
As shown in
Figure 15 and
Figure 16, the displacement and additional stress effects caused by the excavation of the cross-passage and the pumping station were largely confined to the frozen curtain area, with negligible impact on soil beyond this zone. The frozen curtain effectively ensured a safe working environment for the excavation activities.
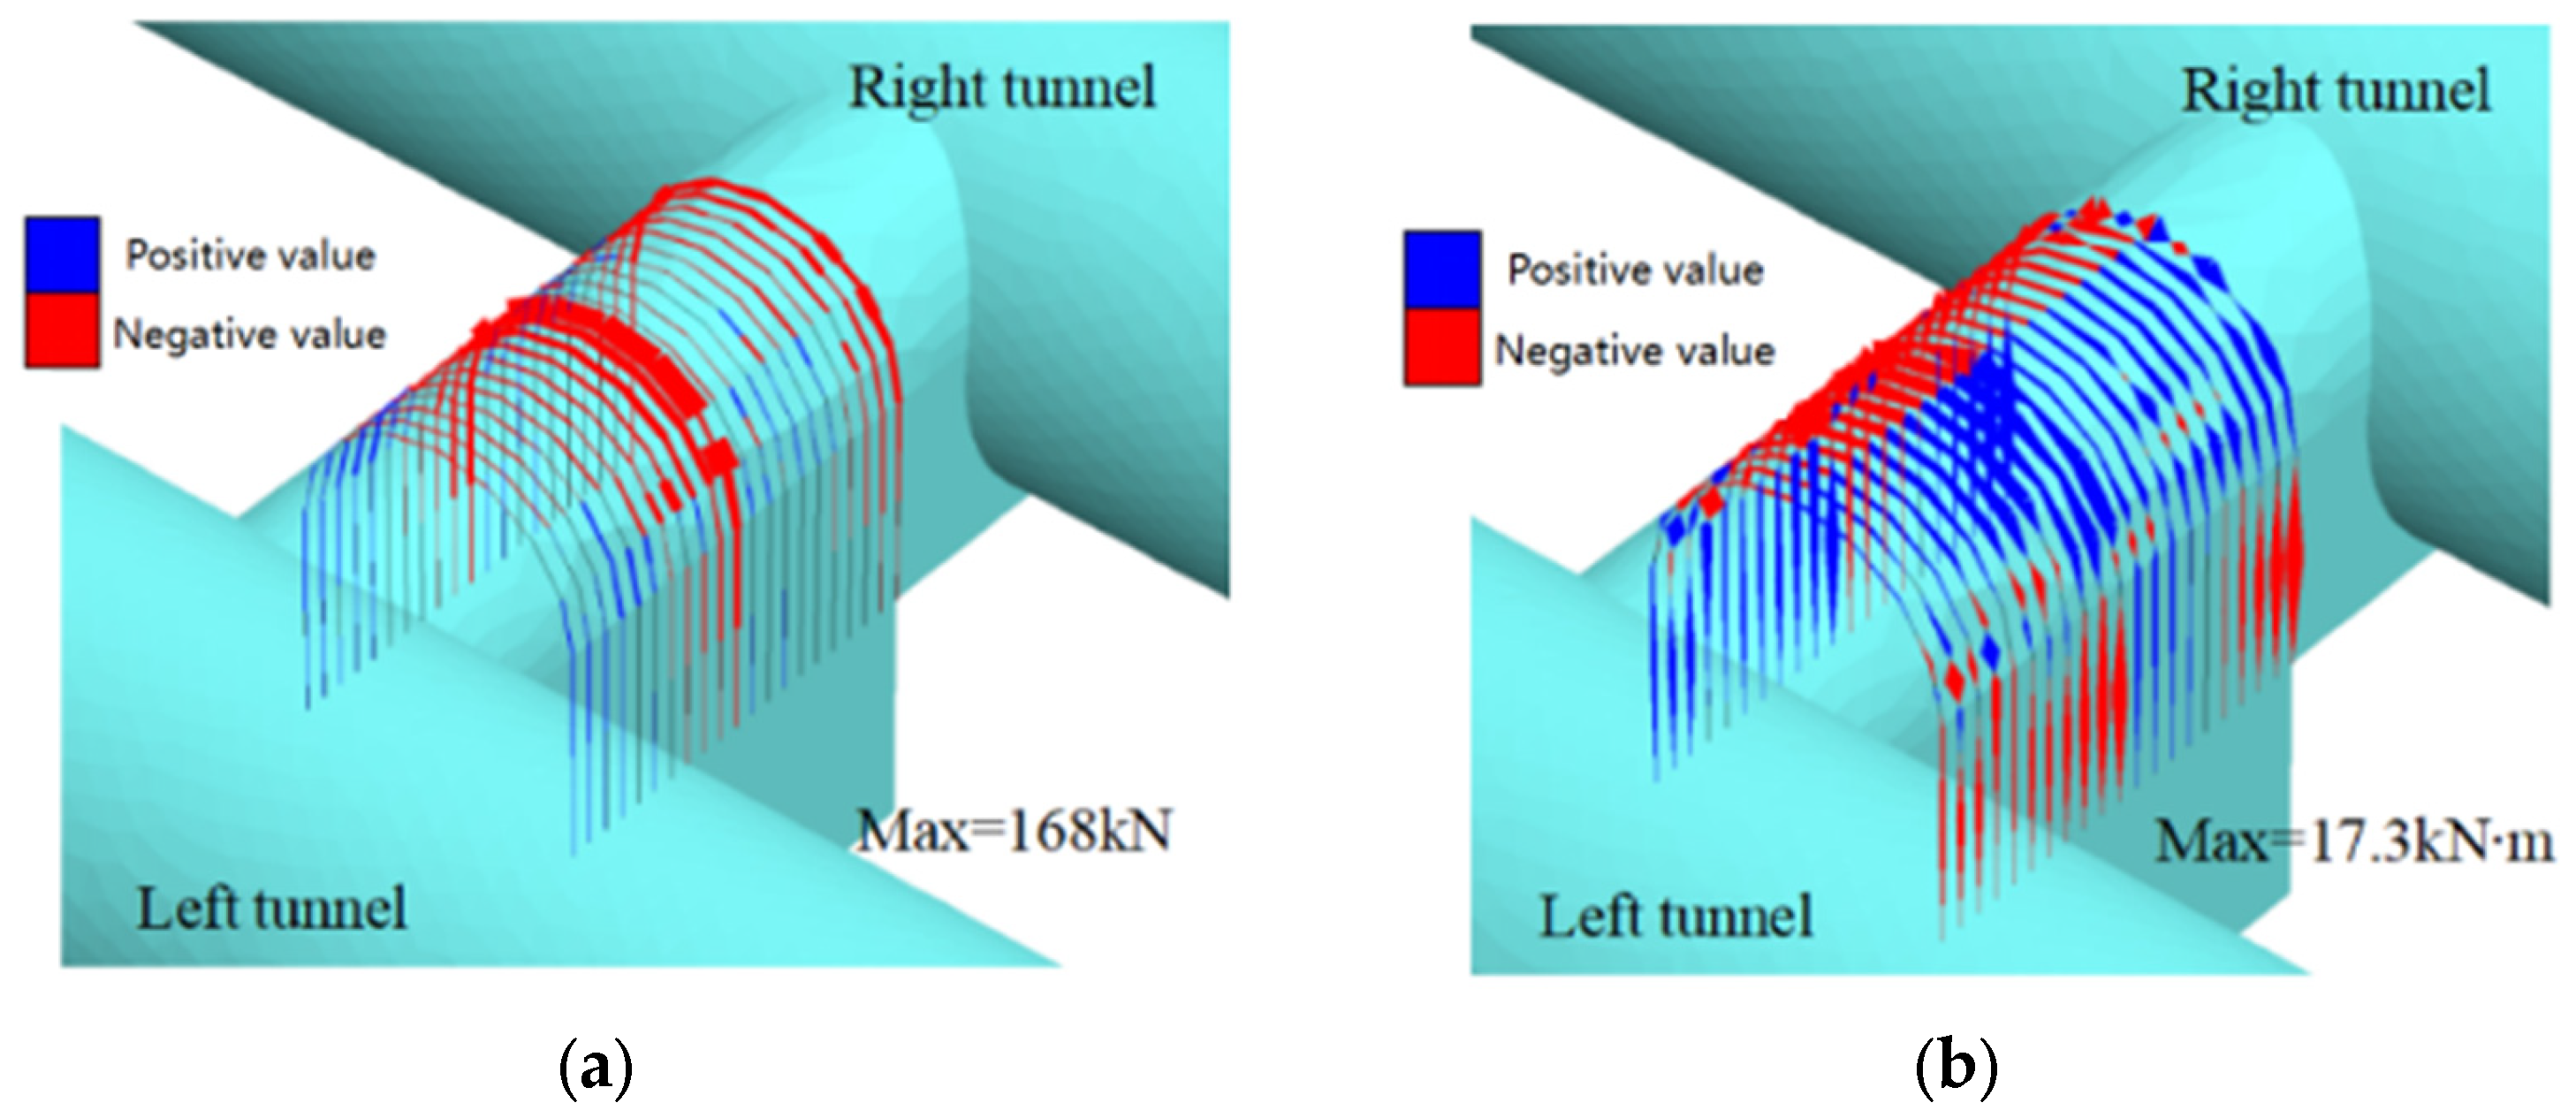
During the excavation of the cross-passage and pumping station, support from the I-beam frame and shotcrete was progressively applied as excavation advanced.
Figure 17a,b illustrate the distribution of axial force and bending moment in the I-beam frame after excavation. Analysis of the internal force diagram revealed that the maximum axial force occurred at the top arch of the central part of the cross-passage, with a maximum tension of approximately 168 kN. The maximum bending moment also occurred in this area, reaching around 17.3 kN·m.
By integrating the results of soil displacement, deformation, freezing curtain stress, and the internal forces in the supporting structure during excavation, it can be concluded that the excavation of the cross-passage and pumping station caused minimal disturbance to the surrounding soil. The soil deformation remained limited, and the maximum principal stress occurred at the junction between the shield tunnel and the cross-passage. Stress concentrations at tunnel-cross-passage intersections resulted from the combined effect of multiple interacting factors. Geometric discontinuity created abrupt changes in geometric dimensions and structural stiffness between the main tunnel and cross-passage, leading to uneven stress distribution throughout the intersection zone. Furthermore, the different load-bearing behaviors exhibited by intersecting structures intensified localized stress concentrations. Material property variations also played a crucial role, particularly the complex interface behavior at these intersections, which significantly influenced how stress concentrations developed and propagated within the structural system. Furthermore, the internal forces in the supporting structure were controlled within an acceptable range, meeting the strength requirements.
4.3. Natural Thawing
After 65 days of freezing, the freezing equipment was deactivated, allowing the soil to thaw naturally. To assess the impact of temperature, deformation, and stress changes on the cross-passage and pumping station throughout the thawing process, this study further investigated the soil’s response during thawing. In accordance with the project’s construction requirements, the temperature field, displacement field, and stress field during the 45-day thawing period were systematically analyzed.
During the construction process, active freezing was immediately terminated upon completion of the cross-passage and pumping station excavation and the installation of the initial support. As natural thawing progressed, the temperature of the frozen wall gradually increased from the outside to the inside, leading to a uniform temperature distribution in the frozen area. However, according to the actual construction requirements, the soil within the frozen zone is still required to maintain a certain level of strength for up to 45 days during natural thawing.
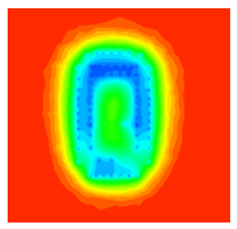
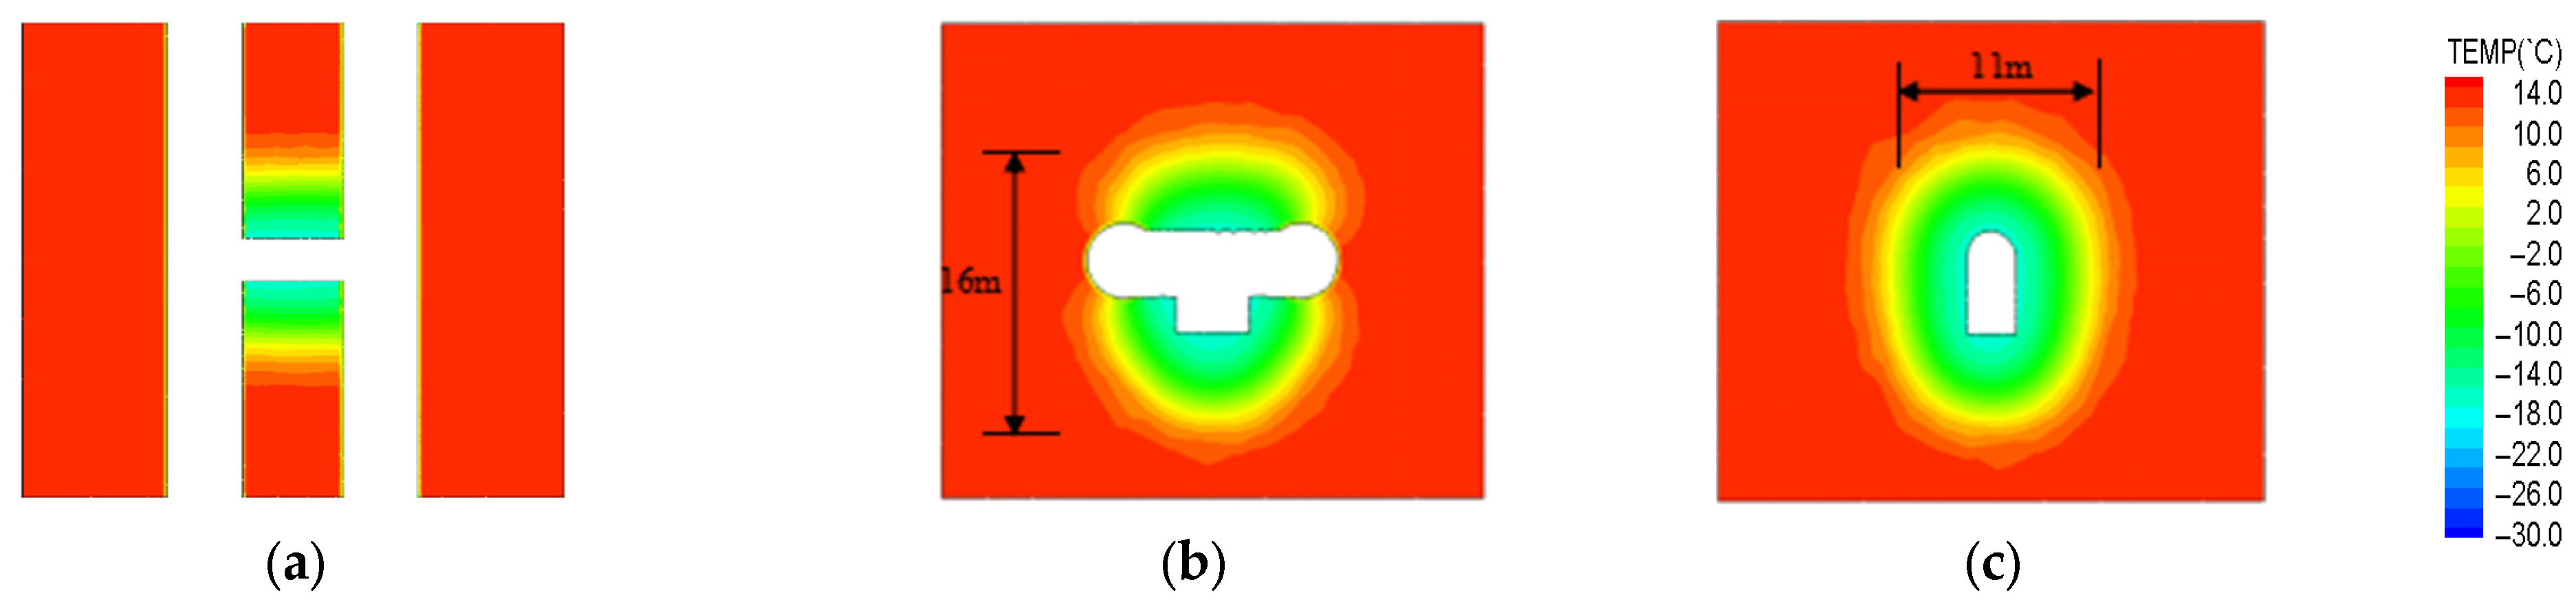
Figure 18 shows the temperature field of the soil after 45 days of natural thawing. As seen in
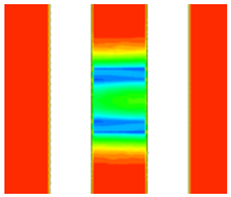
Figure 18, after 45 days of natural thawing, the temperature at the center of the frozen wall increased from −26 °C to approximately −10 °C due to its proximity to the unfrozen soil. However, the soil temperature within approximately 1.6 m around the cross-passage, inside the frozen curtain, remained at approximately −16 °C. Taking −2 °C as the threshold for complete soil freezing, it can be observed that even after 45 days of thawing, a frozen curtain approximately 3.3 m thick was still maintained. The extent of the frozen area was about 11 m in width and 16 m in height after 45 days of natural thawing, showing little change compared to the range of the frozen zone after 45 days of active freezing. This indicates that the freezing circle remained intact in this period, and the preservation of low temperatures enabled the soil within the frozen zone to maintain sufficient strength, thereby ensuring the safety of ongoing construction activities.
Figure 19 illustrates the displacement field of the soil after 45 days of natural thawing. To facilitate a clearer analysis of thaw settlement displacement during this thawing process, the displacements resulting from frost heave and the excavation of the cross-passage were reset to zero prior to the onset of natural thawing. From the diagram, it is evident that thaw settlement deformation primarily resulted from the phase transition of water and the reconsolidation of soil under additional stress. The areas most affected by freeze–thaw deformation largely coincided with those previously experiencing frost heave deformation. Soil that underwent substantial frost heave typically experienced significant thaw settlement deformation.
Over the 45 days of natural thawing, the upper soil of the cross-passage experienced significant downward displacement, with a maximum value of approximately 3 cm, radiating outward with this point as the center. The displacement in the side wall areas was around 1.5 cm. In contrast, the thaw settlement deformation in the bottom area of the cross-passage was minimal, at approximately 0.2 cm. This was primarily due to the presence of a moderately weathered mudstone layer with favorable mechanical properties, which also exhibited minimal frost heave deformation. Unlike frost heave deformation, thaw settlement continued to develop over time even after freezing ceased. In practical engineering, it is essential to address the adverse effects of thaw settlement to ensure the stability and safety of construction.
Figure 20 illustrates the stress distribution in the soil after 45 days of thawing. According to the diagram, the thawing process did not cause substantial changes to the stress distribution in the soil. Although the stress state of the soil was somewhat relieved after thawing, overall, the changes in the stress state around the excavation site were minimal. This indicates that thawing had a limited impact on the change of stress state, and the stability of the excavation area remained largely unaffected by the thawing process.
4.4. Validation of the Validity of Fine Numerical Simulation Results
Integrating field monitoring data with numerical simulations is essential for the safety of artificial ground freezing construction. To validate the validity of the model and the accuracy of model parameter values, we compared the numerical simulation results with field-measured data. During the freezing process, multiple temperature measurement points were installed on-site, providing extensive temperature data throughout the active freezing, maintenance freezing, and thawing phases.
Monitored data from the second measuring points of representative temperature measuring tubes C1–C3 (located on the right side of the contact channel, from the left to the right line of the tunnel) and C5–C7 (located on the left side of the contact channel, from the left to the right line of the tunnel) were compared with the corresponding temperature points in the numerical simulation, as shown in
Figure 21a,b. The monitored temperature at the measuring points initially decreased before stabilizing, with the rate of temperature change following a similar pattern, which exhibited the same trend as the simulation results. The comparison results show that, while there was some temperature deviation at specific measuring points, the simulation results for the temperature development trend aligned well with the field measurements. This indicates that the calculation parameters and model settings selected in this study are reasonable, and the calculation results have a high level of reliability.


