
An Experimental Study on the Interface Characteristics of Geogrid-Reinforced Construction and Demolition (C&D) Waste Recycled Aggregate Based on Pullout Tests


Abstract
1. Introduction
2. Experimental Details
2.1. Test Setup
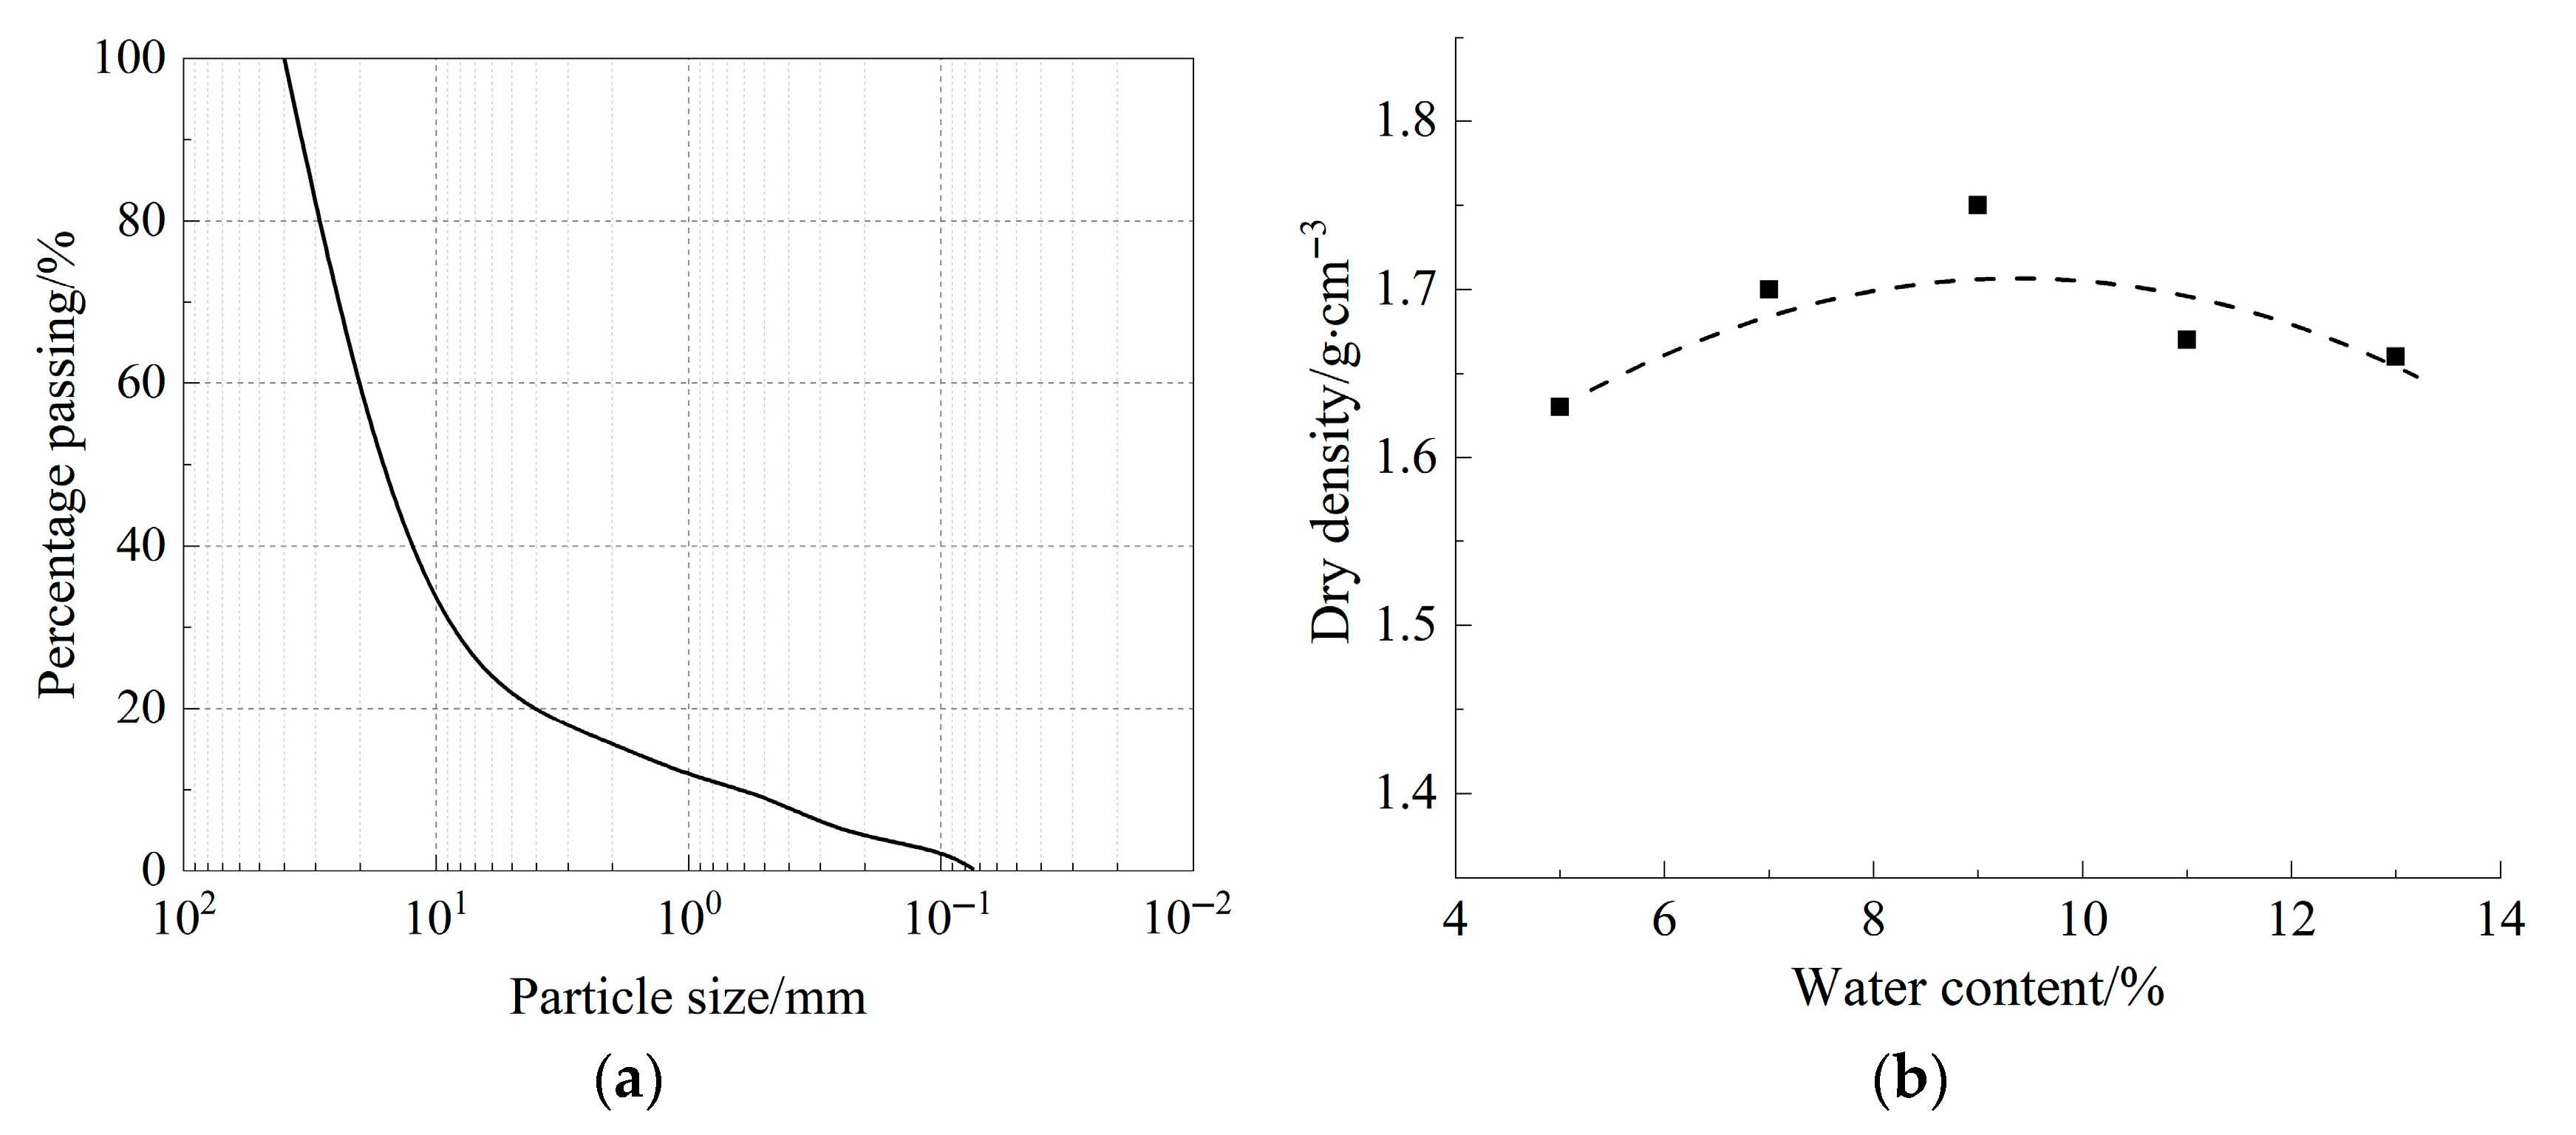
2.2. Material
- (1)
- C&D waste recycled aggregate
- (2)
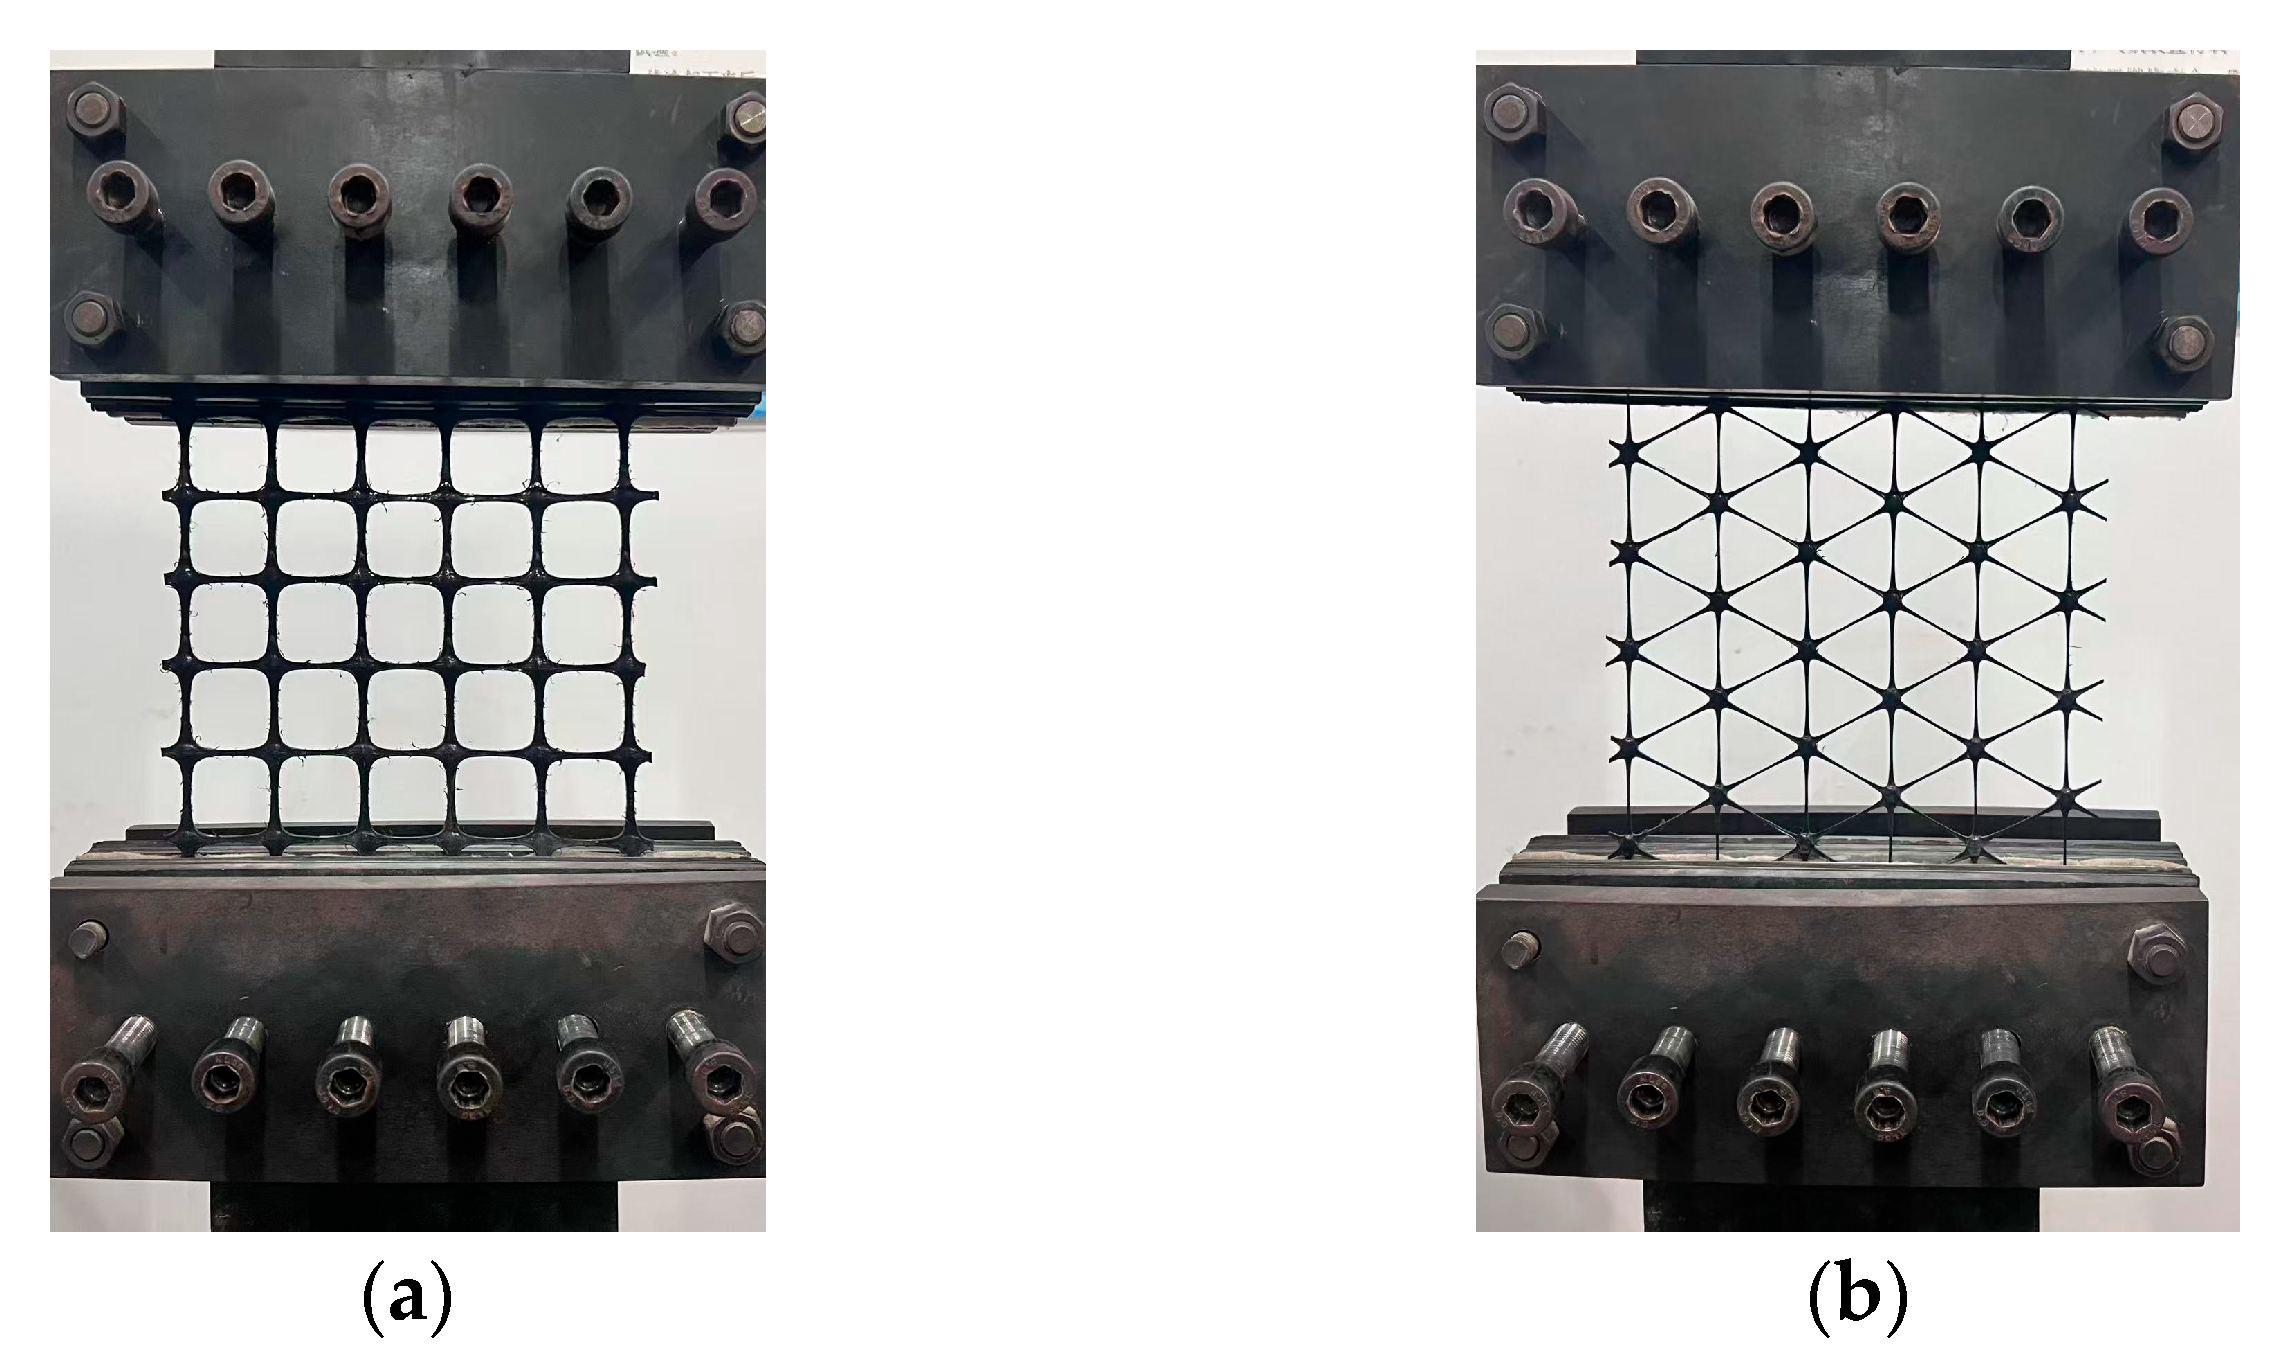
- Geogrid
2.3. Specimen Preparation
- (1)
- Biaxial geogrid-reinforced C&D waste recycled aggregate.
- (2)
- Triaxial geogrid-reinforced C&D waste recycled aggregate.
2.4. Test Program
2.5. Test Responses
3. Pullout Test Results
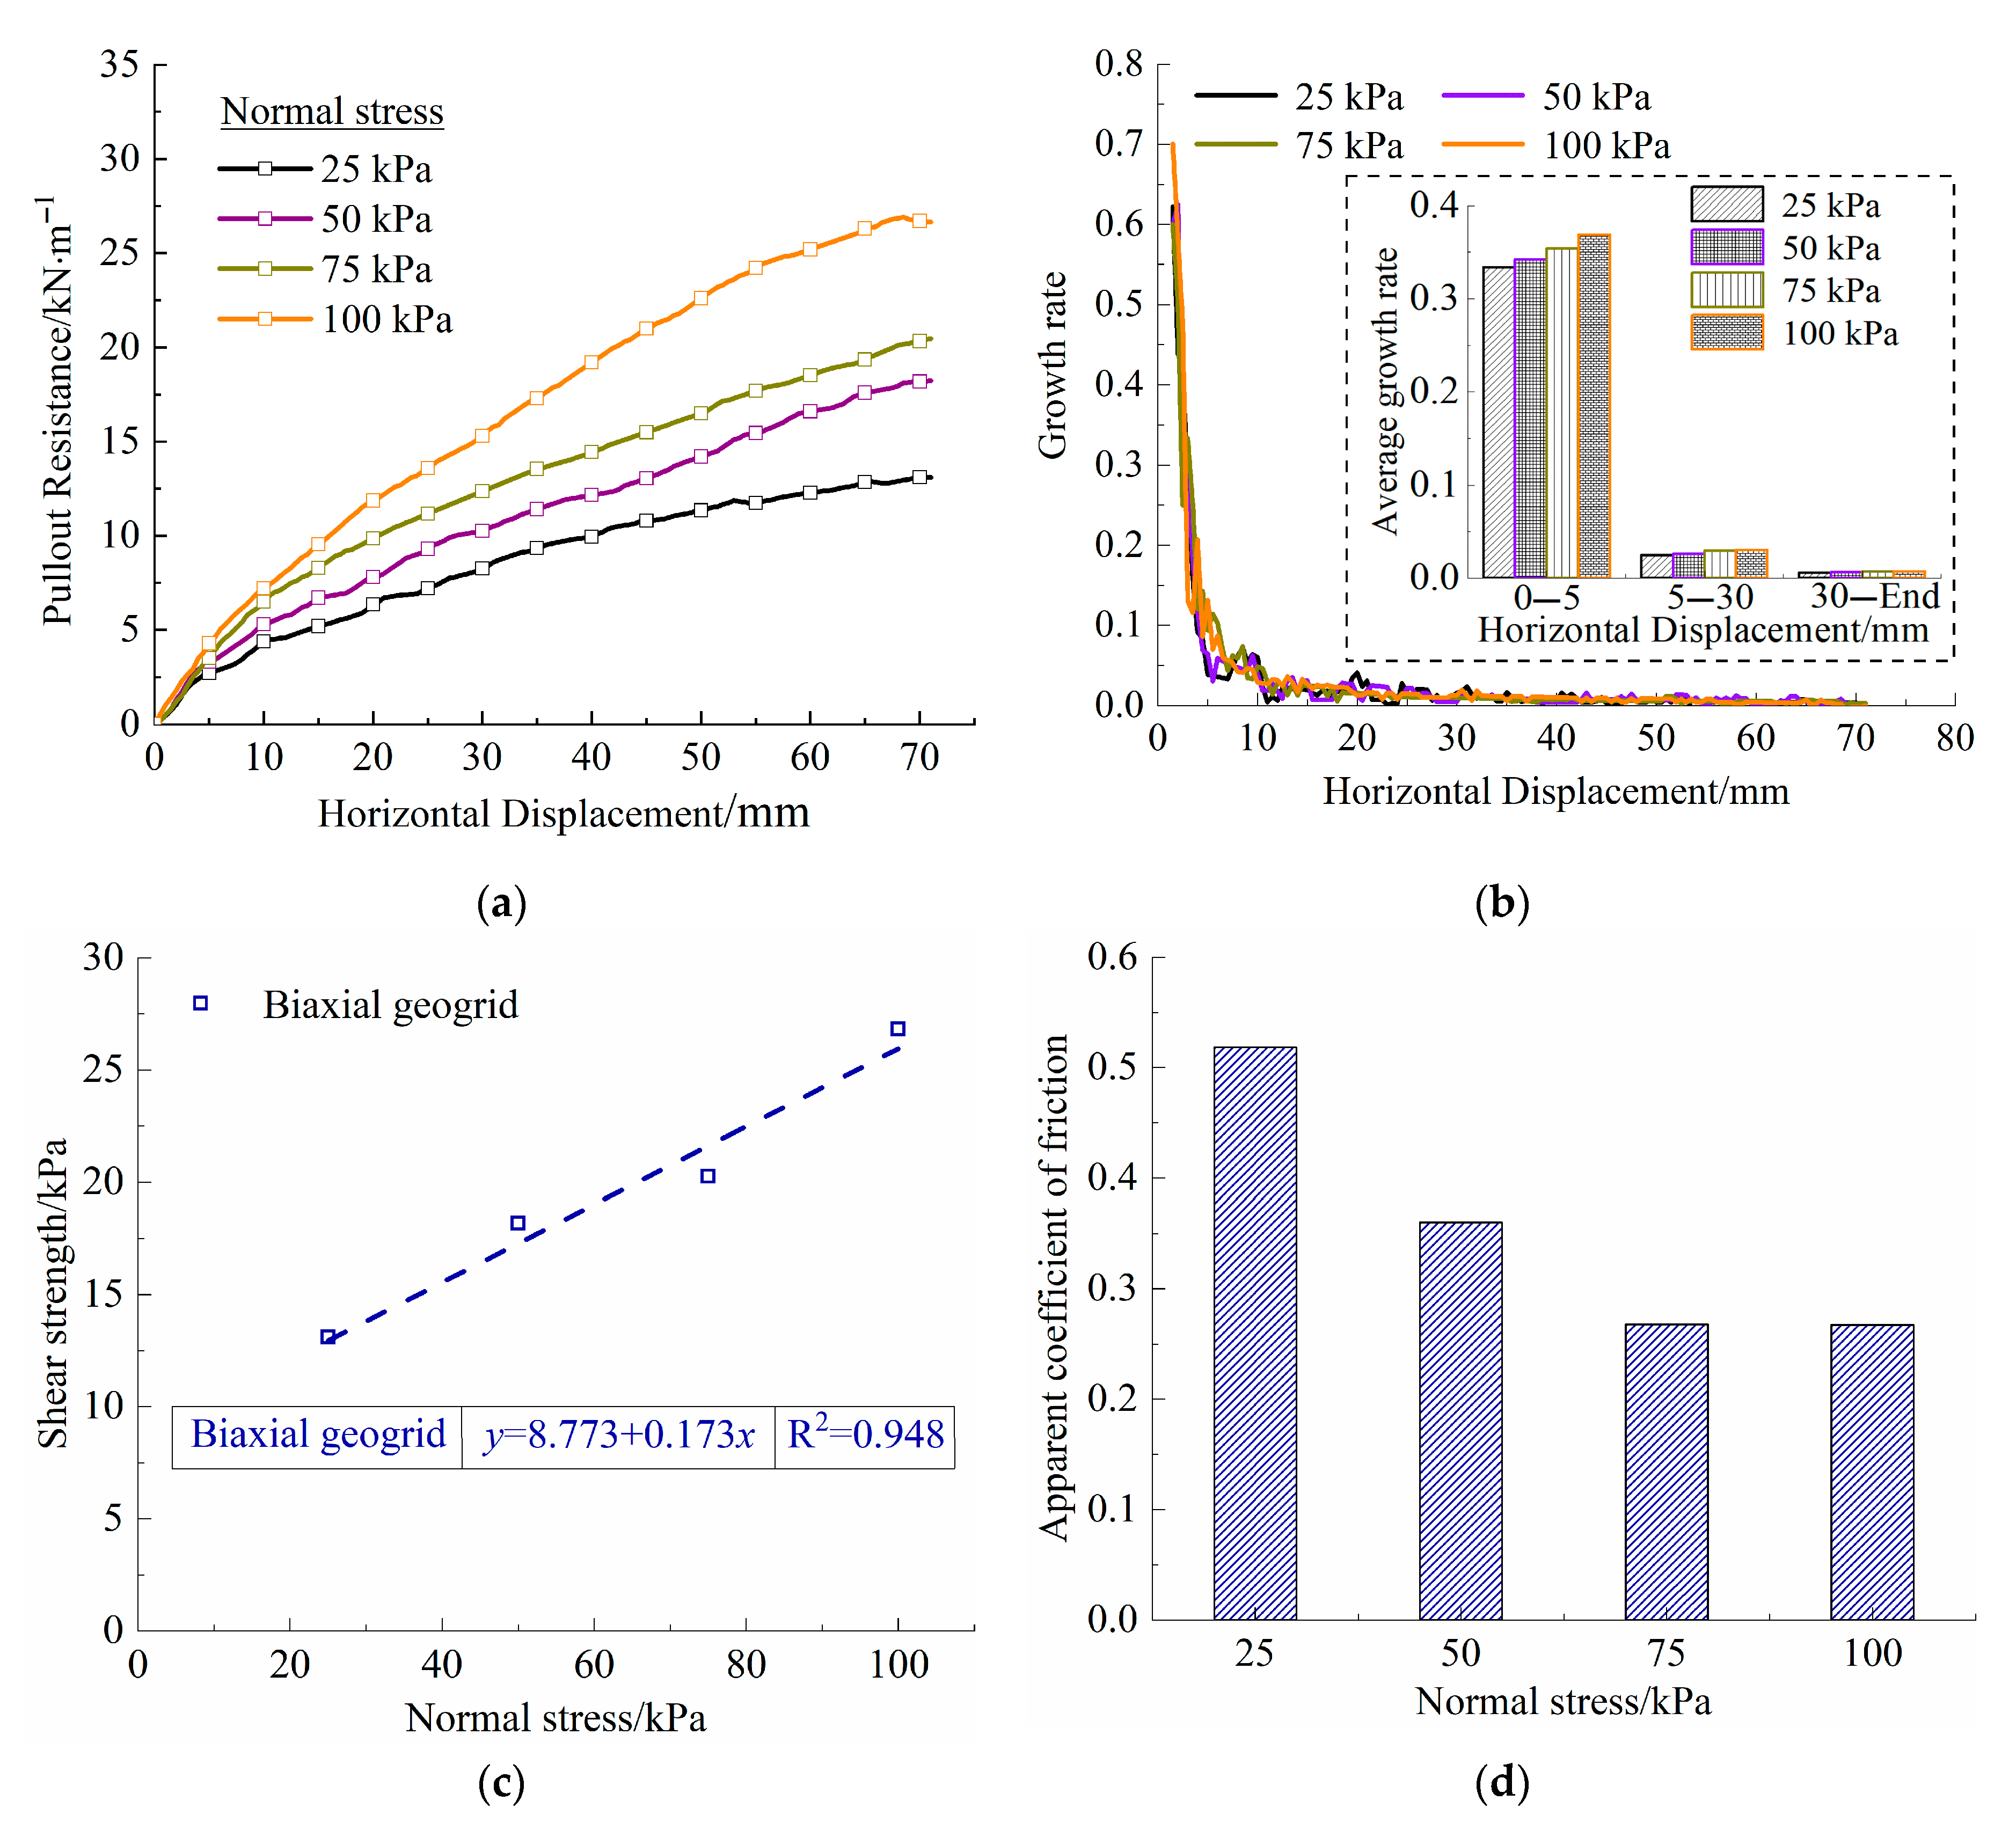
3.1. Influence of Confining Stress
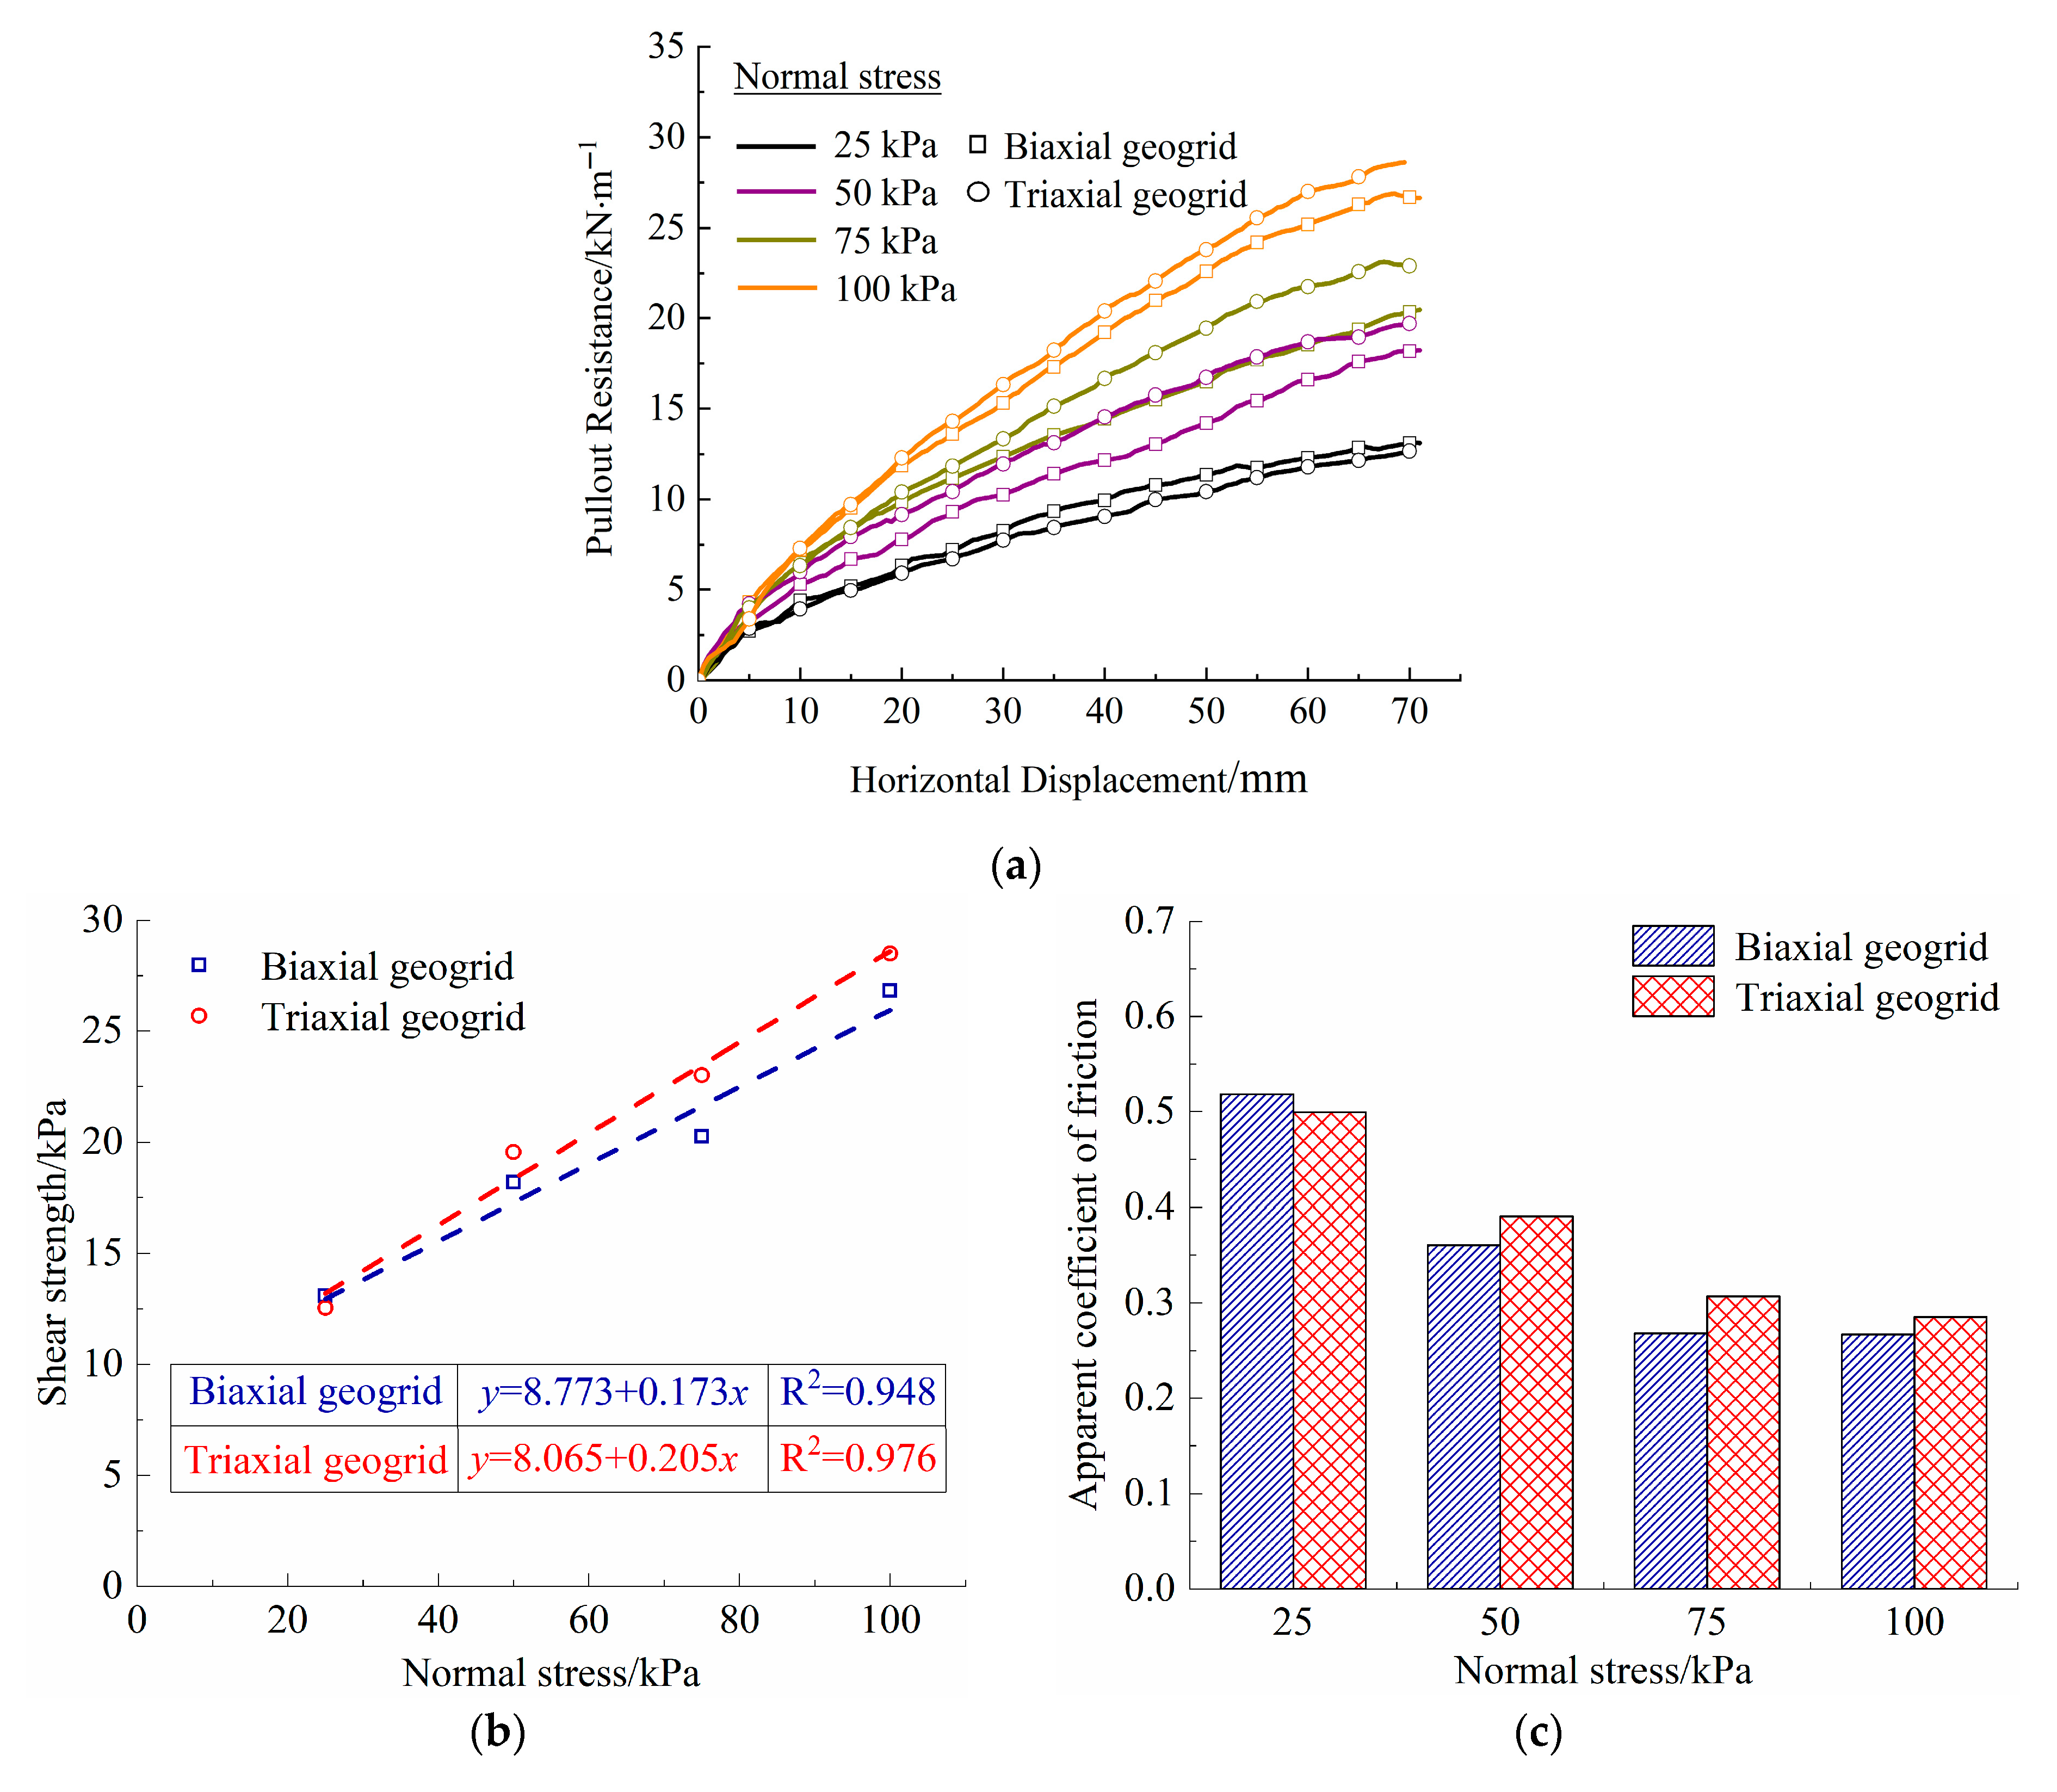
3.2. Influence of Reinforcements Types
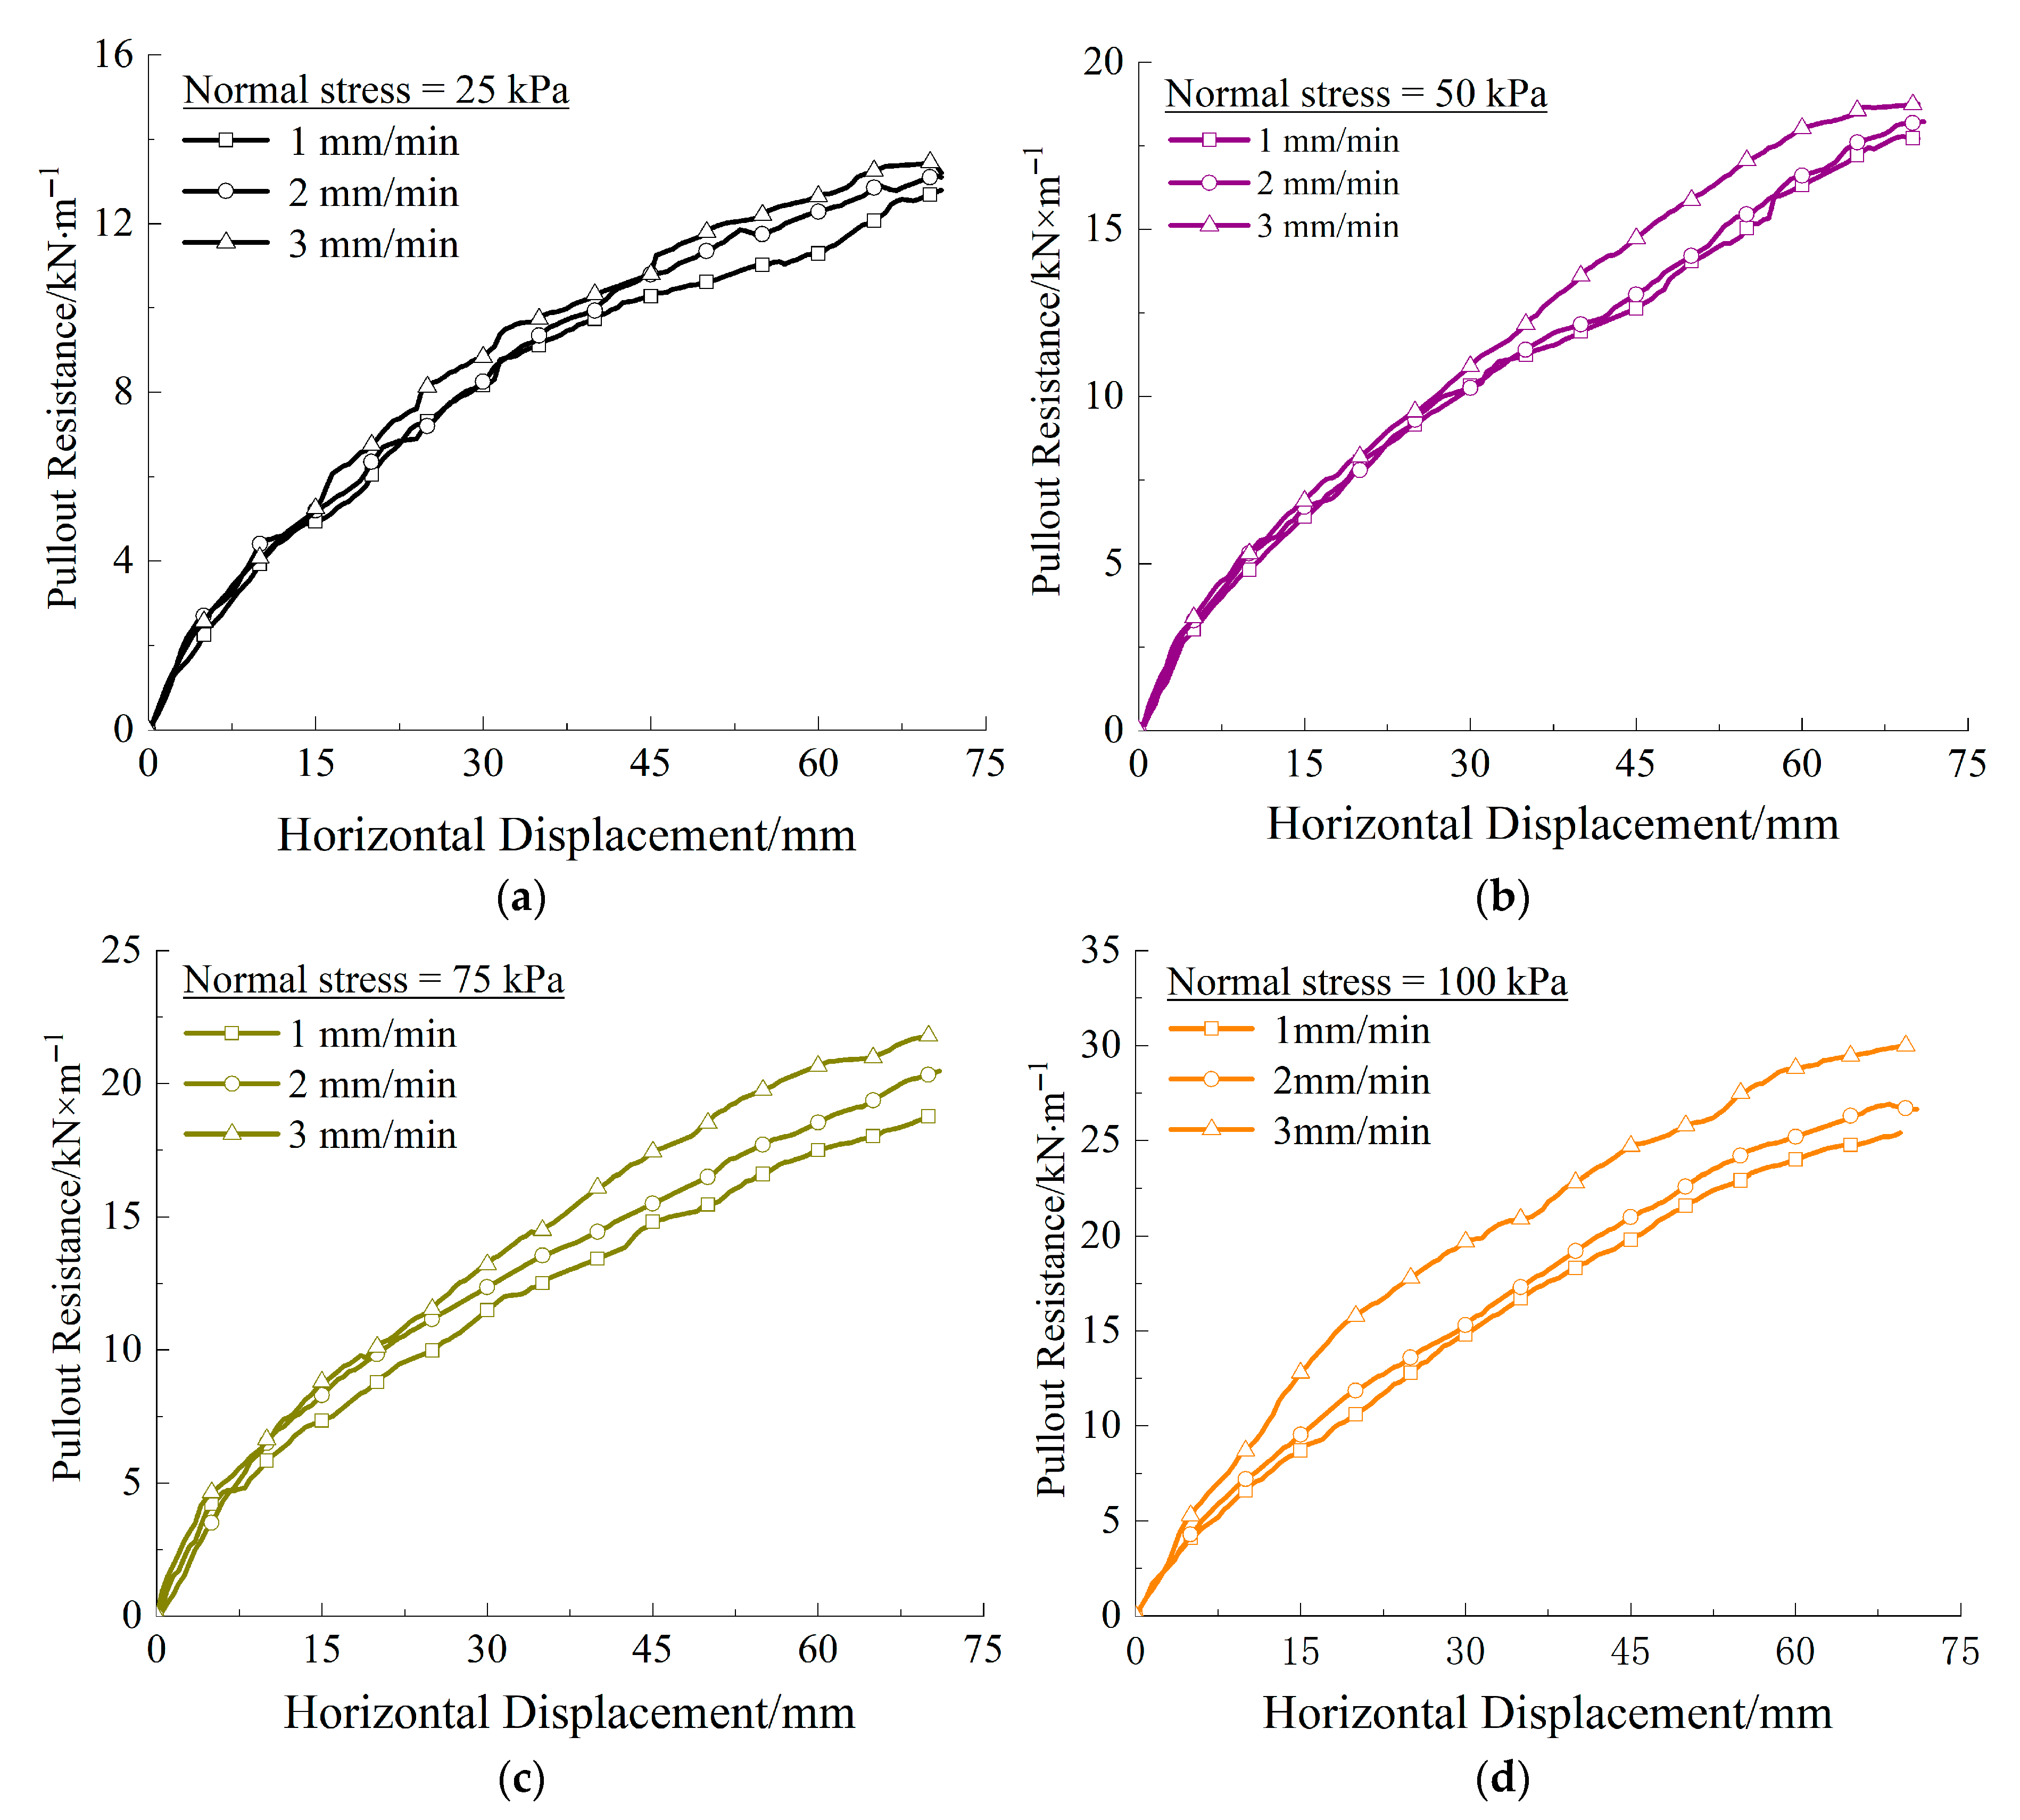
3.3. Influence of Pullout Rates
4. Conclusions
- (1)
- Pullout resistance versus displacement curves exhibit analogous behavioral patterns across varying normal stress, geogrid types, and pullout rates. Initially, rapid pullout resistance escalation occurs with increasing displacement, especially during the pullout displacement of 0–5 mm. The subsequent development of pullout resistance decelerates and eventually stabilizes.
- (2)
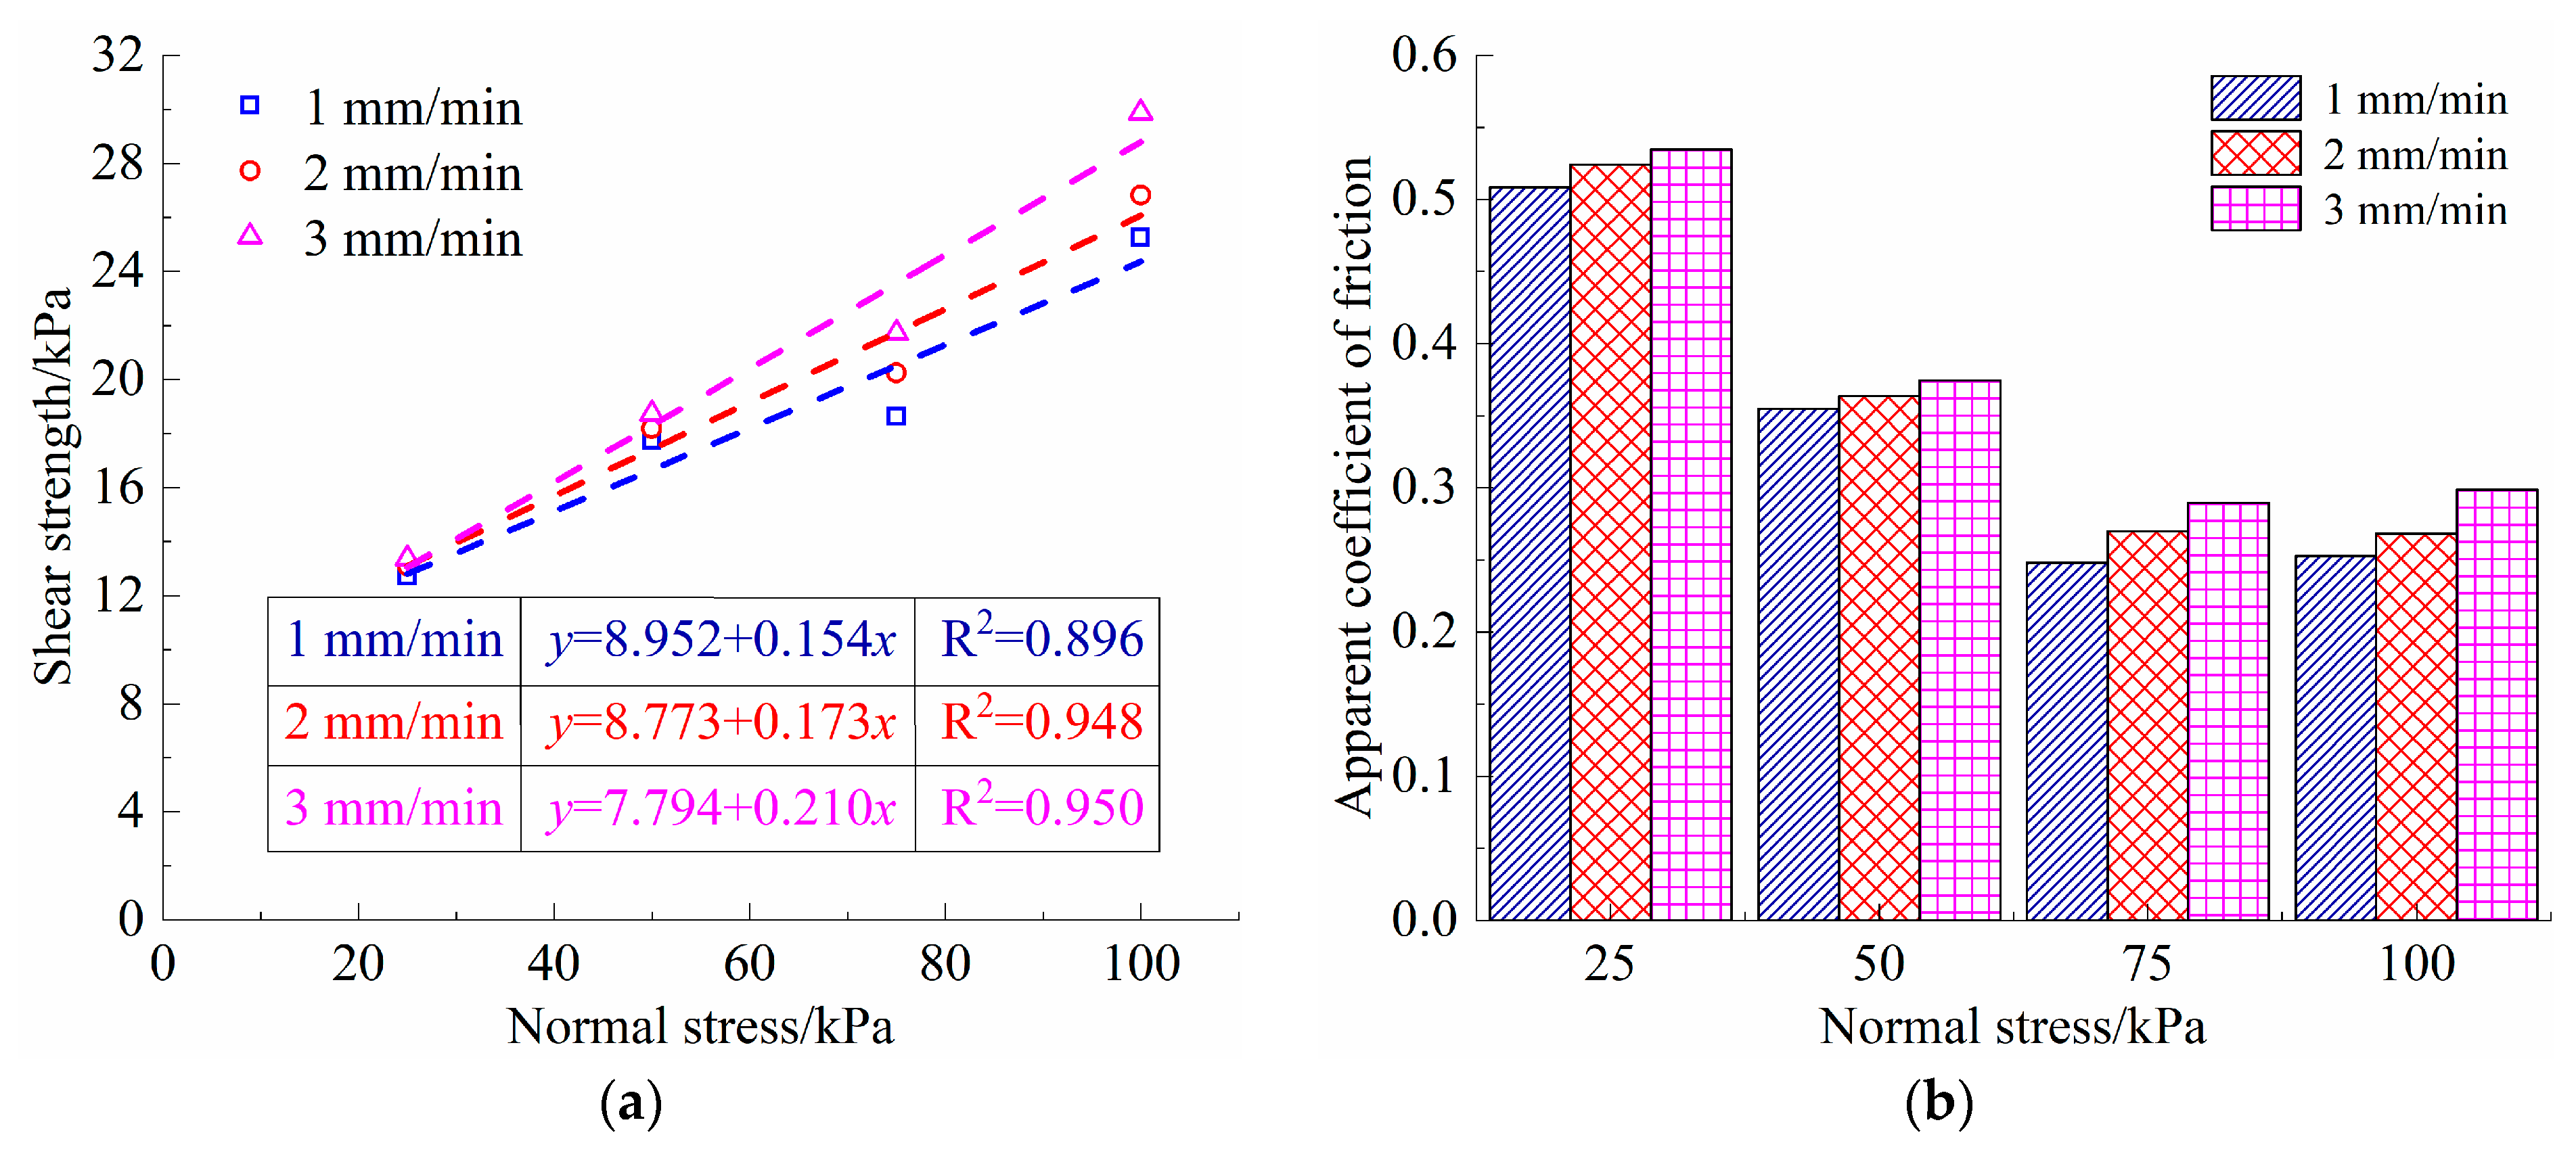
- The normal stress and the type of reinforcement have a great influence on pullout resistance and the interface friction coefficient, while the pullout rate has little effect. In addition, the influence of the reinforcement type and pullout rate on the mechanical characteristics of the interface between the reinforcement and C&D waste recycled aggregate increases with an increase in normal stress.
- (3)
- The biaxial geogrid shows a better reinforcement effect compared to the triaxial geogrid under low normal stress (≤50 kPa). Conversely, the triaxial geogrid shows a better reinforcement effect under high normal stress (≥75 kPa). The selection of reinforcement in reinforced soil structure should fully consider the important indexes such as the type of filler and the height of the structure.
Author Contributions
Funding
Data Availability Statement
Conflicts of Interest
Abbreviations
References
- Strieder, H.L. Mechanical Behavior of Construction and Demolition Waste as Pavement Materials: Influence of Mix Composition and Compaction Conditions. Constr. Build. Mater. 2023, 408, 133698. [Google Scholar] [CrossRef]
- Ma, M.; Tam, V.W.Y.; Le, K.N.; Li, W. Challenges in Current Construction and Demolition Waste Recycling: A China Study. Waste Manag. 2020, 118, 610–625. [Google Scholar] [CrossRef]
- Silva, R.V.; de Brito, J.; Dhir, R.K. Use of Recycled Aggregates Arising from Construction and Demolition Waste in New Construction Applications. J. Clean. Prod. 2019, 236, 117629. [Google Scholar] [CrossRef]
- Ossa, A.; García, J.L.; Botero, E. Use of Recycled Construction and Demolition Waste (CDW) Aggregates: A Sustainable Alternative for the Pavement Construction Industry. J. Clean. Prod. 2016, 135, 379–386. [Google Scholar] [CrossRef]
- Vieira, C.S.; Pereira, P.M. Use of Recycled Construction and Demolition Materials in Geotechnical Applications: A Review. Resour. Conserv. Recycl. 2015, 103, 192–204. [Google Scholar] [CrossRef]
- Batayneh, M.; Marie, I.; Asi, I. Use of Selected Waste Materials in Concrete Mixes. Waste Manag. 2007, 27, 1870–1876. [Google Scholar] [CrossRef]
- Liu, L.; Li, Z.; Cai, G.; Geng, X.; Dai, B. Performance and Prediction of Long-Term Settlement in Road Embankments Constructed with Recycled Construction and Demolition Waste. Acta Geotech. 2022, 17, 4069–4093. [Google Scholar] [CrossRef]
- Arulrajah, A.; Disfani, M.M.; Horpibulsuk, S.; Suksiripattanapong, C.; Prongmanee, N. Physical Properties and Shear Strength Responses of Recycled Construction and Demolition Materials in Unbound Pavement Base/Subbase Applications. Constr. Build. Mater. 2014, 58, 245–257. [Google Scholar] [CrossRef]
- Agrela, F. Construction of Road Sections Using Mixed Recycled Aggregates Treated with Cement in Malaga, Spain. Resour. Conserv. Recycl. 2012, 58, 98–106. [Google Scholar] [CrossRef]
- Jiménez, J.R.; Ayuso, J.; Agrela, F.; López, M.; Galvín, A.P. Utilisation of Unbound Recycled Aggregates from Selected CDW in Unpaved Rural Roads. Resour. Conserv. Recycl. 2012, 58, 88–97. [Google Scholar] [CrossRef]
- Tabsh, S.W.; Abdelfatah, A.S. Influence of Recycled Concrete Aggregates on Strength Properties of Concrete. Constr. Build. Mater. 2009, 23, 1163–1167. [Google Scholar] [CrossRef]
- Medina, C.; Zhu, W.; Howind, T.; Rojas, M.I.S.; Fríaset, M. Influence of mixed recycled aggregate on the physical–mechanical properties of recycled concrete. J. Clean. Prod. 2014, 68, 216–225. [Google Scholar] [CrossRef]
- Gómez, M.B.; Pérez, I. Effects of the use of construction and demolition waste aggregates in cold asphalt mixtures. Constr. Build. Mater. 2014, 51, 267–277. [Google Scholar] [CrossRef]
- Yang, K.H.; Wu, H.M.; Tseng, T.L.; Yoo, C. Model tests of geosynthetic-reinforced soil walls with marginal backfill subjected to rainfall. Geotext. Geomembr. 2023, 51, 342–359. [Google Scholar] [CrossRef]
- Lin, Y.; Liu, S.; He, B.; Li, L.; Qiao, L. Mechanical Behavior of Geogrid Flexible reinforced soil structure Subjected to Dynamic Load. Buildings 2024, 14, 1628. [Google Scholar] [CrossRef]
- Li, X.; Cai, X.; Li, S.; Huang, X.; Zhu, C.; Xu, H. Analysis of the Structural Behavior Evolution of Reinforced Soil Retaining Walls under the Combined Effects of Rainfall and Earthquake. Buildings 2024, 15, 115. [Google Scholar] [CrossRef]
- Baykal, G.; Dadasbilge, O. Experimental Investigation of pullout Resistance of Uniaxial Geogrids. In Geosynthetics in Civil and Environmental Engineering; Li, G., Chen, Y., Tang, X., Eds.; Springer: Berlin/Heidelberg, Germany, 2009; pp. 174–178. [Google Scholar]
- Chen, C.; McDowell, G.R.; Thom, N.H. Investigating Geogrid-Reinforced Ballast: Experimental pullout Tests and Discrete Element Modelling. Soils Found. 2014, 54, 1–11. [Google Scholar] [CrossRef]
- Tajabadipour, M.; Lajevardi, S.H. Laboratory Large-Scale pullout Investigation of a New Reinforcement of Composite Geosynthetic Strip. J. Rock. Mech. Geotech. Eng. 2021, 13, 1147–1159. [Google Scholar] [CrossRef]
- Ferreira, F.B.; Vieira, C.S.; Lopes, M.L.; Carlos, D.M. Experimental investigation on the pullout behaviour of geosynthetics embedded in a granite residual soil. Eur. J. Environ. Civ. Eng. 2016, 20, 1147–1180. [Google Scholar] [CrossRef]
- Vieira, C.S.; Pereira, P.M.; Lopes, M.D.L. Recycled Construction and Demolition Wastes as Filling Material for Geosynthetic Reinforced Structures. Interface Properties. J. Clean. Prod. 2016, 124, 299–311. [Google Scholar] [CrossRef]
- Arulrajah, A.; Rahman, M.A.; Piratheepan, J.; Bo, M.W.; Imteaz, M.A. Evaluation of Interface Shear Strength Properties of Geogrid-Reinforced Construction and Demolition Materials Using a Modified Large-Scale Direct Shear Testing Apparatus. J. Mater. Civ. Eng. 2014, 26, 974–982. [Google Scholar] [CrossRef]
- Sarkar, S.; Prakash, S.; Hegde, A. Interaction between Biaxial Geogrid and Solid Waste Materials: Laboratory Study and Artificial Neural Network Model Development. Int. J. Geosynth. Ground Eng. 2023, 9, 77. [Google Scholar] [CrossRef]
- Wang, M.Y. Research on the Behaviors at Interface Between Geogrids and Expansive Soils and the Reinforcement Mechanism. Ph.D. Thesis, Zhejiang University, Hangzhou, China, 2009. (In Chinese). [Google Scholar]
- Test Methods of Soils for Highway Engineering. JTG 3430-2020; China Communications Press: Beijing, China, 2020.
- Geosynthetics-Wide-width tensile test. GB/T 15788-2017; China Standards Press: Beijing, China, 2017.
- Wang, Z.; Jacobs, F.; Ziegler, M. Experimental and DEM investigation of geogrid–soil interaction under pullout loads. Geotext. Geomembr. 2016, 44, 230–246. [Google Scholar] [CrossRef]
- Agarwal, A.; Ramana, G.V.; Datta, M.; Soni, N.K.; Satyakam, R. Pullout behaviour of polymeric strips embedded in mixed recycled aggregate (MRA) from construction & demolition (C&D) waste–Effect of type of fill and compaction. Geotext. Geomembr. 2023, 51, 405–417. [Google Scholar] [CrossRef]
- Prasad, P.S.; Ramana, G.V. Feasibility study of copper slag as a structural fill in reinforced soil structures. Geotext. Geomembr. 2016, 44, 623–640. [Google Scholar] [CrossRef]
- JTG E50-2006; Test Methods of Geosynthetics for Highway Engineering. China Communications Press: Beijing, China, 2006.
- Moraci, N.; Recalcati, P. Factors Affecting the pullout Behaviour of Extruded Geogrids Embedded in a Compacted Granular Soil. Geotext. Geomembr. 2006, 24, 220–242. [Google Scholar] [CrossRef]
- Cao, W.; Zheng, J.; Zhou, Y. Comparative Experimental Investigation of Geogrid-soil Interface Behavior of Biaxial and Triaxial Geogri. J. Hunan Univ. Nat. Sci. 2019, 46, 109–116. (In Chinese) [Google Scholar] [CrossRef]
- Han, B.; Ling, J.; Shu, X.; Gong, H.; Sun, Y.; Polaczyk, P.A.; Huang, B. Resilient interface shear modulus for characterizing shear properties of pavement base materials. J. Mater. Civ. Eng. 2018, 30, 04018333. [Google Scholar] [CrossRef]


| D60/mm | D30/mm | D10/mm | Optimum Moisture Content/% | Maximum Dry Density /kg·m−3 |
|---|---|---|---|---|
| 20.00 | 9.75 | 0.65 | 9.26 | 1720 |
| Type | Mesh Size/mm | Ultimate Tensile Strength/kN·m−1 | Ultimate Elongation/% | Tensile Modulus/kPa | |
|---|---|---|---|---|---|
| 2% | 5% | ||||
| Biaxial geogrid | 40 × 40 | 39.56 | 8.92 | 386,500 | 283,200 |
| Triaxial geogrid | 40 × 40 × 40 | 35.360 | 8.38 | 317,500 | 230,360 |
| Code | Geogrid | Pullout Rates/mm·min−1 | Normal Stress/kPa |
|---|---|---|---|
| P1 | Biaxial geogrid | 1 | 25, 50, 75 and 100 |
| P2 | 2 | 25, 50, 75 and 100 | |
| P3 | 3 | 25, 50, 75 and 100 | |
| P4 | Triaxial geogrid | 2 | 25, 50, 75 and 100 |
Disclaimer/Publisher’s Note: The statements, opinions and data contained in all publications are solely those of the individual author(s) and contributor(s) and not of MDPI and/or the editor(s). MDPI and/or the editor(s) disclaim responsibility for any injury to people or property resulting from any ideas, methods, instructions or products referred to in the content. |
© 2025 by the authors. Licensee MDPI, Basel, Switzerland. This article is an open access article distributed under the terms and conditions of the Creative Commons Attribution (CC BY) license (https://creativecommons.org/licenses/by/4.0/).
Share and Cite
Zhang, D.; Gao, H.; Wang, H.; Yang, G. An Experimental Study on the Interface Characteristics of Geogrid-Reinforced Construction and Demolition (C&D) Waste Recycled Aggregate Based on Pullout Tests. Buildings 2025, 15, 2355. https://doi.org/10.3390/buildings15132355
Zhang D, Gao H, Wang H, Yang G. An Experimental Study on the Interface Characteristics of Geogrid-Reinforced Construction and Demolition (C&D) Waste Recycled Aggregate Based on Pullout Tests. Buildings. 2025; 15(13):2355. https://doi.org/10.3390/buildings15132355
Chicago/Turabian StyleZhang, Da, Haixiang Gao, Haifeng Wang, and Guangqing Yang. 2025. "An Experimental Study on the Interface Characteristics of Geogrid-Reinforced Construction and Demolition (C&D) Waste Recycled Aggregate Based on Pullout Tests" Buildings 15, no. 13: 2355. https://doi.org/10.3390/buildings15132355
APA StyleZhang, D., Gao, H., Wang, H., & Yang, G. (2025). An Experimental Study on the Interface Characteristics of Geogrid-Reinforced Construction and Demolition (C&D) Waste Recycled Aggregate Based on Pullout Tests. Buildings, 15(13), 2355. https://doi.org/10.3390/buildings15132355