Article

Influence on Existing Underlying Metro Tunnel Deformation from Small Clear-Distance Rectangular Box Jacking: Monitoring and Simulation

1
Liangshan Engineering Technology (Wuhan) Co., Ltd., Wuhan 430015, China
2
School of Civil Engineering, Sun Yat-sen University, Guangzhou 510275, China
3
National Engineering Research Center of Eco-Environment in the Yangtze River Economic Belt, China Three Gorges Corporation, Wuhan 430014, China
4
State Key Laboratory for Tunnel Engineering, Guangzhou 510275, China
*
Author to whom correspondence should be addressed.
Buildings 2025, 15(14), 2547; https://doi.org/10.3390/buildings15142547
Submission received: 4 June 2025 / Revised: 13 July 2025 / Accepted: 17 July 2025 / Published: 19 July 2025

Abstract

Rectangular box jacking is widely used in densely developed urban areas. However, when conducted with limited clear distance near existing metro tunnels, it introduces considerable structural safety risks. This study investigates a large-section rectangular box jacking project in Suzhou that crosses a double-line metro tunnel with minimal vertical clear distance. Integrated field monitoring and finite element simulations were conducted to analyze the tunnel’s deformation behavior during various jacking phases. The results show that the upline tunnel experienced greater uplift than the downline tunnel, with maximum vertical displacement occurring directly beneath the jacking axis. The affected zone extended approximately 20 m beyond the pipe gallery boundaries. Both the tunnel vault and ballast bed exhibited vertical uplift, while the hance displaced laterally toward the launching shaft. These deformations showed clear stage-dependent patterns strongly influenced by the relative position of the jacking machine. Numerical simulations demonstrated that doubling the pipe–tunnel clearance reduced the vault displacement by 58.87% (upline) and 51.95% (downline). Increasing the pipe–slurry friction coefficient from 0.1 to 0.3 caused the hance displacement difference to rise from 0.12 mm to 0.36 mm. Further sensitivity analysis reveals that when the jacking machine is positioned directly above the tunnel, grouting pressure is the greatest influence on the structural response and must be carefully controlled. The proposed methodology and findings offer valuable insights for future applications in similar tunnelling projects.

1. Introduction

With the continuous improvement of the development intensity of urban underground space, the available underground resources tend to be saturated [1,2,3]. Given limited space, it is inevitable that new tunnels, underground pipelines, or foundation pit projects will pass through or be close to existing metro tunnels. Table 1 summarizes representative cases of adjacent construction projects in major urban areas. Such proximity operations can significantly disrupt the pre-existing in situ stress and deformation fields of the surrounding soil, leading to additional structural deformations and changes in internal forces, thereby posing a potential risk to the structural integrity and operational safety of the metro tunnel [4,5,6].
Pipe jacking is an important trenchless tunneling method developed after the shield technique. It is widely used for the installation of underground utilities, including power lines, water supply, drainage systems, and integrated utility corridors [7]. Similar to shield construction, pipe jacking encounters similar challenges in supporting pressure control of the excavation face [8]. However, unlike the shield method, pipe jacking requires all subsequent pipes to advance synchronously. To overcome the frictional resistance along the pipe’s outer surface, continuous grouting is necessary, which increases the complexity of construction control [9,10]. When pipe jacking crosses beneath an existing metro tunnel with a small clear distance, the coupling among structure, ground, and construction becomes significantly more complex. This is primarily due to the distinct construction techniques and mechanical mechanisms involved in pipe jacking [11]. Consequently, it is imperative to conduct systematic mechanical analysis and engineering measurement studies to ensure the stability of the metro tunnel structure during pipe jacking operations.
Over the years, scholars have conducted extensive investigations into the effects of approach tunnel construction on existing tunnels or pipelines using a variety of research methodologies, such as on-site monitoring [11,12], physical model experiments [13,14], numerical simulations [15,16], and analytical methods [17,18]. For metro tunnels, it is usually constructed using the shield method. When the approach region of the tunnel experiences varying settlement or excavation loads, it can induce joint rotation and shear displacement of the segments [19], potentially resulting in longitudinal differential settlement of the shield tunnel. To address this issue, Zhang et al. [20] developed a simplified longitudinal beam-spring model (SLBSM) to simulate the longitudinal behavior of shield tunnels. Combined with a pipe jacking project, it is found that the inclination angle between the upper and lower tunnels has a significant effect on the longitudinal displacement and joint opening of the existing tunnel. Xu et al. [21] proposed a model based on the Pasternak–Timoshenko theory that accounts for soil disturbance (SP-T) to characterize the settlement profile of a newly constructed shield tunnel above an existing rectangular box-jacking tunnel. He et al. [22] found that the deformation of existing tunnels induced by circular pipe jacking can be divided into four stages. They also reported that tunnel deformation predicted using the Burger creep visco-plastic (CVISC) model showed better agreement with the measured data. While existing theoretical studies and model tests provide important insights for predicting tunnel deformation, they remain indirect. In contrast, field test data offer more direct and reliable evidence for understanding the deformation behavior of existing tunnels affected by adjacent excavation.
In comparison to circular pipe jacking, rectangular box jacking is more prone to causing the carrying-soil phenomenon due to its larger cross-sectional area and numerous structural corners [23,24,25]. As a result, it leads to a broader range of ground disturbance. When a rectangular box jacking project approaches an existing tunnel, the stratum-structure interaction becomes increasingly complex. This complexity leads to greater deformation in the tunnel vault, hance, and ballast bed and results in elevated structural stress concentrations. Due to its structural characteristics, rectangular box jacking is primarily employed in underground pipe galleries, cross-street channels, and urban expressways [26,27]. Usually, the buried depth is shallow, so most of them cross the existing metro tunnel. However, relatively few studies have been conducted on the structural response of the tunnels induced by rectangular box jacking crossing [11,12,28,29].
Based on this, this study investigates a shallow-buried, large-section rectangular box jacking project that crosses an existing metro tunnel with a small clear distance. The focus is placed on analyzing the deformation patterns of the vault, hance, and ballast bed of the double-line tunnel across different jacking phases. Furthermore, by integrating finite element modelling, the effects of various construction parameters on the deformation of double-line tunnels are systematically evaluated, including the pipe–tunnel clear distance, pipe–soil friction coefficient, and grouting pressure. The findings of this study provide a theoretical foundation and engineering guidance for similar proximity projects, offering significant academic value and practical implications.

2. Field Experiment

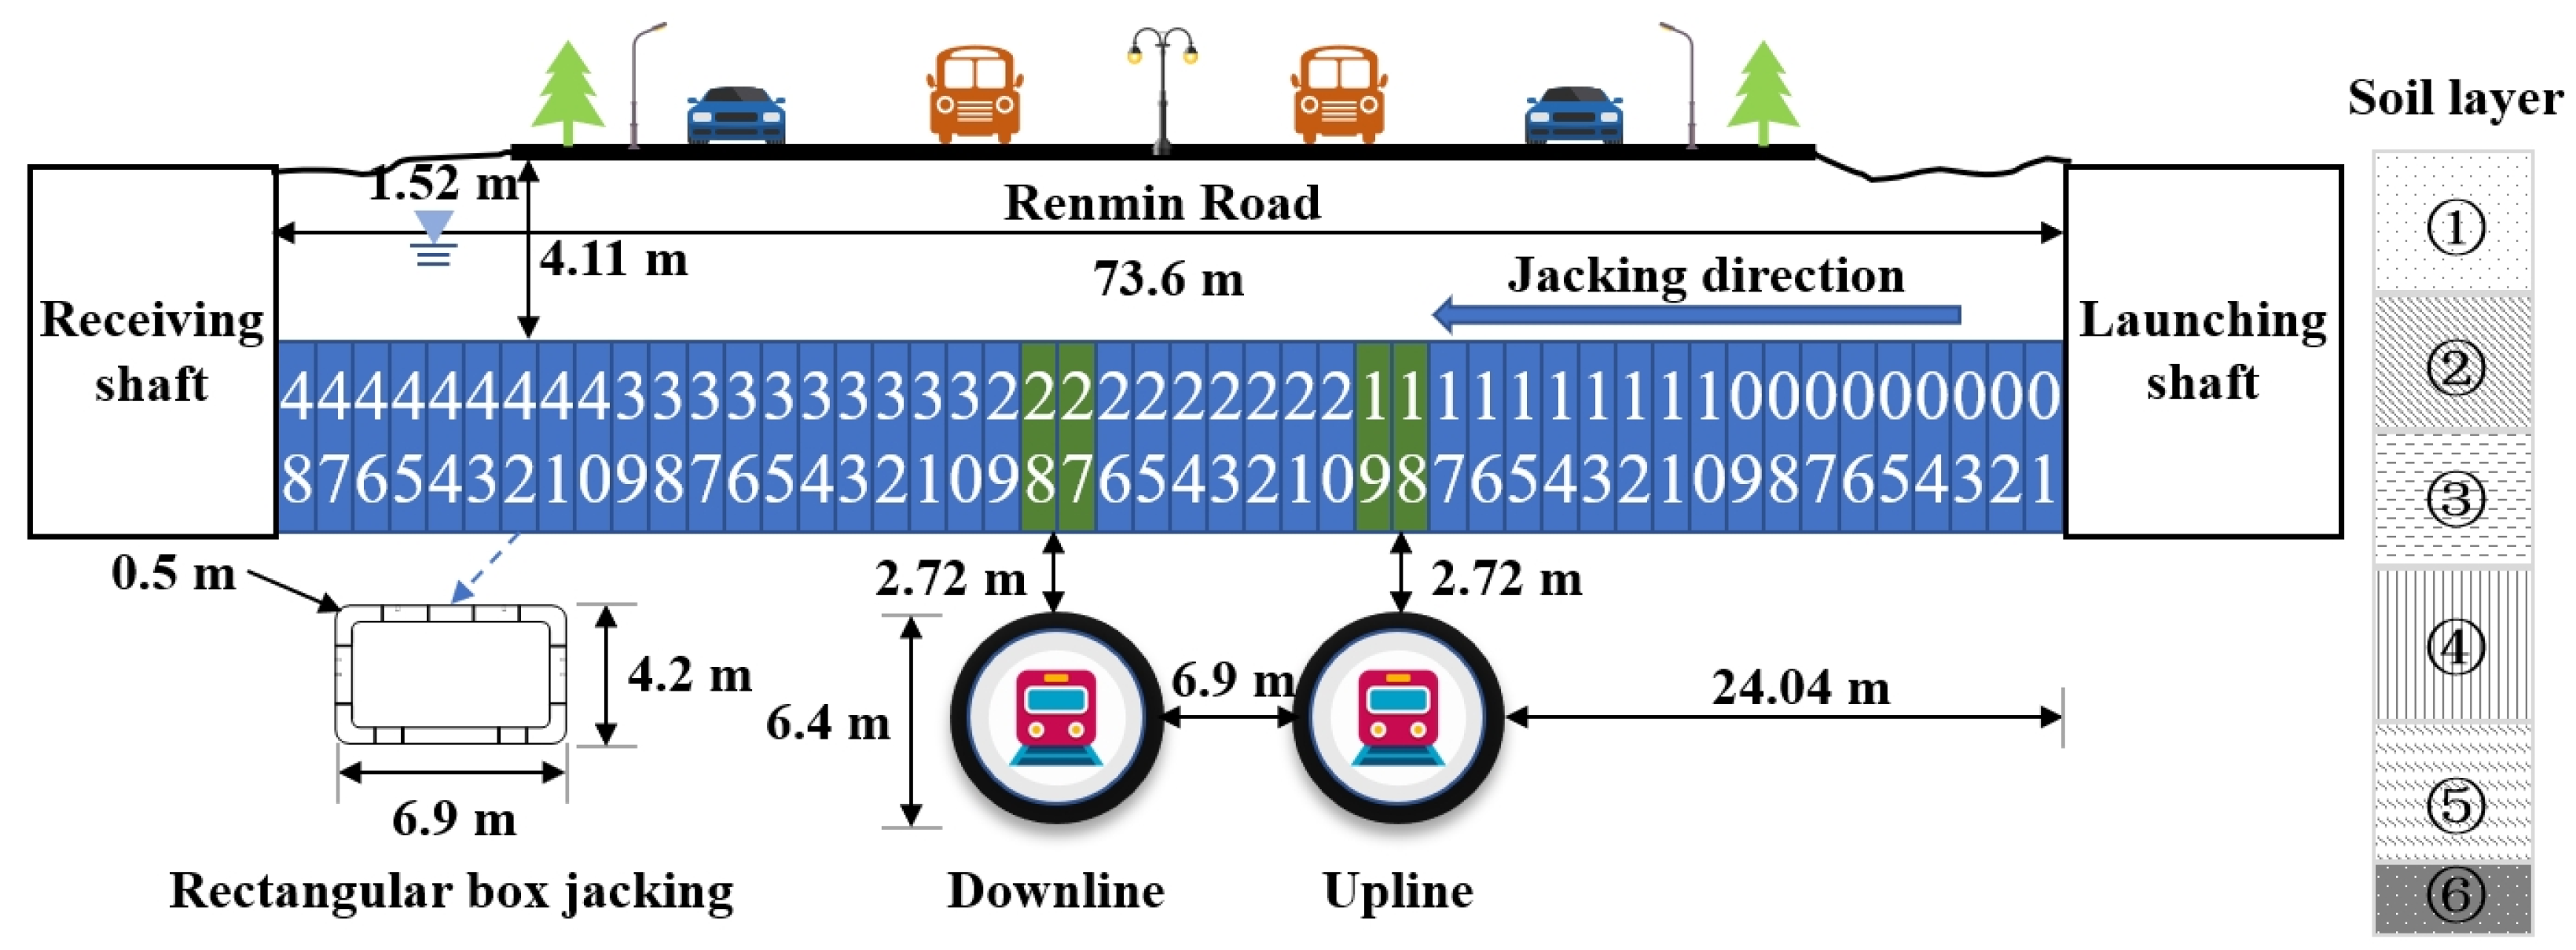
2.1. Project Overview

The Suzhou Renmin Road Underground Pipe Gallery Project was located in the main urban area of Suzhou, and this area experienced high traffic volumes and a complex construction environment, which required advanced construction technology and safety control. Figure 1 illustrates the plan view of the project. The pipe gallery consists of two rectangular boxes, with a size of 6.9 × 4.2 m, the length of a single pipe is 1.5 m, and the wall thickness is 0.5 m. The pipe gallery obliquely crosses under the shield tunnels of Metro Line 2, forming an angle of 78° between the pipe gallery’s centerline and the metro tunnel’s centerline. Figure 2 presents the project profile. The pipe gallery utilized the earth pressure balanced rectangular box jacking method for sequential jacking, with a total jacking length of 73.6 m, consisting of 48 pipes. The jacking section was overlain by an average soil thickness of 4.06 m. The minimum vertical clear distance between the bottom of the pipe gallery and the vault of the metro tunnel was 2.76 m, while the horizontal spacing ranged from 23 m to 27 m. The distance between the upline and downline tunnels was 13.3 m, employing C50 prefabricated reinforced concrete segments. The tunnels had an outer diameter of 6.4 m and an inner diameter of 5.4 m, interconnected using M30 bent bolts. Based on a thorough assessment of construction and monitoring conditions, the length of the affected metro tunnel ranged from 16.90 m to 58.09 m, while the metro continued operating normally during jacking.
Figure 2 illustrates that the strata in the construction zone exhibit greater complexity, with the soil layers from top to bottom as follows: ① Artificial fill, ② Clay, ③ Silty clay, ④ Silty clay mixed with silt, ⑤ Sand clay, and ⑥ Silty clay. Table 2 presents the physical and mechanical parameters associated with each soil layer. Among these, the primary soil layers traversed by the pipe jacking process are ② Clay and ③ Silty clay, both of which exhibit medium compressibility, favorable engineering properties, and relatively uniform composition. The groundwater depth ranges from 1 to 2 m, with shallow micro-confined water present in layers ④ Silty clay mixed with silt and ⑤ Sand clay.

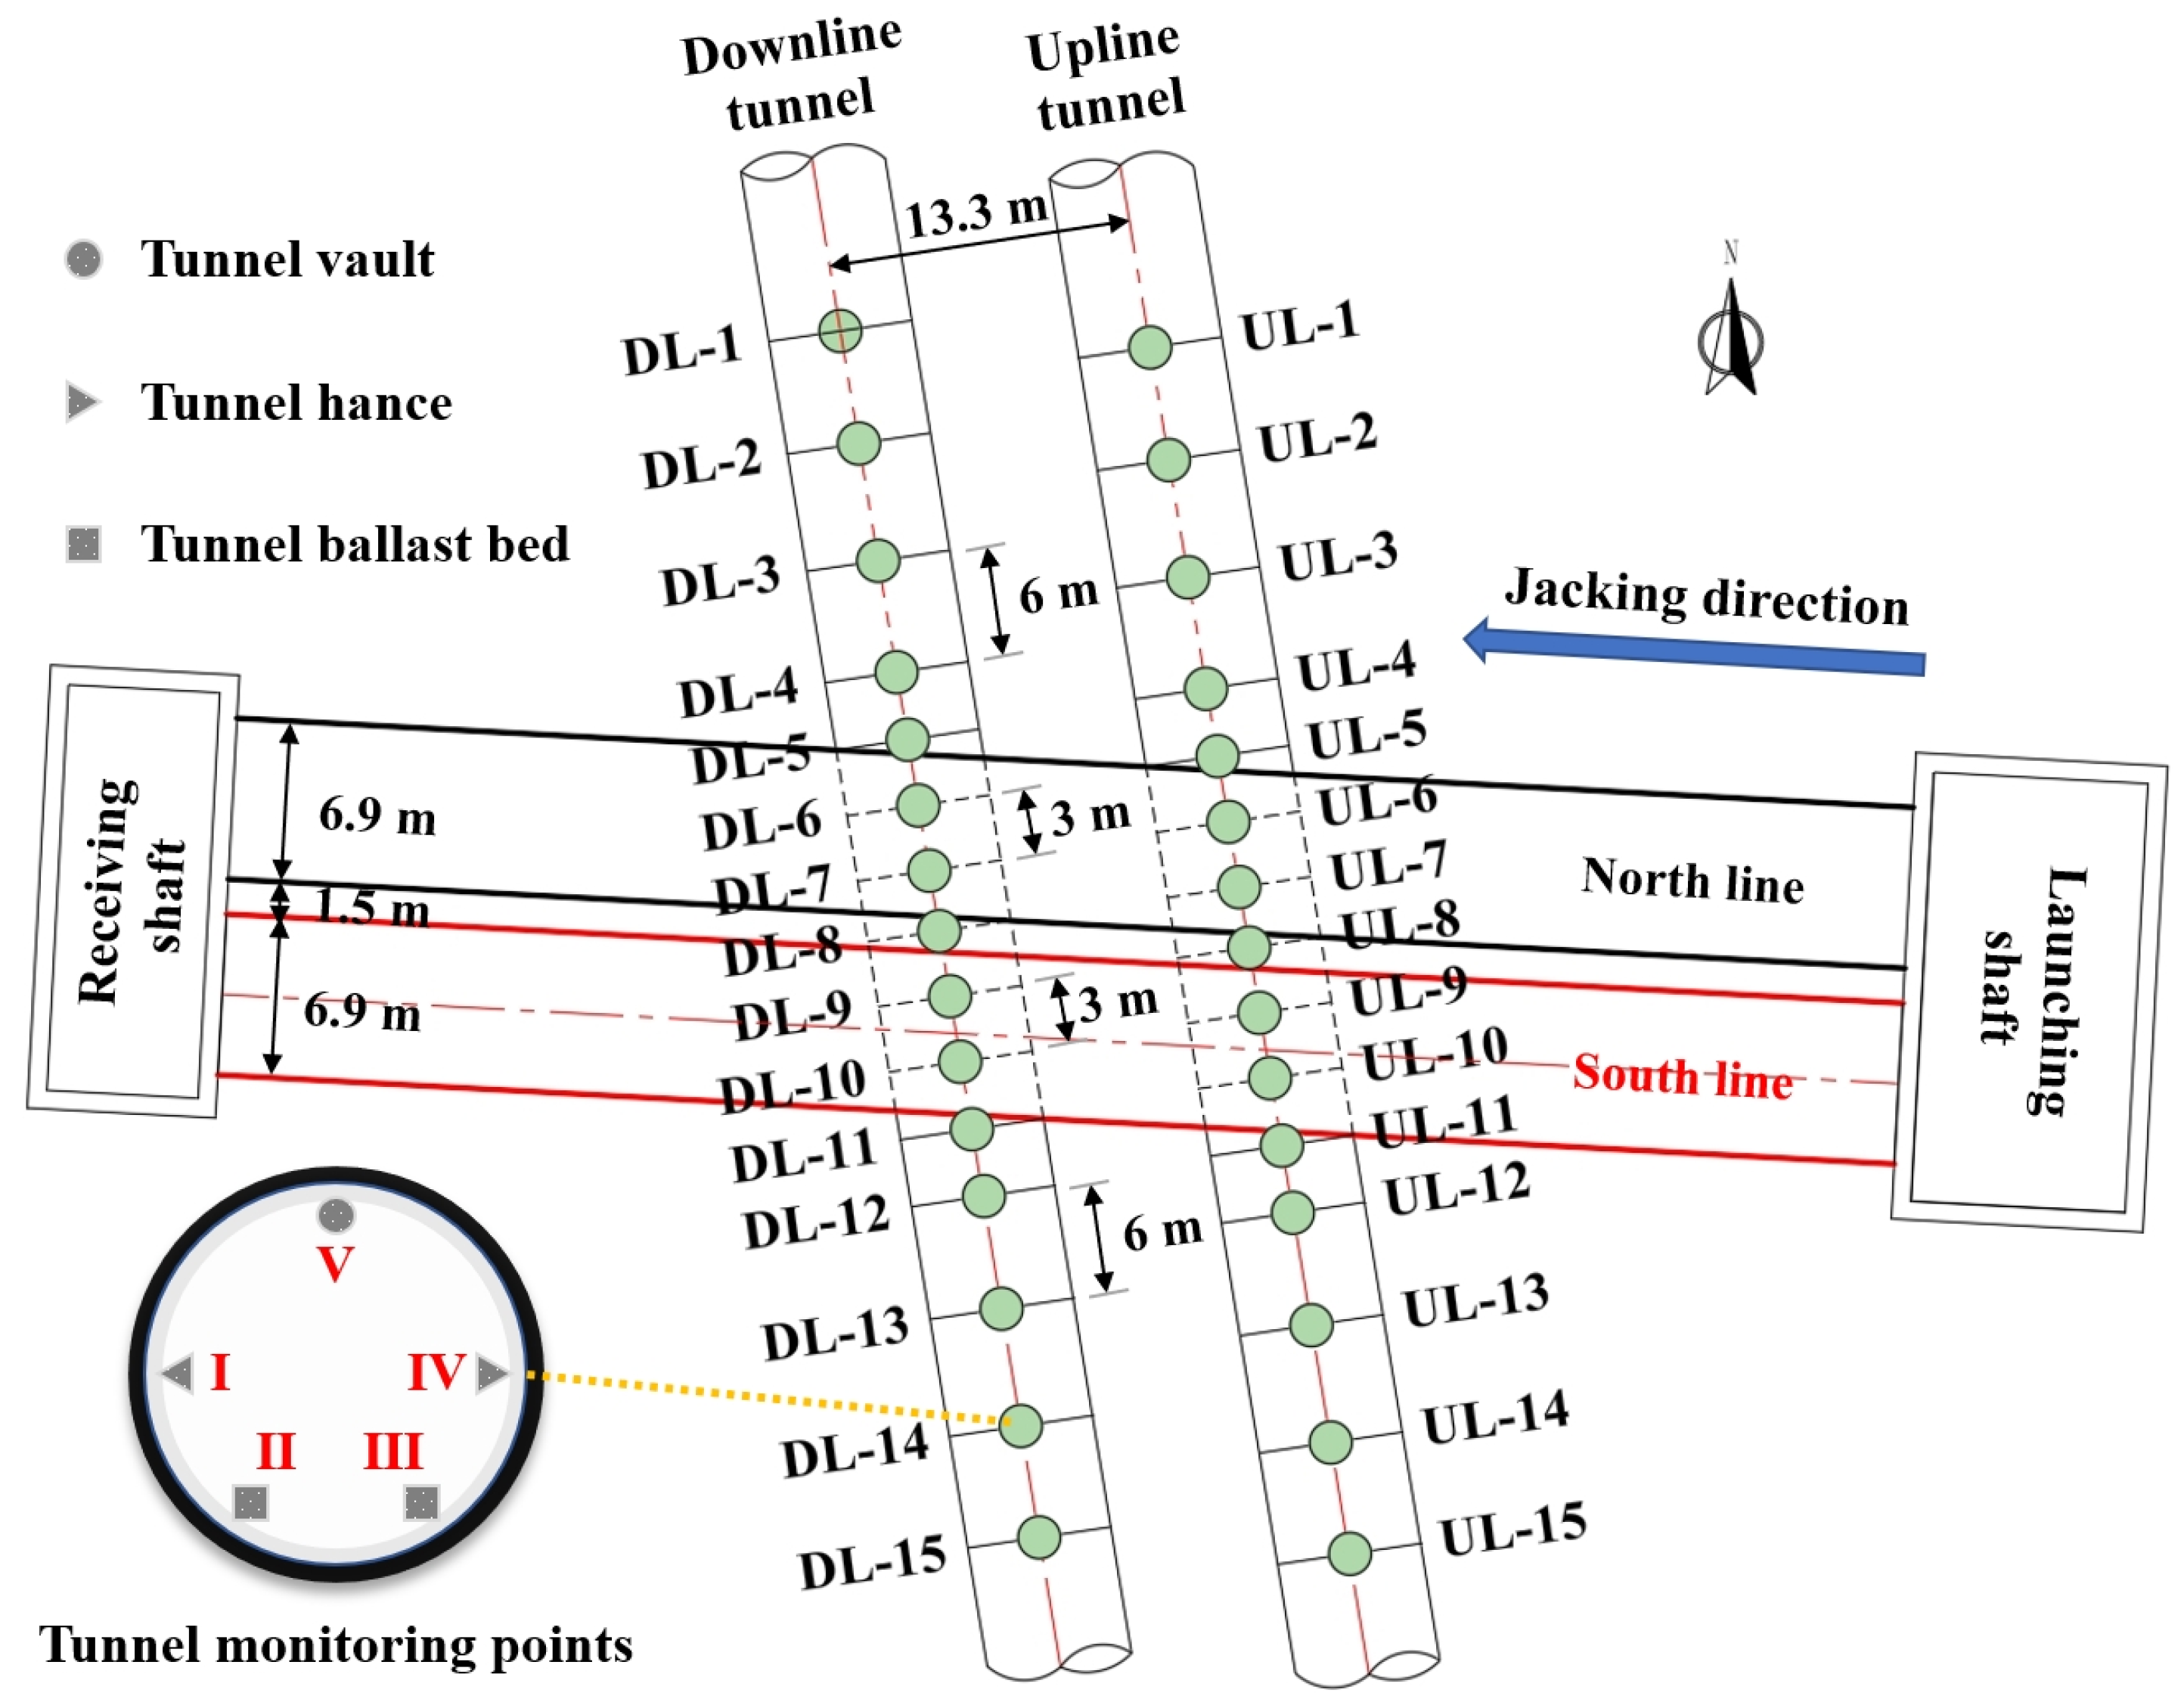
2.2. Monitoring Scheme

Zhou et al. [18] proposed that the disturbance deformation induced by pipe jacking construction primarily results from the intricate interaction between internal and external factors. Based on this theoretical framework, the construction disturbance zone associated with pipe jacking overcrossing double-line tunnels can be more comprehensively classified, as illustrated in Figure 3. Due to the limited clear distance between the rectangular box jacking and the tunnels, the construction of the pipe jacking through the tunnel not only results in the spatial overlap of the soil disturbance zone but also induces a dynamic, nonlinear variation in the stress state of the tunnel structure [11]. Therefore, the response behavior of the tunnel can be directly assessed through the implementation of on-site monitoring tests.
To investigate the impact of rectangular box jacking construction on the deformation of existing tunnel structures, 15 monitoring sections were established in each double-line tunnel, labelled UL-1 through UL-15 (Upline) and DL-1 through DL-15 (Downline), respectively. In particular, within the significant influence zone of pipe jacking, defined as the area above the pipe jacking axis and its adjacent regions, a monitoring section was placed every 3 m. In less critical areas, where the influence is relatively weaker, monitoring sections were placed every five rings (6 m), thereby achieving a balance between monitoring accuracy and construction feasibility. Each section contains five monitoring points, resulting in a total of 150 monitoring points. Specifically, point I and point IV correspond to the left and right hance of the tunnel section, points II and III are located in the left and right ballast bed, and point V is situated at the tunnel vault, as depicted in Figure 4. To enhance monitoring accuracy and data acquisition efficiency, a Leica TM30 total station (Leica Geosystems AG, Heerbrugg, Switzerland) was employed for automatic monitoring of all measurement points. The monitoring system integrates a GPRS wireless data transmission module, enabling real-time data acquisition and remote transmission of monitoring results.
Due to the underground pipe gallery adopting the method of two parallel jacked rectangular boxes in the north and south, in turn, with the south line being jacked first, followed by the north line, there exists a time lag between the construction of the two lines. To mitigate the mutual influence and ensure the relevance and precision of the data analysis, this study only selected the tunnel monitoring data collected during the jacking of the south line. This approach enables a more detailed analysis of the mechanical response and structural deformation characteristics of the existing tunnel during the initial crossing of the rectangular box jacking.

2.3. Experimental Program

The pipe jacking operation for the south line commenced on 16 August, with a total cumulative jacking distance of 73.6 m completed by the morning of 16 September. The daily average jacking rate was approximately 2.7 m, and no extended shutdowns occurred during the entire jacking process. Based on the spatial relationship between the pipe jacking machine and the metro tunnel structure, the entire jacking process was categorized into five distinct key phases: entering the affect zone of UL (Phase I), entering the above of UL (Phase II), entering the above of DL (Phase III), leaving the affect zone of DL (Phase IV), and end of jacking (Phase V). Table 3 presents the division of the jacking phase.

3. Experimental Results and Analysis

3.1. Vertical Displacement of Metro Tunnel

3.1.1. Tunnel Vault

Figure 5 illustrates the vertical displacement of the vault for the double-line tunnel, where positive displacement corresponds to uplift, and negative displacement corresponds to settlement. The monitoring points UL-10 and DL-10 are positioned directly beneath the rectangular box jacking. Regarding the vault of the upline tunnel, excavation from Phase I to II intensifies soil unloading, causing the surrounding soil to shift into the space of the pipe jacking area formed by the excavation, which results in a gradual increase in tunnel uplift and small deformation. During this phase, the deformation across each monitoring section remains relatively consistent, with no obvious trend observed. From Phase III to IV, increased soil unloading exacerbates formation loss, leading to a more pronounced vertical deformation of the vault in the upline tunnel. The analysis indicates that this is attributable to the stress-space-time effect of soil disturbance caused by jacking during the first two phases, along with changes in grouting pressure after the wall. The highest value occurs approximately 5 to 10 m from the left side of the pipe jacking axis, with minimal vertical displacement observed at measuring points farther from the axis.
For the vault of the downline tunnel, the excavation of the pipe jacking has little effect on Phases I and II, and Phases III and IV are the phases when the pipe jacking crosses through the downline tunnel. In Phase III, when the pipe jacking operation occurs directly above the downline tunnel, the uplift of the downline tunnel vault reduces. As the pipe jacking machine exits the affected zone of the downline tunnel in Phase IV, the vertical displacement of the downline tunnel vault notably increases. The self-weight of the pipe jacking machine and the additional stress in front of the excavation face may be the main reasons for this phenomenon. Contrary to observations for the upline tunnel, the maximum vertical displacement of the downline tunnel vault predominantly occurs beneath the pipe jacking axis, exhibiting symmetrical distribution centered around the axis.
Figure 6 illustrates the vertical displacement curves of the vault across 15 monitoring sections. Upon completion of the entire pipe jacking of the south line, the maximum vault displacement observed in the final upline tunnel reaches 1.7 mm. In contrast, the maximum displacement for the downline tunnel is 1.25 mm. Deformation of the metro tunnel beneath the pipe jacking axis is more pronounced compared to regions away from the axis, progressively reducing with increasing distance from the axis. If the soil surrounding the operational metro tunnel is modeled as an elastic foundation beam, as shown in Figure 7, the bending stiffness of the tunnel directly influences the uplift deformation characteristics of the tunnel structure [30]. Throughout the construction of large-section rectangular box jacking, the tunnel tends to float, aligning closely with the displacement patterns presented in Figure 5. Due to temporal-spatial factors and constraints imposed by the upline tunnel, vertical deformation at the vault of the downline tunnel is smaller than that of the upline tunnel.
Figure 8 presents the time-dependent response curves of vault vertical displacement, and the displacement data were obtained from two representative sections—UL9 (upline) and DL9 (downline)—located directly beneath the pipe jacking axis. Based on the phase characteristics of the displacement curve, vault deformation can be categorized into three distinct periods: the initial deformation zone (Period 1), the deformation oscillation zone (Period 2), and the stable uplift zone (Period 3). The deformation mechanism corresponding to each period is closely associated with the relative position of the pipe jacking machine:
Period 1: Before the pipe jacking machine enters the affected zone of the upline tunnel, the tunnel structure is less disturbed as a whole, and the vertical displacement of the vault changes relatively smoothly. The tunnel vault exhibits only slight float, and the uplift amplitudes range from 0 to 0.17 mm for the upline tunnel and from −0.1 to 0.4 mm for the downline tunnel during this period.
Period 2: At this period, the pipe jacking machine is mainly located in the zone affecting the upline and downline tunnels. The vertical deformation of the vault is significantly enhanced, and the downline tunnel is even settled; subsequently, the vault rises sharply. When entering the tunnel directly above, the vault often appears to undergo short-term settlement, which is speculated to be mainly due to the gravitational action caused by the pipe jacking machine and its counterweight. Following the machine’s cross directly above the tunnels, the tunnel structure experiences rapid uplift and a sharp displacement transition, driven by the combined effects of soil unloading and vault rebound, and the uplift amplitudes range from −0.07 to 1 mm for the upline tunnel and from −0.63 to 0.62 mm for the downline tunnel during this period.
Period 3: At this period, the pipe jacking machine exited the affected zone of the downline tunnel, the vault uplift rate declined markedly, and the deformation trend gradually stabilized. Following the end of jacking, localized settlement persists in portions of the double-line tunnel vault; however, overall deformation gradually converges and stabilizes.

3.1.2. Tunnel Ballast Bed

As the vertical displacements of the left and right ballast beds are similar, only the distribution curve for the right ballast bed of the double-line tunnel is presented in Figure 9, with uplift defined as positive and settlement as negative. The deformation behavior of the tunnel ballast bed closely resembles that of the vault, and variations in the relative position of the pipe jacking machine induce corresponding changes in the ballast bed response. From Phase I to II, the ballast bed of the double-line tunnel exhibited slight variation, while the uplift of the upline tunnel appeared in Phase III, and the uplift of the upline tunnel became more and more obvious from Phase III to IV, primarily due to increased stratum loss. Significant uplift of the downline tunnel ballast bed was observed after Phase IV, further confirming that excavation-induced unloading, occurring after the pipe jacking machine passed directly above, accentuated the tunnel’s floating tendency.
Figure 10 presents the vertical displacement curves of the left and right ballast beds across 15 monitoring sections. Upon completion of pipe jacking along the entire alignment, the maximum displacement of the right ballast bed in the upline tunnel reaches 2.58 mm, while the maximum uplift in the downline tunnel reaches 1.37 mm. The maximum vertical displacement of the ballast bed occurs approximately beneath the pipe jacking axis and is symmetrically distributed about the axis, with the vertical displacement of the upline tunnel ballast bed marginally exceeding that of the downline tunnel.
Figure 11 illustrates the time-dependent response curve of vertical displacement in the ballast bed. The overall trend of the curve indicates that the vertical displacement behavior of the ballast bed closely resembles that of the vault and can similarly be divided into three distinct periods, which are similar to the tunnel vault. However, throughout the entire process, the vertical displacement of the upline tunnel ballast bed consistently exceeds that of the downline, with the uplift on the right side of the upline tunnel greater than that on the left. The maximum displacement difference between the two sides reaches 0.54 mm during Phase III, whereas the uplift on both sides of the downline tunnel remains largely uniform. The primary factors contributing to differential ballast bed deformation between the two lines include construction control parameters during jacking, such as jacking force, jacking speed, and the volume of synchronous grouting. In practice, variations in jacking force and speed directly influence the extent and propagation path of stratum disturbance, while uneven grouting may result in differential support effects across regions, thereby inducing asymmetric uplift or settlement of the ballast bed structure [21].
Table 4 summarizes the maximum deformation of the existing double-line tunnel during the pipe jacking construction. The soil disturbance induced by pipe jacking excavation is primarily transmitted in an upward direction. The buoyancy at the bottom of the tunnel (i.e., the ballast bed area) is relatively larger, and the area with lower structural stiffness is more prone to displacement, resulting in vertical deformation amplitudes at the ballast bed that generally exceed those at the vault. Additionally, the damage and disturbance to the surrounding strata of the upline tunnel are more concentrated and last longer in the initial stage of construction disturbance. As construction progresses, stratum disturbances accumulate spatiotemporally, subjecting the upline tunnel structure to persistent high-intensity disturbance throughout the entire cycle, ultimately resulting in significantly greater uplift compared to the downward line. According to the deformation of the double-line tunnel, the affected area of the pipe jacking on the metro tunnel is roughly within the 20 m range of the edge line of the pipe gallery. Within this range, the metro tunnel is significantly impacted by the rectangular box jacking process, and vice versa.

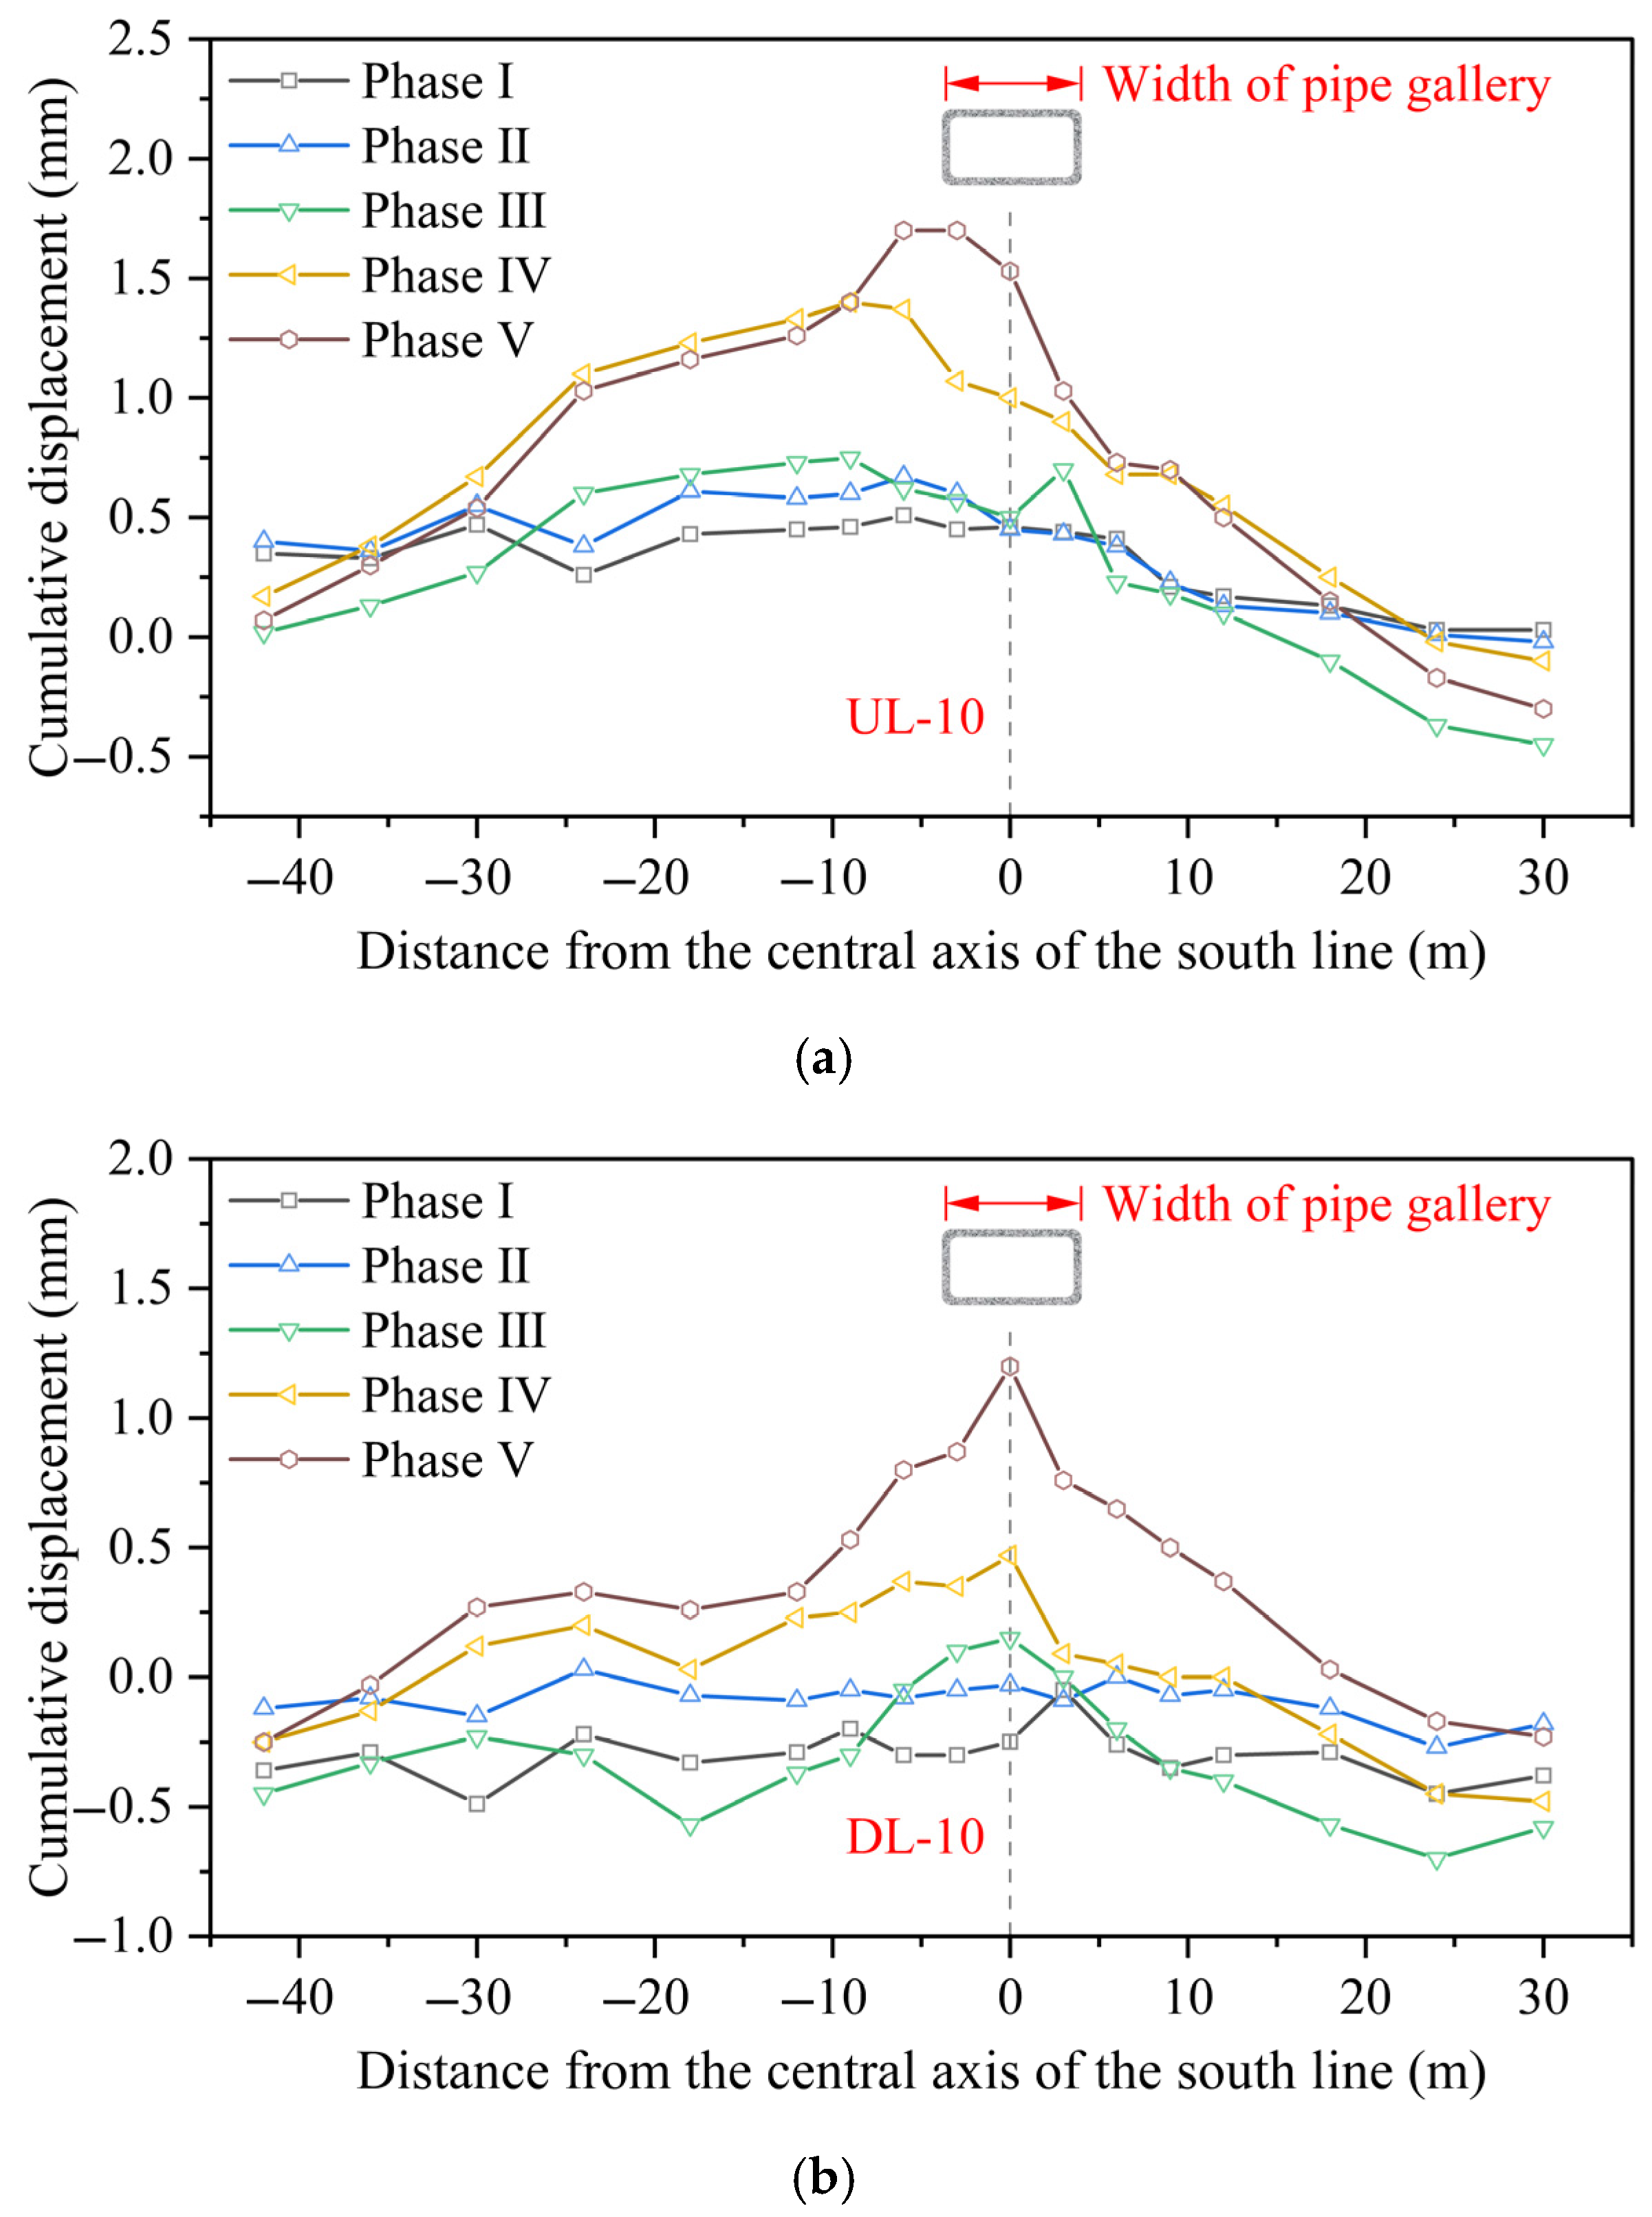
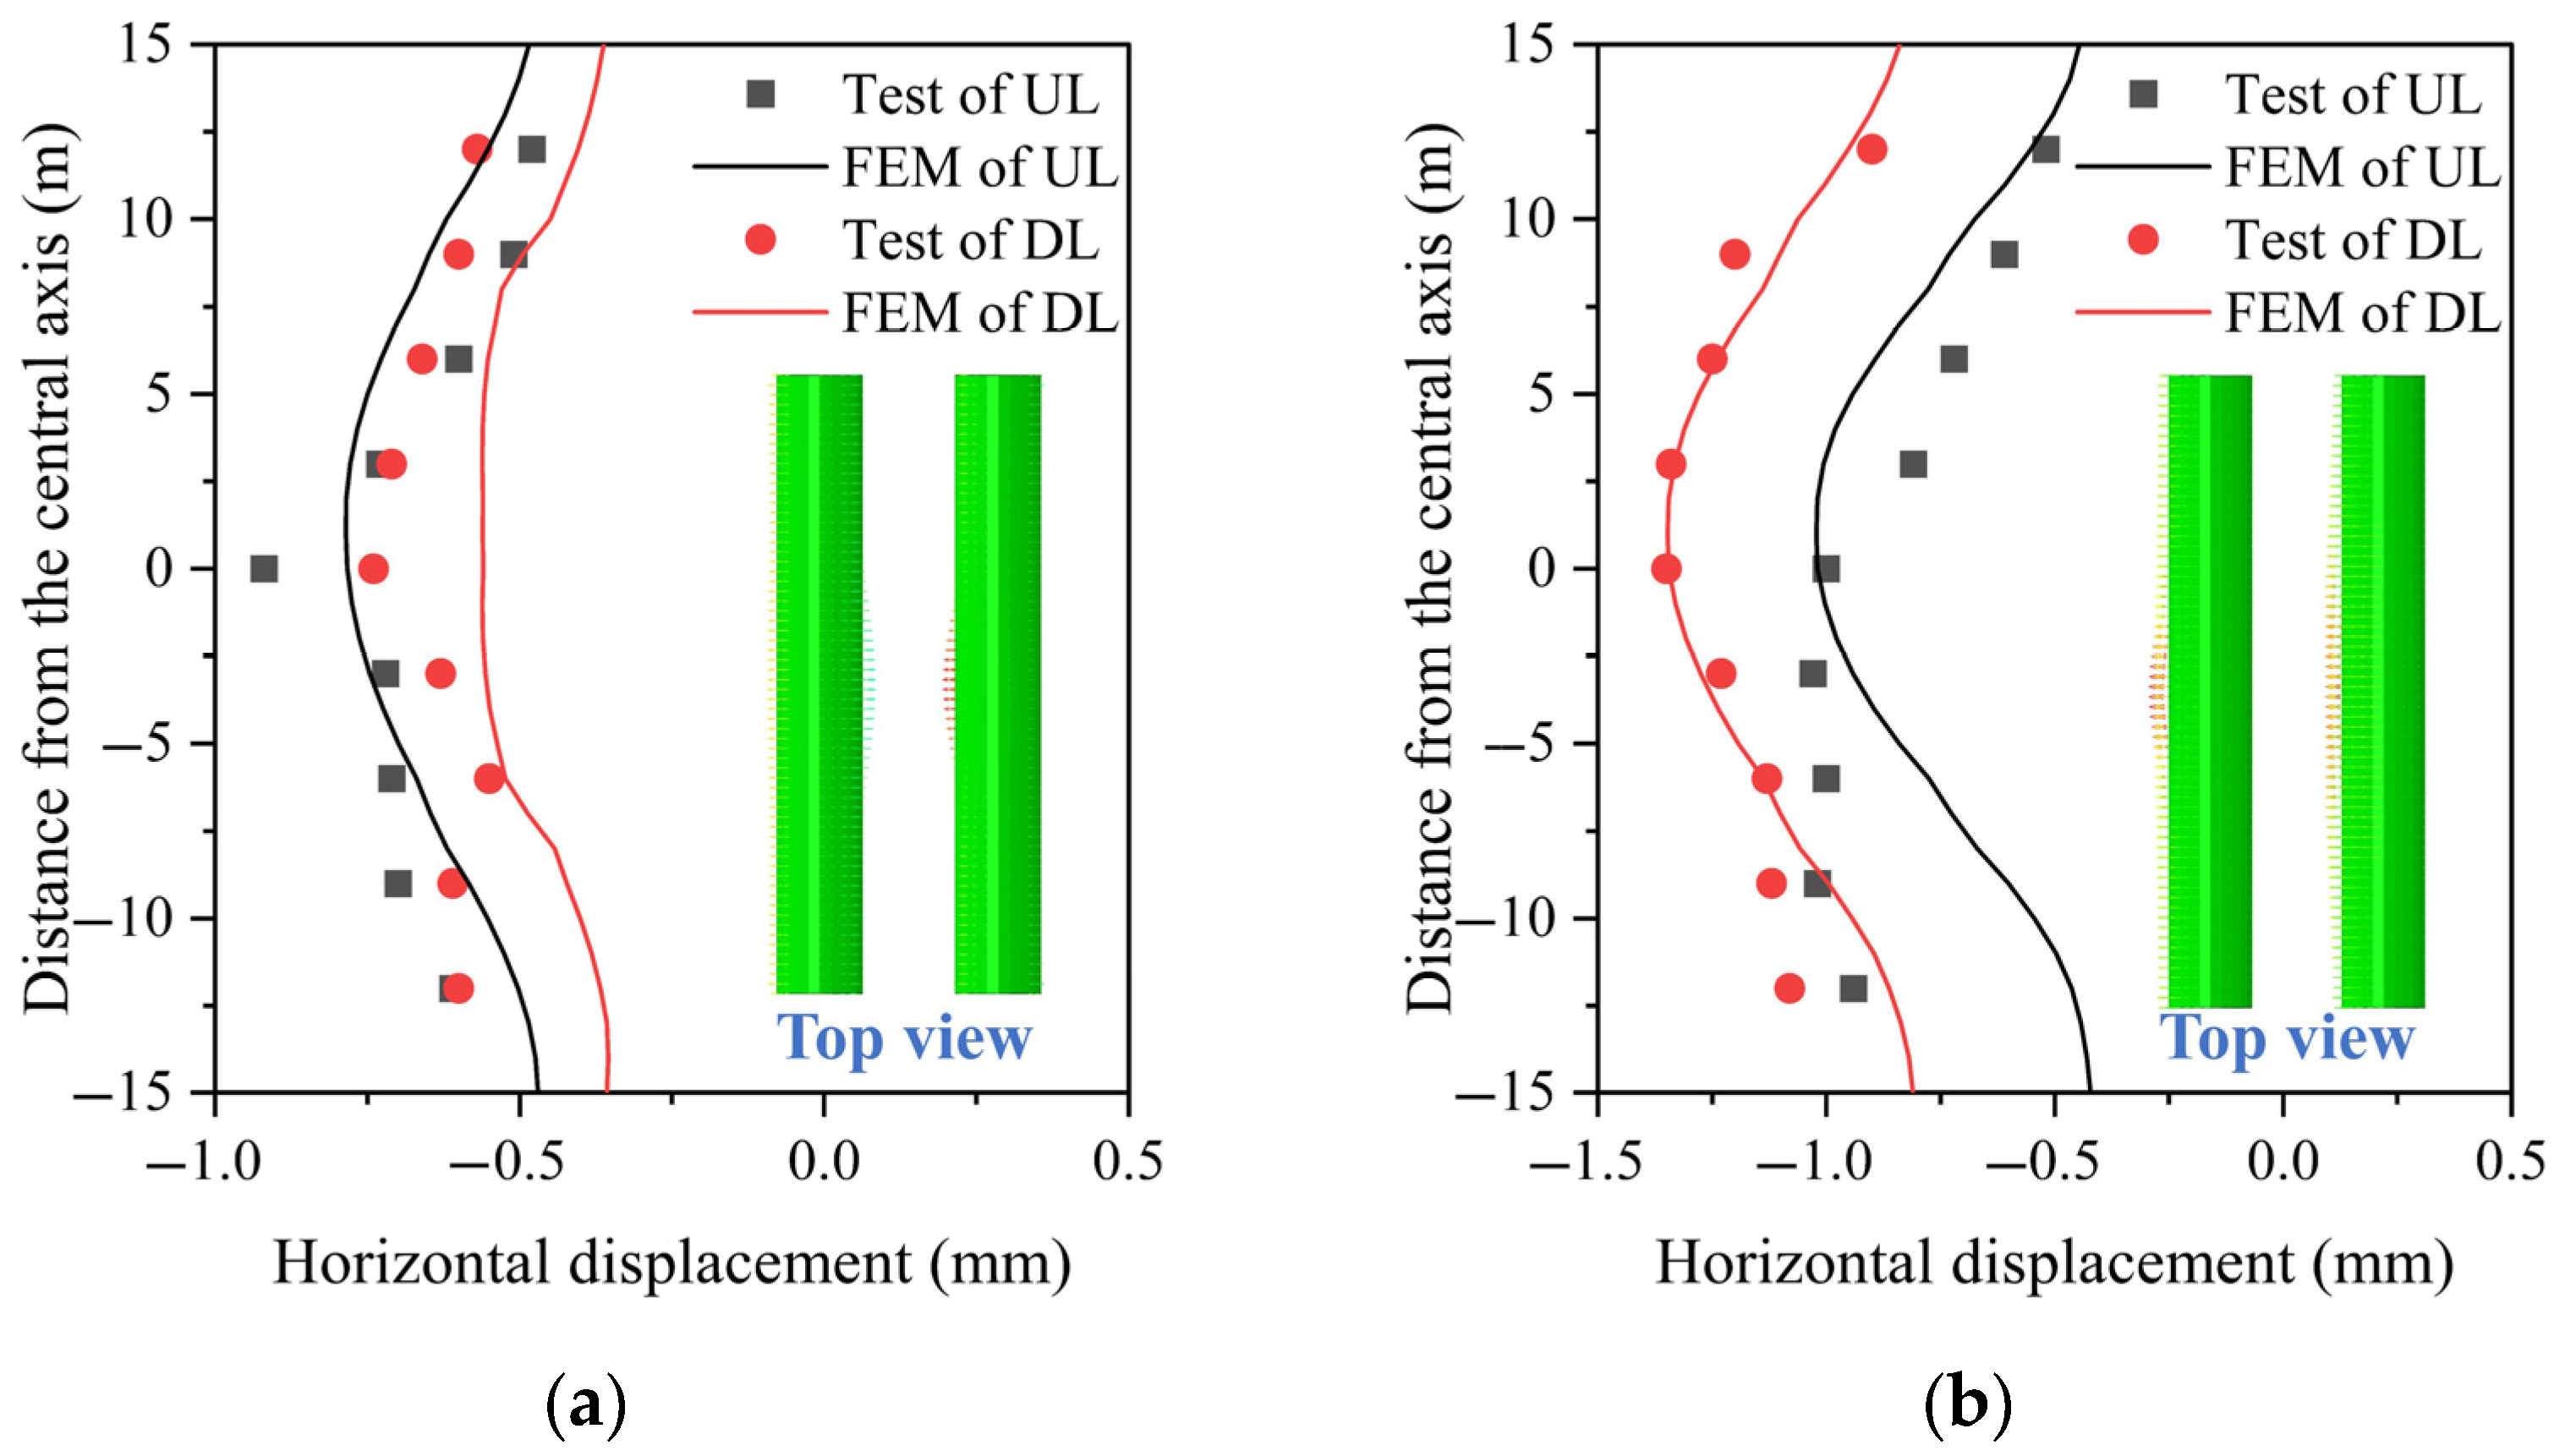
3.2. Horizontal Displacement of Metro Tunnel

As the horizontal displacements of the left and right hance are similar, only the distribution curve for the right hance of the double-line tunnel is presented in Figure 12, with positive values indicating displacement toward the launching shaft and negative values toward the receiving shaft. As shown in Figure 12, during Phases I and II, the surrounding soil moves to the space of the pipe jacking area formed by excavation, resulting in horizontal movement of the upline tunnel hance toward the launching shaft. At Phases III and IV, increased formation loss leads to more obvious horizontal deformation of the upline tunnel hance. For the downline tunnel hance, the horizontal displacement during Phases I and II is not obvious. As the pipe jacking process progresses through the downline tunnel during Phases III and IV and exits its affected zone, increasing stratum loss results in progressively greater horizontal deformation of the hance.
Upon completion of Phase V, the previously disturbed tunnel structure undergoes partial stress redistribution, leading to a rebound in the horizontal displacement of the tunnel hance. This rebound behavior may result from the combined influence of several contributing factors: (1) a relative positional offset exists between the pipe jacking excavation zone and the tunnel structure, resulting in asymmetric disturbance effects; (2) variations in frictional resistance around the pipe, along with dynamic adjustments in grouting parameters during jacking, which affects the stress state of tunnel structure [30]. Throughout the entire jacking process, the horizontal displacement of the tunnel hance remains within 1.5 mm, with the maximum deviation occurring beneath the pipe jacking axis.
Figure 13 presents the horizontal displacement curves of the left and right hance across 15 monitoring sections. Upon completion of pipe jacking along the entire alignment, a pronounced trend is observed in the horizontal movement of the tunnel hances of the upline and downline toward the receiving shaft, indicating a distinct transmission direction of the construction-induced disturbance. The maximum horizontal displacement of the right and left hances on the final upline tunnel reach 0.86 mm and 1.36 mm, respectively, while those on the downline tunnel reach 1.23 mm and 1.42 mm, respectively. The horizontal displacements at the four monitoring points located directly beneath the pipe jacking machine remain the largest and exhibit symmetrical distribution about the jacking axis.
Figure 14 illustrates the time-dependent response curve of horizontal displacement at the tunnel hances. It can be seen that the horizontal displacement process of the hance can be characterized by two distinct periods: the fast migration zone (Period 1), and the stable migration zone (Period 2), and the demarcation point roughly corresponds to the period when the pipe jacking machine crosses over the upline and downline. In Period 1, the pipe jacking machine enters the affected zone of excavation, prompting lateral soil movement toward the pipe jacking cavity. The tunnel subsequently shifted toward the launching shaft, accompanied by a sharp increase in horizontal displacement at the tunnel hance. In Period 2, after the pipe jacking machine fully exits the affected zone of the downline tunnel, horizontal displacements at the hance of both the upline and downline tunnels exhibit initial oscillations followed by a trend toward stabilization. Simultaneously, changes in the spatial position of the excavation area relative to the tunnel structure result in a change in the direction of disturbance propagation, and influenced by frictional resistance and grouting pressure, the tunnel exhibits a slight rebound tendency toward the receiving shaft.
Notably, the horizontal displacement of the hinge in certain sections of Figure 14 shows irregular, jagged fluctuations. Possible causes include limited monitoring accuracy and localized errors caused by external disturbances, such as construction activities and equipment vibrations. It may also be due to measuring points located near structural elements or stratum interfaces, where sudden changes in stiffness or geological discontinuities could create local anomalies. Throughout the process, the horizontal displacement at the right hance of the upline tunnel remains the smallest; however, a significant disparity exists between the left and right sides, possibly due to the proximity of the pipe jacking initiation point to the upline tunnel, leading to more intense ground disturbance on that side. In contrast, the horizontal displacements of the left and right hance on the downline tunnel are relatively similar, with the resulting structural deformation exhibiting greater symmetry, regularity, and consistency.

4. Numerical Simulation and Discussion

To comprehensively analyze the structural response of the tunnel and the influence of construction parameters, various working conditions were defined based on site-specific conditions, and numerical simulations were conducted using the ABAQUS finite element software. The simulation results were validated and calibrated against the measured data.

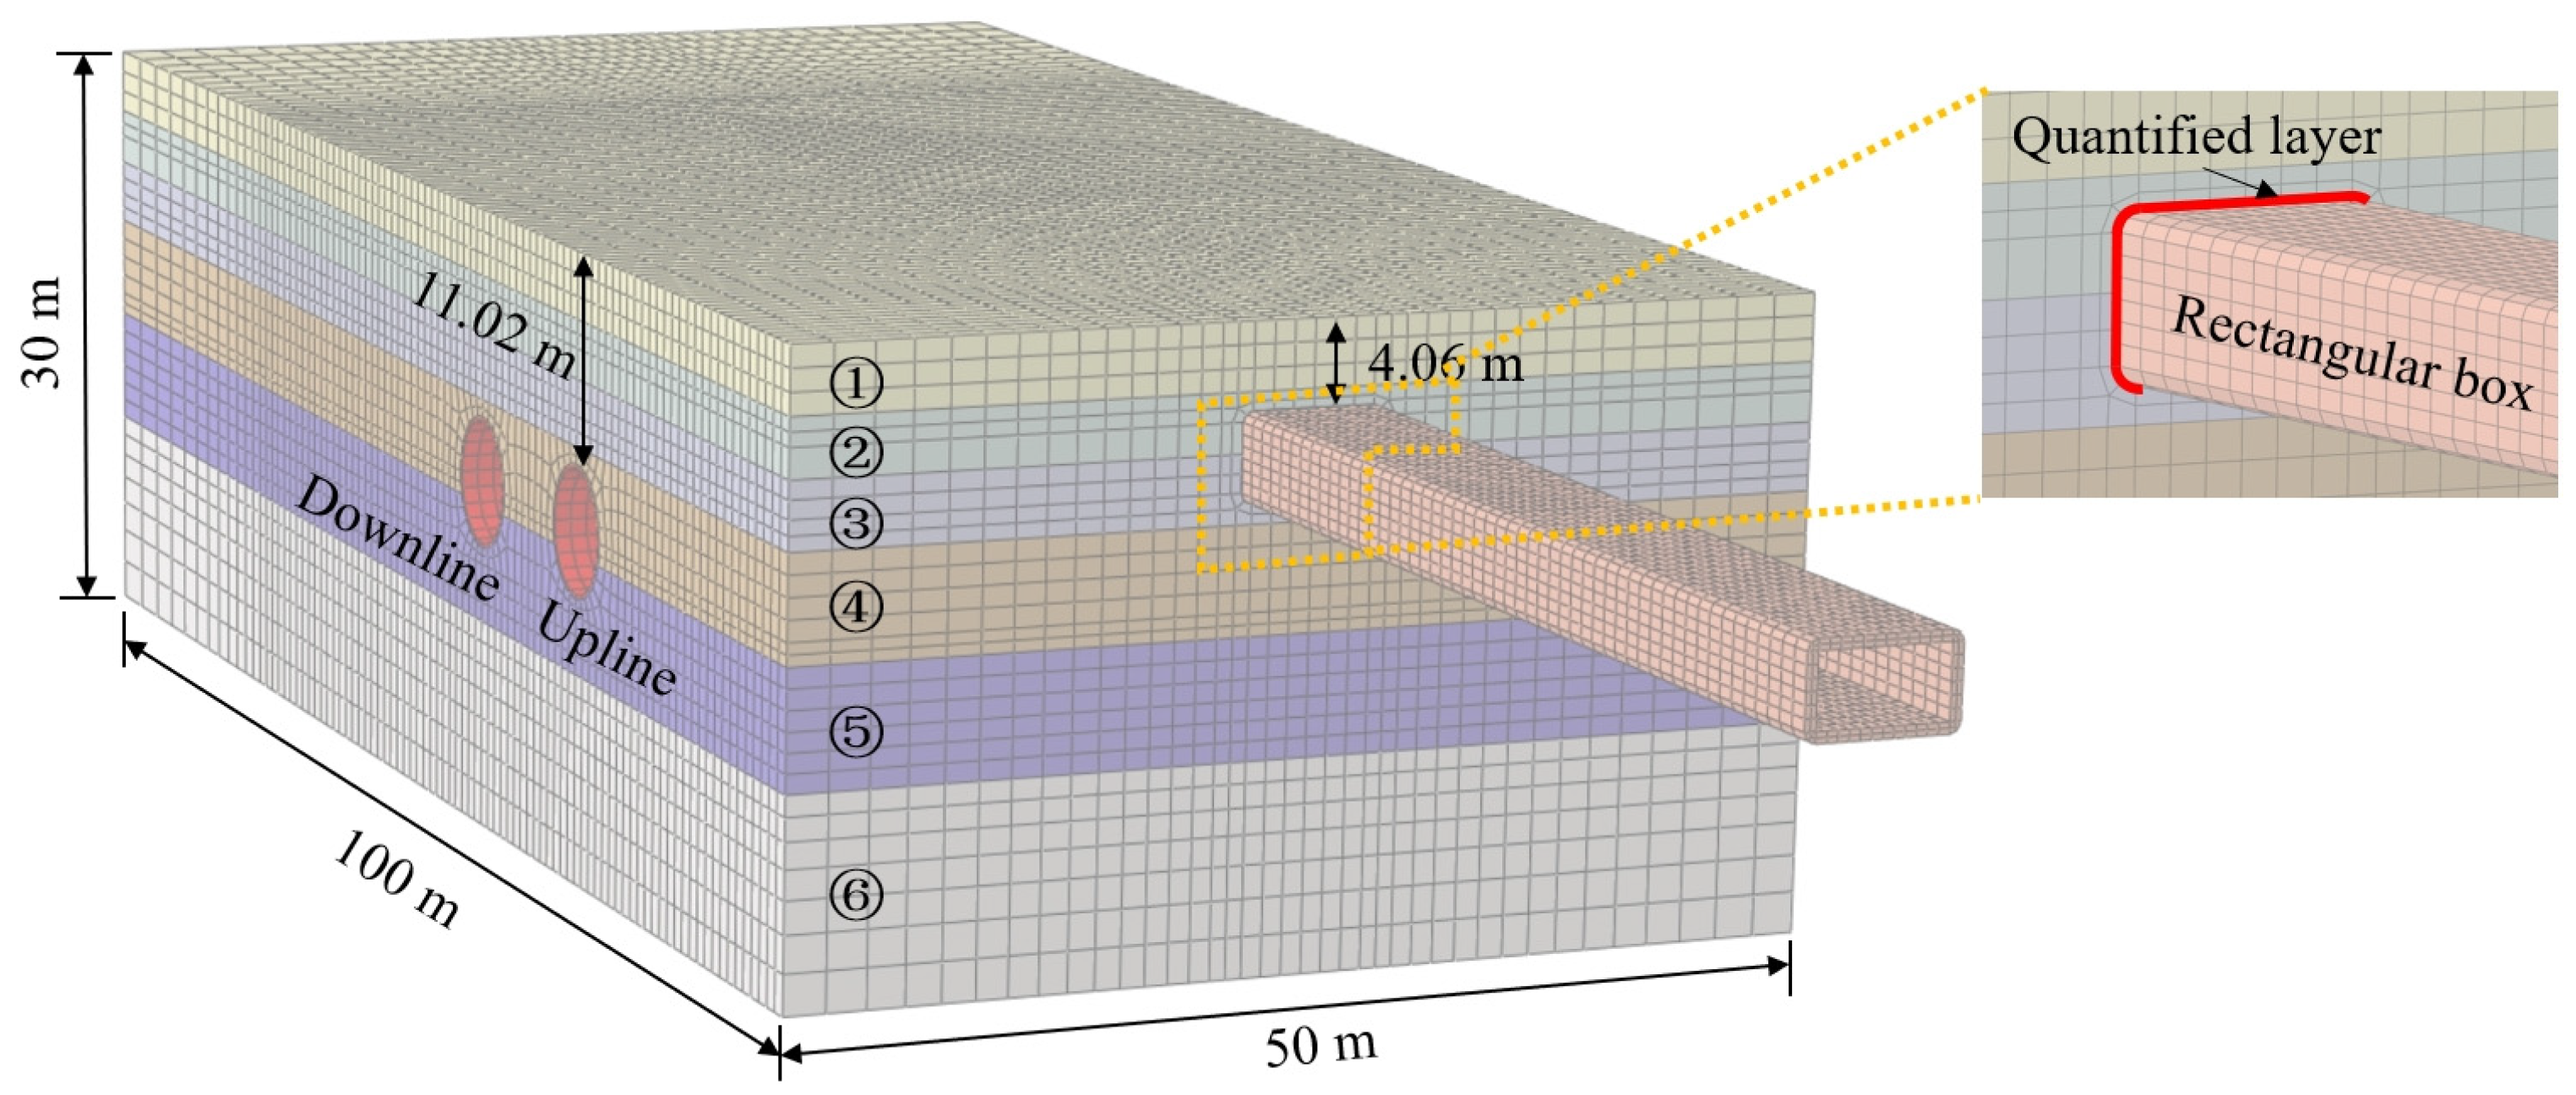
4.1. Finite Element Model

To investigate the effects of various construction parameters on rectangular box jacking overcrossing an existing double-line metro tunnel, a three-dimensional numerical model was developed using ABAQUS (2024 version). As illustrated in Figure 15, the model size was 100 m (length) × 50 m (width) × 30 m (height), with different soil parameters assigned to six stratum layers (see Table 1). In the simulation, the slurry in the overcut region was modeled as an equivalent layer, which was implemented using the tracing element method (Elcopy). The soil elements were duplicated and traced as equivalent layer elements via a modified INP file, with updated material properties, thereby avoiding the need to define complex soil–slurry contact interactions and substantially improving computational efficiency [31]. Owing to the lubricating effect of slurry, the tangential friction coefficient at the pipe–soil interface was set to 0.2, and a hard contact condition was applied in the normal direction. The tunnel–soil interface was defined using a ‘Tie’ constraint, excluding any consideration of sliding behavior. Additionally, the tunnel structure was modeled using the Concrete Damage Plasticity (CDP) constitutive model. To account for the initial stiffness reduction caused by circumferential bolts, the structural elastic modulus was reduced to 80% of the nominal concrete modulus, following the approach of Wang et al. [32]. Although the nonlinear contact behavior of the bolts is not explicitly modeled, the approach effectively captures the stiffness degradation at the structural scale and meets the accuracy requirements for large-scale response analysis. The structural material parameters are shown in Table 5.
The pipe jacking adopted the displacement control method to jack in turn, and each segment advanced sequentially by 1.5 m. The assumptions and simplifications adopted for the 48-segment jacking process are as follows: (1) the Drucker–Prager (D–P) model was employed to simulate the behavior of the soil layers. Compared with the widely used Mohr–Coulomb (M–C) model, the D–P model features a smooth conical yield face, making it more suitable for yield analysis of soils under general triaxial stress conditions. It has better stability and convergence in numerical calculation, especially in ABAQUS and other finite element platforms; (2) all components were modeled using eight-node linear brick elements with reduced integration (C3D8R), with the temporal effects during jacking neglected, and only the instantaneous settlement during construction considered; (3) the thrust exerted by the cutterhead was assumed to be fully balanced with the earth pressure ahead, with no overcut or under-excavation occurring. (4) The excavation process was modeled using the birth and death element method (Model Change), while displacement control was applied at the rear of the rectangular box pipe to simulate a straight-line advancement, as illustrated in Figure 16.

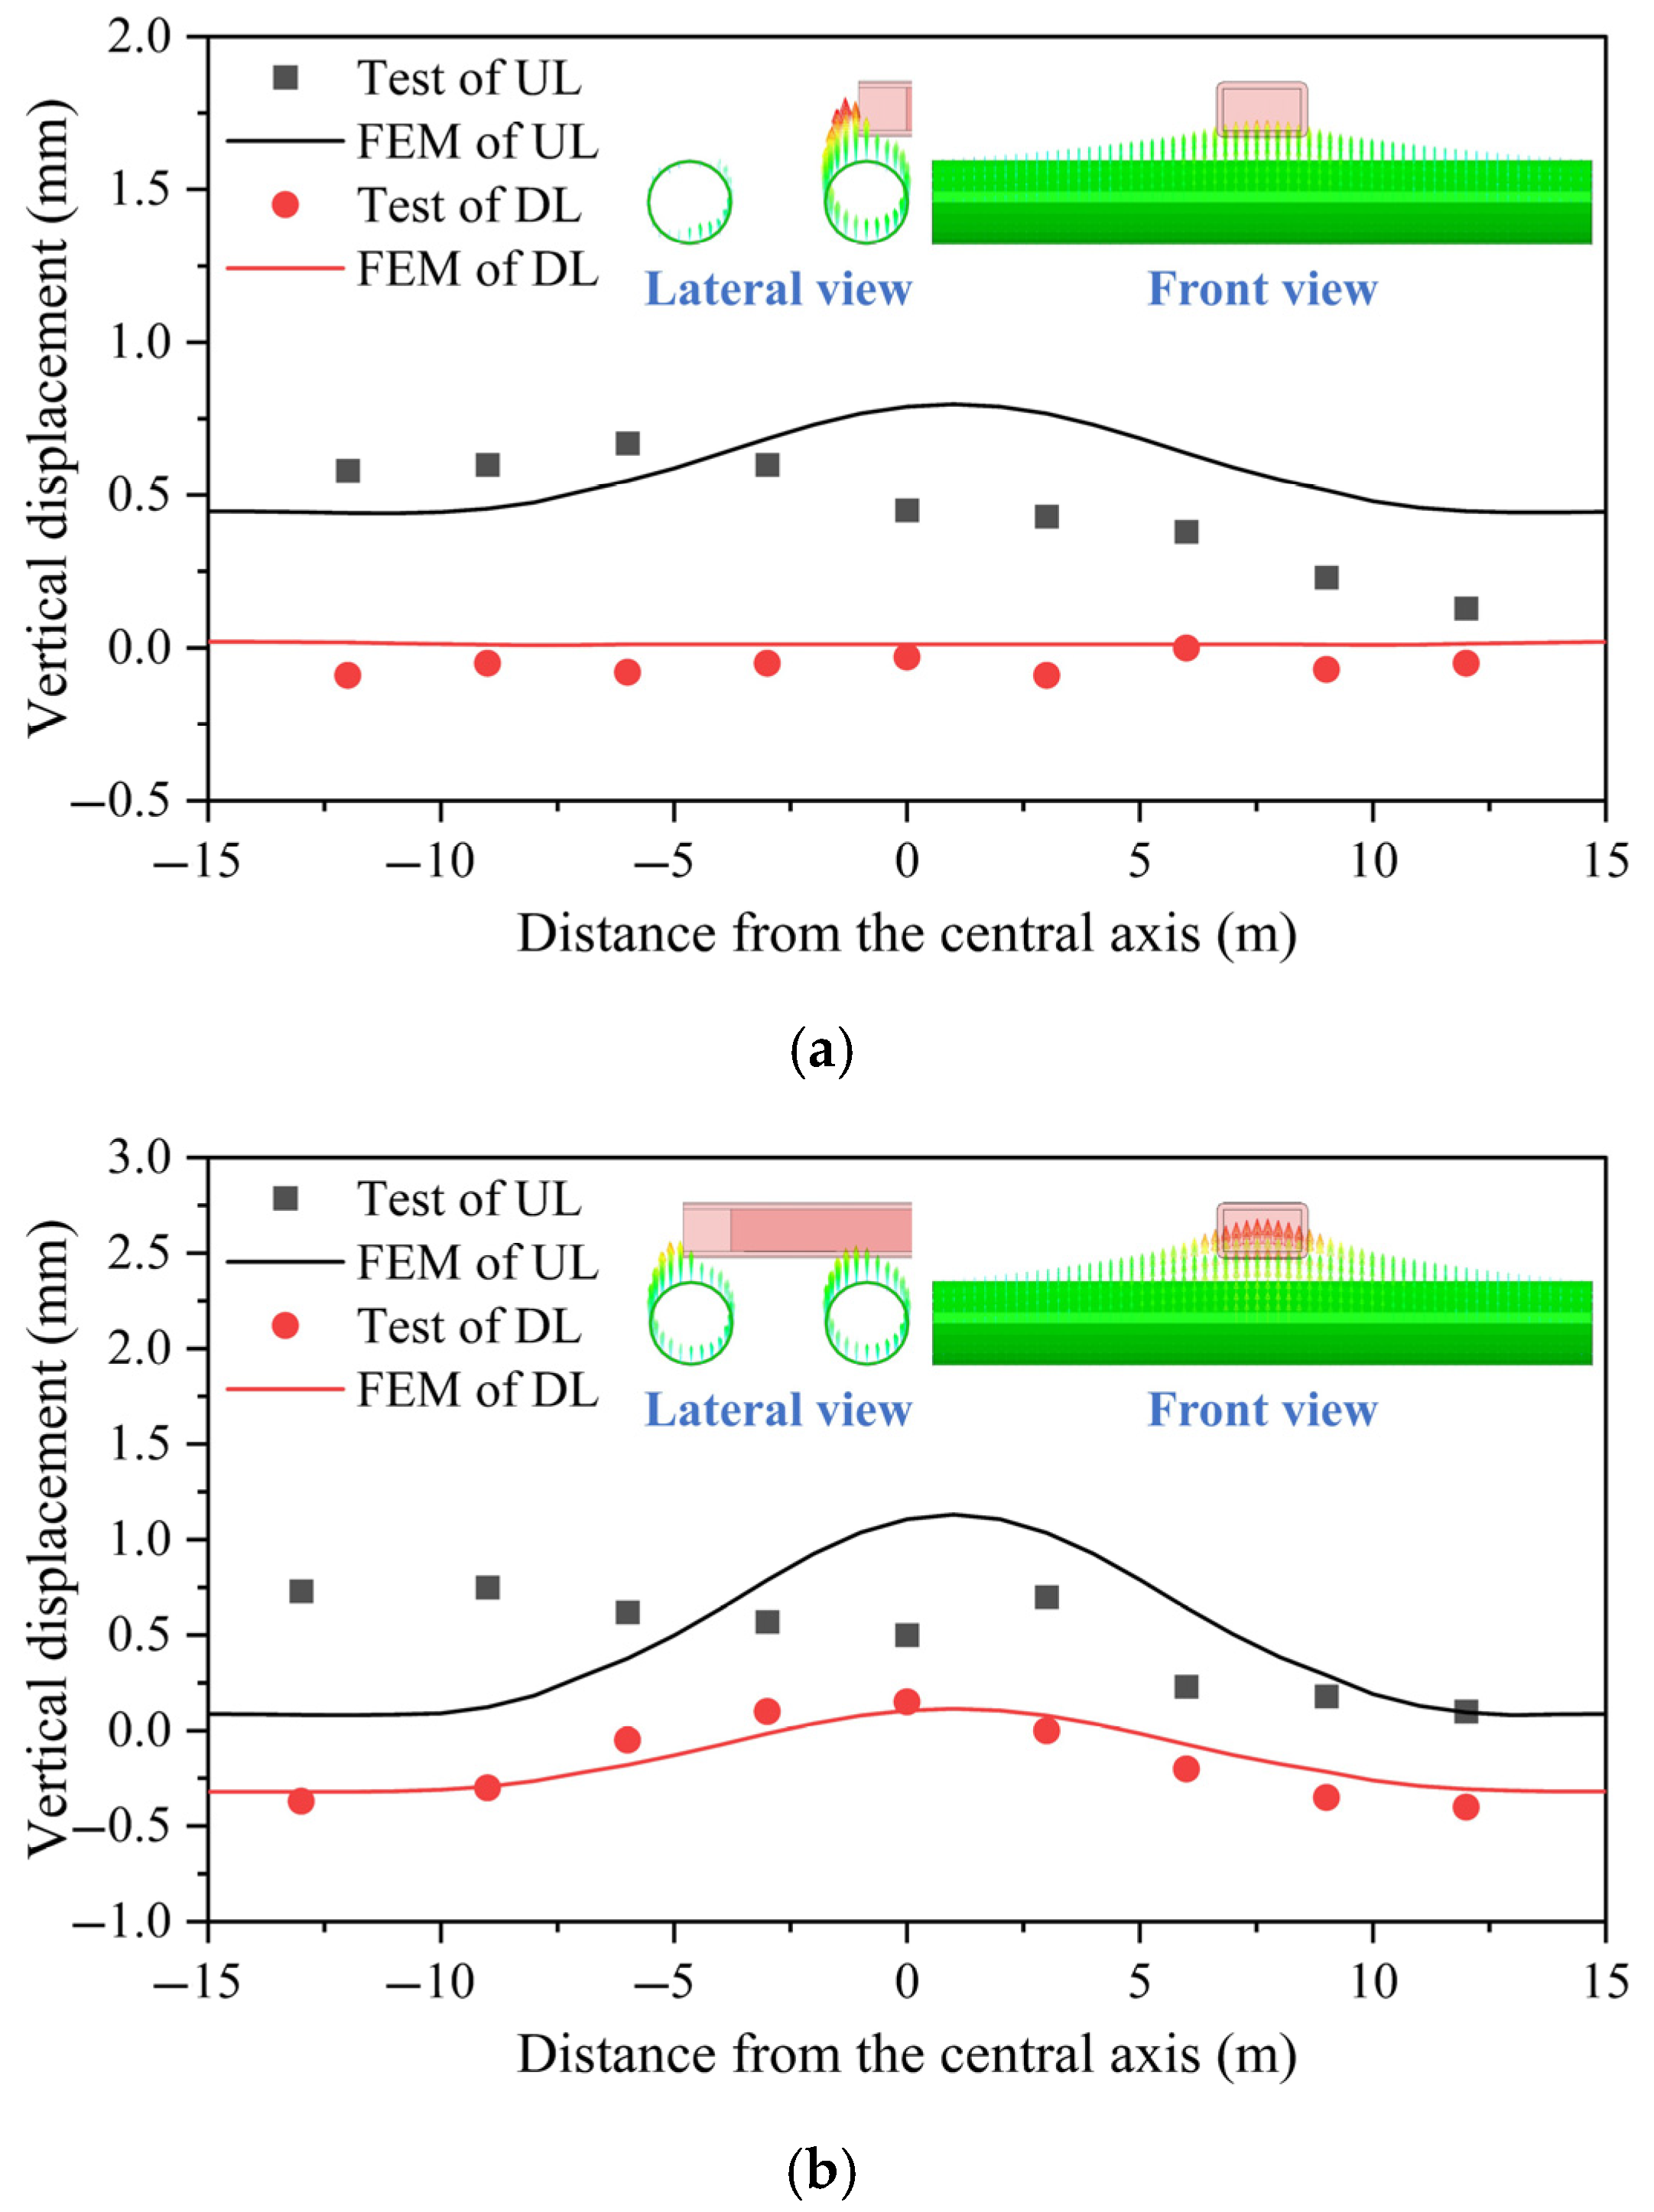
4.2. Model Validation

To validate the accuracy and applicability of the numerical model, simulations were conducted following the procedures above, and the simulated vertical displacement of the vault and horizontal displacement of the hance were compared with field measurements (see Figure 5 and Figure 12). To simplify the analysis, two representative construction disturbance phases were selected: Phase II (cutterhead positioned directly above the upline tunnel) and Phase III (cutterhead positioned directly above the downline tunnel), representing the tunnel structural response during different stages—before, during, and after the pipe jacking process. The corresponding results are presented in Figure 17 and Figure 18.
As shown in Figure 17 and Figure 18, the simulation results for the downline tunnel exhibit higher agreement with the measured data, possibly due to reduced external disturbance and a more controllable construction process during the crossing of the downline tunnel. Furthermore, the fitting accuracy for vertical displacement is slightly lower than that for horizontal displacement, particularly within 0–5 m beneath the pipe jacking axis. This is likely due to the strong influence of transient and asymmetric construction disturbances in this region, which may result in localized pre-settlement or compaction within the disturbed strata. The model adopts an idealized staged loading approach, which does not fully capture the localized heterogeneity of construction-induced disturbances. In addition, the number of monitoring points in this region is relatively limited, making the fitting accuracy more susceptible to monitoring errors.
In summary, the numerical simulation results exhibit strong agreement with the measured data in terms of trend direction, displacement extrema, and inflection point locations, indicating that the proposed model possesses high predictive accuracy and a strong capability for simulating structural responses. Although some fluctuations are observed in the measured data, the overall error remains within the acceptable range for engineering applications.

4.3. Influence of Construction Parameters

As discussed in Section 3.1., when a large-section jacked rectangular box crosses an existing metro tunnel with a small clear distance, the tunnel is prone to experiencing uneven floating deformation. If the floating deformation exceeds the design control threshold, it may lead to structural defects such as segment cracking or misalignment, thereby posing a potential threat to the safety of metro operations [19]. Therefore, a systematic analysis of the key influencing factors during the construction process is urgently required.
Considering the relative spatial relationship between the tunnel and the jacking pipe, as well as the main influencing factors during construction, this study selects three primary variables—pipe–tunnel clear distance, pipe–slurry friction coefficient, and grouting pressure—to analyze and compare their effects on the vertical displacement of the tunnel vault under various combined working conditions. The pipe–tunnel clear distance is typically determined in the design stage and should account for the distribution of underground utilities, geological conditions, and construction feasibility. In contrast, the pipe–slurry friction coefficient and slurry pressure are directly related to construction practices and serve as critical parameters governing pipe–soil interaction and mechanical response. Accordingly, these three factors are emphasized in the simulation to provide insights for optimizing construction procedures and controlling associated risks.
Table 6 summarizes the parameter settings of various working conditions, among which the configuration with d = 4.1 m, μ = 0.2, and p = 80 kPa most closely matches the actual field conditions.

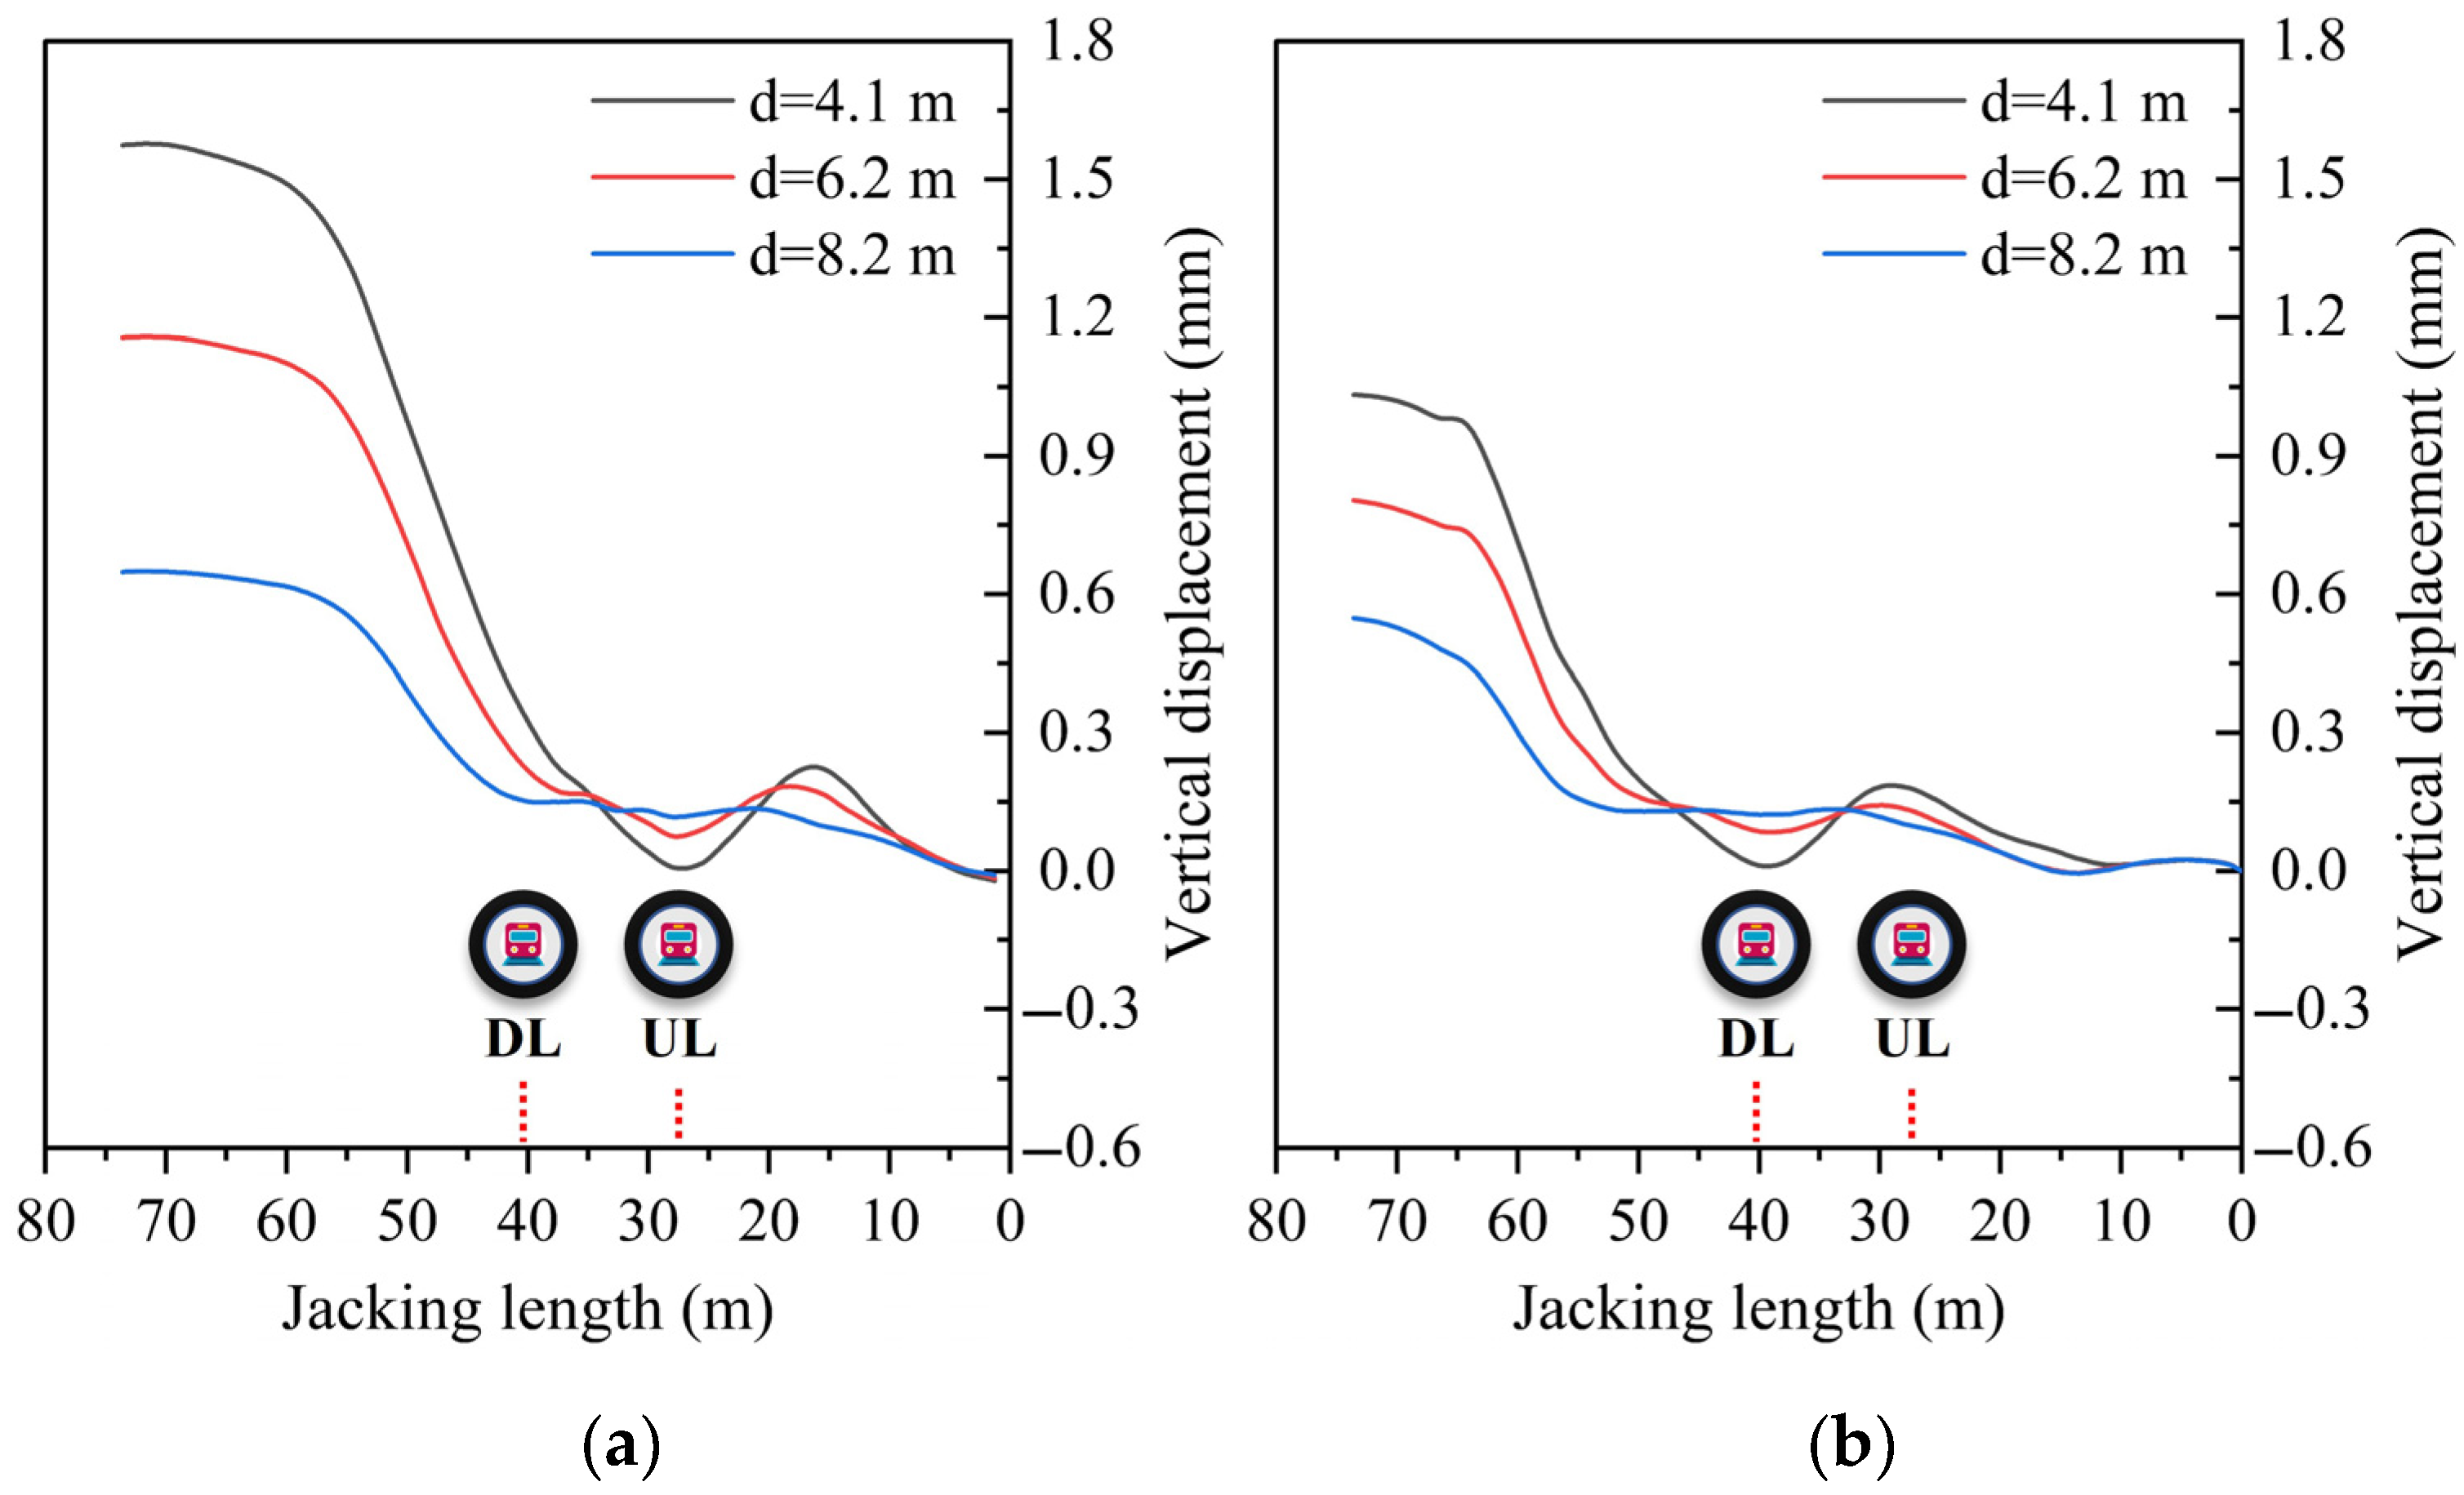
4.3.1. Pipe–Tunnel Clear Distance

Figure 19 illustrates the vertical displacement curve of the double-line tunnel vault with the jacking length under different pipe–tunnel clear distances. Overall, the simulation results align well with the field measurements, and the vault’s vertical displacement exhibits a characteristic deformation pattern of ‘initial uplift-subsequent settlement-secondary uplift-stabilization’. Before the pipe jacking machine enters the affected zone of the existing tunnel, the vertical displacement of the tunnel vault changes little; as the machine gradually enters the affected zone, the tunnel vault begins to experience disturbance and exhibits a slight uplift. As the pipe jacking machine continues to jack, its self-weight becomes increasingly influential, leading to moderate settlement of the tunnel vault, and when the excavation face is directly above the tunnel, the settlement reaches its maximum. Subsequently, due to the combined effects of soil unloading and vault rebound, the tunnel experiences rapid uplift followed by gradual stabilization in the later stages.
The impact of pipe jacking construction on the vault of the upline tunnel is significantly greater than that on the downline tunnel. The simulation results are in good agreement with the monitoring data, indicating that the difference may be closely related to the temporal and spatial superposition effect during jacking. Further analysis reveals that as the pipe–tunnel clear distance increases, the vertical deformation curve of the vault becomes more gradual, and the impact of construction disturbance gradually attenuates.
Upon completion of pipe jacking, the maximum vault displacement of the upline tunnel is reduced by approximately 26.54% and 58.87%, respectively, compared to the conditions with smaller clear distances, while the corresponding displacement in the downline tunnel is reduced by approximately 22.18% and 51.95%, respectively. These results show that the reasonable determination of the clear distance between the pipe–tunnel is of great significance to effectively control the floating deformation of the existing tunnel.

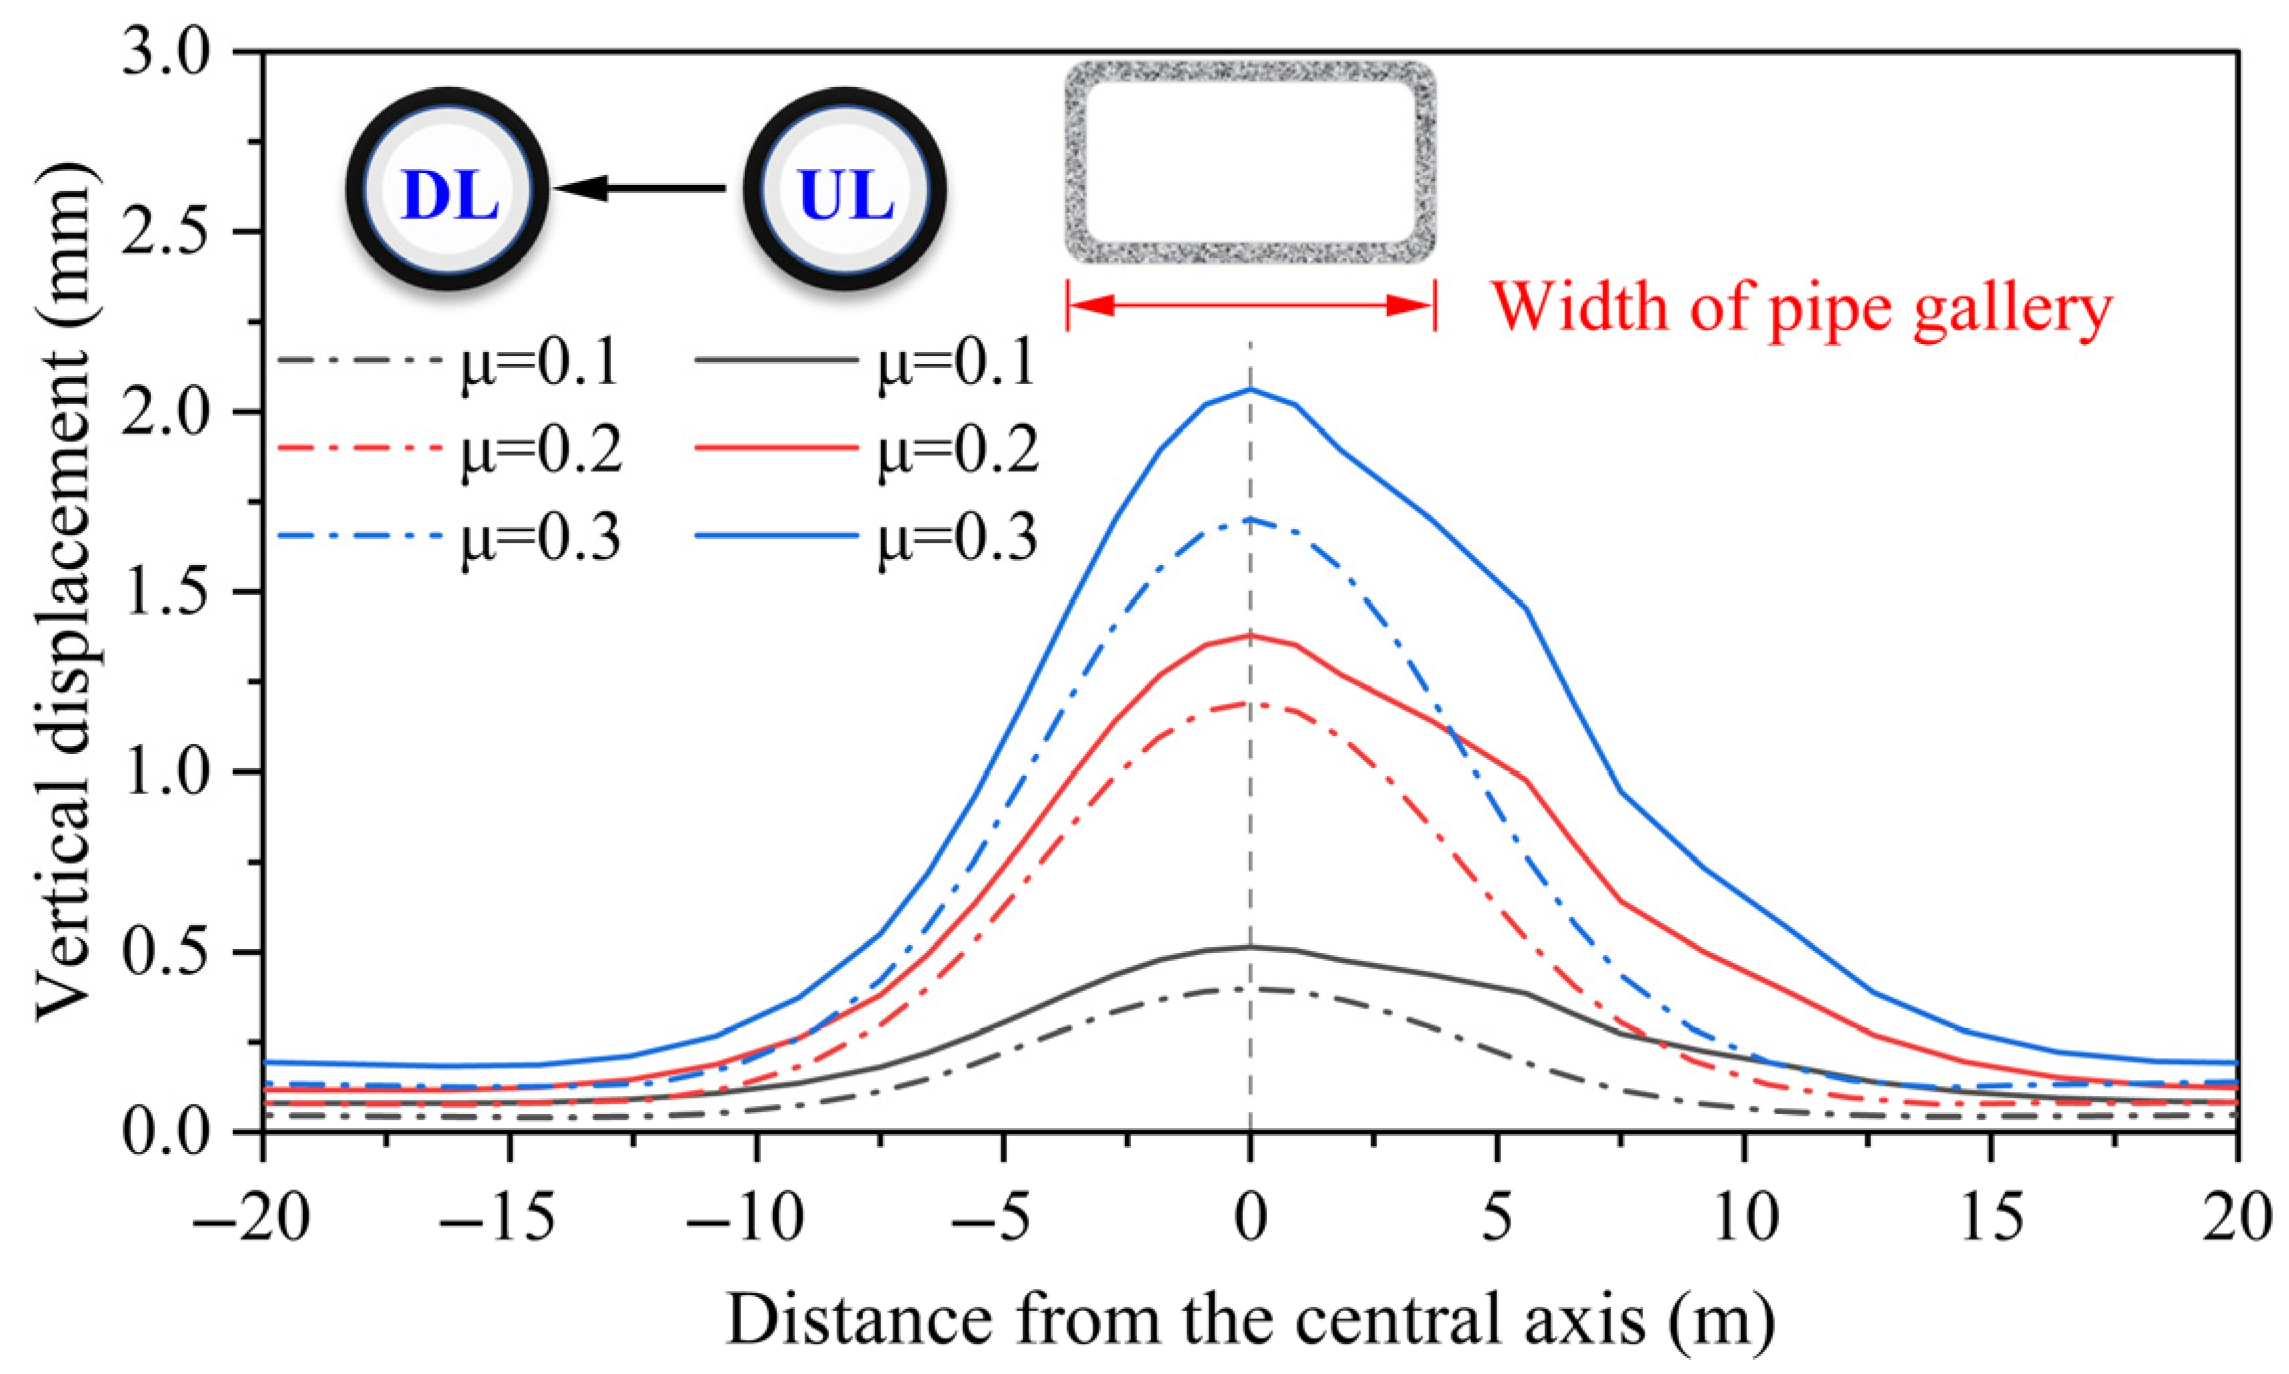
4.3.2. Pipe–Slurry Friction Coefficient

When the overcrossing jacked box crosses the metro tunnel under conditions of small clear distance, frictional resistance around the jacked box is further transmitted to the tunnel structure via stress transfer within the surrounding soil. This induces additional loading on the overlying soil, subsequently causing varying degrees of deformation in the tunnel structure. In particular, the carrying-soil phenomenon easily occurs during large-section rectangular box jacking construction [23], while good slurry properties and appropriate grouting pressure improve the slurry sleeve at the pipe–soil interface [33], thereby reducing the asymmetric deformation of metro tunnels.
Figure 20 illustrates the vertical displacement profiles of the double-line tunnel vault under different friction coefficients. With the increase in the pipe–soil friction coefficient, the maximum uplift displacement of the vault shows a significant increasing trend, with the peak displacement typically occurring directly beneath the pipe jacking axis. In addition, the friction coefficient also affects the vertical displacement difference of the double-line tunnel vault. When the friction coefficient is 0.1, 0.2, and 0.3, the corresponding displacement differences are 0.12 mm, 0.19 mm, and 0.36 mm, respectively, exhibiting a nonlinear increasing trend. These findings confirm that a lower pipe–soil friction coefficient can effectively mitigate the adverse effects of construction-induced disturbance on the existing tunnel structure, especially in the double-line tunnel system, which can effectively slow down the asymmetric deformation trend of the tunnels.

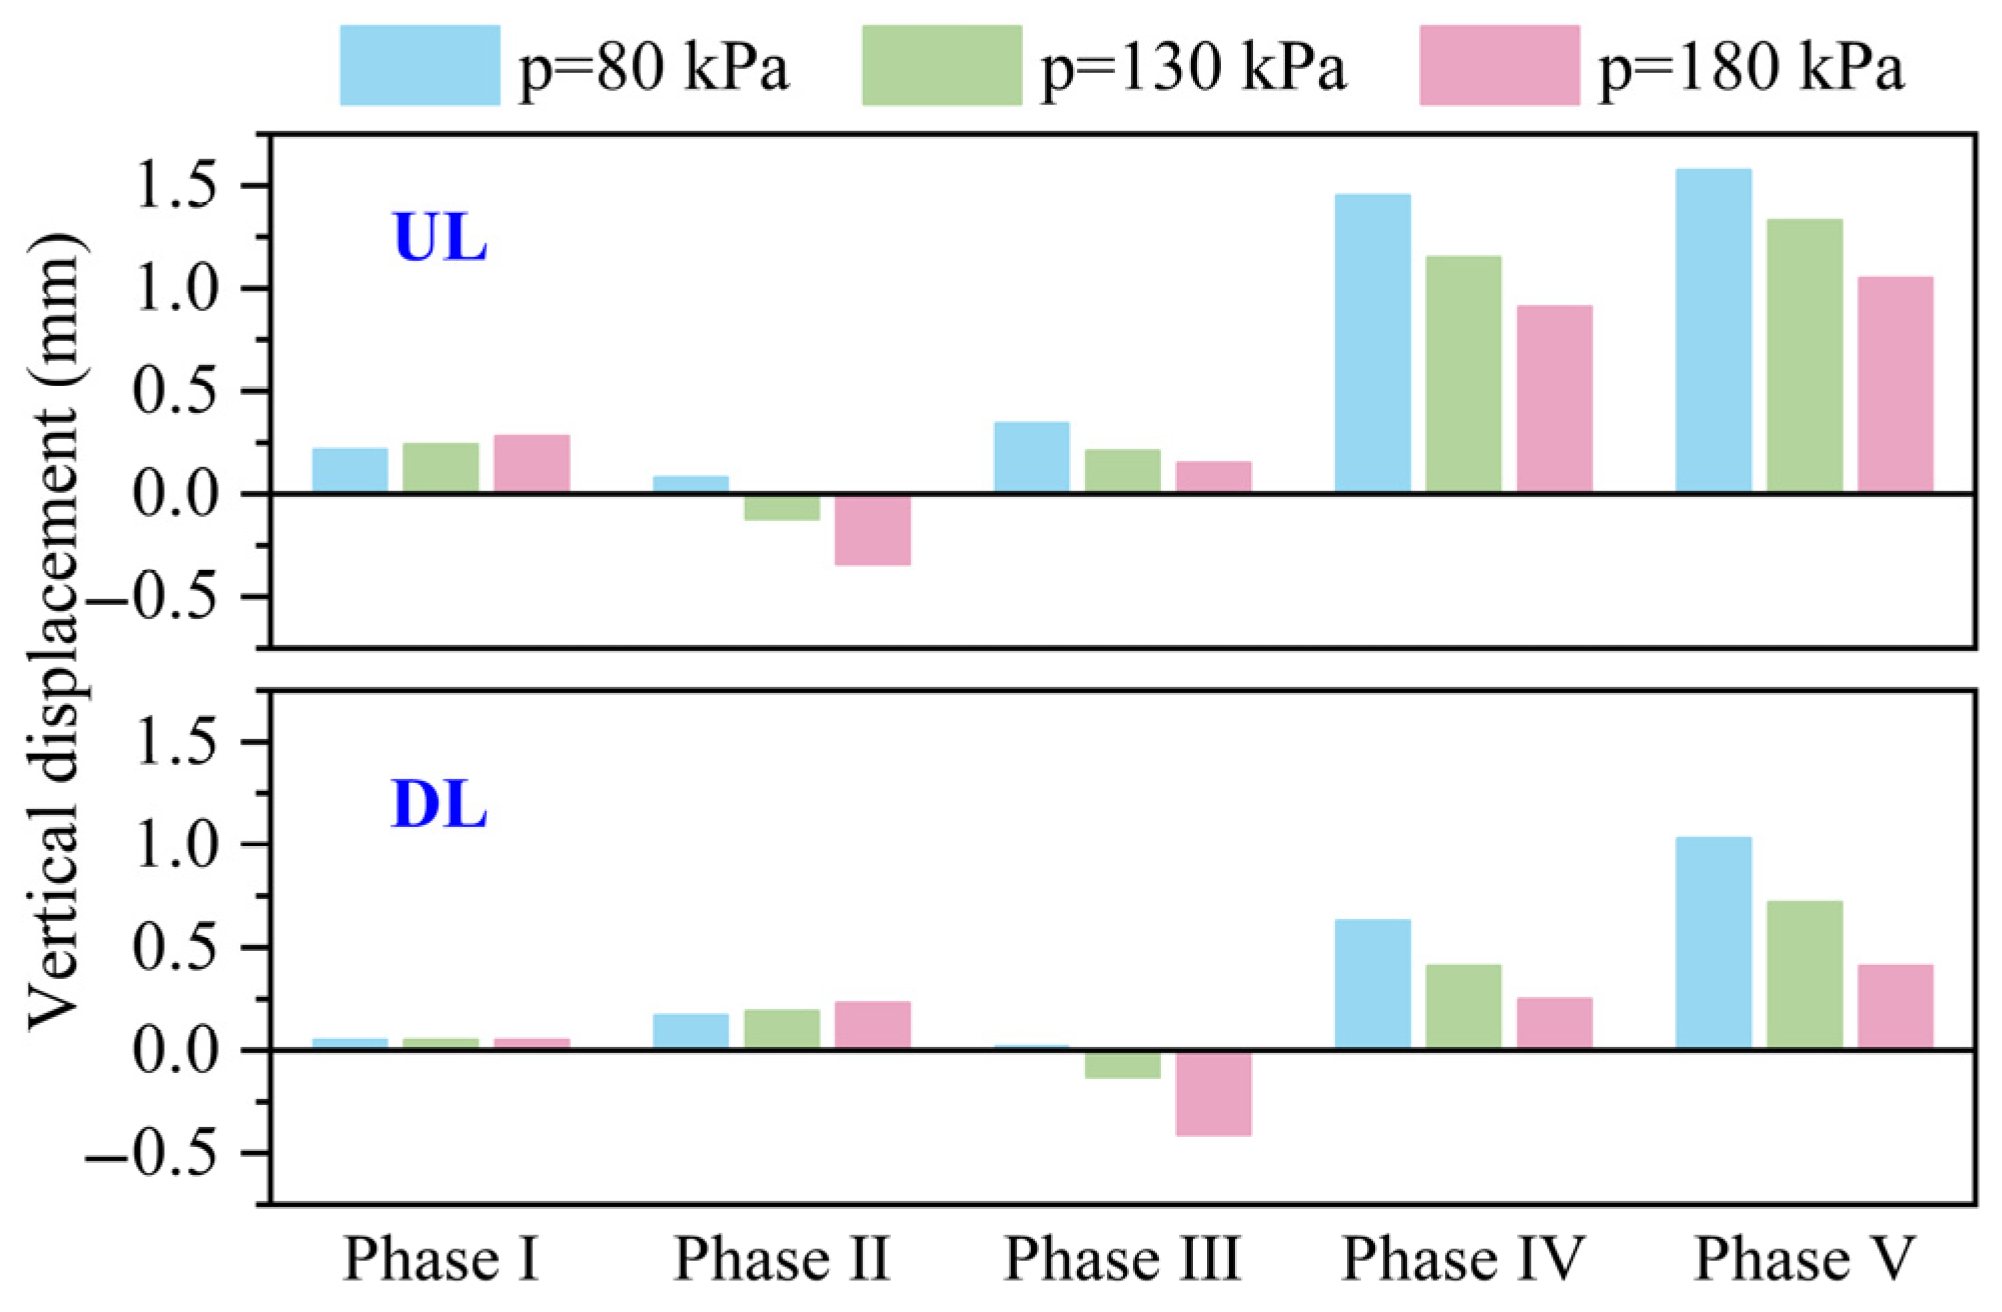
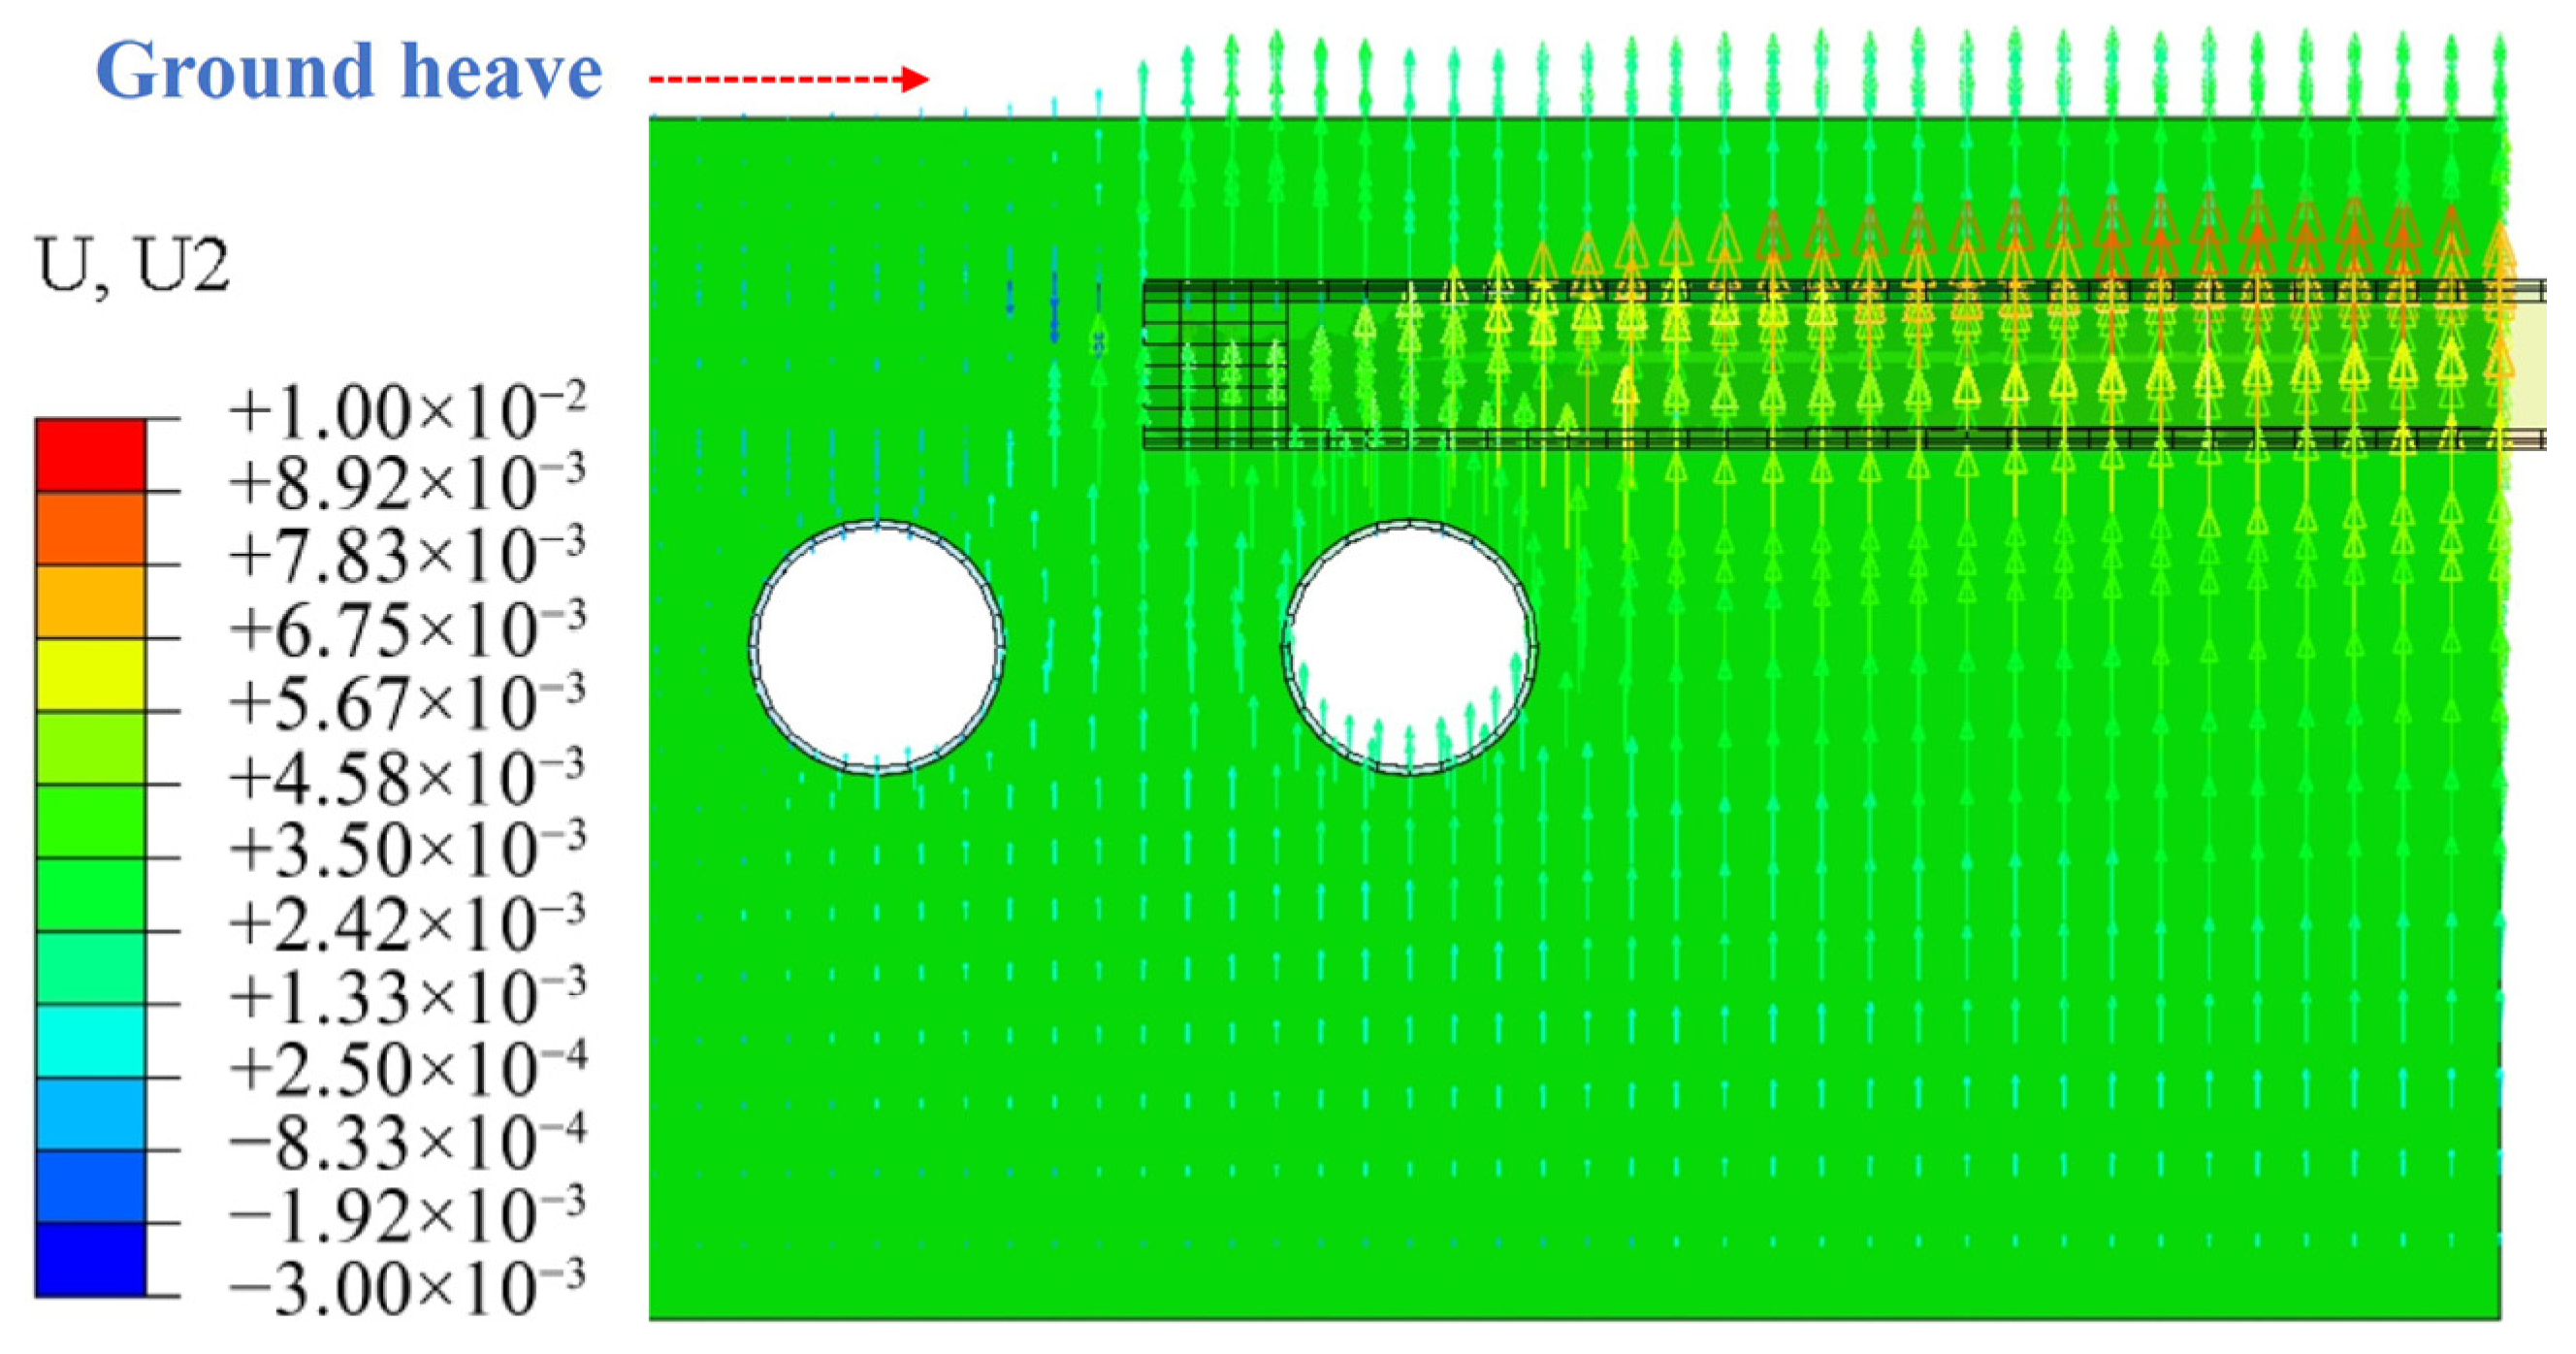
4.3.3. Grouting Pressure

When the clear distance is small, the soil thickness between the pipe jacking and the existing tunnel decreases, increasing the likelihood that high-pressure slurry during grouting will diffuse laterally and exert additional pressure on the existing structure [34]. Therefore, the magnitude of grouting pressure significantly influences the differential deformation of the metro tunnel structure and may even contribute to overall structural instability.
Figure 21 presents the vertical displacement of the double-line tunnel vault in each phase under different grouting pressures. In general, as the grouting pressure increases, the maximum uplift of the double-line tunnel vault exhibits a decreasing trend; however, slight subsidence is observed in both Phase II and Phase III, suggesting that soil disturbance, compaction, or local stress concentration during the early phase of jacking near the tunnel may induce temporary settlement of the vault. As pipe jacking overcrossing and grouting compensation, the deformation trend turns to uplift. Moreover, under a grouting pressure of 80 kPa, the vault displacement difference between the upline and downline tunnels reaches its maximum during Phase V. It indicates that structural response non-uniformity is most pronounced under low grouting pressure, and that an appropriate increase in grouting pressure (130–180 kPa) helps mitigate the uplift of the tunnel vault.
However, in shallow-buried rectangular box jacking, excessive grouting pressure may cause the slurry to migrate upward along paths of least resistance, leading to disturbances in the overlying strata structure. Figure 22 illustrates the contours of ground heave corresponding to a grouting pressure of 80 kPa. As the grouting pressure increases, the slurry’s ability to overcome soil resistance is enhanced, resulting in an expanded diffusion range within the soil. Especially in soft soil, silty clay, and other high plasticity strata, it may cause more pronounced ground heave issues. Therefore, it is neither economically viable nor structurally safe to rely solely on increasing grouting pressure to control tunnel deformation while neglecting the need to limit ground heave.

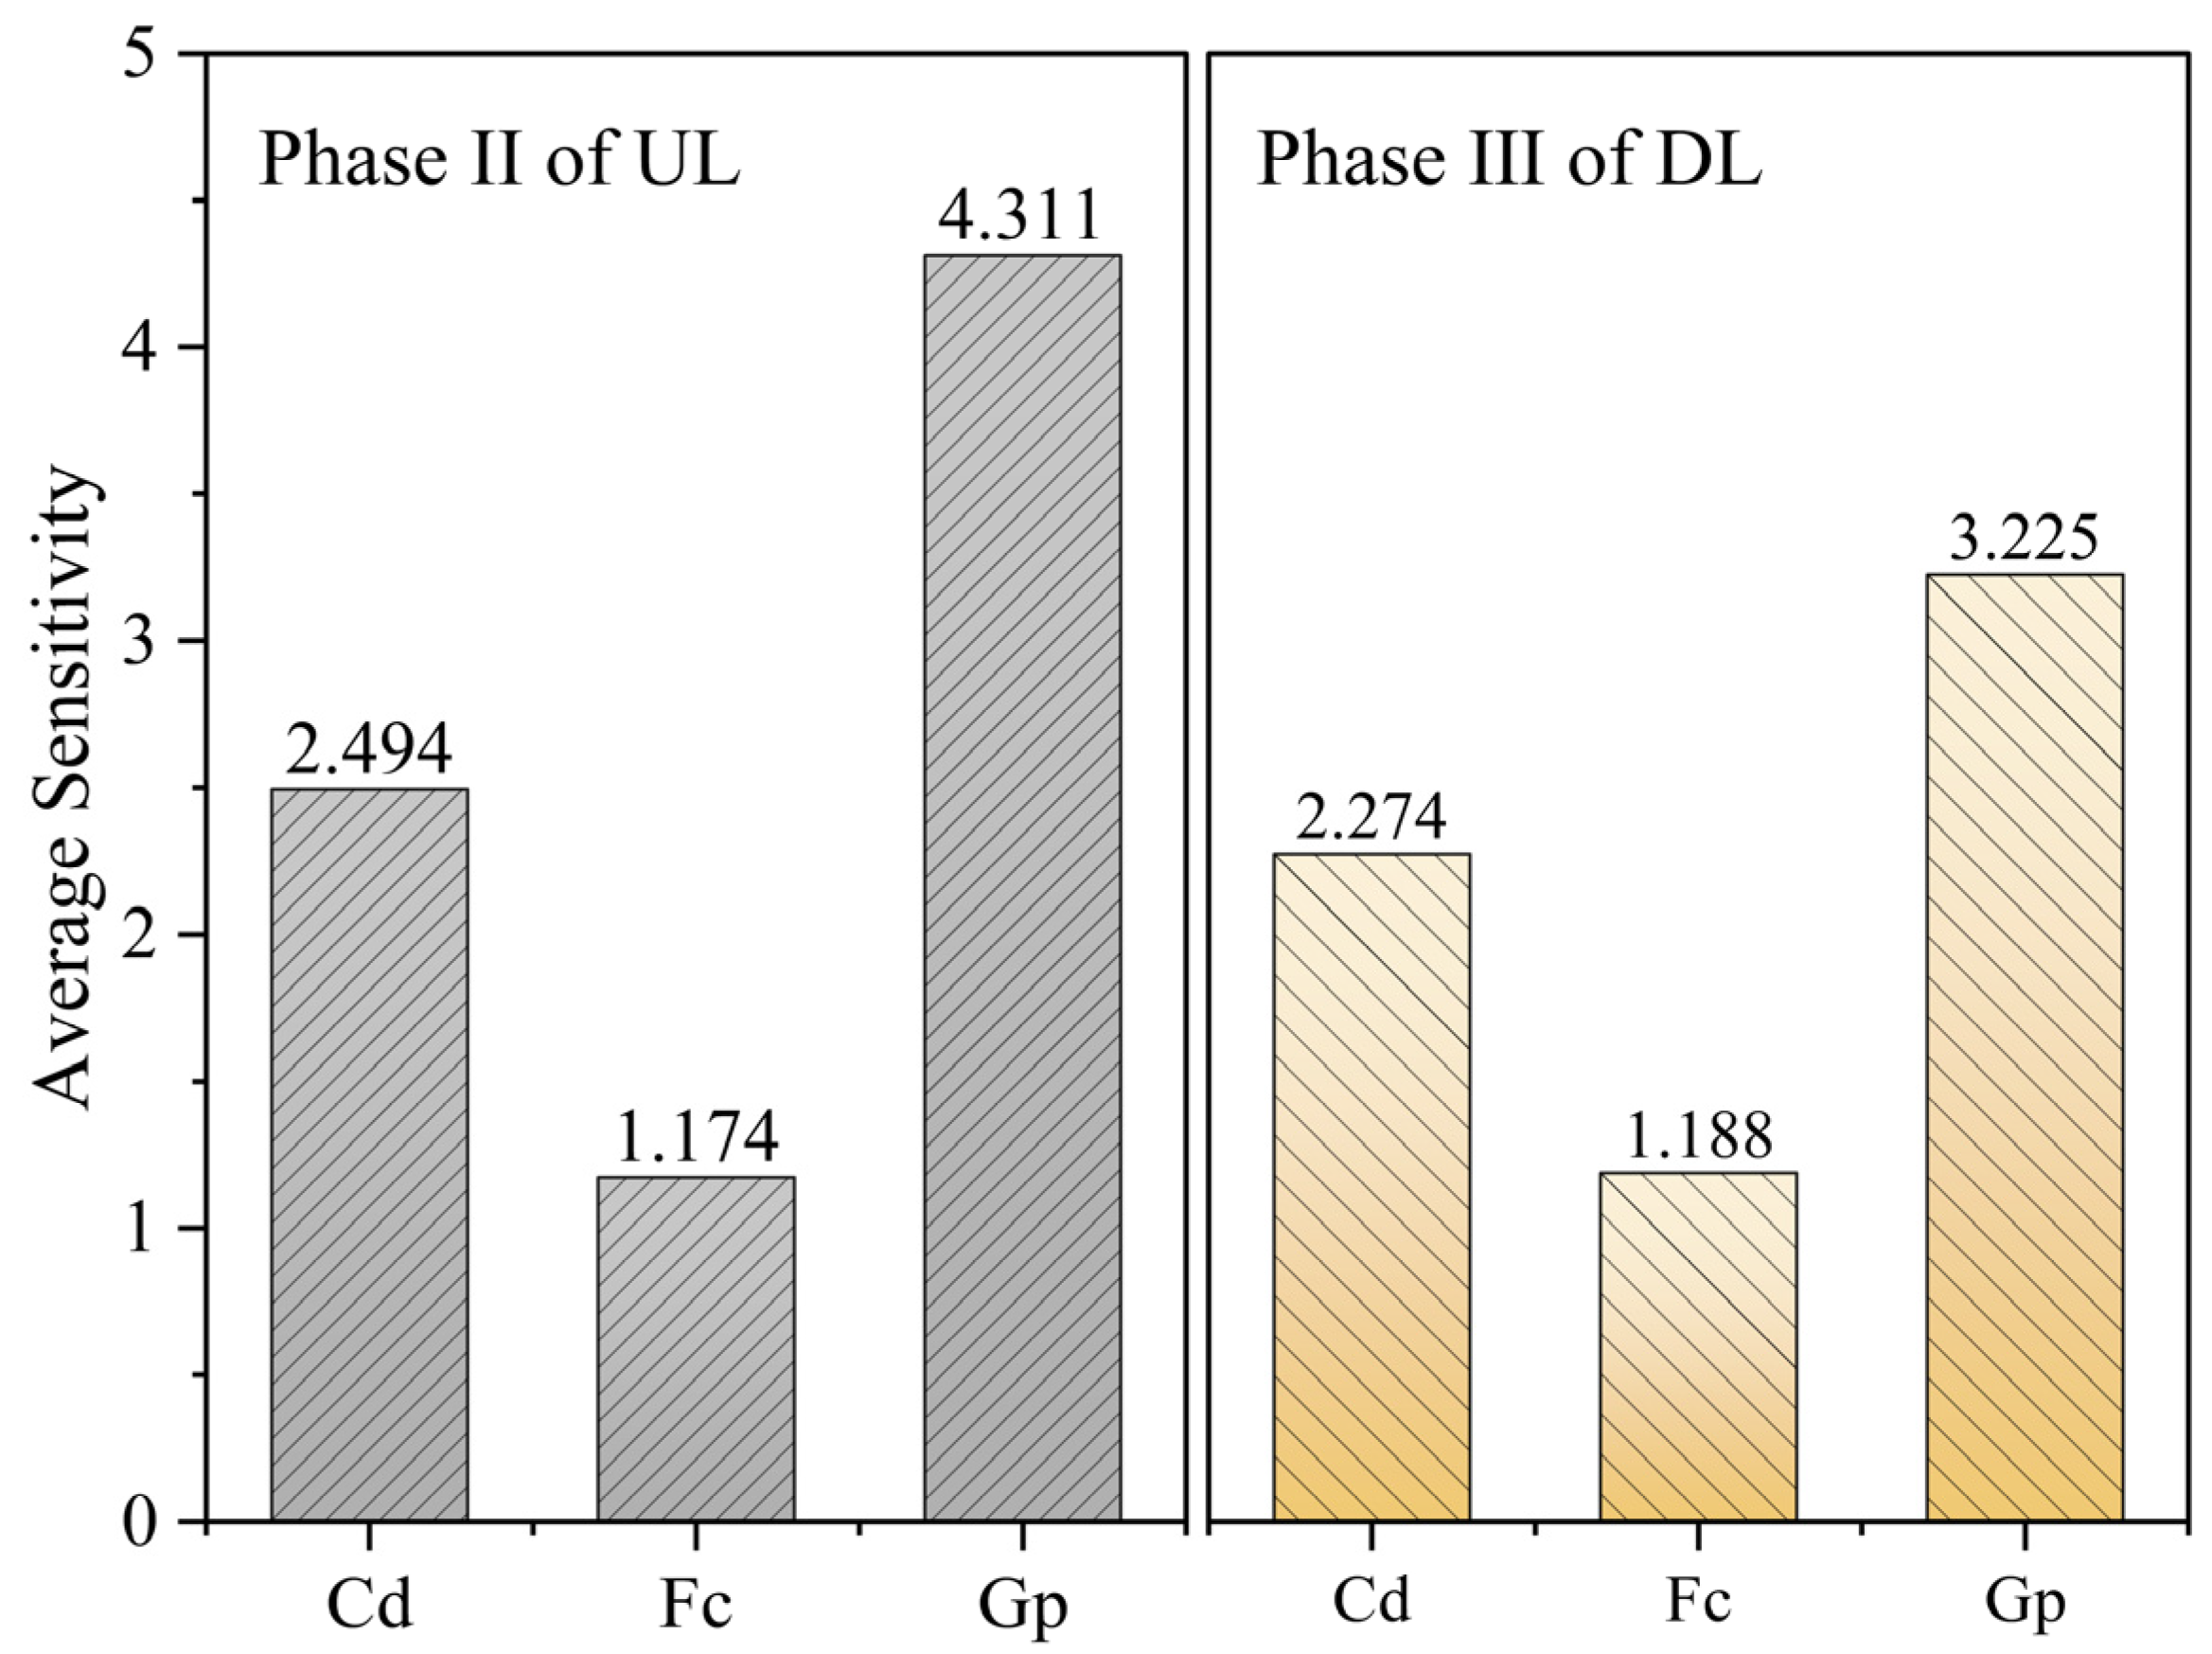
4.3.4. Parameter Sensitivity Analysis

To eliminate the influence of differing parameter dimensions on the sensitivity analysis, this study introduces the normalized relative change rate as an evaluation metric to assess the sensitivity of three key construction parameters: pipe–tunnel clear distance (Cd), pipe–slurry friction coefficient (Fc), and grouting pressure (Gp). The corresponding calculation index, S, is then calculated using Equation (1):
S = Δ R / R ¯ Δ P / P ¯
where Δ R denotes the variation in displacement, R ¯ represents the average displacement, Δ P denotes the variation in the parameter, and P ¯ represents the average value of the parameter.
Given the multiple relative spatial configurations involved when the rectangular box jacking crosses the double-line tunnel, this study focuses on a representative working condition. Specifically, it selects the stage when the jacking machine is positioned directly above the double-line tunnel to analyze the degree of influence of each parameter on vault displacement during the critical construction stage. The average sensitivity index of the three selected construction parameters is then computed, and the corresponding results are presented in Figure 23.
In terms of overall trends, the sensitivity ranking at both stages follows the order Gp > Cd > Fc, indicating that under the current working conditions, grouting pressure (Gp) exerts the most significant influence on the vault’s structural response. This is because the slurry pressure is transmitted to the tunnel structure through the surrounding soil. If not properly controlled, even small pressure fluctuations may trigger pronounced structural responses, such as uplift or settlement. The clear distance (Cd) exhibits high sensitivity to vault displacement when the spacing is small. As the spacing increases, the interference effect diminishes, and the sensitivity declines accordingly, revealing a nonlinear relationship. In contrast, the sensitivity of the pipe–slurry friction coefficient (Fc) is generally low, suggesting a limited direct impact on vault displacement. However, in formations with high friction or abundant viscous particles, abrupt changes in frictional resistance may still disrupt jacking forces and compromise structural stability. Therefore, in practical construction, the slurry ratio and pipe surface treatment should be appropriately designed based on geological conditions to mitigate potential risks.

5. Conclusions

Based on a shallow-buried, large-section rectangular box jacking project overcrossing an existing metro tunnel with a small clear distance, this study integrates field monitoring data and finite element simulation to systematically analyze the deformation response of the double-line tunnel structure under various jacking phases, and it further discusses the influence law of key construction parameters on its deformation. The main conclusions are as follows:
(1)
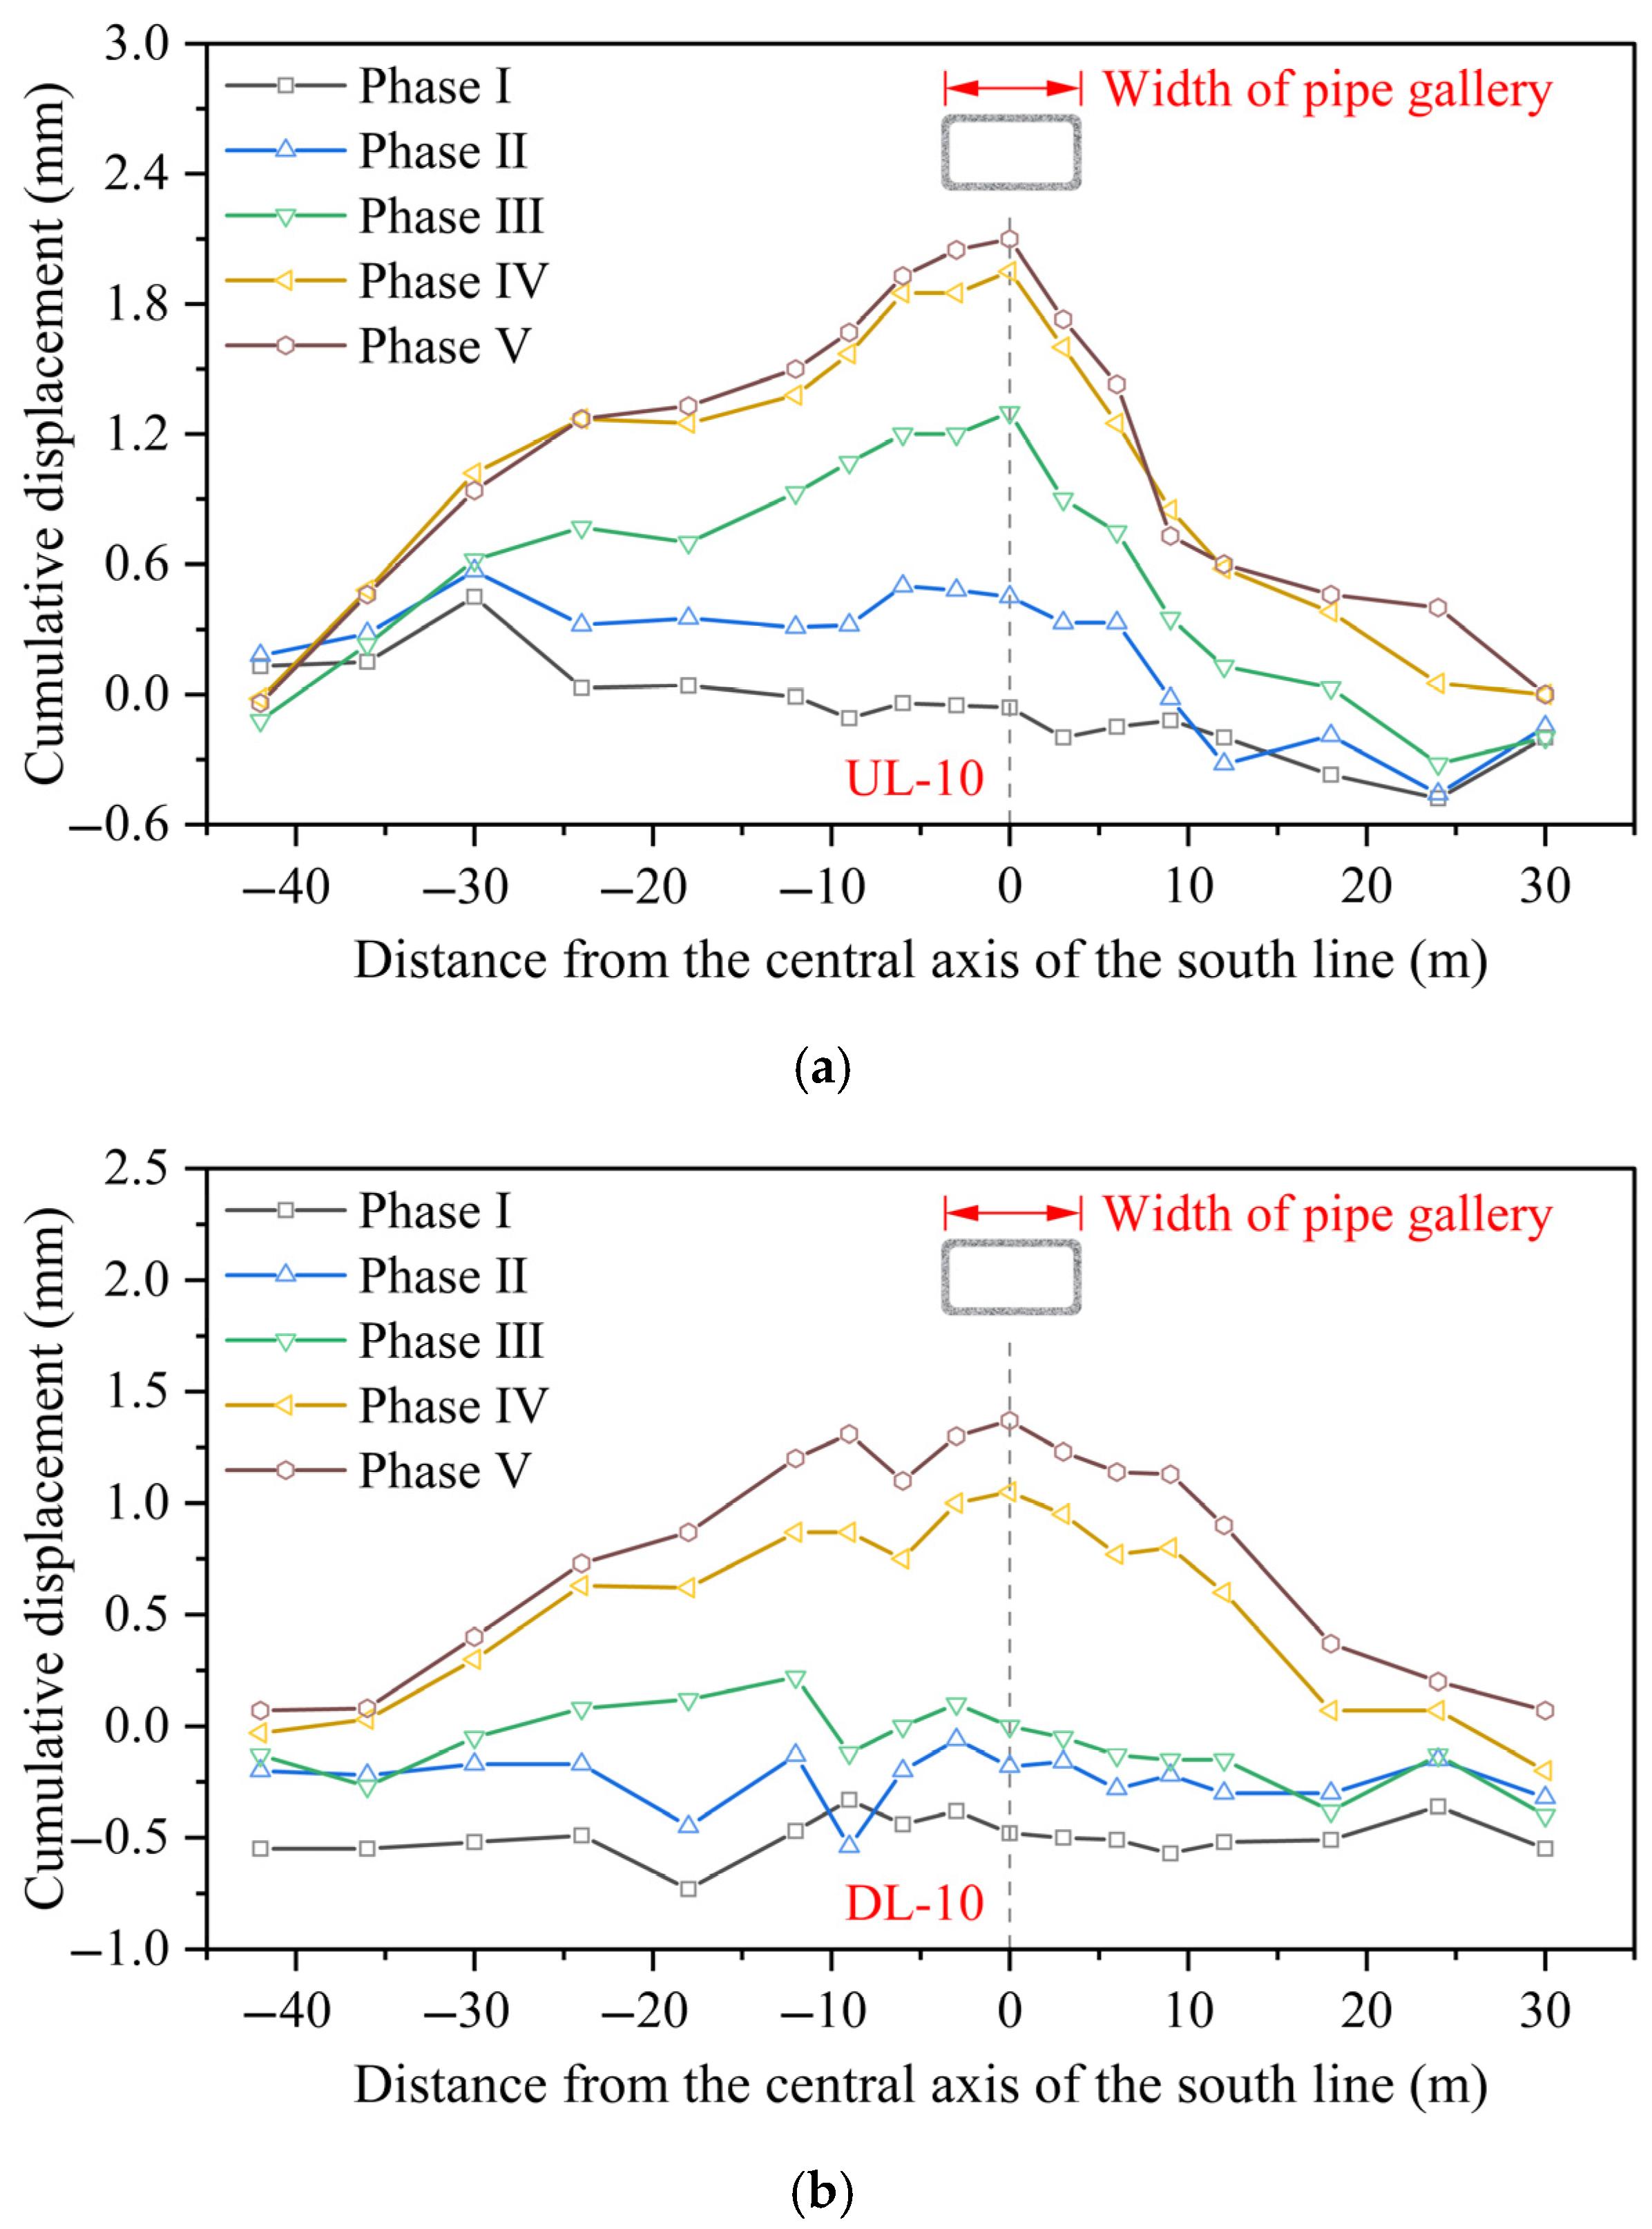
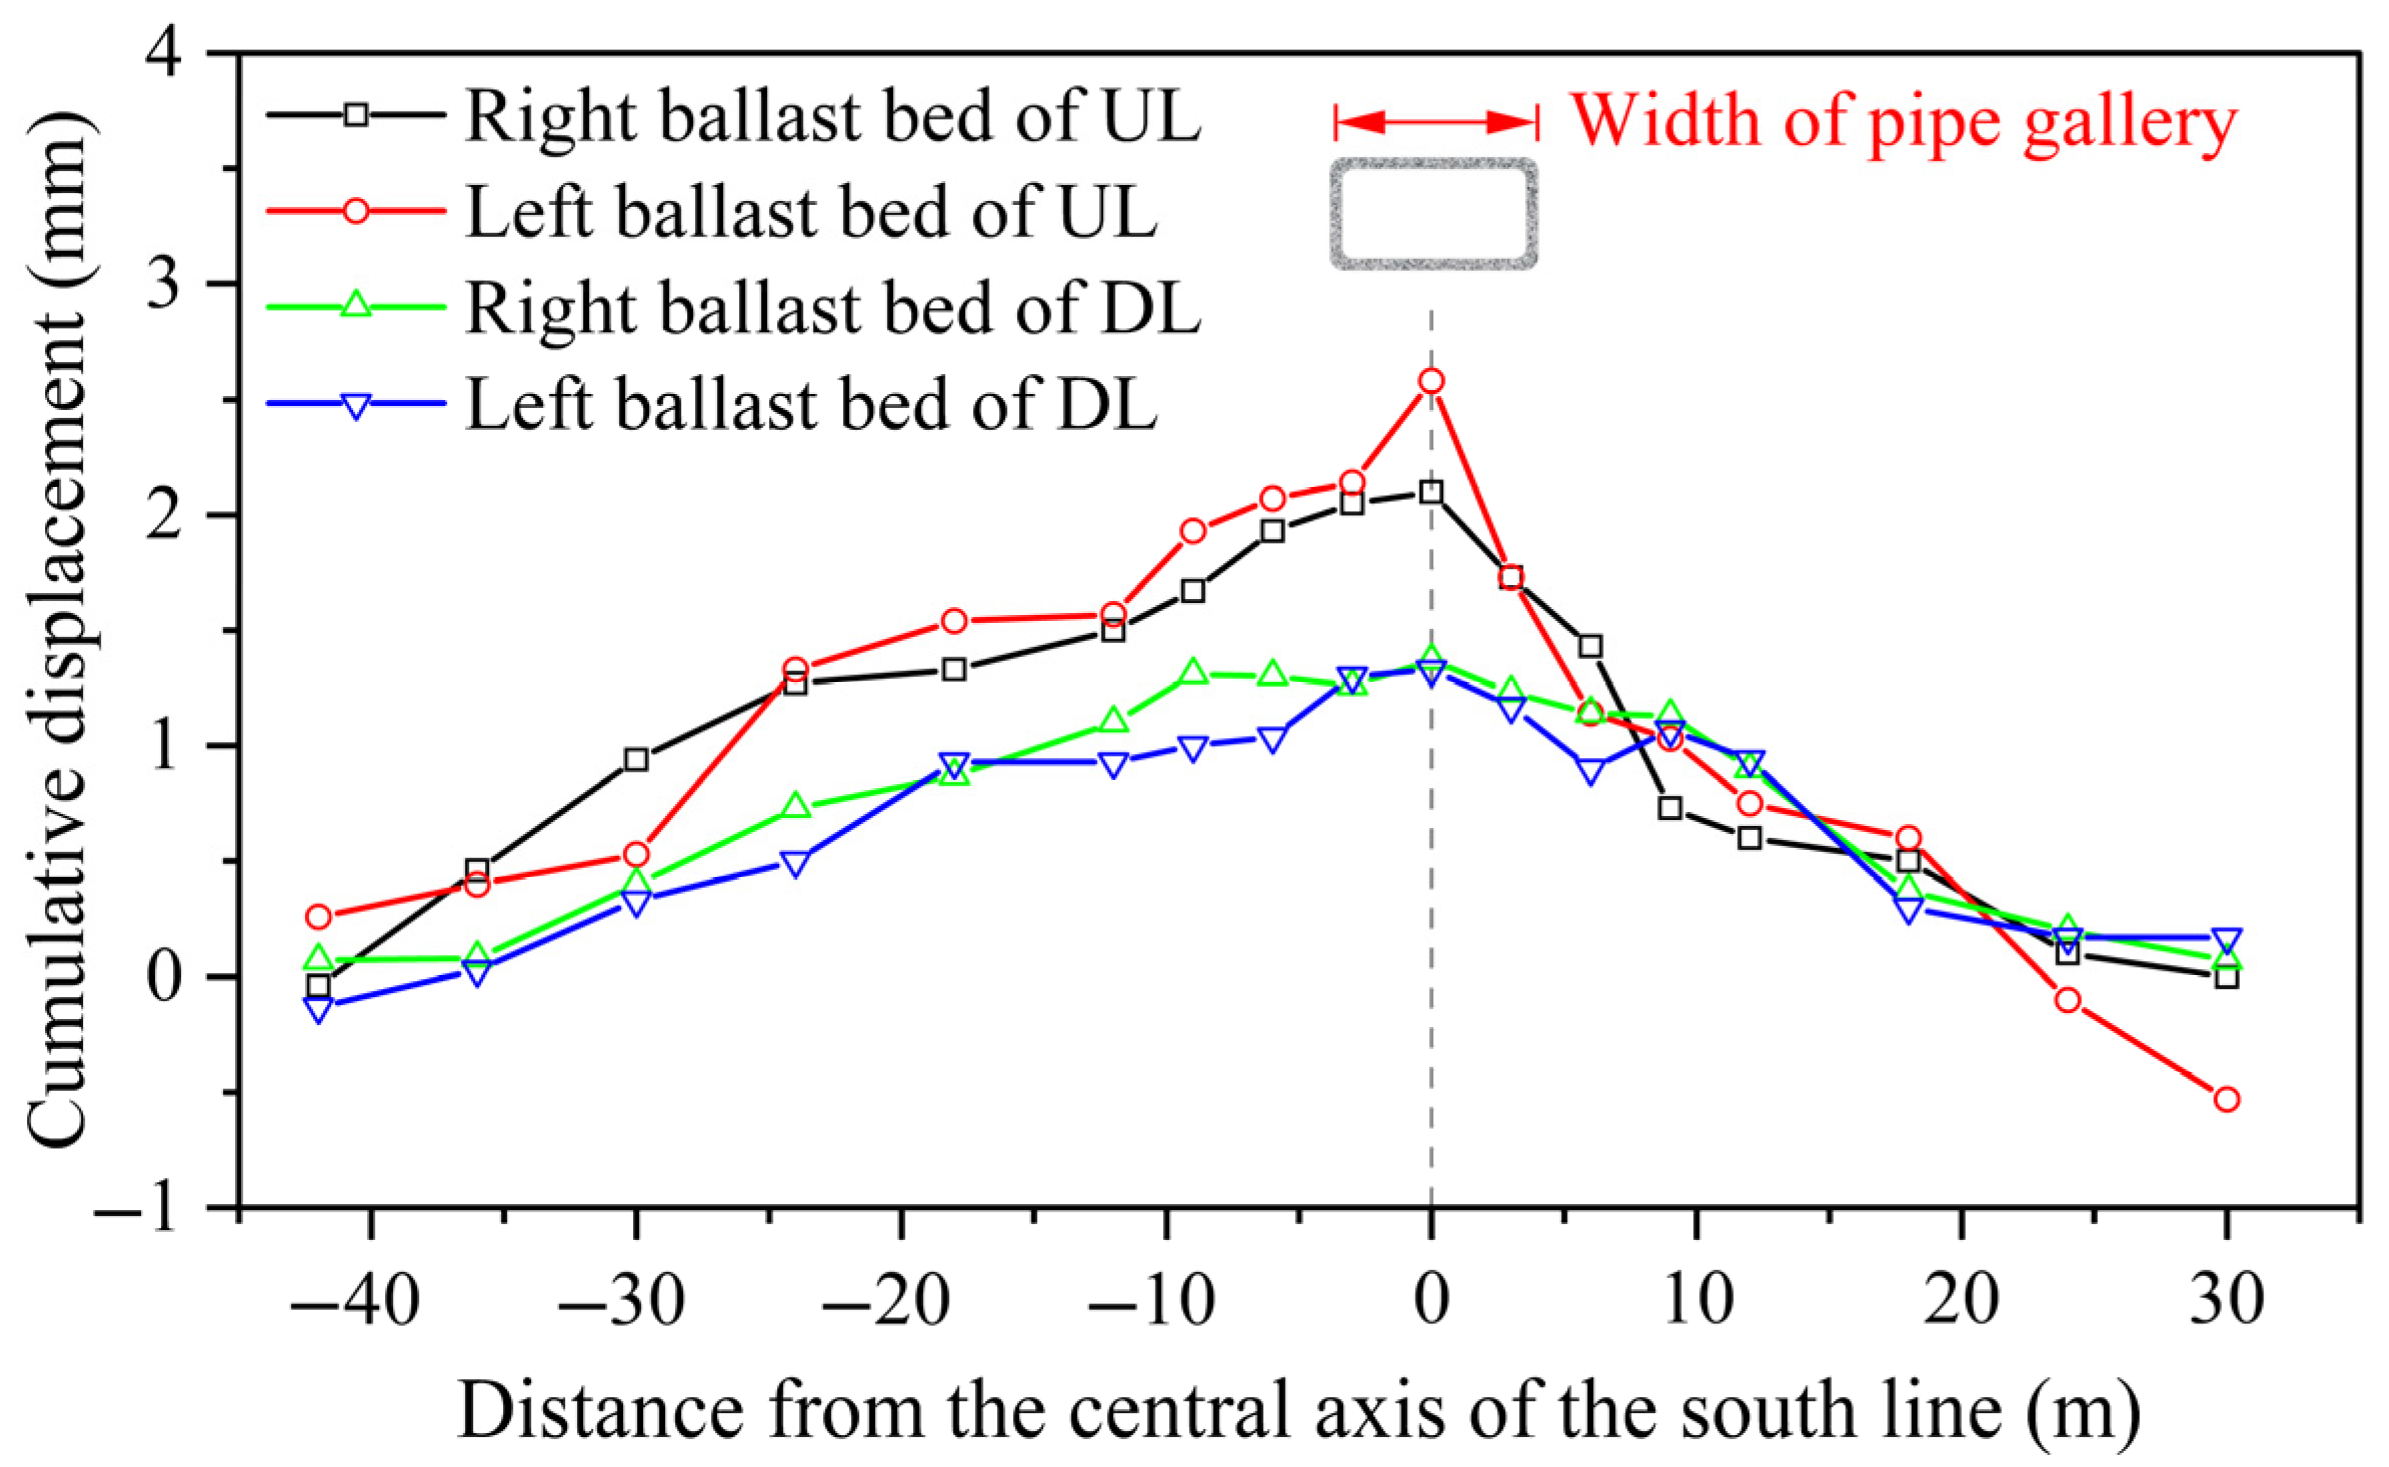
During the rectangular box jacking process, the maximum deformation of the metro tunnel primarily occurs directly beneath the jacking axis. The displacement amplitude is generally controlled within 2 mm, exhibiting a symmetrical distribution pattern centered along the axis, and the influence zone of deformation extends approximately 20 m from the edge of the pipe gallery. The tunnel vault and ballast bed mainly float upward, while the tunnel hance tends to shift horizontally toward the receiving shaft. As the surrounding soil gradually consolidates during the later stages of construction, the horizontal displacement of the tunnel hance decreases, although the overall deformation trend remains stable.
(2)
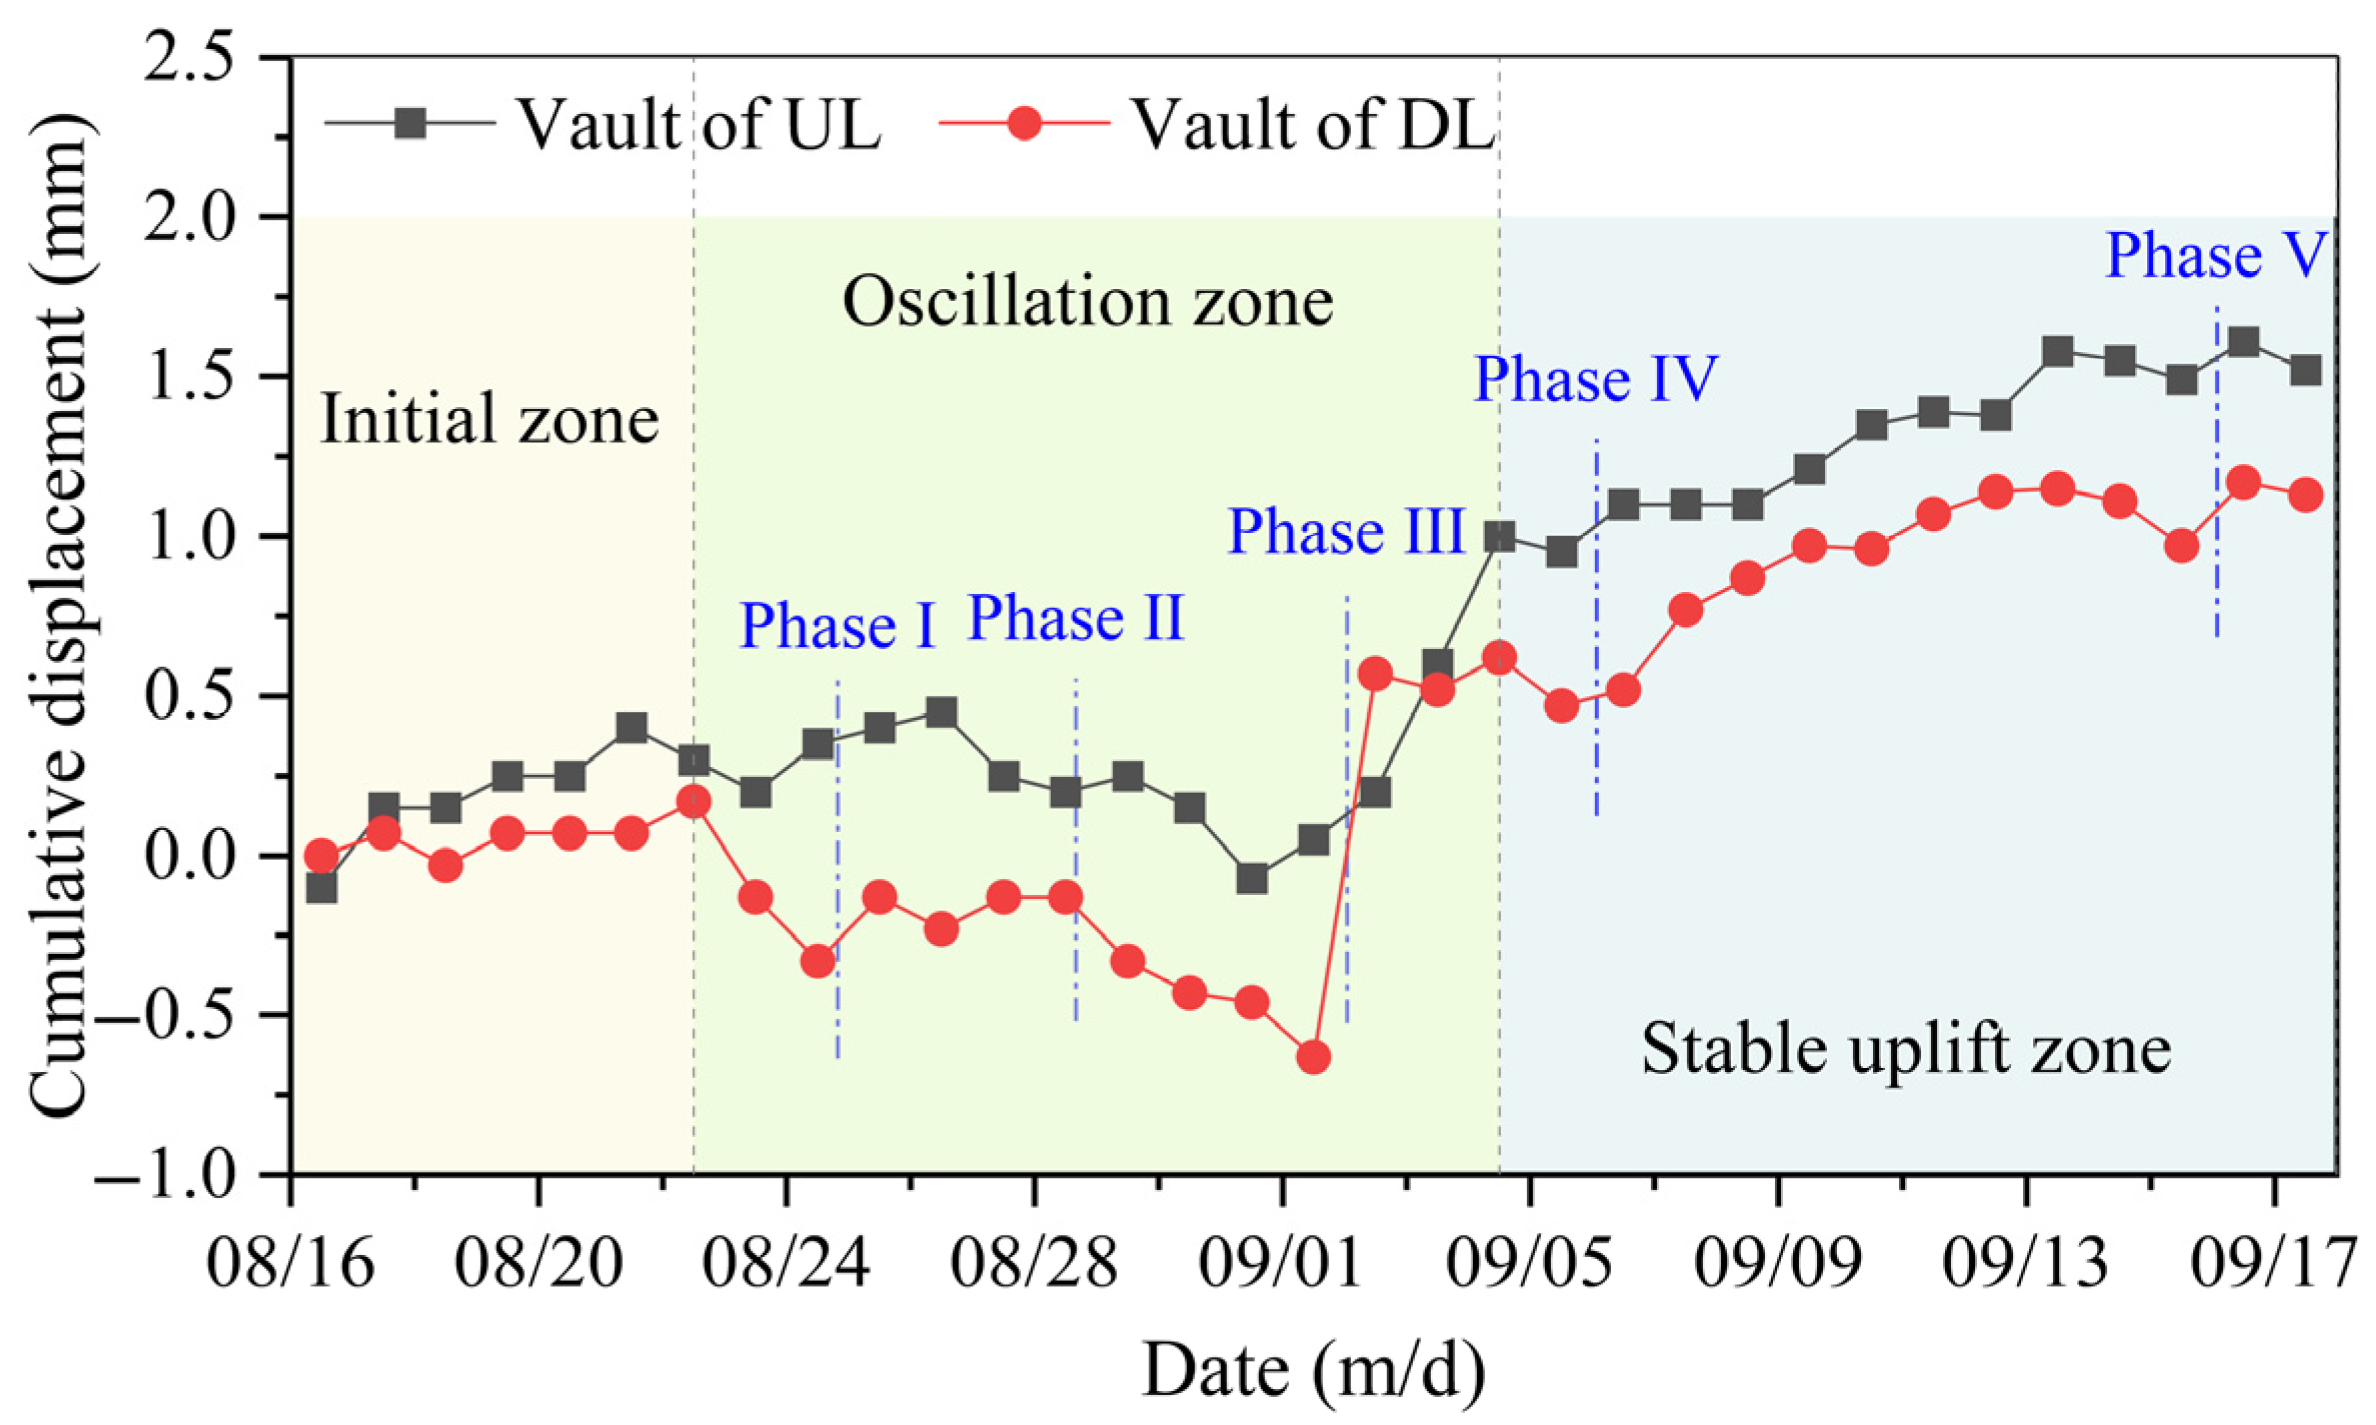
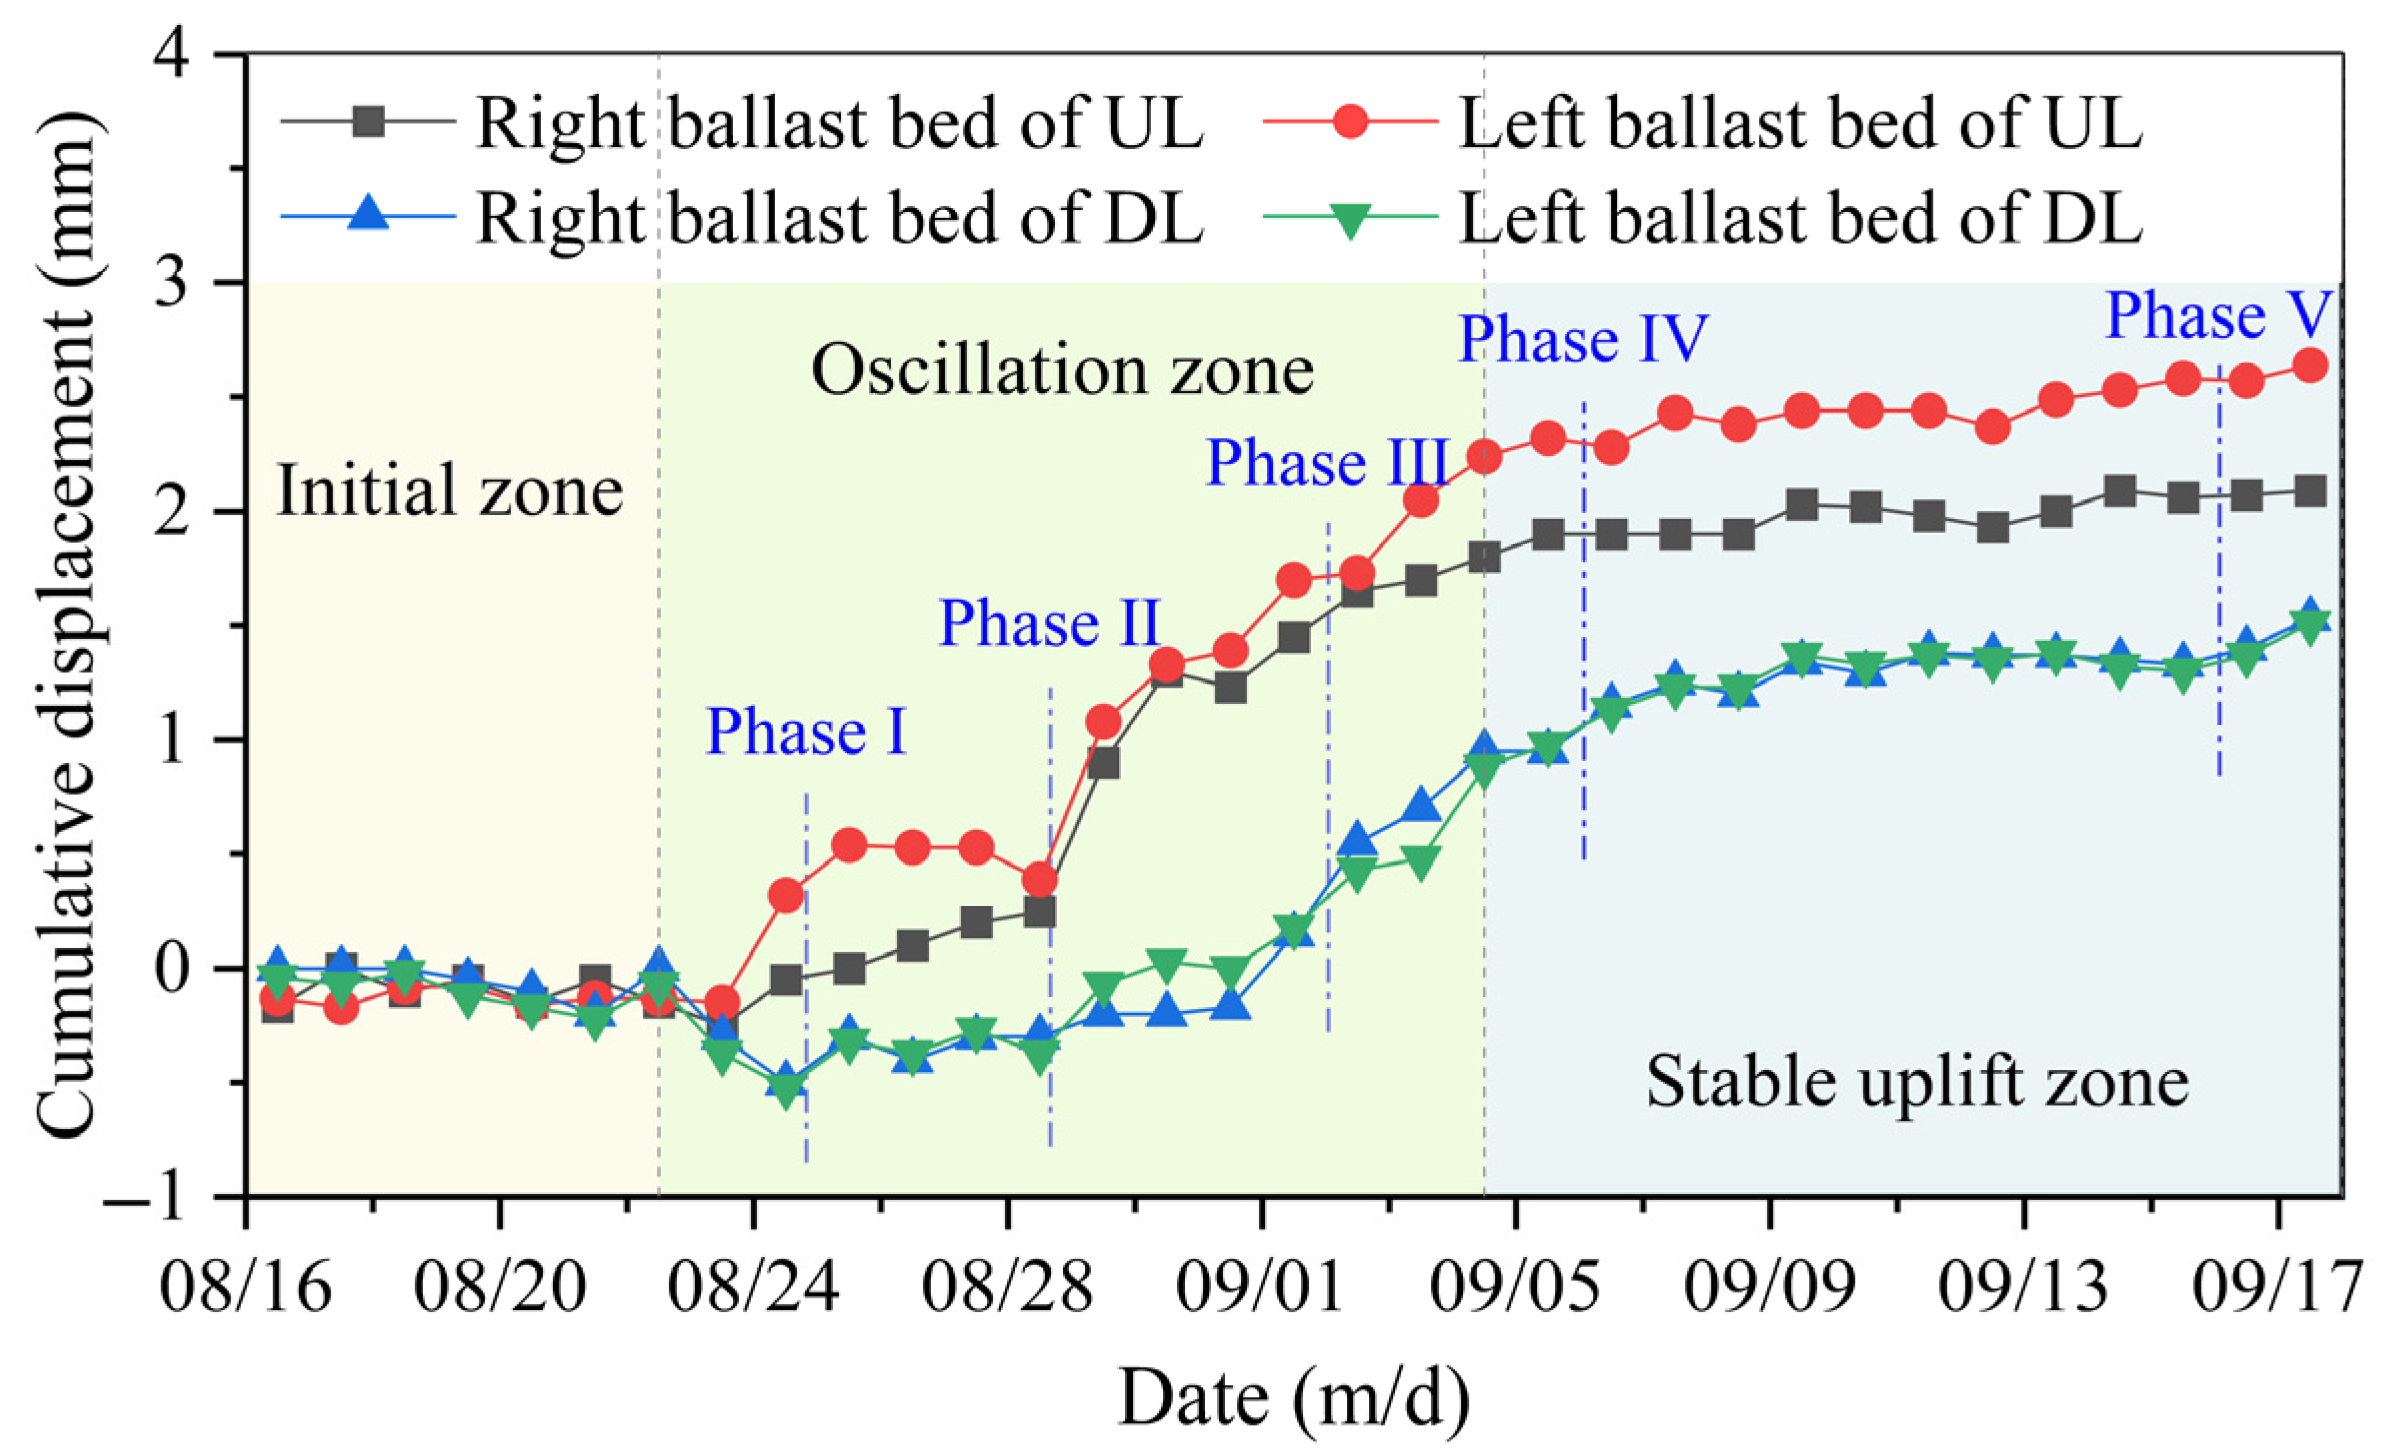
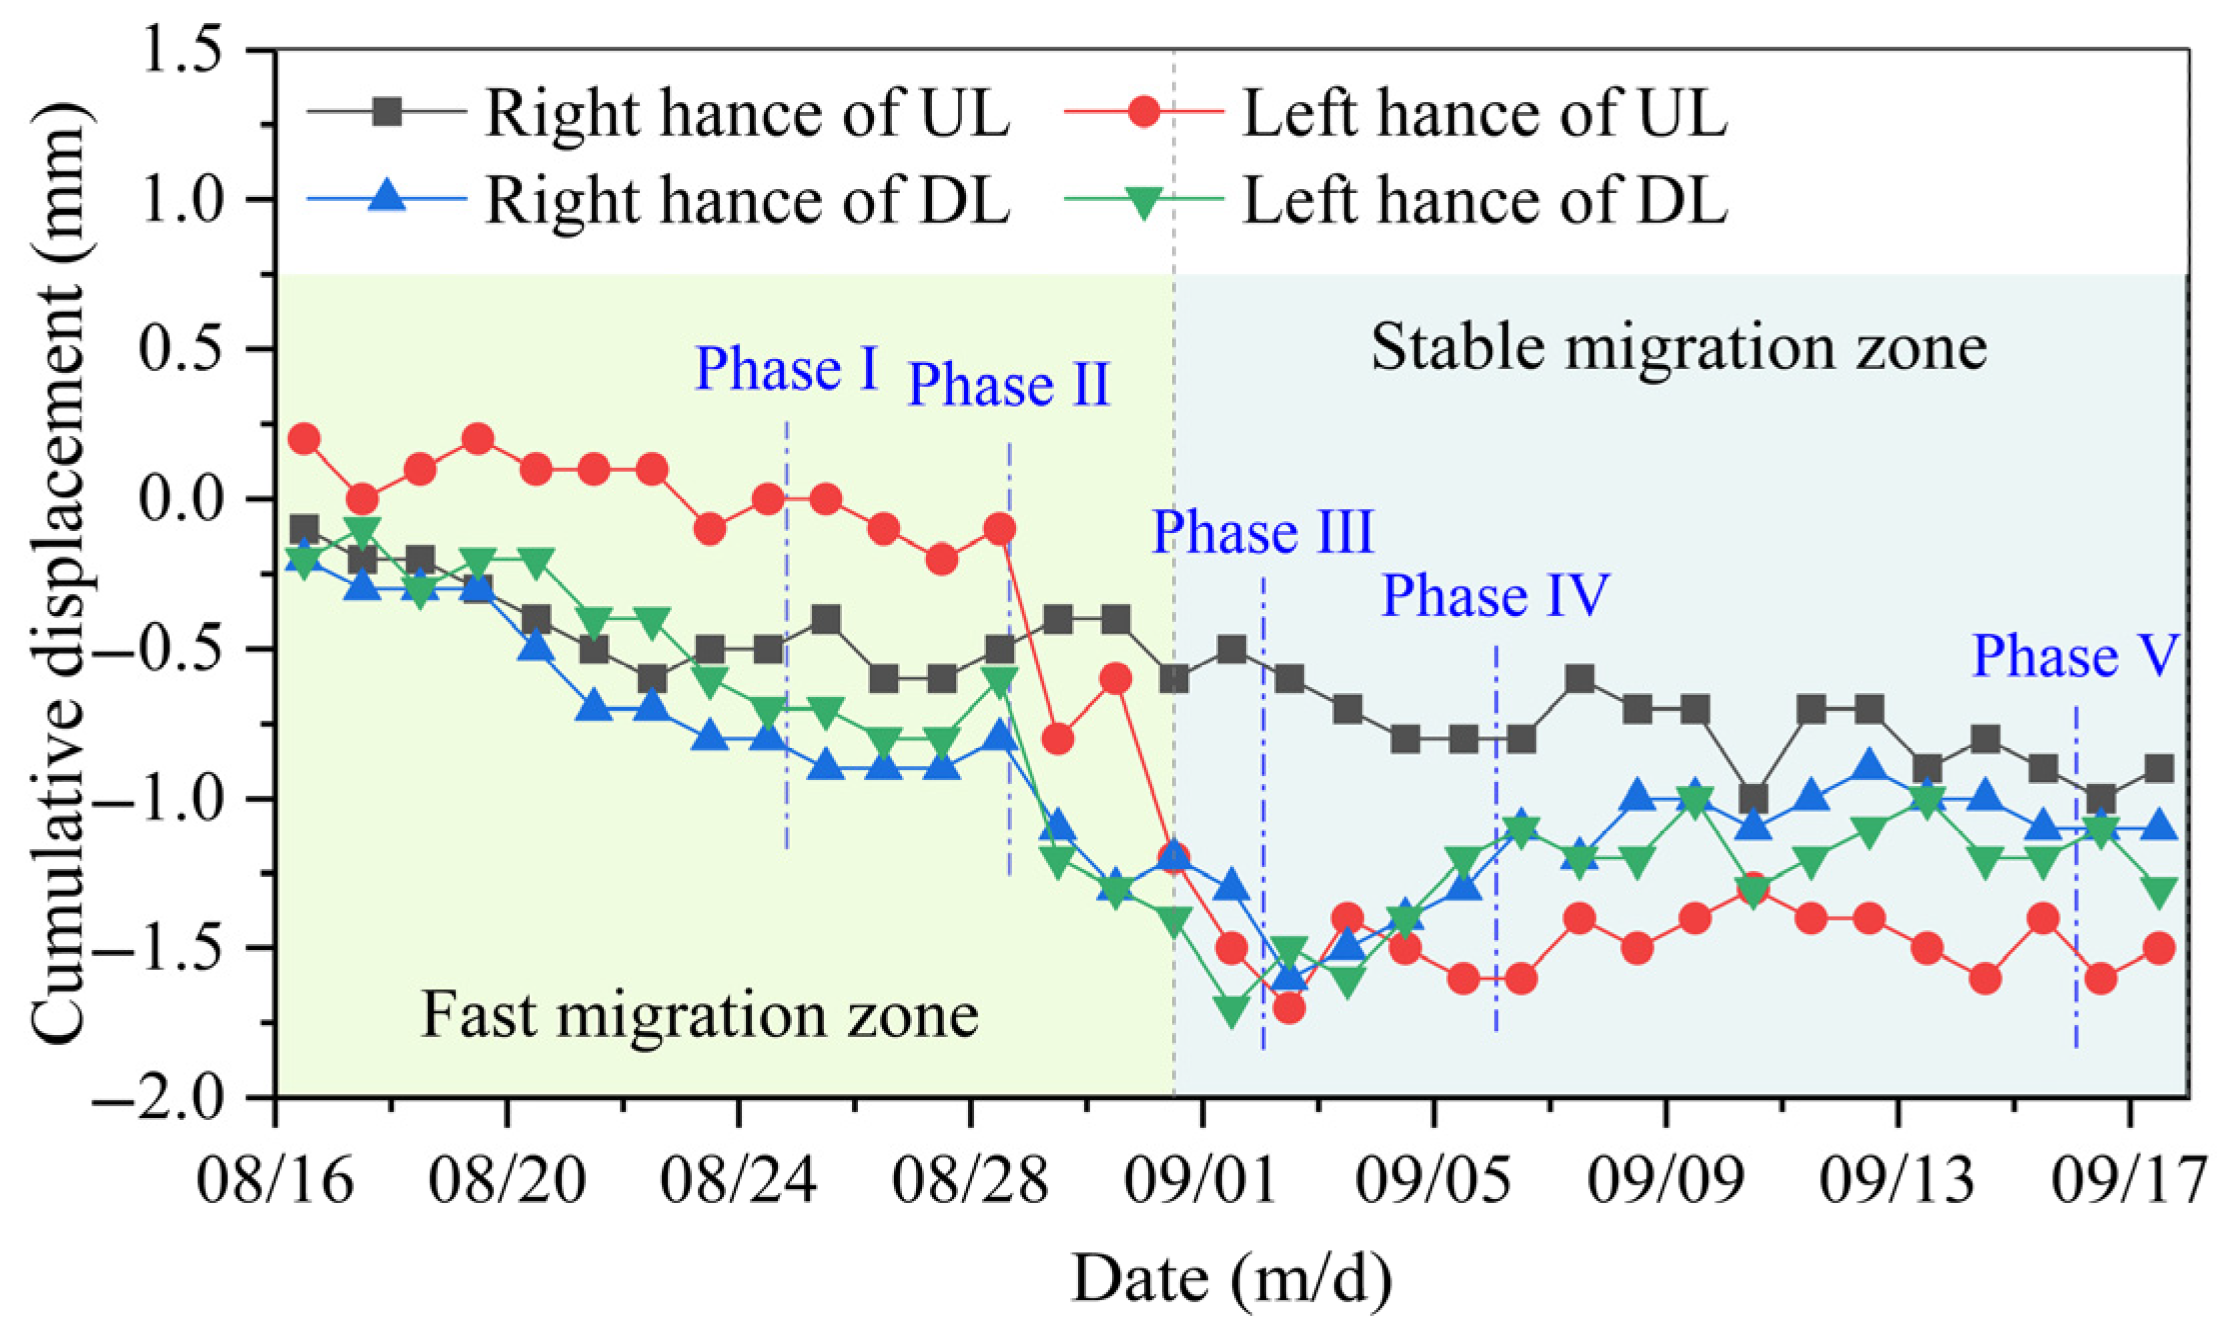
The vertical displacement trends of both the vault and the ballast bed in the double-line tunnel exhibit similar patterns; however, the uplift magnitude of the ballast bed is generally greater than that of the vault. The evolution of displacement can be categorized into three distinct stages: the initial deformation zone, the deformation oscillation zone, and the stable uplift zone, with the self-gravity of the pipe jacking machine serving as the primary influencing factor. The horizontal displacement at the tunnel hance predominantly undergoes two stages: the fast migration zone and the stable migration zone, and the demarcation point roughly corresponds to the period when the pipe jacking machine crosses the upline and downline.
(3)
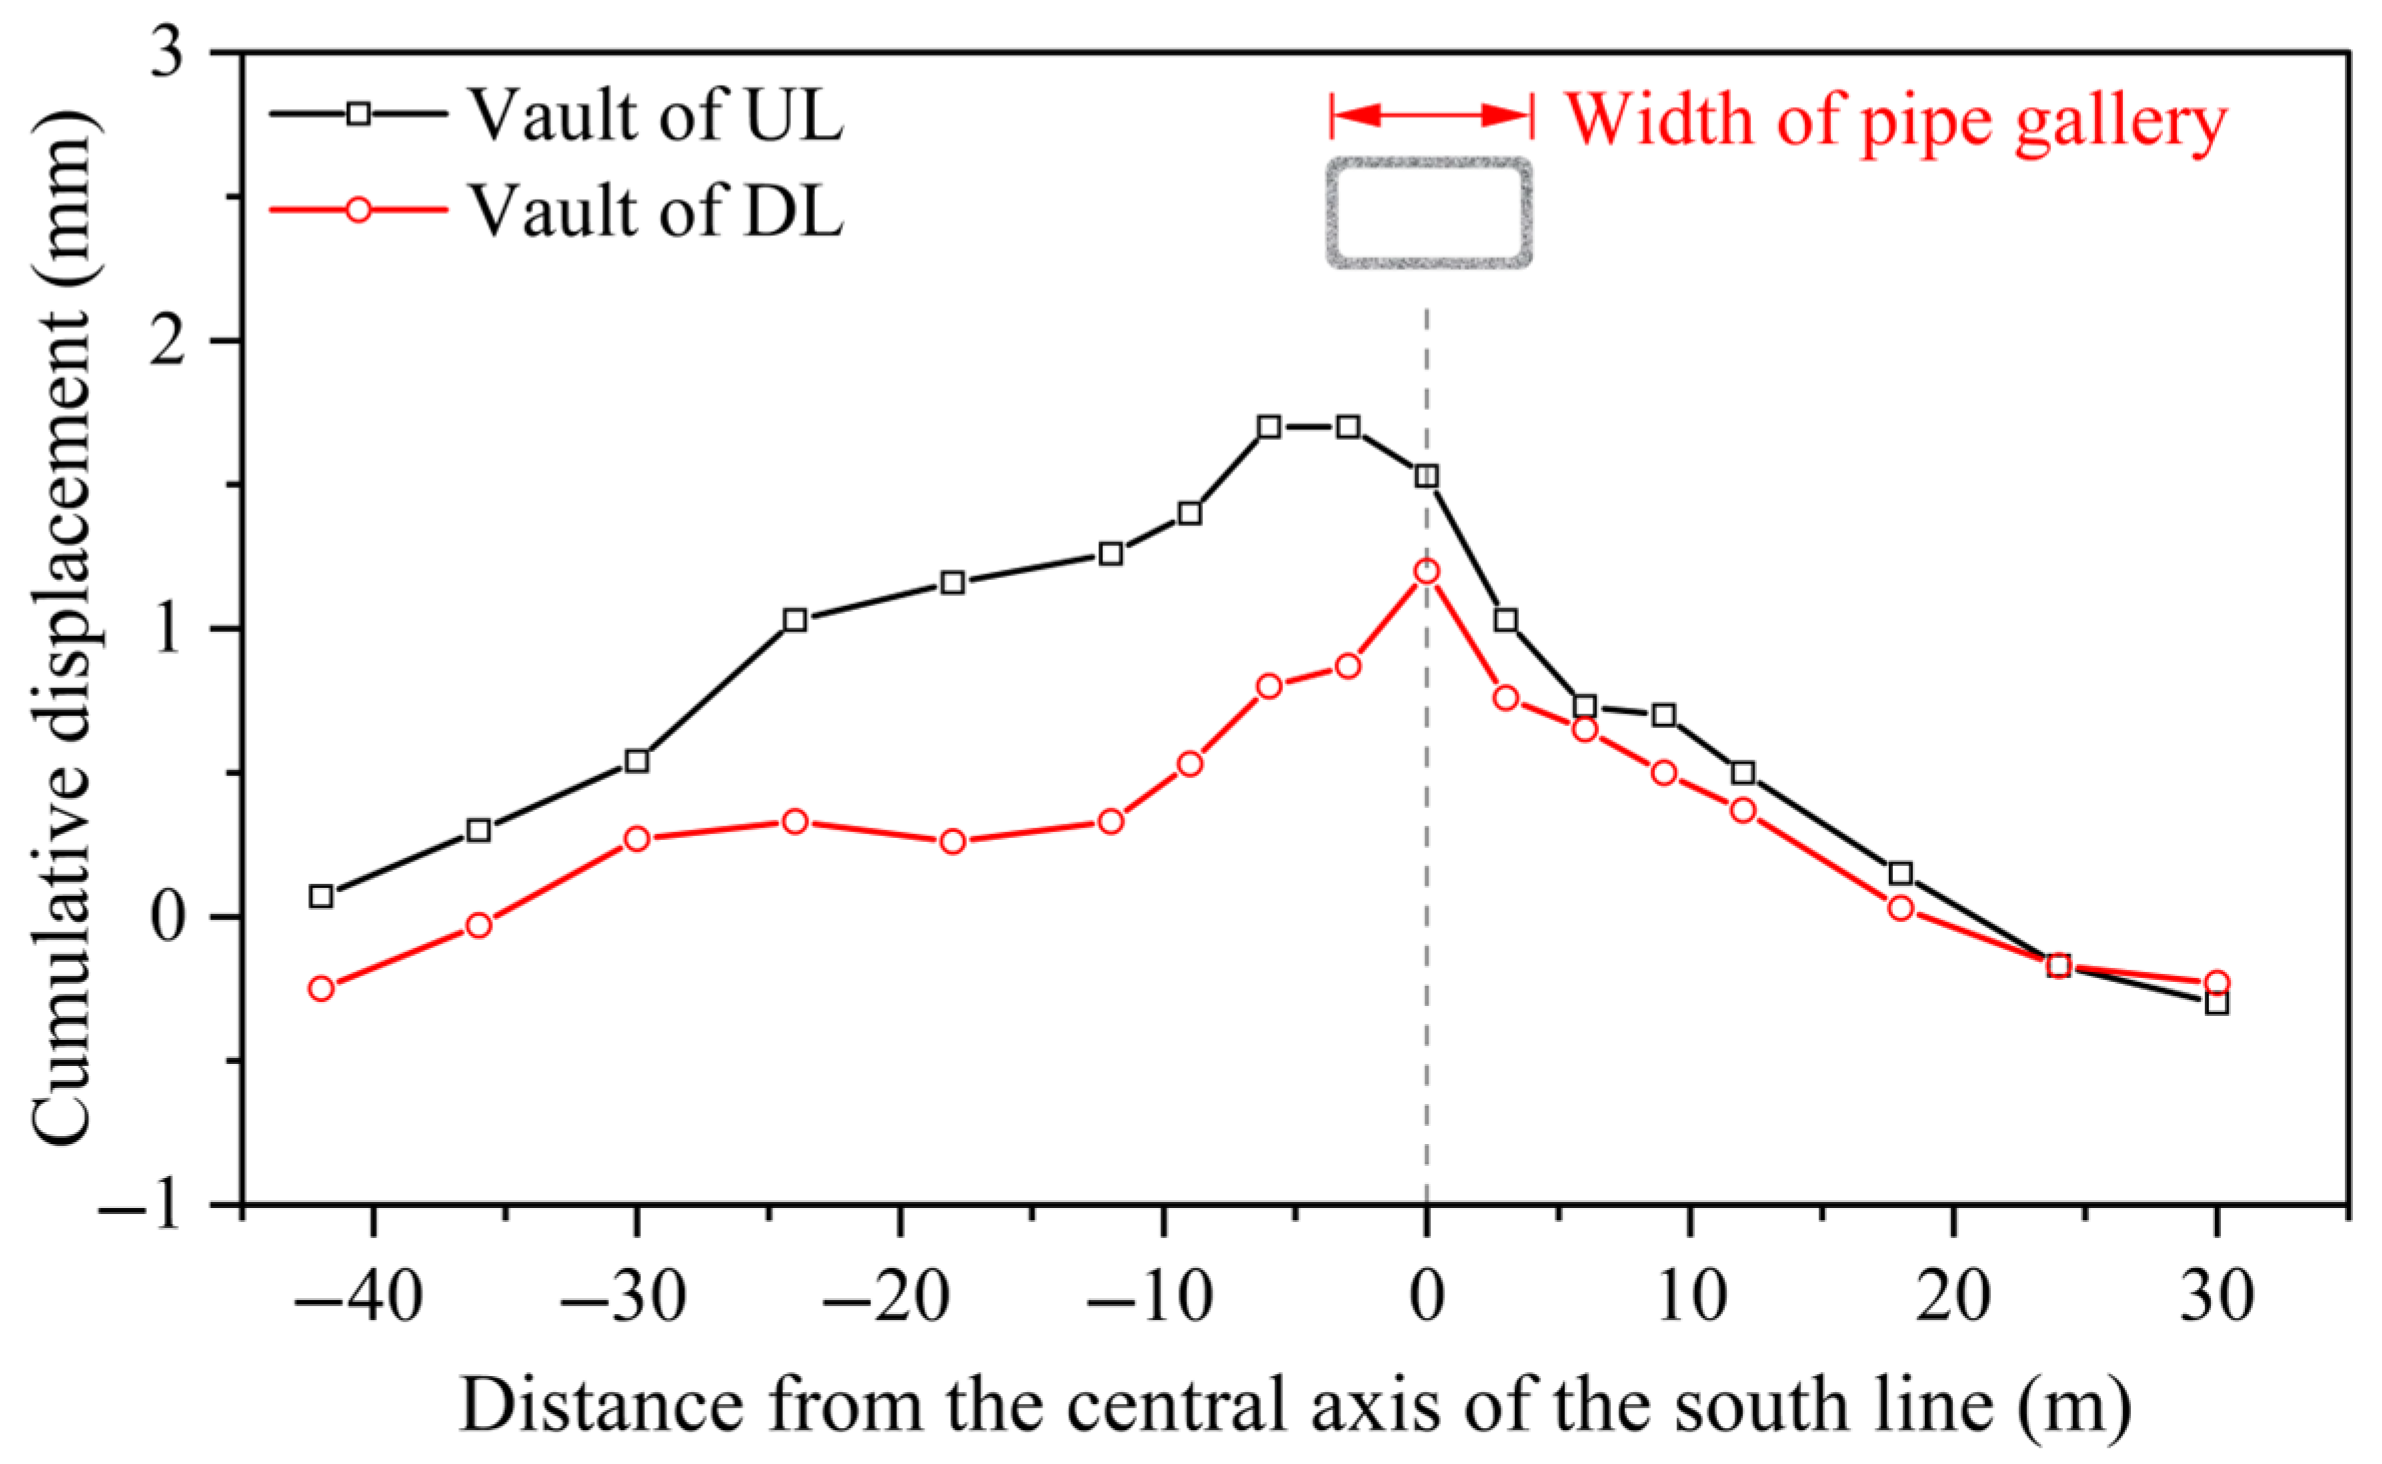
Throughout the entire jacking process, the deformation amplitude of the upline tunnel structure is generally greater than that of the downline, with the deformation of the right side hance and ballast bed exhibiting significantly higher values than that of the left side. This phenomenon indicates that stratum disturbances exhibit temporal and spatial effects, wherein structural components initially impacted by pipe jacking endure greater cumulative deformation during the whole construction process.
(4)
The finite element simulation results align well with the monitoring data. When the clear distance is increased to two times the original clear distance, the vertical displacement of the upline and downline tunnel vaults is reduced by 58.87% and 51.95%, respectively. As the friction coefficient is 0.1, 0.2, and 0.3, the deformation difference of the double-line tunnel vault is 0.12 mm, 0.19 mm, and 0.36 mm, respectively. Insufficient grouting pressure results in uneven tunnel deformation, whereas a moderate increase can effectively suppress tunnel float. However, excessive grouting pressure may trigger secondary risks, such as ground heave above shallow-buried jacked pipes. When the jacking machine is positioned directly above the tunnel, the sensitivity of grouting pressure is higher than that of the other two parameters, indicating its dominant role in influencing structural responses during this critical stage.
In summary, the numerical model developed in this study accurately captures the impact of pipe jacking on existing tunnel structures, with strong predictive performance and engineering applicability. The modeling process is standardized, and the parameters have clear physical meaning, enabling application to similar geological and construction conditions. Nonetheless, its performance under varying geology, boundary conditions, or strong disturbances requires further validation. Future work should explore broader engineering scenarios to enhance the model’s generality and reliability.

Author Contributions

C.M.: Investigation, writing—original draft, formal analysis, data curation, methodology, and writing—review and editing. H.Z.: Conceptualization, validation, and supervision. B.M.: Funding acquisition and resources. All authors have read and agreed to the published version of the manuscript.

Funding

This study was supported by the Guangdong Provincial Department of Science and Technology (2021ZT09G087).

Data Availability Statement

Data will be made available upon request.

Acknowledgments

The authors are grateful to The First Engineering Co., Ltd. of China Railway 20th Bureau Group for cooperation in the field monitoring.

Conflicts of Interest

Author Chong Ma was employed by the company Liangshan Engineering Technology (Wuhan) Co., Ltd. Author Hao Zhou was employed by the company National Engineering Research Center of Eco-Environment in the Yangtze River Economic Belt, China Three Gorges Corporation. The remaining author declares that the research was conducted in the absence of any commercial or financial relationships that could be construed as a potential conflict of interest.

References

  1. Broere, W. Urban Underground Space: Solving the problems of today’s cities. Tunn. Undergr. Space Technol. 2016, 55, 245–248. [Google Scholar] [CrossRef]
  2. Cui, J.; Broere, W.; Lin, D. Underground Space utilisation for urban renewal. Tunn. Undergr. Space Technol. 2021, 108, 103726. [Google Scholar] [CrossRef]
  3. Zhou, H.; Huang, S.; Zhang, P.; Ma, B.; Ma, P.; Feng, X. Prediction of jacking force using PSO-BPNN and PSO-SVR algorithm in curved pipe roof. Tunn. Undergr. Space Technol. 2023, 138, 105159. [Google Scholar] [CrossRef]
  4. Ng, C.W.W.; Shi, J.; Hong, Y. Three-dimensional centrifuge modelling of basement excavation effects on an existing tunnel in dry sand. Can. Geotech. J. 2013, 50, 874–888. [Google Scholar] [CrossRef]
  5. Liu, B.; Yu, Z.; Han, Y.; Wang, Z.; Zhang, R.; Wang, S. Analytical solution for the response of an existing tunnel induced by above-crossing shield tunneling. Comput. Geotech. 2020, 124, 103624. [Google Scholar] [CrossRef]
  6. Ayasrah, M. Response of Existing Pile Groups Due to Twin Tunneling: A Numerical Study. Eng. Technol. Appl. Sci. Res. 2025, 15, 23309–23316. [Google Scholar] [CrossRef]
  7. Ma, B.; Najafi, M. Development and applications of trenchless technology in China. Tunn. Undergr. Space Technol. 2008, 23, 476–480. [Google Scholar] [CrossRef]
  8. Ji, X.; Ni, P.; Barla, M.; Zhao, W.; Mei, G. Earth pressure on shield excavation face for pipe jacking considering arching effect. Tunn. Undergr. Space Technol. 2018, 72, 17–27. [Google Scholar] [CrossRef]
  9. Zhang, P.; Behbahani, S.S.; Ma, B.; Iseley, T.; Tan, L. A jacking force study of curved steel pipe roof in Gongbei tunnel: Calculation review and monitoring data analysis. Tunn. Undergr. Space Technol. 2018, 72, 305–322. [Google Scholar] [CrossRef]
  10. Ong, D.E.L.; Choo, C.S. Assessment of non-linear rock strength parameters for the estimation of pipe-jacking forces. Part 1. Direct shear testing and backanalysis. Eng. Geol. 2018, 244, 159–172. [Google Scholar] [CrossRef]
  11. Xu, X.; Tong, L.; Li, Z.; Liu, X.; Hu, Q.; Yao, H.; Li, J. Influence of extreme shallow jacked box tunnelling on underlying metro tunnels: A case study. Undergr. Space 2023, 12, 234–250. [Google Scholar] [CrossRef]
  12. Zhang, D.; Liu, B.; Qin, Y. Construction of a large-section long pedestrian underpass using pipe jacking in muddy silty clay: A case study. Tunn. Undergr. Space Technol. 2016, 60, 151–164. [Google Scholar] [CrossRef]
  13. Choi, J.-I.; Lee, S.-W. Influence of existing tunnel on mechanical behavior of new tunnel. KSCE J. Civ. Eng. 2010, 14, 773–783. [Google Scholar] [CrossRef]
  14. Li, P.; Du, S.-J.; Ma, X.-F.; Yin, Z.-Y.; Shen, S.-L. Centrifuge investigation into the effect of new shield tunnelling on an existing underlying large-diameter tunnel. Tunn. Undergr. Space Technol. 2014, 42, 59–66. [Google Scholar] [CrossRef]
  15. Avgerinos, V.; Potts, D.M.; Standing, J.R. Numerical investigation of the effects of tunnelling on existing tunnels. Géotechnique 2017, 67, 808–822. [Google Scholar] [CrossRef]
  16. Zheng, Z.; Xue, X.; Su, D.; Chen, J.; Qiu, T.; Chen, P.; Xie, D.; Su, L.; Chen, W.; Huang, S.; et al. Instability mechanism and reinforcement measures for segments of Ultra-Large diameter shield tunnels when constructing cross passages by mechanical methods. Tunn. Undergr. Space Technol. 2024, 154, 106125. [Google Scholar] [CrossRef]
  17. Liang, R.; Wu, W.; Yu, F.; Jiang, G.; Liu, J. Simplified method for evaluating shield tunnel deformation due to adjacent excavation. Tunn. Undergr. Space Technol. 2018, 71, 94–105. [Google Scholar] [CrossRef]
  18. Zhou, Z.; Chen, Y.; Liu, Z.; Miao, L. Theoretical prediction model for deformations caused by construction of new tunnels undercrossing existing tunnels based on the equivalent layered method. Comput. Geotech. 2020, 123, 103565. [Google Scholar] [CrossRef]
  19. Wu, H.-N.; Shen, S.-L.; Liao, S.-M.; Yin, Z.-Y. Longitudinal structural modelling of shield tunnels considering shearing dislocation between segmental rings. Tunn. Undergr. Space Technol. 2015, 50, 317–323. [Google Scholar] [CrossRef]
  20. Zhang, Z.; Liang, R.; Li, Z.; Kang, C.; El Naggar, M.H.; Xiao, M.; Wu, W. Analytical solution for longitudinal deformation of shield tunnel induced by overcrossing tunnelling considering circumferential joints. J. Rock Mech. Geotech. Eng. 2023, 15, 2355–2374. [Google Scholar] [CrossRef]
  21. Xu, Y.; Zhang, Z.; Zhang, C.; Han, X.; Liu, T.; Zhang, X. Analysis of longitudinal deformation of existing rectangular pipe jacking tunnel caused by shield tunnel undercrossing. Tunn. Undergr. Space Technol. 2025, 161, 106532. [Google Scholar] [CrossRef]
  22. He, H.; Wang, S.; Shen, W.; Zhang, W. The influence of pipe-jacking tunneling on deformation of existing tunnels in soft soils and the effectiveness of protection measures. Transp. Geotech. 2023, 42, 101061. [Google Scholar] [CrossRef]
  23. Ma, L.; Xue, C.; Yang, Q.; Chen, D.; Wang, B. A simplified method for evaluating the carrying-soil phenomenon in large cross-section rectangular pipe jacking. Eng. Fail. Anal. 2024, 165, 108750. [Google Scholar] [CrossRef]
  24. Ye, P.; Lan, B.; Zhang, P.; Zeng, C.; Xu, T.; Xu, Y.; Wu, R. Numerical Simulation Study on Evolution Process of Carrying-Soil Effect of Rectangular Pipe Jacking. Buildings 2024, 14, 3057. [Google Scholar] [CrossRef]
  25. Ma, P.; Shimada, H.; Sasaoka, T.; Moses, D.N.; Matsumoto, F.; Chen, X. Investigation on the engineering effects of the geometrical configuration of the jacking rectangular pipe. Tunn. Undergr. Space Technol. 2022, 119, 104239. [Google Scholar] [CrossRef]
  26. Chen, X.; Ma, B.; Najafi, M.; Zhang, P. Long rectangular box jacking project: A case study. Undergr. Space 2021, 6, 101–125. [Google Scholar] [CrossRef]
  27. Tian, X.; Song, Z.; Lun, K.; Xie, J.; Ma, P. A Prediction Method for Frictional Resistance in Long-Distance Rectangular Pipe Jacking Considering Complex Contact States. Buildings 2025, 15, 1904. [Google Scholar] [CrossRef]
  28. Liu, W.; Wu, Y.; Zhao, H.; Xu, X.; Miao, L. Deformations of Subway Tunnels Induced by the Overcrossing Jacked Box Tunnels. Symmetry 2021, 13, 1800. [Google Scholar] [CrossRef]
  29. Luo, L.; Zhe, Q.; Liu, W.; Fang, Y.; Wang, F. Research on the Longitudinal Deformation of Segments Induced by Pipe-Jacking Tunneling over Existing Shield Tunnels. Buildings 2025, 15, 1394. [Google Scholar] [CrossRef]
  30. Lin, C.; Zheng, J.; Ye, Y.; Nadim, F.; Liu, Z.; Zhao, C.; Chen, Y.; Ding, Z. Analytical solution for tunnelling-induced response of an overlying pipeline considering gap formation. Undergr. Space 2024, 15, 298–311. [Google Scholar] [CrossRef]
  31. Ma, P.; Shimada, H.; Sasaoka, T.; Hamanaka, A.; Moses, D.N.; Dintwe, T.K.M.; Matsumoto, F.; Ma, B.; Huang, S. A new method for predicting the friction resistance in rectangular pipe-jacking. Tunn. Undergr. Space Technol. 2022, 123, 104338. [Google Scholar] [CrossRef]
  32. Wang, F.; Shi, J.; Huang, H.; Zhang, D. Modified analytical solution of shield tunnel lining considering nonlinear bending stiffness of longitudinal joint. Tunn. Undergr. Space Technol. 2020, 106, 103625. [Google Scholar] [CrossRef]
  33. Shou, K.; Yen, J.; Liu, M. On the frictional property of lubricants and its impact on jacking force and soil–pipe interaction of pipe-jacking. Tunn. Undergr. Space Technol. 2010, 25, 469–477. [Google Scholar] [CrossRef]
  34. Zhou, H.; Huang, S.; Ma, B.; Zhang, H.; Tan, X.; Zhao, Y.; Ma, P.; Su, X.; Wei, Y. Full-scale test study on the mechanical response of ultra-large section jacking prestressed concrete cylinder pipe (JPCCP) under axial jacking force. Tunn. Undergr. Space Technol. 2025, 155, 106194. [Google Scholar] [CrossRef]
Figure 1. Plan view of the project.
Buildings 15 02547 g001
Figure 2. Profile of rectangular box jacking and metro tunnel.
Buildings 15 02547 g002
Figure 3. Division of the soil disturbance zone in the construction of pipe jacking over a double-line tunnel.
Buildings 15 02547 g003
Figure 4. Layout of tunnel monitoring sections and measuring points.
Buildings 15 02547 g004
Figure 5. Vertical displacement distribution curve of vault: (a) upline tunnel; (b) downline tunnel.
Buildings 15 02547 g005
Figure 6. Vertical displacement distribution curve of each vault in the monitoring sections.
Buildings 15 02547 g006
Figure 7. Deformation of the tunnel caused by the overcrossing construction of rectangular box jacking.
Buildings 15 02547 g007
Figure 8. Curve of vertical displacement of vault over time.
Buildings 15 02547 g008
Figure 9. Vertical displacement distribution curve of the ballast bed on the right side: (a) upline tunnel; (b) downline tunnel.
Buildings 15 02547 g009
Figure 10. Vertical displacement distribution curve of each ballast bed in monitoring sections.
Buildings 15 02547 g010
Figure 11. Curve of vertical displacement of ballast bed over time.
Buildings 15 02547 g011
Figure 12. Horizontal displacement distribution curve of the hance on the right side: (a) upline tunnel; (b) downline tunnel.
Buildings 15 02547 g012
Figure 13. Horizontal displacement distribution curve of each tunnel hance in monitoring sections.
Buildings 15 02547 g013
Figure 14. Curve of horizontal displacement of hance over time.
Buildings 15 02547 g014
Figure 15. FE mesh model for the case.
Buildings 15 02547 g015
Figure 16. Simulation of construction course: (a) Initial state; (b) Phase I; (c) Phase II; (d) Phase III.
Buildings 15 02547 g016
Figure 17. Comparison between the measured and simulated values of the vertical displacement at the tunnel vault: (a) Phase II; (b) Phase III.
Buildings 15 02547 g017
Figure 18. Comparison between the measured and simulated values of the horizontal displacement at the tunnel hance: (a) Phase II; (b) Phase III.
Buildings 15 02547 g018
Figure 19. Curves of vertical displacement of double-line tunnel vault with jacking length under different clear distances: (a) upline tunnel; (b) downline tunnel.
Buildings 15 02547 g019
Figure 20. Variation curve of vertical displacement of double-line tunnel vault under different friction coefficients.
Buildings 15 02547 g020
Figure 21. Vertical displacement of double-line tunnel vault in each phase under different grouting pressures.
Buildings 15 02547 g021
Figure 22. Contours of ground heave (e.g., p = 80 kPa).
Buildings 15 02547 g022
Figure 23. Influence of construction parameters on the vertical deformation of the vault in the double-line tunnel.
Buildings 15 02547 g023
Table 1. Similar adjacent construction cases.
No.City/CountryProject NameConstruction MethodObjectMinimum Clear Distance (m)
1Guangzhou, ChinaLiede Drainage ProjectRectangular pipe jackingMetro station pile foundations and structures2.3
2Nanjing, ChinaUnderground Passage ConstructionRectangular pipe jackingMetro lines<4.5
3SingaporeDeep Tunnel Sewerage System (DTSS) Phase IIPipe jackingMetro lines and substructures2.5
4SingaporeThomson–East Coast Line (TEL)Pipe jacking, Shield tunnellingMetro lines and pile foundations<2.5
5London, UKCrossrail ProjectMicrotunnelling, Shield tunnellingMetro lines2–3
6Paris, FranceGrand Paris ExpressPipe jacking, Shield tunnellingDense urban infrastructure<3
Table 2. Physical and mechanical parameters of strata.
Soil LayerThickness (m)Density
(kg·m−3)
Compression
Modulus (MPa)
Poisson RatioCohesion (kPa)Internal Friction
Angle (°)
① Artificial fill3.2185023.80.332312.1
② Clay2.8189030.80.32215.2
③ Silty clay3.2187027.60.322613.6
④ Silty clay mixed with silt5.1184042.50.23724.1
⑤ Sand clay5.71870530.22329.3
⑥ Silty clay10.6192036.20.353716.5
Table 3. Division of the jacking phase for the south line.
PhaseTimeLocation of the MachineDistance (m)Relative Position Diagram
16 August 10:00Start jacking0-
I25 August 09:50Entering the affect zone of UL16.90Buildings 15 02547 i001
II29 August 08:55Entering the above of UL27.21Buildings 15 02547 i002
III2 September 07:35Entering the above of DL40.52Buildings 15 02547 i003
IV6 September 16:20Leaving the affect zone of DL58.09Buildings 15 02547 i004
V9 September 07:35End of jacking73.60-
Table 4. Maximum deformation of the existing double-line tunnel.
ItemUplineDownline
MaximumMinimumMaximumMinimum
VaultMonitoring sectionUL-8UL-15DL-9DL-1
Measuring pointIIII
Value (mm)1.70−0.291.21−0.25
Ballast bedMonitoring sectionUL-9UL-15DL-9DL-1
Measuring pointIIIIIIIII
Value (mm)2.58−0.531.37−0.13
Table 5. Material parameters of the main structure.
Thickness (m)Density (kg·m−3)Elastic Modulus (MPa)Poisson
Ratio
Remark
Tunnel lining0.50240027,600 *0.280% reduction
Jacked pipe0.45240034,5000.2
Quantified layer0.03105010.38
Note: * Elastic modulus after stiffness reduction.
Table 6. Parameter settings of various working conditions.
ParametersSymbolValue
Pipe–tunnel clear distance (m)d4.16.28.2
Pipe–slurry friction coefficientμ0.10.20.3
Grouting pressure (kPa)p80.0130.0180.0
Disclaimer/Publisher’s Note: The statements, opinions and data contained in all publications are solely those of the individual author(s) and contributor(s) and not of MDPI and/or the editor(s). MDPI and/or the editor(s) disclaim responsibility for any injury to people or property resulting from any ideas, methods, instructions or products referred to in the content.

