Article

ANN and RF Optimized by Hunter–Prey Algorithm for Predicting Post-Blast RC Column Morphology

1
State Key Laboratory of Precision Blasting, Jianghan University, Wuhan 430056, China
2
State Key Laboratory of Explosion Science and Safety Protection, Beijing Institute of Technology, Beijing 100081, China
3
Hubei Key Laboratory of Blasting Engineering, Jianghan University, Wuhan 430056, China
4
China Safety Technology Research Academy of Ordnance Industry, Beijing 100053, China
*
Authors to whom correspondence should be addressed.
Buildings 2025, 15(13), 2351; https://doi.org/10.3390/buildings15132351
Submission received: 26 April 2025 / Revised: 24 June 2025 / Accepted: 3 July 2025 / Published: 4 July 2025
(This article belongs to the Section Building Structures)

Abstract

The drilling and blasting method is commonly employed for the rapid demolition of outdated buildings by destroying key structural components and inducing progressive collapse. The residual bearing capacity of these components is governed by the deformation morphology of the longitudinal reinforcement, characterized by bending deflection and exposed height. This study develops and validates a finite element (FE) model of a reinforced concrete (RC) column subjected to demolition blasting. By varying concrete compressive strength, the yield strength of longitudinal reinforcement, the longitudinal reinforcement ratio, and the shear reinforcement ratio, 45 FE models are established to simulate the post-blast morphology of longitudinal reinforcement. Two databases are created: one containing 45 original simulation cases, and an augmented version with 225 cases generated through data augmentation. To predict bending deflection and the exposed height of longitudinal reinforcement, artificial neural network (ANN) and random forest (RF) models are optimized using the hunter–prey optimization (HPO) algorithm. Results show that the HPO-optimized RF model trained on the augmented database achieves the best performance, with MSE, MAE, and R2 values of 0.004, 0.041, and 0.931 on the training set, and 0.007, 0.057, and 0.865 on the testing set, respectively. Sensitivity analysis reveals that the yield strength of longitudinal reinforcement has the most significant impact, while the shear reinforcement ratio has the least influence on both output variables. The partial dependence plot (PDP) analysis indicates that the ratio of shear reinforcement has the most significant impact on the deformation of longitudinal reinforcement.

1. Introduction

Concrete and reinforcement are essential building materials, and the demolition of structures at the end of their service life provides a significant source for recycling these materials. Drilling and blasting, as an efficient and economical method, has been widely used in the demolition of high-rise buildings [1,2,3]. During demolition blasting, the energy released by explosive detonation acts on portions of the reinforced concrete (RC) columns, resulting in the crushing and ejection of concrete fragments, while the reinforcement becomes deformed and exposed [4,5]. These effects reduce the load-bearing capacity of the RC columns, ultimately leading to structural instability and collapse [6,7].
The residual bearing capacity of the RC columns after blasting plays a crucial role in the progressive collapse of building structures. At present, most related studies focus on external blasting load [8,9,10,11]. The main differences between these studies and demolition blasting lie in the position of the explosives and the resulting deformation morphology of the columns. When the explosives are placed outside of the RC columns, the deformation direction of the columns is opposite to the explosive position, and the deformation morphology is not centrosymmetric. In contrast, in demolition blasting, the explosives are placed inside the RC columns and the deformation morphology of the columns is centrosymmetric. Different deformation morphologies of the columns after blasting lead to different axial load-bearing mechanisms [4,9,12]. In view of these differences, some researchers study the deformation morphology and residual bearing capacity of RC columns under drilling and blasting loads [4,12,13,14,15]. Fujikake [13] constructed an RC column specimen with a single blasthole to investigate the residual bearing capacity after blasting. The results showed that only the longitudinal reinforcement could resist the axial force and moment in the blast-damaged zone. Sun [4,12] simplified the longitudinal reinforcement in the crushed zone as a spring and proposed a mechanical model of a residual RC column. The predicted strain curve of the simplified model and the test results were in good agreement. Kuzkin [14] and Yao [15] considered the Euler formula to analyze the axial resistance force of the RC column, and they found that the deformation morphology of the longitudinal reinforcement after blasting, including the bending deflection and exposed height of longitudinal reinforcement, largely influenced the residual bearing capacity of the RC column. In the crushed zone, the concrete was fragmented and ejected under the blasting load, leaving only the longitudinal reinforcement to resist the axial load. The post-blast load-bearing capacity of the RC column was determined by the deformation morphology of the longitudinal reinforcement, especially its bending deflection and exposed height.
The bending deflection and exposed height of the longitudinal reinforcement are influenced by various factors, including material strength [5,13], ratio of reinforcement [10,16], weight of explosive [17], axial load [18,19], and dimensions of the RC column [8]. Fujikake [13] found that when the compressive strength of concrete increased from 50 to 90 MPa, the exposed height of longitudinal reinforcement after blasting decreased by about 40%. Yan [5] established RC columns with various ratios of longitudinal reinforcement and shear reinforcement to investigate the deformation morphology of longitudinal reinforcement after blasting. The results showed that when the ratio of longitudinal reinforcement increased from 0.78 to 1.54%, the bending deflection of longitudinal reinforcement decreased by 64%; when the ratio of shear reinforcement increased from 0.1 to 0.88%, the bending deflection of longitudinal reinforcement decreased by 67% and the exposed height of longitudinal reinforcement decreased by 18%. The weight of explosives also had a large influence on the damage to the concrete. When the weight of explosives increased by 10 times from 100 g, the damage degree increased by about 100% [17]. On the contrary, the axial load has little influence on the deformation morphology of longitudinal reinforcement after blasting [18]. In comparison, the material strength, the ratio of longitudinal reinforcement, the ratio of shear reinforcement, and the weight of explosive have significant effects on both the bending deflection and the exposed height of the longitudinal reinforcement after blasting, whereas the axial load has a minimal impact.
The bending deflection and exposed height of longitudinal reinforcement are two critical factors in calculating the residual bearing capacity of RC columns. Accurate prediction of these parameters is essential for effective blasting design. Machine learning (ML) algorithms offer a promising approach for predicting the deformation morphology of longitudinal reinforcement with high accuracy, owing to their ability to model complex nonlinear relationships and account for multiple influencing parameters [20,21,22,23,24]. When selecting an algorithm, the size of the training data should be fully considered. If the training data is limited, an ML algorithm with a simple structure should be chosen. Various ML algorithms, including artificial neural networks (ANN) [25,26,27], support vector regression (SVR) [26,27,28,29,30], and random forest (RF) [28,31], have been employed to predict the mechanical properties and deformation of RC columns and beams. Nguyen [25] adopted the ANN algorithm to predict the ultimate axial load bearing capacity of precast high-strength concrete nodular piles. The results showed that the model prediction accuracy was high, and the training and testing R2 were 0.986 and 0.972, respectively. Zhang [26] combined the SVR with a genetic optimization algorithm to predict the shear strength capacity of RC deep beams, which showed better performance than the SVR model. Asteris [28] proposed an RF model to predict the compressive strength of cement-based mortar. The training and testing R2 were both higher than 0.94. In conclusion, machine learning algorithms, especially ANN, SVR, and RF, have been widely applied to predict the mechanical properties and deformation behavior of RC columns and beams. All three algorithms have demonstrated excellent model performance in related fields, and their integration with optimization techniques can further improve model accuracy and reliability.
In this study, ANN and RF algorithms are adopted to predict the bending deflection and the exposed height of longitudinal reinforcement in RC columns after blasting. The hunter-prey optimization (HPO) algorithm is employed to optimize the hyperparameters of the models. A finite element (FE) model is established and calibrated, and 45 FE simulations are conducted by varying parameters such as the compressive strength of concrete, yield strength of longitudinal reinforcement, ratio of longitudinal reinforcement, and ratio of shear reinforcement. The resulting 45 datasets are augmented to generate a total of 225 data points in the database. Subsequently, the two ML models optimized by the HPO algorithm are trained using these two databases. Their predictive performances are evaluated and compared using mean square error (MSE), mean absolute error (MAE), and the coefficient of determination (R2). The structure of this study is organized as follows: (1) FE model simulation and database establishment, (2) introduction of intelligence algorithms, (3) intelligence model establishment and evaluation, and (4) results and discussion.

2. FE Simulation and Database Establishment

In this study, a FE model of an RC column subjected to demolition blast loading is established and simulated using LS-DYNA software (R11.0.) to investigate the post-blast deformation patterns of the longitudinal reinforcement. Firstly, the specimen dimensions and blast design of the FE model are determined based on field test data, and the simulation results are calibrated by the field test results. Subsequently, the deformation behavior of the longitudinal reinforcement after blasting is simulated under varying conditions, including different compressive strength of concrete, yield strength of longitudinal reinforcement, ratio of longitudinal reinforcement, and ratio of shear reinforcement. Finally, a dataset comprising 45 groups is compiled, and a database containing 225 groups of data is established using a data augmentation method.

2.1. The Establishment and Calibration of FE Model

The specimen dimensions and blasting design of the RC column are described as follows [15]. The RC column has a rectangular cross-section of 900 × 900 mm2 and a height of 4000 mm. The compressive strength of concrete is 40 MPa, and the elastic modulus is 32.5 GPa [32]. The spacing of the longitudinal and shear reinforcement is 120 mm and 100 mm, respectively, and the corresponding reinforcement ratios are 1.13% and 0.087%, respectively. The yield and ultimate strength of reinforcement are 335 and 455 MPa, respectively, and the elastic modulus is 200 GPa. A total of 15 blastholes are drilled and charged on the RC column with six rows as shown in Figure 1a. Each blasthole has a diameter of 32 mm. Within each row, the horizontal distances between blastholes are 200 mm and 250 mm, and the vertical spacing between rows is 300 mm. The blasthole depth is 550 mm, with a charge length of 200 mm and a stemming length of 350 mm. The weight of emulsion explosive in each blasthole is equal, and the total emulsion explosive weight is 3300 g. All blastholes are detonated simultaneously.
As shown in Figure 1b, 8-node brick solid elements are used to model the concrete and stemming, while 2-node beam elements are employed for the longitudinal and shear reinforcement. Three element sizes are used for the concrete: (1) 1 × 1 × 1 mm elements are used near the blasthole; (2) 20 × 20 × 20 mm elements are used in the charging area; (3) 20 × 20 × 40 mm elements are used outside the charging area. The element size of stemming is 1 × 1 × 1 mm, while the element size of reinforcement is 10 × 10 × 10 mm. The explosive and surrounding air are also modeled, with the solid and fluid domains coupled using the keyword *CONSTRAINED_LAGRANGE_IN_SOLID.
The RHT constitutive model [33,34] is used to simulate the dynamic response of both concrete and stemming materials under demolition blast loading. In the RHT constitutive model, by defining failure surface, yield surface, and residual surfaces, the model effectively reflects the failure characteristics of concrete under various stress conditions. Concrete damage is described by a unified damage variable that evolves with the accumulation of plastic strain during loading. The density of the concrete is 2.40 g/cm3, with a quasi-static compressive strength of 40 MPa. The ratio of tensile strength and compressive strength is 0.1. The elastic modulus is 32.5 GPa, while the Poisson ratio is 0.2. Other material parameters for concrete in the RHT model are referenced from Refs. [32,33,34]. The stemming material has a density of 2.20 g/cm3, a quasi-static compressive strength of 20 MPa, and a shear modulus of 0.15 GPa [35]. All other parameters of the stemming material are assumed to be identical to those of the concrete. The longitudinal and shear reinforcements are modeled using a bilinear elastic-plastic material model. The parameters for longitudinal reinforcement are as follows [36]: the density is 7.85 g/cm3, the elastic and tangent modulus are 200 and 2 GPa, respectively, the Poisson’s ratio is 0.3, the yield strength is 335 MPa, and the effective plastic strain for eroding elements is 0.14. For the shear reinforcement, all parameters are the same as those of the longitudinal reinforcement, except for the yield strength and the effective plastic strain for eroding elements, which are set to 235 MPa and 0.10, respectively [32]. The detonation of the explosive is modeled using the *MAT_HIGH_EXPLOSIVE_BURN constitutive model, coupled with the equation of state (EOS) of Jones-Wilkins-Lee (JWL). The emulsion explosive has the following properties [37]: the density of explosive is 1.37 g/cm3, the velocity of detonation is 5500 m/s, and the Chapman-Jouget (CJ) pressure is 9 GPa. Air is modeled using *MAT_NULL in combination with a linear polynomial EOS. The density of air is 1.29 × 10⁻³ g/cm3, and the ratio of specific heats is 1.4 [35].
The concrete damage, bending deflection D, and exposed height H of the longitudinal reinforcement are obtained through numerical simulations, as shown in Figure 2. Figure 2a shows the macroscopic failure pattern of the RC column observed in the field test [15]. The field test settings are consistent with the numerical simulations, and the specific parameters can be found in reference [15]. The concrete near the charge position is severely damaged, with most fragments ejected and some confined within the reinforcement cage. The longitudinal reinforcement is bent and exposed outside the RC column, and the shear reinforcement is also destroyed. In the crushed zone, the concrete lost its load-bearing capacity, leaving only the longitudinal reinforcement to support the gravity from the top of the column. Figure 2b,c show the post-blast deformation patterns of concrete and reinforcement as obtained from the FE simulation. As the concrete fractured and lost its confinement effect, the longitudinal reinforcement experienced bending deflection. The deformation morphology of reinforcement observed in the FE simulation closely resembled that in the field test, demonstrating good agreement between simulation and test results.
The values of D and H for the longitudinal reinforcement after blasting are shown in Figure 3. The results show that the relative error of D between the test and the numerical simulation is approximately 10%, while that of H is about 2%. Both the macroscopic failure mode of the RC column and the values of D and H for the longitudinal reinforcement demonstrate good agreement between the field test and the numerical simulation. Therefore, the development of the FE model, the selection of material parameters, and the overall modelling approach adopted in this study are appropriate for simulating both the deformation morphology of the longitudinal reinforcement and the dynamic response of RC columns under demolition blasting.

2.2. Numerical Simulation of the Post-Blast Deformation Morphology of Longitudinal Reinforcement

Based on the above analysis and discussion, the main factors influencing the post-blast deformation morphology of longitudinal reinforcement are the material strength and the ratio of reinforcement. To comprehensively investigate the D and H of the longitudinal reinforcement after blasting, a series of FE models are established and simulated under varying conditions. Specifically, the parameters considered include the compressive strength of concrete (40, 60, and 80 MPa), the yield strength of longitudinal reinforcement (335, 400, and 500 MPa), the ratio of longitudinal reinforcement (0.75, 1.13, and 1.50%) and the ratio of shear reinforcement (0.087, 0.175, and 0.349%). In addition, the specimen dimensions, blasthole drilling scheme, total weight of explosive, and boundary conditions of the FE models are kept consistent with the calibrated model described earlier. The elastic modulus of concrete and the spacing of reinforcement are adjusted in accordance with changes in the strength of concrete and the ratio of reinforcement, respectively. By combining the four parameters, a total of 45 FE models of RC columns are developed and simulated to collect data on the post-blast deformation characteristics (D and H) of longitudinal reinforcement, as shown in Table 1.

2.3. Data Collection and Database Establishment

Following the FE simulation, 45 sets of data are collected, including the specimen dimensions of the RC columns, mechanical properties of the materials, blasting design parameters, explosive parameters, and the D and H of the longitudinal reinforcement. Prior to constructing the database, the input parameters needed to be clearly defined. Since the specimen dimensions are identical across all simulations, the length, width, and height of the RC columns are excluded as input variables. The ratios of longitudinal and shear reinforcement have a significant influence on the deformation morphology of the longitudinal reinforcement after blasting [5,13] and thus are selected as key input parameters. The spacing and the cross-sectional area of the reinforcement could be derived from the reinforcement ratios, so they are not treated as independent inputs. The compressive strength of concrete is a critical parameter that characterizes its mechanical behavior, and the yield strength of the longitudinal reinforcement is similarly important. Other mechanical parameters of concrete, such as the elastic modulus, are correlated with compressive strength [38] and are thus omitted to avoid redundancy. Additionally, since the blasting design and explosive parameters are kept consistent in this study, they are also excluded from the input parameters.
In summary, the selected input parameters are compressive strength of concrete (FC), the yield strength of longitudinal reinforcement (FR), the ratio of longitudinal reinforcement (RL), and the ratio of shear reinforcement (RS). The output parameters are the bending deflection (D) and exposed height (H) of the longitudinal reinforcement after demolition blasting. Accordingly, a database with a dimensionality of 45 × 6 is established. To mitigate the influence of varying magnitudes across different variables on model performance [39,40], all data are normalized according to Equation (1).
X ij = x ij x min i x max i x min i
where Xij and xij are the values of the data after and before normalization, and xmax(i) and xmin(i) are the maximum and minimum values of the ith parameter.
To improve the robustness of the ML model established in this study, a data augmentation method is adopted to expand the size of the dataset [41,42]. Random noise, following a normal distribution and with an amplitude less than 1% of the parameter values, is added to the data [41,43,44]. Considering the model structure and training efficiency, the dataset is augmented five times, resulting in a total of 225 data samples. The distribution of each parameter within the dataset is shown in Figure 4. The dataset is randomly split into two subsets: 70% of the data is used for training the model, while the remaining 30% is used for testing purposes [45].

3. Intelligence Algorithms

3.1. ANN Algorithm

The ANN algorithm is widely used in engineering prediction tasks due to its strong nonlinearity and powerful fitting ability [46]. An ANN typically consists of three types of layers: the input layer, the hidden layer, and the output layer. The input and output layers usually contain a single layer, while the hidden layer may comprise multiple layers [47]. Neurons are the fundamental units within each layer, and they are interconnected between adjacent layers. Each neuron can be regarded as a linear function with a single variable. It receives data from the previous layer and processes the data by the weight and bias of the function. The processed data is then passed through a transfer function, which improves the nonlinear characteristics of the model [48]. The main objective of ANN training is to adjust the weights and biases of the neurons to ensure that the predicted output closely matches the target output in the dataset [25]. The structure of the ANN is shown in Figure 5.
In this study, an ANN algorithm is used to predict the D and H of longitudinal reinforcement after demolition blasting. Four parameters are selected as inputs to the ANN model, including FC, FR, RL, and RS. The D and H are the output parameters of the model. Accordingly, the input and output layers of the ANN consisted of four and two neurons, respectively.

3.2. RF Algorithm

The RF algorithm is an ensemble learning model based on the bagging strategy [49], consisting of multiple independent decision trees. Once the input training data are provided, individual decision trees are constructed and trained using random subsamples, thereby reducing the risk of overfitting. The RF algorithm then combines the predictions from these multiple decision trees, either by averaging or applying weights, to obtain the final regression result.
The detailed regression process of the RF algorithm is outlined as follows [31,49]: (1) Establishing the subsample sets. A subset of samples is selected to form a subsample set. Each decision tree in the RF algorithm is trained on a different subsample set, increasing the variety within the RF model. (2) Random feature selection. At each node of the decision tree, only some of the randomly chosen features are evaluated when determining the optimal feature. This approach helps prevent any single feature from dominating the RF model, thereby enhancing the overall robustness of the model. (3) Construction of decision trees. The decision tree is constructed on each subsample set. Each decision tree is built using its respective subsample set. During the growth of the trees, the best feature is chosen recursively to partition the data into subsets with the least impurity. (4) Ensemble prediction: The final regression result is obtained by averaging or weighting the predictions from individual decision trees. The RF algorithm’s ability to train multiple trees on different subsamples and random feature subsets makes it highly resistant to overfitting while maintaining strong predictive performance. A visual representation of the RF model structure is shown in Figure 6.
In the RF algorithm, four key hyperparameters help control model complexity and generalization: (1) The maximum depth parameter limits the number of levels in each decision tree. Deeper trees can capture more complex patterns but are prone to overfitting, while shallower trees tend to generalize better. (2) Number of decision trees. The number of trees in the ensemble determines its overall size. A large number of trees improves prediction stability and reduces variance, but increases computational cost. (3) Minimum samples to split a node. This defines the minimum number of samples required to split an internal node. Higher values restrict tree growth and help mitigate overfitting. (4) Minimum samples at a leaf node. This controls the minimum number of samples required to form a leaf. Larger leaf sizes simplify the model and may reduce the risk of overfitting. Proper hyperparameter tuning ensures a balance between model accuracy and generalization performance.

3.3. HPO Algorithm

The HPO algorithm is a swarm intelligence algorithm proposed by Naruei [50], inspired by the natural interactions between hunters and prey. It simulates the dynamic strategies of both groups: hunters focus on tracking and capturing prey, while prey engage in food searching and evasive maneuvers to avoid predation. This dual-behavior mechanism effectively balances exploration and exploitation, making HPO a powerful optimization tool.
(1)
Hunter behavior: initially, hunters move randomly within the search space to explore potential solutions. As optimization progresses, hunters adaptively adjust their movement and gradually converge toward prey. Although the prey population is typically dispersed, hunters strategically identify outlier prey—those positioned farthest from the population’s average location—as primary targets. Once a target is identified, hunters actively pursue and attack it, mimicking the convergence toward optimal solutions. The hunter search mechanism is given by Equation (2):
y m , n x + 1 = y m , n x + 0.5 2 C Z P pre y m , n x + 2 1 C Z μ y m , n x
where ym,n(x) and ym,n(x + 1) are the current and next position of hunters, respectively; C is the balance parameter, which decreases from 1 to 0.02 over the iterations; Z is an adaptive parameter; Ppre denotes the prey position; and μ signifies the mean population position of all prey.
(2)
Prey behavior: before detecting hunters, prey moves randomly in search of food, exploring different regions of the solution space. Upon sensing the presence of hunters, prey respond collectively by fleeing toward safer locations, which are defined as the points farthest from hunters [51]. This escape mechanism enhances solution diversity and prevents premature convergence by maintaining a wide search distribution. The updated position of the prey is shown in Equation (3).
y m , n x + 1 = P opt + C Z cos 2 π R × P opt y m , n x
where Popt represents the optimal position, and R is a random coefficient. The adjusting parameter of β is set as 0.1 [50].

4. Intelligence Model Establishment and Evaluation

4.1. Model Establishment

The predictive performance of the ML model can be improved by combining it with swarm-based optimization algorithms [26,52]. In this study, the ANN and RF models are optimized using the HPO algorithm to enhance model performance. In the ANN algorithm, the number of neurons in each hidden layer greatly influences the model’s predictive performance [53,54]. The HPO-ANN model is established with four hidden layers [55], and the number of neurons in each hidden layer is treated as an optimization object. During each iteration of training, the batch size is set to 1, and the number of training iterations is set to 40 based on a trial-and-error method. The maximum depth, the number of decision trees, the minimum number of samples required to split an internal node, and the minimum samples required at a leaf node are four important hyperparameters in the RF algorithm [31,49], which are the optimization objects in the HPO-RF model. In addition, the swarm size and number of iterations in the HPO algorithm are set to 5 and 40, respectively, to balance training efficiency and predictive performance [46,56].
To investigate the influence of model algorithms and database scale on model performance, four ML models are developed to predict the D and H of longitudinal reinforcement after demolition blasting, as listed in Table 2.

4.2. Evaluation Indices

In this study, three mathematical indices, including the MSE, MAE, and R2, used to evaluate the model performance, are calculated by Equation (4).
MSE = 1 T j = 1 T y j m j 2
MAE = 1 T j = 1 T y j m j m j
R 2 = 1 i = 1 T y j m j 2 i = 1 T y j n j 2
where yj is the output data in the database, mj is the model output, nj is the mean values of D and H, respectively, and T represents the number of data groups. The model performance can be evaluated by comprehensively comparing the MSE, MAE, and R2.

5. Results and Discussion

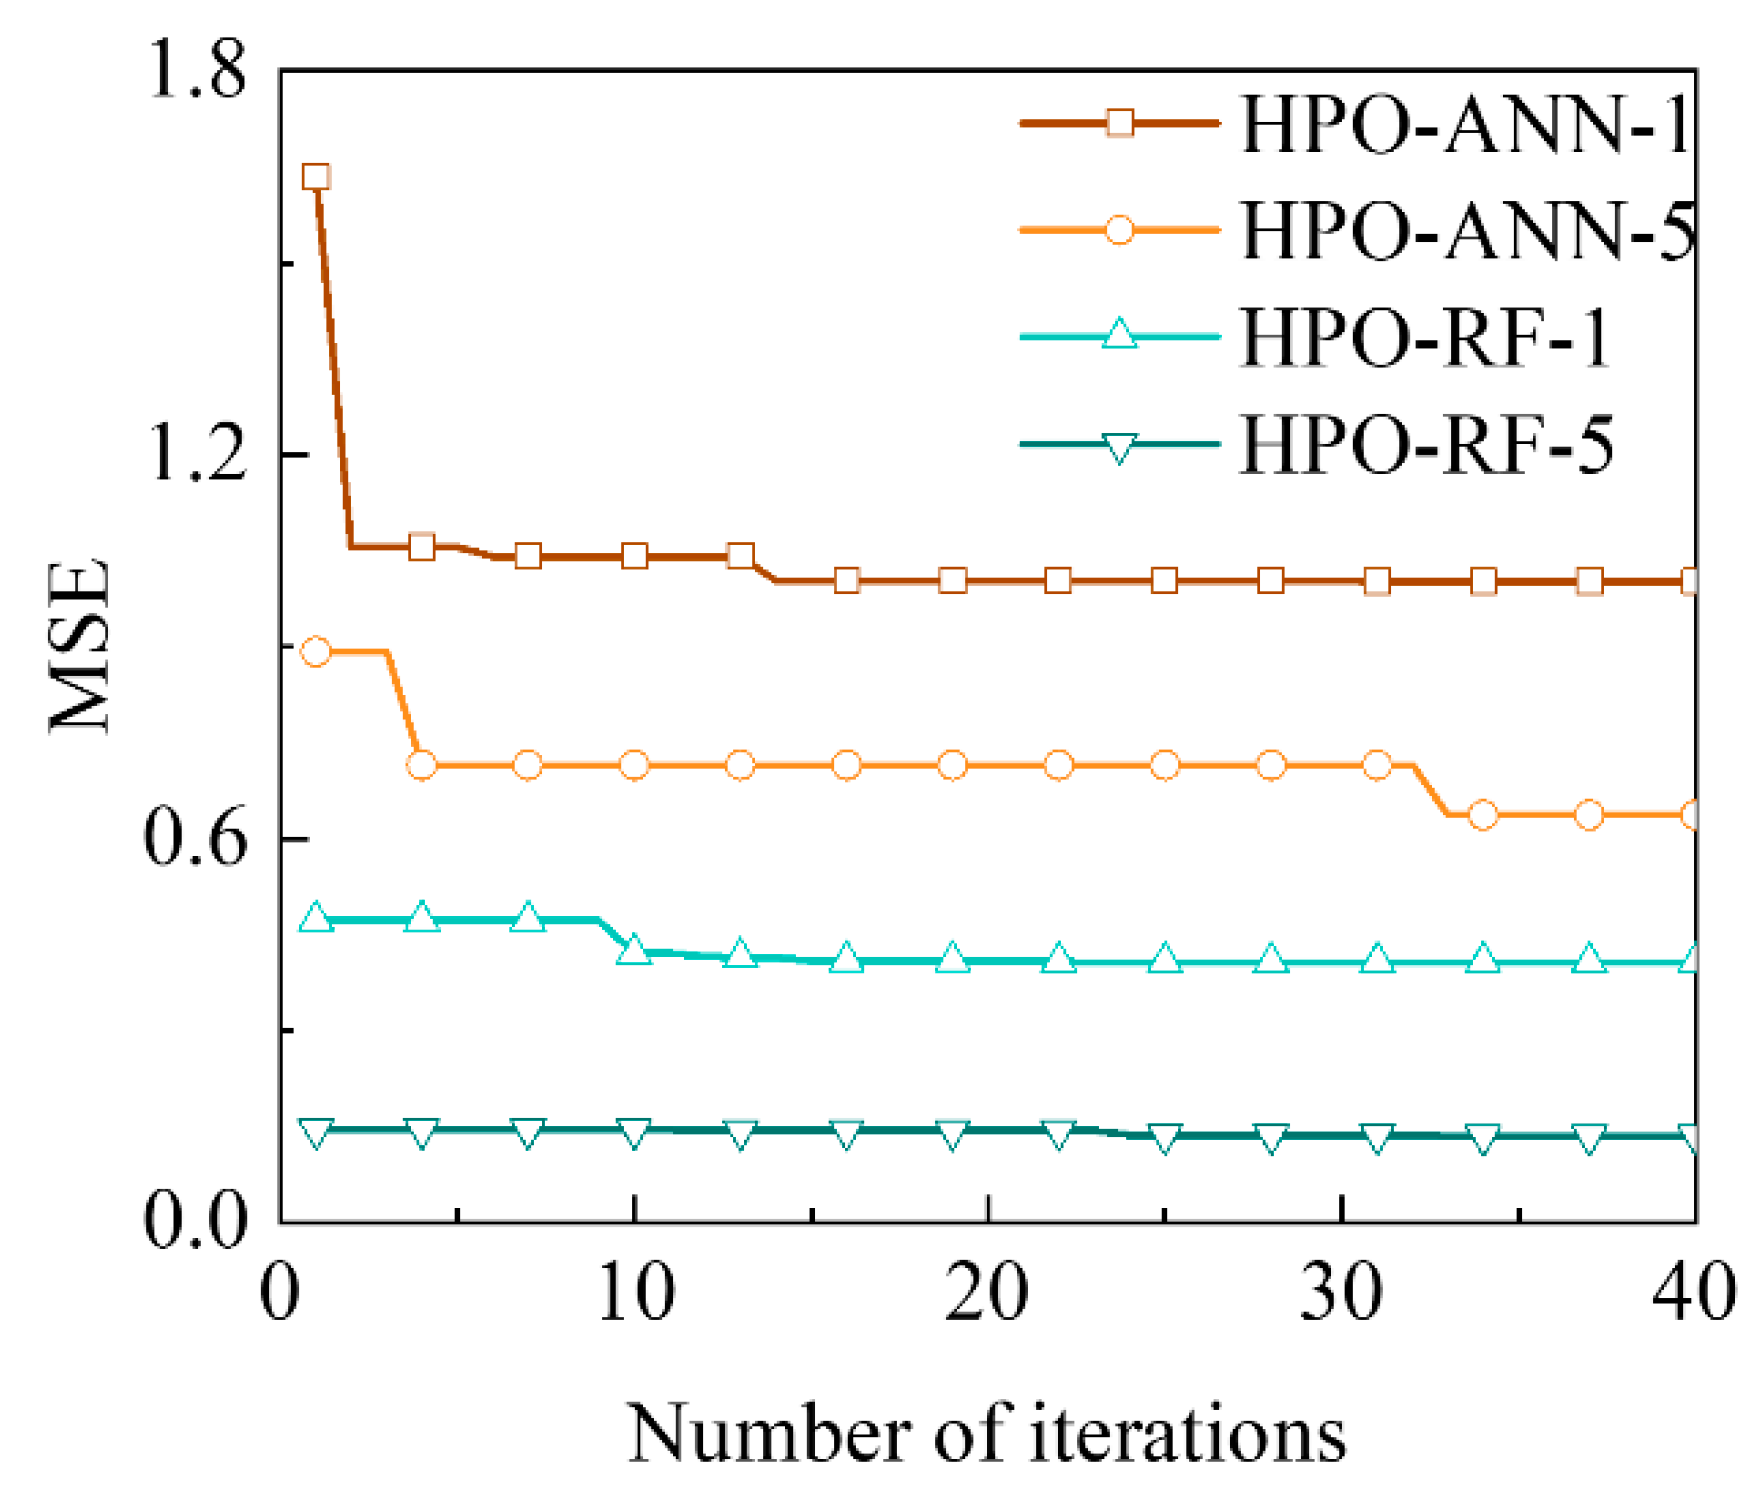
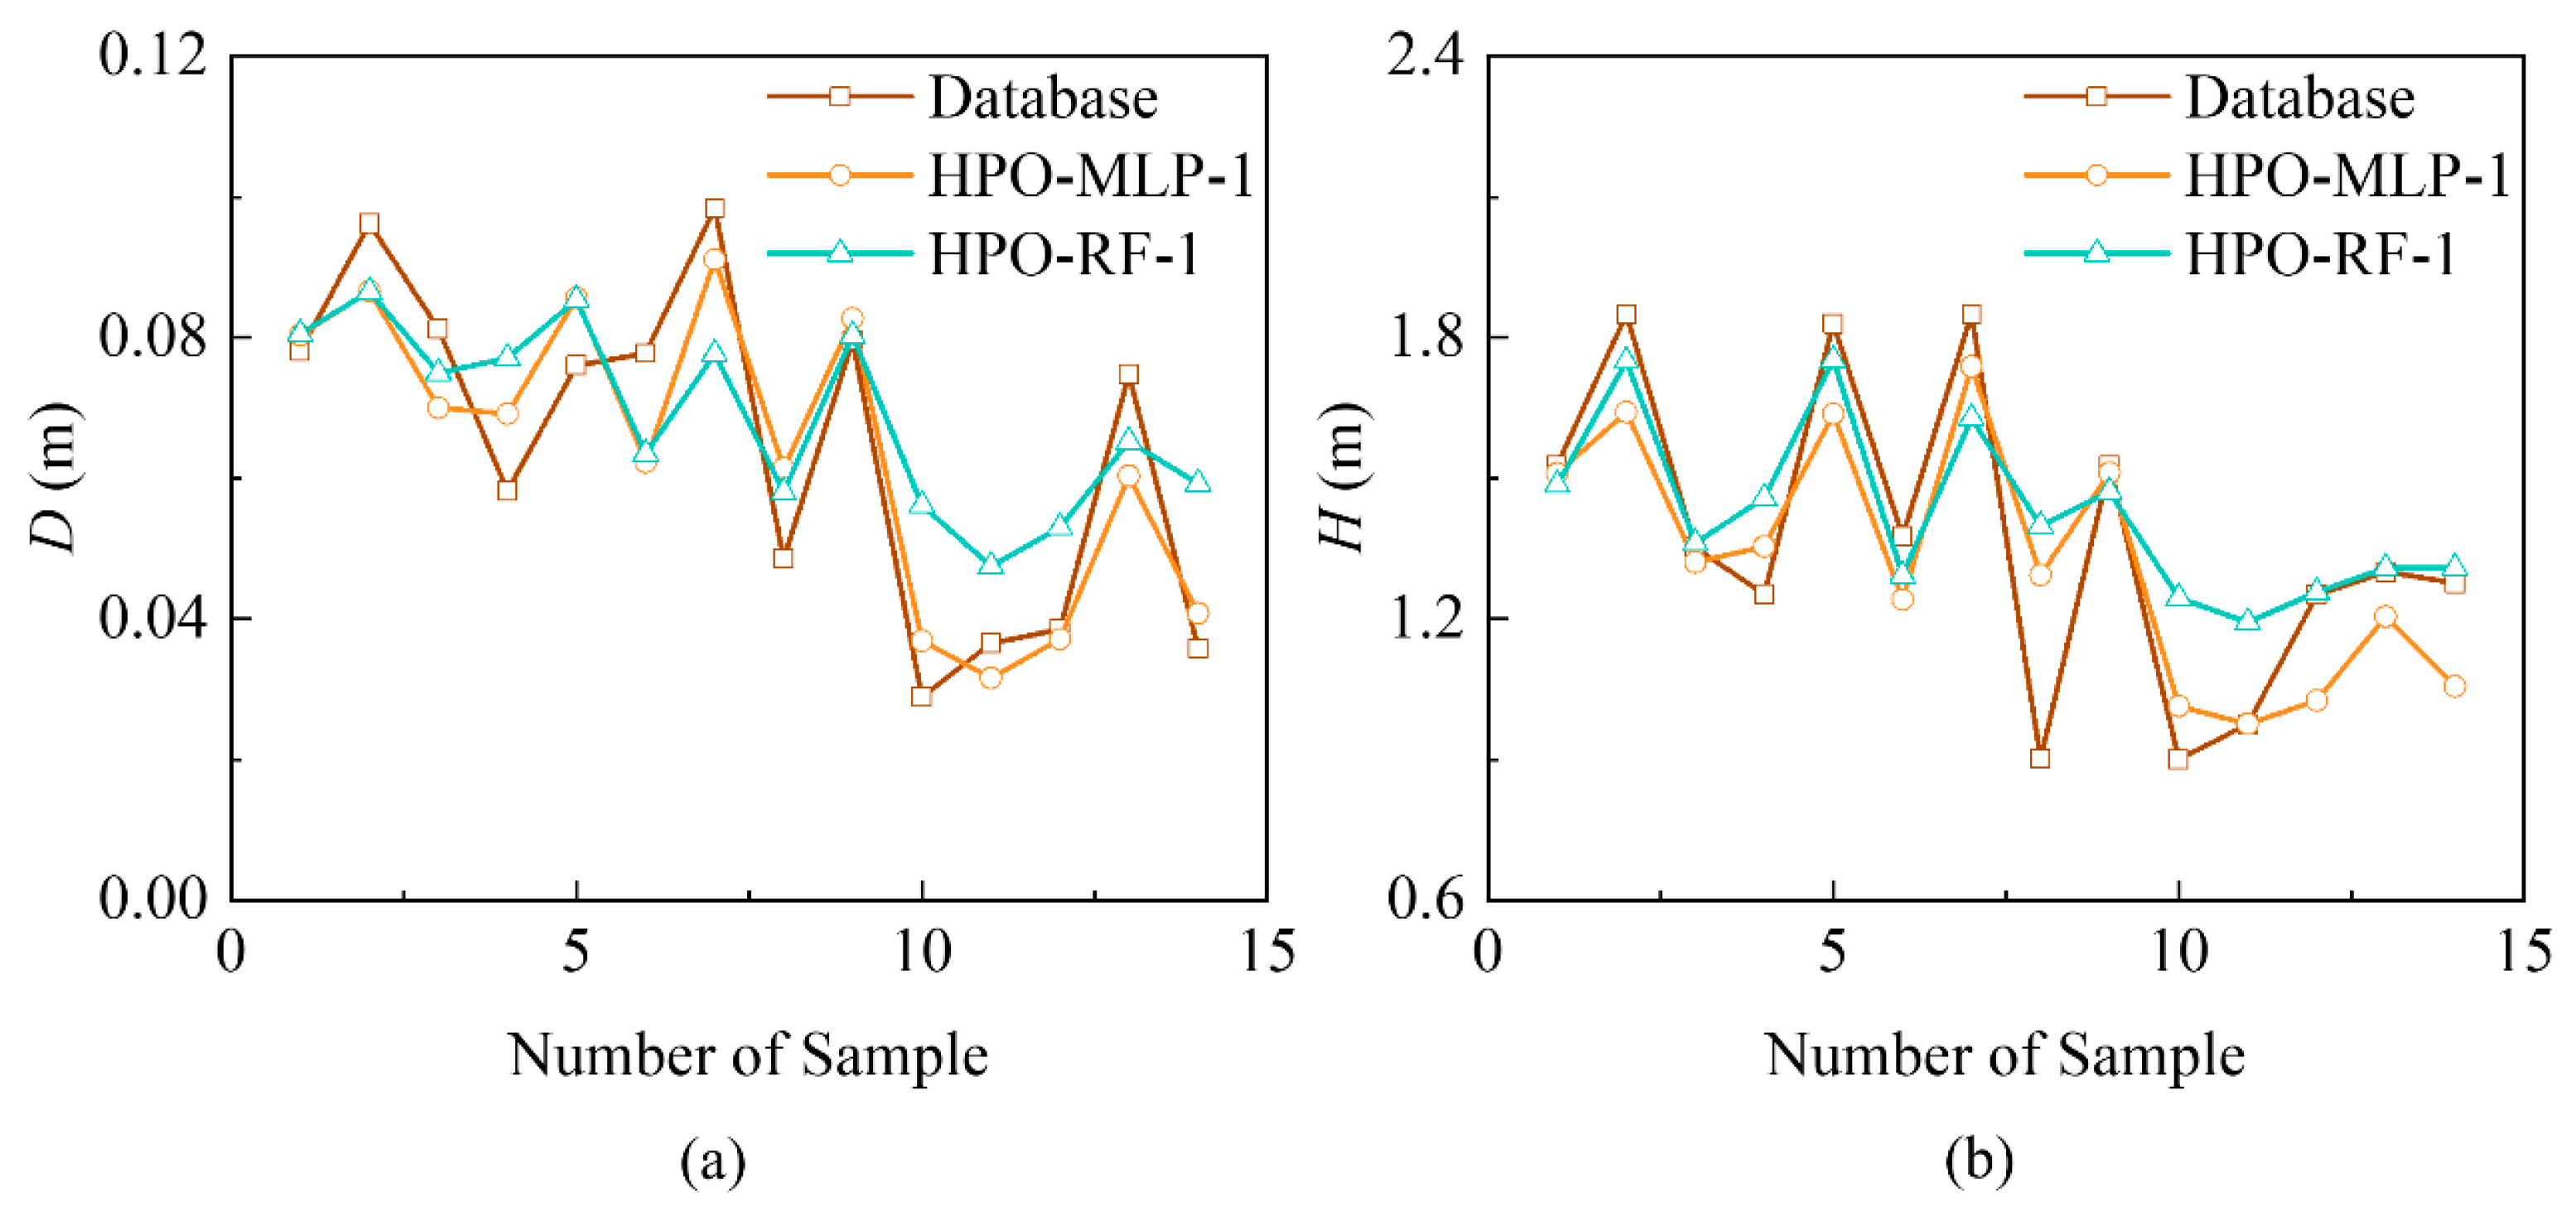
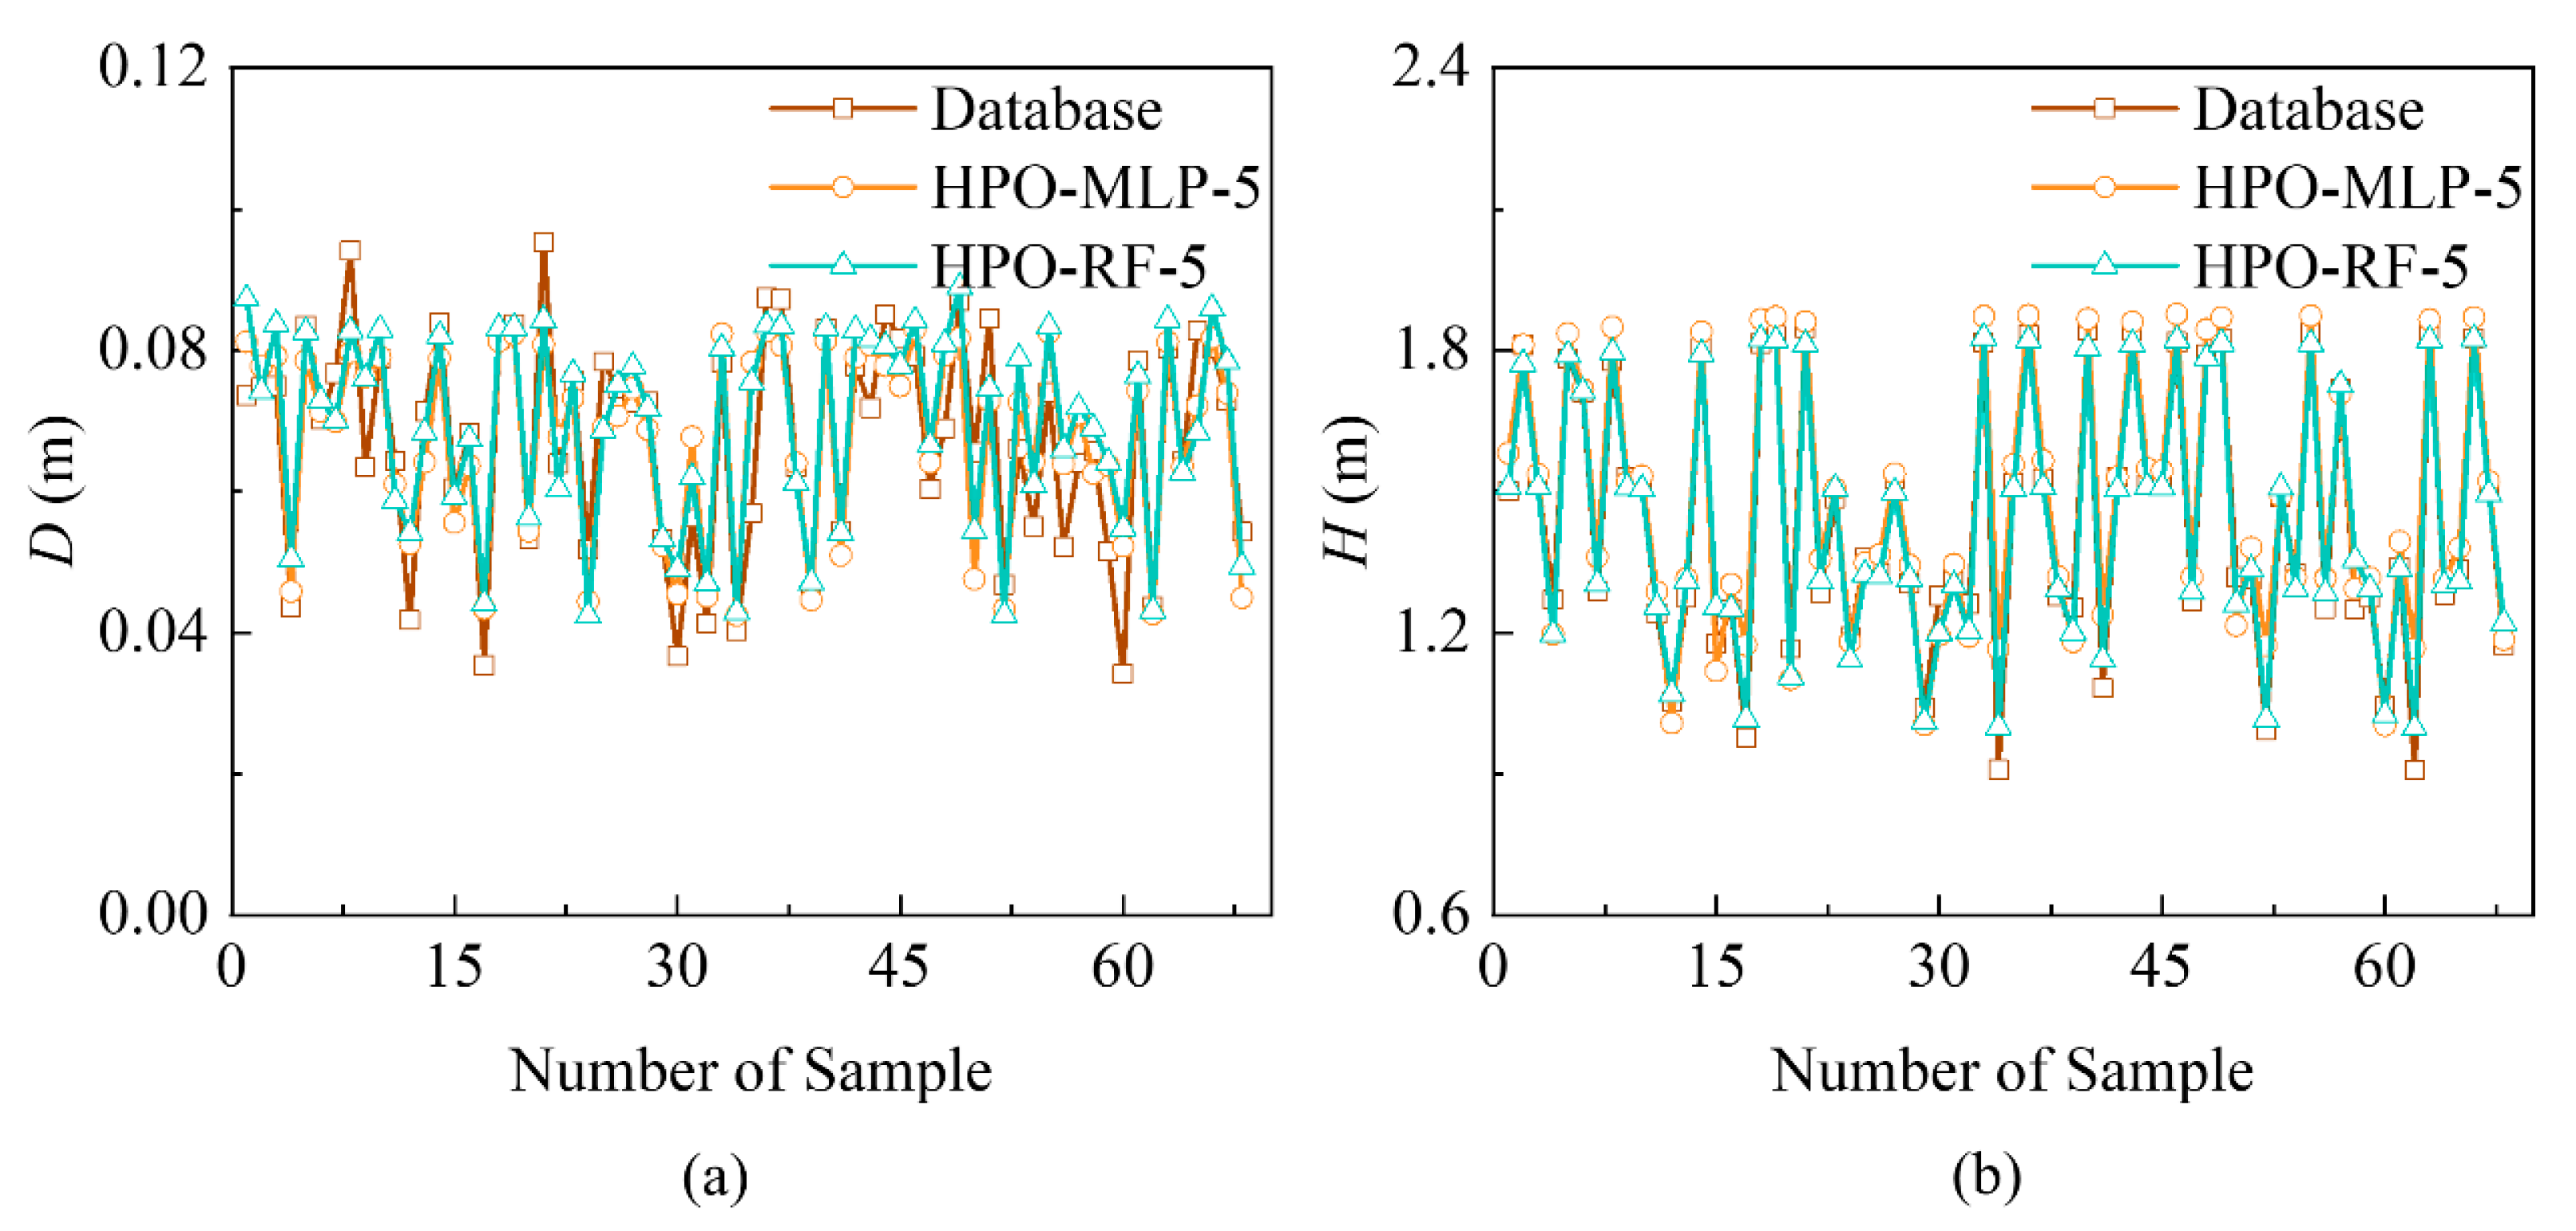
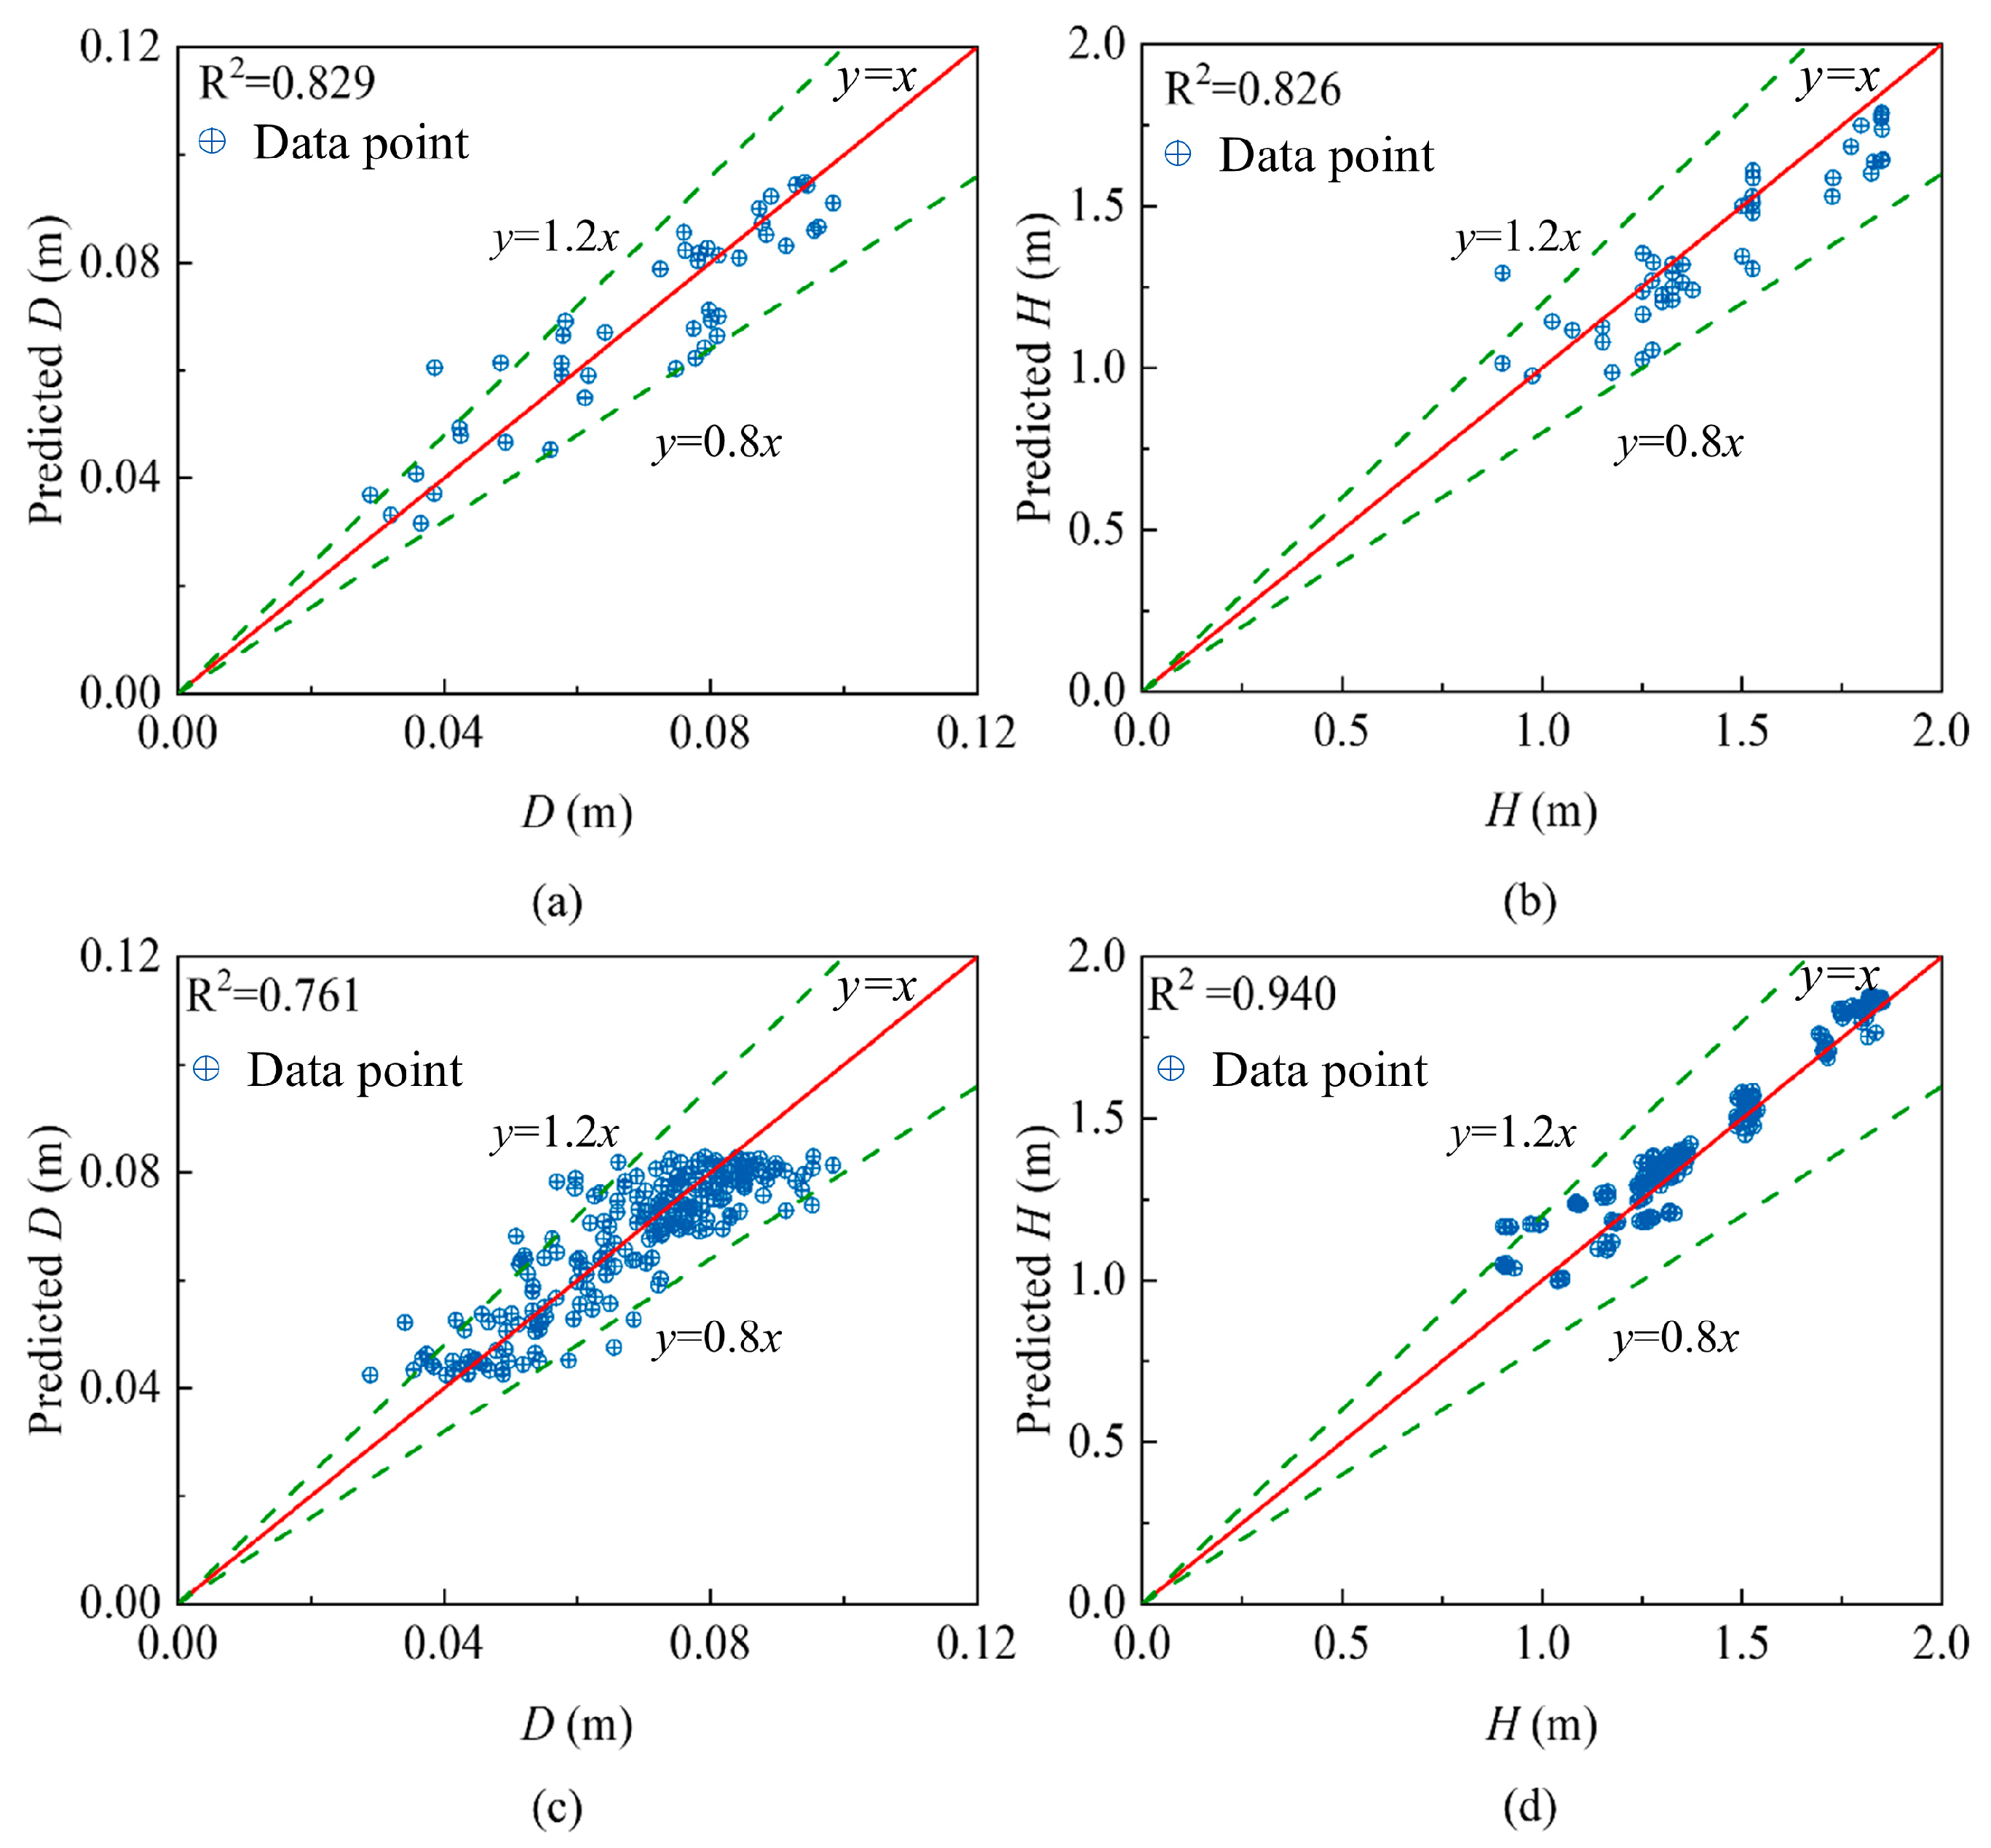
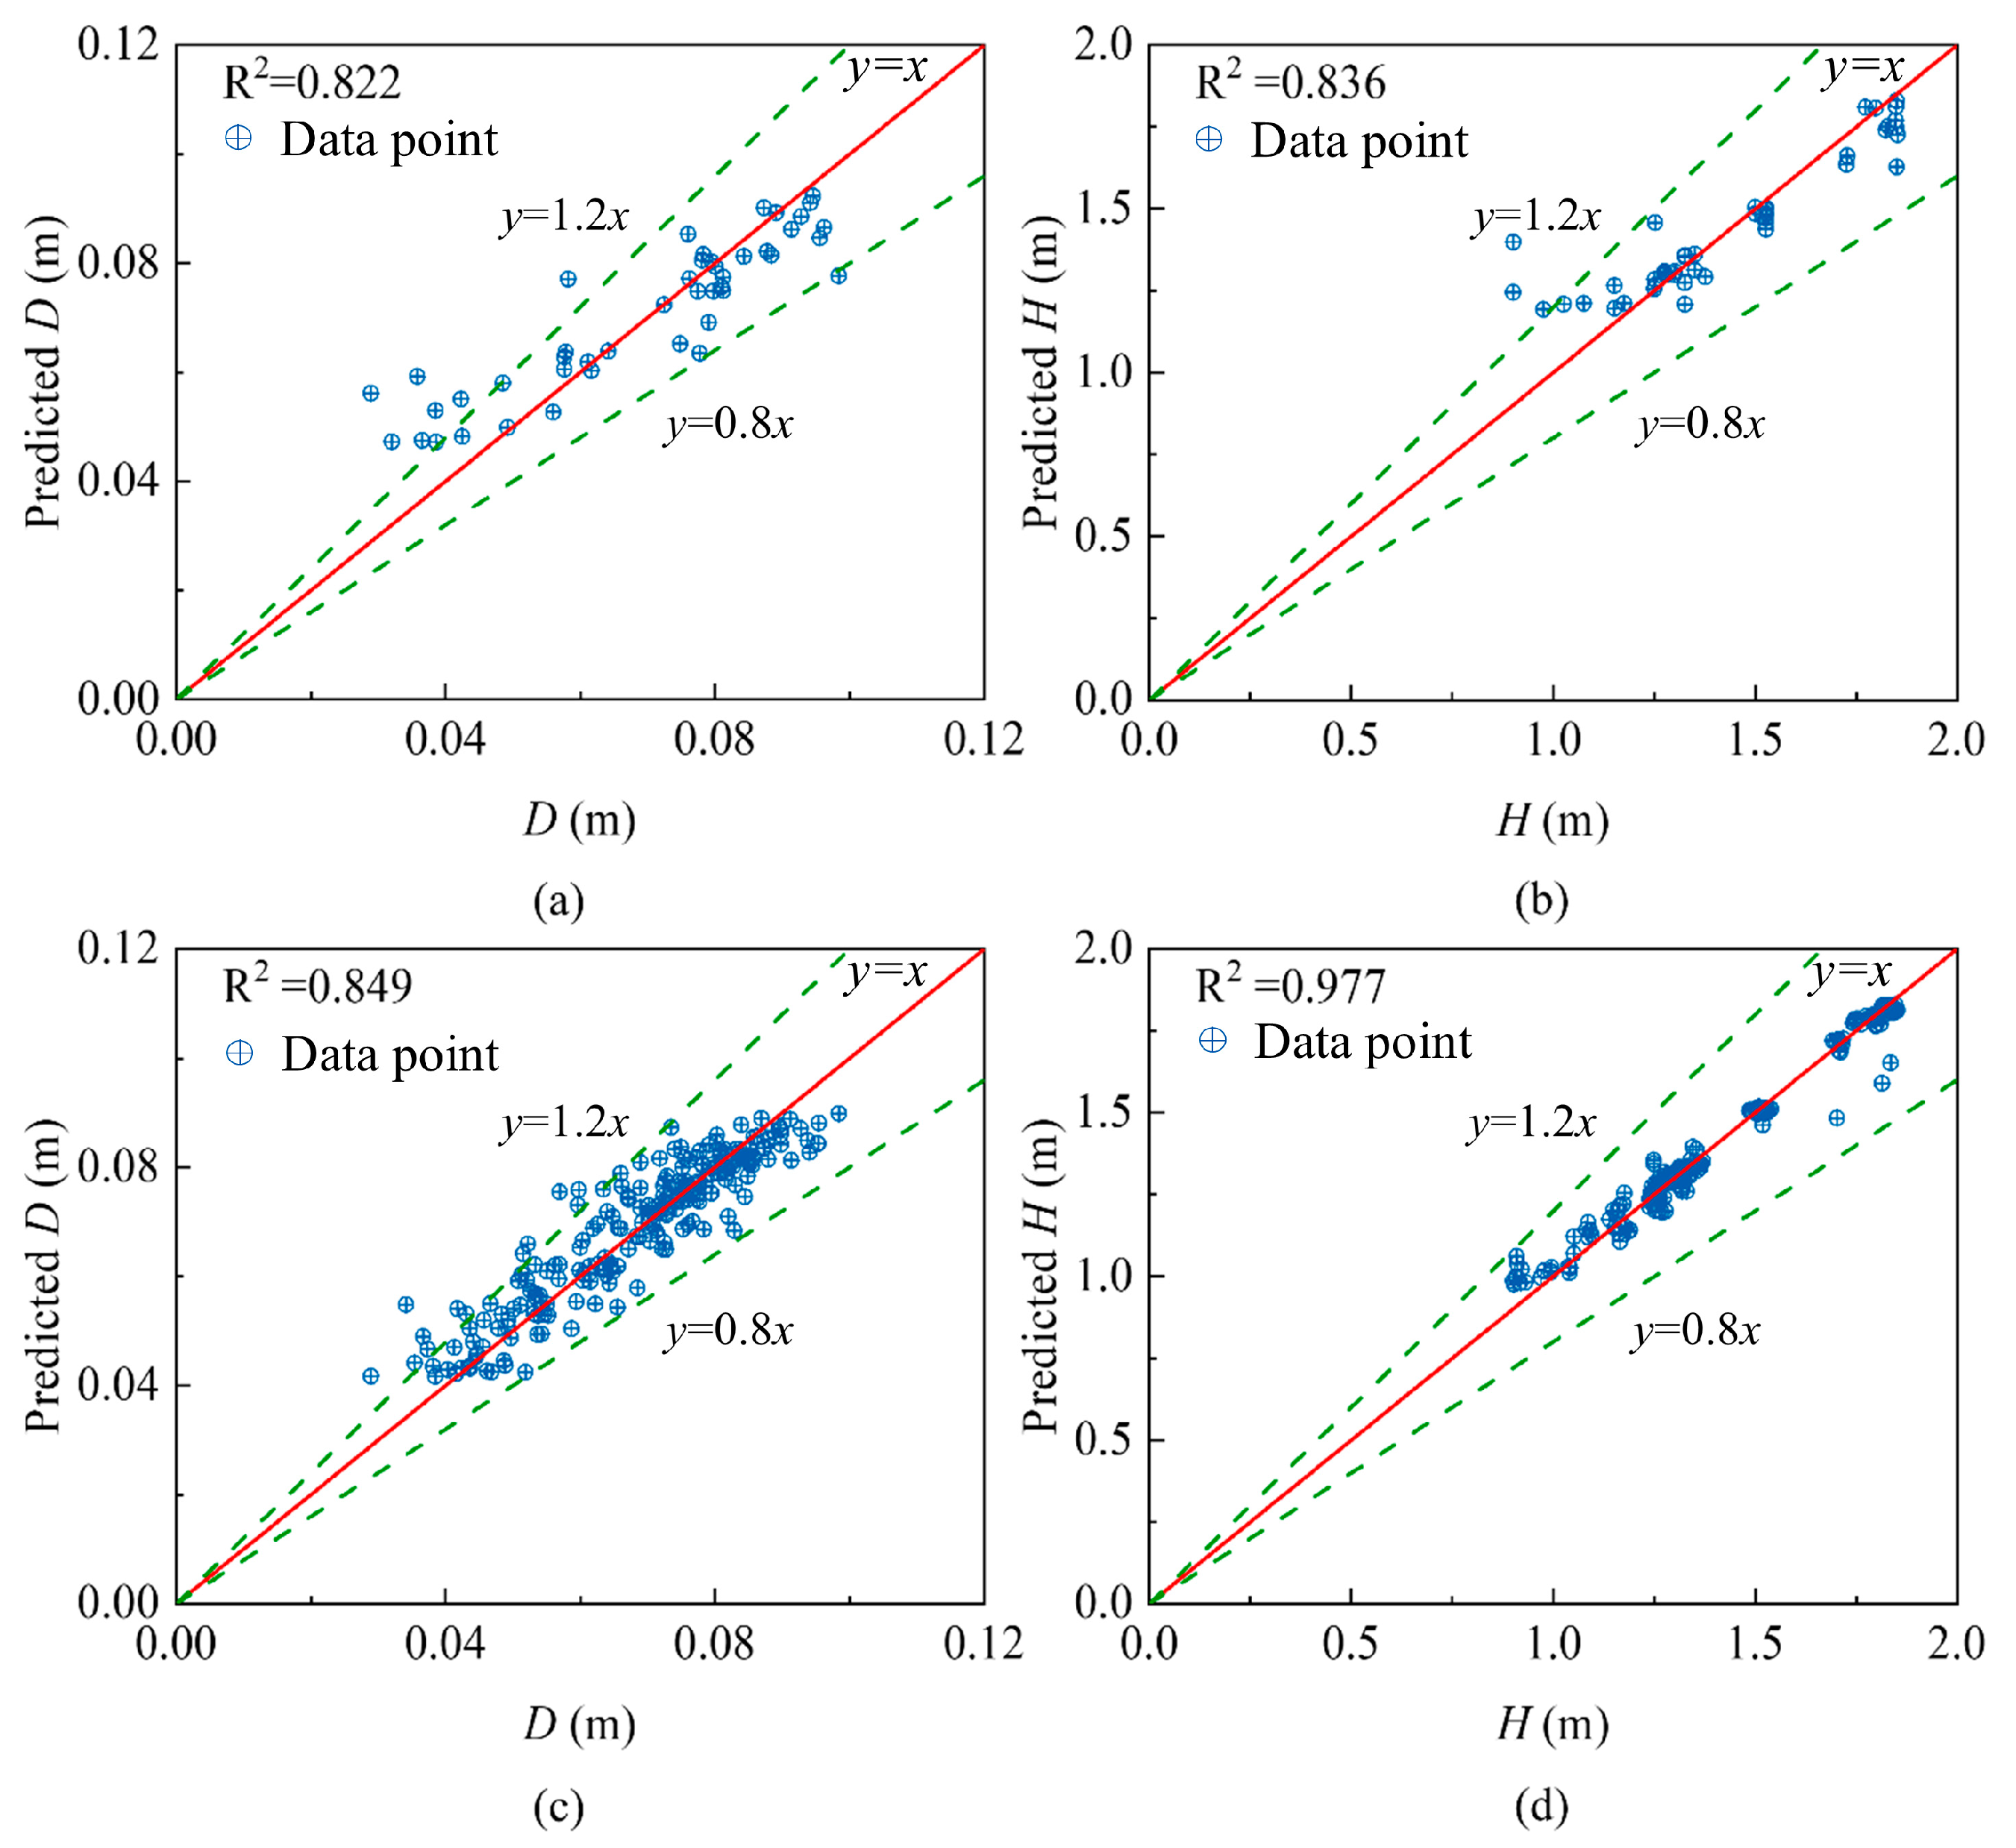
5.1. Performance of Intelligence Models

Swarm-based optimization algorithms are useful for tuning the hyperparameters of ML models, which may improve their predictive performance. The optimization processes of the four intelligence models are shown in Figure 7. As the number of optimization iterations increases, the MSE of all four models decreases gradually. A lower MSE indicates a better optimization result. Among the four models, the HPO-RF-5 model achieves the lowest MSE value of 0.135. In contrast, the HPO-ANN-1 model yields the highest MSE of 1.001 after 40 optimization iterations, indicating the poorest optimization performance. This may be due to the model being trapped in a local optimum during the optimization process. Based on the optimization results, the performance ranking of the models from best to worst is as follows: HPO-RF-5, HPO-RF-1, HPO-ANN-5, and HPO-ANN-1.
After model optimization and training, the predictive performance of the four intelligent models is evaluated. The predictions of D and H based on 45 groups of data are shown in Figure 8. Figure 8a shows that the D predicted by HPO-ANN-1 has higher accuracy than that predicted by HPO-RF-1. Specifically, when the value of D is less than 0.04 m, the prediction accuracy of HPO-RF-1 is significantly lower than that of HPO-ANN-1. In Figure 8b, the prediction accuracy of H also shows similar results. When the value of H is below 1.2 m, the accuracy of HPO-RF-1 is lower than that of HPO-ANN-1. In general, HPO-ANN-1 performs better than HPO-RF-1 in predicting both D and H.
Figure 9 shows the predicted value of D and H by intelligent models based on 225 groups of data. Figure 9a shows that the predicted D values from HPO-ANN-5 and HPO-RF-5 have similar prediction accuracy. The predictions from both models tend to exhibit large relative errors when the value of D is either too large or too small. This is because the values of D are sparsely distributed in the database within this range, as shown in Figure 4. The predicted H values from HPO-ANN-5 and HPO-RF-5 have high accuracy, and almost all predicted results are close to the actual values in the database, as shown in Figure 9b. By comparing the predictive performance of intelligent models trained on databases of different sizes, such as the H predicted by HPO-RF-1 in Figure 8b and by HPO-RF-5 in Figure 9b, the necessity of data augmentation is demonstrated.
Figure 10 shows the R2 values of D and H predicted by the HPO-ANN models. Figure 10a,c show that the R2 of D decreases to 0.761 due to the increased number of data points in the database. This may be caused by noise introduced during data augmentation. For H prediction, the R2 increases significantly from 0.826 to 0.940, as shown in Figure 10b,d. Most predicted values of H by the HPO-ANN-5 model are close to the ideal values due to the increased number of data points in the database.
Figure 11 shows the R2 values of D and H predicted by the HPO-RF models. Both the predicted R2 values of D and H increase after data augmentation. The R2 of D predicted by the HPO-RF-5 increases by 3.28% compared to the HPO-RF-1. The R2 of H predicted by the HPO-RF-5 is 0.977, the highest among all models. The noise added to the database needs to be carefully controlled, as it can improve the robustness of the ML model (as shown in Figure 10d and Figure 11c,d), but may also reduce model performance (as shown in Figure 10c) [57].
In summary, the HPO algorithm facilitates efficient hyperparameter tuning for ML models to improve model performance. The data augmentation method used in this study effectively improves model performance, as shown in Figure 10c and Figure 11c,d. Meanwhile, the amplitude of noise during data augmentation needs to be carefully set to minimize the negative influence of large noise on model performance, as shown in Figure 10c. In addition, HPO exhibits different capabilities in optimizing the ANN and RF algorithms. In this study, the HPO-RF achieves a higher R2 than the HPO-ANN, especially when the models are trained with 225 groups of data.

5.2. Comprehensive Evaluation of Intelligent Models

In this study, three statistical indices—MSE, MAE, and R2—are used to comprehensively evaluate model performance during training and testing. When the values of MSE and MAE are close to 0, and R2 is close to 1, the model is considered to achieve optimal performance. Each index for the four models is scored based on its value. A higher score corresponds to better model performance. The comprehensive evaluation of the four models is listed in Table 3. The HPO-RF-5 model achieves the highest score among the four models, with MSE, MAE, and R2 values of 0.004, 0.041, and 0.931 in the training dataset, and 0.007, 0.057, and 0.865 in the testing datasets. All indices for this model show the best performance in both the training and testing datasets. In contrast, the HPO-MLP-1 model receives the lowest score in the training evaluation and the second lowest in testing, indicating that it is underfitting. Although the HPO-RF-1 model performs well in the training dataset, it performs the worst in the testing dataset, suggesting that it suffers from overfitting. In addition, regardless of whether the algorithm is ANN or RF, models trained on larger datasets tend to show better predictive performance. This further highlights the necessity of data augmentation in this study.

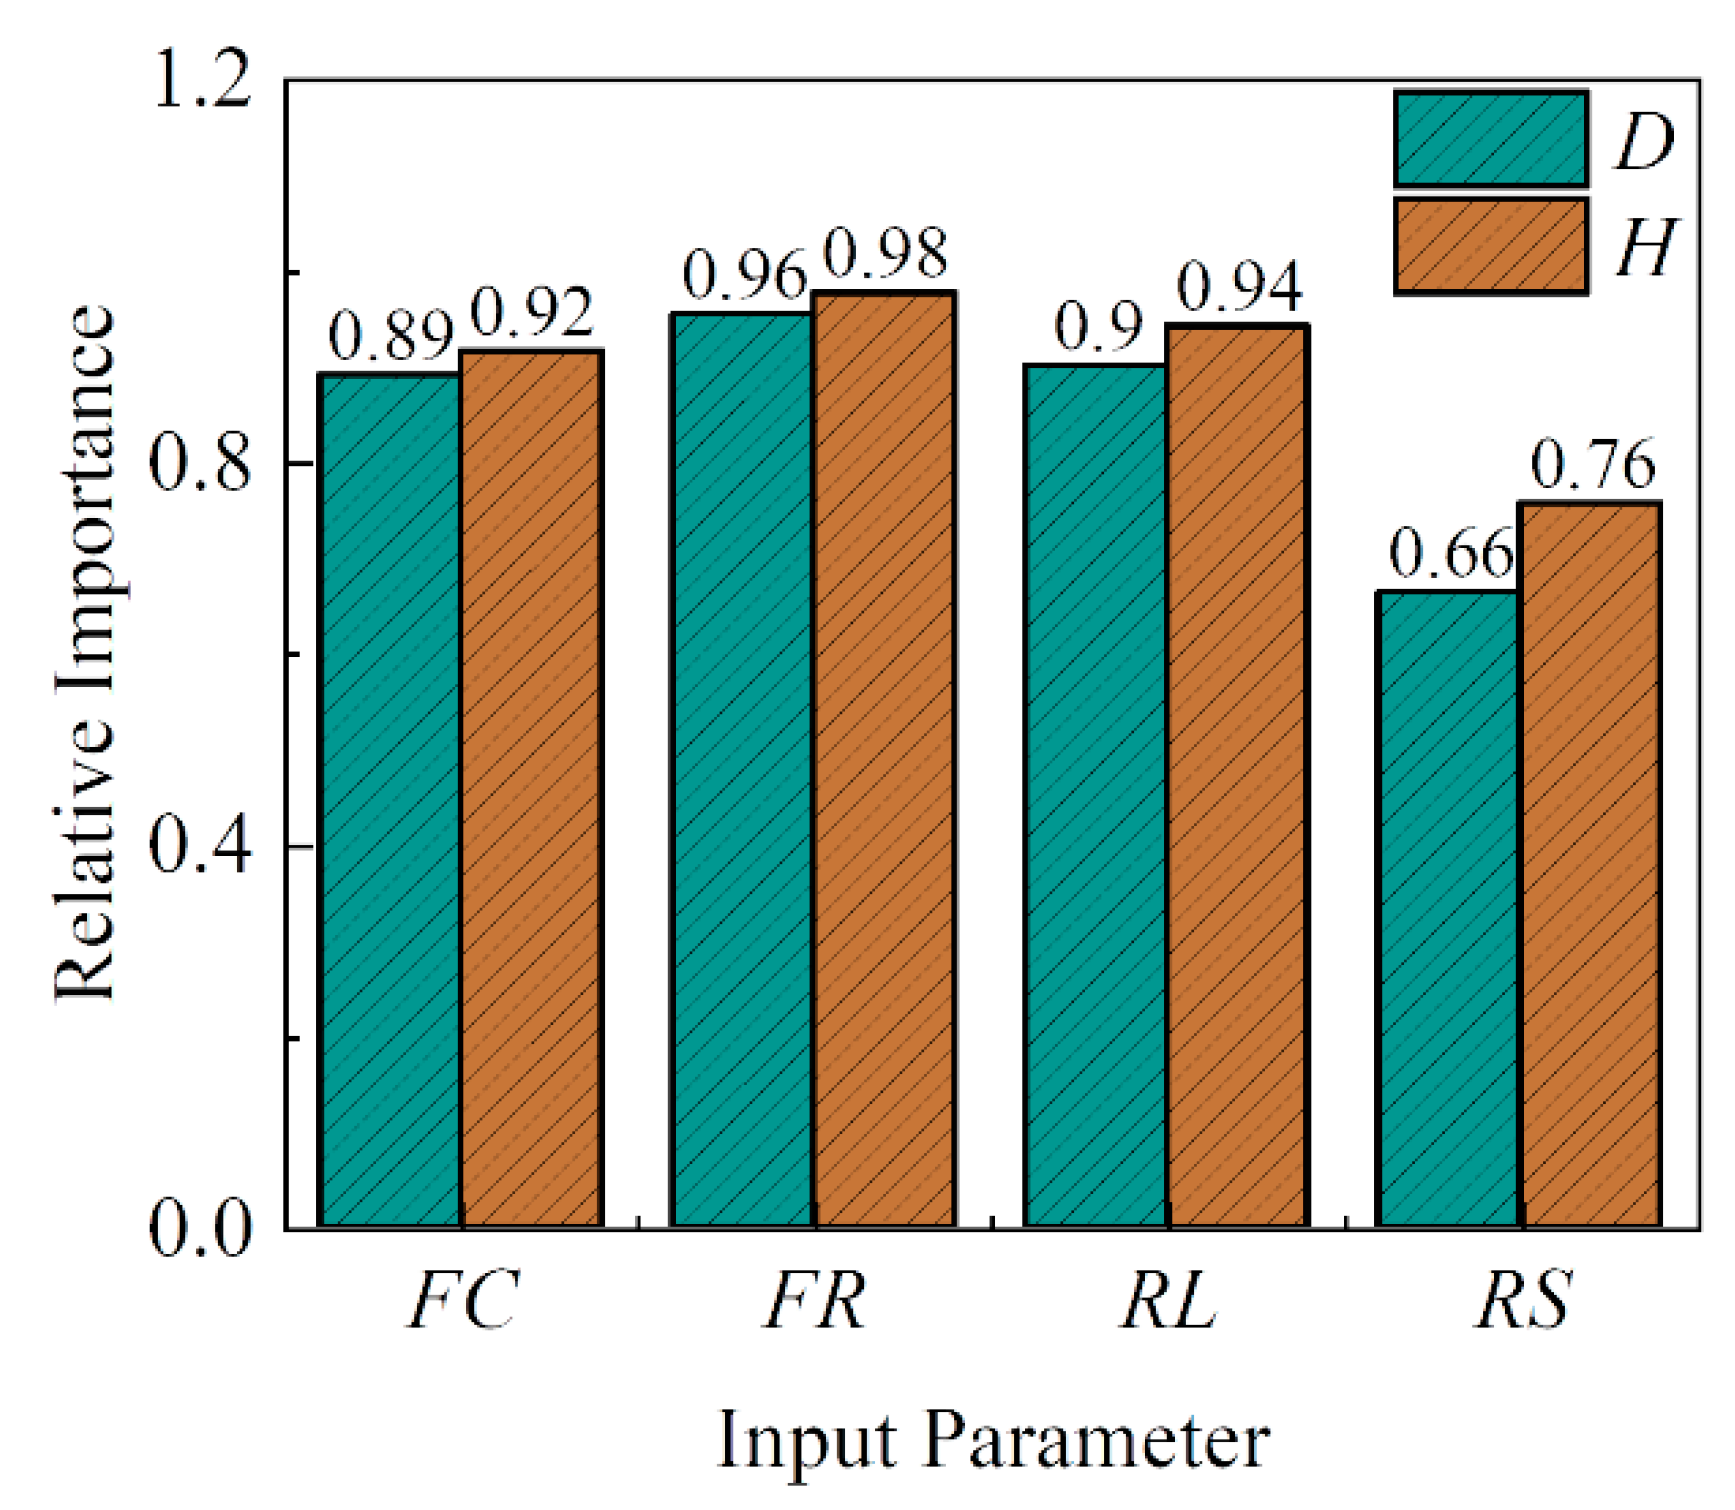
5.3. Sensitivity Analysis

Sensitivity analysis evaluates the overall influence of each input variable on the model’s predictive performance or output results across the entire data distribution. It is a global explanation method, focusing on the combined effect of the variable across all samples. The influence of each input parameter on the output (D and H) is assessed by sensitivity analysis. In this study, the cosine amplitude method [24,29,58] is applied to illustrate the relative importance of each input with respect to the outputs. Using this method, the data in the database is represented as a matrix of size m × n, where m is the number of data groups and n is the total number of input and output parameters. In this study, m = 225, n = 6. The data is defined as an array X shown in Equation (5).
X = X 1 , X 2 , , X m
Each data point in X is a vector with n dimensions. For example, the ith data point in the array can be presented by Equation (6).
X i = X i 1 , X i 2 , , X i n
The relative importance rij can be calculated by Equation (7):
r i j = k = 1 m X i k X j k k = 1 m X i k 2 k = 1 m X j k 2 , i , j = 1 , 2 , , n .
When rij is close to 1, it indicates a high relative importance of the input variable to the output. The relationship between input and output is shown in Figure 12. The most important input parameter for D and H is the yield strength of longitudinal reinforcement, with relative importance values of 0.96 and 0.98, respectively. Meanwhile, the compressive strength of concrete and the ratio of longitudinal reinforcement also show high importance for D and H, with relative importance values of approximately 0.90. The influence of the ratio of shear reinforcement on D and H is 0.66 and 0.76, respectively. This finding is consistent with the conclusions reported in Refs. [5,13].

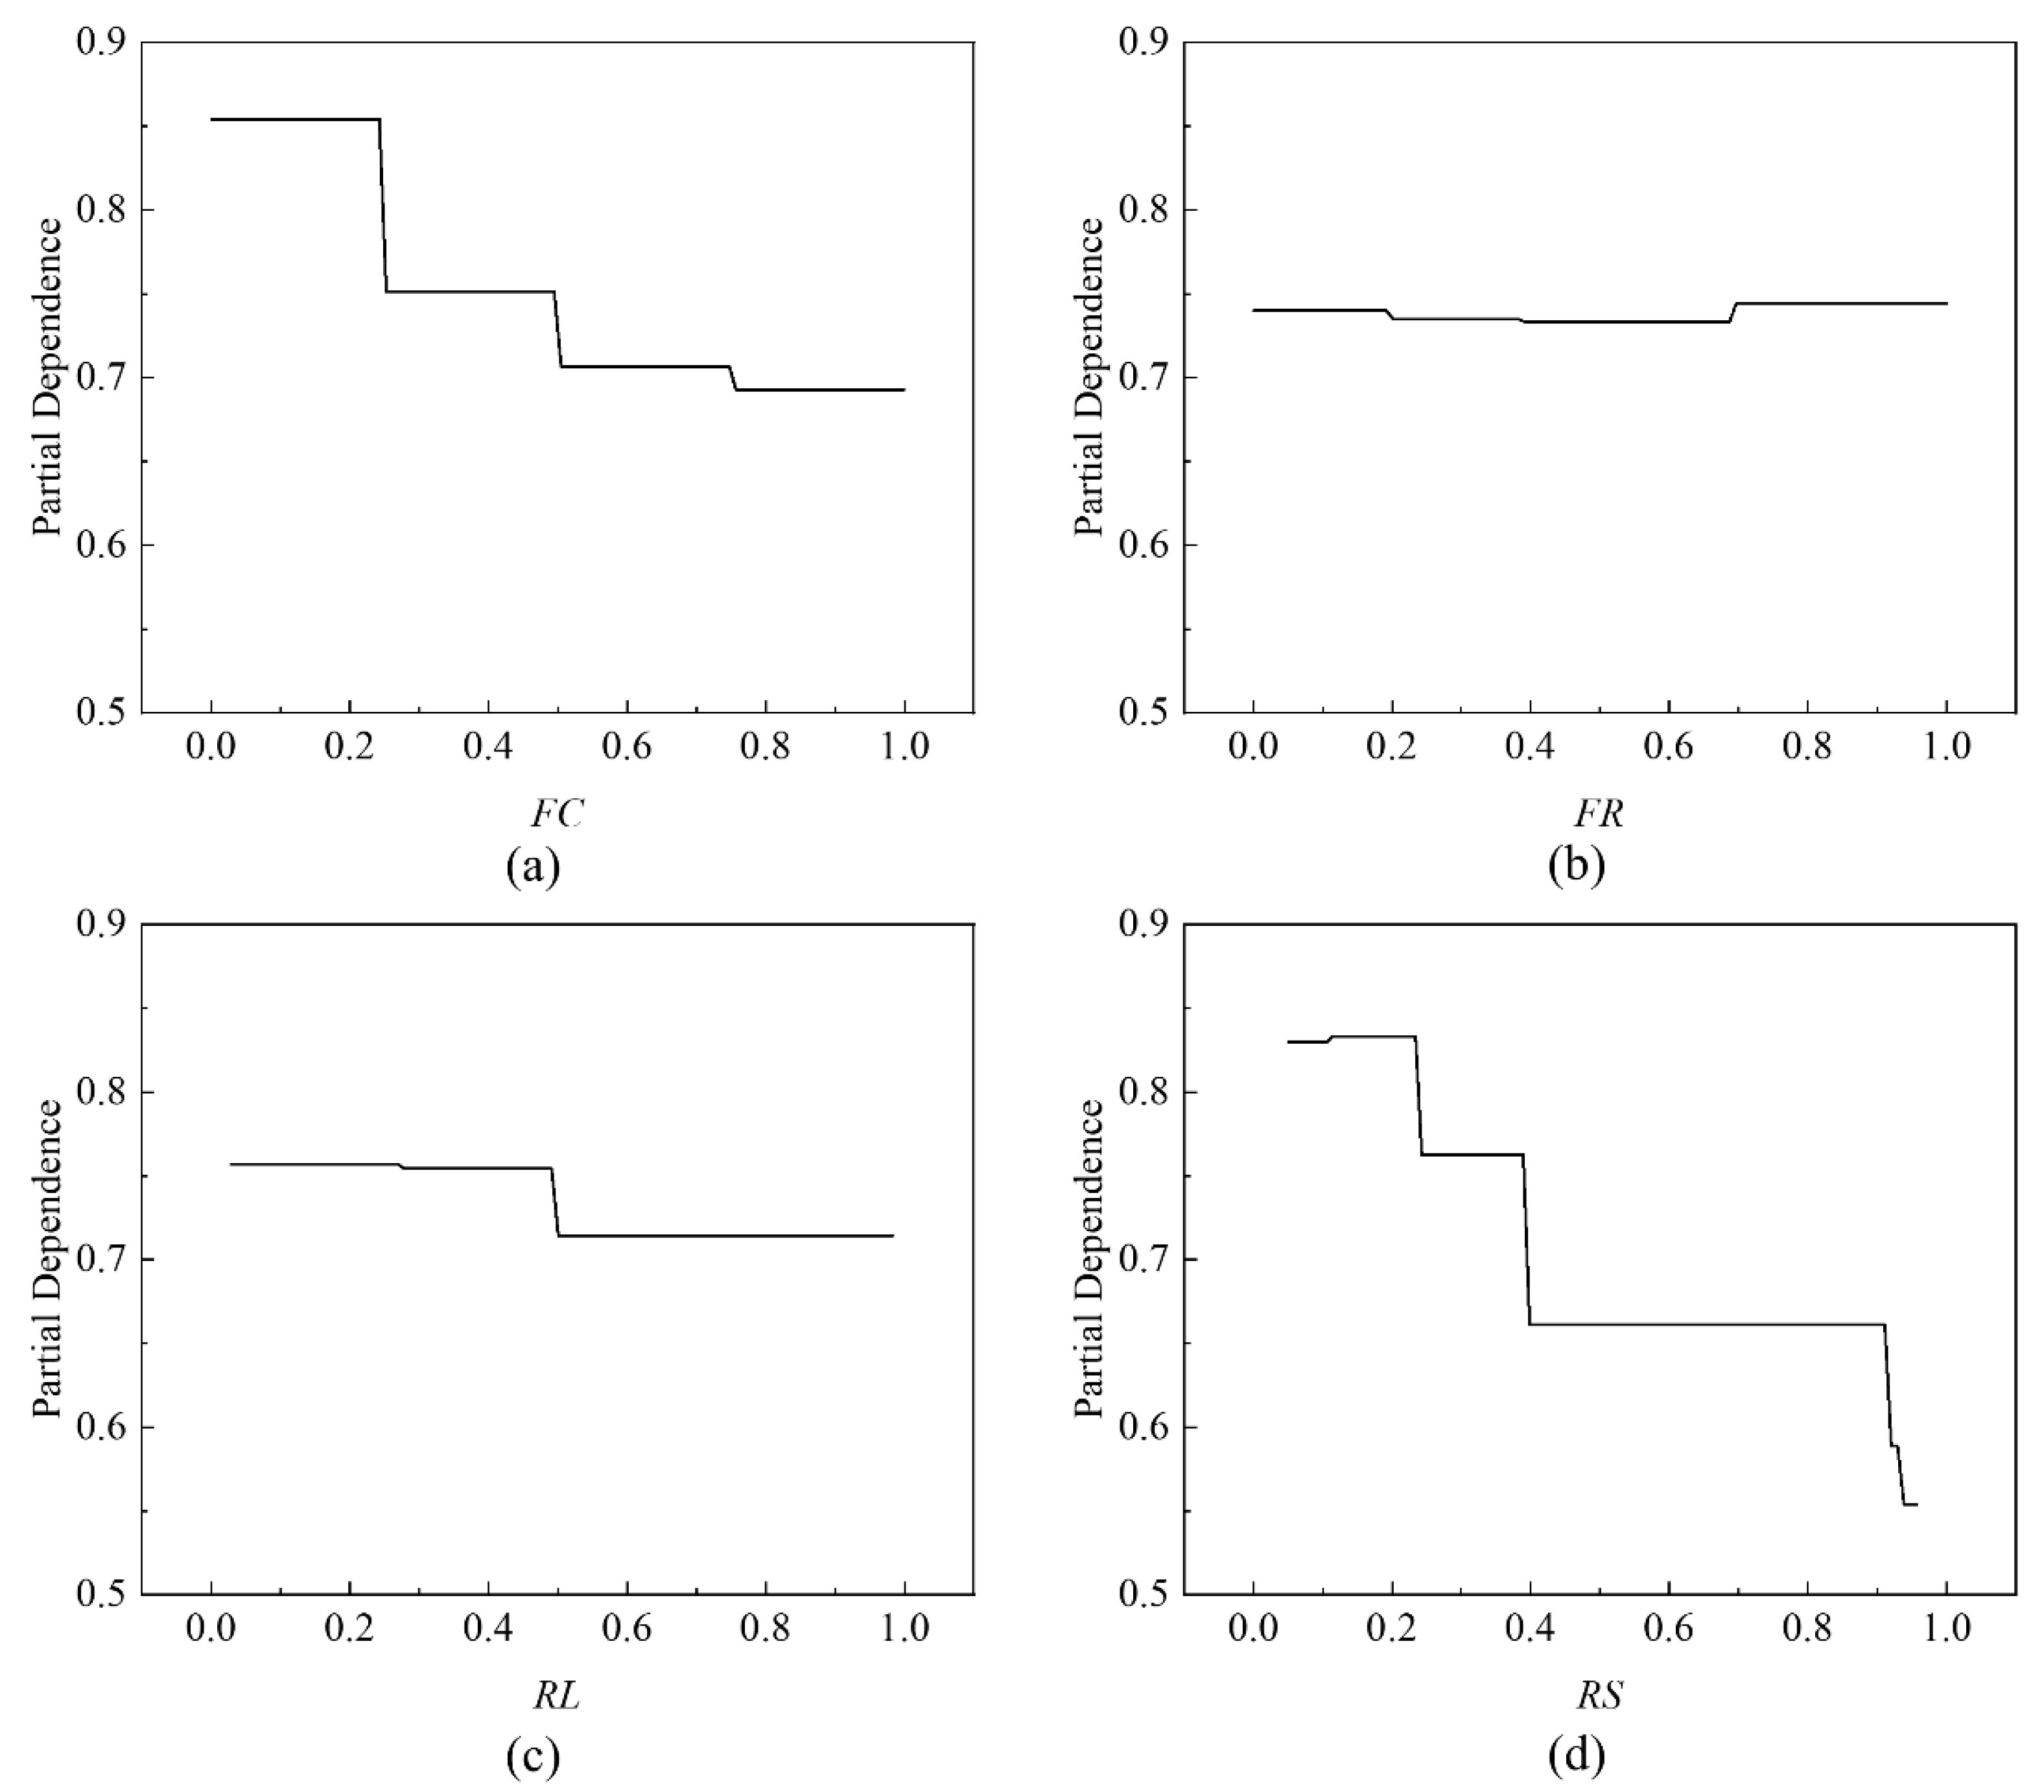
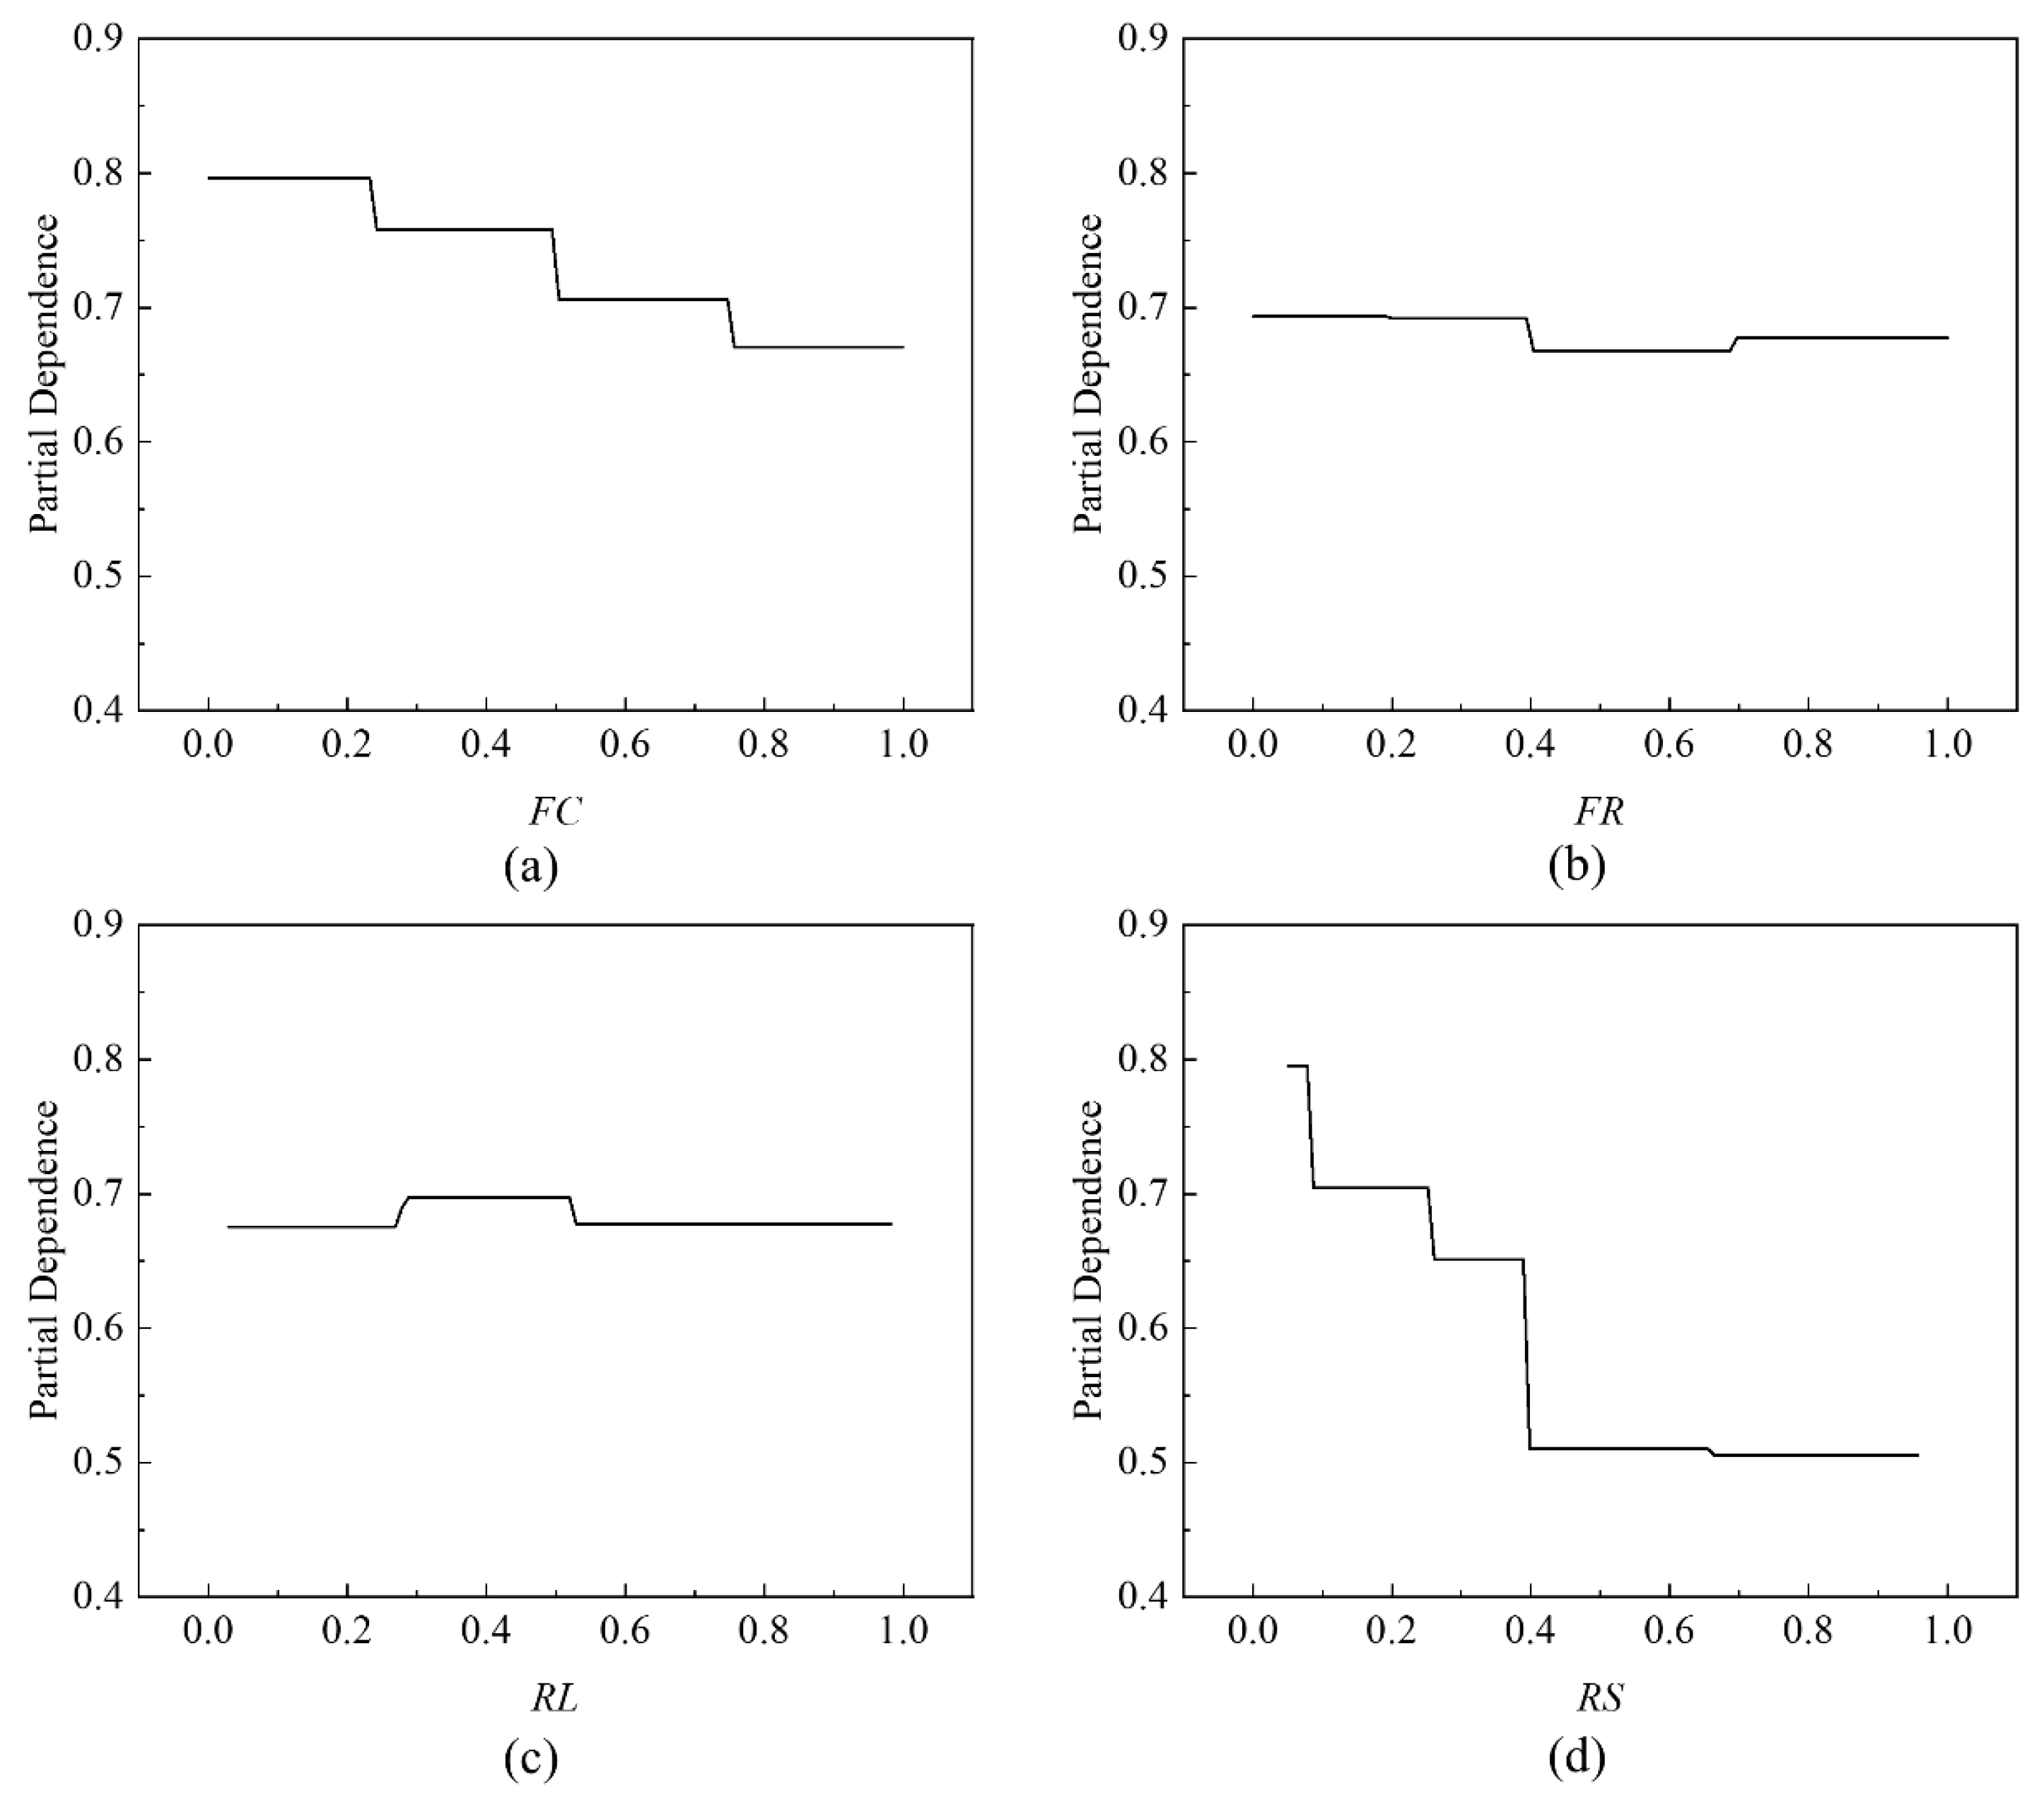
5.4. Partial Dependence Plot (PDP) Analysis

PDP is a visualization tool used to interpret complex machine learning models. It shows how changes in a single input variable affect the model’s predicted output on average, while keeping all other input variables fixed. Figure 13 illustrates the partial dependence of the HPO-RF-5 model’s prediction of the D value on four input variables, showing how changes in a single feature affect the predicted value while keeping other features constant. Among these, RS has the most significant impact on D. As the RS value increases, the D value decreases gradually, as shown in Figure 13d. Similarly, FC also has a notable influence, with the D value decreasing as FC increases, as seen in Figure 13a. This trend is reasonable, as higher RS and FC values enhance the resistance ability of RC columns to blast loading, thereby reducing the likelihood of longitudinal reinforcement deformation. Moreover, FR exhibits the least influence on D. As FR changes, the value of D remains nearly unchanged, as shown in Figure 13b.
Figure 14 shows the partial dependence of the HPO-RF-5 model’s prediction of the H value on four input variables. RS has a significant influence on H. When the value of RS increases, the H decreases gradually, as shown in Figure 14d. In contrast, FR and RL have negligible influence on H. As FR and RL vary, the partial dependence remains nearly constant, as shown in Figure 14b,c.

5.5. Overfitting Analysis

Overfitting is a common issue in the training of artificial intelligence models, referring to abnormal behavior where a model performs well on the training data but poorly on the test data. To assess potential overfitting, the model’s performance is evaluated using MSE, MAE, and R2 on both the training and test datasets, as listed in Table 3. The model’s performance on the training set exhibited significantly lower MSE and MAE values, as well as a higher R2 value, compared to the testing set, indicating a potential overfitting issue. For example, the performance of HPO-RF-1 shown in Table 3 may mean that overfitting occurs in this model. The value of MSE and MAE in the training set is significantly lower than that in the testing set. In addition, the value of R2 in the testing set is only 65% of that in the training set. The performance of the other three models on the training and testing sets is similar, indicating no overfitting issues. Furthermore, PDP analysis can provide a reference for determining whether the model suffers from overfitting. As illustrated in Figure 13 and Figure 14, the variations in D and H values with respect to the changes in the four input parameters in the HPO-RF-5 model are reasonable. For example, as RS increases, both D and H values decrease. This is attributable to the enhanced ability of the RC column to resist blast loading with increasing RS, resulting in a significant reduction in both D and H values. This finding agrees with the conclusions drawn in Refs. [5,13]. In conclusion, except for the HPO-RF-1 model, the other three models in this study do not exhibit overfitting.

6. Conclusions

In this study, datasets consisting of 45 and 225 samples are utilized, and the HPO algorithm is applied to optimize the hyperparameters of ANN and RF models for predicting the post-blast morphology of RC columns. Satisfactory model performance is achieved. However, several limitations and challenges are identified: (1) The data used for ML model training are obtained from numerical simulations of RC columns with identical dimensions and blasting designs. As a result, the model’s predictive capability is primarily restricted to RC columns with the specific size and blasting configuration considered in this study, and its applicability remains limited. (2) Only four primary input parameters are considered, i.e., compressive strength of concrete, yield strength of reinforcement, ratio of longitudinal reinforcement, and ratio of shear reinforcement, while other potentially influential factors affecting the post-blast morphology of RC columns are not included. (3) Although good performance is observed on the current dataset, the model’s generalization ability is not yet validated using real engineering data or RC columns with different dimensions and structural configurations. Further testing with more diverse datasets is required to enhance the model’s adaptability and robustness.
In this study, two ML models optimized by the HPO algorithm are employed to predict the bending deflection and exposed height of longitudinal reinforcement in RC columns subjected to demolition blasting. The FE models, which consider the concrete compressive strength, the yield strength of longitudinal reinforcement, the longitudinal reinforcement ratio, and the shear reinforcement ratio, are developed to simulate 45 cases. These cases are then augmented to generate a comprehensive database containing 225 samples for model training and testing. Based on the findings, the following conclusions are presented: (1) The data augmentation method used in this study effectively improves the performance of the ML models. The performance scores of the HPO-ANN and HPO-RF models show significant improvement. (2) Among the four HPO-optimized ML models, HPO-RF-5 demonstrates the best predictive performance, achieving MSE, MAE, and R2 values of 0.004, 0.041, and 0.931 in training, and 0.007, 0.057, and 0.865 in testing. (3) Sensitivity analysis reveals that the yield strength of longitudinal reinforcement is the most influential factor, with a relative importance score of 0.96 for bending deflection and 0.98 for exposed height, whereas the shear reinforcement ratio contributes the least to the prediction. (4) The partial dependence plot (PDP) analysis indicates that the ratio of shear reinforcement has the most significant impact on the deformation of longitudinal reinforcement. The yield strength of the reinforcement has the least influence on the deformation of the longitudinal reinforcement.

Author Contributions

Conceptualization, K.R. and X.X.; methodology, K.R.; software, J.S.; validation, Y.Y.; formal analysis, K.R.; resources, Y.J.; data curation, H.T.; writing—original draft preparation, K.R.; writing—review and editing, Y.J.; visualization, Q.Y.; supervision, Y.J., J.Y. and X.X.; project administration, J.Y. All authors have read and agreed to the published version of the manuscript.

Funding

This research was funded by the State Key Laboratory of Precision Blasting and the Hubei Key Laboratory of Blasting Engineering, Jianghan University, grant number PBSKL2022A01.

Data Availability Statement

The original contributions presented in this study are included in the article. Further inquiries can be directed to the corresponding author.

Conflicts of Interest

The authors declare no conflicts of interest.

References

  1. Sun, J.; Jia, Y.; Xie, X.; Yao, Y. Design Criteria for the Folding Implosion of High-Rise RC Buildings. Eng. Struct. 2018, 233, 111933. [Google Scholar] [CrossRef]
  2. Fang, C.; Linzell, D.G. Examining Progressive Collapse Robustness of a High-Rise Reinforced Concrete Building. Eng. Struct. 2021, 248, 113274. [Google Scholar] [CrossRef]
  3. Chai, Y.; Luo, N.; Zhang, H.; Duan, Y.; Mou, G.; Sun, W.; Dong, J. Application of Controlled Blasting Demolition Technology in Ultra-High Coaxial Thin-Walled Steel Inner Cylinder Reinforced Concrete Chimney. Case Stud. Constr. Mater. 2023, 18, e01936. [Google Scholar] [CrossRef]
  4. Sun, J.; Jia, Y.; Yao, Y.; Xie, X. Experimental Investigation of Stress Transients of Blasted RC Columns in the Blasting Demolition of Buildings. Eng. Struct. 2020, 210, 110417. [Google Scholar] [CrossRef]
  5. Yan, Y.; Hou, X.; Zheng, W.; Fei, H. The Damage Response of RC Columns with Considering Different Longitudinal and Shear Reinforcement under Demolition Blasting. J. Build. Eng. 2022, 62, 105396. [Google Scholar] [CrossRef]
  6. Zhang, Z.X. Rock Fracture and Blasting: Theory and Applications, 1st ed.; Butterworth-Heinemann: Oxford, UK, 2016; ISBN 0128027045. [Google Scholar]
  7. Uenishi, K.; Takahashi, H.; Yamachi, H.; Sakurai, S. PC-Based Simulations of Blasting Demolition of RC Structures. Constr. Build. Mater. 2010, 24, 2401–2410. [Google Scholar] [CrossRef]
  8. Wang, X.; Zhang, Z. Residual Axial Capacity of Square Recycled Aggregate Concrete-Filled Steel Tube Columns After Blast Loads. J. Build. Eng. 2022, 47, 103865. [Google Scholar] [CrossRef]
  9. Wu, K.C.; Li, B.; Tsai, K.C. Residual Axial Compression Capacity of Localized Blast-Damaged RC Columns. Int. J. Impact Eng. 2011, 38, 29–40. [Google Scholar] [CrossRef]
  10. Bao, X.; Li, B. Residual Strength of Blast Damaged Reinforced Concrete Columns. Int. J. Impact Eng. 2010, 37, 295–308. [Google Scholar] [CrossRef]
  11. Roller, C.; Mayrhofer, C.; Riedel, W.; Thoma, K. Residual Load Capacity of Exposed and Hardened Concrete Columns under Explosion Loads. Eng. Struct. 2013, 55, 66–72. [Google Scholar] [CrossRef]
  12. Sun, J.; Xie, X.; Wang, K.; Jia, Y.; Liu, C. Initial Bending Instability Model of Exposed Reinforcing Bars in Demolition Projects. Blasting 2015, 32, 1–4+27. [Google Scholar]
  13. Fujikake, K.; Aemlaor, P. Damage of Reinforced Concrete Columns under Demolition Blasting. Eng. Struct. 2013, 55, 116–125. [Google Scholar] [CrossRef]
  14. Kuzkin, V.A.; Dannert, M.M. Buckling of A Column under A Constant Speed Compression: A Dynamic Correction to the Euler Formula. Acta Mech. 2016, 227, 1645–1652. [Google Scholar] [CrossRef]
  15. Yao, Y. Instability and Failure Mechanism of High-Rise Buildings in Blasting Demolition Projects. Ph.D. Thesis, Hohai University, Nanjing, China, 2019. [Google Scholar]
  16. Kyei, C.; Braimah, A. Effects of Transverse Reinforcement Spacing on the Response of Reinforced Concrete Columns Subjected to Blast Loading. Eng. Struct. 2017, 142, 148–164. [Google Scholar] [CrossRef]
  17. Li, M.; Zong, Z.; Wu, G.; Zhang, X.; Yuan, S.; Tang, B. Residual Axial Capacity of Circular Reinforced Concrete Columns Subjected to Contact Explosions. Adv. Struct. Eng. 2022, 25, 1622–1635. [Google Scholar] [CrossRef]
  18. Shi, Y.; Hu, Y.; Chen, L.; Li, Z.X.; Xiang, H. Experimental Investigation into the Close-in Blast Performance of RC Columns with Axial Loading. Eng. Struct. 2022, 268, 114688. [Google Scholar] [CrossRef]
  19. Thai, D.K.; Kim, S.E. Numerical Investigation of the Damage of RC Members Subjected to Blast Loading. Eng. Fail. Anal. 2018, 92, 350–367. [Google Scholar] [CrossRef]
  20. Fakharian, P.; Rezazadeh Eidgahee, D.; Akbari, M.; Jahangir, H.; Ali Taeb, A. Compressive Strength Prediction of Hollow Concrete Masonry Blocks Using Artificial Intelligence Algorithms. Structures 2023, 47, 1790–1802. [Google Scholar] [CrossRef]
  21. Miao, X.; Chen, B.; Zhao, Y. Prediction of Compressive Strength of Glass Powder Concrete Based on Artificial Intelligence. J. Build. Eng. 2024, 91, 109377. [Google Scholar] [CrossRef]
  22. Wang, Q.; Hussain, A.; Farooqi, M.U.; Deifalla, A.F. Artificial Intelligence-Based Estimation of Ultra-High-Strength Concrete’s Flexural Property. Case Stud. Constr. Mater. 2022, 17, e01243. [Google Scholar] [CrossRef]
  23. Zhang, J.; Li, D.; Wang, Y. Predicting Uniaxial Compressive Strength of Oil Palm Shell Concrete Using A Hybrid Artificial Intelligence Model. J. Build. Eng. 2020, 30, 101282. [Google Scholar] [CrossRef]
  24. Asteris, P.G.; Lourenço, P.B.; Roussis, P.C.; Elpida Adami, C.; Armaghani, D.J.; Cavaleri, L.; Chalioris, C.E.; Hajihassani, M.; Lemonis, M.E.; Mohammed, A.S.; et al. Revealing the Nature of Metakaolin-Based Concrete Materials Using Artificial Intelligence Techniques. Constr. Build. Mater. 2022, 322, 126500. [Google Scholar] [CrossRef]
  25. Nguyen, T.; Ly, K.D.; Nguyen-Thoi, T.; Nguyen, B.P.; Doan, N.P. Prediction of Axial Load Bearing Capacity of PHC Nodular Pile Using Bayesian Regularization Artificial Neural Network. Soils Found. 2022, 62, 101203. [Google Scholar] [CrossRef]
  26. Zhang, G.; Ali, Z.H.; Aldlemy, M.S.; Mussa, M.H.; Salih, S.Q.; Hameed, M.M.; Al-Khafaji, Z.S.; Yaseen, Z.M. Reinforced Concrete Deep Beam Shear Strength Capacity Modelling Using an Integrative Bio-Inspired Algorithm with An Artificial Intelligence Model. Eng. Comput. 2022, 38, 15–28. [Google Scholar] [CrossRef]
  27. Nguyen, T.H.; Nguyen, D.T.; Nguyen, D.H.; Tran, D.H. Evaluation of Residual Strength of Corroded Reinforced Concrete Beams Using Machine Learning Models. Arab. J. Sci. Eng. 2022, 47, 9985–10002. [Google Scholar] [CrossRef]
  28. Asteris, P.G.; Koopialipoor, M.; Armaghani, D.J.; Kotsonis, E.A.; Lourenço, P.B. Prediction of Cement-Based Mortars Compressive Strength Using Machine Learning Techniques. Neural Comput. Appl. 2021, 33, 13089–13121. [Google Scholar] [CrossRef]
  29. Debnath, P.; Dey, A.K. Prediction of Bearing Capacity of Geogrid-Reinforced Stone Columns Using Support Vector Regression. Int. J. Geomech. 2018, 18, 04017147. [Google Scholar] [CrossRef]
  30. Mohammed, H.R.M.; Ismail, S. Proposition of New Computer Artificial Intelligence Models for Shear Strength Prediction of Reinforced Concrete Beams. Eng. Comput. 2022, 38, 3739–3757. [Google Scholar] [CrossRef]
  31. Yang, L.; Qi, C.; Lin, X.; Li, J.; Dong, X. Prediction of Dynamic Increase Factor for Steel Fibre Reinforced Concrete Using a Hybrid Artificial Intelligence Model. Eng. Struct. 2019, 189, 309–318. [Google Scholar] [CrossRef]
  32. GB 50010-2010; Code for Design of Concrete Structures. Ministry of Housing and Urban-Rural Development of the People’s Republic of China (MOHURD): Beijing, China, 2010.
  33. Riedel, W.; Mayrhofer, C.; Thoma, K.; Stolz, A. Engineering and Numerical Tools for Explosion Protection of Reinforced Concrete. Int. J. Prot. Struct. 2010, 1, 85–102. [Google Scholar] [CrossRef]
  34. Borrvall, T.; Riedel, W. The RHT Concrete Model in LS-DYNA. In Proceedings of the 8th European LS-DYNA Users Conference, Strasbourg, France, 23–24 May 2011. [Google Scholar]
  35. Hallquist, J.O. LS-DYNA Keyword User’s Manual; Livermore Software Technology Corporation: Livermore, CA, USA, 2007. [Google Scholar]
  36. Xin, C.L. Handbook of Common Material Parameters for Finite Element Analysis, 1st ed.; Machine Press: Beijing, China, 2019. [Google Scholar]
  37. Li, T.; Niu, X.; Fei, A.; Zhu, C.; Wang, M. Numerical Simulation for the Matching Effect of Rock Parameters on Explosives and Rocks. IOP Conf. Ser. Earth Environ. Sci. 2019, 304, 052110. [Google Scholar] [CrossRef]
  38. Sachpazis, C.I. Correlating Schmidt Hardness with Compressive Strength and Young’s Modulus of Carbonate Rocks. Bull. Eng. Geol. Environ. 1990, 42, 75–83. [Google Scholar] [CrossRef]
  39. Wei, H.; Chen, J.; Zhu, J.; Yang, X.; Chu, H. A Novel Algorithm of Nested-ELM for Predicting Blasting Vibration. Eng. Comput. 2022, 38, 1241–1256. [Google Scholar] [CrossRef]
  40. Abbaszadeh Shahri, A.; Pashamohammadi, F.; Asheghi, R.; Abbaszadeh Shahri, H. Automated Intelligent Hybrid Computing Schemes to Predict Blasting Induced Ground Vibration. Eng. Comput. 2022, 38, 3335–3349. [Google Scholar] [CrossRef]
  41. Mikołajczyk, A.; Grochowski, M. Data Augmentation for Improving Deep Learning in Image Classification Problem. In Proceedings of the 2018 International Interdisciplinary PhD Workshop, Świnouście, Poland, 9–12 May 2018; pp. 117–122. [Google Scholar] [CrossRef]
  42. Erichson, N.B.; Lim, S.H.; Xu, W.; Utera, F.; Cao, Z.; Mahoney, M.W. NoisyMix: Boosting Model Robustness to Common Corruptions. Proc. Mach. Learn. Res. 2024, 238, 4033–4041. [Google Scholar] [CrossRef]
  43. Rong, K.; Xu, X.; Wang, H.; Yang, J. Prediction of the Mean Fragment Size in Mine Blasting Operations by Deep Learning and Grey Wolf Optimization Algorithm. Earth Sci. Inform. 2024, 17, 2903–2919. [Google Scholar] [CrossRef]
  44. Iwana, B.K.; Uchida, S. An empirical survey of data augmentation for time series classification with neural networks. PLoS ONE 2021, 16, e0254841. [Google Scholar] [CrossRef]
  45. Hosseini, S.A.; Tavana, A.; Abdolahi, S.M.; Darvishmaslak, S. Prediction of Blast-Induced Ground Vibrations in Quarry Sites: A Comparison of GP, RSM and MARS. Soil. Dyn. Earthq. Eng. 2019, 119, 118–129. [Google Scholar] [CrossRef]
  46. Shang, Y.; Nguyen, H.; Bui, X.N.; Tran, Q.H.; Moayedi, H. A Novel Artificial Intelligence Approach to Predict Blast-Induced Ground Vibration in Open-Pit Mines Based on the Firefly Algorithm and Artificial Neural Network. Nat. Resour. Res. 2020, 29, 723–737. [Google Scholar] [CrossRef]
  47. Enayatollahi, I.; Aghajani Bazzazi, A.; Asadi, A. Comparison Between Neural Networks and Multiple Regression Analysis to Predict Rock Fragmentation in Open-Pit Mines. Rock. Mech. Rock. Eng. 2014, 47, 799–807. [Google Scholar] [CrossRef]
  48. Zhou, Z.H. Machine Learning; Tsinghua University Press: Beijing, China, 2016; ISBN B01ED31E04. [Google Scholar]
  49. Breiman, L. Random Forests. Mach. Learn. 2001, 45, 5–32. [Google Scholar] [CrossRef]
  50. Naruei, I.; Keynia, F.; Molahosseini, A.S. Hunter–Prey Optimization: Algorithm and Applications. Soft Comput. 2021, 26, 1279–1314. [Google Scholar] [CrossRef]
  51. Berryman, A. The Origins and Evolution of Predator-Prey Theory. Ecology 1992, 73, 1530–1535. [Google Scholar] [CrossRef]
  52. Li, E.; Yang, F.; Ren, M.; Zhang, X.; Zhou, J.; Khandelwal, M. Prediction of Blasting Mean Fragment Size Using Support Vector Regression Combined with Five Optimization Algorithms. J. Rock. Mech. Geotech. Eng. 2021, 13, 1380–1397. [Google Scholar] [CrossRef]
  53. Monjezi, M.; Amiri, H.; Farrokhi, A.; Goshtasbi, K. Prediction of Rock Fragmentation Due to Blasting in Sarcheshmeh Copper Mine Using Artificial Neural Networks. Geotech. Geol. Eng. 2010, 28, 423–430. [Google Scholar] [CrossRef]
  54. Bahrami, A.; Monjezi, M.; Goshtasbi, K.; Ghazvinian, A. Prediction of Rock Fragmentation Due to Blasting Using Artificial Neural Network. Eng. Comput. 2011, 27, 177–181. [Google Scholar] [CrossRef]
  55. Amoako, R.; Jha, A.; Zhong, S. Rock Fragmentation Prediction Using an Artificial Neural Network and Support Vector Regression Hybrid Approach. Mining 2022, 2, 233–247. [Google Scholar] [CrossRef]
  56. Ding, X.; Hasanipanah, M.; Nikafshan Rad, H.; Zhou, W. Predicting the Blast-Induced Vibration Velocity Using A Bagged Support Vector Regression Optimized with Firefly Algorithm. Eng. Comput. 2021, 37, 2273–2284. [Google Scholar] [CrossRef]
  57. Khosla, C.; Saini, B.S. Enhancing Performance of Deep Learning Models with Different Data Augmentation Techniques: A Survey. In Proceedings of the 2020 International Conference on Intelligent Engineering and Management (ICIEM), London, UK, 17–19 June 2020; pp. 79–85. [Google Scholar] [CrossRef]
  58. Ross, T.J. Fuzzy Logic with Engineering Applications; Wiley: New York, NY, USA, 2010; ISBN 1119235863. [Google Scholar]
Figure 1. RC column: (a) Diagram of blastholes; (b) FE model.
Buildings 15 02351 g001
Figure 2. The deformation morphology: (a) RC column in field test; (b) concrete in numerical simulation; (c) reinforcement in numerical simulation.
Buildings 15 02351 g002
Figure 3. The values of D and H of the longitudinal reinforcement after blasting.
Buildings 15 02351 g003
Figure 4. The distribution of input and output parameters.
Buildings 15 02351 g004
Figure 5. The structure of ANN.
Buildings 15 02351 g005
Figure 6. The structure of RF algorithm.
Buildings 15 02351 g006
Figure 7. The optimization process of four intelligence models.
Buildings 15 02351 g007
Figure 8. The (a) D and (b) H predicted by intelligence models with 45 groups of data.
Buildings 15 02351 g008
Figure 9. The (a) D and (b) H predicted by intelligence models with 225 groups of data.
Buildings 15 02351 g009
Figure 10. The R2 of D and H predicted by the HPO-ANN model. (a) D predicted by the HPO-ANN-1; (b) H predicted by the HPO-ANN-1; (c) D predicted by the HPO-ANN-5; (d) H predicted by the HPO-ANN-5.
Buildings 15 02351 g010
Figure 11. The prediction R2 of the HPO-RF model. (a) D predicted by the HPO-RF-1; (b) H predicted by the HPO-RF-1; (c) D predicted by the HPO-RF-5; (d) H predicted by the HPO-RF-5.
Buildings 15 02351 g011
Figure 12. The relative importance of input.
Buildings 15 02351 g012
Figure 13. PDP analysis for bending deflection of longitudinal reinforcement: (a) FC; (b) FR; (c) RL; (d) RS.
Buildings 15 02351 g013
Figure 14. PDP analysis for exposed height of longitudinal reinforcement: (a) FC; (b) FR; (c) RL; (d) RS.
Buildings 15 02351 g014
Table 1. Simulation cases.
No.Compressive Strength of Concrete (MPa)Yield Strength of Reinforcement (MPa)Ratio of Longitudinal Reinforcement (%)Ratio of Shear Reinforcement (%)No.Compressive Strength of Concrete (MPa)Yield Strength of Reinforcement (MPa)Ratio of Longitudinal Reinforcement (%)Ratio of Shear Reinforcement (%)
1403350.750.08724604001.130.087
2403350.750.17525605001.130.087
3403350.750.34926803351.130.087
4404000.750.08727803351.130.175
5405000.750.08728803351.130.349
6603350.750.08729804001.130.087
7603350.750.17530805001.130.087
8603350.750.34931403351.500.087
9604000.750.08732403351.500.175
10605000.750.08733403351.500.349
11803350.750.08734404001.500.087
12803350.750.17535405001.500.087
13803350.750.34936603351.500.087
14804000.750.08737603351.500.175
15805000.750.08738603351.500.349
16403351.130.08739604001.500.087
17403351.130.17540605001.500.087
18403351.130.34941803351.500.087
19404001.130.08742803351.500.175
20405001.130.08743803351.500.349
21603351.130.08744804001.500.087
22603351.130.17545805001.500.087
23603351.130.349/////
Table 2. Model setting.
No.Model NameAlgorithmDatabase Scale
1HPO-ANN-1HPO-ANN45
2HPO-ANN-5HPO-ANN225
3HPO-RF-1HPO-RF45
4HPO-RF-5HPO-RF225
Table 3. Performance and scores of four ML models.
Model NameModel RankTotal ScoreRank
TrainingTesting
MSEMAER2MSEMAER2
HPO-ANN-10.013 (1)0.088 (1)0.819 (1)0.025 (2)0.130 (2)0.767 (2)94
HPO-ANN-50.008 (2)0.069 (2)0.840 (2)0.009 (3)0.071 (3)0.839 (3)152
HPO-RF-10.006 (3)0.061 (3)0.911 (3)0.043 (1)0.163 (1)0.591 (1)123
HPO-RF-50.004 (4)0.041 (4)0.931 (4)0.007 (4)0.057 (4)0.865 (4)241
Disclaimer/Publisher’s Note: The statements, opinions and data contained in all publications are solely those of the individual author(s) and contributor(s) and not of MDPI and/or the editor(s). MDPI and/or the editor(s) disclaim responsibility for any injury to people or property resulting from any ideas, methods, instructions or products referred to in the content.

