Abstract
Against the background of the global concern for environmental protection and the prevalence of the green building concept, the requirements for building design are increasing, as are the technological content and functional requirements. Meanwhile, the urgency to address challenges related to the ecological environment and performance requirements has become increasingly pronounced. Taking a dormitory building in China as an example. Autodesk Revit 2018 software is employed in this study to establish a building information modeling (BIM). Green building software (GBSWARE) simulates and analyzes outdoor wind environment, indoor thermal comfort, calculates building energy conservation, does daylighting analysis, and calculates building daylighting. Although the building’s energy-saving design aligns with the requirements, the lighting and indoor thermal comfort of the rooms do not meet the standards. Additionally, the outdoor wind environment has problems with the wind zone and a wind speed amplification coefficient that surpasses the limit. The thermal environment within the residential building fails to satisfy the requirements. This study leverages a BIM-based model for multifaceted applications, integrating tailored retrofit strategies that align with the building’s inherent characteristics and detailed analyses of its components. By harnessing the building’s energy-saving potential, it enhances energy use efficiency, offering a valuable reference for the conceptual design of green buildings and energy-efficient retrofits.
1. Introduction
Currently, energy and environmental problems are becoming increasingly serious. Buildings use about 30 to 40 percent of the world’s energy, and buildings emit one-third of the world’s greenhouse gases. Green buildings, also known as healthy buildings, can have a positive impact throughout the life cycle of a building and reduce negative impacts on the natural environment [1]. Sustainable development has intensified significantly, and the institutionalization of environmentally responsible practices in corporate operations is gaining traction. This paradigm shift is driving a convergence of industries towards systematic environmental management strategies [2].
As a major consumer of resources and generator of waste, the construction industry is actively shifting to more sustainable construction techniques [3]. Green building is a construction concept that aims to reduce environmental impact, improve resource efficiency, and create a low-carbon and healthy living environment [4]. Through careful design and construction, green buildings can optimize resource use, significantly reduce pollution, and improve occupant health [5]. Compared with traditional buildings, green buildings can achieve 50 percent energy saving, 40 percent water saving, and 35 percent carbon reduction, which has become a core solution to address the environmental crisis [6]. According to estimates by the World Green Building Council, carbon emissions from the construction industry account for approximately 40% of global carbon emissions. Promoting green buildings can save 50% of energy and 60% of water resources, reduce waste generation by 80%, and cut carbon dioxide emissions by 45%. However, green building practitioners face significant challenges in the design phase, particularly the inaccuracy of traditional assessment methods in terms of time and cost projections [7]. The transmission of traditional architectural design drawings across disciplines is prone to data loss and inefficiencies, primarily due to the incompatibility of various design software and the lack of a dedicated collaborative platform. This incompatibility necessitates cumbersome and repetitive data transfer procedures. Consequently, the results of information analysis cannot be effectively shared or utilized for design optimization. These challenges significantly reduce designer efficiency and result in considerable time wastage.
A green building typically includes one or more of the following features and criteria: efficient use of resources and energy, use of renewable energy, measures to reduce pollution and waste, use of green materials, quality and comfortable living environment, as well as adaptation to the local environment and climate. Due to the stringent standards of green building, it is difficult for traditional construction methods to meet these requirements [8,9]. Therefore, more and more Architecture, Engineering, Construction and Operations (AECO) participants are suggesting the integration of BIM technology in green building construction to reduce the difficulty of green building construction [10,11] and reduce global energy consumption [12].Alwan’s 2015 study on building evaluation and energy analysis found that the application of BIM technology can lead to fast and efficient green building certification [13]. Jalaei and Jrade have focused on the integration of BIM and LEED and have successfully proposed an approach to sustainable integration that provides an important reference for sustainable building in Canada [14]. The effectiveness of green buildings can still be affected by inappropriate and incomplete analysis tools and methodologies that do not allow for optimal optimization of the building [15,16]. Traditional 2D AutoCAD workflows exhibit information fragmentation and interdisciplinary collaboration barriers. Crucially, such drawings lack the parametric data required for performance simulations (e.g., energy consumption, lighting, and ventilation analysis). Similarly, SketchUp’s surface-based modeling omits material properties, construction assemblies, and component performance data. This limitation impedes design modifications due to absent parametric associations, subsequently complicating maintenance. These conventional methods often rely on static, fragmented representations that cannot support comprehensive green building optimization. Empirical calculation methods exhibit notable limitations—their simplified algorithms yield coarse results suitable only for preliminary assessments, not refined decision-making. Furthermore, using disparate analytical tools (e.g., Ecotect for lighting, EnergyPlus for energy, and Fluent for CFD) creates information silos, necessitates redundant labor, and delays design feedback cycles.
As an emerging new technology, various BIM-based energy analysis software seems to be one of the key approaches to solve this problem [17]. BIM contains not only geometric information but also integrates physical attributes (e.g., orientation and envelope) and environmental parameters. This comprehensive integration empowers the algorithmic modeling of energy consumption throughout the building’s life cycle. Chinese BIM software performs well in terms of data security, cost-effectiveness, user habit adaptability, and localization standards [18]. BIM enables data-informed sustainability decisions at the design stage by analyzing the key functional dimensions, including structural integrity, ventilation efficacy, temperature regulation, circulation systems, lighting efficiency, and energy distribution. Tools like GBSWARE further enhance this process by supporting multidimensional data simulation and performance optimization through deep integration with BIM modeling.
If pre-design simulations do not meet the requirements of green building design and construction, the building scheme design can be modified, and the energy-saving design can be carried out from the first step of the whole life cycle of the building. This ensures optimal energy performance, accelerates investment payback, and extends the building’s energy-saving lifespan. If the simulation results of the existing building fail to meet the requirements of green building design, usually only an energy-saving retrofit measure of energy saving effect is inadequate, so it is necessary to decompose the existing building energy consumption status quo, the energy-saving retrofit measures for each part of the energy consumption sub-items, thereby maximizing systemic energy efficiency.
This study aims to evaluate the performance of a university dormitory building through the integrated application of Autodesk Revit and GBSWARE software to derive the corresponding energy-saving retrofit measures. Usually, the energy-saving effect of only one energy-saving retrofit measure is not enough. For example, enhancing the thermal insulation of the building envelope without complementary shading and ventilation strategies can lead to unintended consequences. While reduced heat loss benefits winter performance, the lack of solar control and passive cooling increases indoor temperatures during summer. This occurs because the improved insulation traps internally generated heat and incident solar radiation within the building. Consequently, the integration of external shading with insulation is essential for optimizing year-round thermal comfort and energy efficiency.
Furthermore, synergistic energy savings can be achieved by linking daylight harvesting strategies with artificial lighting controls to reduce electrical lighting demand. Consequently, it is necessary to disaggregate the current state of energy consumption of an existing building and carry out energy-saving retrofit measures for each part of energy consumption item by item, thereby maximizing the energy efficiency of the building and providing an optimal living environment. Energy-efficient university campuses will play a vital role in the development of sustainable cities in the future and are essential to achieving China’s carbon neutrality goals [19]. Although green building software (GBSWARE) has been applied in the industry, energy-saving retrofits for existing dormitory buildings, especially in-depth analyses incorporating specific building characteristics and actual operational data, still have significant scientific and practical value. Energy-saving retrofits for such buildings require comprehensive consideration of their special needs, such as ventilation, lighting, and thermal comfort. By analyzing these characteristics in detail, the study proposes targeted retrofit solutions, which have not been covered in previous studies.
2. Research Method
2.1. Introduction to Research Software
Autodesk Revit is an industry-leading Building Information Modeling (BIM) software widely used in architectural design, structural engineering, and MEP (Mechanical, Electrical, and Plumbing) modeling. It enables parametric design, cross-disciplinary collaboration, and lifecycle data integration, serving as a powerful 3D modeling platform for green building analysis, construction simulation, as well as energy efficiency optimization.
GBSWARE, a series of green building simulation and optimization solutions developed by Beijing Green Building Software Co., leverages the BIM model to conduct multidimensional analyses of building ventilation, sunlight and lighting, energy-saving design, and thermal comfort across both indoor and outdoor environments. The results of the analysis derived from GBSWARE offer critical references for optimizing design schemes and facilitating green building evaluation. As a software for the simulation and analysis of green buildings, GBSWARE supports full-lifecycle assessments of architectural design, aligning with green building evaluation criteria at each design phase. Table 1 summarizes the GBSWARE (2018) applied to this application.

Table 1.
Summary of Main Analysis Software in GBSWARE (2018).
2.2. Research Process
The first step in the process involves site selection. The building selected for this paper (Figure 1) is situated in Mianyang City, Sichuan Province, which falls within China’s building climate zone III, characterized by hot summers and cold winters. The dormitory building is classified as a type II high-rise student dormitory with 11 floors above ground and a total floor area of 27,611.38 square meters. The dormitory building features a total height of 40 m, a design service life of 50 years, and a fire resistance level of Grade II. Its structural system comprises a reinforced concrete frame-shear wall structure with a seismic intensity of 7 degrees, the benchmark for measuring the seismic resistance of buildings.
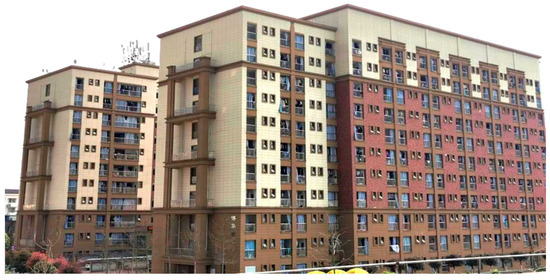
Figure 1.
Actual View of Bohua Dormitory Building.
The second step involves developing the Building Information Model (BIM). In this study, Autodesk Revit software is chosen for BIM due to its basic element is the real (true) object “family”, which facilitates parametric design, setting different parameters for different families. Parametric modeling enhances the standardization and precision of BIM. In addition, the modeling software Revit and the analysis software interact correctly with each other through the DWF format and the SXF format. The Autodesk Revit 2018 modeling process is demonstrated in Figure 2. The project’s engineering information parameters were used from the original building design data.
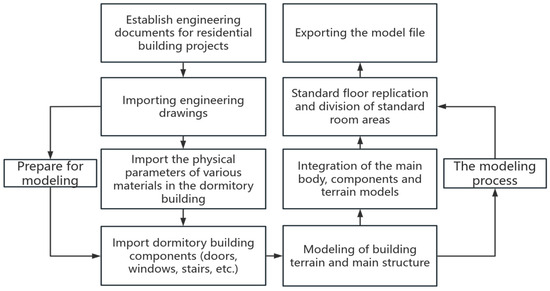
Figure 2.
Autodesk Revit Main Operating Flow of the Modeling.
The specific step involves systematically organizing the construction drawings of the modeling object by elevation levels. First, the architectural and structural construction drawings of each level are segregated layer by layer. The corresponding 2D plan views are then imported into the respective elevation planes of Autodesk Revit 2018. Subsequently, the BIM modeling process proceeds sequentially, including the axis network, walls, doors and windows, staircases, floor slabs, railings and handrails, as well as related details. During the drawing process of walls, doors, and windows, material assignments must strictly adhere to the project-specific material specifications. The walls have the correct thermal resistance, thickness, density, and other thermophysical parameters for the later simulation and analysis of the thermal direction. The building information and key material parameters are based on the original design. Figure 3 illustrates the architectural BIM view of the 3D model generated in Autodesk Revit 2018, while Figure 4 presents the corresponding structural model.
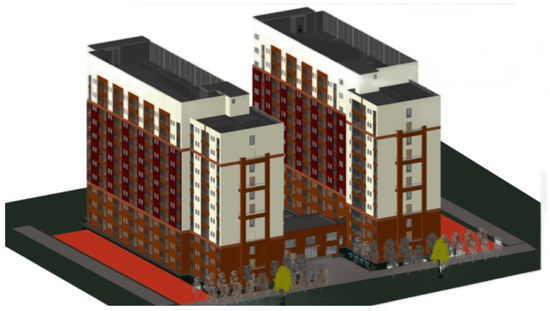
Figure 3.
Autodesk Revit 3D Building Model.
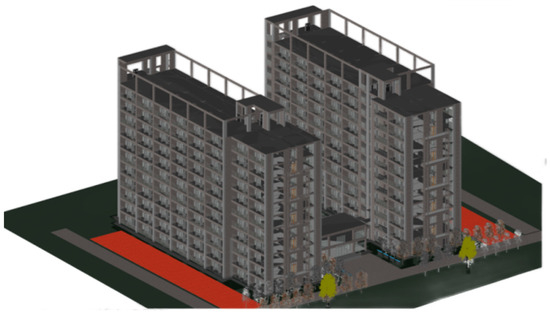
Figure 4.
Autodesk Revit 3D Structure Model.
The third step involved conducting integrated indoor and outdoor physical environments of the building model using Swire Energy Analysis software, which has embedded mathematical formulas for calculations. The data obtained from the calculations for the model under different operational scenarios are systematically utilized for predictive performance analysis. For example, the Revit model was imported into the energy-efficient design software BECS for refinement. Firstly, the model undergoes a thorough check for overlaps and alignment between the wall column, the model itself, and the wall base. Subsequently, following operations such as setting the layer heights, numbering doors and windows, searching the room, and building outline operation, the analyzable 3D model is finalized (Figure 5). Subsequently, in line with the project’s overall plan, the modeling of the surrounding buildings is undertaken. The main steps in this process include importing CAD drawings, drawing building profile curves, defining the height of the building profile, naming the building, as well as finally initiating the analysis of the outdoor wind environment and sunlight exposure on the model (e.g., Figure 6). The energy-saving design software BECS is used to calculate a single three-dimensional model. Firstly, the software’s default project settings, project structure, and project detail information are refined and adjusted in accordance with the project design instructions. Subsequently, relevant data is extracted from the model for the next step of energy consumption calculation and energy-saving compliance verification.
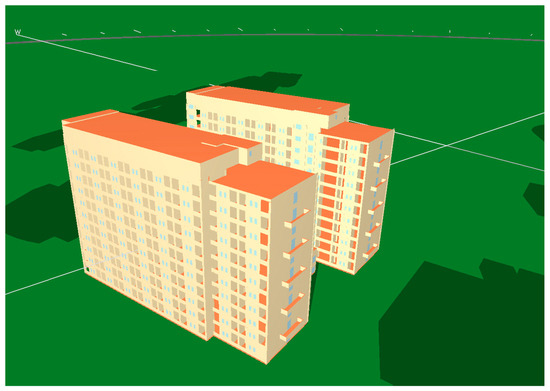
Figure 5.
GBSWARE 3D Monomer Analysis Model.
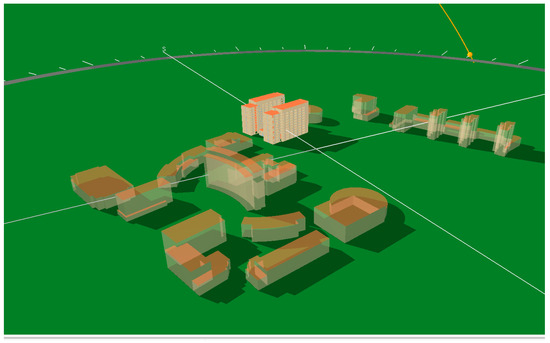
Figure 6.
GBSWARE 3D Combination Analysis Model.
The fourth step involves conducting a detailed analysis of the wind, light, and thermal conditions within the existing building, followed by compiling and summarizing the data obtained. The process of the combined steps above is illustrated in Figure 7.
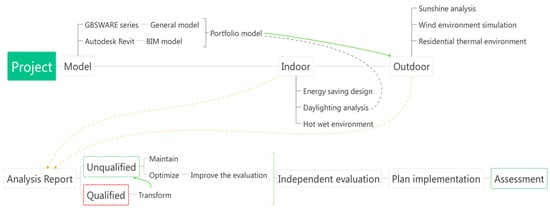
Figure 7.
Structure Diagram of the Modeling and Green Building Analysis Flow.
3. Results
3.1. Outdoor Wind Environment Analysis
The VENT tool is capable of simulating the outdoor wind environment for the combined model during both winter and summer seasons, which is evaluated based on the green building evaluation standard (GB/T 50378-2019) [20]. The conditions to be fulfilled are that the wind environment within the site is favorable for outdoor walking, comfortable movement and natural ventilation of the building.
For example, during summer, within the site’s interior, areas designated for human activity must not contain a windless area or vortex area. When the wind speed in a certain area drops below 0.2 m/s, the wind speed is close to 0, effectively causing the air to become nearly stagnant. In such conditions, people in the area can hardly feel the wind flow, so it is called a windless area.
The Computational Fluid Dynamics (CFD) method is used to solve the wind field problem. Before analysis, global project parameters must be configured, with main setup parameters including grid division, inlet wind speed and direction, season, as well as simulation quality. The accuracy of simulations is intricately linked to grid division; an increased number of grids coupled with smaller grid sizes enhances precision. Season and inlet wind speed and direction will determine the whole of the simulation results and need to be set according to the actual situation of the region in accordance with the “Design Code for Heating, Ventilation and Air Conditioning of Civil Buildings” (GB 50736-2012) [21]. In winter, the average outdoor wind speed in Mianyang is 2.7 m/s in the wind direction E 0°. The average outdoor wind speed in Mianyang in summer is 2.5 m/s in the wind direction ENE 67.5° (East-Northeast 67.5°).
Upon completing the setup, the simulation analysis commences. The analysis cloud diagrams for the winter and summer seasons are illustrated in Figure 8 and Figure 9, respectively. Meanwhile, a summary of the compliance analysis is presented in Table 2 and Table 3. The simulation of the outdoor winter wind environment (as demonstrated in Figure 8) reveals that while no areas around the building experience wind speeds exceeding the limit, there is a zone where the wind speed amplification coefficient surpasses the threshold, necessitating appropriate adjustments to the building layout. According to the simulation of the outdoor environment in summer (Figure 9), it can be seen that there is no obvious vortex generated in the calculation domain, but there is a wind speed of less than 0.2 m/s exceeding the limitation area in the pedestrian area, and there is a windless area, so it does not satisfy the “Energy Saving Design Standard for Public Buildings” (GB 50189-2015) [22]. Therefore, the study concluded that the building layout was not reasonable enough.
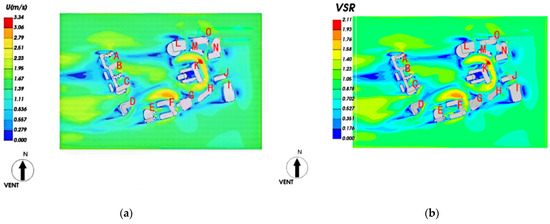
Figure 8.
Simulation Analysis of Outdoor Wind Environment in Winter (A, B, C, etc. represent surrounding numbered buildings). (a) Wind Speed Cloud at 1.5 Meter Height Level in the Computational Domain. (b) Cloud View of Wind Speed Amplification Factor at 1.5 Meters Height in the Computational Domain.
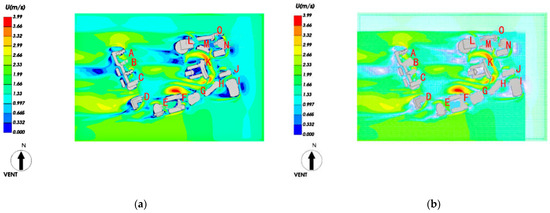
Figure 9.
Simulation Analysis of Outdoor Wind Environment in Summer. Exegesis: This F number represents the student dormitory building. Other symbols, such as ABC, represent the surrounding numbered buildings in Figure 8 and Figure 9. (a) Wind Speed Cloud at 1.5 Meter Height Level in the Computational Domain. (b) Cloud View of Wind Speed Amplification Factor at 1.5 Meters Height in the Computational Domain.

Table 2.
Summary of the Standard Analysis of No Wind Area/Vortex Area in Summer Working Conditions.

Table 3.
Analysis and Summary of the Wind Speed/Wind Speed Amplification Coefficient Standard in Winter.
The compliance status of vortex and windless areas in the pedestrian zones of the residential area during summer is summarized in Table 2. As depicted in Figure 8, no vortex areas are observed within the residential area, aligning with the specified requirements for pedestrian zones, which should ideally have zero vortex areas. However, a windless area exists in the residential area, deviating from the standard, which stipulates that pedestrian zones should have no windless areas. This indicates non-compliance with the specified criteria.
The assessment of winter wind speed and wind speed amplification is presented in Table 3. The applicable conditions for a wind speed of 5 m/s are the main pedestrian walkways around the building (such as roads and squares) and transitional spaces with low pedestrian density (such as courtyard connections). The applicable conditions for a wind speed of 2 m/s are building entrances and exits (lobbies and unit doors) to prevent cold air infiltration and increase heating loads. As illustrated in Figure 9, the wind speed around the existing residential building remains within the range of <5 m/s, with no areas exceeding the limit. Consequently, the result of the judgment reaches the standard.
3.2. Thermal Environment Analysis of Residential Areas
The TERA performs simulation calculations according to the Design standard for thermal environment urban residential area (JGJ 286-2013) [23], and the index system includes the average summer windward area ratio that must be satisfied (as displayed in Table 4), and the summer outdoor activities should be shaded (such as in Table 5) as mandatory provisions.

Table 4.
Average Summer Windward Area Ratio (ζs) Limits for Residential Areas.

Table 5.
Limits of Shading Coverage for Residential Areas (%).
Either prescriptive or evaluative design can be adopted based on this context. The project design must adhere to the prescriptive criteria outlined in Article 4.1.4, Article 4.2.3, Article 4.3.1, and Article 4.4.2 of the literature JGJ 286-2013. If any of these four articles fail to meet the specified criteria, an evaluative design must be conducted using the calculation formulas specified in Article 5.0.1 and Article 5.0.2.
In residential areas, the green area on building roofs must constitute at least 50% of the roof area that can be greened. Additionally, outdoor activity areas and pavement surfaces should be designed to facilitate rainwater infiltration and evaporation. Moreover, the hour-by-hour black sphere temperature in summer in the residential area shall not be greater than 33 °C, and the average heat island intensity in summer should be maintained at or below 1.5 °C.
The building is situated in zone III, and the calculation has the following results:
The average windward area ratio is 0.78, which adheres to the summer limit of ≤0.80 for this ratio. The activity site lacks sunshade facilities, resulting in a sunshade coverage ratio that fails to meet the mandatory requirements. Moreover, since the building’s ground floor has no elevated area, its ventilation elevation rate is effectively 0%. The building is not set up with an arbor and climbing trellis, and the leaf area of the green shading body is 0. The infiltration ratio area is 30%, the groundwater permeability coefficient is 2.5%, and the evaporation rate is 1.78%, all of which fall short of the required standards for infiltration and evaporation. There is no greening on the roof, and the greening rate of the roof does not meet the standard. However, the average heat island intensity is 1.10 °C, which meets the standard of heat island intensity The maximum wet-bulb black bulb temperature is 18.91 °C—both comply with the respective standards(such as the conclusion in Table 6).

Table 6.
Conclusion of Residential Thermal Environment Analysis.
3.3. Building Energy Efficient Design Analysis
The BECS was used to calculate the 3D monolithic model (e.g., Figure 6). Firstly, the software’s default project settings, structure, and detailed information were modified and corrected according to the project design instructions. Then, the project information was modified; the geographic location was set as Mianyang, and the building type as a residential building. In the professional settings section, the standard was set as “Sichuan Province Energy Saving Design Standard for Residential Buildings” (DBJ51/143-2020) [24]. In the next step, the envelope parameters were inputted, such as wall material, window type, etc., and the window-to-wall ratio and heat transfer coefficient limits were automatically calibrated. In the characteristic table, the engineering detail information was set. Next, data extraction was carried out to perform the energy consumption calculation, energy saving check, and output energy saving report. For example, when setting up the project structure, the exterior enclosure structure materials were set up according to the original information of the building design, the heat transfer coefficient of the roof was set as 0.94 W/m2·°C, the heat transfer coefficient of the exterior wall as 1.2 W/m2·°C, the heat transfer coefficient of the subdivided wall as 1.65 W/m2·°C, and so on, which are all in line with the energy-saving design standards. Due to the large number of parameters, other parameter settings were omitted.
Subsequently, the data was extracted from the model to facilitate the subsequent energy consumption calculation and energy-saving checking operation. As shown in Table 7, all the prescriptive design indexes of the project meet the requirements of the GB 50189-2015.

Table 7.
Conclusions of Energy Conservation Inspection.
3.4. Sunshine Calculation Analysis
The integrated model was imported into the SUN software to perform standardized analyses, including window illuminance assessment, shading patterns, real-time daylight simulation, daylight area quantification, as well as panoramic daylight visualization.
The software calculation is based on the Standard for Urban Residential Area Planning and Design (GB 50180-2018) [25], Standard for Building Daylight Calculation Parameters (GB/T 50974-2014) [26], and the Uniform Standard for Design of Civil Buildings (GB 50352-2019) [27]. The software’s global settings were modified before analysis, and the daylight standard was set according to the GB 50736-2012 requirements (e.g., Table 8). The sunshine requirement stipulates a minimum of 3 h of sunlight on a cold day. The analysis scale and unit were set at 1:500 mm. The analysis was conducted between 8:00 am and 4:00 pm. Subsequently, the models for window elevations, non-enclosed balconies or balcony-like shelters, and roof shelters were generated for the single model of the combined model. This was followed by numbering windows, assigning sub-household numbers to windows, and grouping architectural elements. Finally, the simulation analysis commenced.

Table 8.
Sunshine Standards for Residential Buildings.
The results of the sunlight analysis are demonstrated in Table 9, which does not satisfy 390 households, and Table 9 does not satisfy (GB 50180-2018), accounting for 56%. The results of other analyses are depicted in Figure 10.

Table 9.
Sunshine Analysis Results of the Bohua Dormitory Building.
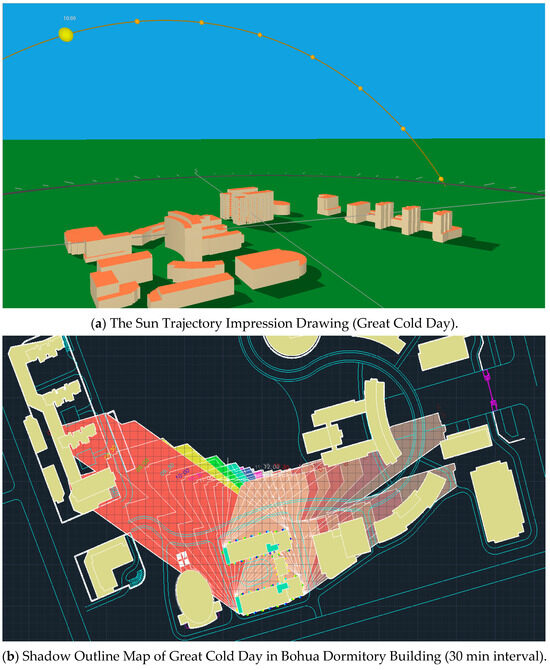
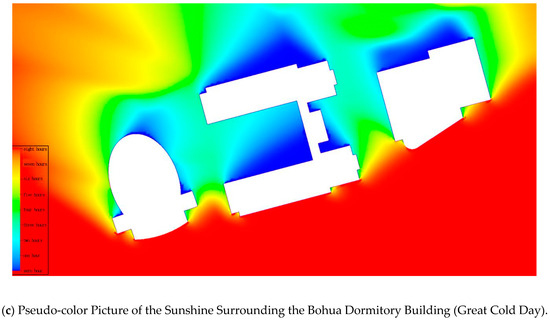
Figure 10.
Sunshine Simulation Analysis of the Combined Model. (Red for high temperatures, color gradient bars for decreasing temperatures and blue for low temperatures in the figure).
3.5. Building Day Lighting Calculation Analysis
The DALI was utilized for computational analysis and structured into four distinct modules: daylighting modeling, daylighting setup, analysis and calculation, and result output. This software enables direct daylighting analysis using a 3D combined model (e.g., Figure 7). After the global settings were used to determine the lighting calculation conditions and parameters, room type settings were used to establish lighting level requirements for each space, and the accurate selection of regional locations along with their corresponding light climate zones, the software’s built-in lighting engine was subsequently employed to conduct the lighting analysis.
Through the lighting analysis, the lighting effect of the standard requirements of the room in the project, according to the “Standard for Daylighting Design of Building” (GB 50033-2013) [28] requirements of the room, house type situation is summarized in Table 10. From this table, it can be concluded that natural interior lighting does not meet code requirements. The building has an “H”-shaped layout with a main body height of over 40 m. Its unique plan form results in a significant lack of sunlight hours in the winter on cold days for the opposite types of units between the two wings of the building, and some of the units are not even able to meet the minimum sunlight standards.

Table 10.
Lighting Analysis of the Room and House Type Situation Summary.
3.6. Indoor Thermal Comfort Evaluation Analysis
The three-dimensional monolithic model is imported into the ITES, and its calculation is mainly based on the “Evaluation Standard for Indoor Thermal Environment in Civil Building” (GB/T 50785-2012) [29]. The first calculation step involves determining the flow rate and temperature distribution of the indoor wind field. The second step simulates the distribution of evaluation indices for the indoor heat and humidity environment. In the final step, the PMV (Predicted mean vote) and PPD (Predicted Percentage of Dissatisfied) are calculated to meet the standard.
PPD represents the average expected vote from people in hot and humid environments who express dissatisfaction with their environment, effectively indicating the percentage of people who are dissatisfied with the environment. The predicted mean heat sensation index PMV is the average index of the crowd’s vote on the heat sensation level. The correlation between PMV and human heat sensation is illustrated in Table 11.

Table 11.
Relationship Between PMV and Human Thermal Sensation.
The relationship between PMV and PPD is depicted in Figure 11, where PMV reflects the subjective evaluation of the vast majority of the number of participants. Specifically, when PMV is 0, and PPD is 5%, it implies that approximately 5% of individuals may still perceive the environment as slightly warm or cool.
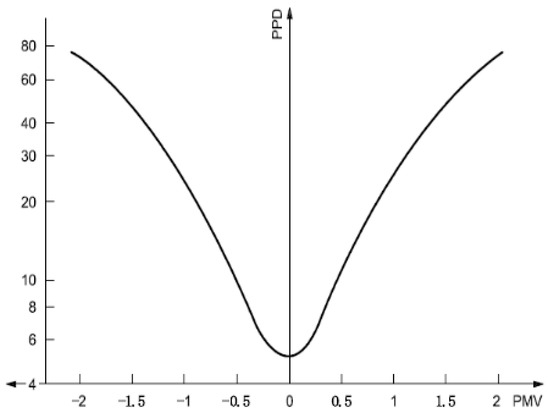
Figure 11.
The Relationship Between PMV and PPD.
The project employs Computational Fluid Dynamics (CFD) simulations guided by the parameters specified in Table 12 to examine the temperature and velocity fields within the indoor environment. The project assessed adherence to PMV and PPD standards through established thermal comfort assessment metrics.

Table 12.
Indoor Environment Calculation Parameters.
As illustrated in Figure 12, the simulation results for the southern section of the ground floor reveal that 34.27% of the analyzed area meets Class II thermal comfort standards for both PMV and PPD indices. In accordance with Section 5.2.9 of China’s Green Building Evaluation Standard (GB/T 50378-2019), this performance qualifies for two points.
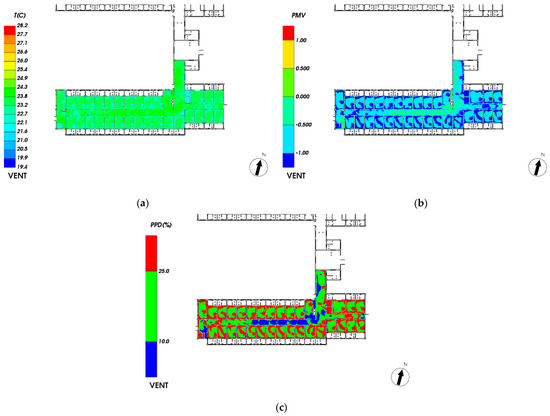
Figure 12.
Simulation and Analysis of the Heat and Wet Environment of the South Building of the First Ground Floor. (a) Temperature Field Distribution at the Pedestrian Height. (b) PMV Distribution at the Pedestrian Height. (c) PPD Distribution at the Pedestrian Height.
4. Discussion
4.1. Retrofitting Recommendations
According to the “Assessment Standard for Green Retrofitting of Existing Buildings” GB/T51141-2015 [30], the following retrofit suggestions are proposed to utilize the energy-saving potential of the building and to improve the efficiency of energy use.
4.1.1. Suggestions on Energy Consumption Modification of Enclosure Structure and Equipment
The heat insulation form of the building envelope significantly impacts indoor thermal stability and air conditioning energy demands. Enhancing the envelope’s insulation performance helps sustain a more comfortable indoor climate while concurrently lowering air conditioning loads [31]. Targeted renovation of the building envelope can involve rectifying and repairing uneven, weathered, or damaged parts of the indoor wall to maintain a clean and orderly appearance. Given that the building floor is high and the exterior wall is laid with ceramic tiles, it is difficult to set the outer insulation layer and integrate civil decoration construction. If necessary, the inner insulation layer and curtains can be added to increase the indoor heat insulation ability, reduce indoor heat loss, and reduce the air conditioning load [32]. Utilizing solar energy can reduce the load on heating and cooling systems and improve the performance of hot water and air conditioning [33,34]. Reasonable selection of the number and capacity of units, optimization of indoor air-conditioning systems, and the use of frequency conversion technology significantly reduce equipment energy consumption.
4.1.2. Suggestions on Room Lighting and Thermal and Humid Environment Renovation
Room lighting has a significant impact on human health and energy efficiency, and the implementation of external shading measures can also affect lighting to some extent [35]. Based on the analyses in Section 3.5 (daylighting), Section 3.6 (indoor heat environment), the daylighting in this building’s rooms falls short of standards. To minimize reliance on artificial lighting and leverage natural energy-saving renovations, it is recommended to install adjustable baffle boards on balconies. These will effectively channel natural light indoors, reduce indoor water vapor, improve the indoor heat and humidity environment, and, to a certain extent, reduce indoor artificial light sources, thereby achieving the energy-saving goal. Choose curtains with good light transmission, such as semi-transparent voile curtains, to ensure privacy while maximizing the amount of natural light entering the dormitory. For example, it is expected to increase the light factor in areas with substandard lighting to 78 percent. It is important to provide suitable ventilation openings for dormitory doors, windows, walls, etc. so that good air convection can be created. Using the principle of hot air rising, hot and humid air is expelled.
4.1.3. Suggestions on Renovation of Outdoor Site Layout and Ventilation Environment
The change in airflow parameters will affect the objective parameters from the physical perspective and the physiological indexes of the human body [36,37,38]. Optimal building orientation and site layout not only enhance the building’s aesthetic appeal but also ensure outdoor comfort and facilitate natural ventilation, thereby improving the overall indoor environment. Based on the residential thermal environment analysis in Section 3.2 and the outdoor wind environment in Section 3.1, the building site’s limited shading rate, along with windless and vortex areas in the wind field, significantly hinders outdoor heat dissipation and dilution of pollutants. Since the layout and orientation of the existing building cannot be changed, green areas and various kinds of vegetation can be added around the building to increase the shading rate of the site and optimize outdoor wind field patterns [39]. If the above measures are applied, the wind-free zone in summer will disappear, and energy efficiency standards will be met.
4.2. GBSWARE in the Application of Green Building Advantages
Building energy modeling (BEM) based on building information modeling (BIM) has been a hot topic in academia and industry in recent years [40]. The need for digitization is increasing as the building industry is under pressure to solve long-term challenges [41]. Through digitization, the required data is carried on the model as the carrier, and the data is transmitted, shared, and synchronized in different simulation analysis software or data interaction platforms. For example, BECS is a type of Building Energy Modelling (BEM). The 3D monomer analysis model of this project (as depicted in Figure 6) is fully constructed using Autodesk Revit 2018 and subsequently imported into BECS for data transfer. This model is not only limited to energy-saving design analysis but can also be imported into other GBSWARE software. After undergoing simple model processing and necessary global settings, it becomes amenable to simulation analysis. This approach effectively reduces the repeated modeling process, enhances information utilization efficiency, and effectively addresses mechanical inefficiencies like repetitive modeling and corrections in projects. Compared to traditional manual field measurements, GBSWARE simplifies the green building design and evaluation process. From the digital modeling of the actual project to GBSWARE’s simulation and analysis report, and finally, to the application materials of green building evaluation and identification, the main process can be accomplished through software. GBSWARE’s diverse simulation and analysis results for this project serve as valuable inputs for planning green building strategies, informing energy-saving transformation of existing buildings, and compiling application materials for green building certifications. Automating manual field operations, data compilation, and other repetitive processes significantly enhances work efficiency.
5. Conclusions
In building design, the building itself should be comprehensively analyzed in all aspects, and different energy-saving measures should be implemented based on the building’s specific characteristics and current energy consumption patterns, thereby uncovering its full energy-saving potential. At present, the transition from traditional buildings is now essential, with an increasing number of projects requiring BIM and green building design expertise. In this paper, we mainly used Swire’s green building software suite to analyze the energy consumption of the Bohua dormitory building. Our findings indicate that while the building’s energy-saving design meets the requirements, room lighting and indoor thermal comfort fall short. Additionally, the outdoor wind environment exists in the wind-free zone, the wind speed amplification coefficients exceed limits, and the residential thermal environment fails to meet the requirements. Consequently, future renovations of the existing building must be guided by the analytical findings, implementing targeted measures to address each deficient aspect. The software and simulation analysis involved is only a part of the whole BIM technology. At present, green building design and analysis based on BIM are still in their infancy. Software simulations of building energy consumption often overlook the impact of behavioral factors, thereby limiting their ability to comprehensively analyze the influencing factors of building energy consumption. Significant untapped potential remains in the design and simulation of passive energy-saving strategies within BIM for buildings, as well as in the development of self-cleaning and self-regulating technologies for eco-buildings. It is hoped that the simulation and analysis of existing buildings can contribute to BIM and BIM-based green building analysis technologies.
Author Contributions
Conceptualization, H.Y. and J.L.; research Method, H.Y. and J.L.; software, J.L.; formal analysis, H.Y. and J.L.; investigation, X.L.; resources, M.L.; data curation, J.L.; writing the original draft preparation, J.L.; writing—review and editing, H.Y.; project administration, X.L. and M.L.; funding acquisition, H.Y. All authors have read and agreed to the published version of the manuscript.
Funding
This work is supported by the Sichuan Higher Education Institutions Building “Double First-rate” Disciplines Gong ga Program Cultivating Disciplines (Sichuan Education Commission 2023.NO.184) and the Energy Environmental Protection and Smart Energy Conservation Team (MCKYT 202404).
Data Availability Statement
No new data created.
Conflicts of Interest
Jun Liu was employed by Si Chuan NO.11 Construction Co., Ltd. The remaining author declare that the research was conducted in the absence of any commercial or financial relationships that could be construed as a potential conflict of interest.
References
- Cao, Y.; Kamaruzzaman, S.; Aziz, N. Green Building Construction: A Systematic Review of BIM Utilization. Buildings 2022, 12, 1205. [Google Scholar] [CrossRef]
- Zhuang, D.; Zhang, X.; Lu, Y.; Wang, C.; Jin, X.; Zhou, X.; Shi, X. A performance data integrated BIM framework for building life-cycle energy efficiency and environmental optimization design. Autom. Constr. 2021, 127, 103712. [Google Scholar] [CrossRef]
- Waqar, A.; Othman, I.; Saad, N.; Azab, M.; Khan, A.M. BIM in green building: Enhancing sustainability in the small construction project. Clean. Environ. Syst. 2023, 11, 100149. [Google Scholar] [CrossRef]
- Liu, Y.; Li, T.; Xu, W.; Wang, Q.; Huang, H.; He, B.-J. Building information modelling-enabled multi-objective optimization for energy consumption parametric analysis in green buildings design using hybrid machine learning algorithms. Energy Build. 2023, 300, 113665. [Google Scholar] [CrossRef]
- Liao, J.-X.; Jiang, T.-M.; Liu, X.-Y. The Analysis of Green Building System Based on BIM. IOP Conf. Ser. Earth Environ. Sci. 2020, 495, 12054. [Google Scholar] [CrossRef]
- Solla, M.; Elmesh, A.; Memon, Z.A.; Ismail, L.H.; Al Kazee, M.F.; Latif, Q.B.A.I.; Yusoff, N.I.M.; Alosta, M.; Milad, A. Analysis of BIM-Based Digitising of Green Building Index (GBI): Assessment Method. Buildings 2022, 12, 429. [Google Scholar] [CrossRef]
- Zuo, J.; Zhao, Z. Green building research–current status and future agenda: A review. Renew. Sustain. Energy Rev. 2014, 30, 271–281. [Google Scholar] [CrossRef]
- Hwang, B.; Shan, M.; Lye, J. Adoption of sustainable construction for small contractors: Major barriers and best solutions. Clean Technol. Environ. Policy 2018, 20, 2223–2237. [Google Scholar] [CrossRef]
- Shan, M.; Liu, W.; Hwang, B.; Lye, J.-M. Critical success factors for small contractors to conduct green building construction projects in Singapore: Identification and comparison with large contractors. Environ. Sci. Pollut. Res. 2020, 27, 8310–8322. [Google Scholar] [CrossRef]
- Lu, Y.; Wu, Z.; Chang, R.; Li, Y. Building Information Modeling (BIM) for green buildings: A critical review and future directions. Autom. Constr. 2017, 83, 134–148. [Google Scholar] [CrossRef]
- Mohanta, A.; Das, S. Causal Analysis of Slow BIM Adoption in Eastern India with a Special Focus on Green Building Sector. J. Inst. Eng. (India) Ser. A 2022, 103, 319–337. [Google Scholar] [CrossRef]
- De Cian, E.; Sue Wing, I. Global Energy Consumption in a Warming Climate. Environ. Resour. Econ. 2019, 72, 365–410. [Google Scholar] [CrossRef]
- Alwan, Z.; Greenwood, D.; Gledson, B. Rapid LEED evaluation performed with BIM based sustainability analysis on a virtual construction project. Constr. Innov. 2015, 15, 134–150. [Google Scholar] [CrossRef]
- Jalaei, F.; Jrade, A. Integrating building information modeling (BIM) and LEED system at the conceptual design stage of sustainable buildings. Sustain. Cities Soc. 2015, 18, 95–107. [Google Scholar] [CrossRef]
- Häkkinen, T.; Belloni, K. Barriers and drivers for sustainable building. Build. Res. Inf. 2011, 39, 239–255. [Google Scholar] [CrossRef]
- Hwang, B.G.; Tan, J.S. Green building project management: Obstacles and solutions for sustainable development. Sustain. Dev. 2012, 20, 335–349. [Google Scholar] [CrossRef]
- Wong, K.D.; Fan, Q. Building information modelling (BIM) for sustainable building design. Facilities 2013, 31, 138–157. [Google Scholar] [CrossRef]
- Wang, Y.; Zhao, B.; Nie, Y.; Jiang, L.; Zhang, X. Challenge for Chinese BIM Software Extension Comparison with International BIM Development. Buildings 2024, 14, 2239. [Google Scholar] [CrossRef]
- Liu, Q.; Wang, Z. Green BIM-based study on the green performance of university buildings in northern China. Energy Sustain. Soc. 2022, 12, 12. [Google Scholar] [CrossRef]
- CB/T 50378-2019; Assessment Standard for Green Building. China Architecture and Building Press: Beijing, China, 2019. Available online: https://www.eia543.com/documents/14%E5%BB%BA%E7%AD%91%E8%AE%BE%E8%AE%A1%26%E5%AE%A4%E5%86%85%E7%A9%BA%E6%B0%94%E6%B1%A1%E6%9F%93%E7%A0%94%E7%A9%B6/%E7%BB%BF%E8%89%B2%E5%BB%BA%E7%AD%91%E8%AF%84%E4%BB%B7%E6%A0%87%E5%87%86%EF%BC%88GB%20T%2050378-2019%EF%BC%89.pdf (accessed on 7 June 2025).
- GB 50736-2012; Design Code for Heating Ventilation and Air Conditioning of Civil Buildings. China Architecture and Building Press: Beijing, China, 2012. Available online: https://www.codeofchina.com/standard/GB50736-2012.html (accessed on 7 June 2025).
- GB 50189-2015; Design Standard for Energy Efficiency of Public Buildings. China Architecture and Building Press: Beijing, China, 2015. Available online: http://www.gbeca.org/zhuantibaogao/LSJZZCFGHB/ljbz/resource/baffda9af52e75177cb6c0024e818feb.pdf (accessed on 7 June 2025).
- JGJ 286-2013; Design Standard for Thermal Environment of Urban Residential Areas. China Architecture and Building Press: Beijing, China, 2013. Available online: https://www.mohurd.gov.cn/gongkai/zc/wjk/art/2015/art_17339_224855.html (accessed on 7 June 2025).
- GB 50180-2018; Standard for Urban Residential Area Planning and Design. China Architecture and Building Press: Beijing, China, 2018. Available online: http://senyada.com/Uploads/ueditor/file/20220507/6276166ac549e.pdf (accessed on 7 June 2025).
- J10147-2018; Design Standard for Energy Efficiency of Residential Buildings in Sichuan Province. Sichuan Provincial Department of Housing and Urban-Rural Development: Chengdu, China, 2019. Available online: https://www.doc88.com/p-2925958948516.html (accessed on 7 June 2025).
- GB/T50974-2014; Standard for Assessment Parameters of Sunlight on Building. China Architecture and Building Press: Beijing, China, 2014. Available online: https://www.gbwindows.org/upFiles/infoImg/2016052356343253.pdf (accessed on 7 June 2025).
- GB 50352-2019; Uniform Standard for Design of Civil Buildings. China Architecture and Building Press: Beijing, China, 2019. Available online: https://pyso.newswz.cn/upload/202207/202207141825456611.pdf (accessed on 7 June 2025).
- GB 50033-2013; Standard for Daylighting Design of Buildings. China Architecture and Building Press: Beijing, China, 2013. Available online: https://pro5323b5d3-pic11.ysjianzhan.cn/upload/2_15GB50033-2013JZCGSJBZ.pdf (accessed on 7 June 2025).
- GB/T 50785-2012; Evaluation Standard for Indoor Thermal Environment in Civil Building. China Architecture and Building Press: Beijing, China, 2012. Available online: http://www.weboos.cn:8093/assets/basicStandard/std_195713.pdf (accessed on 7 June 2025).
- GB/T51141-2015; Assessment Standard for Green Retrofitting of Existing Building. China Architecture and Building Press: Beijing, China, 2015. Available online: http://www.weboos.cn/assets/basicStandard/std_699357.pdf (accessed on 7 June 2025).
- Tahmasbi, F.; Khdair, A.I.; Aburumman, G.A.; Tahmasebi, M.; Thi, N.; Afrand, M. Energy-efficient building façades: A comprehensive review of innovative technologies and sustainable strategies. J. Build. Eng. 2025, 99, 111643. [Google Scholar] [CrossRef]
- Misiopecki, C.; Grynning, S.; Gustavsen, A. Thermal improvements of box-window using shading attachments. Hot-box measurements. Dev. Built Environ. 2023, 16, 100185. [Google Scholar] [CrossRef]
- Meena, C.S.; Prajapati, A.N.; Kumar, A.; Kumar, M. Utilization of Solar Energy for Water Heating Application to Improve Building Energy Efficiency: An Experimental Study. Buildings 2022, 12, 2166. [Google Scholar] [CrossRef]
- Ruan, X.; Song, Z.; Feng, B.; Peng, C.; Dang, C.; Xie, S.; Dai, B. Eco-friendly combined heating and cooling system integrated with solar photovoltaic and energy storage: Thermodynamic performance and carbon emission evaluation. Case Stud. Therm. Eng. 2025, 71, 106132. [Google Scholar] [CrossRef]
- Wang, Y.; Yang, W.; Wang, Q. Multi-objective parametric optimization of the composite external shading for the classroom based on lighting, energy consumption, and visual comfort. Energy Build. 2022, 275, 112441. [Google Scholar] [CrossRef]
- Tham, K.W. Indoor air quality and its effects on humans—A review of challenges and developments in the last 30 years. Energy Build. 2016, 130, 637–650. [Google Scholar] [CrossRef]
- Tamura, K.; Matsumoto, S.; Tseng, Y.H.; Kobayashi, T.; Miwa, J.; Miyazawa, K.; Hirao, T.; Matsumoto, S.; Hiramatsu, S.; Otake, H.; et al. Physiological and subjective comfort evaluation under different airflow directions in a cooling environment. PLoS ONE 2021, 16, e249235. [Google Scholar] [CrossRef]
- Tamura, K.; Matsumoto, S.; Tseng, Y.H.; Kobayashi, T.; Miwa, J.; Miyazawa, K.; Matsumoto, S.; Hiramatsu, S.; Otake, H.; Okamoto, T. Physiological comfort evaluation under different airflow directions in a heating environment. J. Physiol. Anthropol. 2022, 41, 16. [Google Scholar] [CrossRef] [PubMed]
- Wong, N.H.; Tan, C.L.; Kolokotsa, D.D.; Takebayashi, H. Greenery as a mitigation and adaptation strategy to urban heat. Nat. Rev. Earth Environ. 2021, 2, 166–181. [Google Scholar] [CrossRef]
- Gao, H.; Koch, C.; Wu, Y. Building information modelling based building energy modelling: A review. Appl. Energy 2019, 238, 320–343. [Google Scholar] [CrossRef]
- Zulu, S.L.; Saad, A.M.; Omotayo, T. The Mediators of the Relationship between Digitalisation and Construction Productivity: A Systematic Literature Review. Buildings 2023, 13, 839. [Google Scholar] [CrossRef]
Disclaimer/Publisher’s Note: The statements, opinions and data contained in all publications are solely those of the individual author(s) and contributor(s) and not of MDPI and/or the editor(s). MDPI and/or the editor(s) disclaim responsibility for any injury to people or property resulting from any ideas, methods, instructions or products referred to in the content. |
© 2025 by the authors. Licensee MDPI, Basel, Switzerland. This article is an open access article distributed under the terms and conditions of the Creative Commons Attribution (CC BY) license (https://creativecommons.org/licenses/by/4.0/).