Abstract
Understanding the hierarchical patterns of building heights is essential for sustainable urban development and planning. This study presents a novel approach for detecting and comparing building height hierarchies in four major bay areas: the San Francisco Bay Area, the New York Bay Area in the United States, the Tokyo Bay Area in Japan, and the Guangdong-Hong Kong-Macau Greater Bay Area in China. Kernel density estimation was first used to create continuous spatial distributions of building heights, forming the basis for our analysis. The approach then uses the contour tree algorithm to abstract and visualize these hierarchies. A structural similarity index is proposed to compare the hierarchies by identifying the maximum common sub-contour tree across the different contour trees. The results reveal that all four bay areas exhibit a multi-core hierarchical structure, with the greater bay area exhibiting the most complex pattern. Quantitative comparison reveals that the building height hierarchies of the New York Bay Area and Tokyo Bay Area are most similar (similarity index = 0.74), while those of the San Francisco Bay Area and Greater Bay Area are the least similar (similarity index = 0.17). Our approach provides a practical tool for understanding building height hierarchies and can be readily applied to analyze diverse spatial patterns.
1. Introduction
Buildings are the physical manifestation of urban form and function, playing a crucial role in shaping the urban environment and influencing various aspects of city life [1]. The structures of urban buildings within the context of rapid urbanization demonstrate a pronounced trend toward three-dimensional vertical expansion [2,3,4], exerting a significant impact on urban human societies and natural/physical environments [5,6,7]. Numerous studies have demonstrated that the vertical growth of buildings can modify local climate conditions [8], shape land use patterns [9] and transportation systems [10,11], and influence urban biodiversity and social dynamics [12]. Therefore, the scientific exploration and comprehension of vertical urban building structures are indispensable for fostering sustainable urban development [5,13], improving the quality of life [14,15], and addressing the complex challenges faced by rapidly growing cities [16].
Building height is a fundamental metric for comprehending the vertical dimension of urban spaces [17]. Building height data has been established as a critical input for urban climate models [18], sprawl analyses [19], resilience planning [20], and energy consumption [21]. Currently, height information can be derived from various data sources, such as optical images [22,23], synthetic aperture radar (SAR) images [24,25], Light Detection and Ranging (LiDAR) data [26,27,28], and digital surface model (DSM) products [24,29]. These multi-source building height data provide an advantageous data foundation for analyzing urban building 3D morphology at different scales.
The hierarchical organization of the urban built environment has long been recognized as a key factor in how humans perceive and interact with urban spaces. Research in 3D spatial cognition [30,31,32] has demonstrated that individuals naturally categorize and structure spatial information hierarchically, utilizing features such as building height and spatial relationships. This aligns with principles of urban morphology, which conceptualize cities as complex systems comprising nested spaces and structures [33,34]. Consequently, the hierarchical representation of building height patterns aligns with these cognitive processes, providing a framework for analyzing the visual complexity, coherence, and diversity of urban landscapes [35]. One of the most popular approaches to studying urban building hierarchical patterns is computing building metrics [6]. Building metrics are quantifiable parameters that offer a structured framework for analyzing urban 3D morphology and hierarchical patterns [36,37]. Many metrics that are related to the 3D characteristics of the buildings, such as height, area, volume, and density, provide a comprehensive understanding of the building’s structural and geometric properties [38,39]. Some studies [40,41] also employed landscape metrics (i.e., patch index, convexity, fractality, rectangularity, and cubic index) to describe the urban building patterns in 2D and 3D scales.
Analysis of the spatial patterns of urban building hierarchy necessitates a foundation in the spatial distribution of buildings, complemented by the exploration of building morphological characteristics. Consequently, spatial-based methods, such as Minimum Spanning Tree (MST) [42,43], concentric rings [5], and building density-derived contours [44,45], have been extensively studied. The MSTs that link each building to its neighbors based on the minimum distance can be utilized to differentiate heterogeneous or homogeneous settlements and to characterize local urban patterns [43,46]. The concentric ring-based method divides metropolitan areas into concentric zones. It summarizes the building characteristics within each zone and helps researchers gain insights into the morphological changes that occur as one moves from the city center to the periphery [47,48]. The contour-based method generates contours from the building density grid and identifies structured building patterns by identifying the topology and relationships between contours [26,45]. These spatial-based methods have played a pivotal role in elucidating urban building spatial distribution and dynamics. However, most studies have been narrowly focused on analyzing single cities, with a scarcity of comparative research across diverse cities.
Building height is a crucial indicator of urban density, and the hierarchical patterns of building height reflect a city’s urban form and development dynamics [27]. Comparing these patterns across different cities provides insights into the historical, cultural, and economic factors that shape urban growth and evolution [36,48] and can help assess the compactness and sustainability of urban areas, which are crucial for efficient land use and resource management [49]. Spatial pattern comparison, which studies two or more spatial patterns to characterize their degree of similarity or difference, is a solution for exploring the multi-city variations of building height patterns [50]. As most studies investigated the building morphological indicators and their spatial distributions, the multi-city/region comparison of building height hierarchical patterns assumes heightened significance and urgency.
The world’s four major bay areas, including the San Francisco Bay Area (SFBA) and New York Bay Area (NYBA) in the United States, the Tokyo Bay Area (TBA) in Japan, and the Guangdong-Hong Kong-Macao Bay Area (GBA) in China, have a proven reputation for powering economic growth and urbanization [51]. As the major and representative urban agglomerations, understanding the building height hierarchy within the four major bay areas holds significant implications for sustainable urban development. To our knowledge, few studies have been conducted to compare cross-bay areas’ building hierarchy patterns. To this end, this investigation is grounded in two questions: (1) How can the hierarchical patterns of building heights be comparatively analyzed across different bay areas? (2) Do the hierarchical patterns of building heights within the world’s four major bay areas exhibit similarities or differences? This study addresses these questions by introducing a novel method for deriving building height hierarchies and a complementary structural similarity index, designed to enable cross-city comparisons of these hierarchies.
2. Study Area and Data
2.1. Study Area
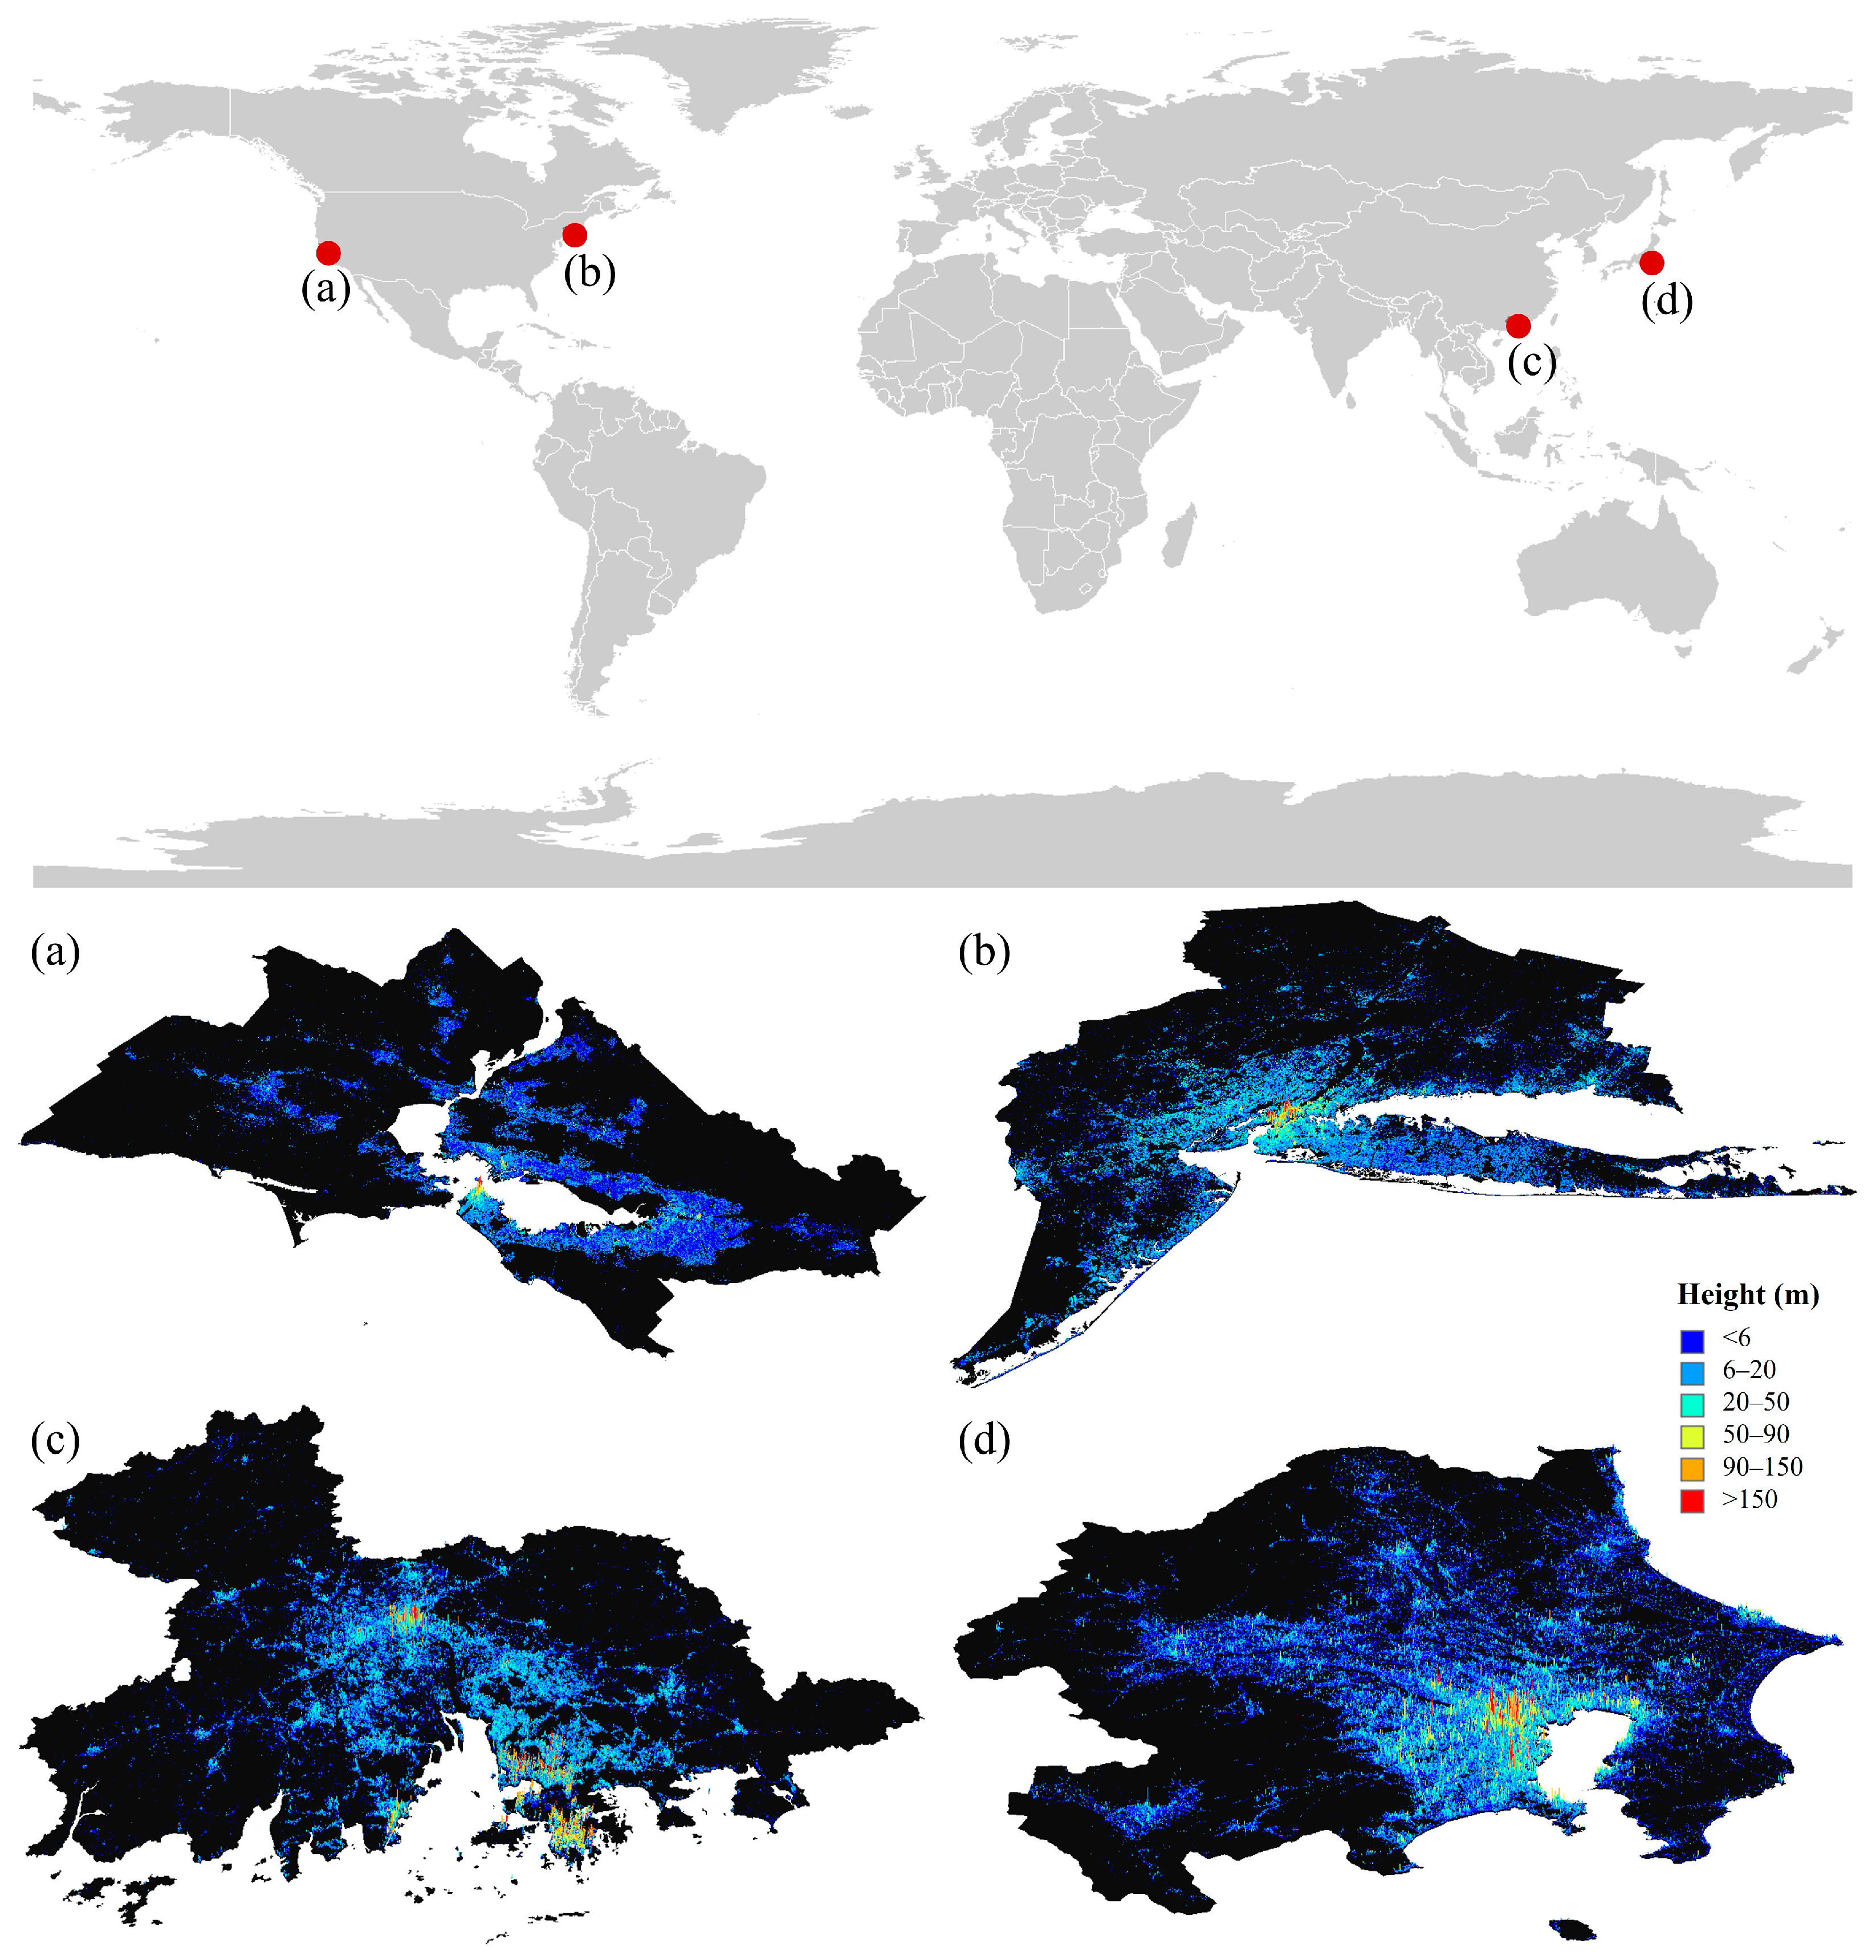
Our study areas are the world’s four major bay areas (as depicted in Figure 1), including the SFBA, the NYBA, the TBA, and the GBA. These four bay areas have emerged as pivotal economic hubs and are characterized by their unique contributions to global economic activity. SFBA, centered around the San Francisco Bay in the United States, is renowned for its preeminence in the technology sector. NYBA, often called the world’s financial capital, encompassing Manhattan Island and its surrounding areas, is a cornerstone of global finance. Financial services and related sectors drive its economy. NYBA is home to several leading tech giants and is a hub for innovation and entrepreneurship. TBA stands out in Japan for its robust industrial base, contributing significantly to the nation’s economic prowess. TBA is a testament to the region’s advanced manufacturing capabilities. GBA, located in Southern China, combines the strengths of a dynamic manufacturing base with the advanced services sector. GBA is the only bay area that integrates two economic and three legal tender systems, making it a diverse and complex economic zone.

Figure 1.
The location and building height data for the four major bay areas: (a) SFBA, (b) NYBA, (c) GBA, and (d) TBA.
The selection of the four bay areas as case studies is based on two principal considerations. Firstly, these regions represent large-scale, complex urban systems globally, characterized by intricate built environments and significant variations in building height. This complexity makes them suitable for evaluating the robustness and efficacy of the novel methodology proposed in this study. Secondly, all four bay areas function as major global economic hubs. Investigating the variations in building height hierarchies across these economically pivotal regions facilitates the elucidation of the underlying drivers and emergent trends in the morphological development of diverse urban systems.
2.2. Data
This study’s primary dataset is the World Settlement Footprint 3D (WSF 3D) [2]. WSF 3D is a comprehensive geospatial information resource that offers a detailed three-dimensional representation of human settlements across the globe at a resolution of 90 m. The WSF 3D dataset comprises several key metrics, including building area, height, volume, and fraction, collectively providing a detailed characterization of urban building structures. Each of these metrics is derived from satellite imagery and represents a critical aspect of urban morphology, offering insights into human settlements’ structural and functional aspects. More importantly, the dataset’s resolution and accuracy allow for a detailed analysis of urban growth patterns, building typologies, and spatial variations within and between cities [5]. This study focuses on the building height data derived from WSF 3D data, as illustrated in Figure 1. The WSF3D data can be downloaded from the EOC Geoservice platform (https://geoservice.dlr.de/web/datasets/wsf_3d (accessed on 10 December 2024)). The downloaded building height data are provided in raster format with a spatial resolution of 90 m. Subsequently, we utilized the geographical boundaries of the four selected bay areas to clip the corresponding building height data for each individual region.
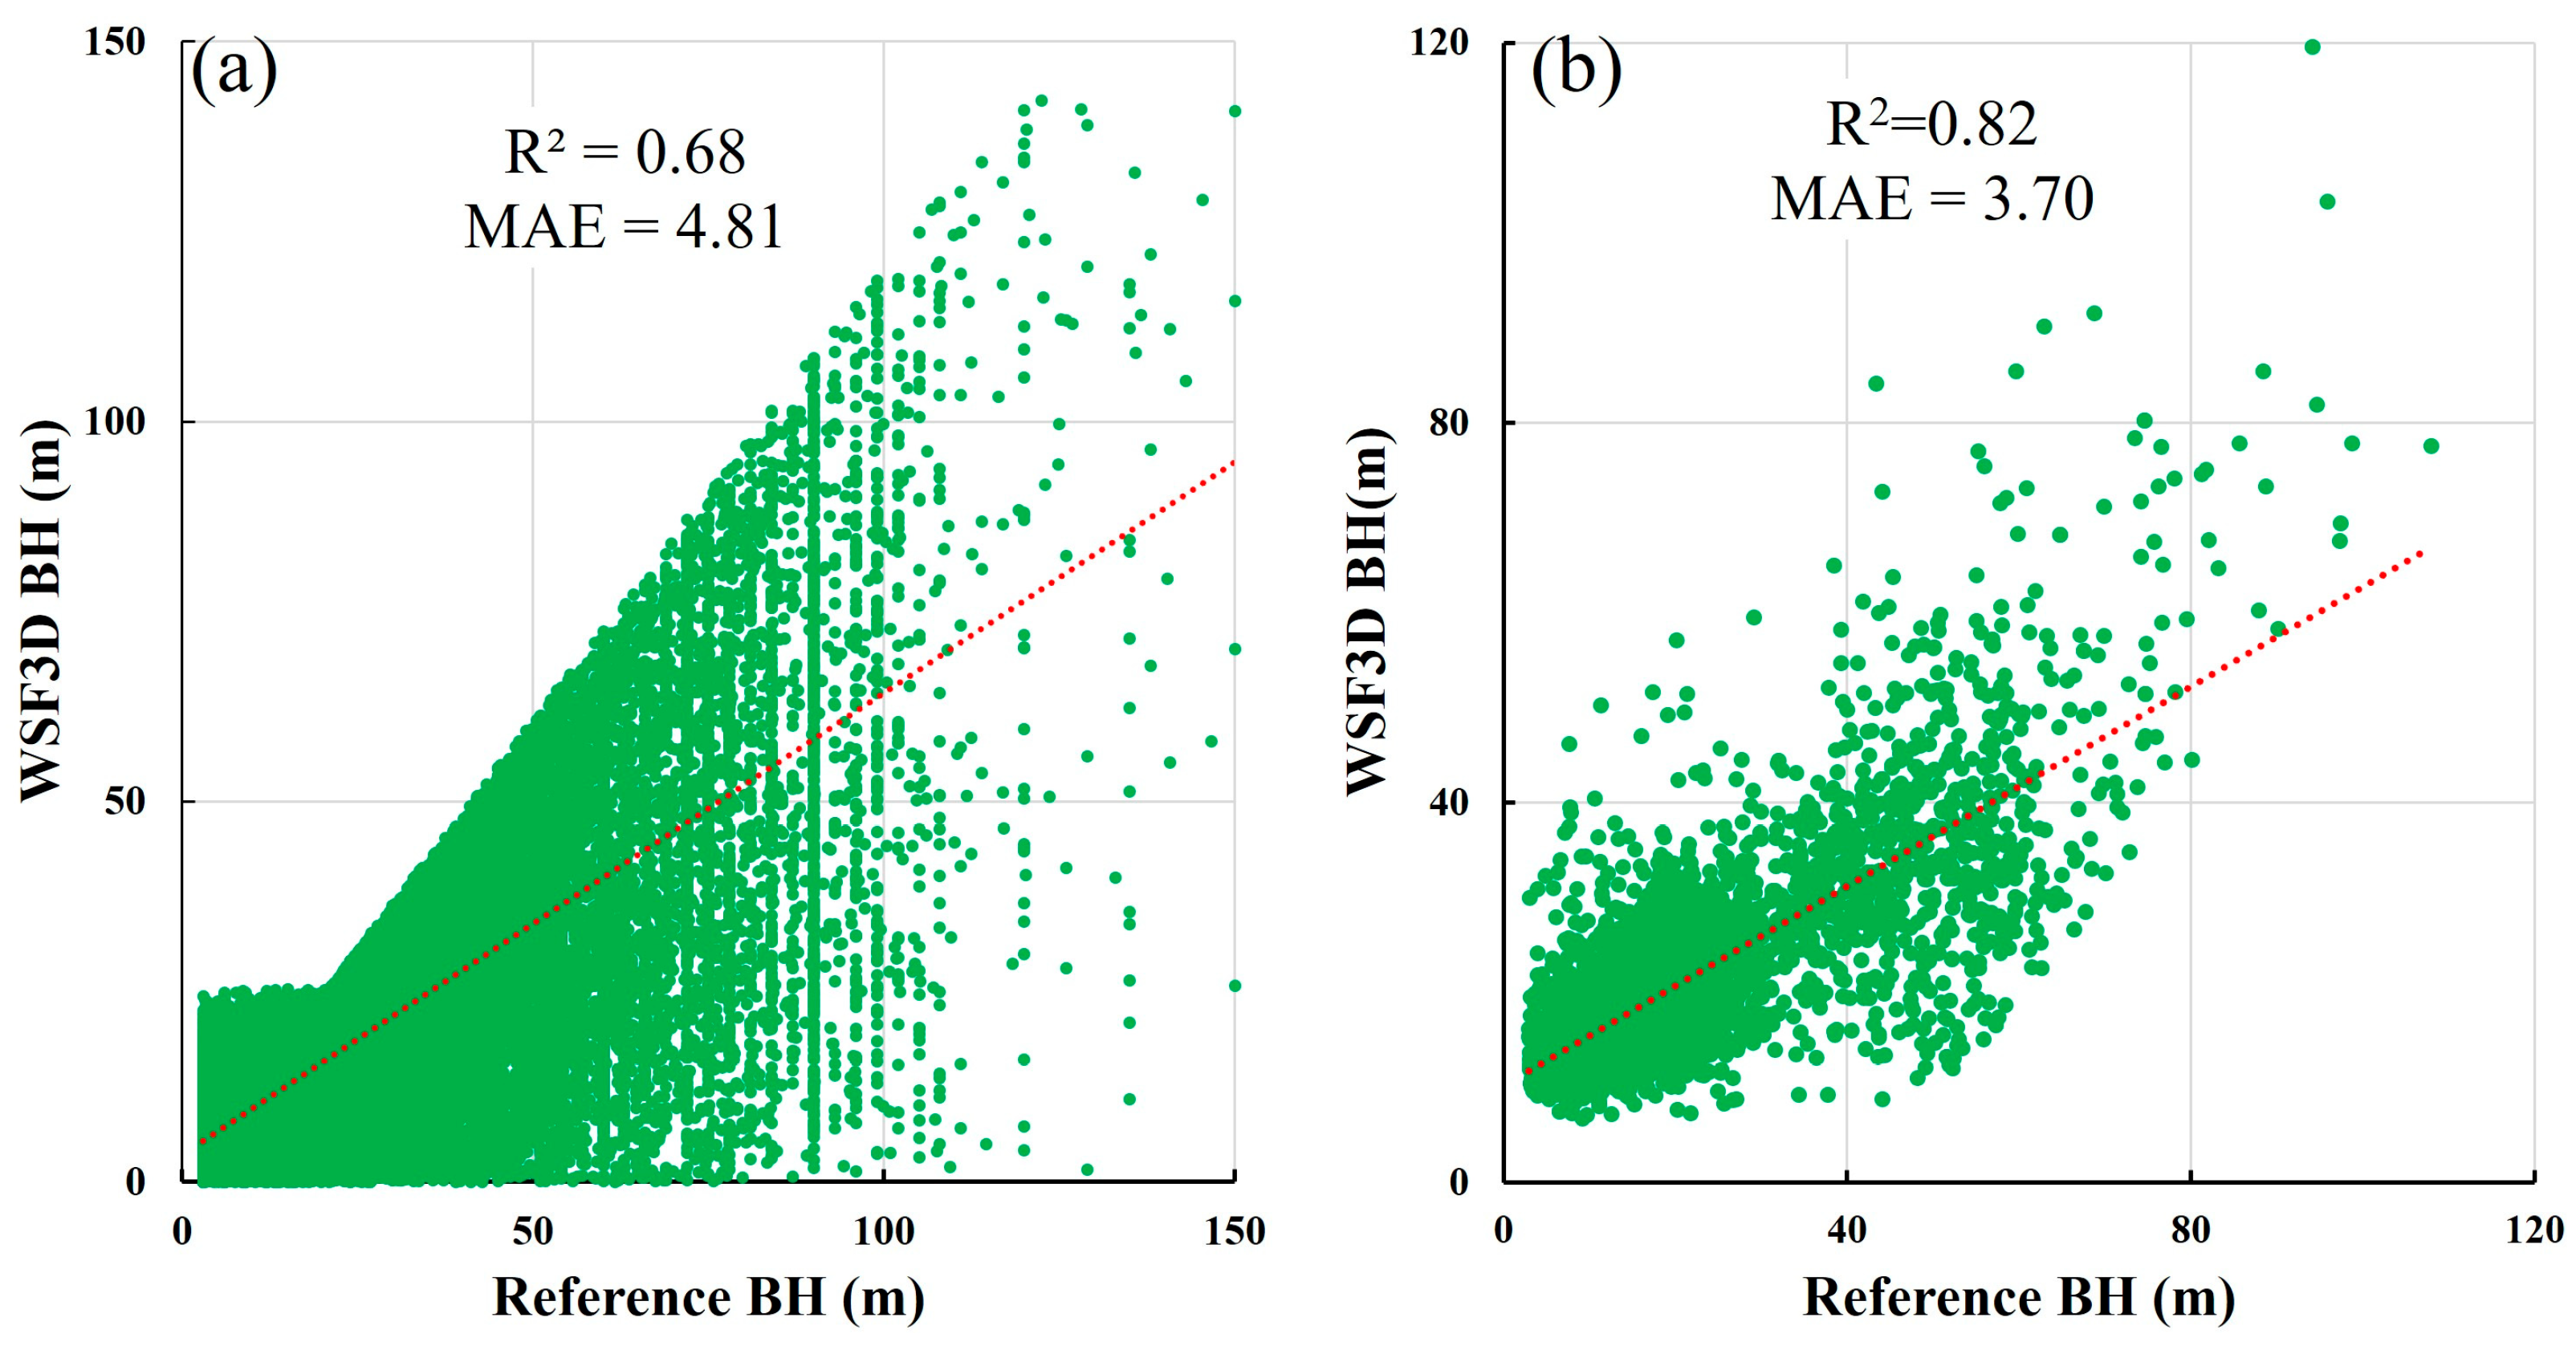
An experiment was conducted to assess the accuracy of the WSF3D building height data. Two vector-based building datasets, serving as reference data, were employed for validation. One dataset, encompassing Guangzhou and Shenzhen within the GBA, was sourced from Amap (https://amap.com/ (accessed on 25 May 2021)), while the other, covering New York City, was obtained from the NYC Department of Information Technology and Telecommunications. Both datasets document the number of building floors. Consequently, building height was estimated by multiplying the number of floors by a standard floor height of 3 m [52,53,54]. These vector-based building datasets were aggregated into a 90 m resolution grid using an averaging method to facilitate building height validation. The aggregated grids were subsequently compared to the WSF3D building height data, with the results illustrated in Figure 2. The analysis reveals that the WSF3D building height data demonstrate an accuracy of R2 = 0.68 and MAE = 4.81 m in the GBA, and an accuracy of R2 = 0.82 and MAE = 3.70 m in the NYBA. Therefore, we conclude that the WSF3D building height data are reliable for the purposes of this study.

Figure 2.
The accuracy of WSF3D building height data in GBA (a) and NYBA (b).
3. Method
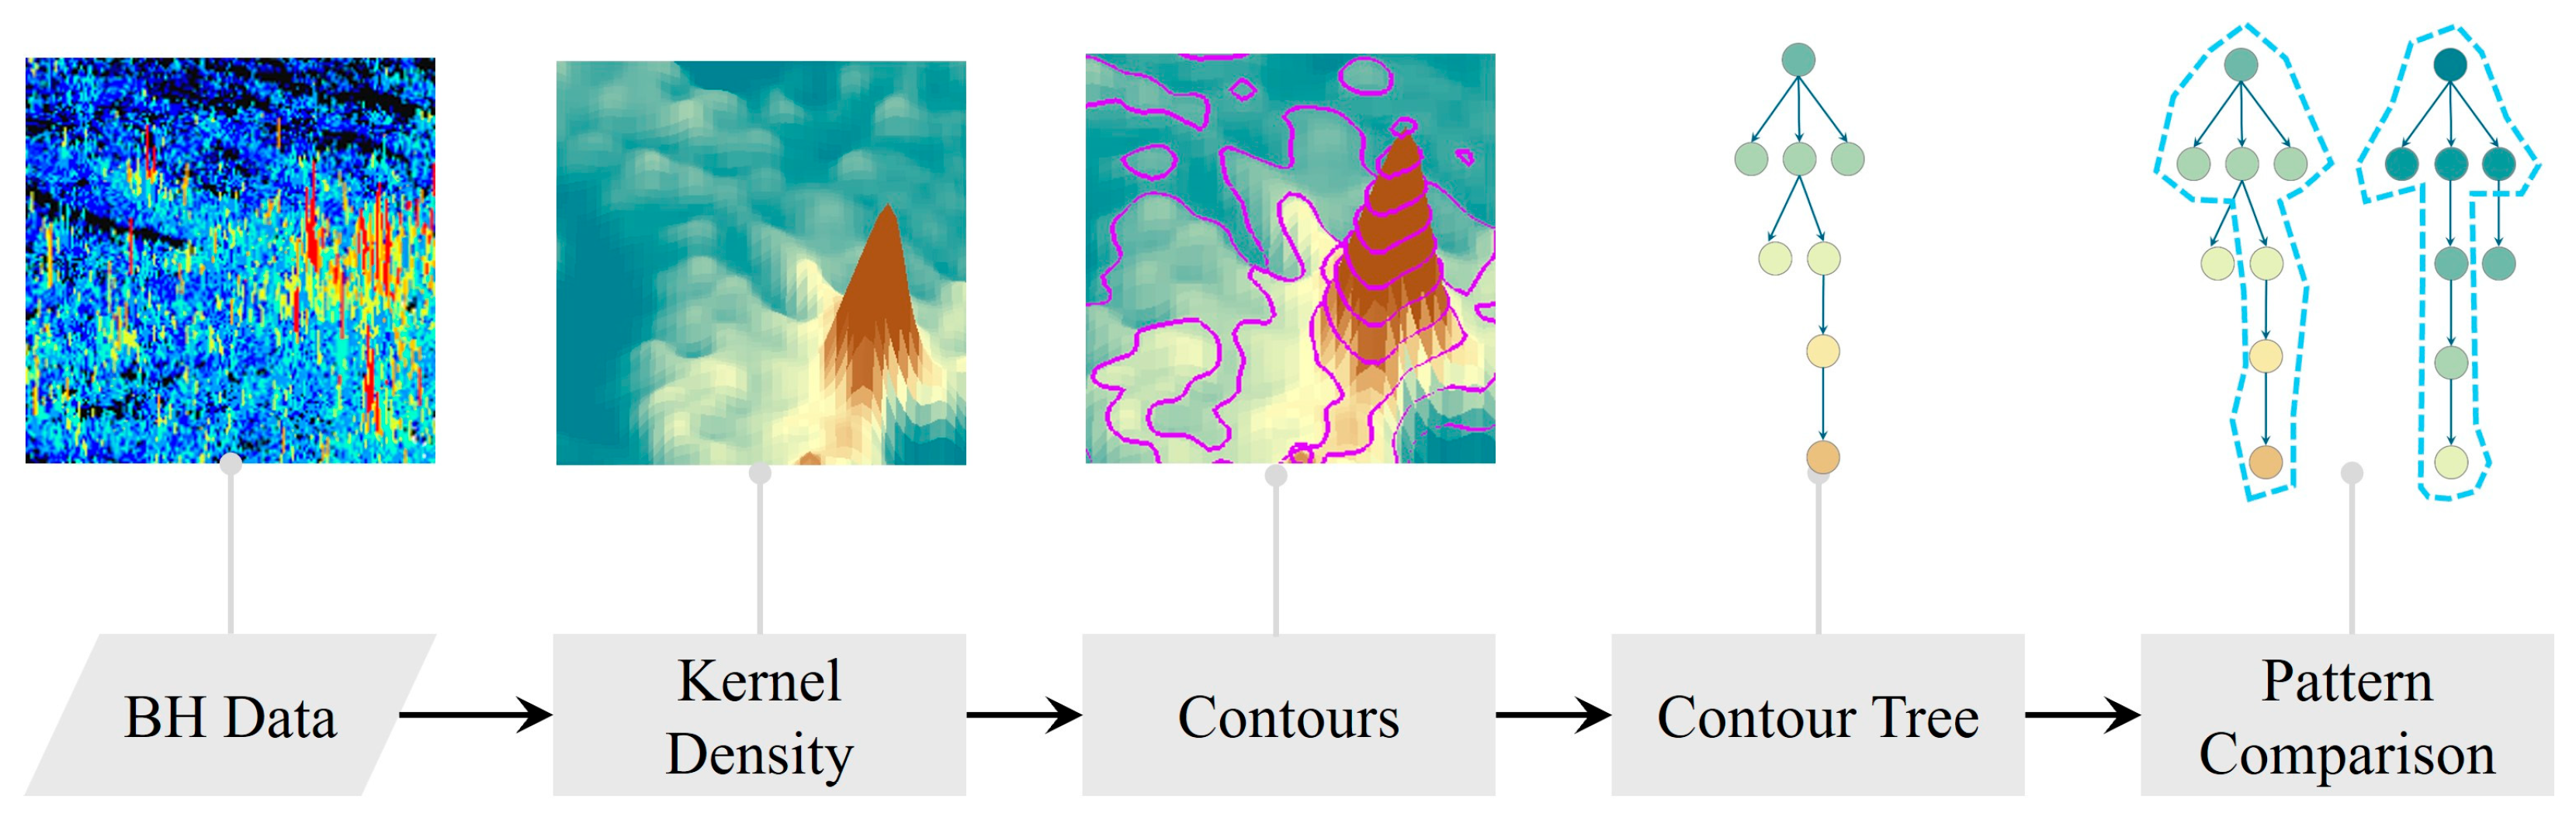
The methodological framework is illustrated in Figure 3. Initially, based on the building height data, we employ kernel density estimation (KDE) to generate a continuous density map of building heights. Subsequently, we utilize the contour tree method to extract the hierarchical graph structure from this density map, which serves as an abstract representation of the building height patterns within each bay area. Finally, utilizing these graph-based contour trees, we pairwise identify the maximum common sub-contour tree and propose a structural similarity index to quantify the degree of similarity between them. This approach facilitates the comparative analysis of building height hierarchies across the different bay areas.

Figure 3.
Flowchart of the research.
3.1. Theoretical Basis
The spatial organization of urban development is largely manifested through the spatial arrangement of buildings [45]. A fundamental characteristic is the higher density of tall buildings and human activities observed in urban centers relative to peripheral areas. This spatial pattern often indicates a positive correlation between building height and human activity density [5]. Therefore, the building height density within a region can be conceptualized as a continuous surface, which serves as a proxy for the intensity of human activity, with urban centers analogous to peaks, which are represented by a set of contour lines with higher building height values. Therefore, the detection of urban morphological structures corresponds to identifying specific contours within the building height data. The contour tree represents a graph-based abstraction of these contours, and it has been demonstrated to effectively capture significant morphological differences between regions. By representing the building height patterns with a contour tree graph structure, the problem of comparing these patterns is transformed into measuring the similarity of two graphs. Thus, the similarity between two contour trees can be quantified by the extent to which their structures overlap or share common features relative to their overall structures.
3.2. Kernel Density Estimation
Given the medium resolution (90 m) of the WSF 3D dataset, which leads to spatial discontinuities in areas with no buildings, a comprehensive analysis of building height hierarchies over extensive regions is hindered. To address this issue, this study utilizes the kernel density estimation (KDE) method to generate a spatially continuous distribution of building heights from the 90 m resolution data. The rationale for employing KDE is that the WSF 3D building heights data can be conceptualized as discrete building height samples, from which the KDE method can derive a probability density function to represent the underlying distribution of building heights effectively. The KDE method facilitates the visualization of spatial distribution characteristics by constructing a smooth surface that calculates the density and frequency surrounding these features. The kernel density at a location (x, y) is determined by the following formula:
where are the input points within the radius distance of the location (x, y), is the building height of point , and represents the distance between point and the location (x, y). The selection of the radius (also called bandwidth) is crucial as it determines the level of synthesis in the results. In this study, we selected a uniform radius value for the four bay areas to ensure the comparability of the results, adopting the default value of 500 m as referenced in the existing literature [5] on urban morphology analysis.
3.3. Contour Tree Representation
The contour tree is a robust data structure that captures the topology of contours and has proven effective in delineating the hierarchical arrangement of surface depressions [55], landscape patterns [56,57], and building structures [26,45]. The contour tree approach provides a tree-like structure that captures the topology of the contours, enabling efficient visual representation of the global hierarchy structure and local hotspots of spatial distribution.
A contour tree comprises nodes and links, with each node standing in for a discrete contour and each edge denoting the topological connection between neighboring nodes. In this structure, nodes are endowed with a single parent node, yet they may have multiple child nodes, except the root node. Generally, constructing a contour tree involves the following steps: (1) creating contours—generating contours from the KDE map at various density intervals effectively captures the variation in building heights across the study area; it is also essential to ensure that only closed contours are retained, and open contours are typically not of interest and should be excluded; (2) sorting the contours by their levels—the contours are first sorted based on their values to ensure that contours with lower values come before those with higher values; (3) finding connected components—for each contour, find the connected components, which are the regions of the domain where the contour is either above or below the domain; and (4) constructing the tree—the contour tree is constructed recursively by organizing the generated contours based on their spatial relationships. This involves establishing parent–child relationships between contours, where higher contours serve as parents to lower ones.
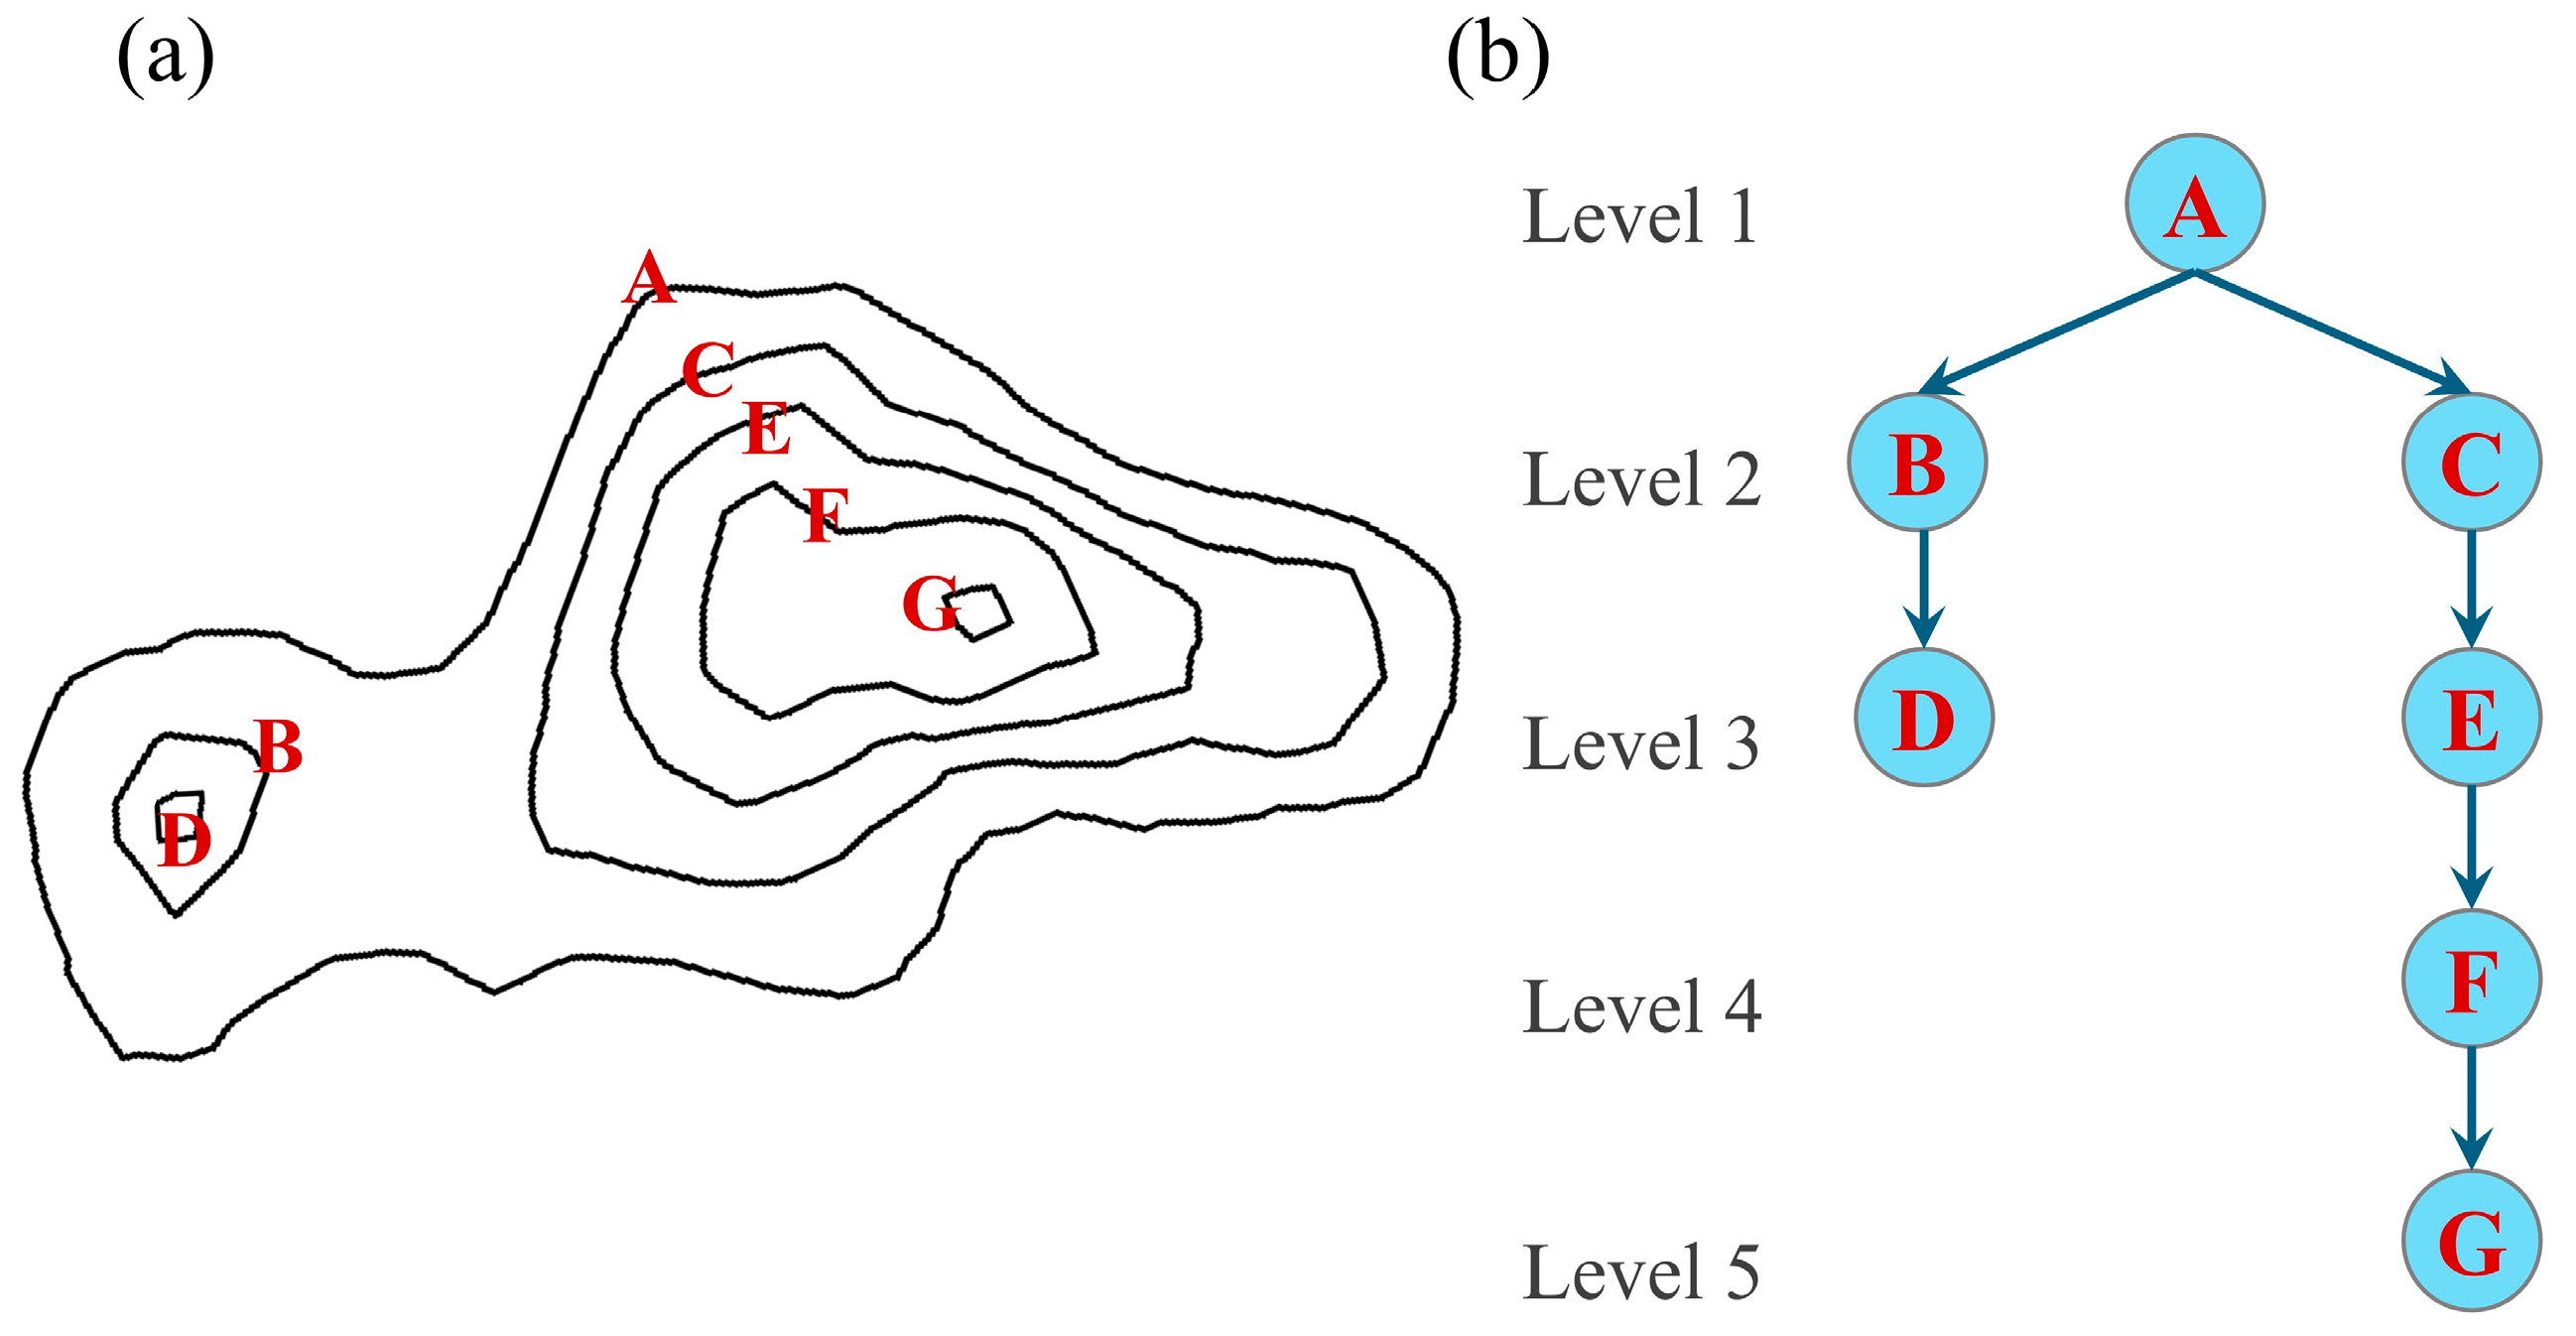
Figure 4 shows an example of a contour tree. Usually, the contour tree can be established from the bottom up, based on the density values. Contour A is identified as the root node with the minimum density value. Contours B and C, adjacent contours of contour A, are determined as child nodes of contour A. Adjacent contours have the same density level and are considered parallel in the contour tree. In contrast, an adjacent contour is identified as a lower level in the tree if it has a higher density level and is contained by other contours. For example, contours B and C, with the same density, are identified as the child nodes of contour A. The iterative procedure finally establishes a multi-branch contour tree (Figure 4).

Figure 4.
Illustration of contour tree. (a) Contours and (b) contour tree representation.
For more complex building height patterns, the contour tree will exhibit multiple branches (also called sub-trees), each representing a relatively homogeneous pattern of building height. The contour tree in Figure 4 can be dissected into two branches, each representing a hierarchical level of the building height pattern. For each spatial pattern under comparison, we extract contours at a consistent set of levels and construct their respective contour trees. This ensures that the comparison is made at a standard topological level.
3.4. Contour Patterns’ Similarity Calculation
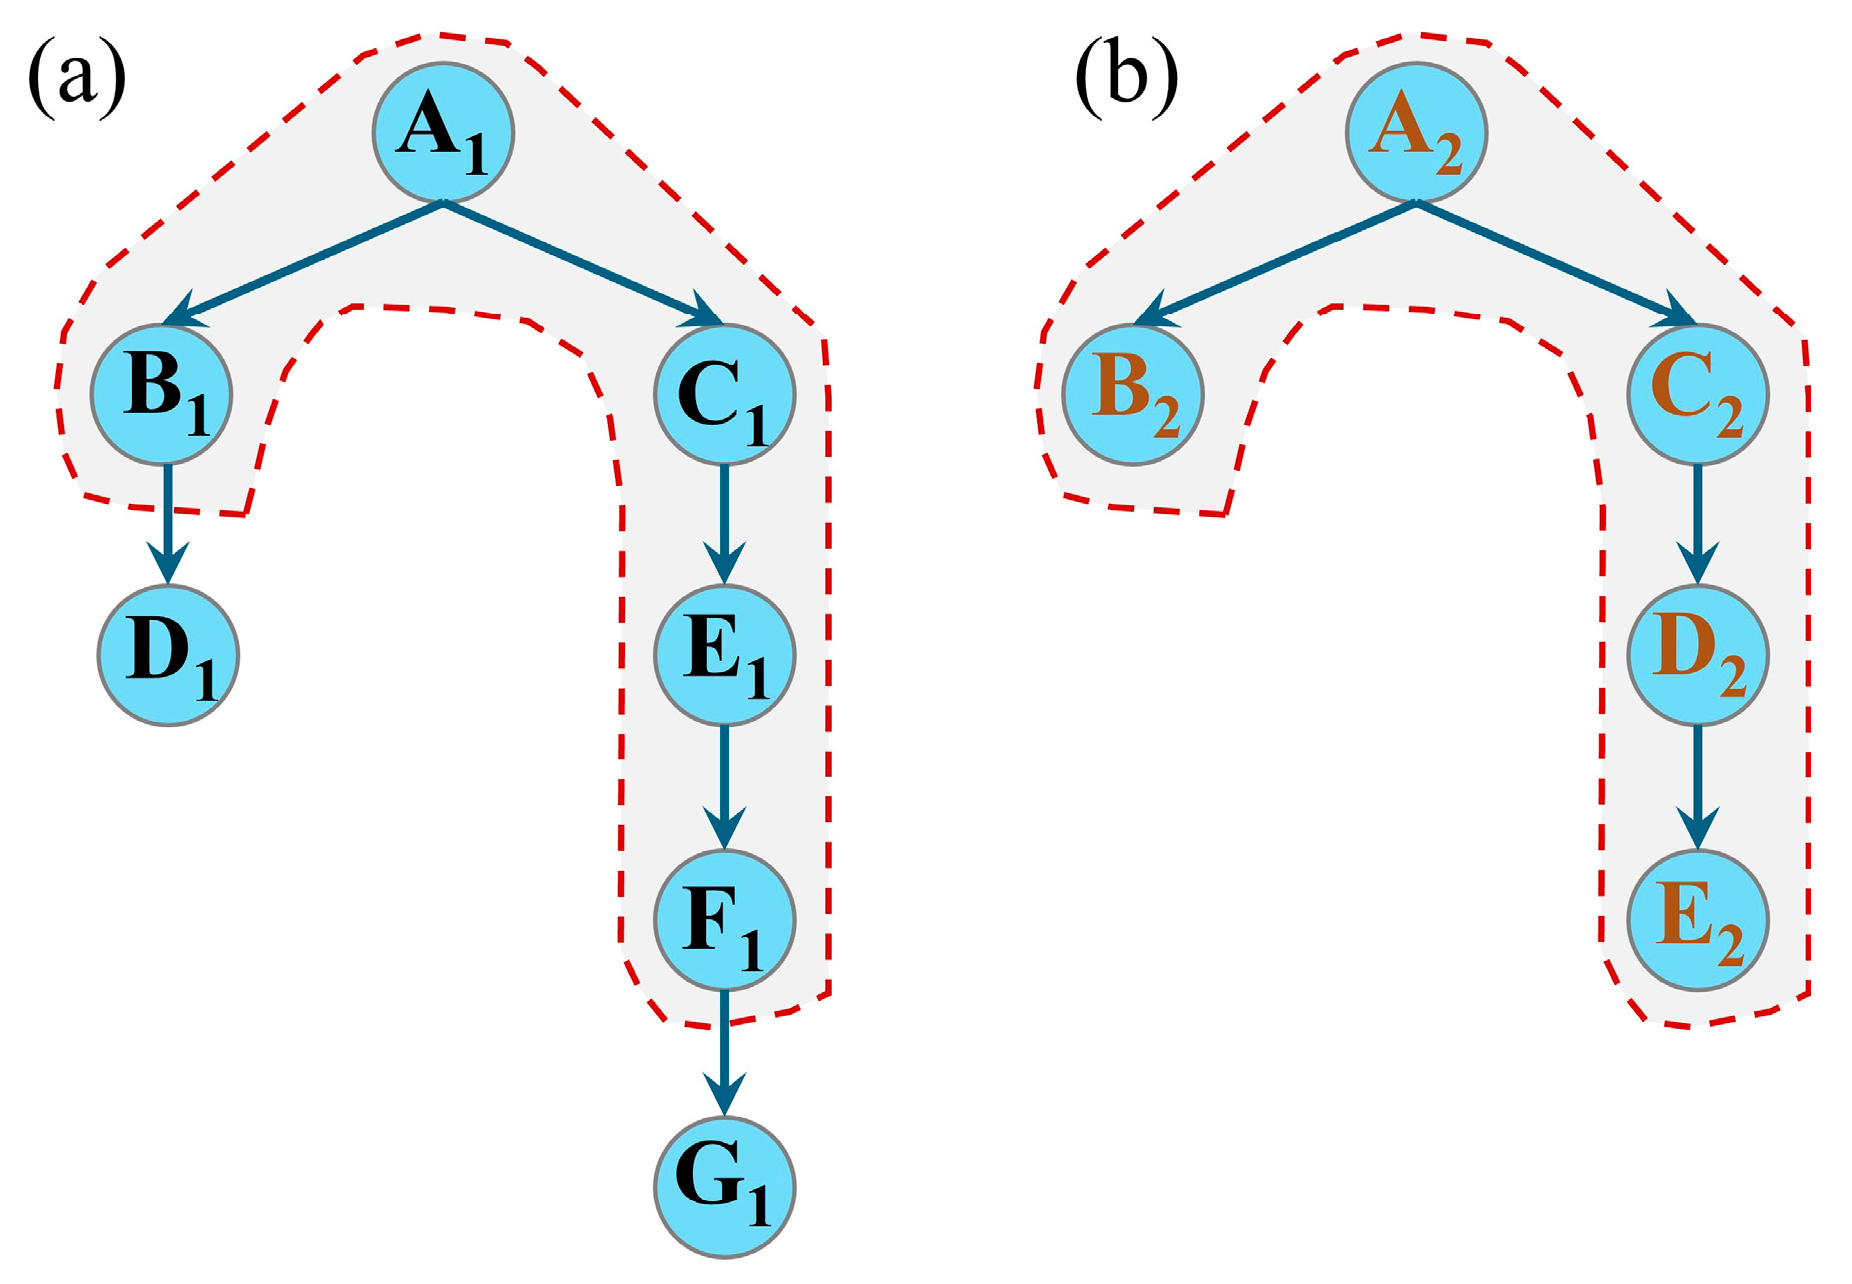
Diverse building spatial structures exhibit contrasting contour patterns. The contour tree, based on the spatial distribution of building heights, effectively identifies multiple central structures within a region. Therefore, we posit that assessing the similarity between contour trees provides a robust means of defining multi-city morphological similarity. Utilizing the theory of common subgraphs [58,59], we aim to identify shared structural patterns between two or more contour trees. To quantify and characterize the degree of similarity or difference between these contour patterns, we have developed a node-matching-based method to build the correspondence between two contour patterns. We initiate the process by identifying the maximum common sub-contour tree from two contour trees, and . A maximum common sub-contour tree is a subtree that is present in both and and contains the largest possible number of nodes. As depicted in Figure 5, and are contour trees with distinct structures, and their maximum common sub-contour tree is highlighted with a red dashed box.

Figure 5.
Maximum common sub-contour tree identification: (a) contour tree and (b) contour tree .
We further propose a structural similarity index based on the Jaccard similarity coefficient [60]. The Jaccard similarity coefficient, which is defined as the size of the intersection divided by the size of the union of two label sets, is a statistic used for gauging the similarity and diversity of sample sets. It is a valuable tool widely used for clustering, classification, and similarity analysis in scientific research [61]. Building upon the Jaccard similarity coefficient and the maximum common sub-contour tree, we introduce a structural similarity index to compare the contour patterns across different bay areas. The structural similarity index quantifies the similarity between two sets by dividing the size of their intersection by the size of their union. Let denote the maximum common sub-contour tree of and . The variables , , and represent the number of nodes in , , and , respectively. Similarly, , , and denote the number of edges in , , and , respectively. The similarity index is defined as:
This index ranges from 0 to 1. A value of 1 indicates that the two contour trees and are completely isomorphic, while a value of 0 signifies that they are not structurally similar at all. As shown in Figure 5, the similarity index between and was calculated to be 0.69. Generally, a similarity index above 0.6 could be considered a high similarity score, as this suggests that over 60% of the contours and structures have a similar distribution. Conversely, a similarity index below 0.3 could be considered a low similarity score, indicating that the building patterns have a relatively small amount of overlap. By calculating the structural similarity index, we can establish the correspondences between nodes in the corresponding contours of different bay areas, thus facilitating the comparison and similarity analysis between the contour patterns.
4. Results
4.1. The Similarity Between the Four Bay Areas
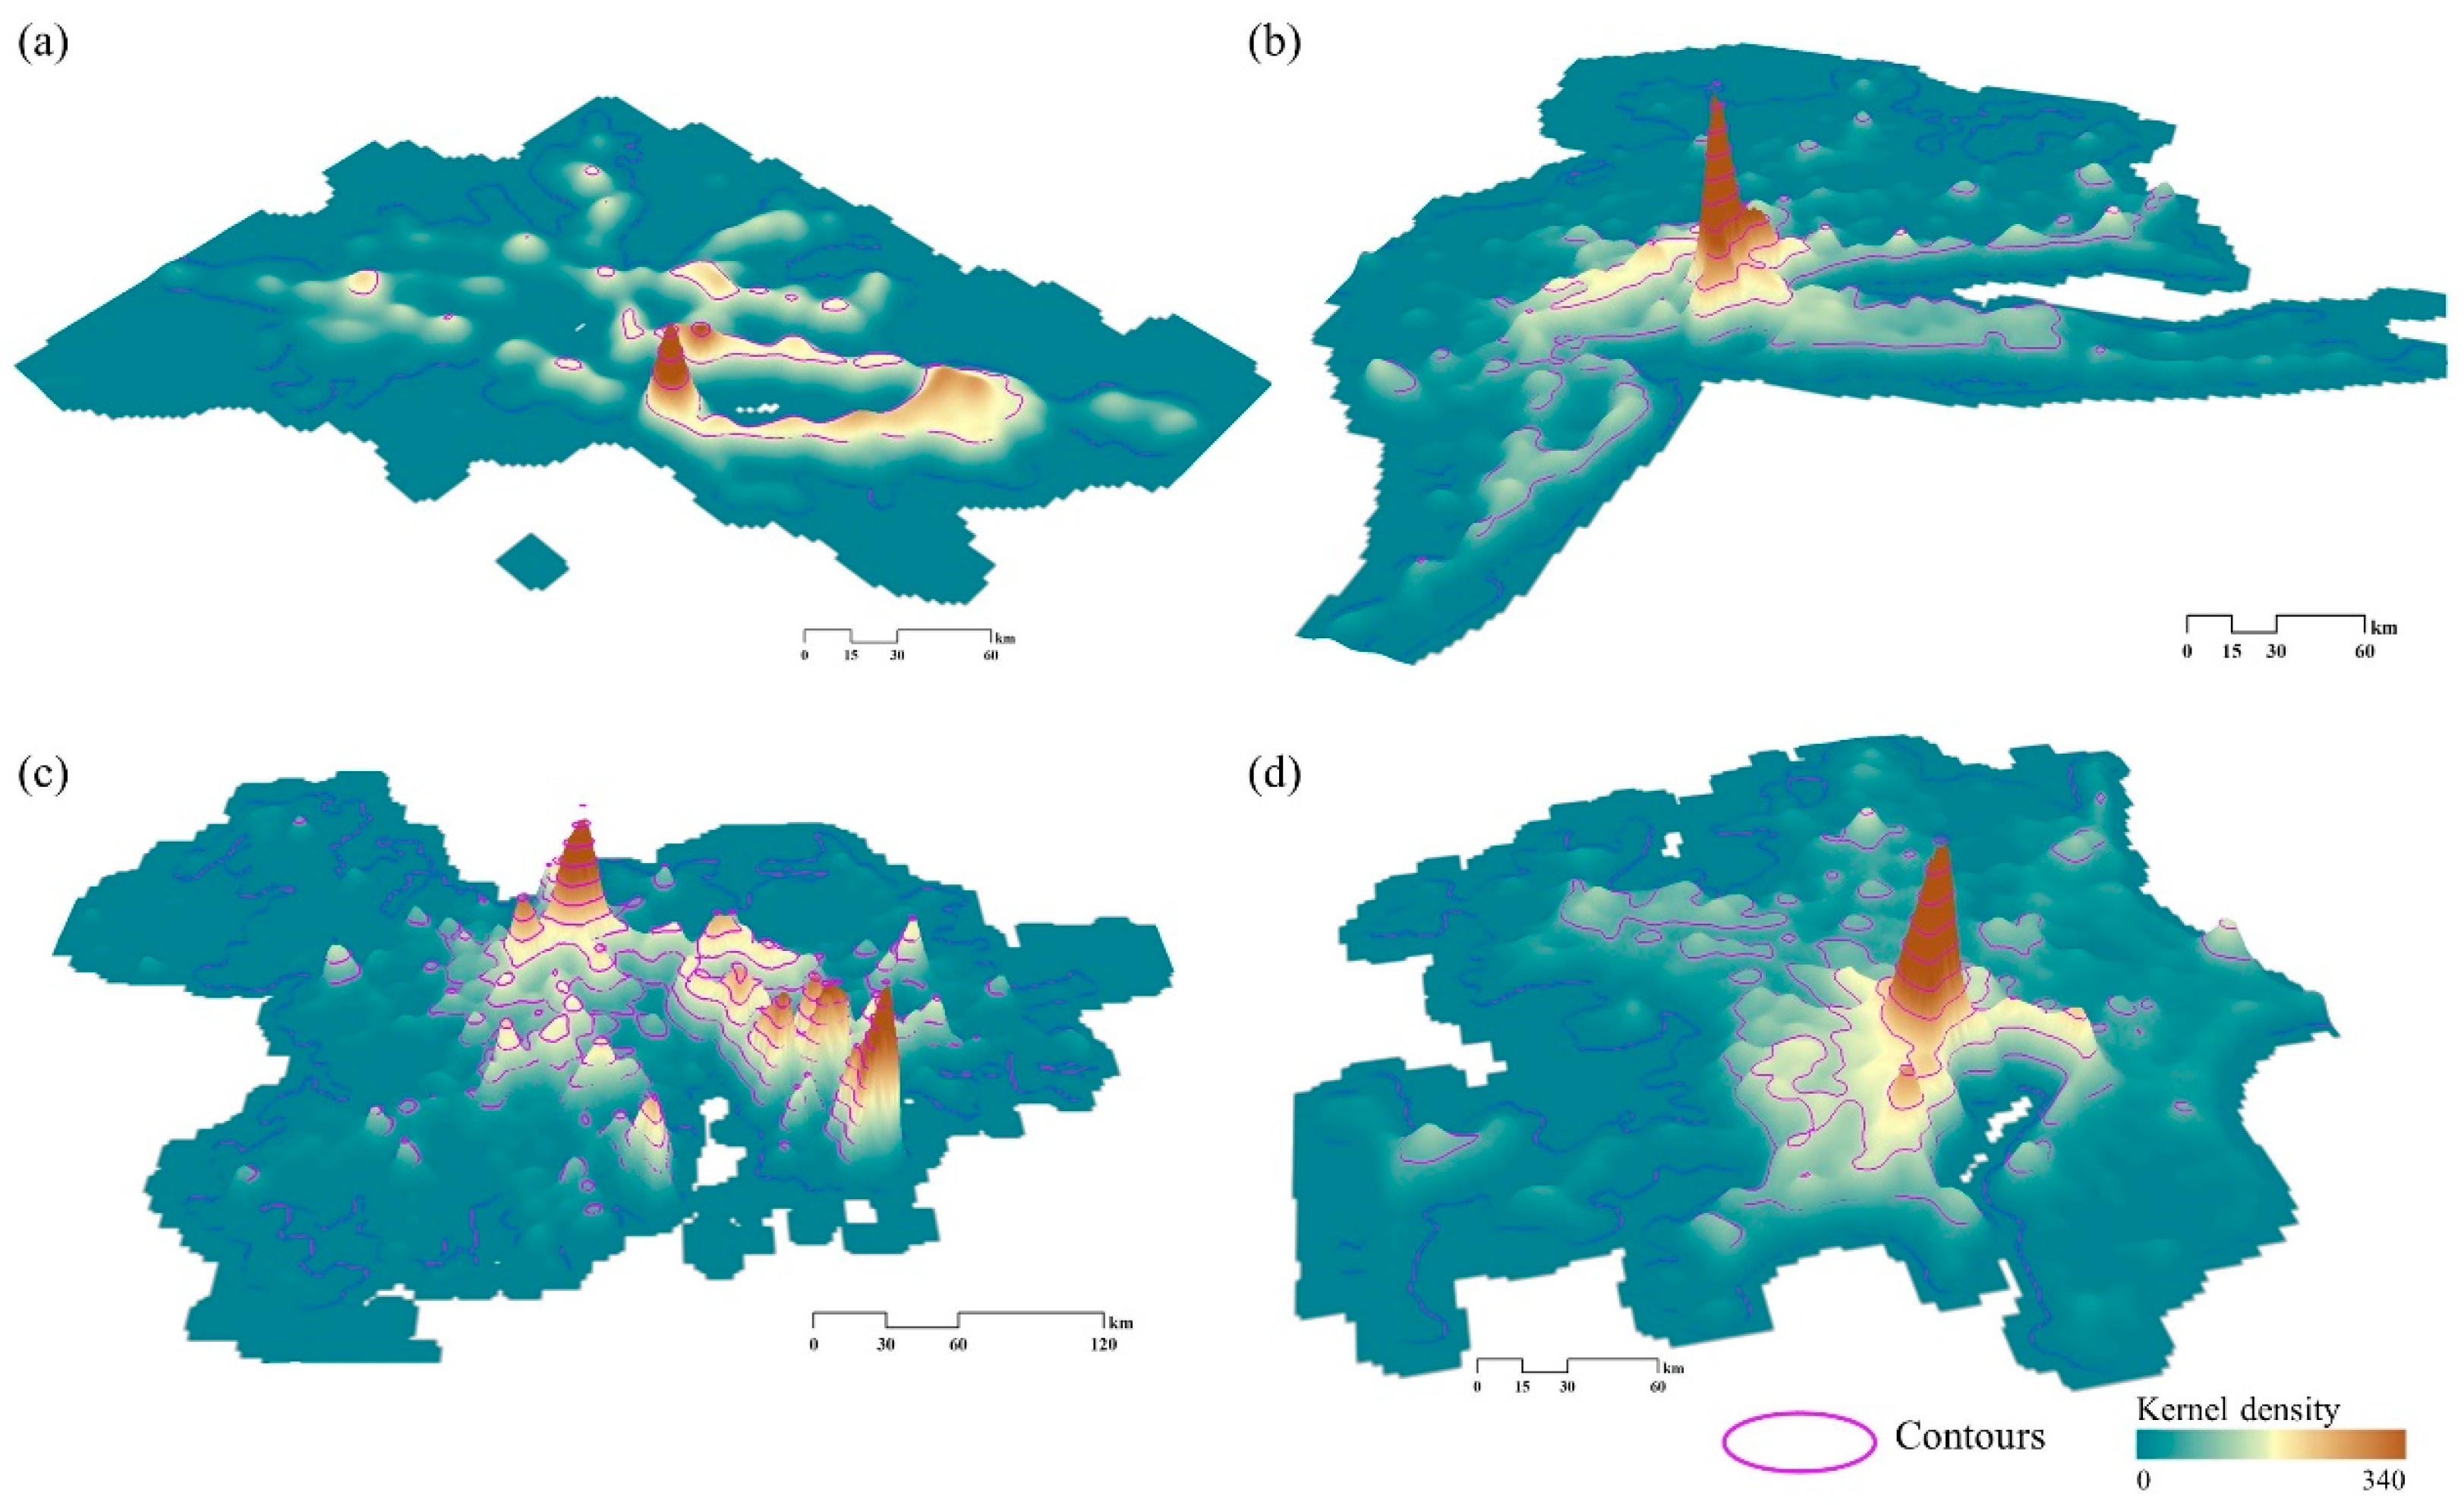
The contour trees for all four bay areas were generated using a uniform parameter set, comprising a KDE bandwidth of 500 m and a contour interval of 30. The kernel density map in Figure 6 reveals distinct spatial urban structures and distributions among buildings of different heights. The spatial distribution patterns observed can be summarized as follows: (1) Firstly, all four major bay areas exhibit multiple contour structures. The SFBA and the NYBA each have a dominant structure characterized by a single distinct high-density region within their respective areas. The TBA has two dominant high-density peaks, while the GBA features several prominent high-density regions within its territory. (2) The cores within the bay areas are predominantly situated within the largest cities of each respective area. For instance, in the SFBA, the core is located in San Francisco; in the NYBA, the core is situated in New York City; in the GBA, the cores are mainly found in Guangzhou, Shenzhen, and Hong Kong; and in the TBA, the two major cores are centered in Tokyo and Yokohama. (3) Building kernel densities diminish rapidly away from the core centers, implying that the core centers exhibit significantly higher kernel densities than other regions. (4) Beyond the primary cores, numerous local sub-core areas with lower densities are distributed sporadically throughout the bay areas, primarily within smaller cities within each respective bay region. The spatial distribution characteristics of building heights are, in fact, consistent with the economic development patterns of the bay areas [62].

Figure 6.
The kernel density maps for (a) SFBA, (b) NYBA, (c) GBA, and (d) TBA.
Figure 6 also depicts contours (purple lines) generated from the kernel density map. The distribution of these contours suggests that they align primarily along the bays, indicating that a significant portion of the urban buildings in these regions are constructed along the coastline. Utilizing these contours, we have constructed contour trees for each bay area to represent the hierarchical structure of the built environment. Figure 7 presents the contour tree structures for the four bay areas.

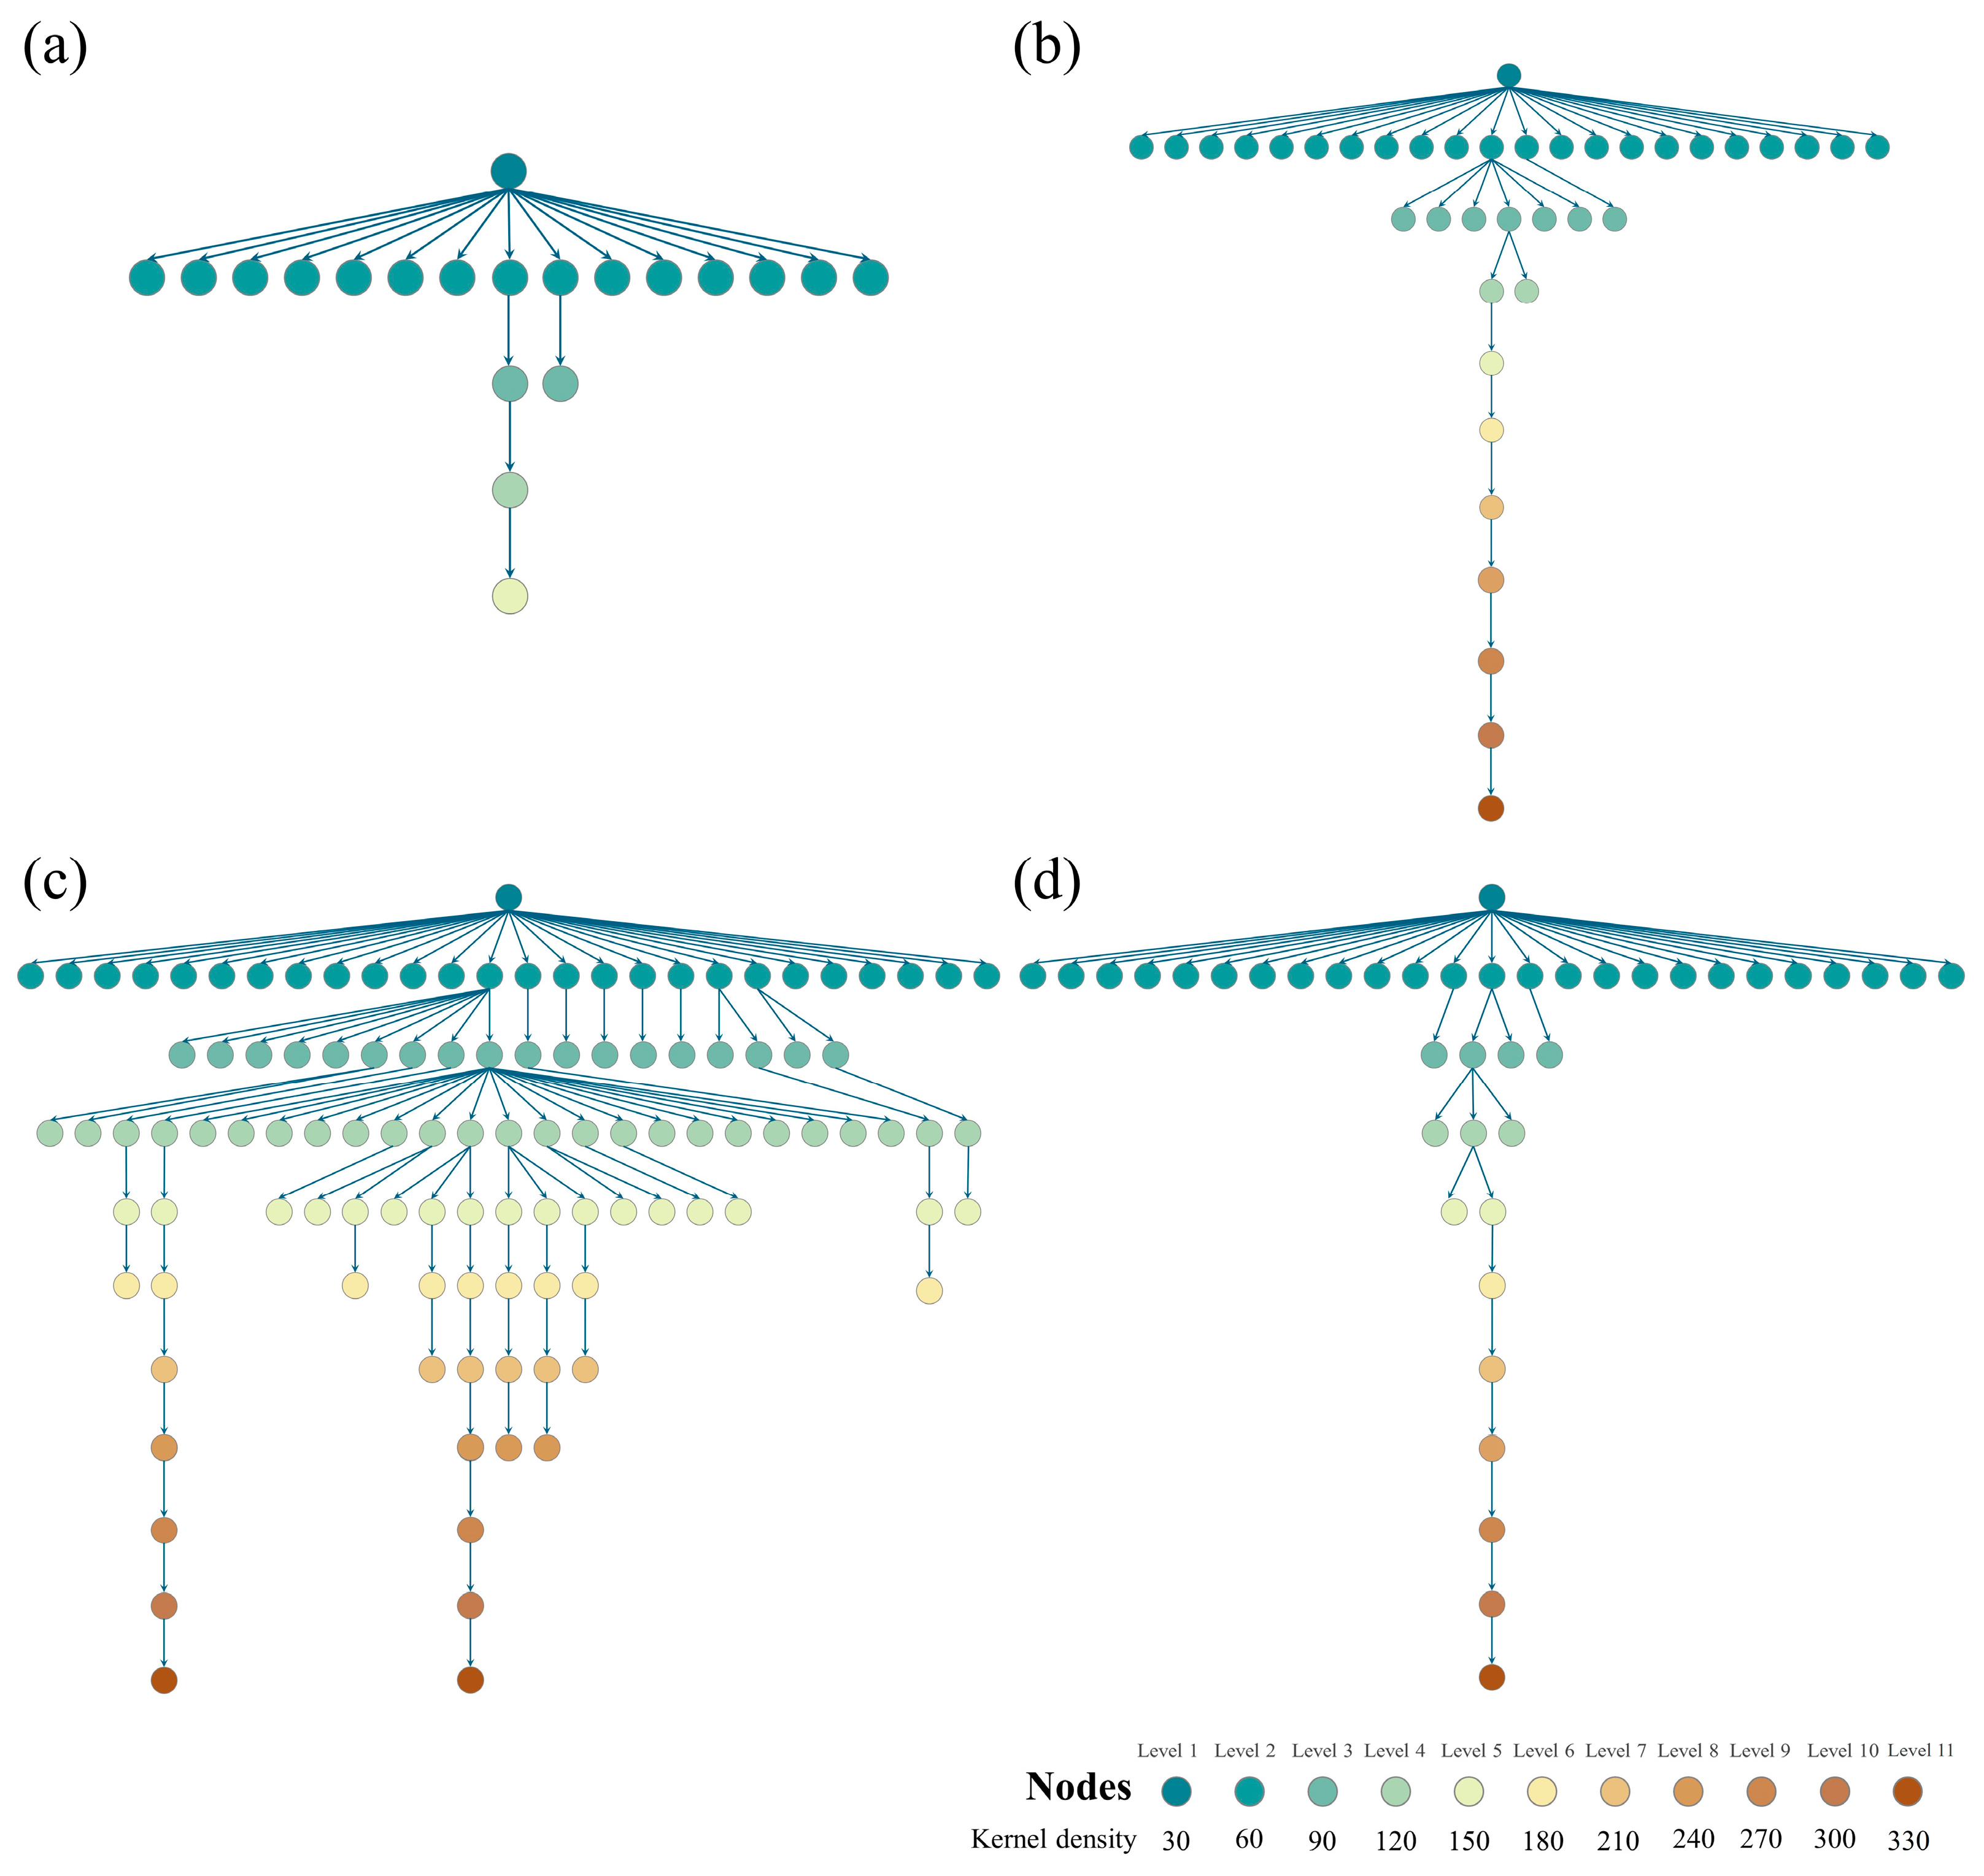
Figure 7.
The contour tree in each bay area: (a) SFBA, (b) NYBA, (c) GBA, and (d) TBA.
The contour trees in Figure 7 reveal that the GBA exhibits the most complex building hierarchy among the four bay areas, characterized by a high degree of branching, while the SFBA demonstrates the simplest structure. Similar to the previous analyses, the SFBA, NYBA, and TBA each possess a single deep branch in their contour trees, whereas the GBA exhibits two deep branches. At the second level (corresponding to a kernel density of 30), the contour tree structures in the four bay areas remain relatively similar. However, at the third hierarchical level (corresponding to a kernel density threshold of 60), substantial divergences in the hierarchical structures become evident. These disparities are primarily characterized by variations in the number of branches emanating at this level. The SFBA exhibits two branches, the NYBA displays seven branches, the GBA presents eighteen branches, and the TBA has four. This discrepancy underscores the considerable heterogeneity in the density and spatial distribution of mid-rise buildings across the four major bay areas. The GBA boasts a substantial number of mid-rise buildings, whereas the SFBA has relatively few. This suggests that the distribution of middle-rise buildings in the GBA reflects a polycentric development pattern, in contrast to the more centralized distribution observed in the SFBA. Beyond the fourth level, the buildings predominantly consist of high-rise structures, which exhibit an even greater tendency towards concentration, primarily in the core cities of each bay area.
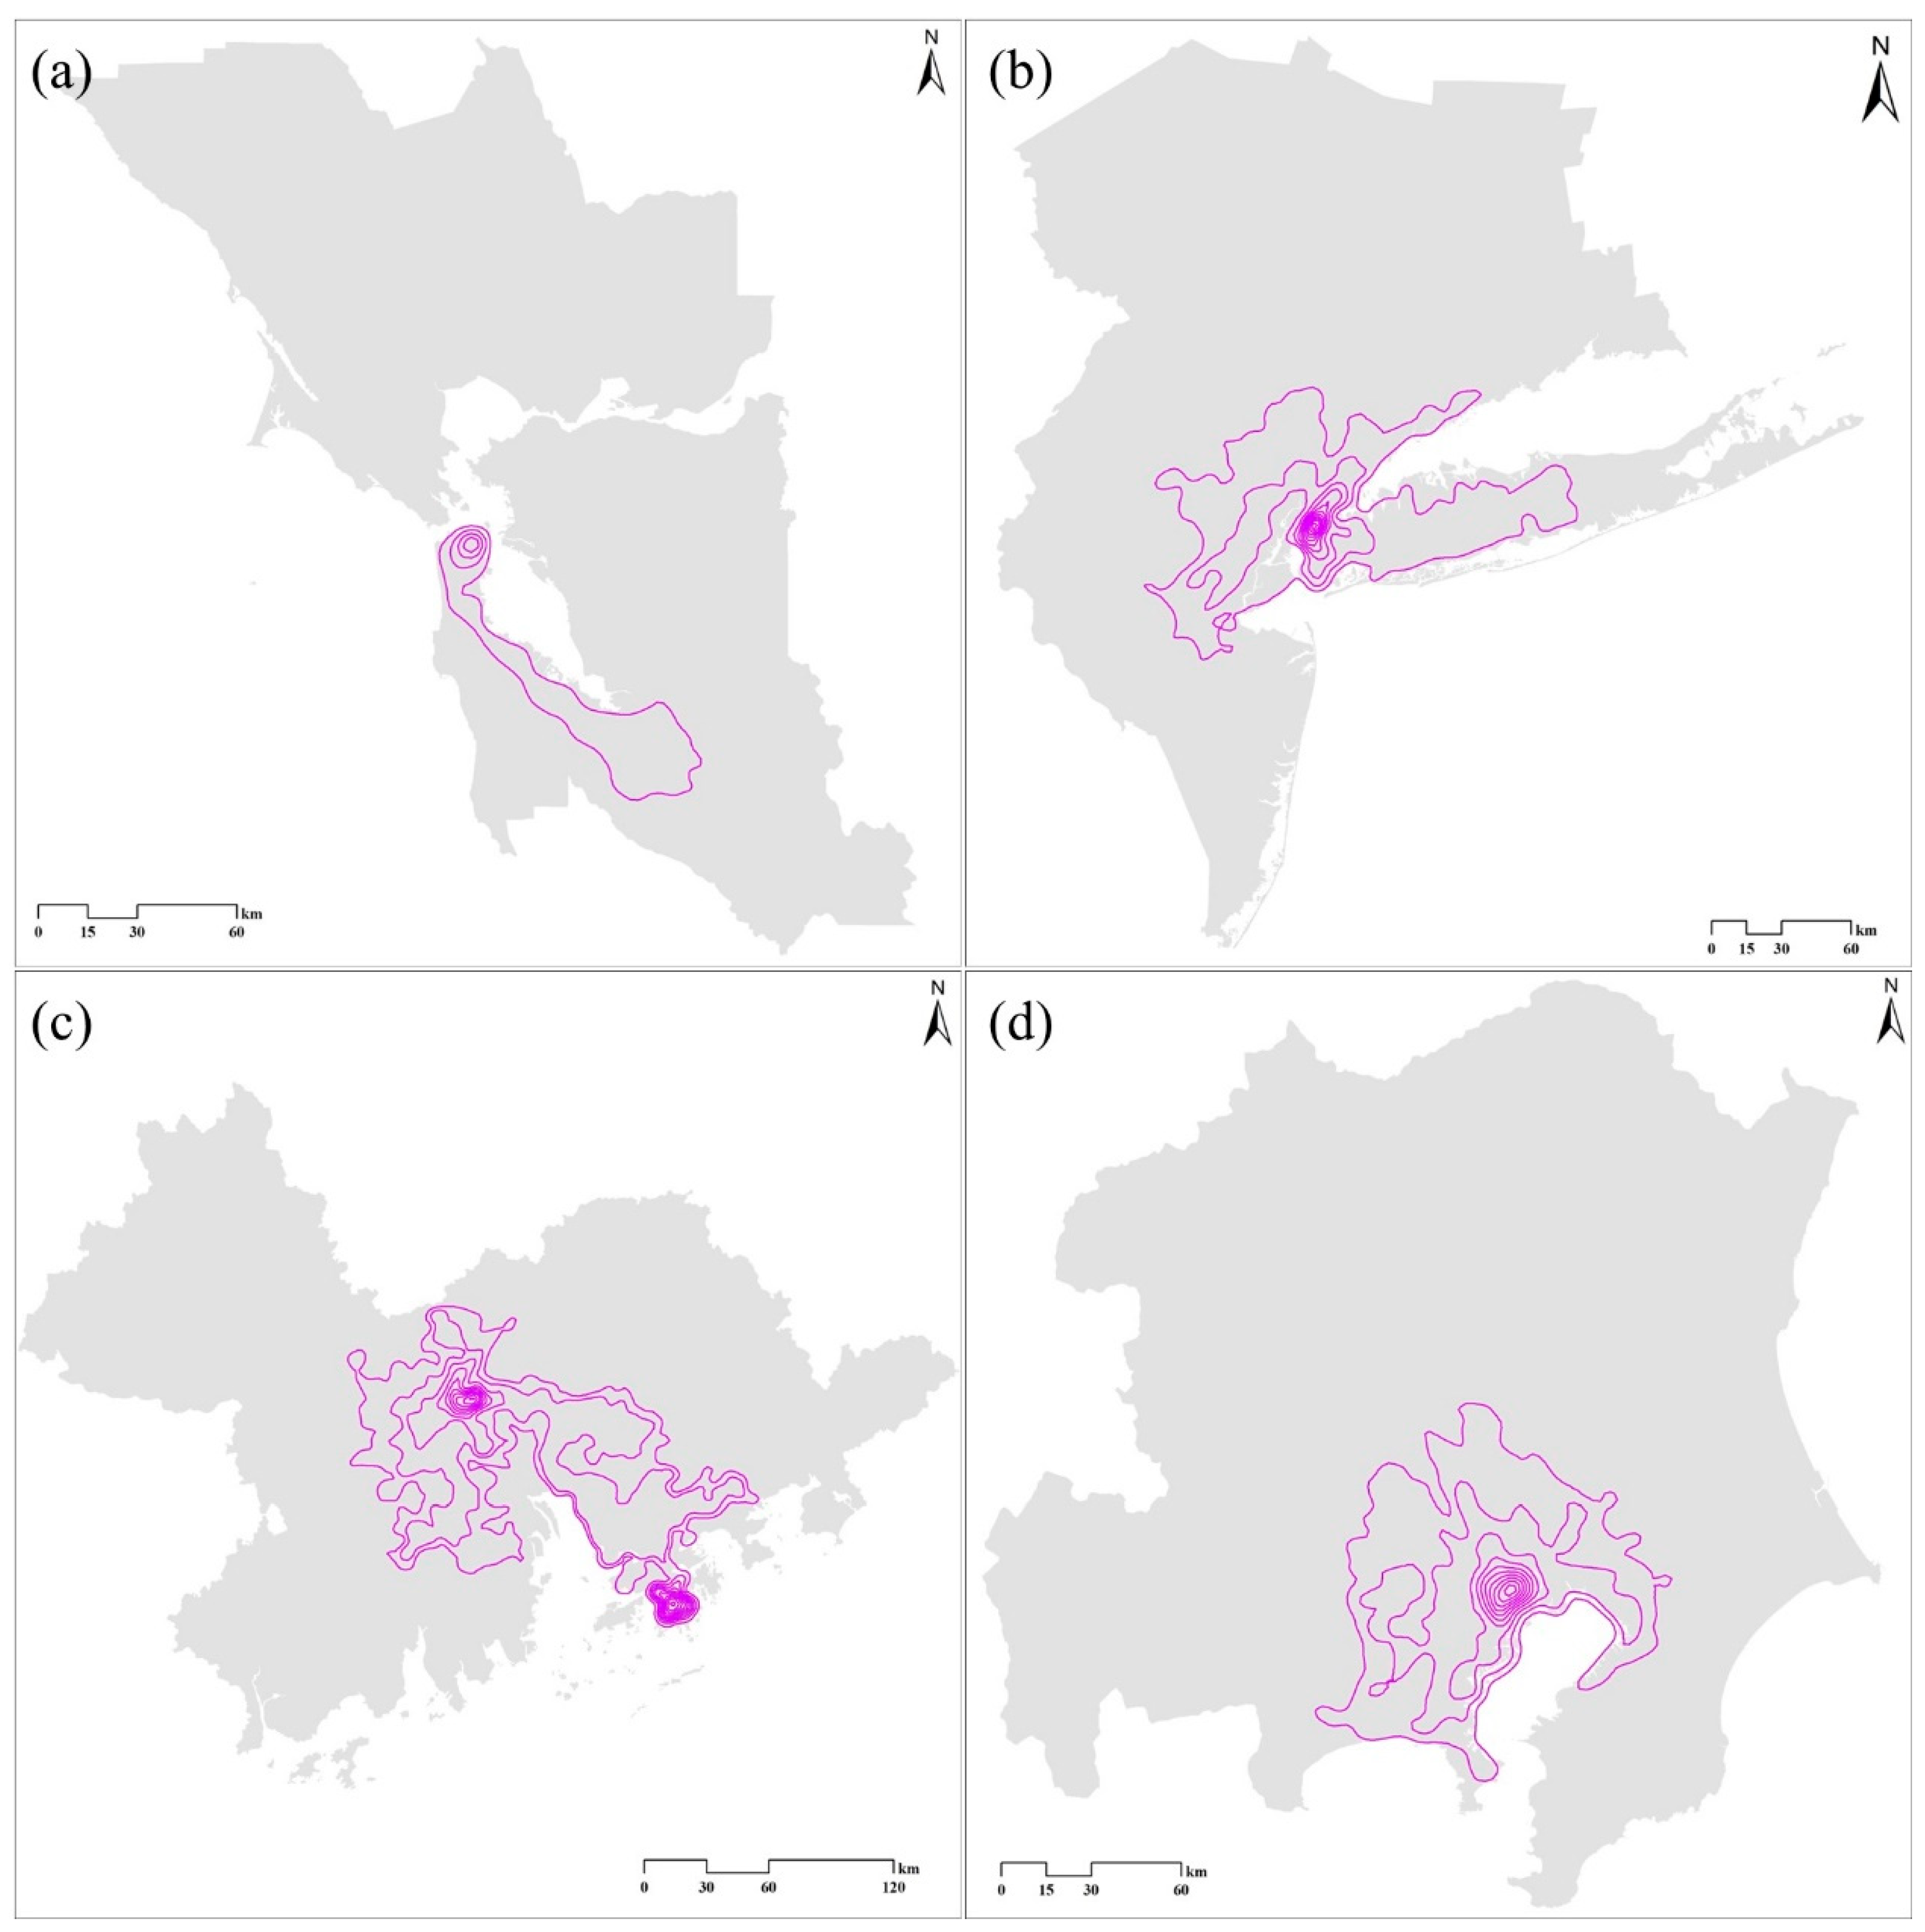
Examining the contour tree structures depicted in Figure 7, we can identify each contour tree’s biggest branch, which has the deepest depth. These biggest branches constitute the most central building hierarchies within the bay areas. We extract the contours corresponding to these biggest branches, as illustrated in Figure 8a–d. It is evident that, although the biggest branch contours map loses some minor contours compared to the original contours map, it maintains the fundamental distribution characteristics.

Figure 8.
The biggest contour tree branch in each bay area: (a) SFBA, (b) NYBA, (c) GBA, and (d) TBA.
Based on the contour tree depicted in Figure 6 and the similarity calculation methodology detailed in Section 3.3, we computed the pairwise similarities between the four bay areas, as summarized in Table 1. The results indicate that the building hierarchies of the NYBA and the TBA exhibit the highest degree of similarity (with a similarity index of 0.74), whereas those of the SFBA and the GBA are the least similar (with a similarity index of 0.17). The similarity between SFBA and NYBA, and SFBA and TBA is relatively close, with similarity indices of 0.49 and 0.48, respectively.

Table 1.
The similarities between the contour patterns in four bay areas.
4.2. Enhancing Similarity Analysis with Building Metrics
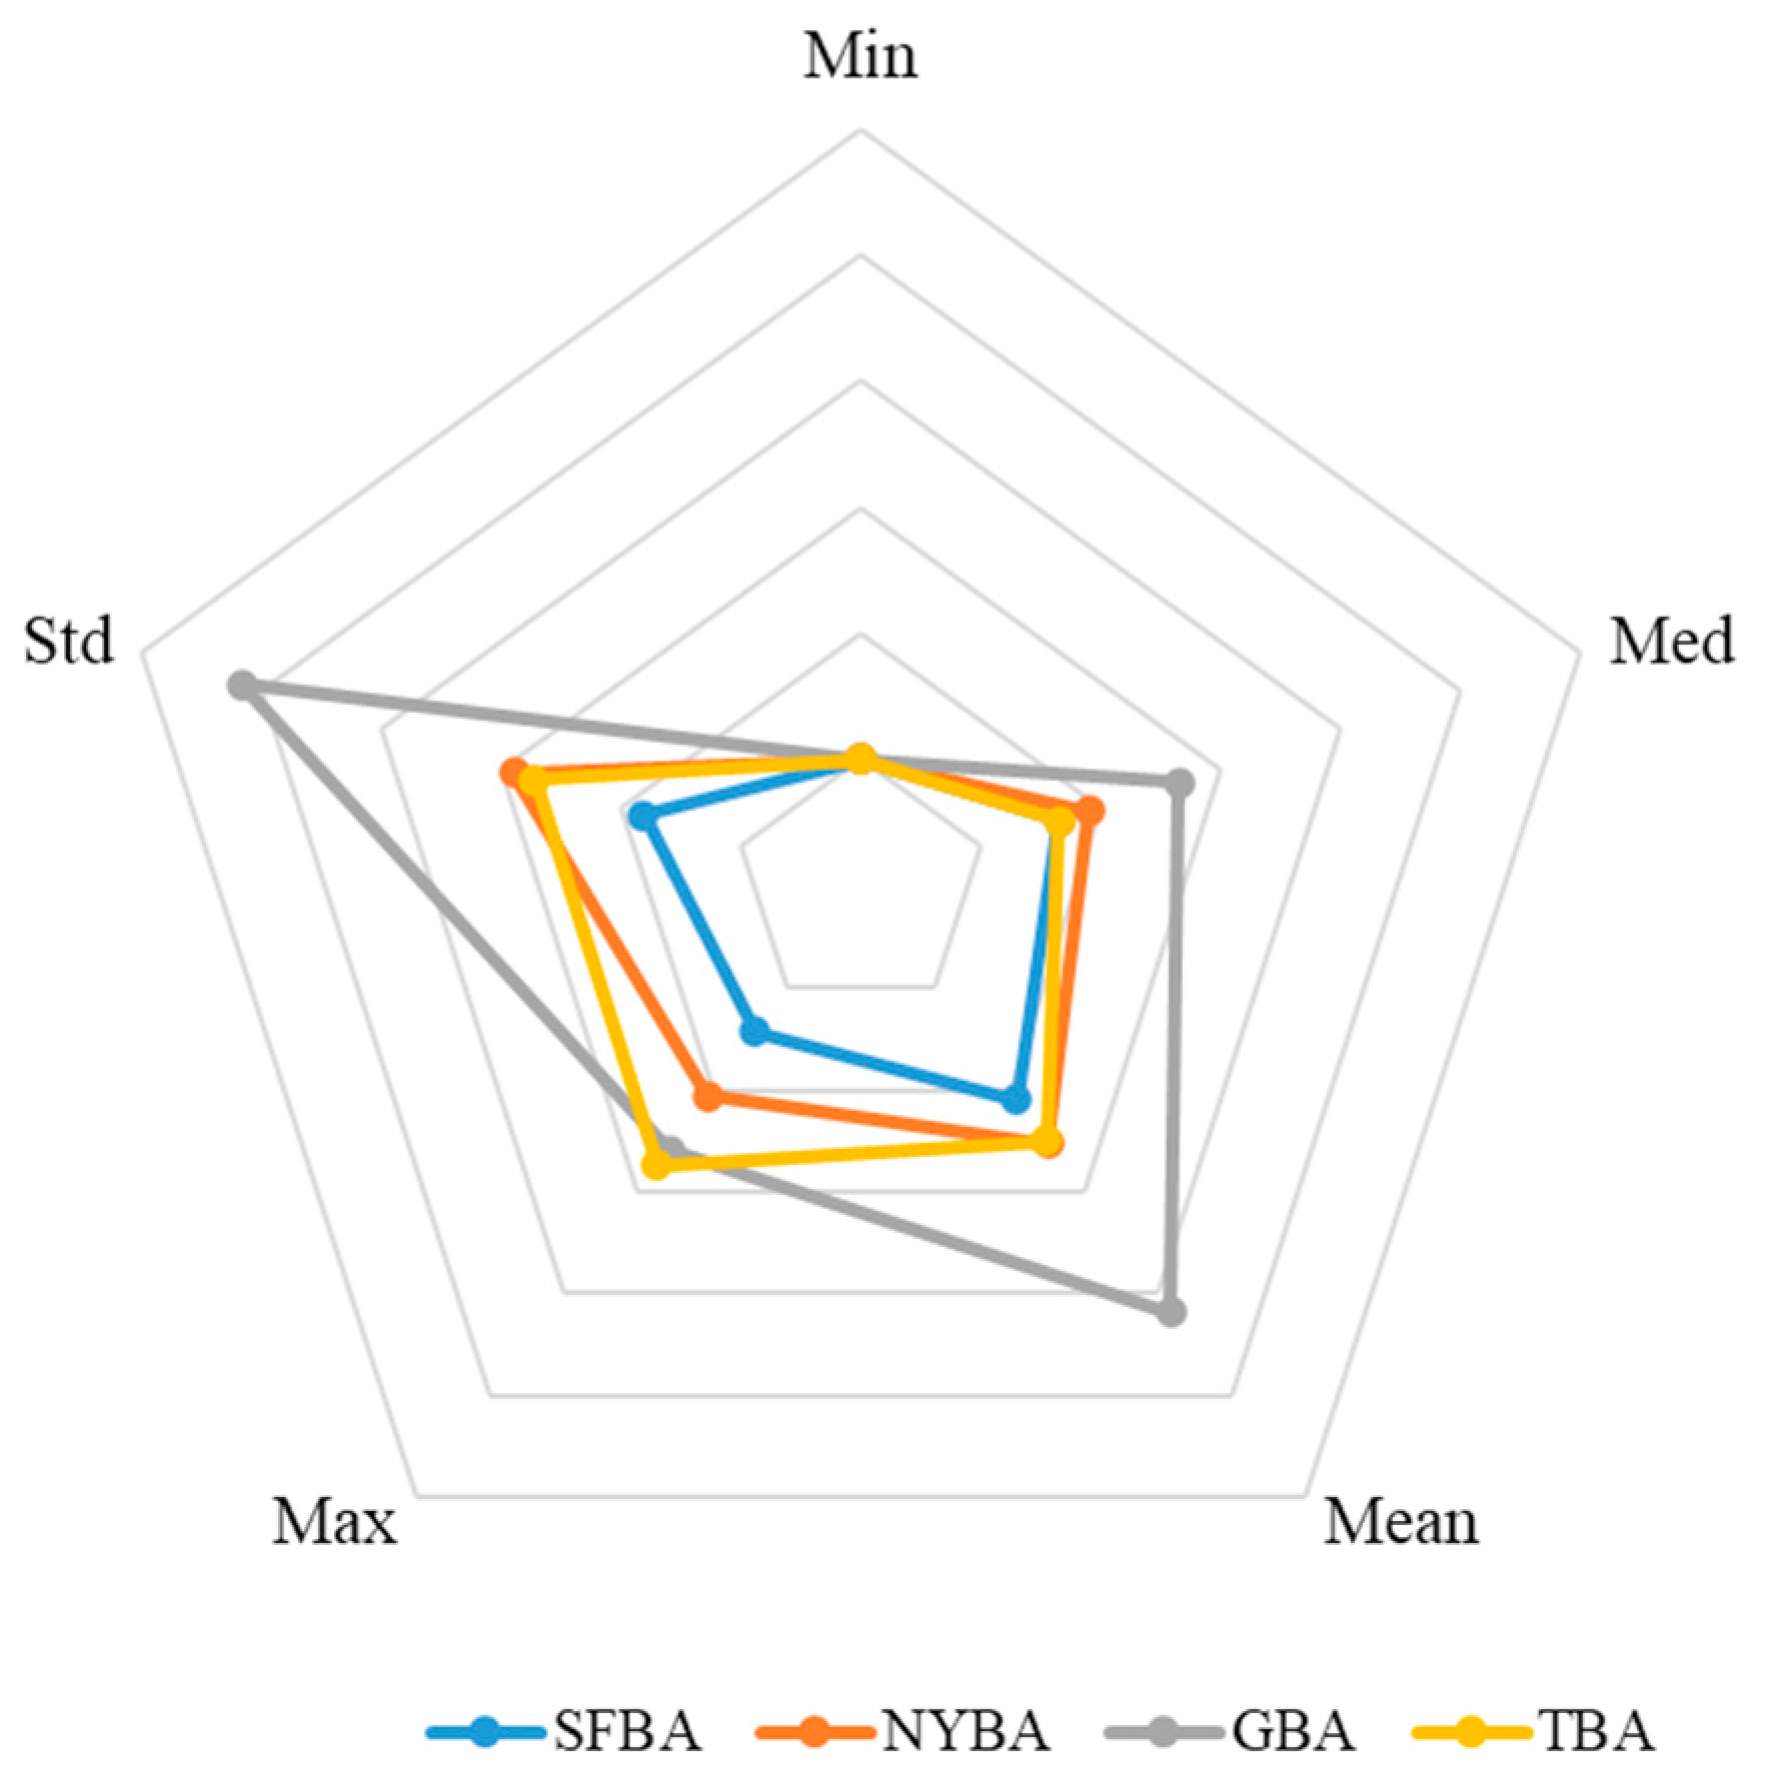
To validate the effectiveness of the similarity results, we compared them with those obtained using traditional building height metrics. Utilizing the WSF3D dataset, we computed five aggregated indicators of building height: minimum (Min), median (Med), mean (Mean), maximum (Max), and standard deviation (Std). The results are presented in Table 2. The table reveals variations in similarity across the four bay areas depending on the specific building height indicator considered. For instance, with respect to the median value, the SFBA and the TBA exhibit greater similarity, while the NYBA and TBA are closer in terms of the mean building height. Conversely, the GBA and TBA show greater similarity in terms of maximum building height.
Table 2.
The statistics of building height metrics in four bay areas.
To provide a more intuitive visualization of the similarities among the four bay areas across these indicators, we employed a radar chart (Figure 9). The radar chart clearly illustrates that the NYBA and TBA are most similar overall, whereas GBA and SFBA are the least similar. This finding is consistent with the conclusions drawn from the method proposed in this study. Therefore, our proposed method not only yields results consistent with those of traditional building height metrics but also captures richer spatial details. Generally, building height metrics provide a simplified, aggregated perspective of urban form, emphasizing the vertical dimension. In contrast, our approach yields a more detailed, spatially explicit representation, encapsulating both vertical and horizontal aspects of urban structure. For instance, while the SFBA and the TBA may exhibit similar median building heights, they present vastly different distributions. The SFBA displays a relatively uniform building height profile, whereas the TBA exhibits significant variability, encompassing a mix of low-rise and high-rise structures. Our method captures such discrepancies in variability, which might be overlooked by simple height metrics. Furthermore, even with comparable height metrics, the spatial arrangement of buildings can differ markedly.

Figure 9.
A visualization of multivariate building height metrics of four bay areas.
We also employed the WSF3D dataset to obtain building density, building area, and building volume metrics at a 90 m resolution for the four study regions. Table 3 summarizes the mean value for these indicators. Similar to the building height, SFBA and TBA exhibit the highest degree of similarity based on building density and building area, while GBA and NYBA show the lowest similarity based on the value of building density, building area, and building volume.
Table 3.
The statistics of three additional building metrics in four bay areas.
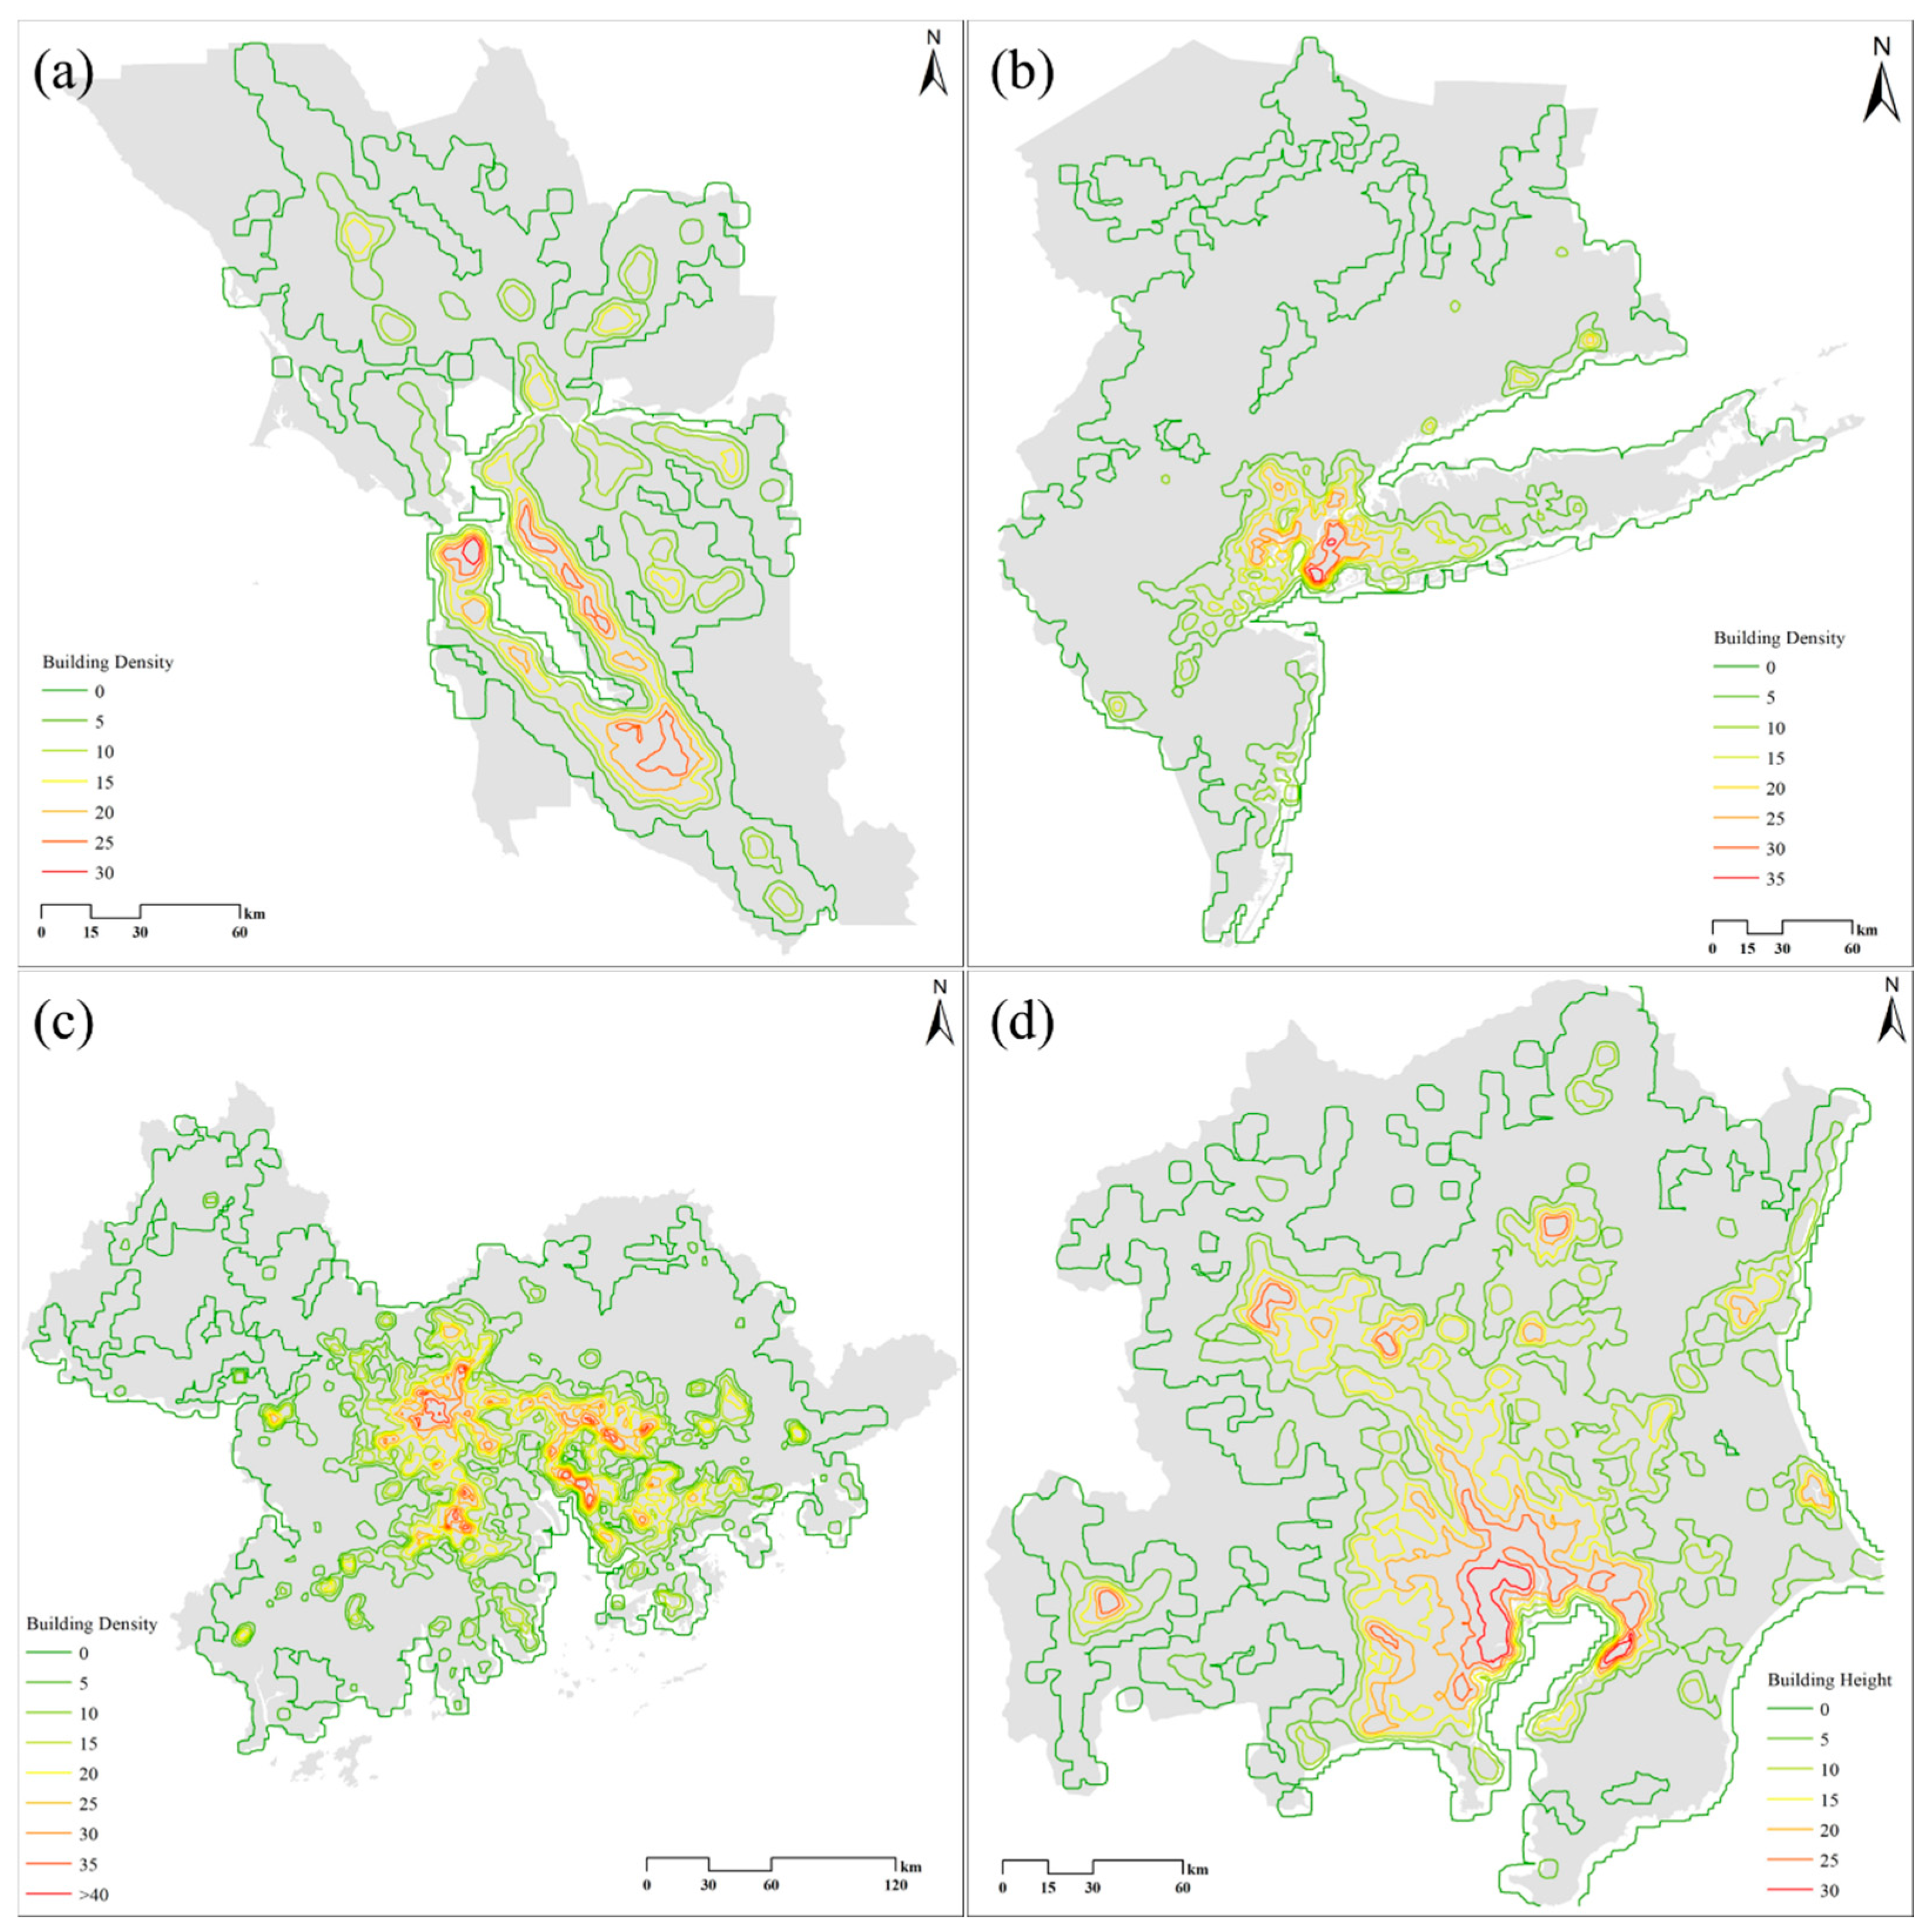
Employing the proposed method in this study, we calculated the structural similarity of the four bay areas based on these metrics. Figure 10 presents the contour maps generated for the building density data. Our findings indicate that NYBA and TBA exhibit the highest structural similarity in terms of building density, while SFBA and GBA show the lowest similarity. Spatial structural similarity analyses of building area and building volume also reveal consistent results. Although SFBA and TBA exhibit similar values in terms of traditional building morphological metrics, significant disparities exist in their spatial distributions. Consequently, traditional metrics merely reflect the overall average level of building morphology within a region and fail to capture the spatial variations.

Figure 10.
The contour map of building density for four bay areas: (a) SFBA, (b) NYBA, (c) GBA, and (d) TBA.
4.3. Impacts of Contour Interval on Similarity Calculation
Similarity calculation between contour trees is highly sensitive to structural variations. The construction of a contour tree relies on contour lines, which are generated at specific intervals. Consequently, varying the contour interval will result in distinct contour tree structures. In our study, we employed a uniform contour interval of 30 to ensure the comparability of generated contours across the four study regions, and no specific adjustments were made to accommodate region-specific characteristics. To investigate the impact of contour interval on city similarity measurements, a range of kernel density intervals from 10 to 100 was selected for evaluation.
For the contour interval, selecting a smaller interval facilitates the detection of intricate building height patterns, but it may concurrently increase computational demands. Conversely, a larger interval enhances computational efficiency yet may sacrifice the detail of building height patterns. As presented in Table 4, the similarity values remain relatively stable and low for contour intervals ranging from 10 to 30. However, beyond this range, similarity values exhibit a gradual decrease as the contour interval extends from 40 to 100, except for the similarity between NYBA and TBA. At very small contour intervals, numerous minor building height variations are captured during the contouring process, leading to smaller regional differences in contour trees and thus higher similarity scores. Conversely, at larger contour intervals, the sparser distribution of contour lines may overlook subtle height variations, resulting in increased inter-regional differences in contour trees and thus lower similarity scores.
Table 4.
Impacts of contour interval on similarity calculation in four bay areas.
5. Discussion
5.1. The Use of Contour Tree
We argue that the contour tree is an effective analytical tool for reflecting the hierarchical structure of building height patterns due to its ability to organize and represent spatial data in a structured, hierarchical manner. Its superiority is manifested in three principal aspects: its hierarchical representation, topological relationships, and its facilitation of multi-scale analysis. The contour tree inherently captures the hierarchical nature of building height patterns. Organizing contours into a tree structure reflects the gradual changes in building height from higher to lower levels, which is a fundamental characteristic of urban morphology. The contour tree also establishes topological relationships between contours, representing the spatial adjacency, containment, and overlap typical in urban environments. This top-down approach identifies dominant height features and their relation to smaller-scale variations. Furthermore, the contour tree facilitates multi-scale analysis, as it can capture large-scale patterns, represented by the tree’s broader structure, and smaller-scale details, represented by its leaf nodes. This allows for the comparison of building height patterns at different spatial extents.
The GBA’s heightened polycentricity is attributed to a confluence of historical and urban planning factors. The GBA’s polycentric structure is rooted in its history of separate administrative entities, such as Guangzhou, Shenzhen, Hong Kong, and Macau, which developed distinct urban cores around their individual ports and trade routes [62]. This historical development was further amplified by China’s economic reforms and recent urban planning efforts that explicitly promote a multi-nodal development strategy. Conversely, the SFBA’s more monocentric pattern is derived from San Francisco’s early dominance as a central city, the rapid growth of Silicon Valley, and historical transportation development that prioritized connections to San Francisco [63]. These contrasting trajectories underscore the significant influence of historical context, urban planning decisions, and economic development paths on the spatial structure of urban regions.
Studying the similarity between contour trees of building height patterns has the potential to enhance our understanding of urban form and building height variability. By examining the similarities and differences between contour trees of various building height patterns, researchers can gain insights into the commonalities and variations in urban morphology across different cities, climates, and cultural settings. This comparative analysis is essential for identifying general trends and specificities in urban form. Moreover, the approach developed in this study also has some implications for spatial pattern comparison studies. A burgeoning trend in geographical analysis is driving the need for methods capable of enabling the comparative analysis of spatial patterns. Spatial pattern comparison is an approach that involves the examination of two or more spatial patterns to quantify their level of resemblance or dissimilarity [50]. This method finds application in diverse domains, including assessing landscape patterns [64] and urban structures [5]. Our proposed method offers broad applicability to various spatial features. For instance, when applied to land surface temperature data, it can elucidate the structure of temperature gradients across a region. This application can facilitate the identification of areas experiencing rapid temperature changes or regions characterized by relatively uniform temperatures. Furthermore, the method can be extended to vegetation density data, revealing the spatial arrangement of different vegetation levels within a region. This can highlight transitions between dense forested areas and sparser regions and contribute to the identification of core areas with high biodiversity.
Scale issues inherently characterize spatial patterns. Researchers have long recognized the necessity of incorporating scale considerations into pattern comparison methodologies. This has led to extensive discussions on the impacts of scale under concepts such as the modifiable aerial unit problem (MAUP) [65]. Given the inconsistencies in size and shape across different regions, spatial patterns are often not directly comparable. Consequently, our research provides a conceptual framework that can inform further studies on spatial pattern comparison. It is worth noting that our method utilizes nodes and edges in the contour tree to represent the degree of similarity. Future studies may employ other measures, such as area differences between contours, to define similarity.
5.2. Implications for Urban System
The hierarchy of building heights is a fundamental aspect of economic conditions, urban aesthetics, and skyline composition [14,62,66], influencing the perception of public spaces and openness within a city. Taller buildings can define the city’s silhouette and create iconic skylines, while lower buildings contribute to visual harmony and openness. Our research is capable of macroscopically reflecting the spatial openness between regions. Generally, areas (i.e., Guangzhou and Hong Kong in GBA) with large areas and high kernel densities tend to have more compact spatial configurations. With the help of the extracted building height hierarchy, the strategic placement of buildings can enhance view corridors and landmarks, ensuring that new construction complements existing structures. Balancing building heights with public spaces creates inviting urban environments. Urban planning, incorporating height guidelines and considering the surrounding context, leads to aesthetically pleasing and contextually appropriate designs. Building height hierarchies are essential for creating visually appealing and iconic urban landscapes that reflect a city’s unique character and identity.
The hierarchy of building heights can also be effectively utilized for analyzing various socioeconomic activities [5,67]. While studies have extensively examined and discussed urban spatial patterns from a horizontal perspective, including urban sprawl [68] and mixed land use [69], studies also explore the vertical aspects of urban buildings [70]. Consequently, the concept of a compact city has gained prominence, focusing on increasing land-use intensity to control horizontal expansion and driving the transformation of urban structure from a vertical dimension [71]. In light of these developments, a reliable building height hierarchy becomes crucial for advancing the analysis of human activities and 3D urban morphology. For instance, by analyzing the urban climate environment and sky view factor, the utilization of building height hierarchy information enables urban planners to recommend specific building configurations that minimize thermal load and enhance aesthetic appeal [72,73].
In densely built-up bay areas, high-rise buildings exert significant environmental, social, and climatic influences. Greenery-covered tall buildings contribute to urban sustainability by reducing wind loads [74], improving air quality [75], supporting biodiversity [76], and enhancing energy efficiency [77]. Furthermore, such vegetated structures mitigate the urban heat island effect through mechanisms including natural shading and evaporative cooling [78]. Conversely, non-vegetated taller structures function as physical barriers, impeding the penetration of cooler marine air masses from adjacent water bodies, thereby intensifying the urban heat island effect and exacerbating temperatures during heat wave events [79]. Concurrently, the complex three-dimensional morphology resulting from varying building heights disrupts and alters wind patterns [80], potentially inhibiting urban ventilation and affecting pollutant dispersion [81]. Understanding these climatic impacts necessitates further investigation into urban building height patterns and is crucial for informed urban planning aimed at mitigating adverse thermal conditions and optimizing air circulation within these dynamic coastal regions.
A key distinction of our study from previous work lies in the application of our method within a cross-region comparative framework, a shift from the more typical single-city analyses employing contour tree analysis. First, by comparing multiple regions, our study transcends the limitations inherent in city-specific analyses, allowing us to identify patterns and trends in building height distributions that are not confined to the unique characteristics of a single urban environment. Second, our work facilitates the identification of both common patterns and significant differences in building height distributions between regions. Finally, the use of KDE and contour tree analysis in a cross-region comparison necessitated the development of a novel method for handling varying contour tree structures and ensuring comparability across regions. To address this, we propose a structural similarity index for comparing multi-core contours, a novel contribution to the field of spatial pattern analysis. This index addresses the challenge of comparing patterns with varying shapes and sizes, enabling a more nuanced and accurate assessment of similarities and differences between complex urban landscapes. This broader perspective enhances the generalizability of our findings and contributes to a more comprehensive understanding of urban morphologies across different contexts.
5.3. Limitations
Our study also has certain limitations. Firstly, due to the temporal limitation of the building height data, we have only analyzed the building height hierarchy at a single time phase. Building height hierarchies across multiple years would provide a more comprehensive understanding of the spatial development patterns of the four major bay areas, which would be more meaningful for understanding urban morphology and socio-economic development. Therefore, future research can explore the temporal and spatial comparisons of building height hierarchies. Secondly, as described in Section 3.3, our comparison of building height contours involved similarity calculations on the constructed contour trees. However, these calculations did not account for certain properties of the study areas, such as their size. Consequently, to refine the method for comparing multi-core contours, future work should incorporate considerations of area size. This presents an exciting opportunity for further research. Thirdly, future research can empirically investigate the relationship between the differences in building height hierarchies and urban environments. For example, future research could extract the hierarchical structure of land surface temperatures using the method in this study and compare it with the building height hierarchy to explore the direct similarities and correlations between the two. Furthermore, the building height hierarchies within the four major bay areas and those of other regions worldwide exhibit differences. Whether these differences can be considered indicators of urbanization levels requires in-depth research. Moreover, although the proposed structural similarity index may not fully capture the intricacies of building height patterns, we consider it a foundational step. Potential future research directions include incorporating additional metrics, such as node importance, graph edit distance, and shape context descriptors, to better capture the spatial distribution of contour patterns.
6. Conclusions
Studying building height hierarchies is crucial for understanding urban form, assessing sustainability, and informing planning and design. This study presents a novel framework for analyzing the spatial patterns of building heights within the world’s four major bay areas. Initially, we utilized kernel density estimation to generate a continuous spatial distribution of building heights. Subsequently, we employed contour trees to delineate the hierarchical structure of these patterns. Based on these hierarchical structures, we proposed a structural similarity index to facilitate comparative analysis of building height hierarchies. This index identifies the maximum common sub-contour tree from the contour trees. Our method not only extracts the hierarchical structures of building height patterns within the four major bay areas but also quantifies the differences between these patterns. This provides a novel approach for comparative urban morphology research.
This study contributes to advancing the quantitative analysis of urban building height structures. It presents a framework that can be extended to analyze urban morphology and patterns in other contexts. Future research endeavors will concentrate on conducting comparative analyses across different cities and investigating temporal changes to yield more generalizable findings, thereby facilitating sustainable urban development.
Author Contributions
Conceptualization, J.X. and B.W.; methodology, J.X.; formal analysis, J.X. and B.W.; investigation, J.X.; writing—original draft preparation, J.X.; writing—review and editing, B.W.; visualization, J.X.; supervision, B.W.; funding acquisition, B.W. All authors have read and agreed to the published version of the manuscript.
Funding
This work was supported by the Guangdong Basic and Applied Basic Research Foundation (No. 2023A1515012487) and the Fundamental Research Funds for the Central Universities, Sun Yat-sen University (No. 24qnpy003).
Data Availability Statement
The data supporting this study’s findings were derived from the following resources available in the EOC Geoservice: https://geoservice.dlr.de/web/ (accessed on 10 December 2024).
Conflicts of Interest
Author Jun Xie was employed by the CEL Terminus (Shanghai) Information Technologies Co., Ltd. The remaining author declare that the research was conducted in the absence of any commercial or financial relationships that could be construed as a potential conflict of interest.
References
- Frantz, D.; Schug, F.; Wiedenhofer, D.; Baumgart, A.; Virág, D.; Cooper, S.; Gómez-Medina, C.; Lehmann, F.; Udelhoven, T.; van der Linden, S.; et al. Unveiling patterns in human dominated landscapes through mapping the mass of US built structures. Nat. Commun. 2023, 14, 8014. [Google Scholar] [CrossRef]
- Esch, T.; Brzoska, E.; Dech, S.; Leutner, B.; Palacios-Lopez, D.; Metz-Marconcini, A.; Marconcini, M.; Roth, A.; Zeidler, J. World Settlement Footprint 3D—A first three-dimensional survey of the global building stock. Remote Sens. Environ. 2022, 270, 112877. [Google Scholar] [CrossRef]
- Chen, G.; Zhou, Y.; Voogt, J.A.; Stokes, E.C. Remote sensing of diverse urban environments: From the single city to multiple cities. Remote Sens. Environ. 2024, 305, 114108. [Google Scholar] [CrossRef]
- Xiao, W.; Ruan, L.; Wang, K.; Xu, S.; Yue, W.; He, T.; Chen, W.; Li, X.; Zhang, Y. Measuring three-dimension urban expansion using multi-source data and change detection algorithm: A case study of Shanghai. Cities 2025, 158, 105682. [Google Scholar] [CrossRef]
- Wu, B.; Huang, H.; Wang, Y.; Shi, S.; Wu, J.; Yu, B. Global spatial patterns between nighttime light intensity and urban building morphology. Int. J. Appl. Earth Obs. Geoinf. 2023, 124, 103495. [Google Scholar] [CrossRef]
- Biljecki, F.; Chow, Y.S. Global building morphology indicators. Comput. Environ. Urban Syst. 2022, 95, 101809. [Google Scholar] [CrossRef]
- Wang, Y.; Sun, G.; Wu, Y.; Rosenberg, M.W. Urban 3D building morphology and energy consumption: Empirical evidence from 53 cities in China. Sci. Rep. 2024, 14, 12887. [Google Scholar] [CrossRef]
- Kamal, A.; Abidi, S.M.H.; Mahfouz, A.; Kadam, S.; Rahman, A.; Hassan, I.G.; Wang, L.L. Impact of urban morphology on urban microclimate and building energy loads. Energy Build. 2021, 253, 111499. [Google Scholar] [CrossRef]
- Chakraborty, S.; Maity, I.; Dadashpoor, H.; Novotnẏ, J.; Banerji, S. Building in or out? Examining urban expansion patterns and land use efficiency across the global sample of 466 cities with million+ inhabitants. Habitat Int. 2022, 120, 102503. [Google Scholar] [CrossRef]
- Ashik, F.R.; Sreezon, A.I.Z.; Rahman, M.H.; Zafri, N.M.; Labib, S.M. Built environment influences commute mode choice in a global south megacity context: Insights from explainable machine learning approach. J. Transp. Geogr. 2024, 116, 103828. [Google Scholar] [CrossRef]
- Wang, M.; Debbage, N. Urban morphology and traffic congestion: Longitudinal evidence from US cities. Comput. Environ. Urban Syst. 2021, 89, 101676. [Google Scholar] [CrossRef]
- Hui, E.C.M.; Li, X.; Chen, T.; Lang, W. Deciphering the spatial structure of China’s megacity region: A new bay area—The Guangdong-Hong Kong-Macao Greater Bay Area in the making. Cities 2020, 105, 102168. [Google Scholar] [CrossRef]
- Stokes, E.C.; Seto, K.C. Characterizing and measuring urban landscapes for sustainability. Environ. Res. Lett. 2019, 14, 045002. [Google Scholar] [CrossRef]
- Mouratidis, K. Urban planning and quality of life: A review of pathways linking the built environment to subjective well-being. Cities 2021, 115, 103229. [Google Scholar] [CrossRef]
- Wu, B.; Yu, B.; Shu, S.; Liang, H.; Zhao, Y.; Wu, J. Mapping fine-scale visual quality distribution inside urban streets using mobile LiDAR data. Build. Environ. 2021, 206, 108323. [Google Scholar] [CrossRef]
- Koumetio Tekouabou, S.C.; Diop, E.B.; Azmi, R.; Jaligot, R.; Chenal, J. Reviewing the application of machine learning methods to model urban form indicators in planning decision support systems: Potential, issues and challenges. J. King Saud. Univ.- Comput. Inf. Sci. 2022, 34, 5943–5967. [Google Scholar] [CrossRef]
- Liu, X.; Wu, X.; Li, X.; Xu, X.; Liao, W.; Jiao, L.; Zeng, Z.; Chen, G.; Li, X. Global mapping of three-dimensional (3D) urban structures reveals escalating utilization in the vertical dimension and pronounced building space inequality. Engineering 2024, 47, 86–99. [Google Scholar] [CrossRef]
- Lu, J.; Nazarian, N.; Hart, M.A.; Krayenhoff, E.S.; Martilli, A. Representing the effects of building height variability on urban canopy flow. Q. J. Roy. Meteorol. Soc. 2024, 150, 46–67. [Google Scholar] [CrossRef]
- Bruyns, G.J.; Higgins, C.D.; Nel, D.H. Urban volumetrics: From vertical to volumetric urbanisation and its extensions to empirical morphological analysis. Urban Stud. 2021, 58, 922–940. [Google Scholar] [CrossRef]
- Schröter, K.; Lüdtke, S.; Redweik, R.; Meier, J.; Bochow, M.; Ross, L.; Nagel, C.; Kreibich, H. Flood loss estimation using 3D city models and remote sensing data. Environ. Model. Softw. 2018, 105, 118–131. [Google Scholar] [CrossRef]
- Gao, J.; Zhong, X.; Cai, W.; Ren, H.; Huo, T.; Wang, X.; Mi, Z. Dilution effect of the building area on energy intensity in urban residential buildings. Nat. Commun. 2019, 10, 4944. [Google Scholar] [CrossRef]
- Geiß, C.; Schrade, H.; Aravena Pelizari, P.; Taubenböck, H. Multistrategy ensemble regression for mapping of built-up density and height with Sentinel-2 data. ISPRS J. Photogramm. Remote Sens. 2020, 170, 57–71. [Google Scholar] [CrossRef]
- Wang, Y.; Li, X.; Yin, P.; Yu, G.; Cao, W.; Liu, J.; Pei, L.; Hu, T.; Zhou, Y.; Liu, X.; et al. Characterizing annual dynamics of urban form at the horizontal and vertical dimensions using long-term Landsat time series data. ISPRS J. Photogramm. Remote Sens. 2023, 203, 199–210. [Google Scholar] [CrossRef]
- Grohmann, C.H. Evaluation of TanDEM-X DEMs on selected Brazilian sites: Comparison with SRTM, ASTER GDEM and ALOS AW3D30. Remote Sens. Environ. 2018, 212, 121–133. [Google Scholar] [CrossRef]
- Frantz, D.; Schug, F.; Okujeni, A.; Navacchi, C.; Wagner, W.; van der Linden, S.; Hostert, P. National-scale mapping of building height using Sentinel-1 and Sentinel-2 time series. Remote Sens. Environ. 2021, 252, 112128. [Google Scholar] [CrossRef]
- Wu, B.; Yu, B.; Wu, Q.; Yao, S.; Zhao, F.; Mao, W.; Wu, J. A graph-based approach for 3D building model reconstruction from airborne LiDAR point clouds. Remote Sens. 2017, 9, 92. [Google Scholar] [CrossRef]
- Zhao, Y.; Wu, B.; Li, Q.; Yang, L.; Fan, H.; Wu, J.; Yu, B. Combining ICESat-2 photons and Google Earth Satellite images for building height extraction. Int. J. Appl. Earth Obs. Geoinf. 2023, 117, 103213. [Google Scholar] [CrossRef]
- Wu, B.; Huang, H.; Zhao, Y. Utilizing building offset and shadow to retrieve urban building heights with ICESat-2 photons. Remote Sens. 2023, 15, 3786. [Google Scholar] [CrossRef]
- Huang, H.; Chen, P.; Xu, X.; Liu, C.; Wang, J.; Liu, C.; Clinton, N.; Gong, P. Estimating building height in China from ALOS AW3D30. ISPRS J. Photogramm. Remote Sens. 2022, 185, 146–157. [Google Scholar] [CrossRef]
- Choi, H.S.; Bruyns, G.; Zhang, W.; Cheng, T.; Sharma, S. Spatial cognition and three-dimensional vertical urban design guidelines—Cognitive measurement and modelling for human centre design. Urban Sci. 2023, 7, 125. [Google Scholar] [CrossRef]
- Zhang, H.; Andrade, B.; Wang, X.; Aburabee, I.; Yuan, S. A study of spatial cognition in the rural heritage based on VR 3D eye-tracking experiments. Herit. Sci. 2024, 12, 141. [Google Scholar] [CrossRef]
- Batty, M. The size, scale, and shape of cities. Science 2008, 319, 769–771. [Google Scholar] [CrossRef] [PubMed]
- Wang, J.; Georganos, S.; Kuffer, M.; Abascal, A.; Vanhuysse, S. On the knowledge gain of urban morphology from space. Comput. Environ. Urban Syst. 2022, 95, 101831. [Google Scholar] [CrossRef]
- Fleischmann, M.; Romice, O.; Porta, S. Measuring urban form: Overcoming terminological inconsistencies for a quantitative and comprehensive morphologic analysis of cities. Environ. Plan. B Urban Anal. City Sci. 2021, 48, 2133–2150. [Google Scholar] [CrossRef]
- Liqiang, Z.; Deng, H.; Chen, D.; Zhen, W. A spatial cognition-based urban building clustering approach and its applications. Int. J. Geogr. Inf. Sci. 2013, 27, 721–740. [Google Scholar] [CrossRef]
- Bonczak, B.; Kontokosta, C.E. Large-scale parameterization of 3D building morphology in complex urban landscapes using aerial LiDAR and city administrative data. Comput. Environ. Urban Syst. 2019, 73, 126–142. [Google Scholar] [CrossRef]
- Wu, B.; Huang, H.; Wang, Y. Quantifying spatial patterns of urban building morphology in the China’s Guangdong-Hong Kong-Marco greater bay area. Int. J. Digit. Earth 2024, 17, 2392832. [Google Scholar] [CrossRef]
- Labetski, A.; Vitalis, S.; Biljecki, F.; Arroyo Ohori, K.; Stoter, J. 3D building metrics for urban morphology. Int. J. Geogr. Inf. Sci. 2023, 37, 36–67. [Google Scholar] [CrossRef]
- Zhang, P.; Ghosh, D.; Park, S. Spatial measures and methods in sustainable urban morphology: A systematic review. Landsc. Urban Plan. 2023, 237, 104776. [Google Scholar] [CrossRef]
- Liu, M.; Hu, Y.-M.; Li, C.-L. Landscape metrics for three-dimensional urban building pattern recognition. Appl. Geog. 2017, 87, 66–72. [Google Scholar] [CrossRef]
- Plexida, S.G.; Sfougaris, A.I.; Ispikoudis, I.P.; Papanastasis, V.P. Selecting landscape metrics as indicators of spatial heterogeneity—A comparison among Greek landscapes. Int. J. Appl. Earth Obs. Geoinf. 2014, 26, 26–35. [Google Scholar] [CrossRef]
- Caruso, G.; Hilal, M.; Thomas, I. Measuring urban forms from inter-building distances: Combining MST graphs with a Local Index of Spatial Association. Landsc. Urban Plan. 2017, 163, 80–89. [Google Scholar] [CrossRef]
- Wu, B.; Yu, B.; Wu, Q.; Chen, Z.; Yao, S.; Huang, Y.; Wu, J. An Extended Minimum Spanning Tree method for characterizing local urban patterns. Int. J. Geogr. Inf. Sci. 2018, 32, 450–475. [Google Scholar] [CrossRef]
- Yang, L.; Yang, X.; Zhang, H.; Ma, J.; Zhu, H.; Huang, X. Urban morphological regionalization based on 3D building blocks—A case in the central area of Chengdu, China. Comput. Environ. Urban Syst. 2022, 94, 101800. [Google Scholar] [CrossRef]
- Yang, L.; Zhou, X.; Yang, X.; Chen, Y.; Zhang, H.; Na, J. A new hierarchical analysis framework of building heights: Towards a more intuitive understanding of 3D urban structure. Trans. GIS 2024, 28, 40–57. [Google Scholar] [CrossRef]
- Yan, X.; Ai, T.; Yang, M.; Yin, H. A graph convolutional neural network for classification of building patterns using spatial vector data. ISPRS J. Photogramm. Remote Sens. 2019, 150, 259–273. [Google Scholar] [CrossRef]
- Wu, S.; Sumari, N.S.; Dong, T.; Xu, G.; Liu, Y. Characterizing urban expansion combining concentric-ring and grid-based analysis for Latin American cities. Land 2021, 10, 444. [Google Scholar] [CrossRef]
- Xu, G.; Dong, T.; Cobbinah, P.B.; Jiao, L.; Sumari, N.S.; Chai, B.; Liu, Y. Urban expansion and form changes across African cities with a global outlook: Spatiotemporal analysis of urban land densities. J. Clean. Prod. 2019, 224, 802–810. [Google Scholar] [CrossRef]
- Xu, Z.; Jiao, L.; Lan, T.; Zhou, Z.; Cui, H.; Li, C.; Xu, G.; Liu, Y. Mapping hierarchical urban boundaries for global urban settlements. Int. J. Appl. Earth Obs. Geoinf. 2021, 103, 102480. [Google Scholar] [CrossRef]
- Malik, K.; Robertson, C.; Roberts, S.A.; Remmel, T.K.; Long, J.A. Computer vision models for comparing spatial patterns: Understanding spatial scale. Int. J. Geogr. Inf. Sci. 2023, 37, 1–35. [Google Scholar] [CrossRef]
- Yang, C.; Li, Q.; Hu, Z.; Chen, J.; Shi, T.; Ding, K.; Wu, G. Spatiotemporal evolution of urban agglomerations in four major bay areas of US, China and Japan from 1987 to 2017: Evidence from remote sensing images. Sci. Total Environ. 2019, 671, 232–247. [Google Scholar] [CrossRef]
- Wu, W.-B.; Ma, J.; Banzhaf, E.; Meadows, M.E.; Yu, Z.-W.; Guo, F.-X.; Sengupta, D.; Cai, X.-X.; Zhao, B. A first Chinese building height estimate at 10 m resolution (CNBH-10 m) using multi-source earth observations and machine learning. Remote Sens. Environ. 2023, 291, 113578. [Google Scholar] [CrossRef]
- Cao, Y.; Huang, X. A deep learning method for building height estimation using high-resolution multi-view imagery over urban areas: A case study of 42 Chinese cities. Remote Sens. Environ. 2021, 264, 112590. [Google Scholar] [CrossRef]
- Stipek, C.; Hauser, T.; Adams, D.; Epting, J.; Brelsford, C.; Moehl, J.; Dias, P.; Piburn, J.; Stewart, R. Inferring building height from footprint morphology data. Sci. Rep. 2024, 14, 18651. [Google Scholar] [CrossRef] [PubMed]
- Wu, Q.; Liu, H.; Wang, S.; Yu, B.; Beck, R.; Hinkel, K. A localized contour tree method for deriving geometric and topological properties of complex surface depressions based on high-resolution topographical data. Int. J. Geogr. Inf. Sci. 2015, 29, 2041–2060. [Google Scholar] [CrossRef]
- Wu, B.; Yu, B.; Wu, Q.; Huang, Y.; Chen, Z.; Wu, J. Individual tree crown delineation using localized contour tree method and airborne LiDAR data in coniferous forests. Int. J. Appl. Earth Obs. Geoinf. 2016, 52, 82–94. [Google Scholar] [CrossRef]
- Peng, J.; Cheng, X.; Hu, Y.; Corcoran, J. A landscape connectivity approach to mitigating the urban heat island effect. Landsc. Ecol. 2022, 37, 1707–1719. [Google Scholar] [CrossRef]
- Lauri, J. Subgraphs as a Measure of Similarity. In Structural Analysis of Complex Networks; Dehmer, M., Ed.; Birkhäuser: Boston, MA, USA, 2011; pp. 319–334. [Google Scholar]
- Ehrlich, H.-C.; Rarey, M. Maximum common subgraph isomorphism algorithms and their applications in molecular science: A review. WIREs Comput. Mol. Sci. 2011, 1, 68–79. [Google Scholar] [CrossRef]
- Raymond, J.W.; Willett, P. Maximum common subgraph isomorphism algorithms for the matching of chemical structures. J. Comput. Aided Mol. Des. 2002, 16, 521–533. [Google Scholar] [CrossRef]
- Wu, B.; Yu, B.; Yao, S.; Wu, Q.; Chen, Z.; Wu, J. A surface network based method for studying urban hierarchies by night time light remote sensing data. Int. J. Geogr. Inf. Sci. 2019, 33, 1377–1398. [Google Scholar] [CrossRef]
- Xie, X.; Liu, X.; McNay, I. One country with two systems: The characteristics and development of higher education in the Guangdong–Hong Kong–Macau Greater Bay Area. Humanit. Soc. Sci. Commun. 2023, 10, 1. [Google Scholar] [CrossRef]
- Osman, T. Land use regulations and the dispersion of the IT Industry in the San Francisco Bay area. Pap. Reg. Sci. 2020, 99, 1301–1317. [Google Scholar] [CrossRef]
- Jasiewicz, J.; Netzel, P.; Stepinski, T.F. Landscape similarity, retrieval, and machine mapping of physiographic units. Geomorphology 2014, 221, 104–112. [Google Scholar] [CrossRef]
- Dark, S.J.; Bram, D. The modifiable areal unit problem (MAUP) in physical geography. Prog. Phys. Geogr. 2007, 31, 471–479. [Google Scholar] [CrossRef]
- Li, M.; Wang, Y.; Rosier, J.F.; Verburg, P.H.; van Vliet, J. Global maps of 3D built-up patterns for urban morphological analysis. Int. J. Appl. Earth Obs. Geoinf. 2022, 114, 103048. [Google Scholar] [CrossRef]
- Xu, Z.; Coors, V. Combining system dynamics model, GIS and 3D visualization in sustainability assessment of urban residential development. Build. Environ. 2012, 47, 272–287. [Google Scholar] [CrossRef]
- Wei, Y.D.; Ewing, R. Urban expansion, sprawl and inequality. Landsc. Urban Plan. 2018, 177, 259–265. [Google Scholar] [CrossRef]
- He, J.; Li, X.; Liu, P.; Wu, X.; Zhang, J.; Zhang, D.; Liu, X.; Yao, Y. Accurate estimation of the proportion of mixed land use at the street-block level by integrating high spatial resolution images and geospatial big data. IEEE Trans. Geosci. Remote Sens. 2021, 59, 6357–6370. [Google Scholar] [CrossRef]
- Liu, Y.; Fang, F.; Li, Y. Key issues of land use in China and implications for policy making. Land Use Policy 2014, 40, 6–12. [Google Scholar] [CrossRef]
- Wu, X.; Ou, J.; Wen, Y.; Liu, X.; He, J.; Zhang, J. Developing a data-fusing method for mapping fine-scale urban three-dimensional building structure. Sustain. Cities Soc. 2022, 80, 103716. [Google Scholar] [CrossRef]
- Chen, F.; Wittkopf, S.K.; Khai Ng, P.; Du, H. Solar heat gain coefficient measurement of semi-transparent photovoltaic modules with indoor calorimetric hot box and solar simulator. Energy Build. 2012, 53, 74–84. [Google Scholar] [CrossRef]
- Wang, C.; Song, J.; Shi, D.; Reyna, J.L.; Horsey, H.; Feron, S.; Zhou, Y.; Ouyang, Z.; Li, Y.; Jackson, R.B. Impacts of climate change, population growth, and power sector decarbonization on urban building energy use. Nat. Commun. 2023, 14, 6434. [Google Scholar] [CrossRef]
- Hui, Y.; Tang, Y.; Yang, Q.; Mochida, A. Numerical study on influence of surface vegetation on aerodynamics of high-rise buildings. Sustain. Cities Soc. 2024, 107, 105407. [Google Scholar] [CrossRef]
- Al-Kodmany, K. Greenery-covered tall buildings: A review. Buildings 2023, 13, 2362. [Google Scholar] [CrossRef]
- Sandifer, P.A.; Sutton-Grier, A.E.; Ward, B.P. Exploring connections among nature, biodiversity, ecosystem services, and human health and well-being: Opportunities to enhance health and biodiversity conservation. Ecosyst. Serv. 2015, 12, 1–15. [Google Scholar] [CrossRef]
- Xikai, M.; Lixiong, W.; Jiwei, L.; Xiaoli, Q.; Tongyao, W. Comparison of regression models for estimation of carbon emissions during building’s lifecycle using designing factors: A case study of residential buildings in Tianjin, China. Energy Build. 2019, 204, 109519. [Google Scholar] [CrossRef]
- Hesslerová, P.; Pokorný, J.; Huryna, H.; Seják, J.; Jirka, V. The impacts of greenery on urban climate and the options for use of thermal data in urban areas. Prog. Plan. 2022, 159, 100545. [Google Scholar] [CrossRef]
- Zhou, Y.; Zhao, H.; Mao, S.; Zhang, G.; Jin, Y.; Luo, Y.; Huo, W.; Pan, Z.; An, P.; Lun, F. Exploring surface urban heat island (SUHI) intensity and its implications based on urban 3D neighborhood metrics: An investigation of 57 Chinese cities. Sci. Total Environ. 2022, 847, 157662. [Google Scholar] [CrossRef]
- Gao, H.; Liu, J.; Lin, P.; Li, C.; Xiao, Y.; Hu, G. Pedestrian level wind flow field of elevated tall buildings with dense tandem arrangement. Build. Environ. 2022, 226, 109745. [Google Scholar] [CrossRef]
- Shui, T.; Cao, L.; Xiao, T.; Zhang, S. Influence of building-height variability on urban ventilation and pollutant dispersion characteristics. Atmosphere 2025, 16, 614. [Google Scholar] [CrossRef]
Disclaimer/Publisher’s Note: The statements, opinions and data contained in all publications are solely those of the individual author(s) and contributor(s) and not of MDPI and/or the editor(s). MDPI and/or the editor(s) disclaim responsibility for any injury to people or property resulting from any ideas, methods, instructions or products referred to in the content. |
© 2025 by the authors. Licensee MDPI, Basel, Switzerland. This article is an open access article distributed under the terms and conditions of the Creative Commons Attribution (CC BY) license (https://creativecommons.org/licenses/by/4.0/).