Multi-Source Data and Semantic Segmentation: Spatial Quality Assessment and Enhancement Strategies for Jinan Mingfu City from a Tourist Perception Perspective

Abstract
1. Introduction
2. Materials and Methods
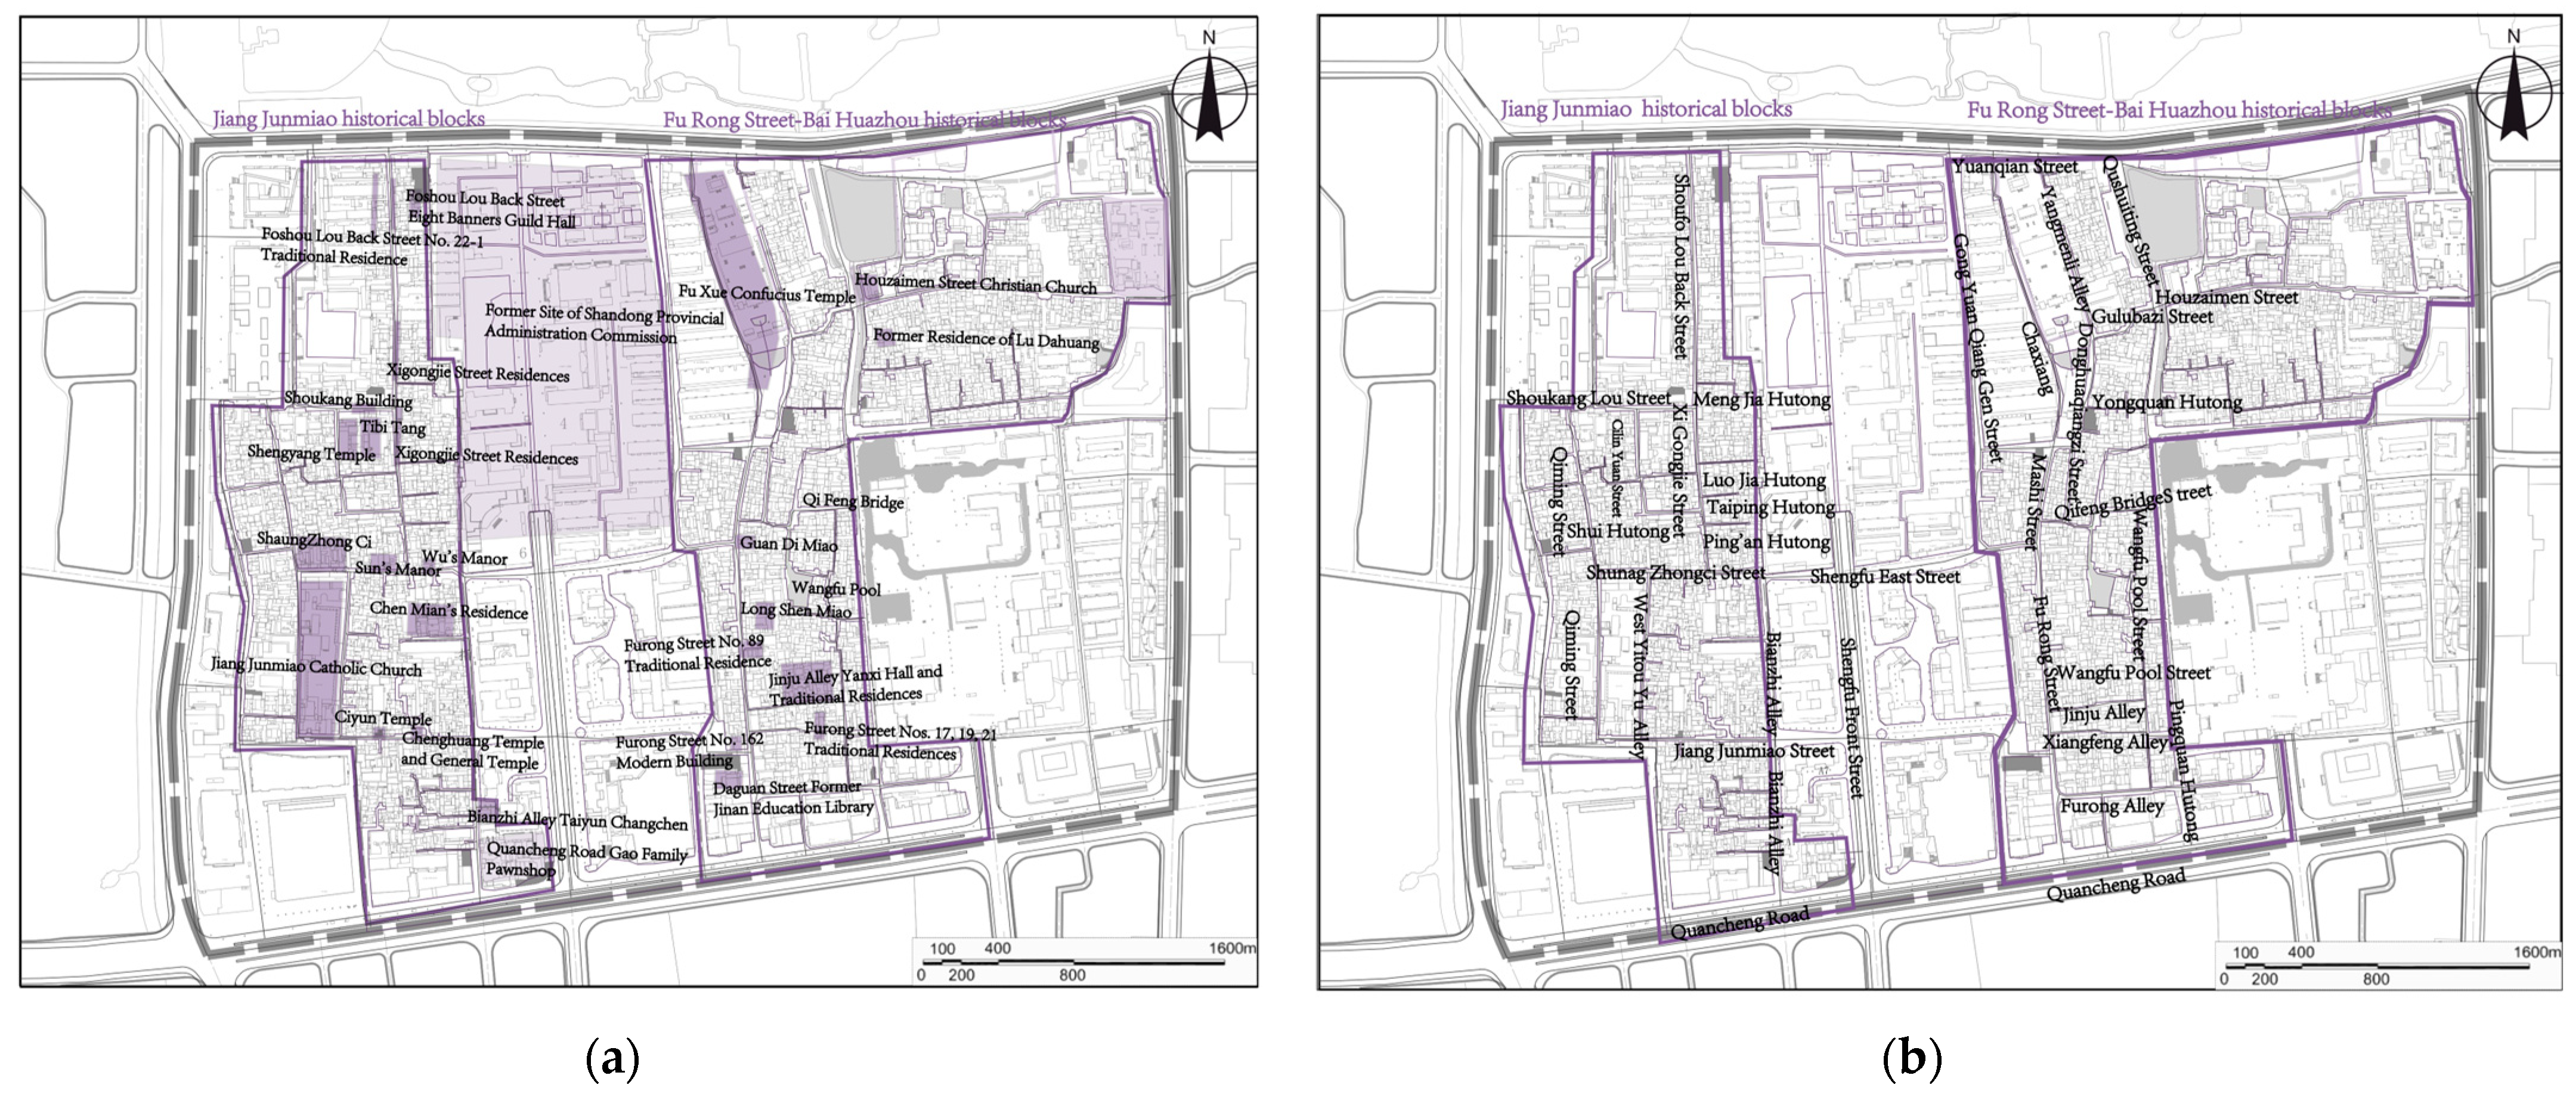
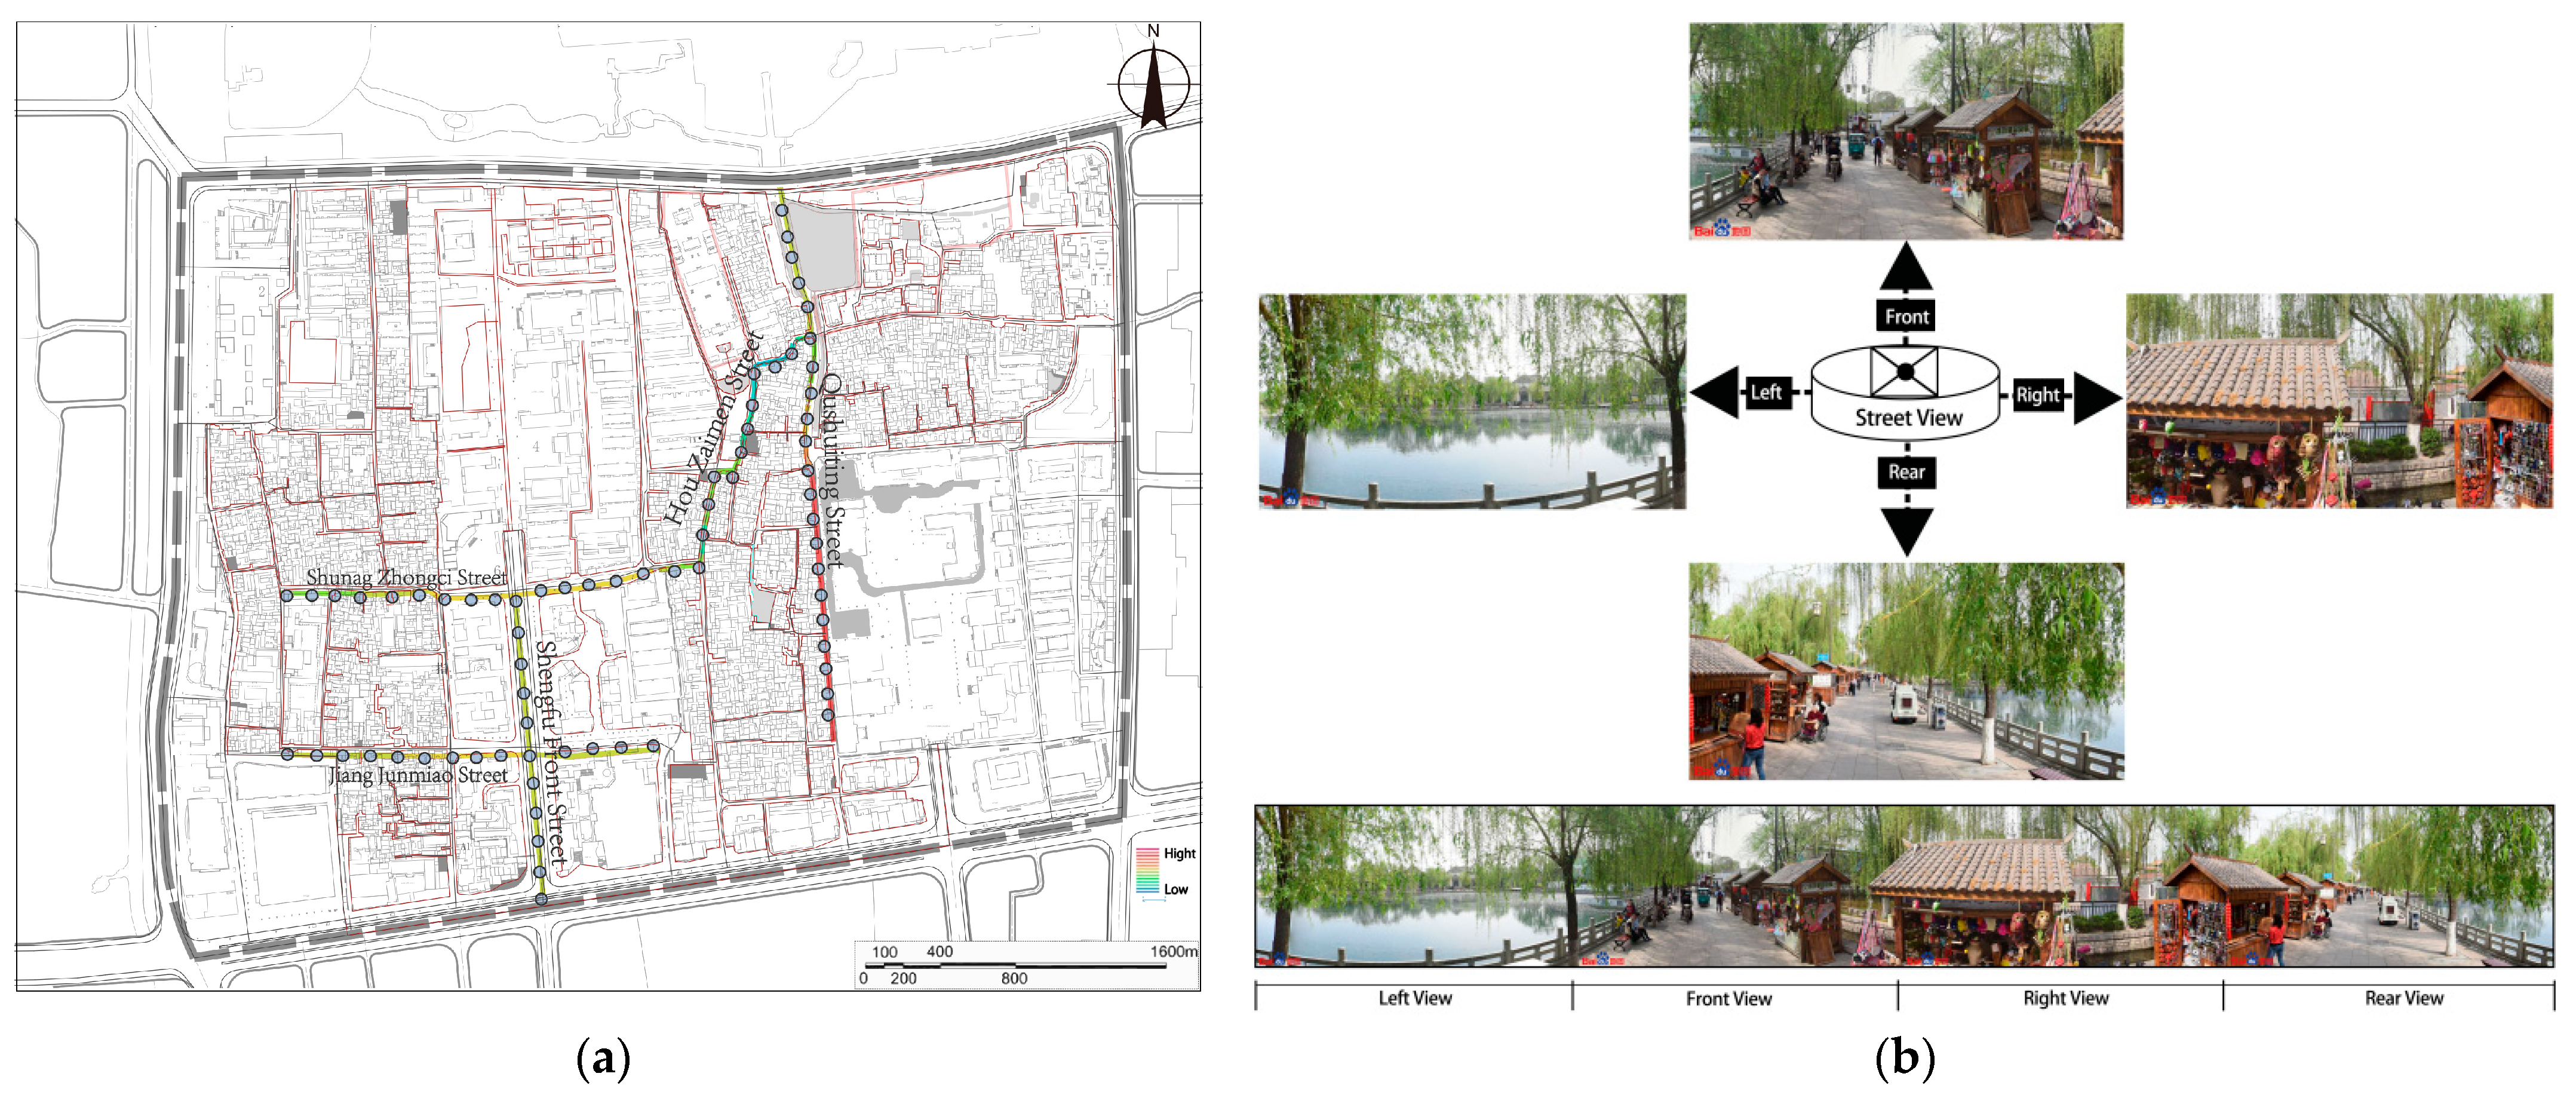
2.1. Spatial Characteristics and Cultural Heritage Distribution of Jinan Mingfu City
- Fu Rong Street–Bai Huazhou historical blocks (bounded by Quancheng Road to the south, Daminghu Road to the north, Zhenchi Street to the east, and Gong Yuan qianggen Street to the west) exemplify Jinan’s traditional commercial culture and folk customs, hosting clusters of time-honored eateries, handicraft stores, and cultural and creative boutiques. Baihuazhou, with its natural landscapes and historical and cultural heritage, has become a premier destination for tourists to experience Jinan’s spring water culture and historic urban ambiance.
- Jiang Junmiao historical blocks (delimited by Quancheng Road to the south, Daminghu Road to the north, Bianzhi Lane to the east, and Taiping Temple Street and Xichenggen Street to the west) are distinguished by their religious heritage and historical architecture, including landmarks such as the Guandi Temple and Fu Xue Confucian Temple. These ancient buildings not only showcase the artistic style of Jinan’s ancient architecture but also reflect the city’s profound historical and cultural heritage.
- Heritage architecture: A total of 276 traditional buildings, including 11 provincial-level conservation units such as Fu Xue Confucian Temple, Chen Mian’s Zhuangyuan Mansion, and 30 municipal-level conservation units such as Lao She’s Former Residence, Hou Zaimen Christian Church;
- Intangible cultural heritage sites: National-level intangible cultural heritage sites such as Jinan Shadow Puppetry Theater, Lu Embroidery, Cloisonné Workshops, and the birthplace of Qushui Liushang culture;
- Characteristic spaces: The spring–alley–courtyard spatial fabric, such as Furong Spring, Wangfu Pool, Ming-Qing dynasty streets and alleys, such as Qushuiting Street, Jiang Junmiao Street, and spring water folk activities, such as the Lotus Festival and Dragon Lantern Fair.
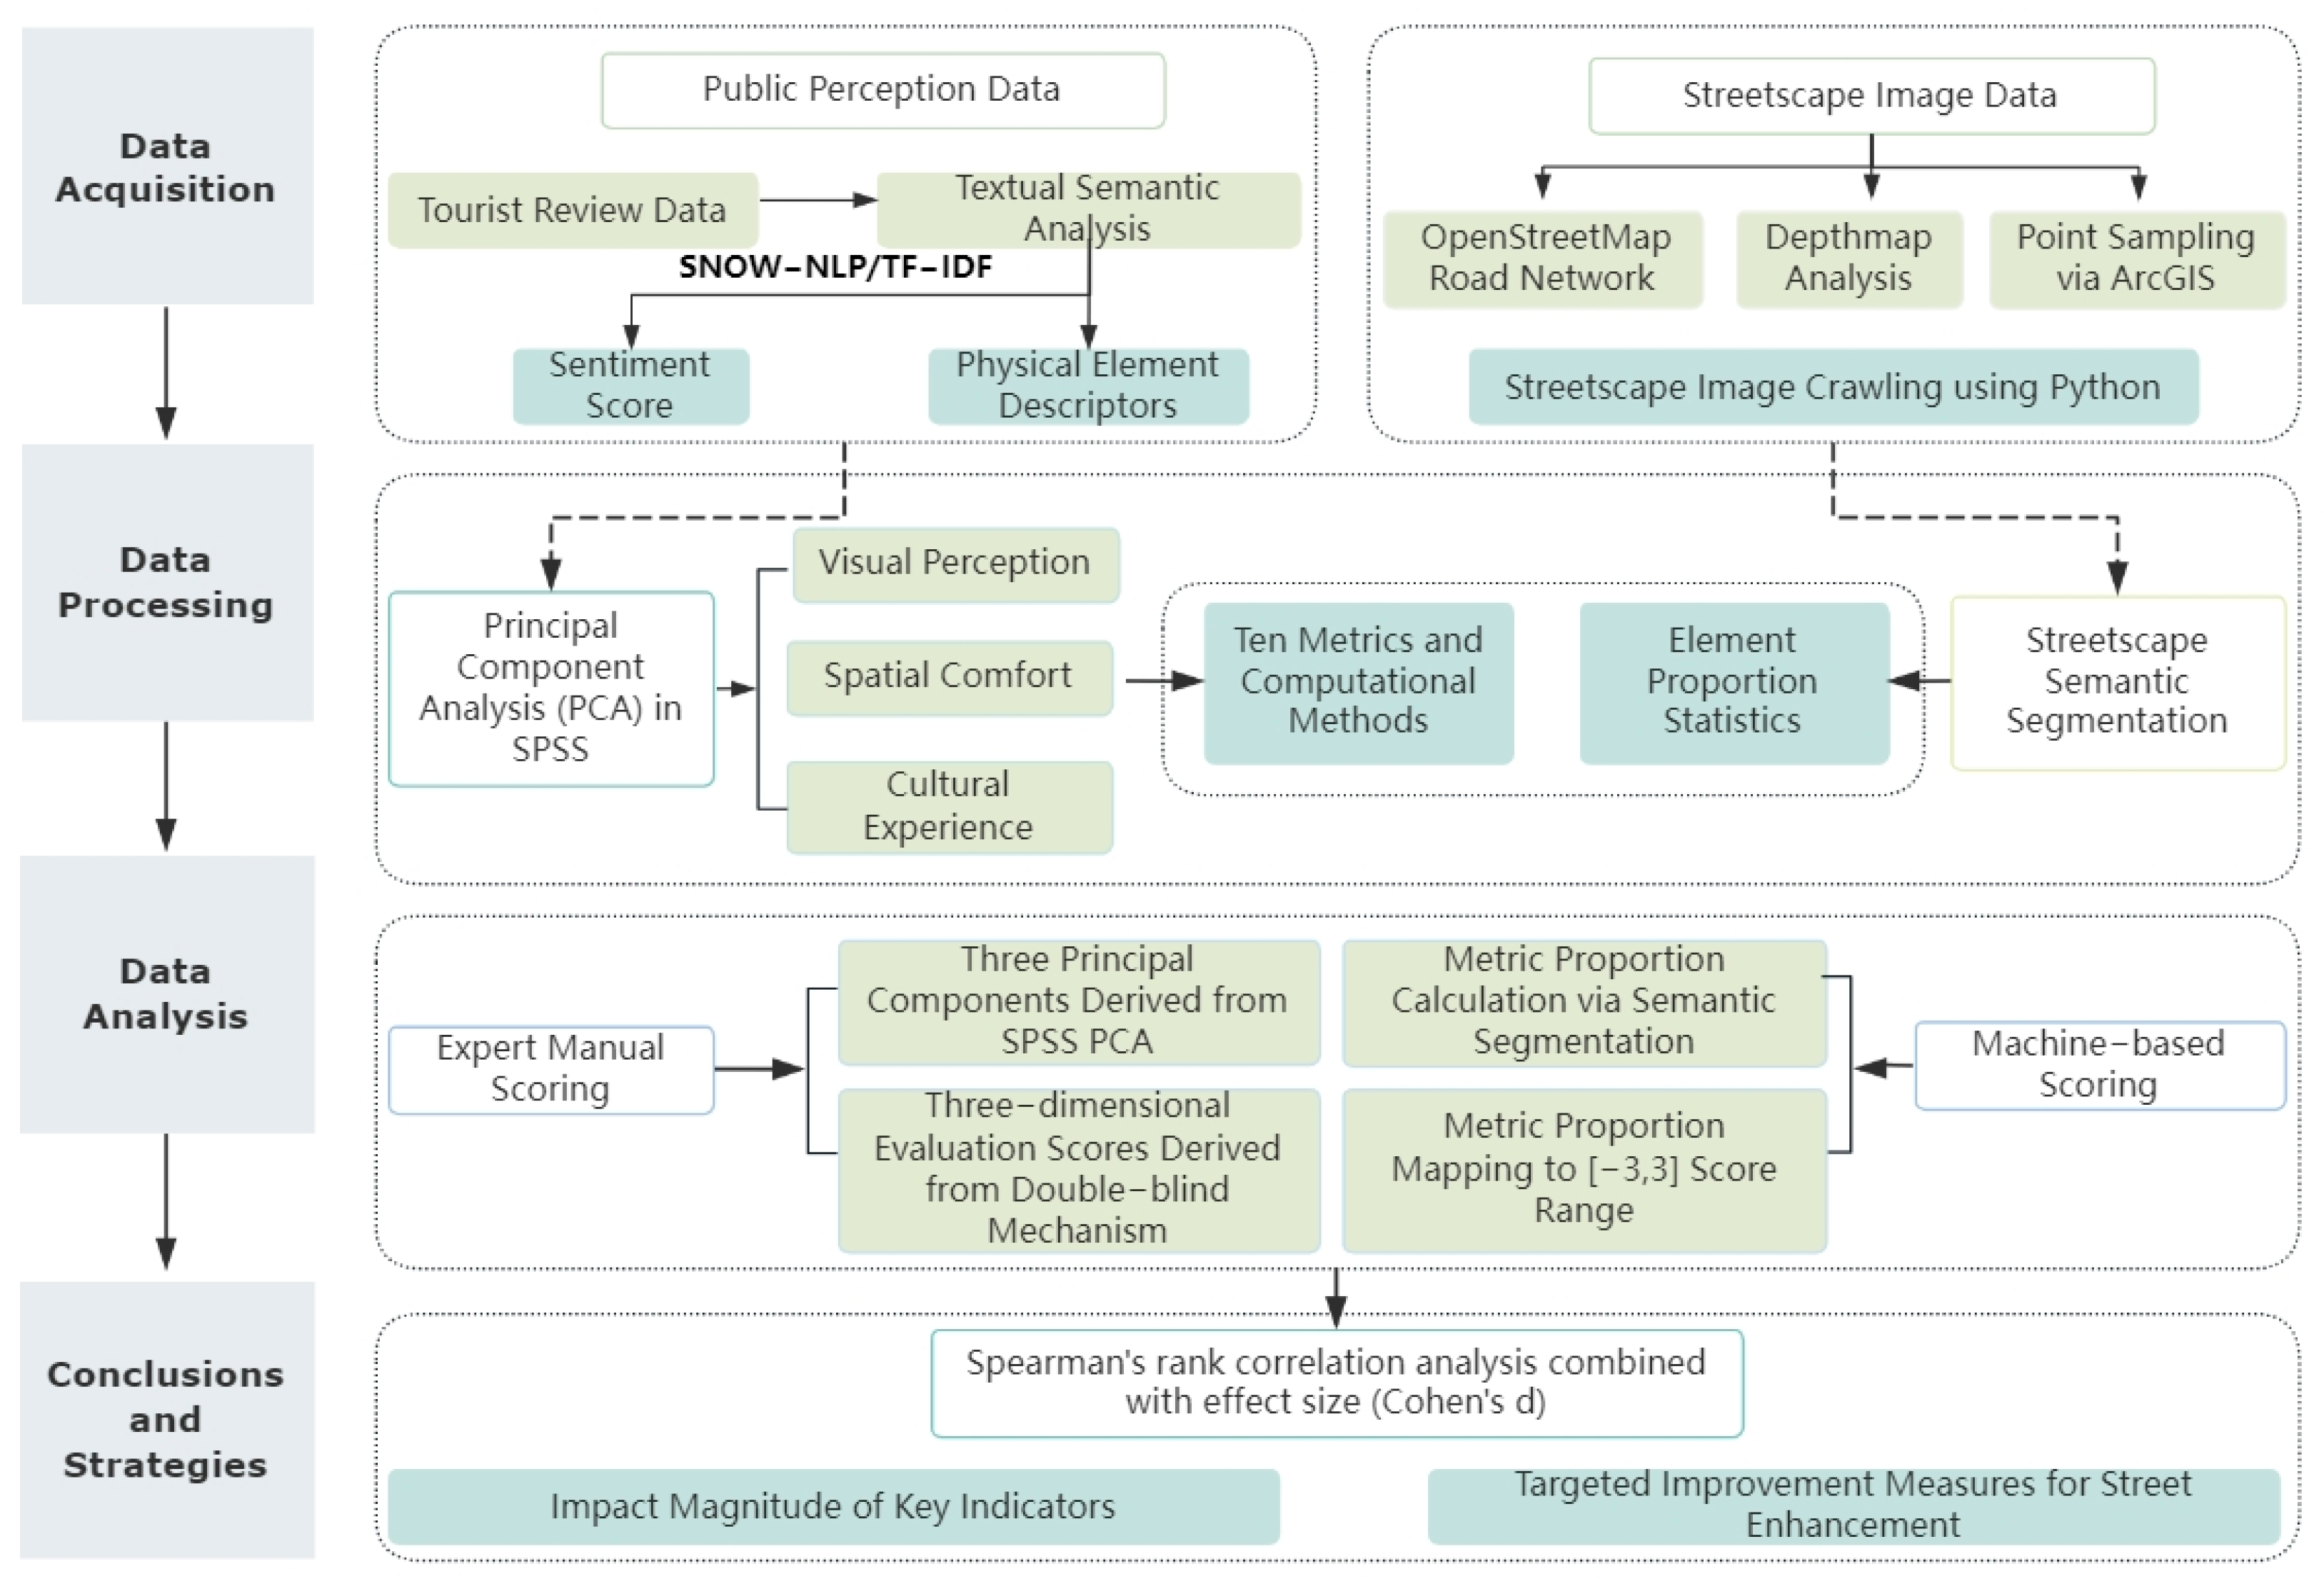
2.2. Research Framework
- Visual dimension: Prioritizes aesthetic coherence;
- Comfort dimension: Focuses on spatial accessibility and facility convenience;
- Cultural dimension: Emphasizes historical symbol preservation and narrative immersion.
3. Data and Methodology
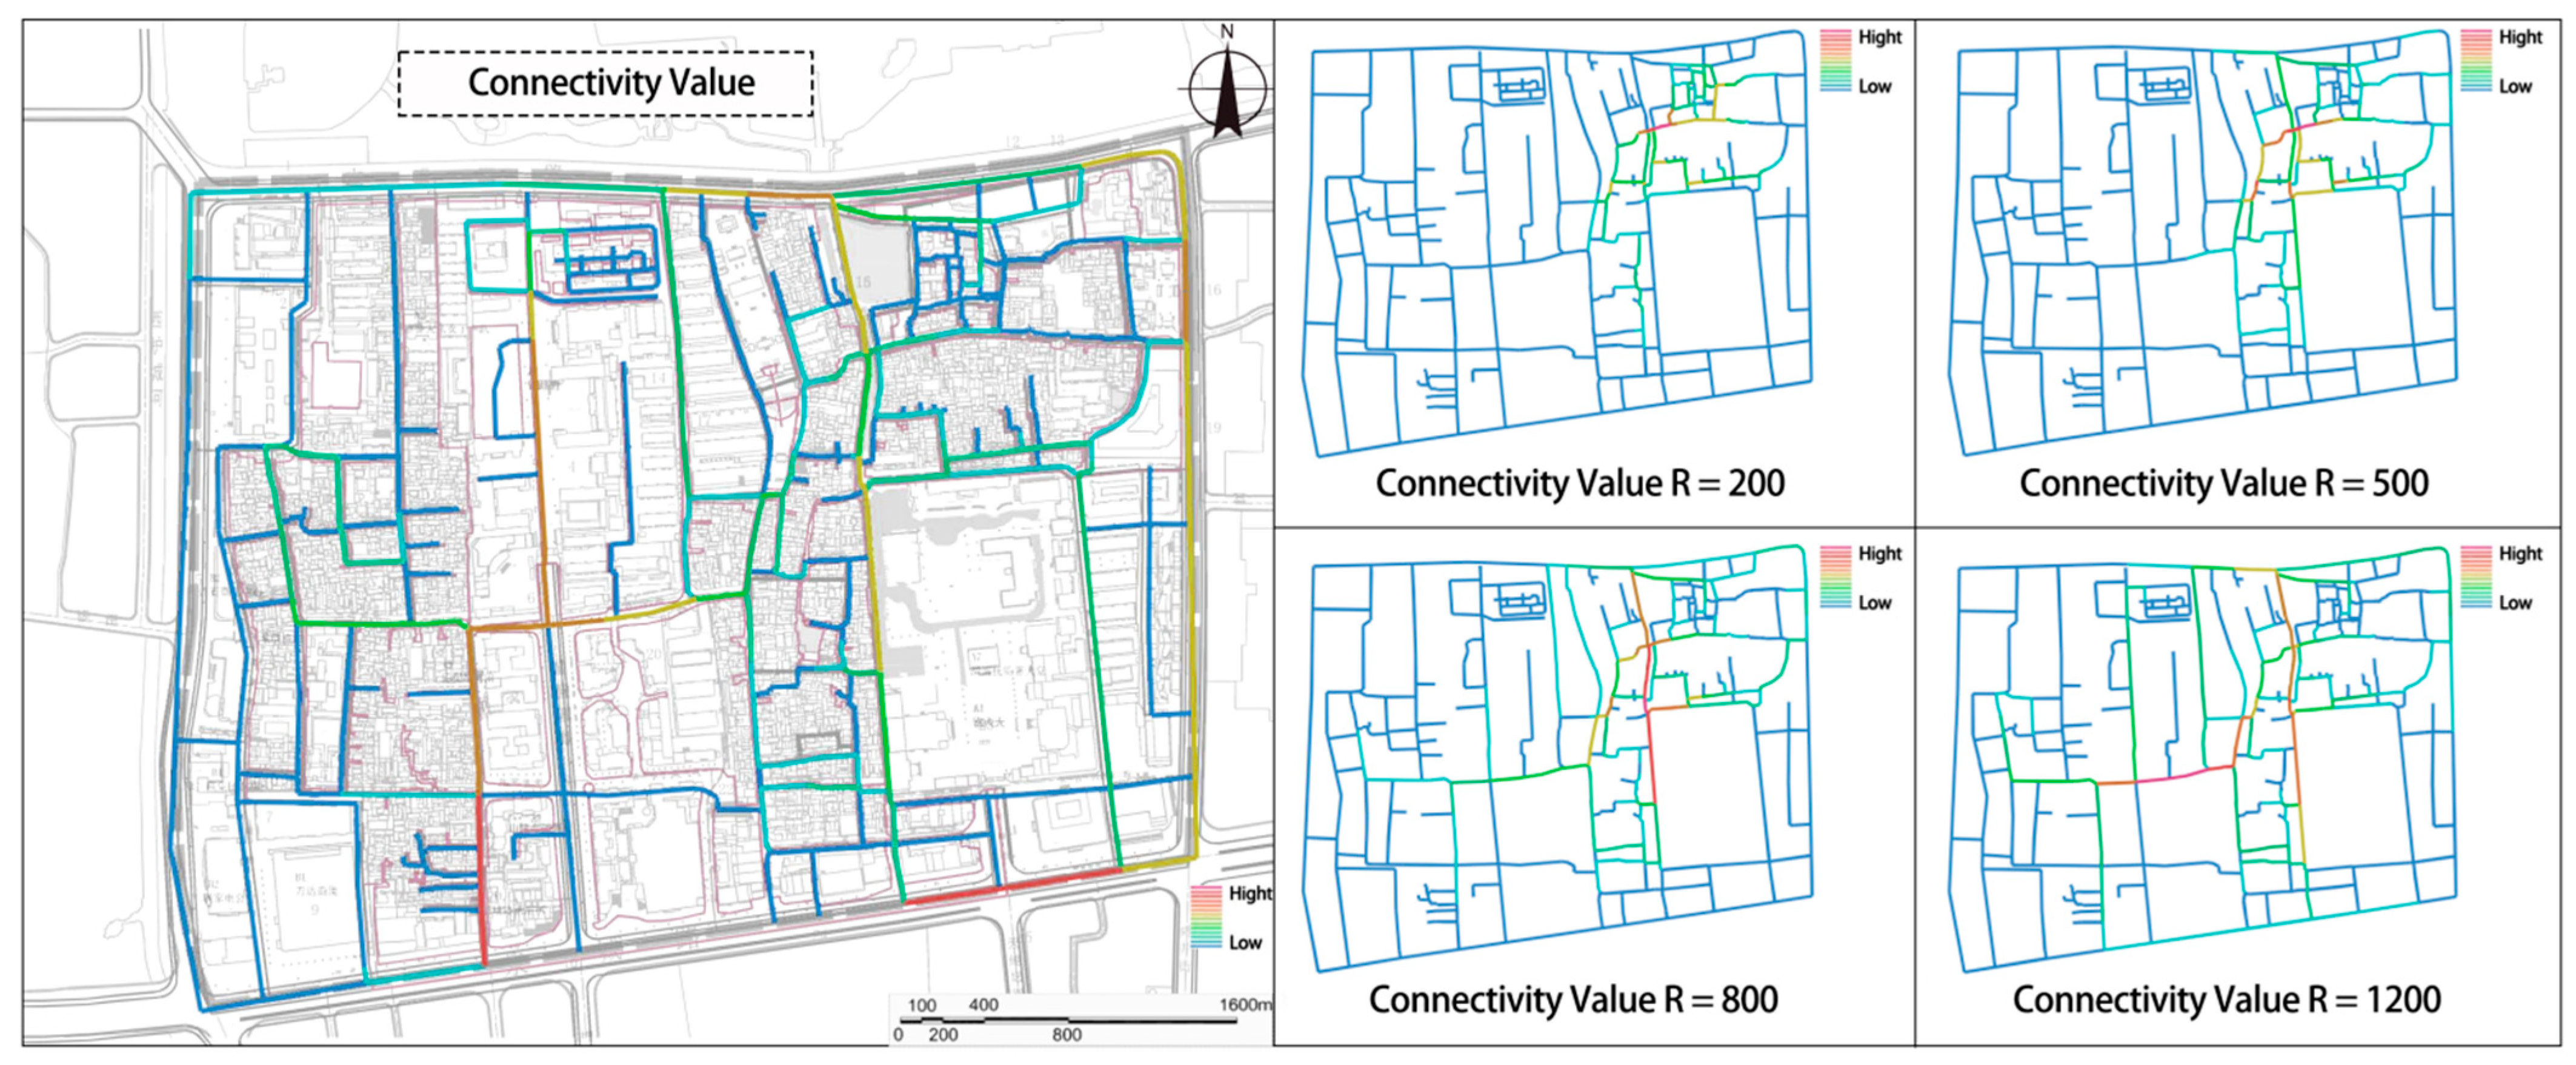
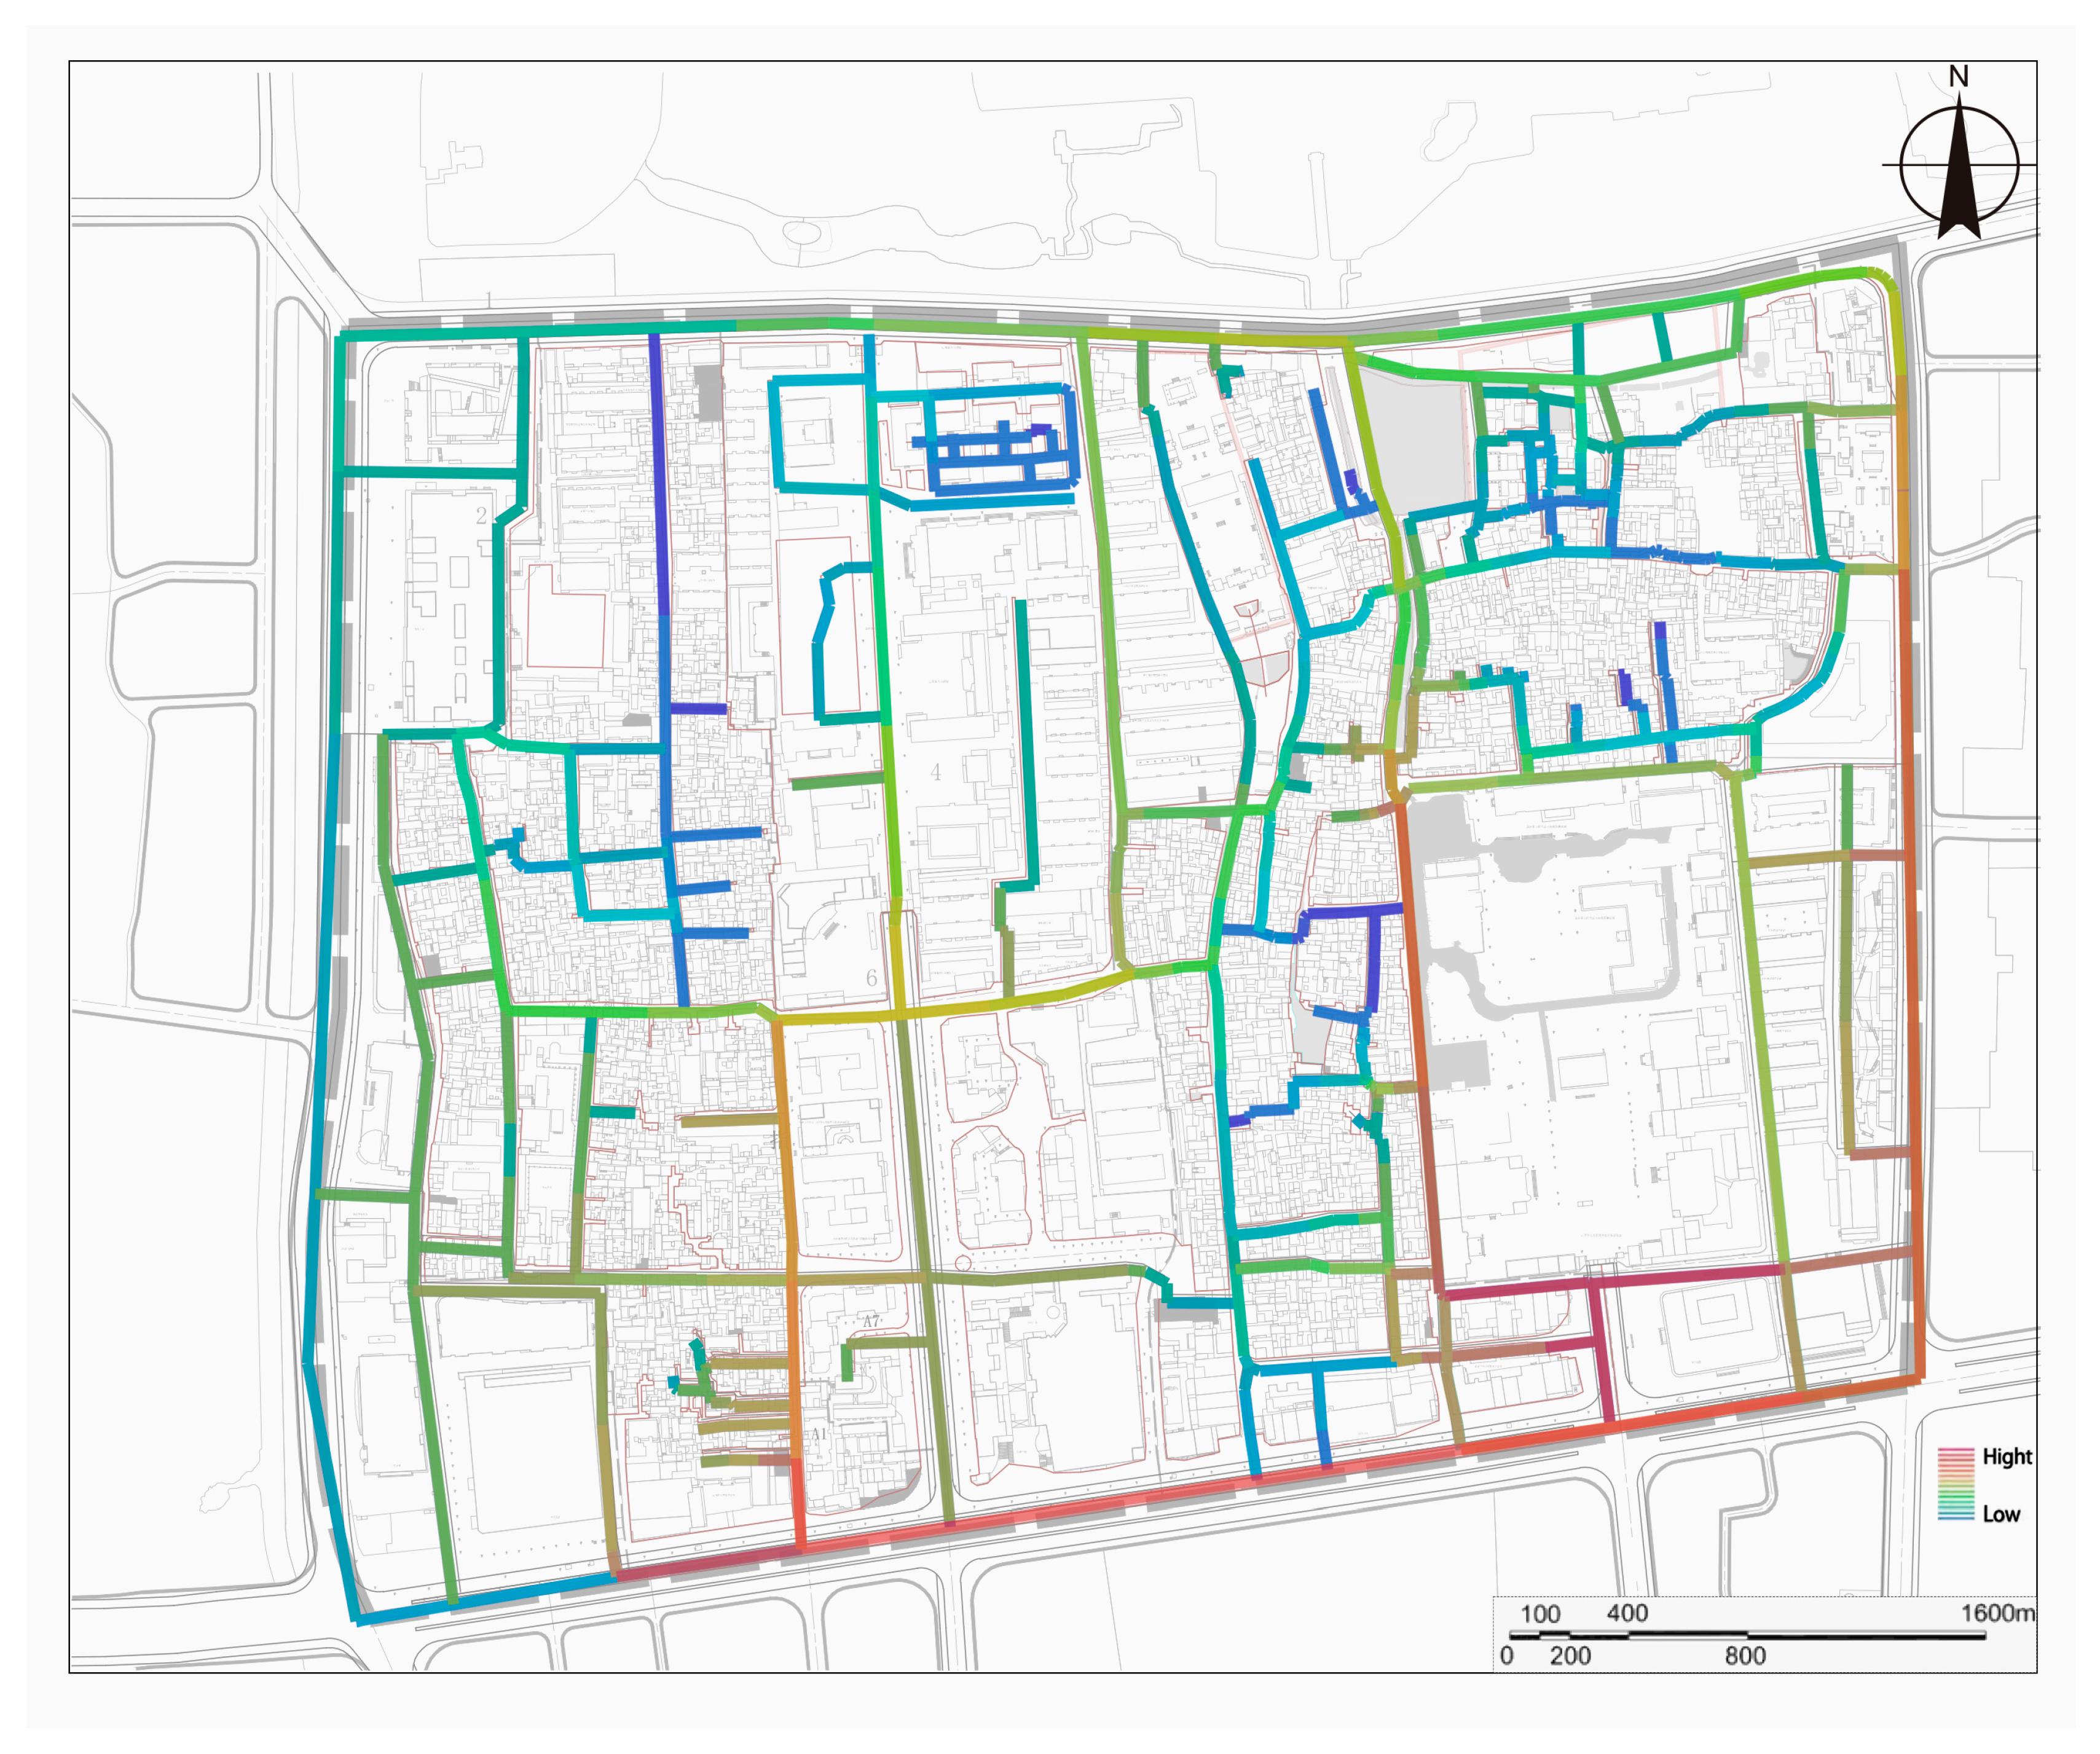
3.1. Street Potential Assessment and Screening Based on Space Syntax
- High-efficiency streets (In > 0.5631, Cn > 0.4482): High integration value and connectivity value, serving as the core streets with significant cultural tourism potential.
- Potential streets (In > 0.5631, Cn ≤ 0.4482): High connectivity value but low integration value. These streets could be transformed into culturally valuable corridors through targeted improvements.
- Isolated streets (In ≤ 0.5631, Cn ≤ 0.4482): Low integration value and connectivity value, largely disconnected from the main street network.
- Transitional streets (In ≤ 0.5631, Cn > 0.4482): Intermediate integration value and connectivity value, exhibiting moderate cultural tourism potential.
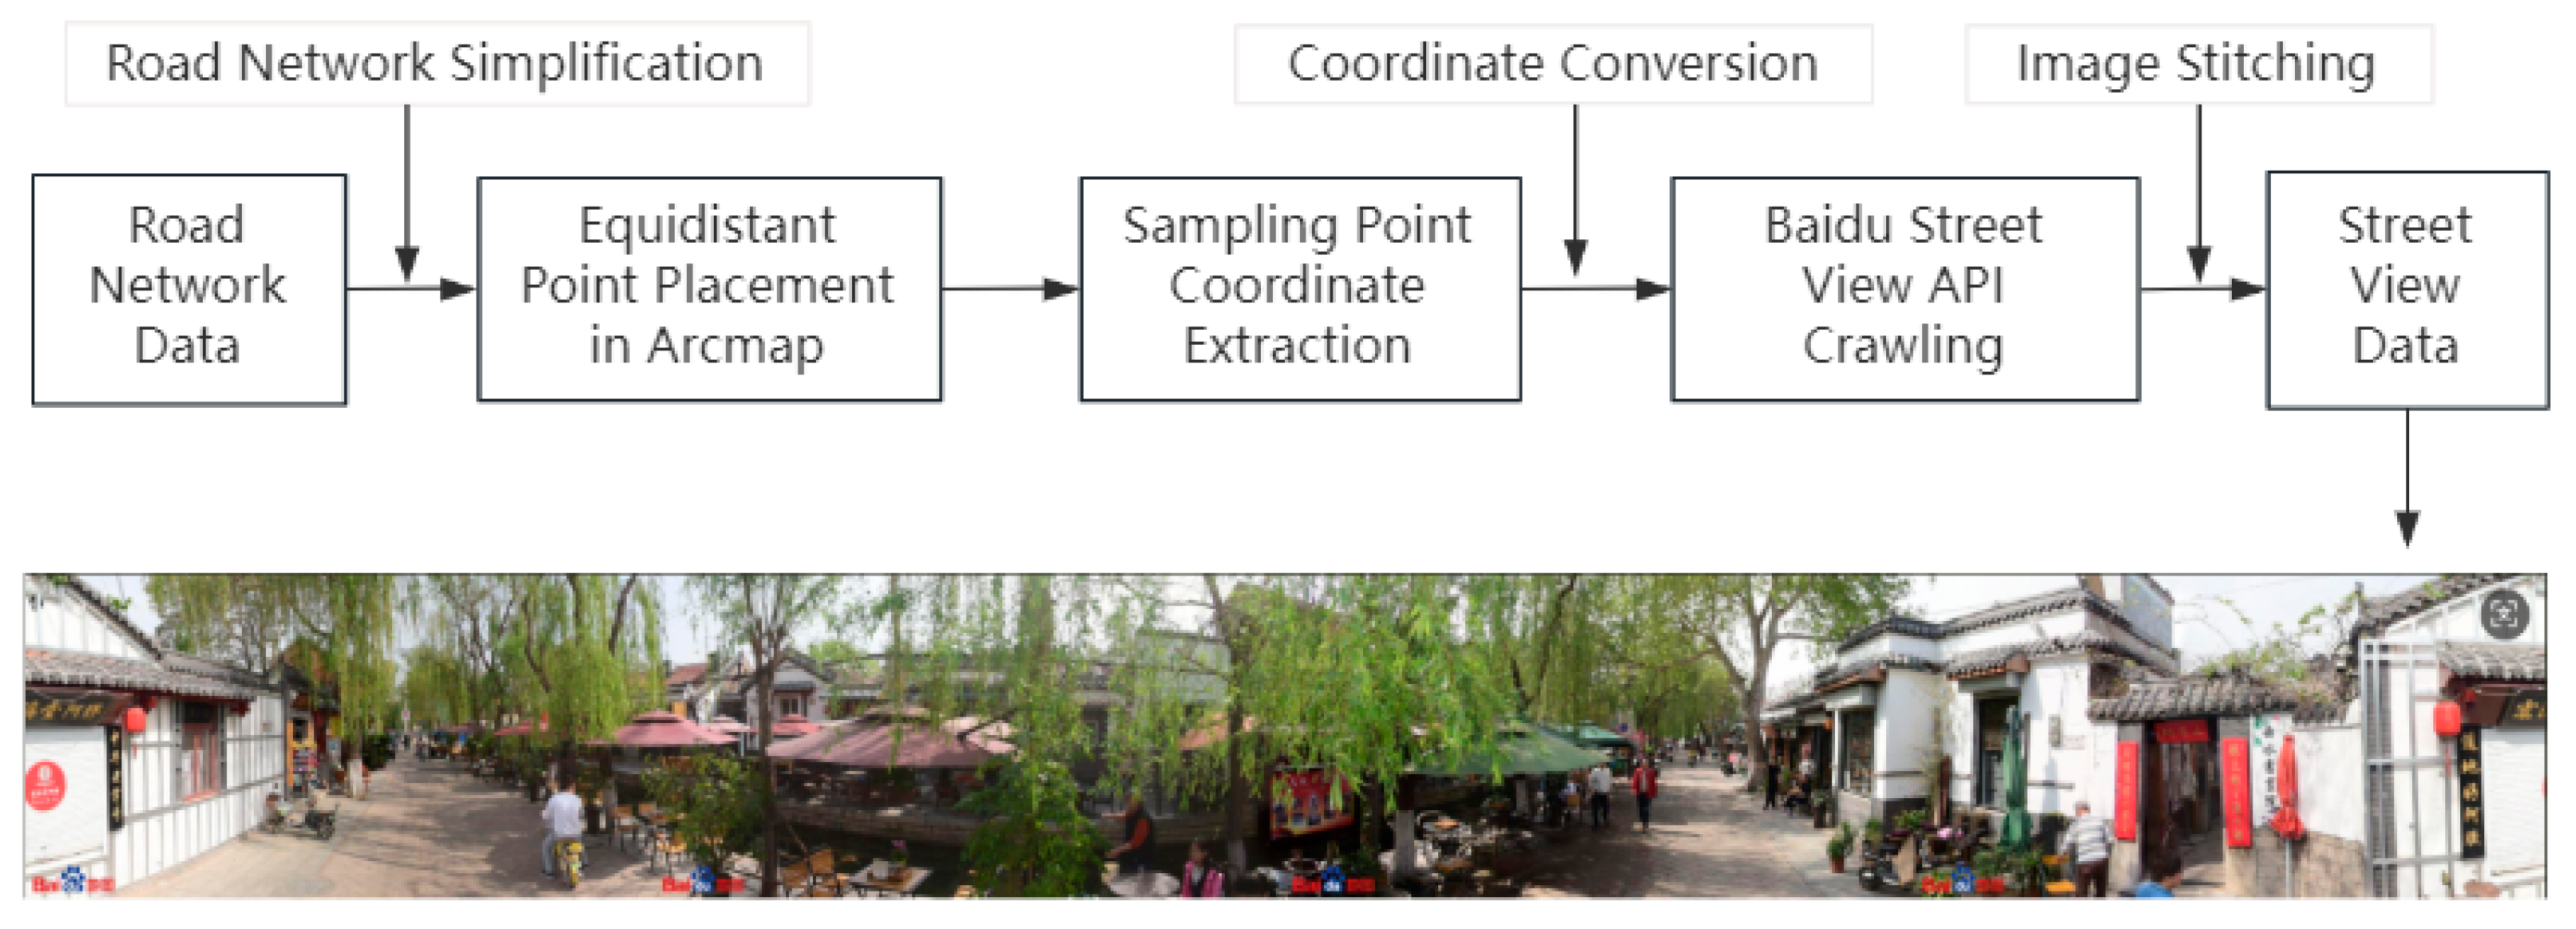
3.2. Street View Image Data Acquisition
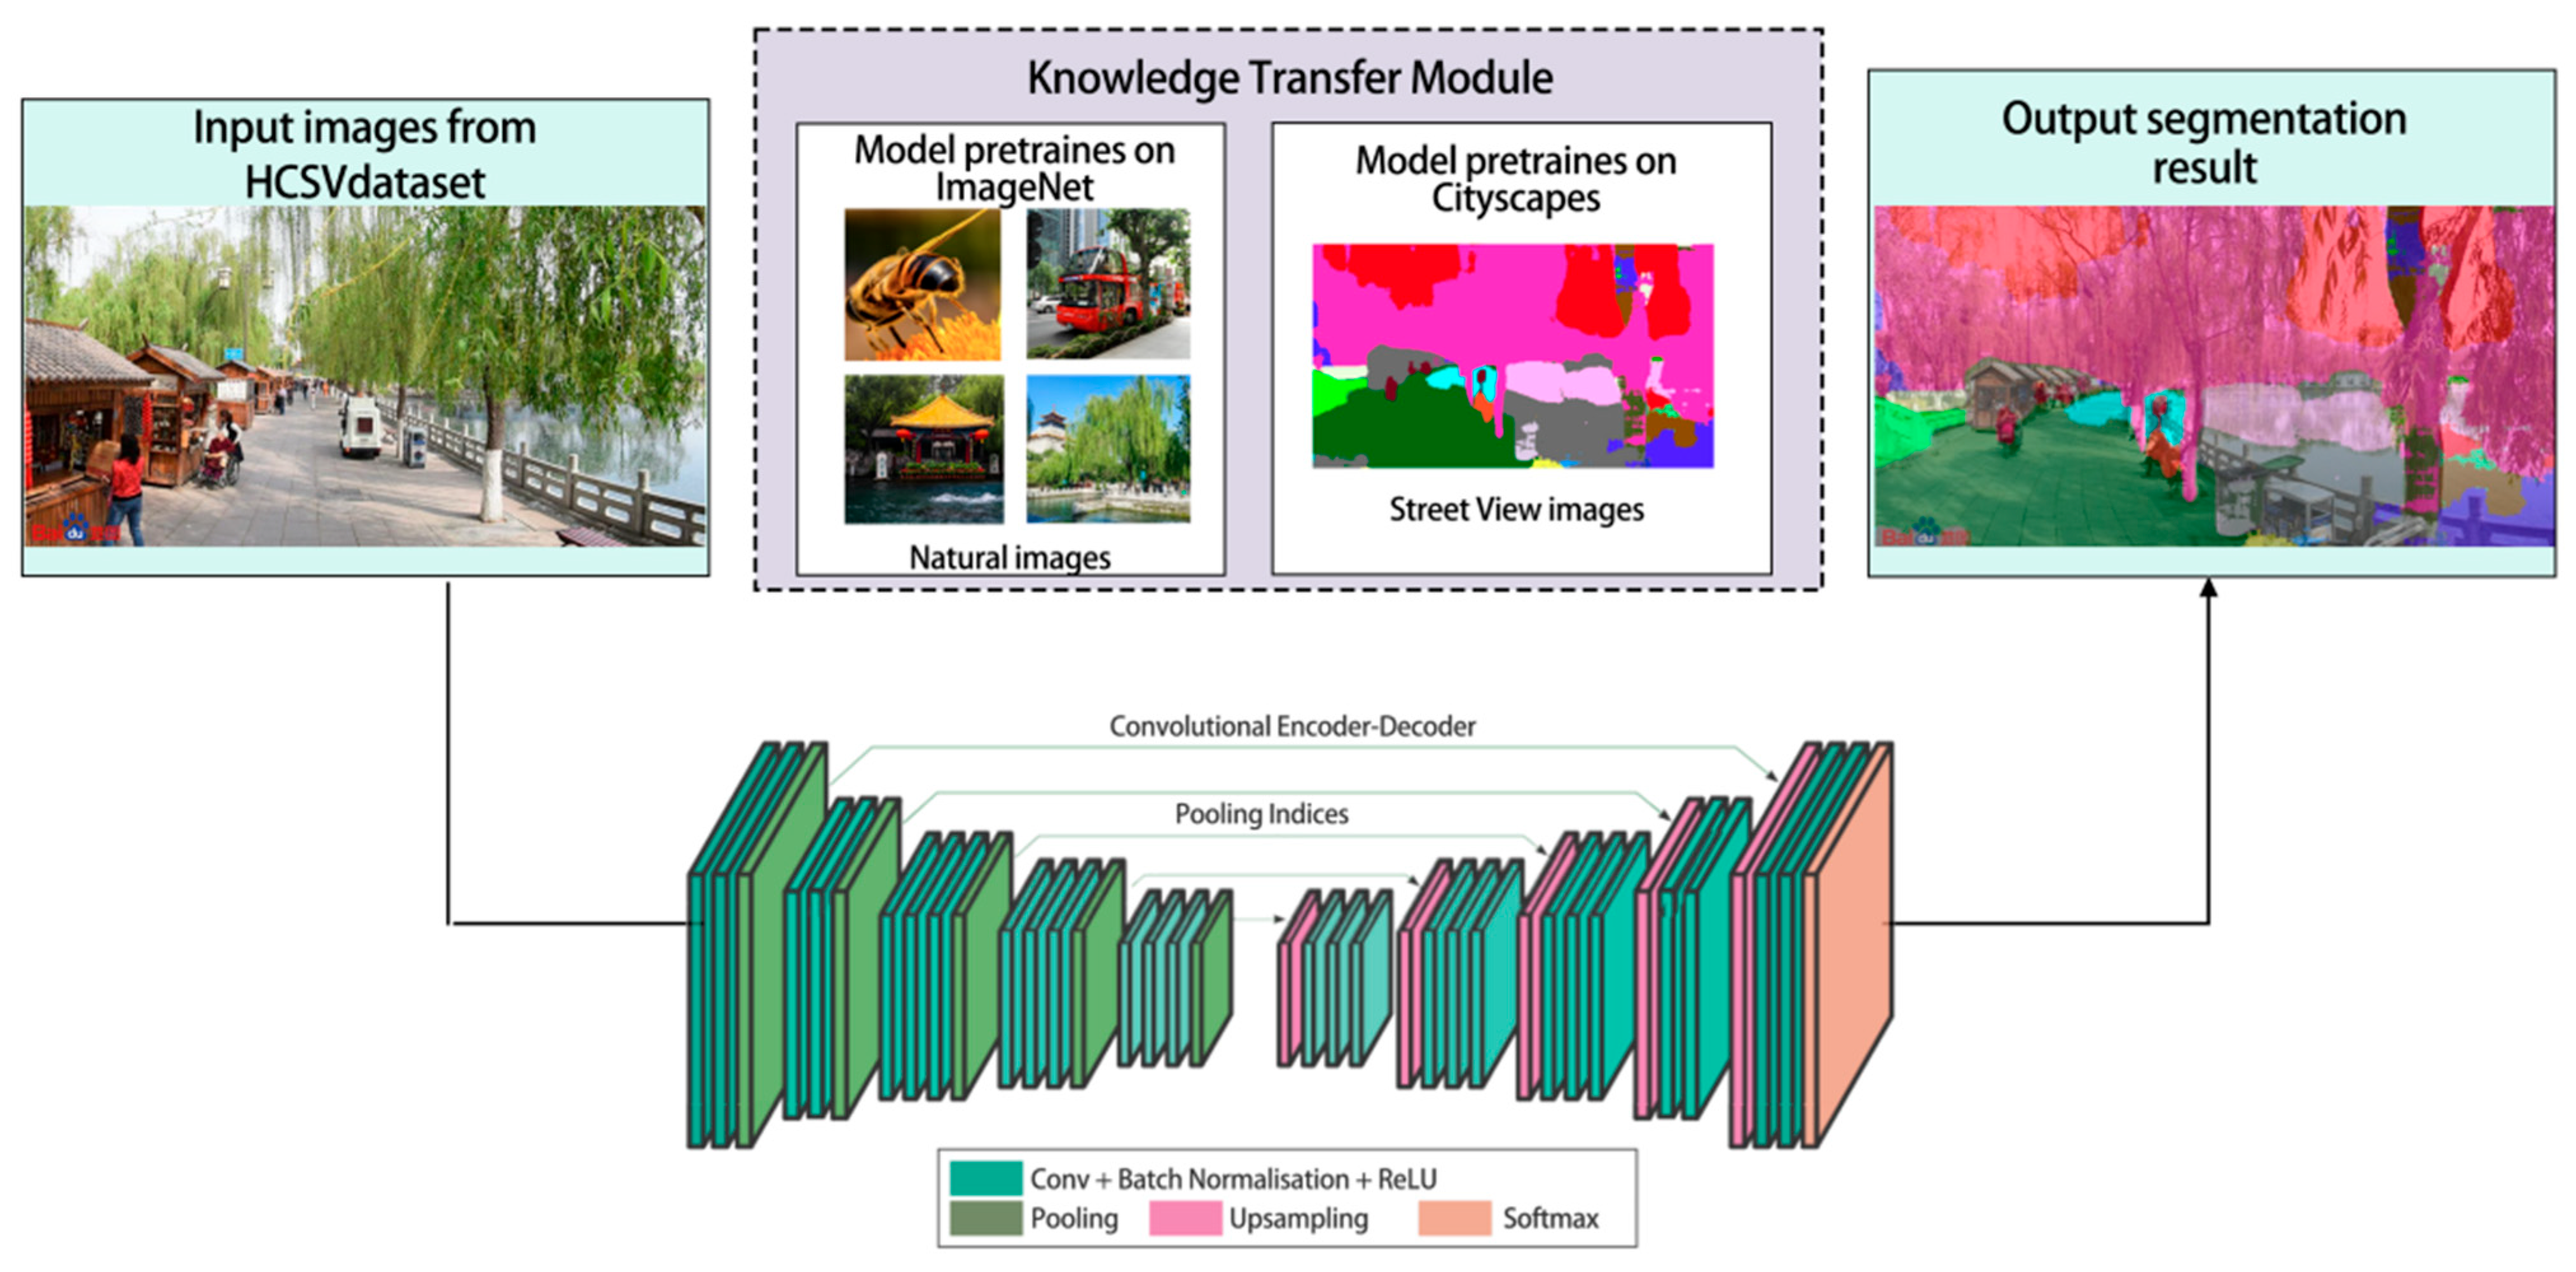
3.3. Public Perception Element Extraction
- Sentence segmentation and tokenization of preprocessed texts.
- Weighted scoring algorithm assigning sentiment scores for each review:Positive: +3 to +1Negative: −1 to −3Neutral: 0
4. Results
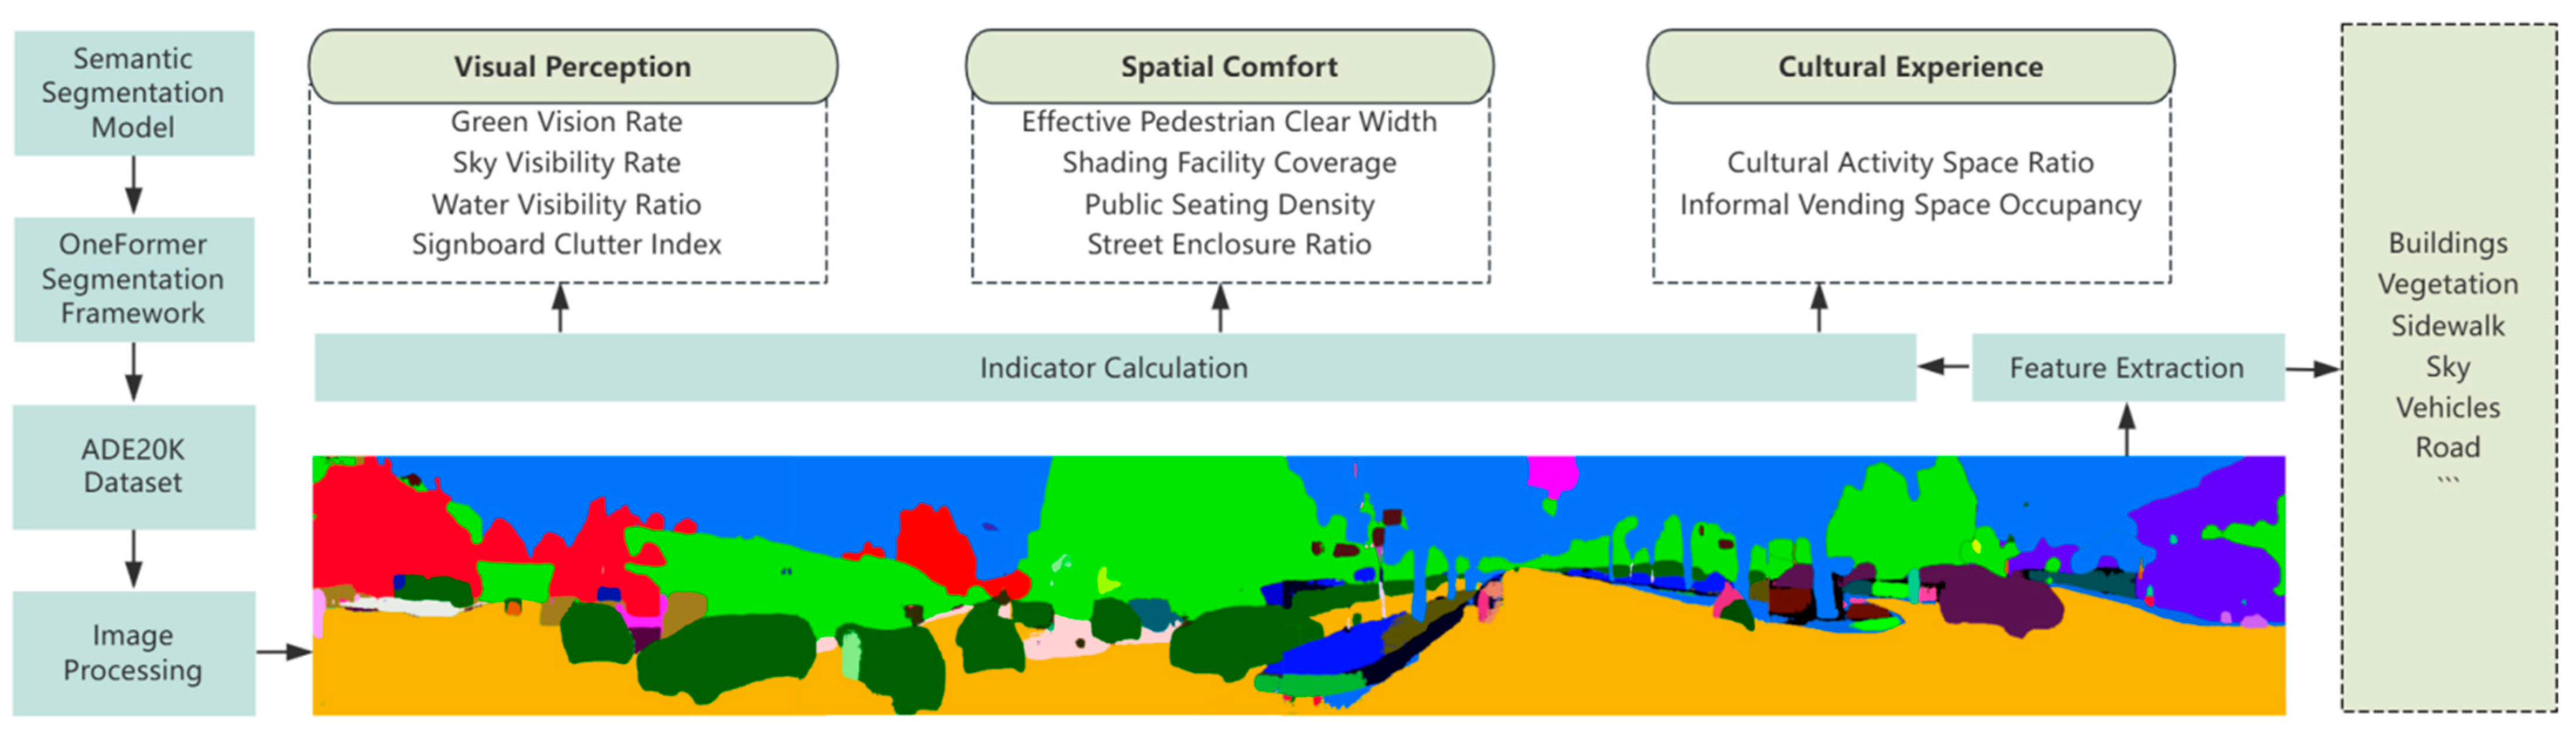
4.1. Development of a Three-Dimensional Indicator Framework
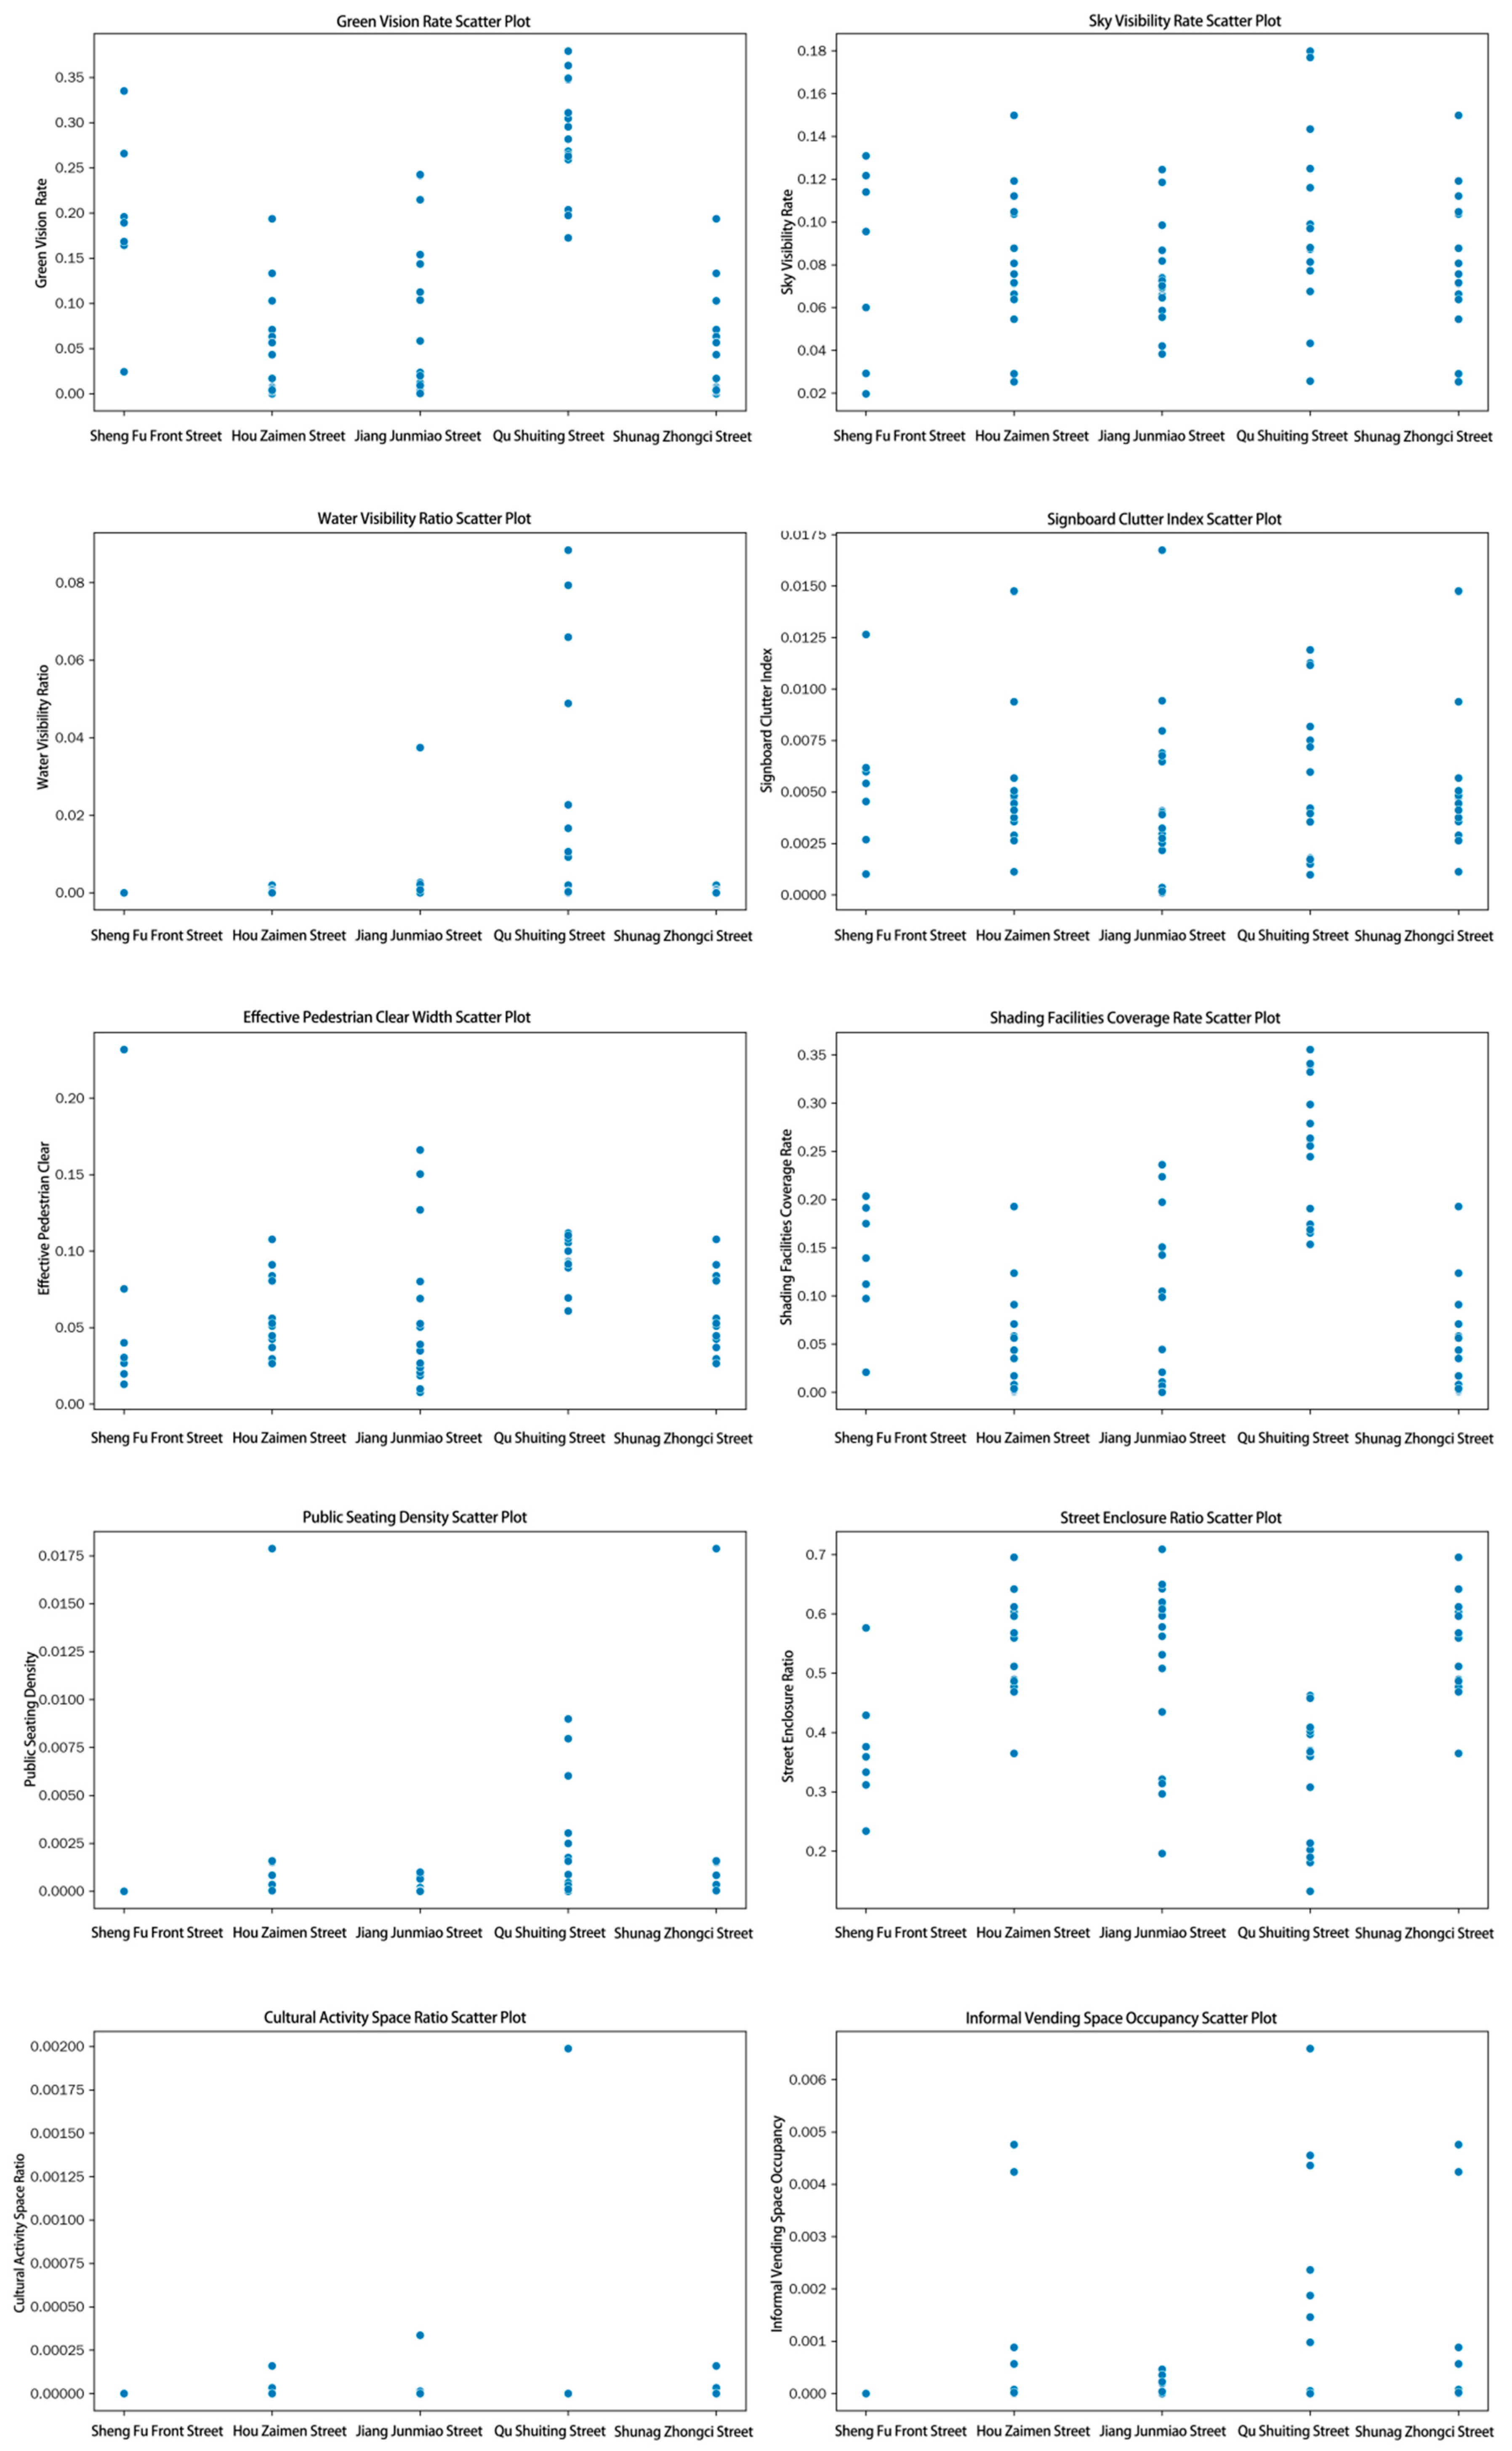
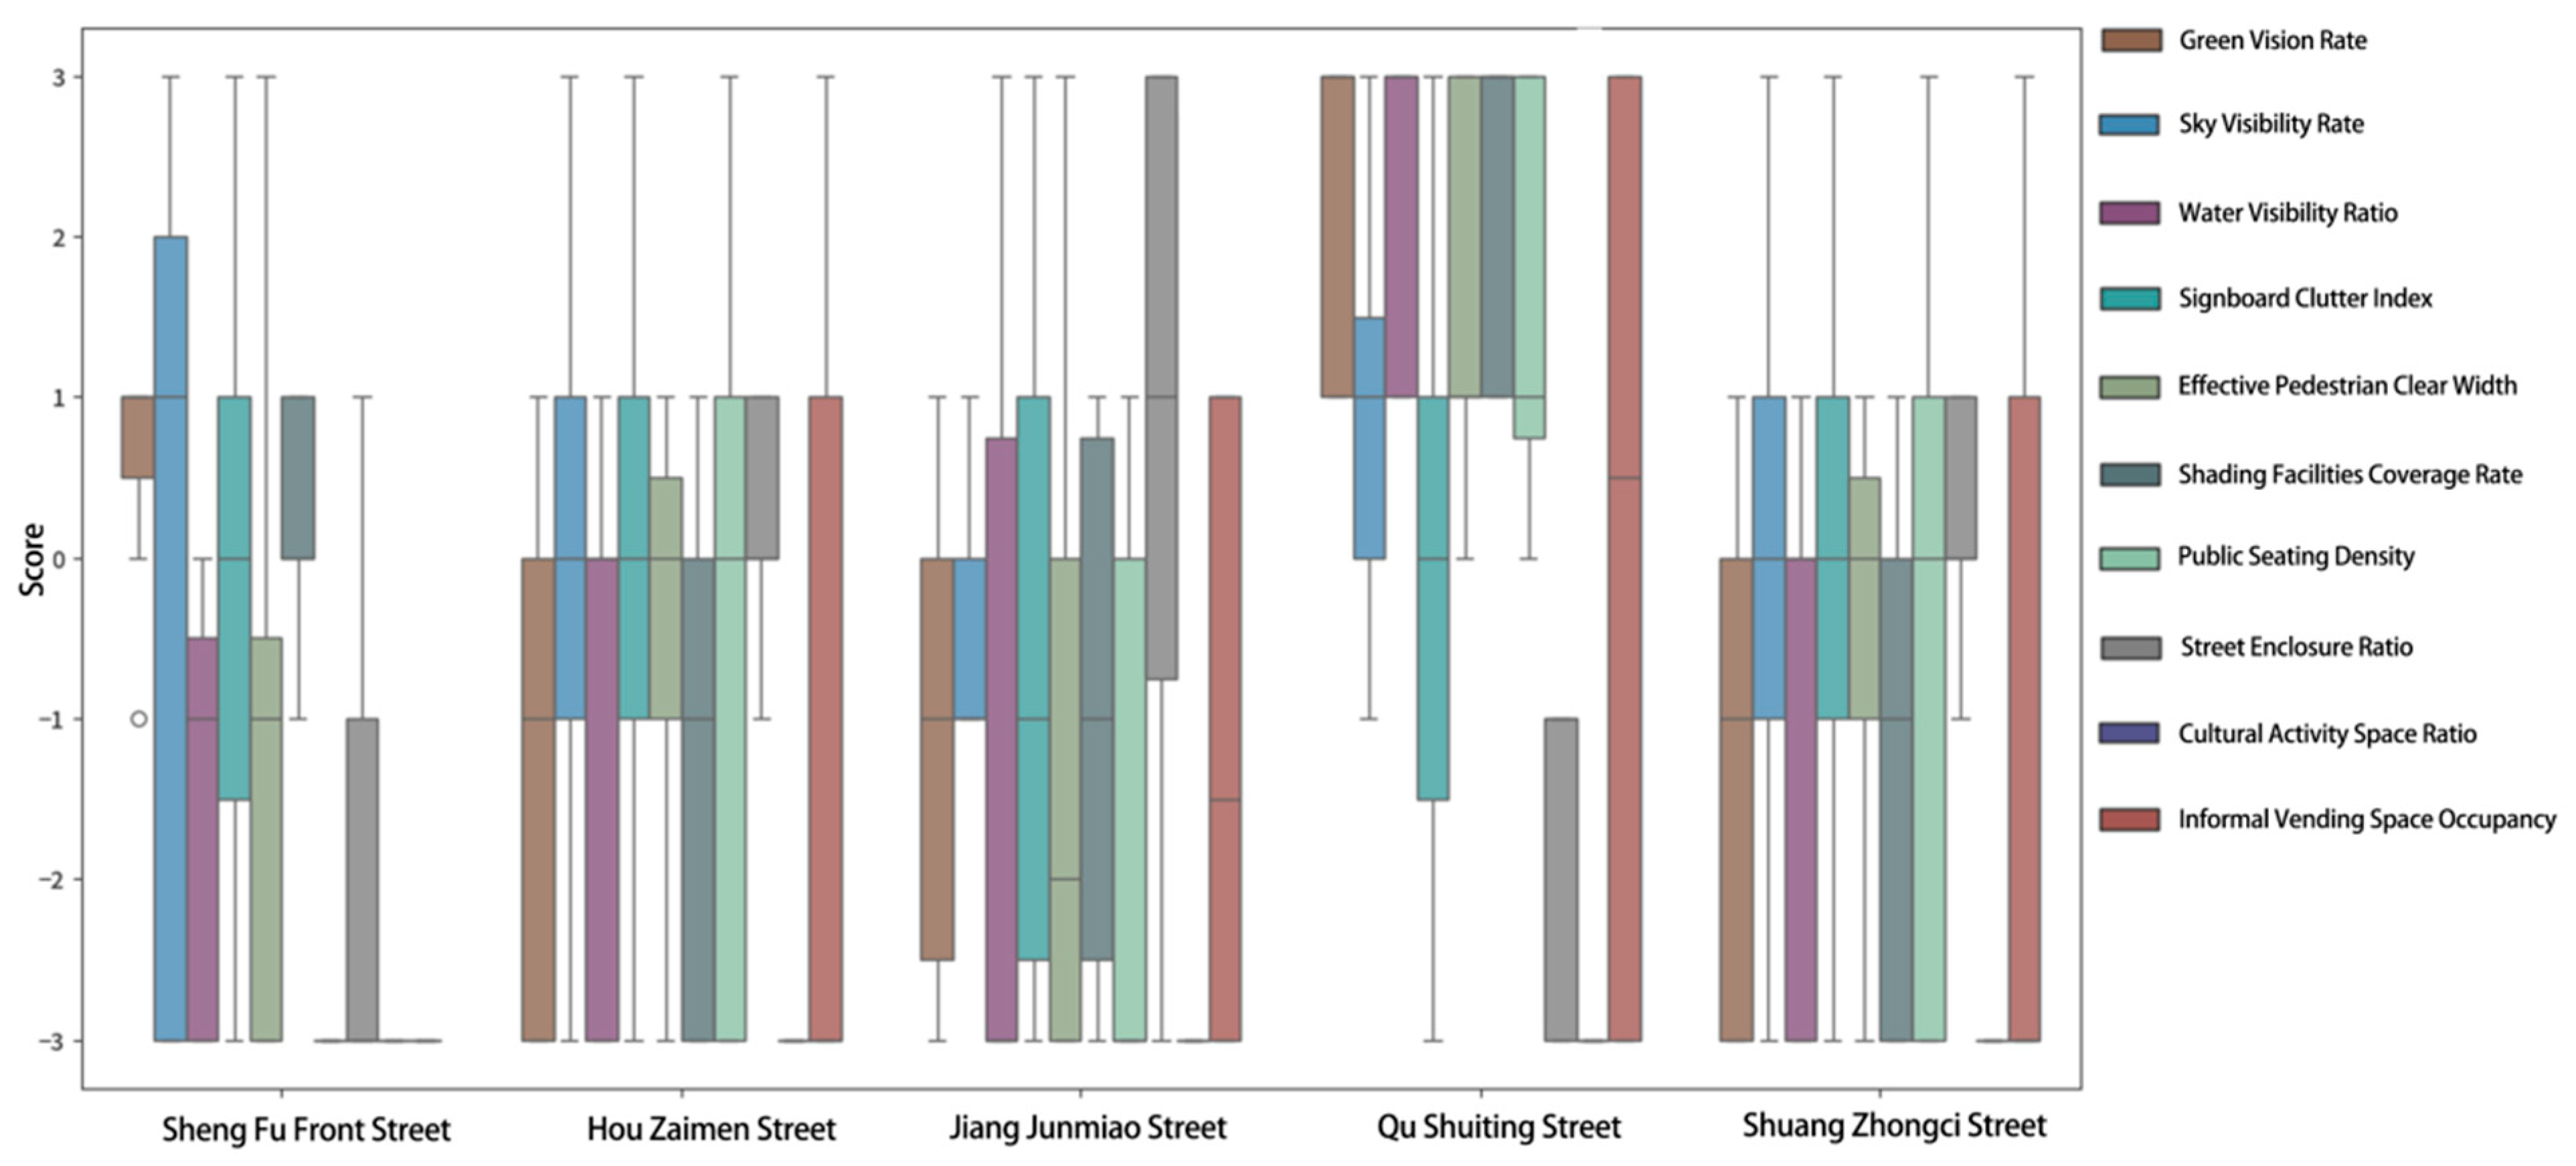
- The visual dimension builds upon Fang, Z.G.’s quantitative research on street aesthetic indicators [33], focusing on the visual attributes of the physical environment impacting tourist experience: green vision rate, sky visibility rate, and water visibility ratio. Additionally, the signboard clutter index was introduced to reflect conflicts between commercial interfaces and historic landscapes. Special terms such as “Spring Water,” “Lakeside,” “Pearl Spring,” and “Stream” in Factor 1 are rarely found in other scholars’ indicators because of the spring city characteristics of Jinan Mingfu City. Therefore, the water visibility ratio was added.
- The spatial comfort dimension is bench-marked against Han, J.W.’s “Street Comfort” model [34], quantifying the effective pedestrian clear width, shading facility coverage, and street enclosure ratio. Terms such as “stone bench” and “bench” in Factor 2 indicate tourists’ emphasis on resting spaces. Thus, the public seating density indicator was added to quantify resting convenience.
- The cultural dimension integrates Gu, W.Q.’s “Cultural Heritage Transmission Pathway” theory [32]. Combining cultural activity spaces such as “listen to crosstalk,” “folk performance,” “Lotus Festival,” and “market” identified in Factor 3, indicators for the cultural activity space ratio and informal vending space occupancy were established, translating “Intangible Cultural Heritage (ICH) Activation” into measurable street vitality indicators.

| Dimension | Indicator | Scholar | Conceptual Definition | Algorithmic Formulation |
|---|---|---|---|---|
| Visual Dimension | Green Vision Rate | Fang, Z.G. [33] Huang, J.X. [34] Zheng, Y. [31] Pei, Y. [71] | Pixel share of vegetation (trees, grass) in the field of view and identification of vegetation areas by semantic segmentation. | |
| Sky Visibility Rate | Fang, Z.G. [33] Yang, J.Y. [72] Han, J.W. [34] | Sky visible area share, reflecting the sense of spatial oppression, and semantic segmentation to extract sky pixels. | ||
| Water Visibility Ratio | Fang, Z.G. [33] Xiong, X [73] | The proportion of water bodies, such as springs and rivers, that are visible in the streetscape, and semantic segmentation to recognize water body pixels. | ||
| Signboard Clutter Index | Fang, Z.G. [33] He, Z.Y. [74] | Percentage of commercial advertisements with non-historical and cultural elements, semantic segmentation identifies billboard pixels, and calculates density. | ||
| Comfort Dimension | Effective Pedestrian Clear Width | Han, J.W. [34] Zhang, Y.C. [75] | Percentage of passable width after subtracting obstacles, semantic segmentation identifies occupying facilities (electrical boxes, stalls), and calculates the available space. | |
| Shading Facility Coverage | Han, J.W. [74] Feng, X.X. [76] | Percentage of shaded areas, such as pergola, shade, etc., and semantic segmentation to identify shaded areas (shadows + amenities). | ||
| Public Seating Density | Han, J.W. [34] Fang, H.Y. [77] | Percentage of street seats, etc., semantic segmentation identifies seats and counts them. | Public Seating Density = | |
| Street Enclosure Ratio | Han, J.W. [34] Fang, Z.G. [33] | Evaluate the degree of interface enclosure and street openness, composed of elements such as walls, buildings, and pavements, affecting the privacy and openness of the space. | ||
| Cultural Dimension | Cultural Activity Space Ratio | Gu, W.Q. [32] Jiang, L. [78] | Proportion of public space available for cultural activities (plazas, stages, bazaars) to the total area of the neighborhood, and semantic segmentation to identify activity spaces. | Cultural Activity Space Ratio = |
| Informal Vending Space Occupancy | Gu, W.Q. [32] Fang, Z.G. [33] | Proportion of pavement area occupied by temporary stalls (snacks, handicrafts) in the street, semantic segmentation to identify stall areas. | Informal Vending Space Occupancy = |
4.2. Machine Scoring and Human Scoring
- Methodological Protocol:
- Scoring Process:
| Dimension | Expert Group | Visitor Group | Differentiation Characteristics |
|---|---|---|---|
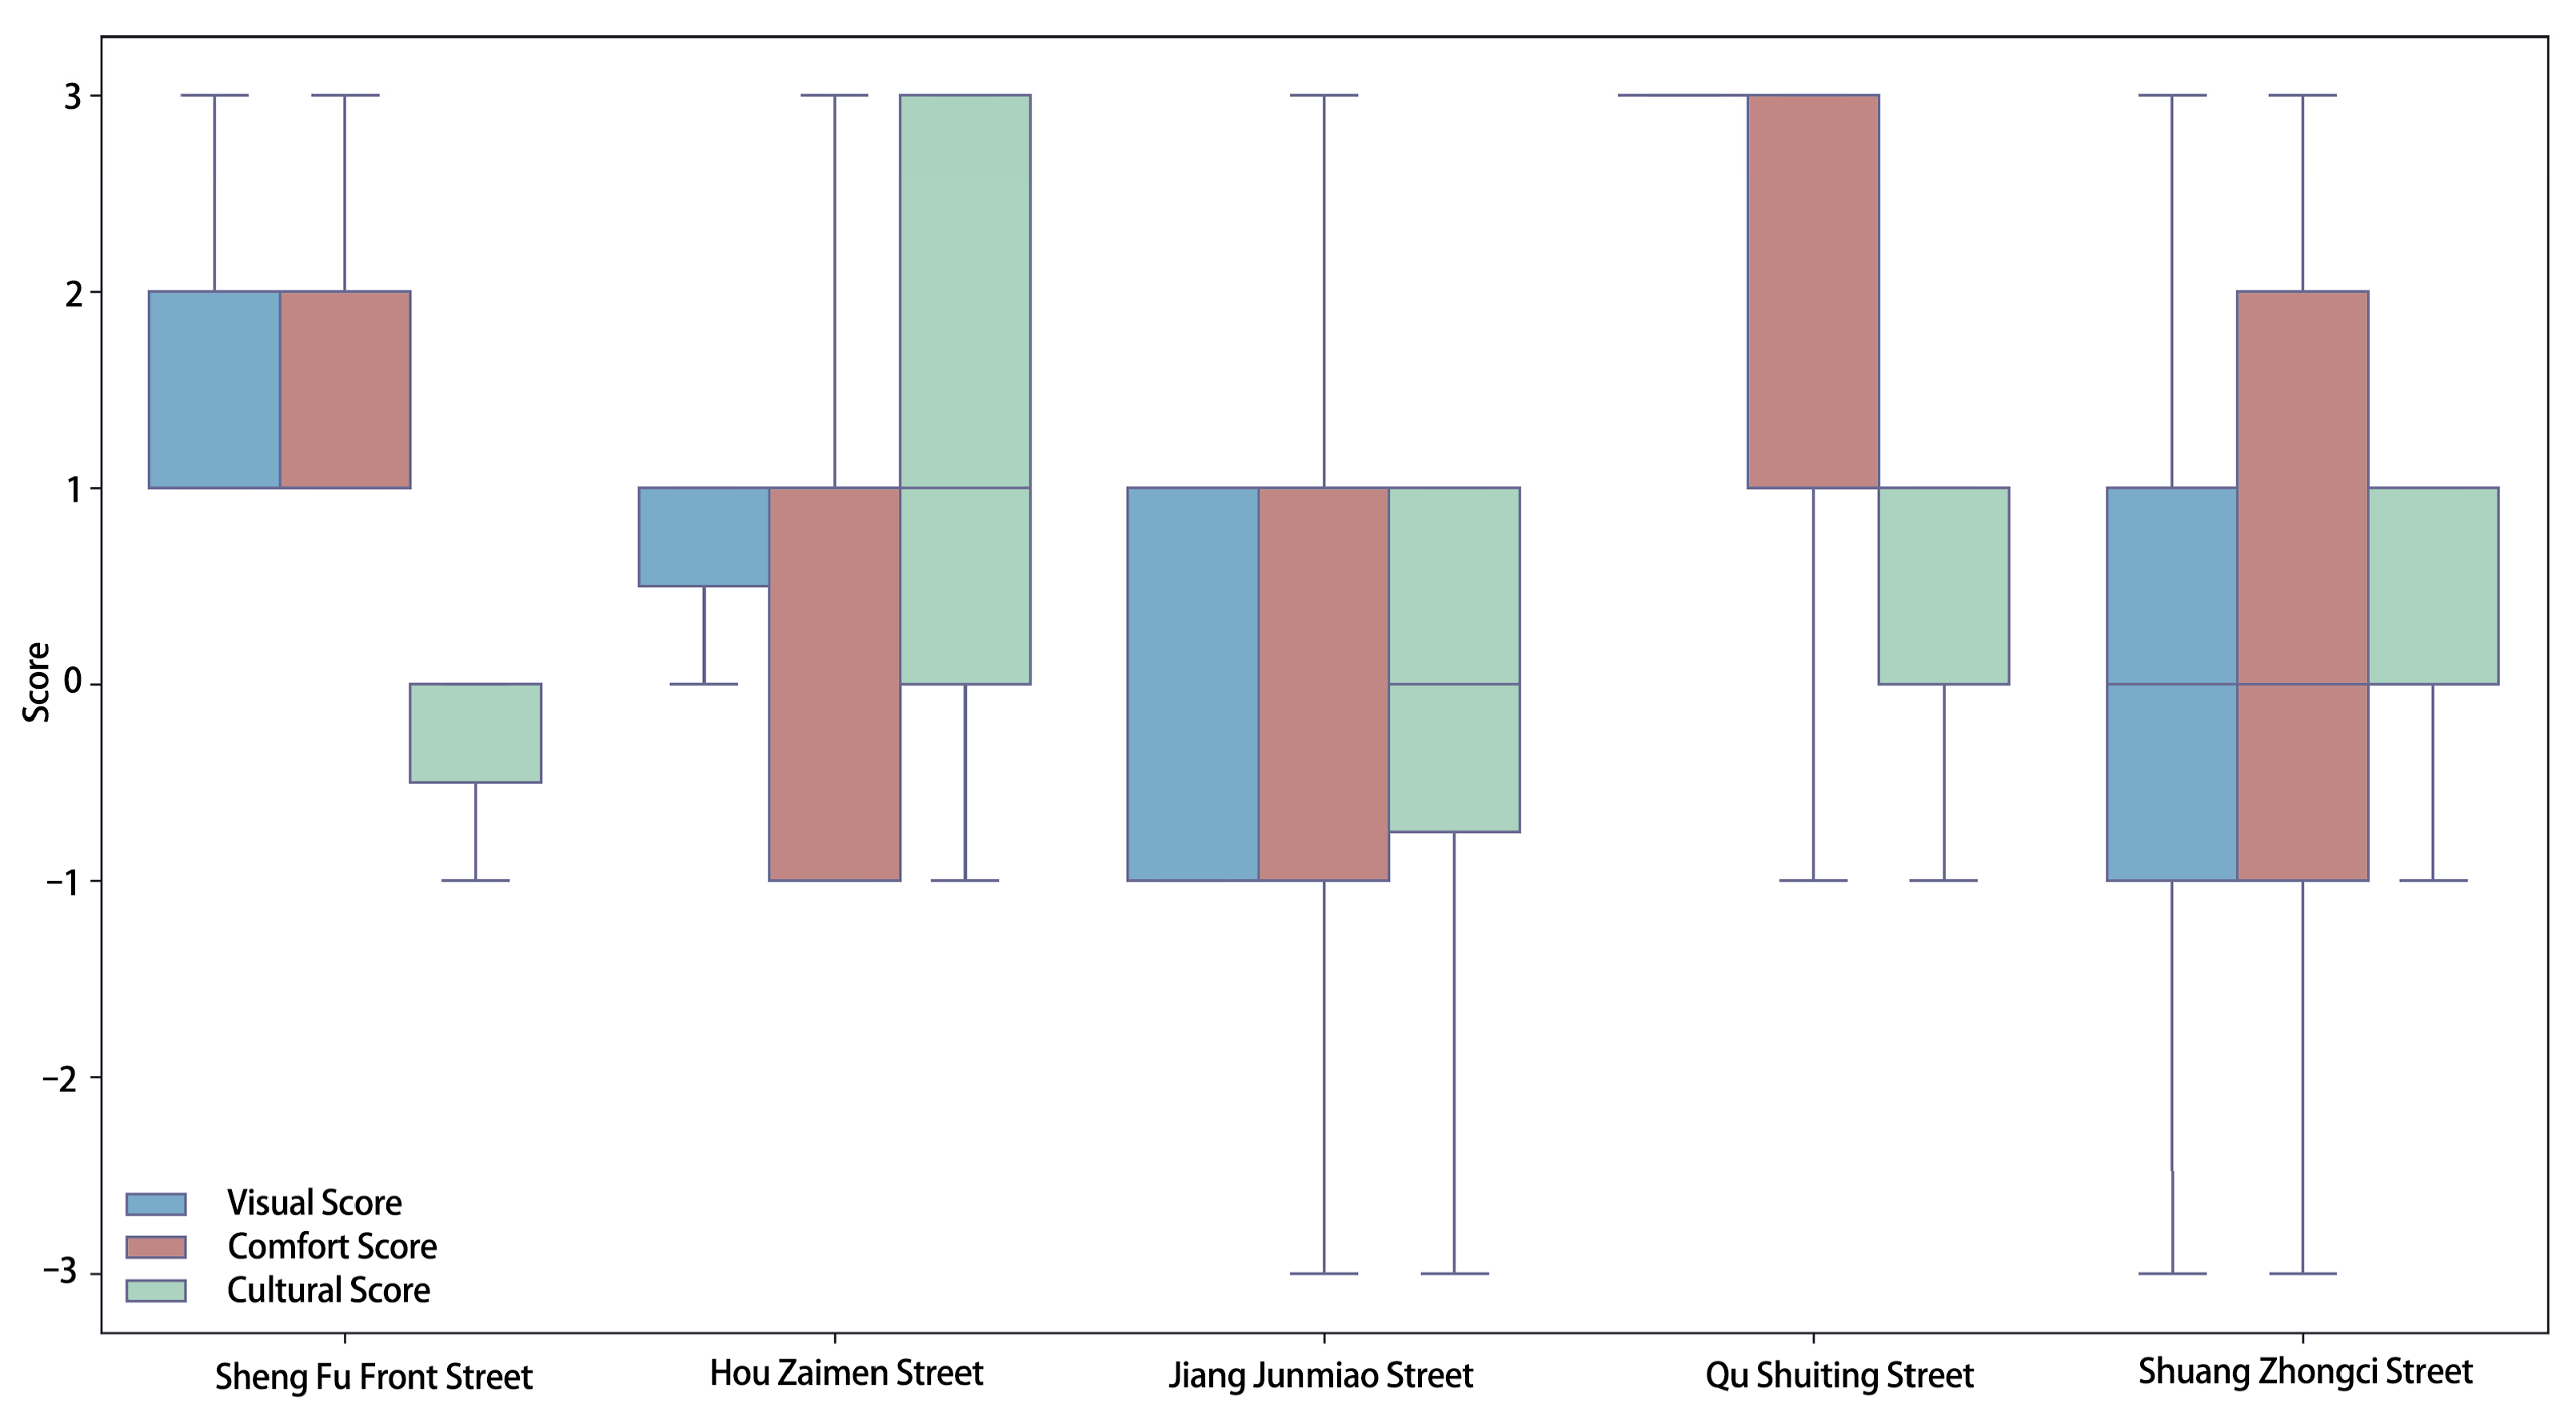
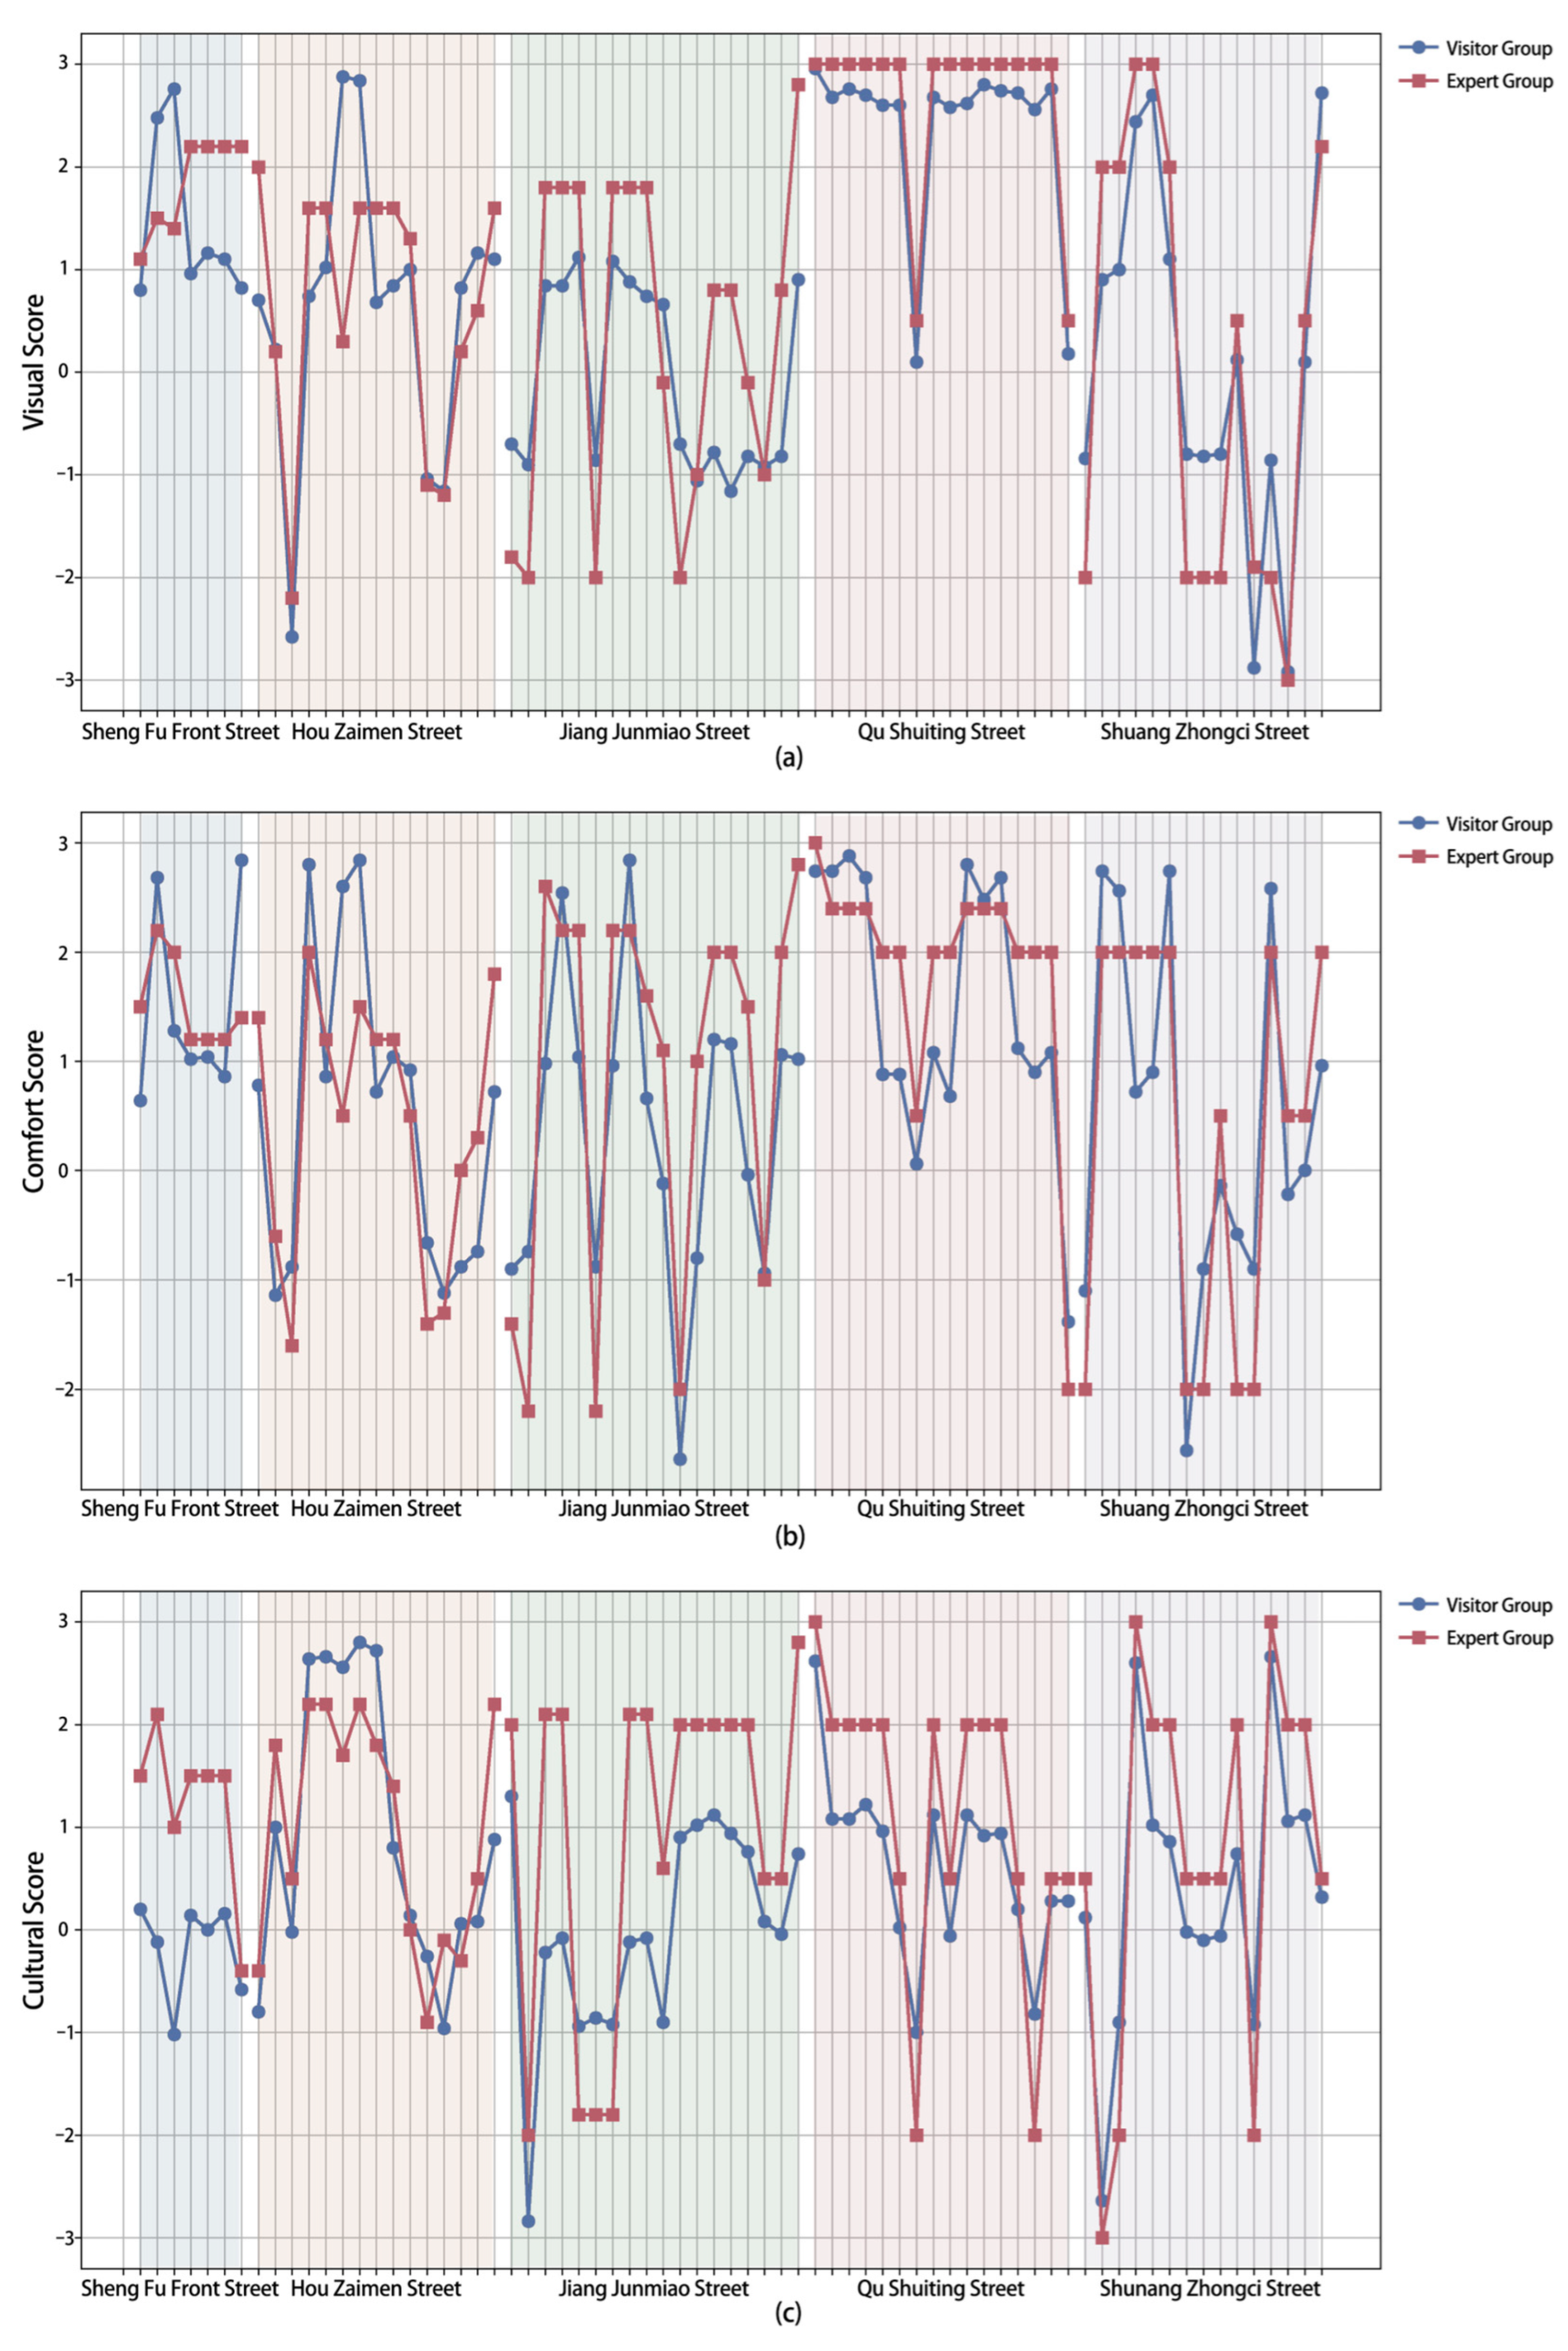
| Visual Dimension | 1.28 | 1.18 | Expert scores are slightly higher (+8.5%) |
| Comfort Dimension | 1.12 | 0.86 | Expert scores are significantly higher (+30%) |
| Cultural Dimension | 1.05 | 0.64 | Expert scores are substantially higher (+64%) |
4.3. Analysis of Indicator Weighting Adjustment and Data Calibration Based on Human–Machine Scoring Correlations
- Visual perception dimension: The green vision rate and shading facility coverage demonstrated strong positive correlations with visual perception scores, with correlation coefficients of 0.656 and 0.671. This indicates that vegetation coverage and shading infrastructure critically enhance visual experiences in urban streets and parks. Conversely, the street enclosure ratio exhibited a strong negative correlation (−0.604), suggesting excessive enclosure induces visual oppressiveness and necessitates calibrated enclosure control in urban design. Indicators such as the signboard clutter index, cultural activity space ratio, and informal vending space occupancy showed negligible correlations (|r| < 0.1), indicating minimal impact on visual evaluation.
- Spatial comfort dimension: The green vision rate and shading facility coverage maintained moderate positive correlations with comfort scores, with correlation coefficients of 0.442 and 0.485. The street enclosure ratio has a negative correlation (−0.469) with comfort evaluation scores, meaning that high enclosure is unfavorable for people to obtain a comfortable experience. Indicators such as the water visibility ratio and signboard clutter index exhibited weak associations (|r| < 0.2), implying limited influence on comfort.
- Cultural experience dimension: Most machine-evaluated indicators displayed statistically insignificant correlations with cultural scores.
5. Discussion
5.1. Visual Landscape Optimization Strategies
5.2. Facility Layout Adjustment Strategies
5.3. Cultural Scenario Implementation Strategies
- Water narrative axis: Taking the Qushui River as the vein, it is proposed to plan a full-process experiential chain of “water drawing-tea tasting-lantern releasing” to recreate the classical literati ambiance of Qushui Liushang. Tourists engage in spring water tea brewing rituals, embodying millennia of spring culture. Then, at nightfall, they can participate in lantern-floating ceremonies, comprehending the poetic charm of Jinan amid sparkling ripples.
- Alley memory wall: Building upon the historical depth of Jiang Junmiao Street and referencing the implemented example of Fuzhou’s Three Lanes and Seven Alleys (Sanfang Qixiang) Historical and Cultural District AR Metaverse Experience [83,84] (which has achieved digital restoration and display of the Ming-Qing era alley layout), the plan is to use AR (augmented reality) technology to dynamically project scenes of late Qing dynasty market life onto the mottled walls. Tourists can trigger a time-traveling interactive experience by touching the walls, thus making historical scenes “come alive” in the present.
- Courtyard revitalization: Consider transforming the Jinju Lane into communal hubs for intangible cultural heritage, creating open-access ICH transmission spaces. Regular activities such as cloisonné craftsmanship experiences and Shandong cuisine culinary classes are held, allowing tourists to appreciate the charm of intangible cultural heritage through hands-on practice and promoting the intergenerational inheritance of traditional culture.
6. Conclusions
Author Contributions
Funding
Data Availability Statement
Conflicts of Interest
Abbreviations
| HVD | Heritage Visibility Density |
| CPI | Composite Potential Index |
| NLP | Natural Language Processing |
References
- Guo, W.; Wang, Y.Y.; Hao, R.N. Tourism Experience Quality of Cultural Elements in Revolutionary Heritage Tourism Sites: An Analysis Based on Online Textual Data. Econ. Forum. 2024, 38, 69–84. [Google Scholar]
- Afshardoost, M.; Eshaghi, M.S. Destination image and tourist behavioural intentions: A meta-analysis. Tour. Manag. 2020, 81, 104154. [Google Scholar] [CrossRef]
- Yan, Y.; Li, B. Identification, Evolution and Asymmetric Influence of Tourists’ Perceived Imagery in Ice and Snow Tourism Cities from the Perspective of Integration of Culture, Sports and Tourism. J. Jilin Sport Univ. 2025, 41, 9–20. [Google Scholar]
- The 14th Five-Year Plan for Cultural and Tourism Development. Available online: https://lyj.nanyang.gov.cn/2022/04-01/175324.html (accessed on 16 April 2025).
- Shandong Provincial Bureau of Statistics. Available online: http://tjj.shandong.gov.cn/col/col6279/index.html (accessed on 16 April 2025).
- Analyzing Tourism Development in Jinan through Ctrip Big Data. Available online: https://baijiahao.baidu.com/s?id=1816565876875339932 (accessed on 20 April 2025).
- Jinan Cultural Tourism Review: This May Day Holiday, Jinan Is Turning Heads! Available online: https://mp.weixin.qq.com/s/1r1GJySGn7cv1B2nQ1OIZg (accessed on 20 April 2025).
- Huang, W.; Zhou, L.; Zhu, Z.M. Analysis of Audience Satisfaction with On-site Cultural Performances at Tourist Destinations: A Case Study of “Tianmen Fox Fairy” in Zhangjiajie. J. Jishou Univ. Soc. Sci. 2014, 35, 115–122. [Google Scholar] [CrossRef]
- Lv, Z. Practice and Prospect of Expanding Social Participation in Cultural Heritage Conservation. Study Nat. Cult. Herit. 2025, 10, 1–3. [Google Scholar]
- Zhao, X.M. Cultural Rights in Complex Urban Heritage: Concept and Practice. Rev. Space Soc. 2024, 3, 113–123. [Google Scholar]
- Wu, W.Z.; Zhuang, Z.M. Design and Innovation of Tourism Products in the Era of the Experience Economy: A Case Study on the Experiential Development of Tourism Products in Ancient Villages. Tour. Trib. 2003, 18, 66–70. [Google Scholar]
- Chen, X.; Liu, X.R.; Ren, X.L. Research on Guest Experience Perception of Lingnan Rural Homestays Based on Online Review Texts. Public Commun. Sci. Technol. 2024, 16, 20–24. [Google Scholar] [CrossRef]
- Urry, J. The Tourist Gaze: Leisure and Travel in Contemporary Societies; Sage: London, UK, 1990. [Google Scholar]
- Ai, J.L.; Deng, Q.F. Traveling Experience Quality Appraisal Target System and the Assessment Method Grind. J. Hunan City Univ. 2008, 29, 51–54. [Google Scholar]
- Ma, T. Tourist Experience Quality and Satisfaction: Connotation, Relationship and Measurement. Tour. Trib. 2019, 34, 29–40. [Google Scholar]
- Stankov, U.; Gretzel, U. Tourism 4.0 technologies and tourist experiences: A human-centered design perspective. Inf. Technol. Tour. 2020, 22, 477–488. [Google Scholar] [CrossRef]
- Manning, C.D.; Raghavan, P.; Schütze, H. Introduction to Information Retrieval, 1st ed.; Cambridge University Press: Cambridge, UK, 2008; pp. 225–267. [Google Scholar]
- Hearst, M.A. Search User Interfaces; Cambridge University Press: Cambridge, UK, 2009; pp. 147–153. [Google Scholar]
- Riloff, E.; Shepherd, J. A Corpus-based Approach for Building Semantic Lexicons. Computation and Language. arXiv 1997. [Google Scholar] [CrossRef]
- Hatzivassiloglou, V.; McKeown, K. Predicting the semantic orientation of adjectives. In Proceedings of the 35th Annual Meeting of the Association for Computational Linguistics and Eighth Conference of the European Chapter of the Association for Computational Linguistics, Madrid, Spain, 7–12 July 1997; pp. 174–181. [Google Scholar] [CrossRef]
- Alonso, M.A.; Vilares, D.; Gómez-Rodríguez, C.; Vilares, J. Sentiment Analysis for Fake News Detection. Electronics 2021, 10, 1348. [Google Scholar] [CrossRef]
- Li, D.N.; Liang, J. Text Mining of the “Shanghai Waste Sorting” Discourse on Sina Weibo: A Public Opinion Analysis Based on Python’s SnowNLP. Southeast Commun. 2019, 93–95. [Google Scholar] [CrossRef]
- Peng, M.; Xi, J.J.; Dai, X.Y.; He, Y.X. Collaborative Filtering Recommendation Based onSentiment Analysis and LDA Topie Model. J. Chin. Inf. Process. 2017, 31, 194–203. [Google Scholar]
- Karimi, K. The Configurational Structures of Social Spaces: Space Syntax and Urban Morphology in the Context of Analytical, Evidence-Based Design. Land 2023, 12, 2084. [Google Scholar] [CrossRef]
- Maniei, H.; Askarizad, R.; Pourzakarya, M.; Gruehn, D. The Influence of Urban Design Performance on Walkability in Cultural Heritage Sites of Isfahan, Iran. Land 2024, 13, 1523. [Google Scholar] [CrossRef]
- Ye, Y.; Zhang, L.Z.; Dou, W.T.; Zeng, W. Measuning Street Greening Quality from Humanistic Perspective: A Large-scaleAnalysis Based on Baidu Street View lmages and Machine Learning Algorithms. Landsc. Archit. 2018, 25, 24–29. [Google Scholar] [CrossRef]
- Wang, Z.Y.; Zhuang, W.M. Research on Block Renewal Post Occupancy Evaluation Methods Based on Image DeepLearning: A Case Study of Shichahai in Beijing. New Archit. 2022, 3, 5–8. [Google Scholar]
- Wang, J. Street Space Quality Evaluation from the Perspective of Urban Function. Master’s Thesis, Shandong Normal University, Jinan, China, 2021. [Google Scholar]
- Huang, J.X.; Liang, J.Q.; Yang, M.S.; Li, Y. Street Space Visual Quality Evaluation Method of Tourism Sites Based on Street View Images. J. Geo-Inf. Sci. 2024, 26, 352–366. [Google Scholar]
- Dai, Z.M.; Hua, C. The Improvement of Street Space Quality Measurement Method Based on Streetscape. Planners 2019, 35, 57–63. [Google Scholar]
- Zheng, Y.; Yang, J.Y. Research on Elaborate Urban Repair Planning Approach Based on AI Analysis of Large-scale Street-view Big Data. Chin. Landsc. Archit. 2020, 36, 73–77. [Google Scholar]
- Gu, W.Q. Study on Evaluation and Optimization Strategy of Street Spatial Quality in Sanyuan County. Master’s Thesis, Xi’an University of Architecture and Technology, Xi’an, China, 2024. [Google Scholar]
- Fang, Z.G.; Liu, C.; Xiao, Y.; Jin, C.H.; Zhuang, X.J. Evaluation of Street Aesthetics and Influencing Factors Using Multi-source Deep Learning Methods: The Case Study of Shanghai. Urban Plan. Int. 2023, 38, 48–58. [Google Scholar]
- Han, J.W.; Dong, L. A Study of Visual Evaluation of Streetscape Based on the Psychophysical Method. Chin. Landsc. Archit. 2015, 31, 116–119. [Google Scholar]
- Jinan Municipal People’s Government. Regulations on the Protection of Famous Historical and Cultural Cities in Jinan; Jinan Municipal People’s Government: Jinan, China, 2021. [Google Scholar]
- Luo, W.J.; Gu, H.Y.; Tao, W. Progress of space syntax research in both domestic and international geography. World Reg. Stud. 2024, 1–16. [Google Scholar]
- Qiao, W.Y.; Guan, W.H.; Wang, X.G.; Wang, X.; Gu, Z.L. Analyzing the Spatial Polycentric Evolution of Changsha City Based on the Space Syntax. J. Urban Reg. Plan. 2018, 10, 45–59. [Google Scholar]
- Zhang, L.; Ding, Y.D.; Zhang, X.Y.; Zhao, D.F. Research on Spatial Optimization Strategy of Historical Block Based on Spatial Syntax——Taking Zhongshu Street in Xuzhou as an Example. Urban Archit. Space 2022, 29, 32–35. [Google Scholar]
- Ji, W.M.; Ding, C.; Peng, B.Y. Analyzing the Spatial Form of Ancient Streets from the Syntactic Perspective: A Case Study of Kongcheng Old Street in Anhui. J. Xi’an Univ. Archit. Technol. Soc. Sci. Ed. 2024, 43, 54–61. [Google Scholar]
- Zhuang, L.H. Spatial Resilience Assessment and Enhancement Strategies for Residential Historic Districts: A Space Syntax-Based Approach. Master’s Thesis, Shandong Jianzhu University, Jinan, China, 2022. [Google Scholar]
- Ji, Z.M.; Tian, Z.G. Assessing the Accessibility of Qingfeng Park in Changzhou through Space Syntax Analysis. Agric. Technol. 2024, 44, 134–137. [Google Scholar]
- Qiu, J.; Huang, J.J. Research on optimization of urban recreation space based on space syntax. Shanxi Archit. 2024, 50, 24–27. [Google Scholar]
- Wang, C.; Yang, L.; Feng, X.; Li, Y.Y.; Zhen, X.H.; Weng, X.X.; Chen, S.J. Optimizing the Spatial Configuration of Industrial Historic-Cultural Districts: A Space Syntax-Based Strategy. Contemp. Hortic. 2024, 47, 108–110+114. [Google Scholar]
- Peponis, J.; Bafna, S.; Zhang, Z.Y. The connectivity of streets: Reach and directional distance. Environ. Plan. B Plan. Des. 2008, 35, 881–901. [Google Scholar] [CrossRef]
- Dou, Q. A Space Syntax Investigation of the Changes in Residential District Planning and Design in Beijing. Archit. J. 2010, 1, 28–32. [Google Scholar]
- Wang, L.H.; Zhang, C.N.; Xie, T. Research on Spatial Structure and Optimization of Chaoshan Village Based on Spatial Syntax and Social Network: Taking Chengyanggang Village in Shantou City as an Example. Ind. Constr. 2024, 54, 163–171. [Google Scholar] [CrossRef]
- Sun, Z.Y.; Han, B.R.; Wang, B.L. Research on Urban Three-dimensional Road Networks Based on Spatial Syntax: A Case Study of Nanjing Drum Tower. Logist. Sci.-Tech. 2024, 47, 71–74+78. [Google Scholar]
- Zhao, H.X.; Wen, J.; Gao, C.Y. Optimizing the Pedestrian Network of Daming Palace Heritage Park: A Space Syntax-Based Approach. Urban Archit. Space 2024, 31, 68–69. [Google Scholar]
- Wu, Y.Q.; Guo, S.Q.; Wang, C.S. Perceiving Hebei Province’s International Destination Image: An Analysis of User-Generated Content through the Lens of Appraisal Theory. J. Hebei Tour. Coll. 2025, 30, 29–35. [Google Scholar]
- Li, S.Y. Investigating the Relationships Between Live Streaming Commerce Content, Online Reviews, and Consumer Purchase Intention. J. Commer. Econ. 2023, 42, 59–62. [Google Scholar]
- Du, S.Y.; Wang, X.P. Study on Overseas Tourists’Perceptions of Huangshan Mountain’s Tourism Image Based on Tourist-generated Contents. J. Huangshan Univ. 2023, 25, 32–38. [Google Scholar]
- Cai, L.B.; Wan, F.L. Measurement, Analysis, and Optimization of Rural Tourism Public Service Quality: A Tourist Perception Perspective. J. Shandong Agric. Univ. Soc. Sci. Ed. 2025, 27, 83–93. [Google Scholar]
- He, W.Q.; Wang, X.W.; Wang, J.Q. Analyzing Jinan’s Destination Image Perception: A Textual Analysis of Online Travel Blogs. China Circ. Econ. 2025, 48–51. [Google Scholar] [CrossRef]
- Hong, B.X.; Liu, P.P. Assessing Cultural Tourism Experience Quality in Quanzhou: A Textual Analysis of Online Content. Bus. Econ. 2025, 52–54+62. [Google Scholar] [CrossRef]
- Li, X.X. Web Text-Based Study on Image Perception of Red Tourism in Lu’an Dabie Mountains. J. Jiamusi Vocat. Coll. 2025, 41, 76–78. [Google Scholar]
- Luo, J.; Luo, P.S. Mapping Destination Image through Digital Narratives and IPA Modeling: A Case Study of Bosten Lake in Xinjiang. Trade Fair Econ. 2025, 46–49. [Google Scholar] [CrossRef]
- Li, X.T. Deconstructing Spatial Contextuality: Elemental Analysis of Mingfu City’s Urban Palimpsest in Jinan. Master’s Thesis, Shandong Jianzhu University, Jinan, China, 2022. [Google Scholar]
- Du, H.X. Research on Landscape Renewal Design of Jinan General Temple Historical District under the Perspective of Residential Symbiosis. Master’s Thesis, Xi’an University of Architecture and Technology, Xi’an, China, 2023. [Google Scholar]
- Zhao, X.Q. An Analysis of the Conservation and Renewal of Urban Historical and Cultural Blocks From the Perspective of Cultural and Tourism Integration: A Case Study of Baihuazhou District, Mingfu City. Master’s Thesis, Guilin University of Technology, Guilin, China, 2022. [Google Scholar]
- Gu, F.Y. Research on the Relationship between Corporate Attention to Environmental Policy, Pressure from the Media, and Corporate Environmental Performance. Master’s Thesis, Nanjing Forestry University, Nanjing, China, 2023. [Google Scholar]
- Nan, J.M. Analysis of User Comments on Shared Study Rooms in China Based on Text Mining. Master’s Thesis, North Minzu University, Yinchuan, China, 2022. [Google Scholar]
- Zheng, M.Y. A Study on Sentiment Annotation Based on Functional Linguistics: A Case of Cross-Border E-Commerce Customer Reviews Between China and ASEAN. Ph.D. Thesis, Guangxi Minzu University, Nanning, China, 2024. [Google Scholar]
- Bird, S.; Klein, E.; Loper, E. Natural Language Processing with Python; O’Reilly Media: Sebastopol, CA, USA, 2009; pp. 121–135. [Google Scholar]
- Church, K.W.; Hanks, P. Word association norms, mutual information, and lexicography. Comput. Linguist. 1990, 16, 22–29. [Google Scholar]
- Zhang, S. Introduction to Conservation of Historic Cities: A Holistic Approach to Cultural Heritage and Historic Environment Protection (Third Edition). J. Tongji Univ. Soc. Sci. Sect. 2021, 32, 2. [Google Scholar]
- Li, H.P.; Wang, Y.H. Research on the Protection and Development of Historic Districts under the Measurement of Community Participation: A Case Study of the Ciqikou Historic District in Chongqing. China Anc. City 2024, 38, 3–9. [Google Scholar] [CrossRef]
- Wang, Y.; Xiu, C.L. Spatial Quality Evaluation of Historical Blocks Based on Street View Image Data: A Case Study of the Fangcheng District. Buildings 2023, 13, 1612. [Google Scholar] [CrossRef]
- Jiang, S.Y.; Liu, J. Comparative Study of Cultural Landscape Perception in Historic Districts from the Perspectives of Tourists and Residents. Land 2024, 13, 353. [Google Scholar] [CrossRef]
- Field, A. Discovering Statistics Using SPSS, 5th ed.; Sage Publications: London, UK, 2018. [Google Scholar]
- Stevens, J.P. Applied Multivariate Statistics for the Social Sciences, 6th ed.; Routledge: New York, NY, USA, 2020; pp. 329–347. [Google Scholar]
- Pei, Y.; Kan, C.; Dang, A. Street Greenspace Justice Assessment Study of Dongcheng District in Beijing Based on Street View Data. Chin. Landsc. Archit. 2020, 36, 51–56. [Google Scholar]
- Yang, J.Y.; Wu, H.; Zeng, Y. Research on Characteristics and Interactive Mechanism of Street Walkability Through Multi-source Big Data: Nanjing Central District as a Case Study. Urban Plan. Int. 2019, 34, 33–42. [Google Scholar] [CrossRef]
- Xiong, X.; Wen, X.Y.; Yang, S.R.; Liu, L.; Zeng, W. Visual Quality Assessment and Influencing Factors Analysis of Urban Waterfront Greenway Landscape: A Case Study of Nanjing Jiajiang Riverside Greenway. Landscape 2024, 41, 69–77. [Google Scholar]
- He, Z.Y. Study on the Personalized Design and Smart Management of the Advertising Signs on Urban Building Facade. Urban Archit. 2024, 21, 133–137. [Google Scholar] [CrossRef]
- Zhang, Y.C. Research on Quantification of Street Spatial Characteristics and Optimization Design in Zhengzhou Based on Street View Images. Master’s Thesis, Henan Agricultural University, Zhengzhou, China, 2024. [Google Scholar]
- Feng, X.X. Assessment and Optimization of Vegetation Shading Benefits Based on the Distribution of Human Flow in Campus. Master’s Thesis, Huazhong Agricultural University, Wuhan, China, 2024. [Google Scholar]
- Fang, H.Y. Research on Design Strategy of Pedestrian Space in Harbin Residential District from the Perspective of Vitality Creation. Master’s Thesis, Harbin Institute of Technology, Harbin, China, 2021. [Google Scholar]
- Jiang, L. Consuming the Urban Cultural Space through the Body: A Focus on Physical Bookstore Space. J. Shenzhen Univ. Humanit. Soc. Sci. 2023, 40, 57–66. [Google Scholar]
- Yin, S.M.; Guo, X.; Jiang, J. Extracting the Urban Landscape Features of the Historic District from Street View Images Based on Deep Learning: A Case Study in the Beijing Core Area. ISPRS Int. J. Geo-Inf. 2022, 11, 326. [Google Scholar] [CrossRef]
- Myers, J.L.; Well, A.D.; Lorch, R.F. Research Design and Statistical Analysis, 3rd ed.; Routledge: New York, NY, USA, 2010; pp. 521–525. [Google Scholar]
- Gibbons, J.D.; Chakraborti, S. Nonparametric Statistical Inference, 6th ed.; CRC Press: Boca Raton, FL, USA, 2020. [Google Scholar]
- Cohen, J. Statistical Power Analysis for the Behavioral Sciences, 2nd ed.; Routledge: New York, NY, USA, 1988; pp. 20–27. [Google Scholar]
- Old Meets High-Tech! Fuzhou’s Three Lanes and Seven Alleys Fun Level up. Available online: https://mp.weixin.qq.com/s/cpUk3c0MXCe9CciQn6Hr9g (accessed on 10 June 2025).
- Creative AR Interactive Experience for Three Lanes and Seven Alleys Historical and Cultural District. Available online: https://www.imetacloud.com/plan/san-fang-qi-xiang-li-shi-wen-hua-jie-qu (accessed on 10 June 2025).


| Street Name | Heritage Visibility Density | Street Length |
|---|---|---|
| Furong Street | 5.2 sites/100 m | Approx. 420 m |
| Bai Huazhou Street | 4.5 sites/100 m | Approx. 300 m |
| Jiang Junmiao Street | 3.8 sites/100 m | Approx. 280 m |
| Hou Zaimen Street | 1.5 sites/100 m | Approx. 200 m |
| Shuang Zhongci Street | 1.2 sites/100 m | Approx. 150 m |
| Dong Huaqiangzi Street | 2.0 sites/100 m | Approx. 250 m |
| … | … | … |
| Street | Comprehensive Potential Index (CPI) | In | Cn | HVD (Sites/100 m) | Typological Characteristics |
|---|---|---|---|---|---|
| Qu Shuiting Street (High-efficiency) | 2.067 | 0.846 (High) | 0.561 (High) | 5.2 (High) | Core cultural tourism corridors |
| Jiang Junmiao Street (Isolated) | 1.411 | 0.5310 (Low) | 0.194 (Low) | 3.8 (High) | Conflict between heritage conservation and accessibility |
| Shuang Zhongci Street (High-efficiency) | 0.858 | 0.797 (High) | 0.598 (High) | 1.2 (Low) | Local cultural deficiency |
| Hou Zaimen Street (Potential) | 0.784 | 0.596 (High) | 0.318 (Low) | 1.5 (Low) | Marginal revitalization blind spots |
| Shengfu Front Street (Potential) | 0.327 | 0.789 (High) | 0.037 (Low) | 0 | Traffic-Induced deprivation of heritage space |
| Sentiment Segment | Sentiment Score |
|---|---|
| Walking on Furong Street felt like being completely pushed along by the crowd—it was packed with people everywhere. | −3 |
| Furong Street is Jinan’s characteristic old street and food street, named after the famous spring “Furong Spring” on the street. | 3 |
| Bordered by Mashi Street to the east, connecting to Qi Fengqiao Street, Xiangfeng Lane, and Furong Lane; adjacent to Yuhuanquan Street to the west, leading to Shengfu East Street. | 0 |
| After admiring Qifeng Bridge, you can wander through the surrounding alleys to experience the charm of old Jinan. | 0 |
| As a tourism educator and nature enthusiast, I personally believe that artificial attractions compromising natural landscapes are counterproductive. | −1 |
| The Qushuiting, Baihuazhou, and Mingfu City area south of the road represents Jinan’s spring water cultural characteristics and is the most worthwhile section to visit. | 1 |
| Physical Element | Word Frequency | Sentiment Score |
|---|---|---|
| Spring Water | 870 | 0, 0, 0, 0, 0, 0, 1, 0, 0, 0, 0, 0, 1, 1, 0, 3, 3, 3, 3, 0, 0, 3, 3, 3, 3, 3, 0, 0, … |
| Lakeside | 615 | 0, 0, 0, 0, 0, 0, 0, 0, 0, 0, 0, 3, 0, 0, 0, 0, 0, 0, 0, 0, 1, 0, 1, 1, 1, 0, 0, 0, … |
| History | 455 | 0, 0, −1, −1, 0, 0, 0, 0, 1, 1, 1, 0, 0, 1, 0, 0, 1, 3, 3, 1, 0, 0, 1, 1, 1, 0, 0, … |
| Ancient Street | 267 | 1, 0, 1, 0, 0, 0, 1, 1, 1, 1, 0, 1, 1, 1, 0, 1, 0, 0, 0, 1, 0, 0, 0, 1, 0, 1, 1, 1, … |
| Decorated Archway | 15 | 1, 0, 0, 1, 0, 0, 0, 0, 0, 0, 0, 0, 0, 1, −1 |
| Balustrade | 3 | 0, 1, 1 |
| Temple of Literature | 239 | 0, 0, 0, 0, 1, 0, 0, 0, 0, 0, 0, 1, 0, 0, 0, 0, 0, 0, 0, −1, 0, −1, 1, 0, 0, 1, 1, … |
| Lao She | 223 | 0, 0, 0, 0, 0, 1, 0, 3, 0, 0, 0, 0, 1, 0, 0, 0, 0, 1, 0, 0, 0, 0, 0, 0, 0, 0, 0, 0, … |
| … | … | … |
| Physical Element | Total Word Frequency | Mean Sentiment Score | Positive Frequency | Negative Frequency | Sentiment Variance |
|---|---|---|---|---|---|
| Spring Water | 870 | 0.36 | 196 | 30 | 0.7933199771055678 |
| Characteristic | 637 | 1.42 | 459 | 4 | 0.9097815458958181 |
| Lakeside | 615 | 0.28 | 143 | 18 | 0.6894500687623522 |
| Park | 582 | 0.28 | 125 | 39 | 0.7774605564306287 |
| Lotus | 520 | 0.24 | 112 | 12 | 0.578430722378848 |
| History | 455 | 0.31 | 117 | 14 | 0.657227382560551 |
| Culture | 405 | 0.39 | 114 | 6 | 0.7095662231009212 |
| Tourism | 403 | 0.36 | 117 | 12 | 0.7068955872188105 |
| Quancheng Square | 392 | 0.23 | 68 | 15 | 0.660073757758151 |
| Ancient Street | 267 | 0.56 | 120 | 6 | 0.74885764957086 |
| … | … | … | … | … | … |
| Visual Perception Elements | Factor 1 | Spatial Comfort Elements | Factor 2 | Cultural Experience Elements | Factor 3 |
|---|---|---|---|---|---|
| Spring Water | 5.03821 | Lively Atmosphere | 2.27207 | Signboards | 2.88051 |
| Park | 3.99731 | Trail | 2.12973 | Huixianlou Restaurant | 2.05298 |
| Lakeside | 3.30701 | Hutong | 2.00042 | Listen to Crosstalk | 1.66994 |
| Lotus | 2.52627 | Stalls | 1.85029 | Ancient Trees | 1.65663 |
| Architecture | 0.78775 | Bustling | 1.75446 | Former Residence of Lu Dahuang | 1.65663 |
| Pearl Spring | 0.62592 | Affordable | 1.6487 | Folk Performance | 1.65663 |
| Photography | 0.88237 | Ancient Street | 1.23603 | Market | 1.65663 |
| Flowers and Plants | −0.5027 | Stone Bench | −1.28178 | Historical Site | 1.65663 |
| Blue Sky | −0.48927 | Bench | −1.2777 | Cultural and Artistic | 1.19729 |
| Trees | 0.44884 | Shade of Trees | −1.2777 | Former Residence of Lao She | 1.03973 |
| Stream | 0.44837 | Leisure | 1.02609 | Storefront | 0.99678 |
| Pond | −0.40417 | Stroll | 1.00449 | Teahouse | 0.95303 |
| Open Space | −0.39282 | Quiet | 0.97863 | Lotus Festival | 0.84724 |
| Advertisement | −0.51878 | Decorated Archway | 0.96219 | Archway | −1.29944 |
| Street Lamps | −0.49488 | Sculpture | −1.27906 | Qifeng Bridge | −0.81796 |
| Machine Indicator | Dimensions | Mean of Compliant Group | Mean of Non-Compliant Group | Mean Difference | Effect Size (Cohen’s d) |
|---|---|---|---|---|---|
| Green Vision Rate | Visual Score | 2.04 | 0.20 | +1.84 | 1.28 (Large Effect) |
| Shading Facility Coverage | Visual Score | 2.04 | 0.20 | +1.84 | 1.28 (Large Effect) |
| Effective Pedestrian Clear Width | Visual Score | 1.85 | 0.31 | +1.54 | 0.99 (Large Effect) |
| Street Enclosure Ratio | Visual Score | −0.38 | 1.60 | −1.98 | −1.44 (Large Negative Effect) |
| Green Vision Rate | Comfort Score | 1.50 | 0.49 | +1.01 | 0.69 (Moderate Effect) |
| Effective Pedestrian Clear Width | Comfort Score | 1.54 | 0.47 | +1.07 | 0.70 (Moderate Effect) |
| Shading Facility Coverage | Comfort Score | 1.58 | 0.44 | +1.13 | 0.77 (Moderate Effect) |
| Street Enclosure Ratio | Comfort Score | 0.04 | 1.33 | −1.29 | −0.91 (Large Negative Effect) |
| Street | Green Vision Rate | Shading Facility Coverage | Effective Pedestrian Clear Width | Street Enclosure Ratio | Visual Score | Comfort Score | Cultural Score |
|---|---|---|---|---|---|---|---|
| Qu Shuiting Street | 0.286 | 0.256 | 0.096 | 0.314 | 2.533 | 1.694 | 0.858 |
| Jiang Junmiao Street | 0.076 | 0.070 | 0.052 | 0.528 | 0.121 | 0.639 | 0.479 |
| Shuang Zhongci Street | 0.051 | 0.047 | 0.056 | 0.543 | 0.049 | 0.410 | 0.578 |
| Hou Zaimen Street | 0.073 | 0.062 | 0.047 | 0.556 | 0.631 | 0.485 | 0.970 |
| Shengfu Front Street | 0.192 | 0.134 | 0.062 | 0.374 | 1.634 | 1.504 | 0.534 |
| Street | Core Deficiencies | Strengths |
|---|---|---|
| Jiang Junmiao Street | low green vision rate (0.076), extremely low visual score (0.121) | relatively high street enclosure ratio (0.528) |
| Shuang Zhongci Street | lowest green vision rate (0.051), lowest shading facility coverage (0.047), lowest comfort score (0.41) | highest street enclosure ratio (0.543) |
| Hou Zaimen Street | lowest effective pedestrian clear width (0.047), low shading facility coverage (0.064), low comfort score (0.485) | highest cultural score (0.97) |
| Shengfu Front Street | relatively low shading facility coverage (0.134), low effective pedestrian clear width (0.062) | acceptable visual/comfort score |
Disclaimer/Publisher’s Note: The statements, opinions and data contained in all publications are solely those of the individual author(s) and contributor(s) and not of MDPI and/or the editor(s). MDPI and/or the editor(s) disclaim responsibility for any injury to people or property resulting from any ideas, methods, instructions or products referred to in the content. |
© 2025 by the authors. Licensee MDPI, Basel, Switzerland. This article is an open access article distributed under the terms and conditions of the Creative Commons Attribution (CC BY) license (https://creativecommons.org/licenses/by/4.0/).
Share and Cite
Chen, L.; Cai, X.; Liu, Z. Multi-Source Data and Semantic Segmentation: Spatial Quality Assessment and Enhancement Strategies for Jinan Mingfu City from a Tourist Perception Perspective. Buildings 2025, 15, 2298. https://doi.org/10.3390/buildings15132298
Chen L, Cai X, Liu Z. Multi-Source Data and Semantic Segmentation: Spatial Quality Assessment and Enhancement Strategies for Jinan Mingfu City from a Tourist Perception Perspective. Buildings. 2025; 15(13):2298. https://doi.org/10.3390/buildings15132298
Chicago/Turabian StyleChen, Lin, Xiaoyu Cai, and Zhe Liu. 2025. "Multi-Source Data and Semantic Segmentation: Spatial Quality Assessment and Enhancement Strategies for Jinan Mingfu City from a Tourist Perception Perspective" Buildings 15, no. 13: 2298. https://doi.org/10.3390/buildings15132298
APA StyleChen, L., Cai, X., & Liu, Z. (2025). Multi-Source Data and Semantic Segmentation: Spatial Quality Assessment and Enhancement Strategies for Jinan Mingfu City from a Tourist Perception Perspective. Buildings, 15(13), 2298. https://doi.org/10.3390/buildings15132298