Article

Optimization of PM2.5 Pollution Control in Residential Buildings Through Mechanical Ventilation Systems Under High Outdoor PM2.5 Levels in Chinese Cities

1
Department of Urban Construction Engineering, Wenhua College, Wuhan 430074, China
2
School of Building Services Science and Engineering, Xi’an University of Architecture and Technology, Xi’an 710055, China
3
School of Environmental Science and Engineering, Huazhong University of Science and Technology, Wuhan 430074, China
4
China Southwest Architecture Design Institute, Chengdu 610042, China
*
Author to whom correspondence should be addressed.
Buildings 2025, 15(16), 2838; https://doi.org/10.3390/buildings15162838
Submission received: 8 July 2025 / Revised: 28 July 2025 / Accepted: 31 July 2025 / Published: 11 August 2025

Abstract

High outdoor PM2.5 levels in Chinese cities pose significant challenges to maintaining healthy indoor air quality in residential buildings, where mechanical ventilation systems are increasingly adopted for pollution control. In this paper, to control the indoor PM2.5 concentration, a mass balance equation for the non-uniform mixing model has been established to calculate the filter efficiency. This study aims to optimize PM2.5 pollution control in residential buildings through mechanical ventilation systems by evaluating the synergistic effects of filter efficiency and ventilation air flow rates under high outdoor PM2.5 conditions. Field measurements and numerical calculations were conducted to monitor indoor and outdoor PM2.5 concentrations. Results showed that, When outdoor PM2.5 concentrations remain below 100 μg/m3, an air exchange rate of 3 h−1 effectively maintains indoor PM2.5 levels below 35 μg/m3 for M6-F8 air filters. Experimental data demonstrate that when a fresh air system equipped with H10 filters operates at an outdoor PM2.5 concentration of 150 μg/m3, the corresponding optimal ventilation rate is 0.45 h−1. Increasing the mechanical ventilation rate to 1 h−1 enables the system to effectively handle higher outdoor concentrations up to 176 μg/m3. Under severe pollution scenarios with outdoor PM2.5 concentrations reaching 250 μg/m3, the air exchange rate should be further increased to 1.65 h−1 to maintain indoor PM2.5 concentrations within acceptable limits. This study provides practical insights for improving residential indoor air quality under high outdoor PM2.5 conditions in Chinese cities.

1. Introduction

Numerous Chinese cities currently experience substantial deviations from standardized outdoor PM2.5 concentration thresholds, making the control of indoor PM2.5 pollution in residential buildings a critical challenge in engineering technology. PM2.5 can be introduced into indoor spaces when it is ventilated from outdoor air which contains a high PM2.5 levels; its inhalation can cause bronchial diseases and cerebrovascular diseases when it infiltrates blood vessels [1,2]. Research indicates that natural ventilation during haze episodes can significantly elevate indoor PM2.5 concentrations [3]. Consequently, ventilation filtration coupled with indoor air purification has emerged as a prevalent approach for mitigating indoor particulate matter pollution [4,5,6,7]. Extensive research has comprehensively demonstrated the dualistic effects of mechanical ventilation on indoor air quality improvement. While effectively reducing indoor particulate concentrations under normal conditions, mechanical ventilation systems may inadvertently exacerbate indoor particle pollution when outdoor PM2.5 levels are elevated [8]. In scenarios where mechanical ventilation proves impractical due to adverse outdoor conditions, indoor air cleaners serve as an alternative mitigation strategy [9]. The operational efficacy of these devices is significantly constrained by their reliance on window openings for fresh air intake, which fundamentally limits their capacity to ensure consistent and uninterrupted air supply. Both ventilation filtration and indoor purification systems present distinct advantages and limitations. The strategic selection of appropriate system configurations is therefore crucial for optimizing indoor PM2.5 control and informing ventilation system design. In conclusion, while the integration of ventilation filtration and indoor purification represents the most effective solution for addressing indoor particulate pollution, the inherent intermittency of fresh air systems and air cleaners, combined with fluctuating outdoor particulate concentrations, results in relatively unstable indoor PM2.5 levels.
Otto et al. [10] argue that mechanical ventilation systems equipped with air filtration in buildings can more effectively reduce indoor particle concentrations and associated health risks compared to source control. In Europe and North America, the adoption rate of fresh air systems reaches as high as 96%, and research on mechanical ventilation has a relatively long history. Kulmala et al. [11] and Jamriska et al. [12] developed a single-zone uniform mixing model to predict indoor particle levels. Their findings demonstrate that maintaining indoor particulate matter concentrations within acceptable limits can be achieved through strategic reduction of fresh air intake during periods of elevated outdoor particulate matter levels, while simultaneously ensuring adequate thermal comfort and meeting minimum fresh air requirements for occupants. Conversely, when indoor sources are the primary contributors to particulate matter, increasing fresh air and reducing recirculated air can effectively control indoor pollutants. Studies by Ben-David et al. [13] and Sawant et al. [14] have demonstrated that the implementation of mechanical ventilation systems substantially reduces the indoor-to-outdoor PM2.5 concentration ratio (I/O ratio), with filter efficiency playing a crucial role in determining indoor PM2.5 levels. According to Zender’s research [15], reliance solely on natural ventilation proves inadequate for enhancing indoor air quality during periods of mechanical ventilation system inactivity, whereas the activation of fresh air supply systems has been shown to effectively mitigate elevated indoor carbon dioxide concentrations. Miller et al. [16] emphasize that indoor particulate matter concentrations in mechanically ventilated spaces are strongly influenced by fresh air volume, and enhancing filter efficiency can substantially mitigate indoor fine particulate pollution. Ruan et al. [17] investigated indoor particulate matter control strategies in Beijing and Los Angeles, analyzing the effects of filter efficiency and fresh air volume on indoor particulate matter concentrations using a mass balance equation. Their results demonstrate that during extreme outdoor pollution events, employing MERV11 or higher-grade filters or limiting fresh air volume to below 8.5 L/s per person can reduce indoor PM2.5 levels to 35 μg/m3. Upgrading the filtration level of mechanical ventilation systems can significantly decrease indoor particulate matter concentrations. However, Brent et al. [18] and Montgomery et al. [19] have cautioned that the use of high-efficiency filters can lead to a substantial increase in system energy consumption.
The purpose of this research is to address the scenario of high outdoor PM2.5 levels in Chinese cities, with a focus on residential buildings—a critical indoor environment closely linked to human health. To control the indoor PM2.5 concentration, a mass balance equation for the non-uniform mixing model has been established to calculate the filter efficiency. Specifically, it aims to systematically explore how to optimize the design, operating parameters, and control strategies of mechanical ventilation systems to enhance their effectiveness in filtering, blocking, and diluting indoor PM2.5. By doing this, the research intends to effectively reduce PM2.5 pollution levels in residential buildings, provide a healthier indoor air environment for residents exposed to high outdoor PM2.5, and offer scientific evidence and technical support for the formulation of relevant building ventilation design standards and pollution control policies.

2. Theoretical Model of Mechanical Ventilation Systems

Mechanical ventilation systems equipped with air filters have been demonstrated to effectively reduce indoor particulate matter concentrations. Extensive research has been conducted by both domestic and international scholars on the selection and design of these filtration systems. Kim et al. [20] employed a steady-state model to examine the parameters affecting indoor PM2.5 concentrations in ventilation systems. Their research revealed that low-efficiency filters are insufficient to mitigate variations in outdoor PM2.5 concentrations, emphasizing the importance of enhancing both ventilation rates and filtration efficiency for effective control of indoor PM2.5 levels. Similarly, domestic scholars Xu [21] and Wang et al. [22] analyzed filter configurations based on steady-state models and characterized filtration efficiency in terms of indoor and outdoor particulate matter concentrations. Nevertheless, these studies have not provided a comprehensive analysis of indoor PM2.5 concentrations that simultaneously considers outdoor PM2.5 levels, ventilation rates, and filtration efficiency. Additionally, they have not incorporated temporal dynamics or addressed the non-uniform mixing characteristics of particulate matter. Based on the indoor-outdoor particulate matter transmission model illustrated in Figure 1, the indoor PM2.5 mass concentration can be effectively characterized using a single-compartment dynamic mass balance model, as formulated in Equation (1).
Based on the mass balance equation for indoor and outdoor particulate matter concentrations, a non-uniform mixing model for particulate matter can be established.
V d C i n d t = ε f Q f ( 1 η m ) C o u t Q f C i n + ( Q i P C o u t Q i C i n ) + G K V C i n
where V is the volume of the house, m3; Qf is the volume of fresh air, m3/h; Qi is the volume infiltrated through the building shell, m3/h; εf is the non-uniform mixing coefficient of mechanical ventilation. P is the penetration coefficient; K is the indoor particle deposition rate, h−1; Cout is the concentration of outdoor PM2.5, μg/m3; Cin is the concentration of indoor PM2.5, μg/m3; ηm is the filtration efficiency of the air filter in the fresh air system, %; and G is the indoor particle source, μg/h.
The non-steady state model can be calculated by setting in Equation (1) and solving for Cin as shown in Equation (2).
C i n = a P C o u t + ε f n ( 1 η m ) C o u t + G V ε f n + a + K 1 e ε f n + a + K t + C 0 × e ε f n + a + K t
where C0 is the initial concentration of indoor PM2.5, μg/m3; n is air exchange rate of mechanical ventilation, h−1; a is air exchange rate of infiltration, h−1.
When the operating time of the mechanical ventilation system approaches infinity, a steady-state model of indoor PM2.5 concentration can be derived, as described in Equation (3).
C = a P C o u t + ε f n ( 1 η m ) C o u t + G V ε f n + a + K
where C is the steady-state concentration of indoor PM2.5, μg/m3.

3. Methods for Determining Indoor and Outdoor PM2.5 Concentration

3.1. Outdoor PM2.5 Concentration

The outdoor PM2.5 concentration plays a critical role in the selection of ventilation and purification systems. When the filter efficiency is determined, the outdoor PM2.5 concentration directly influences the particulate concentration in the supply air. However, there is considerable debate regarding the appropriate methodology for selecting the outdoor PM2.5 concentration as a design parameter. Various approaches have been proposed, including the use of daily average values (Si et al. [23]), annual maximum values (Zhang et al. [24]), and annual average values (Tu et al. [25]), each with its own limitations. Consequently, further research is necessary to determine the most suitable design concentration for outdoor PM2.5.
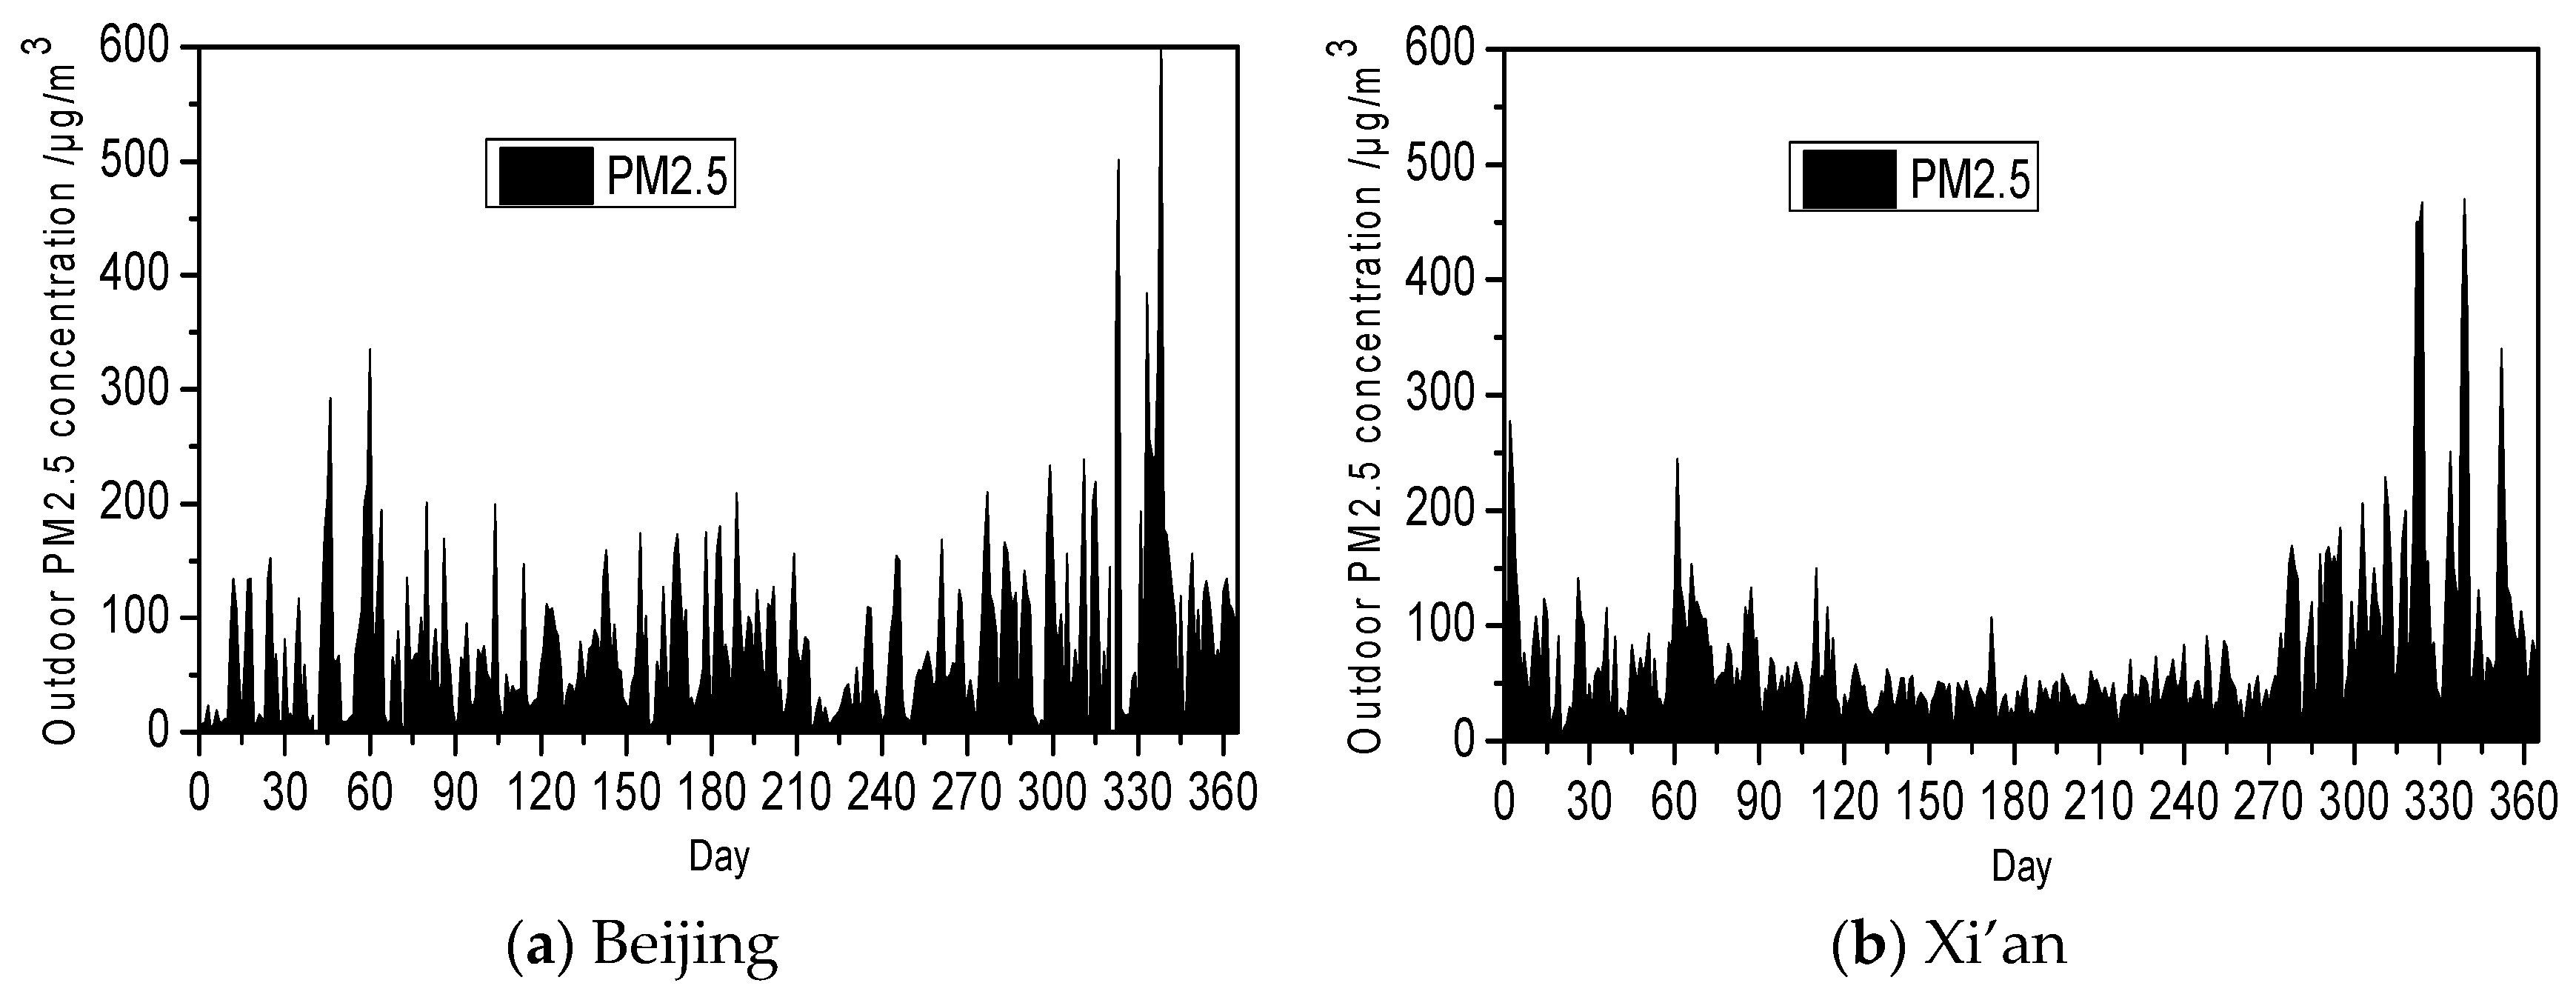
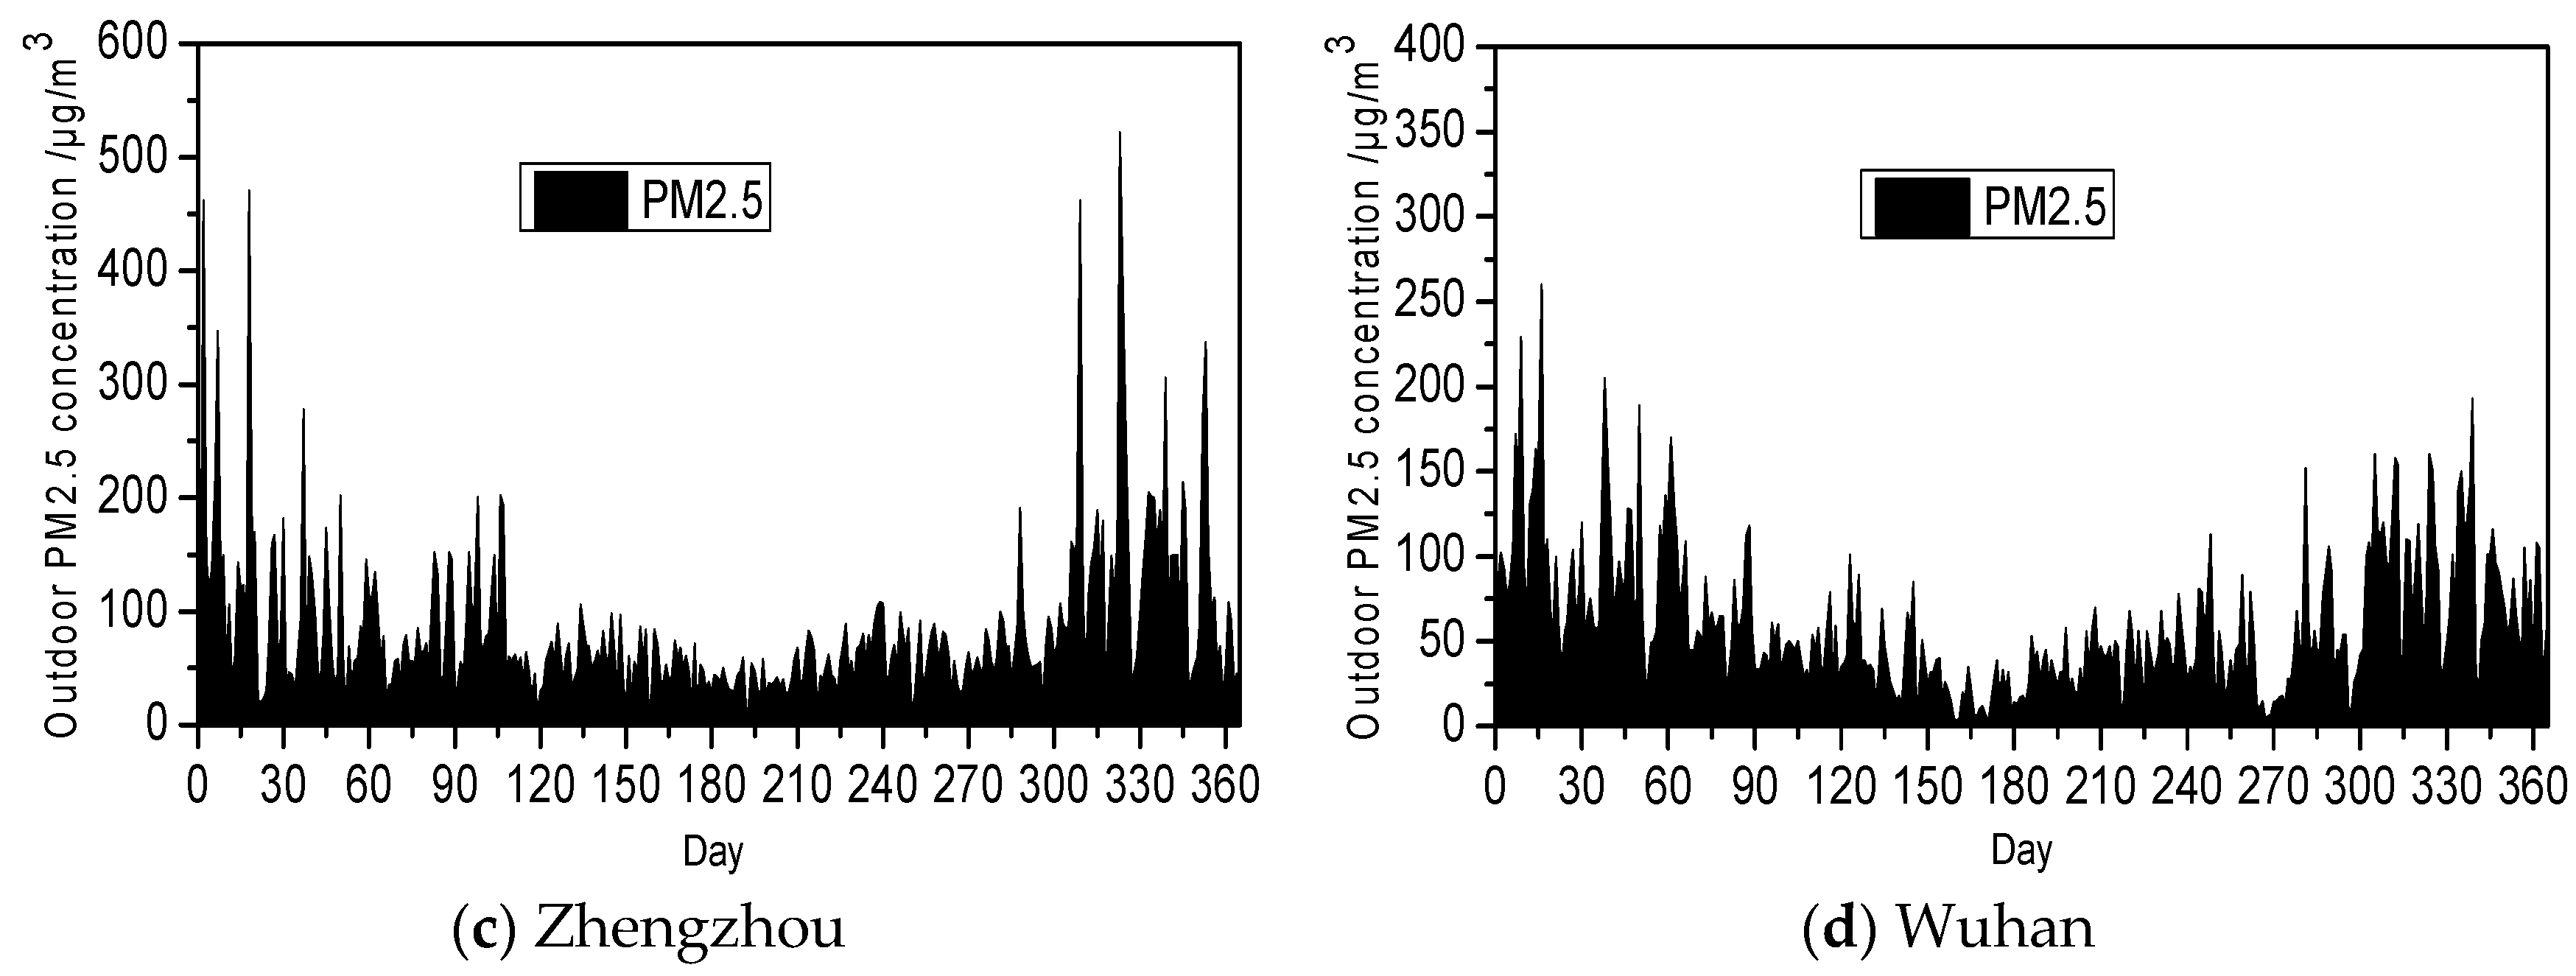
According to monitoring data from the China National Urban Air Quality Real-time Release Platform [26], Figure 2 presents a statistical analysis of the daily average outdoor PM2.5 concentrations for 2017 in four major Chinese cities: Beijing, Xi’an, Zhengzhou, and Wuhan.
The data reveals significant variations in PM2.5 concentrations across these cities, with daily averages fluctuating within ranges of 3–618 μg/m3, 3–470 μg/m3, 8–654 μg/m3, and 3–260 μg/m3, respectively. The corresponding annual average concentrations were 76 μg/m3, 73 μg/m3, 147 μg/m3, and 60 μg/m3. Notably, the annual maximum values were 8.1, 6.4, 4.4, and 4.3 times higher than their respective annual averages. These substantial variations, coupled with the random and volatile nature of outdoor PM2.5 concentrations, underscore the significant differences in air quality patterns among these cities.

3.2. Indoor PM2.5 Concentration Control Standards

The standards for indoor air quality have evolved significantly over time, with notable differences between domestic and international regulations. According to GB/T 18883-2002 “Standards for indoor air quality” [27], the maximum allowable daily average concentration of indoor PM10 was set at 150 μg/m3, while no specific standard was established for PM2.5. However, the revised GB/T 18883-2022 “Standards for indoor air quality” [28] introduced more stringent requirements, reducing the PM10 limit to 100 μg/m3 and establishing a new PM2.5 standard of 50 μg/m3 for daily average concentrations. In the context of building ventilation performance, JGJ/T 309-2013 “The Standard of the measurement and evaluation for efficiency of building ventilation” [29] applies to civil buildings and sets a higher threshold for PM2.5, stipulating that the daily average concentration should remain below 75 μg/m3. Internationally, ASHRAE 62.1 [30] provides comprehensive indoor PM2.5 concentration control standards. Table 1 presents a comparative analysis of these domestic and international standards for indoor PM2.5 control, highlighting the variations in regulatory approaches and permissible concentration levels across different regions and standards.
As illustrated in Table 1, there are significant variations in indoor PM2.5 concentration standards across different regions. The United States and European countries have established stringent requirements, with daily average indoor PM2.5 concentrations limited to 65 μg/m3 and 25 μg/m3, respectively, and annual averages set at 15 μg/m3 and 10 μg/m3. In contrast, Canada adopts a more flexible approach, permitting a higher outdoor PM2.5 hourly average concentration of 100 μg/m3 but enforcing a stricter long-term limit of 40 μg/m3. In comparison, China’s current indoor PM2.5 concentration control standards are relatively lenient compared to those in Europe and the United States.

4. Analysis the Steady-State Model for Indoor PM2.5 Concentration

4.1. The Impact of Ventilation Rate and Filtration Efficiency on Indoor PM2.5 Concentration

This study investigates the influence of outdoor smog conditions on indoor PM2.5 concentrations within a mechanical ventilation system, with a specific focus on residential buildings. The analysis assumes that indoor particulate matter originates exclusively from outdoor sources, thereby neglecting internal dust generation. The research focuses on a residential building encompassing an area of 113 m2 and featuring a floor height of 2.8 m. The mechanical ventilation system employs a balanced two-way flow configuration, with air supply positioned above and return air located below to optimize air distribution. The non-uniform mixing coefficient is calculated based on the standardized methodologies provided in the reference [31]. The study incorporates an infiltration ventilation rate of 0.3 h−1 and calculates a PM2.5 penetration factor of 0.8 using the penetration model [32]. In alignment with the findings of Kim et al. [20], which advocate for the utilization of medium and high-efficiency filters in ventilation systems to mitigate indoor particulate pollution, this research evaluates the performance of various filter grades. Specifically, filters of M6 (32% efficiency), F7 (43%), F8 (54%), F9 (75%), H10 (82%), and a combined M6 + H10 (88%) configuration are analyzed. The indoor PM2.5 concentrations are systematically assessed in relation to both outdoor PM2.5 levels and the air exchange rates facilitated by the mechanical ventilation system.
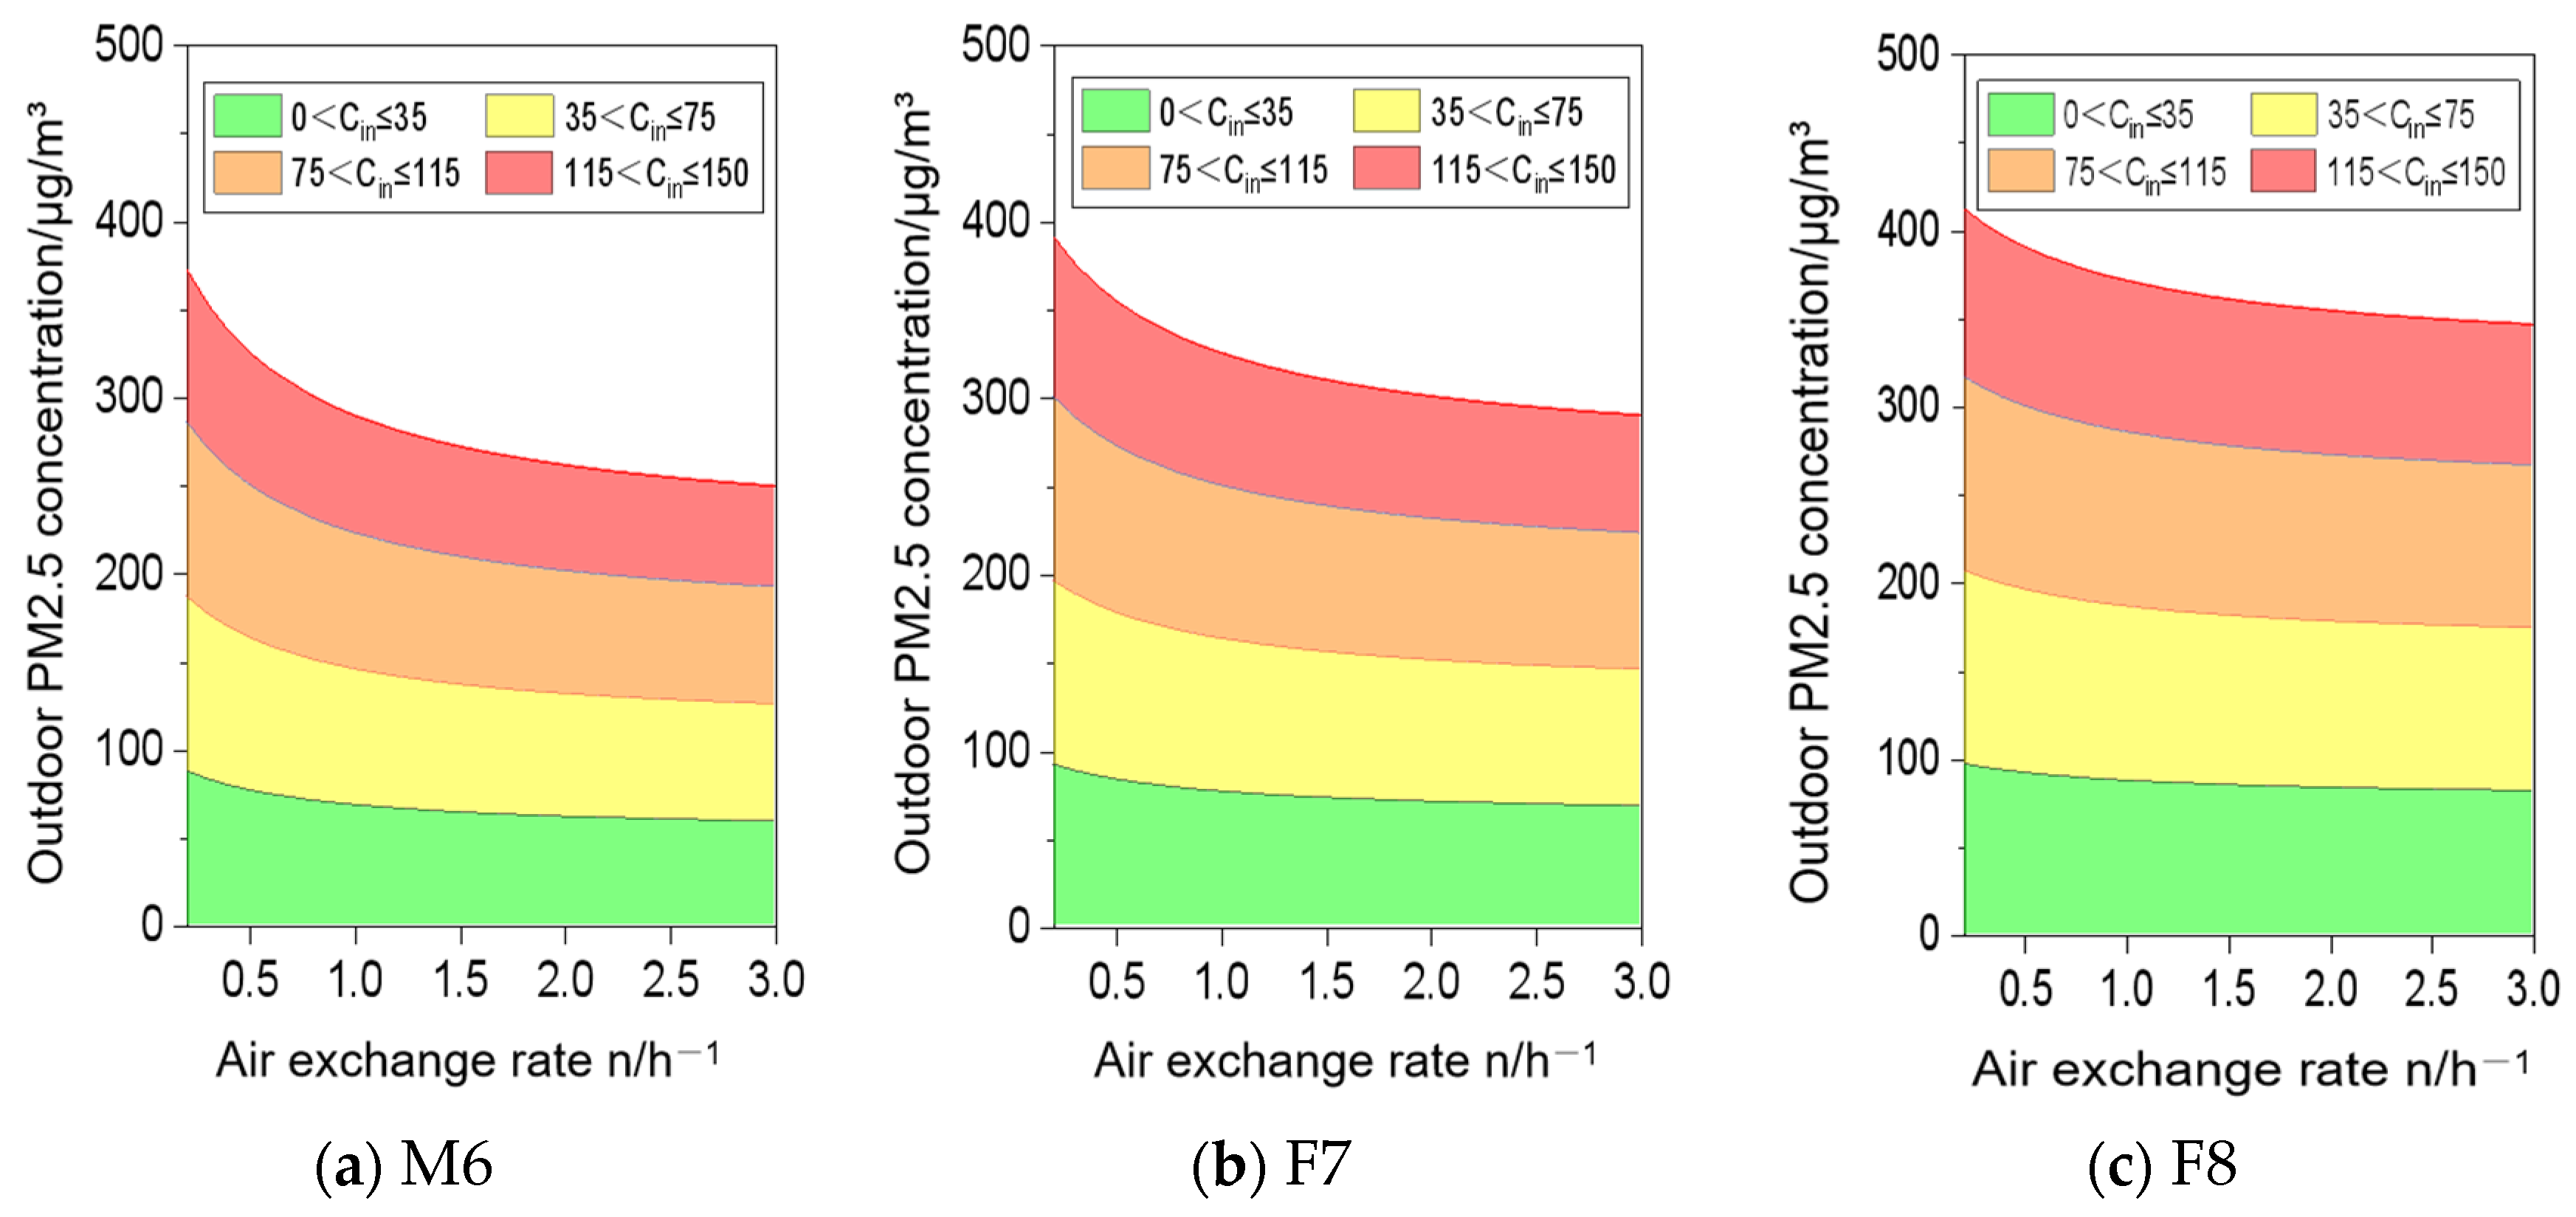
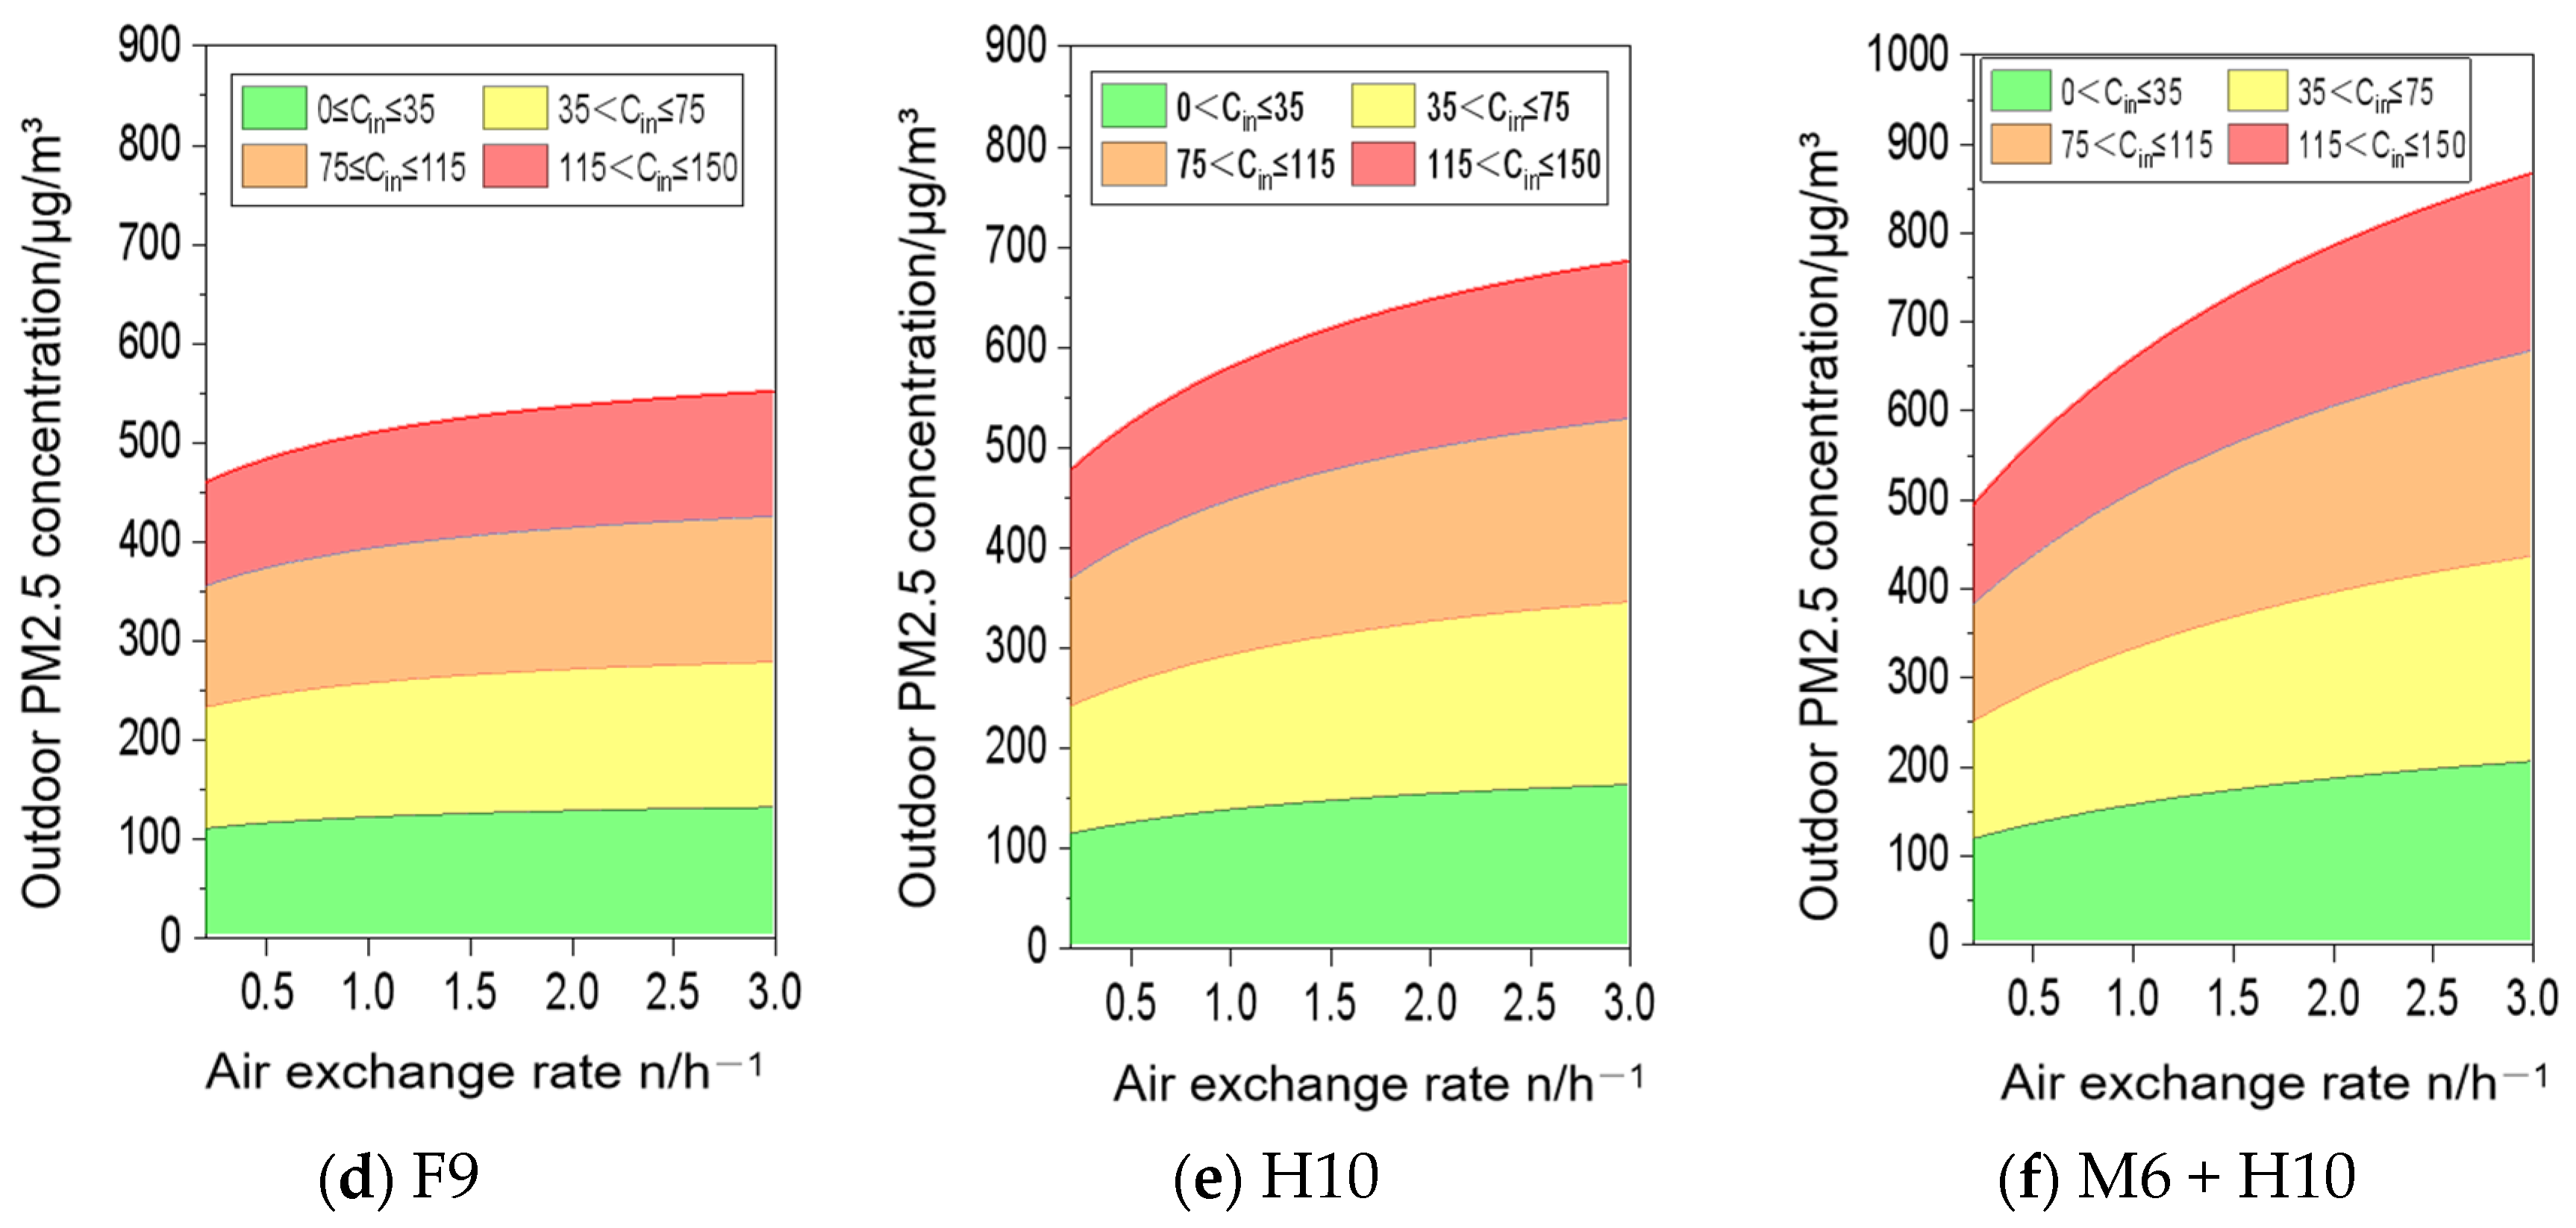
Based on the calculated results, the indoor PM2.5 concentration is categorized into four pollution levels, following the classification standards provided by Ministry of Ecology and Environment of the People’s Republic of China [33]. The classification criteria are as follows: “excellent” (0 < Cin ≤ 35 μg/m3), “good” (35 < Cin ≤ 75 μg/m3), “lightly polluted” (75 < Cin ≤ 115 μg/m3), and “moderately polluted” (115 < Cin ≤ 150 μg/m3). Figure 3 illustrates the indoor PM2.5 concentration ranges associated with different filter efficiencies, the horizontal axis represents the air exchange rate of the mechanical ventilation system, while the vertical axis denotes the outdoor PM2.5 concentration. The air change rate of mechanical ventilation is in the range of 0.5–3 h−1 [34].
The analysis of Figure 3a–c reveals distinct patterns in indoor PM2.5 concentration relative to outdoor levels and air exchange rates. When outdoor PM2.5 concentrations remain below 100 μg/m3, an air exchange rate of 3 h−1 effectively maintains indoor PM2.5 levels below 35 μg/m3, resulting in “excellent” indoor air quality. In scenarios where outdoor PM2.5 concentrations range between 100 and 200 μg/m3, indoor levels correspondingly fall within 35 to 75 μg/m3, classifying the indoor air quality as “good”. However, as outdoor PM2.5 concentrations exceed these thresholds, maintaining acceptable indoor air quality becomes challenging. According to JGJ/T 309-2013 standards, which specify an indoor PM2.5 concentration limit of 75 μg/m3, Figure 3a demonstrates that with an air exchange rate of 3 h−1, the maximum permissible outdoor PM2.5 concentration is 125 μg/m3. This threshold increases to 163 μg/m3 when the air exchange rate is reduced to 0.5 h−1. These observations underscore the significant impact of both outdoor PM2.5 concentrations and ventilation rates on indoor air quality. Current ventilation systems equipped with M6, F7, and F8 filters show limited effectiveness in mitigating outdoor PM2.5 infiltration. Therefore, as outdoor particulate matter concentrations rise, it is crucial for ventilation systems to maintain at least the minimum required fresh air volume to optimize indoor air quality.
The observed trends in Figure 3d–f demonstrate an inverse relationship compared to those in Figure 3a–c, suggesting that enhanced ventilation volume can effectively reduce indoor PM2.5 concentrations when higher-grade filters are employed. For instance, with the M6 + H10 combined filtration system, increasing the air exchange rate from 0.5 h−1 to 3 h−1 results in a significant elevation of the permissible outdoor PM2.5 concentration threshold, from 283 μg/m3 to 434 μg/m3. Notably, ventilation systems utilizing F9 grade or superior filters exhibit a more substantial response to variations in air exchange rates. This finding indicates that augmenting fresh air intake represents a viable strategy for mitigating the effects of severe air pollution conditions.

4.2. Calculation of Filter Efficiency Based on Indoor Non-Guaranteed Days

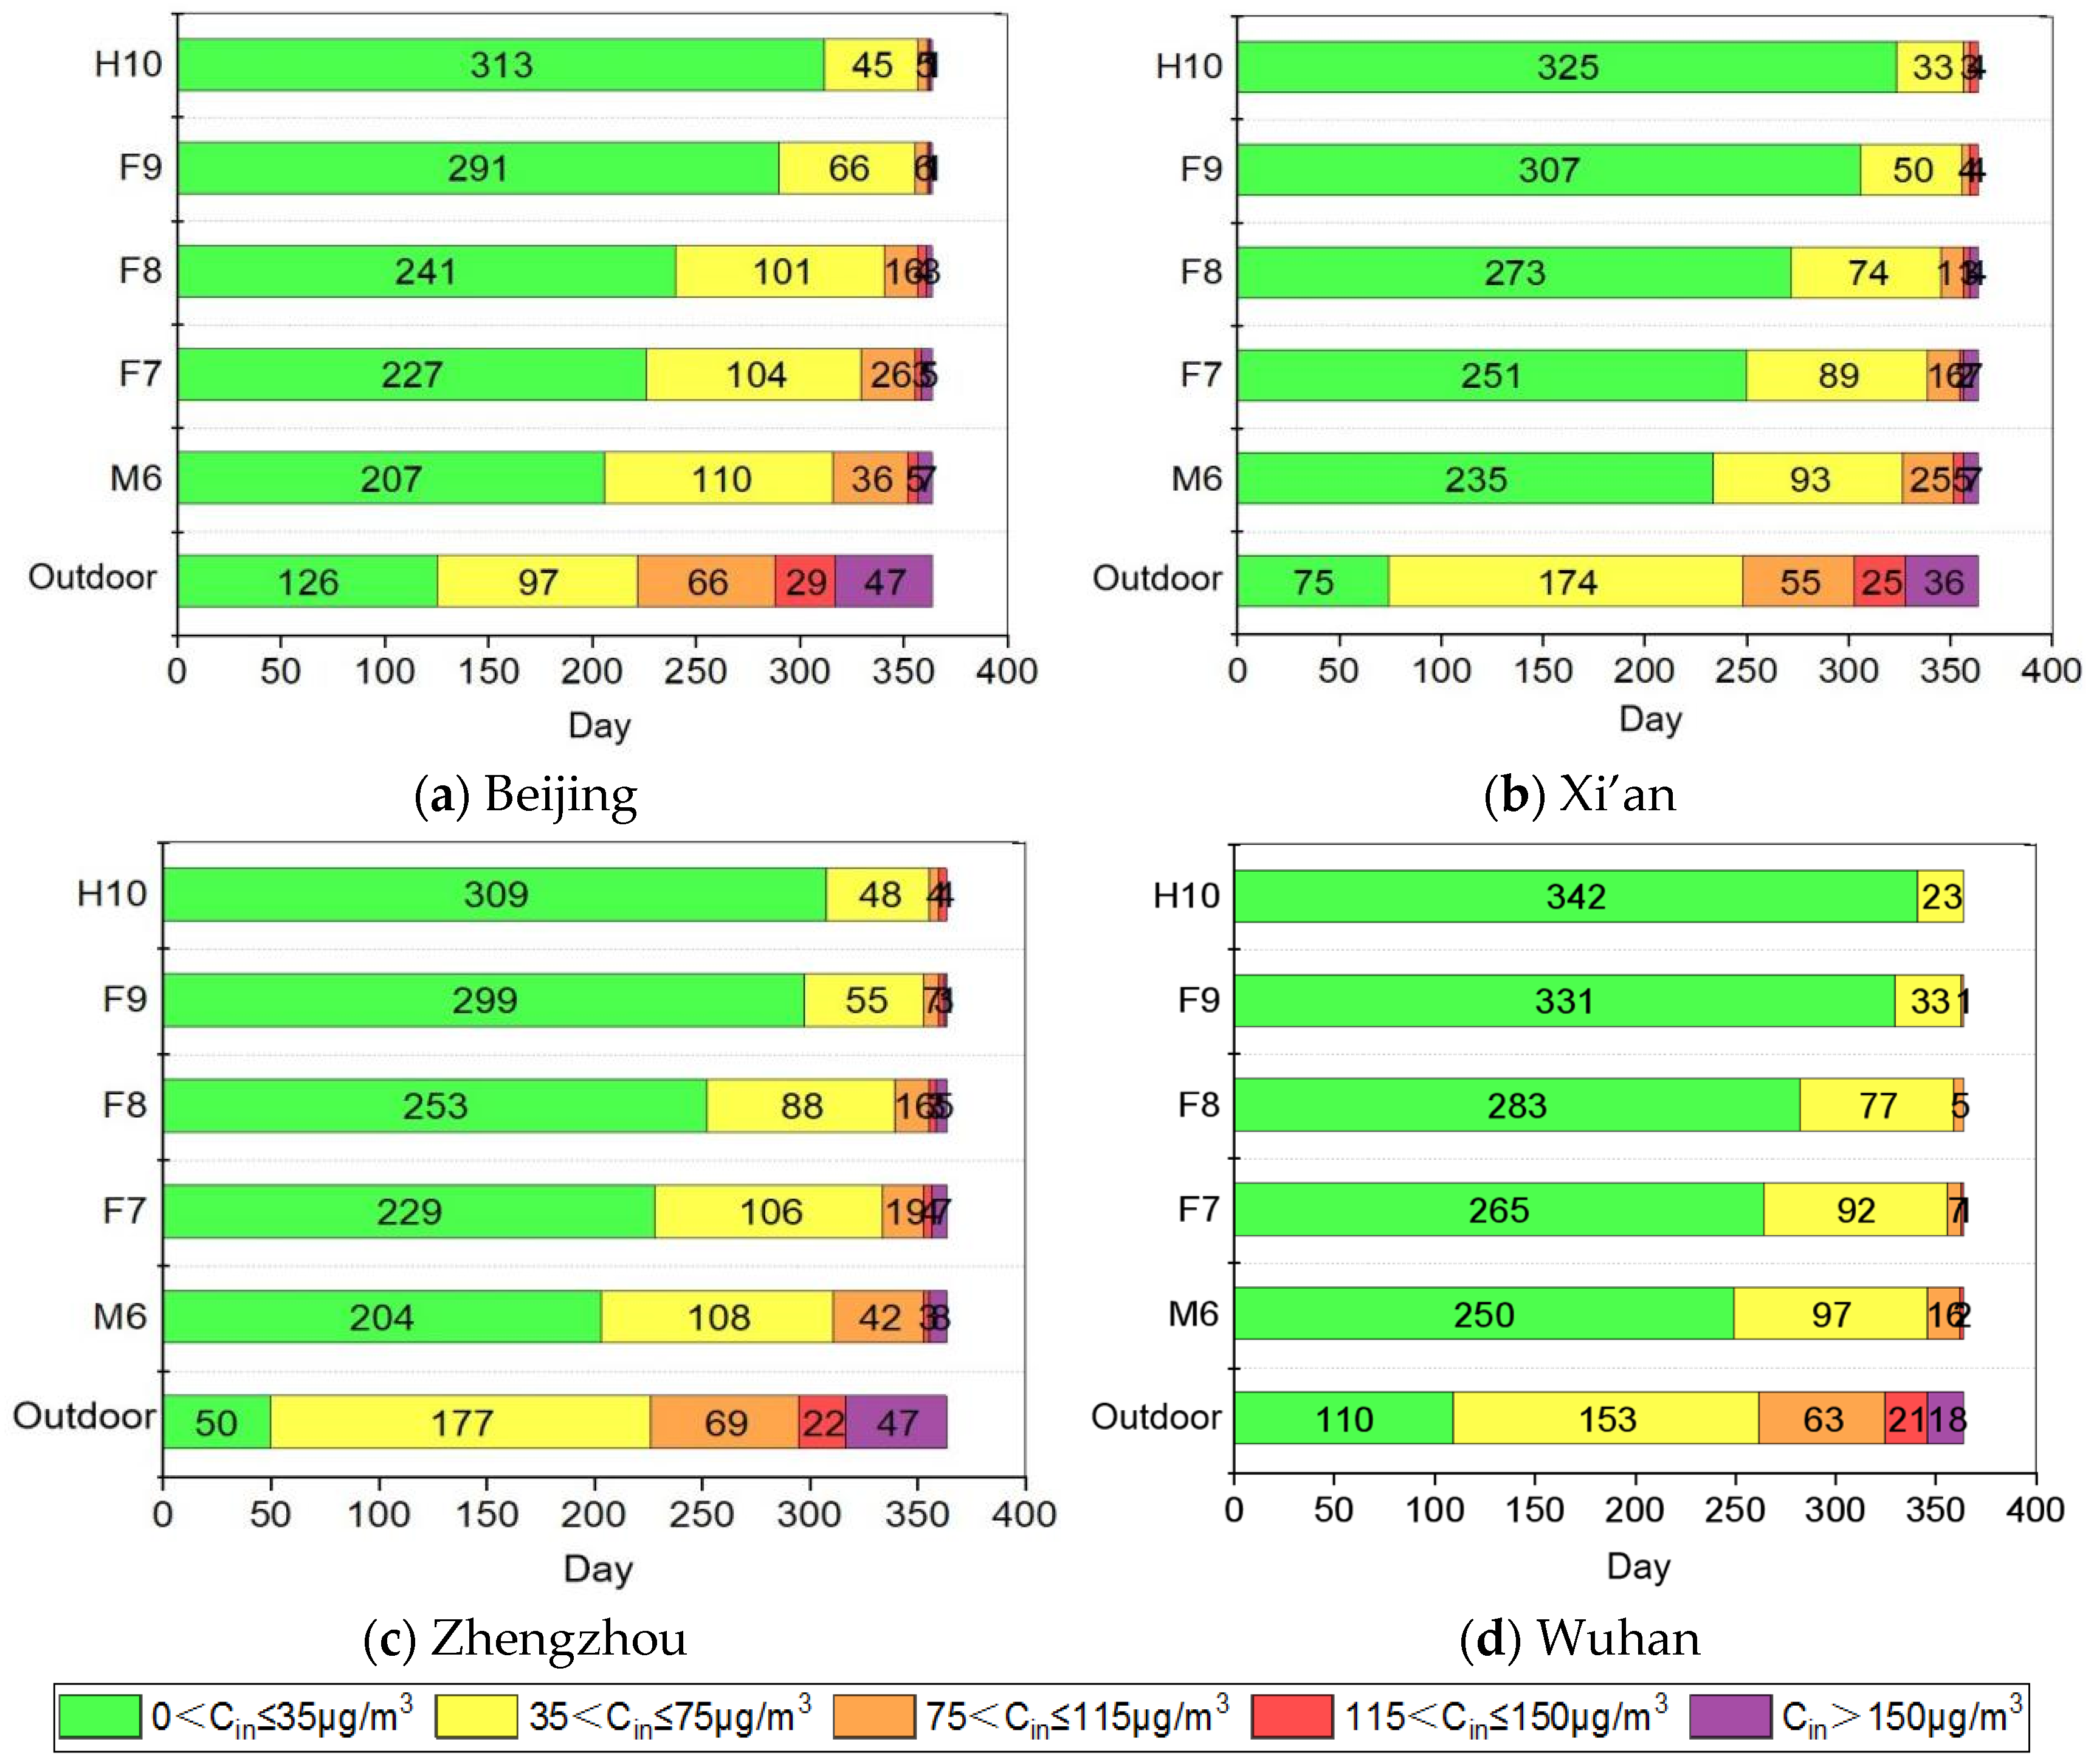
Environmental monitoring stations have demonstrated the capability to effectively monitor and collect outdoor PM2.5 concentration data. By analyzing the correlation between indoor and outdoor particulate matter concentrations, it is feasible to predict the indoor PM2.5 pollution status within ventilation systems. Based on statistical analysis of outdoor PM2.5 concentrations, Figure 4 presents the calculated number of days corresponding to different levels of filter efficiency required to maintain indoor pollution levels throughout the year.
Figure 4 illustrates the comparative analysis of outdoor PM2.5 concentrations and corresponding indoor air quality across four major Chinese cities. The data reveals that Beijing, Xi’an, Zhengzhou, and Wuhan experienced 142, 116, 138, and 102 days respectively with outdoor PM2.5 concentrations exceeding 75 μg/m3, representing 38.9%, 31.8%, 37.8%, and 27.9% of the annual days. The implementation of M6 air filters demonstrated varying effectiveness across cities, with indoor standard exceedances recorded for 48, 37, 53, and 18 days respectively. Conversely, the number of days meeting indoor standards reached 317, 328, 312, and 347 days, achieving “excellent” indoor air quality proportions of 65.3%, 71.6%, 65.4%, and 72% respectively. Enhancement of filtration efficiency yielded significant improvements. With F9 filters, the “non-guaranteed days” reduced to 8, 8, 11, and 1 day respectively, while “excellent” air quality days increased to 81.5%, 86%, 84.5%, and 90.9%. Further upgrading to H10 filters resulted in “non-guaranteed days” of 7, 7, 8, and 0 days, with “excellent” air quality proportions reaching 87.4%, 90.8%, 86.6%, and 93.7% respectively.
The analysis indicates that while the transition from M6 to F9 filters significantly reduced polluted days and enhanced air quality, subsequent improvements in filtration levels yielded diminishing returns. This suggests that for extreme outdoor pollution events, ventilation strategies should integrate both filtration efficiency and ventilation rate optimization.

5. Analysis of the Non-Steady State Model for Indoor PM2.5

5.1. The Impact of Filter Efficiency on Purification Time

Compared to steady-state conditions, there has been increasing attention on the time required for fresh air ventilators to meet indoor PM2.5 concentration control standards. To address this, Lam et al. [35] introduced the concept of Effective Cleaning Rate based on an unsteady-state model. Using the previously described calculation method, the Effective Cleaning Rate of mechanical ventilation systems can be determined as expressed in Equation (4).
R = ε f n + a + λ
Combining Equations (2) and (4), the purification time of the ventilation system can be calculated, which represents the time taken for the indoor PM2.5 concentration to decrease from the initial concentration to the indoor design concentration. The calculation formula is shown in Equation (5).
t = ln ( C i n C C 0 C ) / R
From Equation (5), it is evident that the purification time is influenced by several factors, including outdoor PM2.5 concentration, initial indoor concentration, filter efficiency, and ventilation rate. A shorter purification time indicates a stronger purification capability of the ventilation system. Based on this formula, the calculation of purification time can lead to the following three scenarios.
(1)
When Cin > C, the purification time can be calculated according to Equation (5);
(2)
When Cin = C, Cin/C is set to a value slightly larger than 1. When it is taken as 1.01, it can be considered that the PM2.5 concentration reaches a stable value [30], and the purification time is calculated according to Equation (5);
(3)
When Cin < C, Equation (5) is meaningless, indicating that the indoor PM2.5 concentration exceeds the standard. At this time, the filter efficiency should be readjusted until it conforms to the above two situations.
Considering a scenario where the initial indoor PM2.5 concentration equal to the outdoor levels, with a mechanical ventilation air change rate of 1 h−1 and an infiltration air change rate of 0.3 h−1, Figure 5 depicts the influence of different filter efficiencies on the purification time as the outdoor PM2.5 concentration ranges from 0 to 350 μg/m3.
Figure 5 demonstrates a positive correlation between outdoor PM2.5 concentration and purification time under constant filtration efficiency conditions. At an outdoor PM2.5 concentration of 150 μg/m3, the stabilized indoor PM2.5 concentrations for M6, F7, F8, F9, H10, and M6 + H10 filters were measured at 78, 69, 61, 44, 38, and 34 μg/m3 respectively. When targeting an indoor PM2.5 concentration of 75 μg/m3, due to the relatively low filtration efficiency of the M6 filter, the purification time obviously does not meet the requirements, while other filters achieved the target in 108, 74, 50, 46, and 43 min respectively. Notably, systems equipped with F7 and F8 filters showed limited purification capacity, failing to promptly achieve the desired indoor air quality, thereby necessitating enhanced filtration efficiency to reduce purification duration.
Under a 60-min purification time constraint, the maximum allowable outdoor PM2.5 concentrations for the aforementioned filters were determined to be 120, 130, 140, 163, 173, and 182 μg/m3 respectively, corresponding to moderate (115 < Cout ≤ 150 μg/m3) and severe pollution levels (150 < Cout ≤ 250 μg/m3). During extreme pollution events (Cout > 250 μg/m3), purification times increase substantially. For instance, in Beijing, Xi’an, and Zhengzhou, fresh air systems with F9 filters struggle to maintain safe indoor PM2.5 levels for approximately 10 days annually, with a minimum outdoor concentration of 254 μg/m3 requiring 6.8 h for purification. This duration can be significantly reduced to 2.1 h by implementing H10 level filters, this demonstrates that the purification time of mechanical ventilation systems is significantly reduced with the upgrade of filter levels. In periods of severe outdoor pollution, even the use of medium and high-efficiency filters may not adequately solve the problem of indoor PM2.5 concentration. Under these circumstances, it is essential to investigate indoor PM2.5 control strategies in conjunction with ventilation rates.

5.2. The Impact of Ventilation Rate on Purification Time

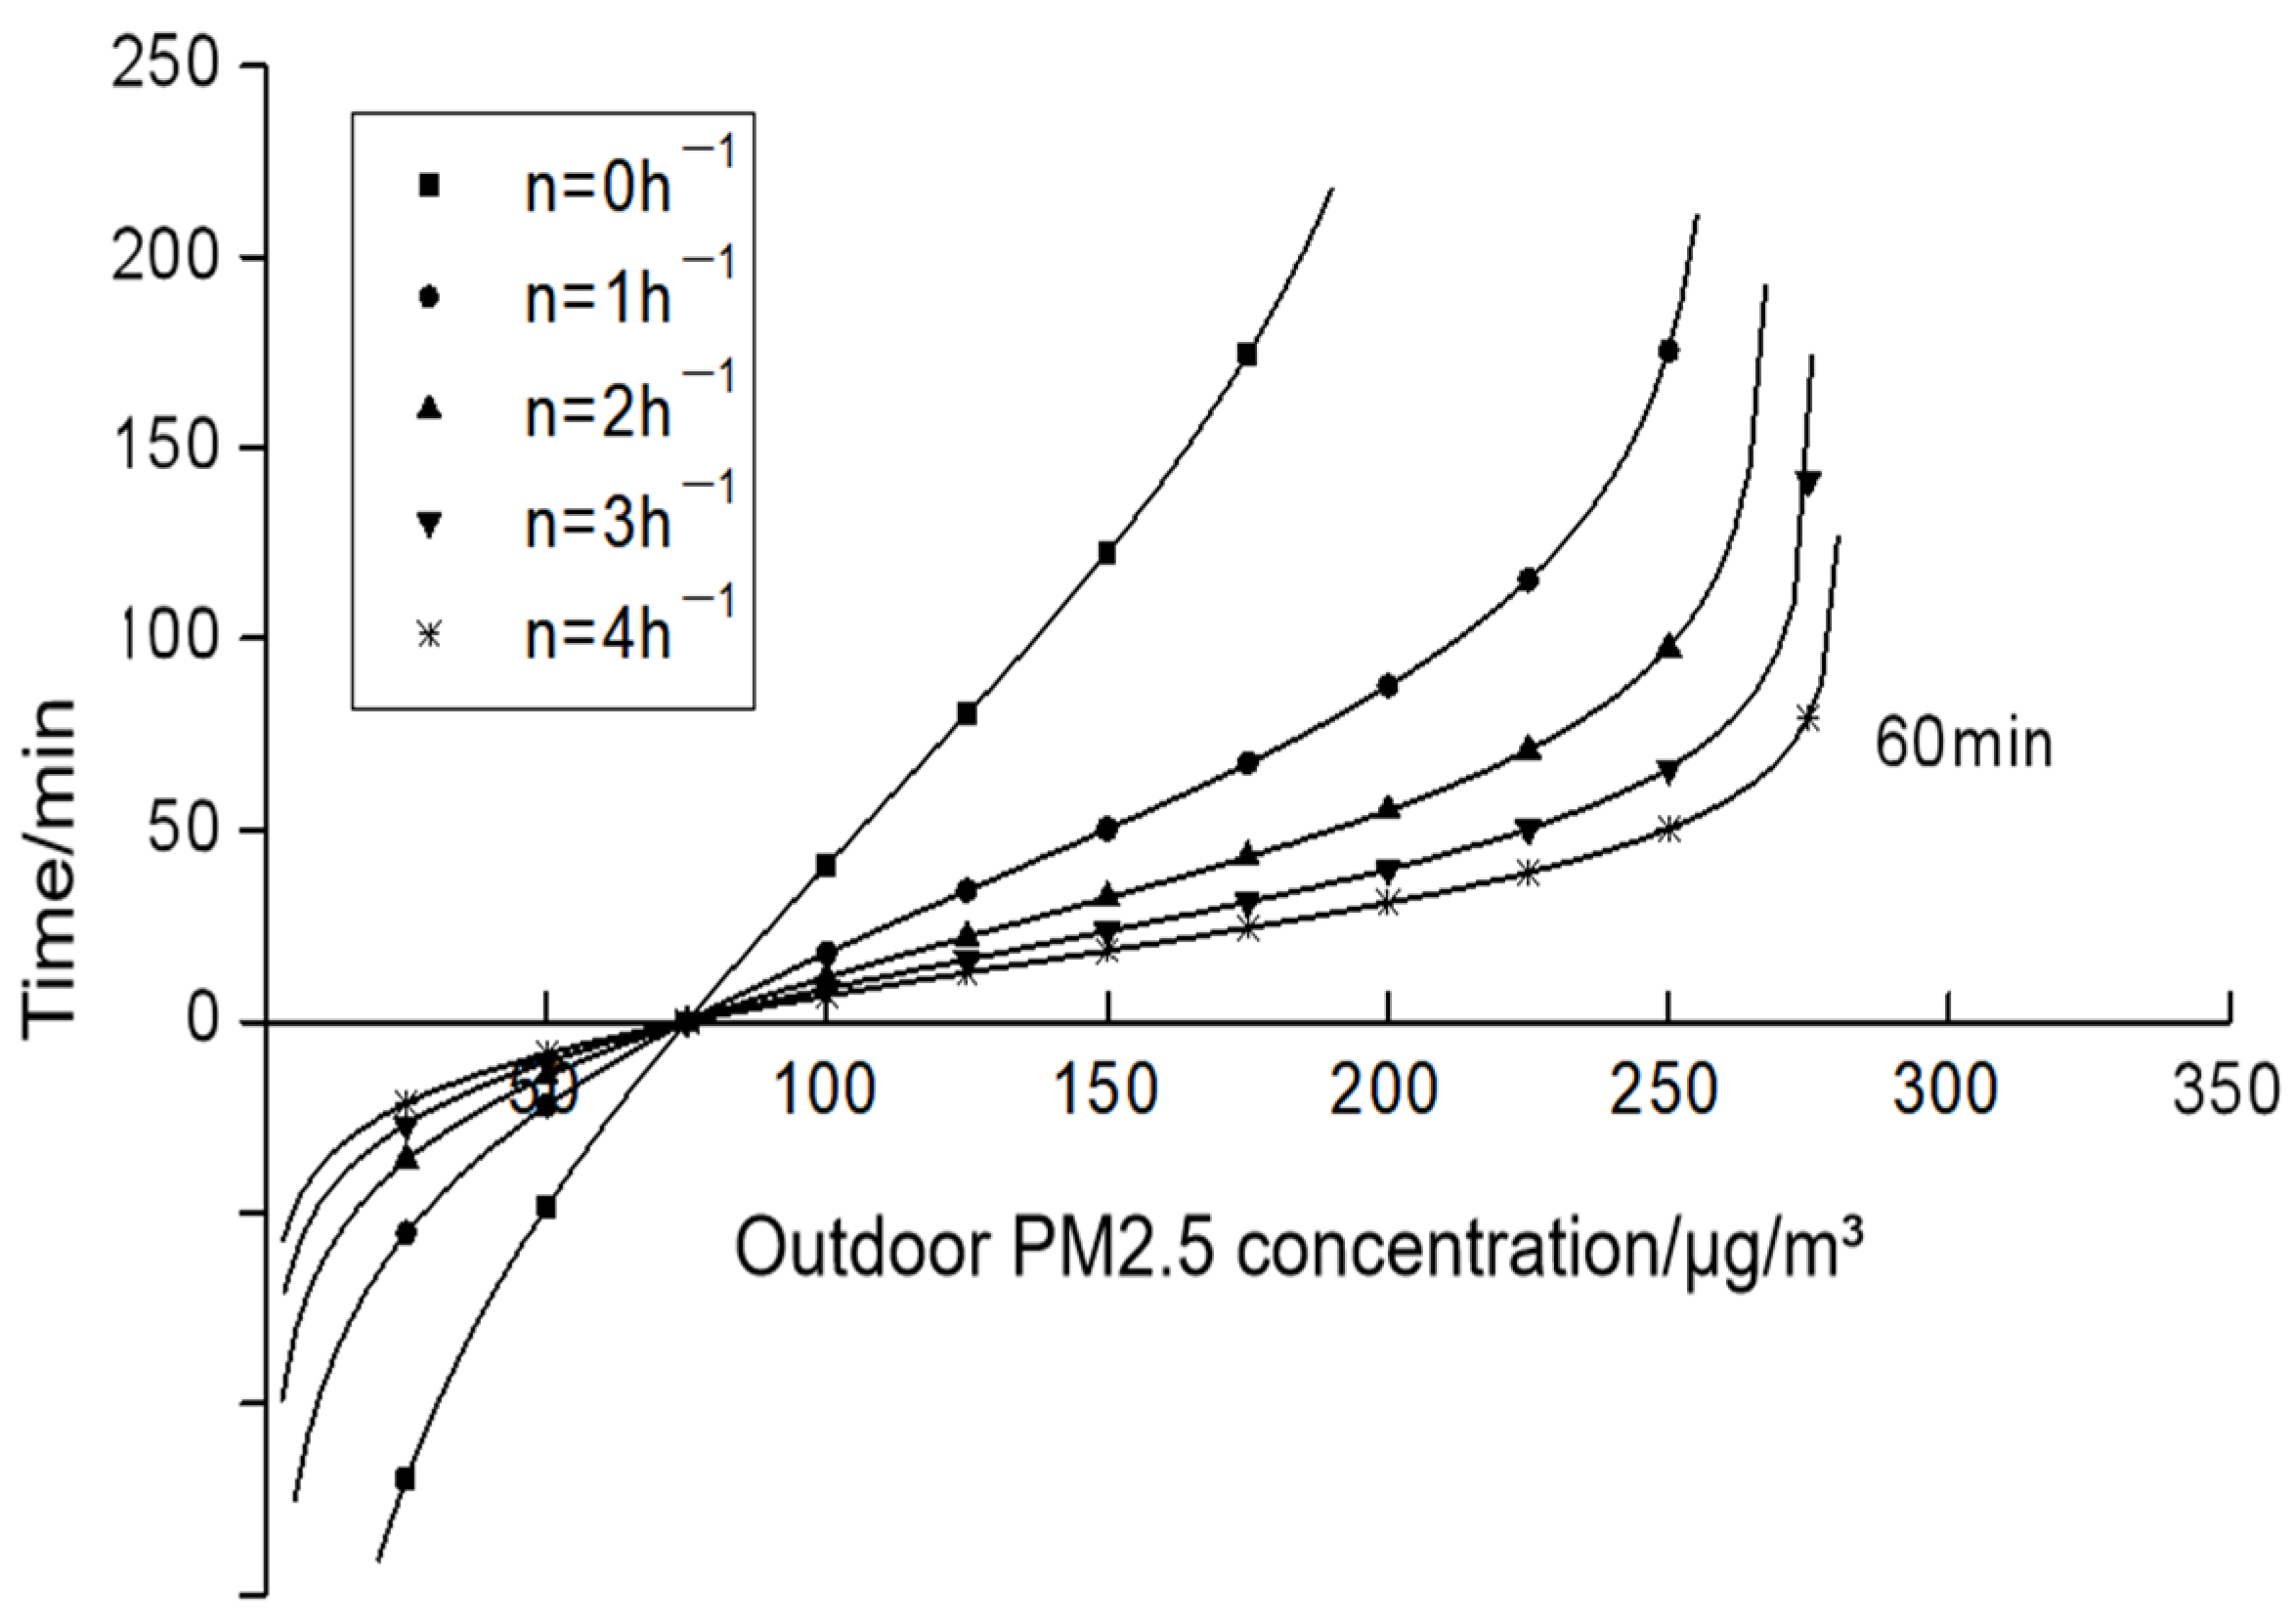
Xu et al. [36] investigated the influence of ventilation volume and filtration efficiency on the steady-state concentration of indoor particulate matter through the application of the mass balance equation. Their findings revealed that increasing the ventilation volume has a limited impact on reducing indoor particle concentrations. However, since this model is based on steady-state conditions, there is a notable gap in research regarding the effects of various parameters under unsteady-state conditions. To further explore the impact of mechanical ventilation volume on the purification efficiency of ventilation systems, this study takes the F9 filter as an example and calculates the purification time corresponding to air exchange rates ranging from 0 to 4 h−1 and outdoor PM2.5 concentrations ranging from 0 to 350 μg/m3. Figure 6 presents the calculation results, with the horizontal axis representing the outdoor PM2.5 concentration and the vertical axis indicating the purification time.
As illustrated in Figure 6, when the outdoor PM2.5 concentration is 150 μg/m3, the purification times corresponding to air exchange rates of 1, 2, 3, and 4 h−1 are 50, 32, 23, and 19 min, respectively. These results demonstrate that, under fixed filtration efficiency and outdoor PM2.5 concentration, the purification time of the ventilation system decreases as the air exchange rate increases. For instance, when the outdoor PM2.5 concentration reaches 250 μg/m3, the purification time at an air exchange rate of 1 h−1 extends to 175 min, highlighting a significant limitation in purification capability. To achieve a target purification time of 60 min, the air exchange rate must be increased to 4 h−1. This study reveals a notable divergence from the steady-state calculations reported by Xu et al. [37]. The unsteady-state model of the ventilation system indicates that increasing the ventilation volume can enhance the PM2.5 removal capacity. For fresh air systems equipped with F9 or higher-grade filters, the required purification time can be achieved by increasing the ventilation rate, particularly during periods of severe outdoor pollution. By adjusting the ventilation volume, fluctuations in outdoor PM2.5 concentrations can be effectively managed while maintaining consistent filtration efficiency. For example, if the target purification time is set at 60 min, the corresponding outdoor PM2.5 concentration limits for air exchange rates of 1, 2, 3, and 4 h−1 are 163, 209, 242, and 262 μg/m3, respectively. This suggests that the mechanical ventilation system can handle increasingly severe pollution levels as the ventilation volume is raised. Table 2 provides a comparative analysis of the number of non-guaranteed days for the steady-state and unsteady-state models of ventilation systems in Beijing, Xi’an, Zhengzhou, and Wuhan.
Table 2 reveals that maintaining a constant air exchange rate while improving the filter grade can markedly decrease the number of days with indoor pollution. Taking Beijing as an example, at a ventilation air exchange rate of 1 h−1, the steady-state and transient models with F8 filters report 24 and 52 non-guaranteed days, respectively, whereas those with F9 filters report 8 and 34 days. Upgrading from F8 to F9 filters significantly reduces the number of non-guaranteed days; however, further enhancements in filter grade have a negligible impact on this reduction. Variations in the air exchange rate minimally affect the steady-state model but significantly influence the transient model. Increasing the air exchange rate from 1 h−1 to 2 h−1 results in a substantial drop in non-guaranteed days in Beijing, Xi’an, and Zhengzhou. For F8 filters, the reduction rates are 15%, 30%, and 30%, respectively, and for F9 filters, they are 53%, 43%, and 57%. The effect of further increasing the ventilation rate diminishes, with H10 filters showing reduction rates of 66%, 52%, and 60%. In the non-steady-state model, maintaining constant filter efficiency while increasing fresh air volume can reduce indoor pollution days; however, the steady-state model yields opposite results. High outdoor PM2.5 concentrations can exacerbate indoor particle pollution when the ventilation rate is increased. Overall, adjusting fresh air volume in response to outdoor PM2.5 fluctuations can control indoor PM2.5 concentrations. For Beijing, Xi’an, and Zhengzhou, H10 filters result in 10, 10, and 11 non-guaranteed days, respectively, while F8 filters in Wuhan result in 12 days, achieving a 97% indoor air quality guarantee rate. Increasing fresh air volume in systems with medium and high-efficiency filters can reduce indoor particulate concentration, but during severe outdoor pollution, indoor PM2.5 levels may still exceed standards. In extreme weather conditions, increasing fresh air volume may compromise thermal comfort and increase air conditioning energy consumption. Air cleaners can be used alongside PM2.5 control measures to address varying levels of outdoor pollution.

5.3. The Impact of Initial Indoor PM2.5 Concentration on Purification Time

Influenced by indoor pollution sources and varying ventilation rates, the initial indoor PM2.5 concentration often deviates significantly from outdoor levels. To address this discrepancy, Jamriska et al. [12] conducted a comprehensive analysis of indoor PM2.5 concentrations under typical environmental conditions. Their findings, as presented in Table 3, demonstrate the comparative data between outdoor PM2.5 concentrations and their corresponding initial indoor counterparts.
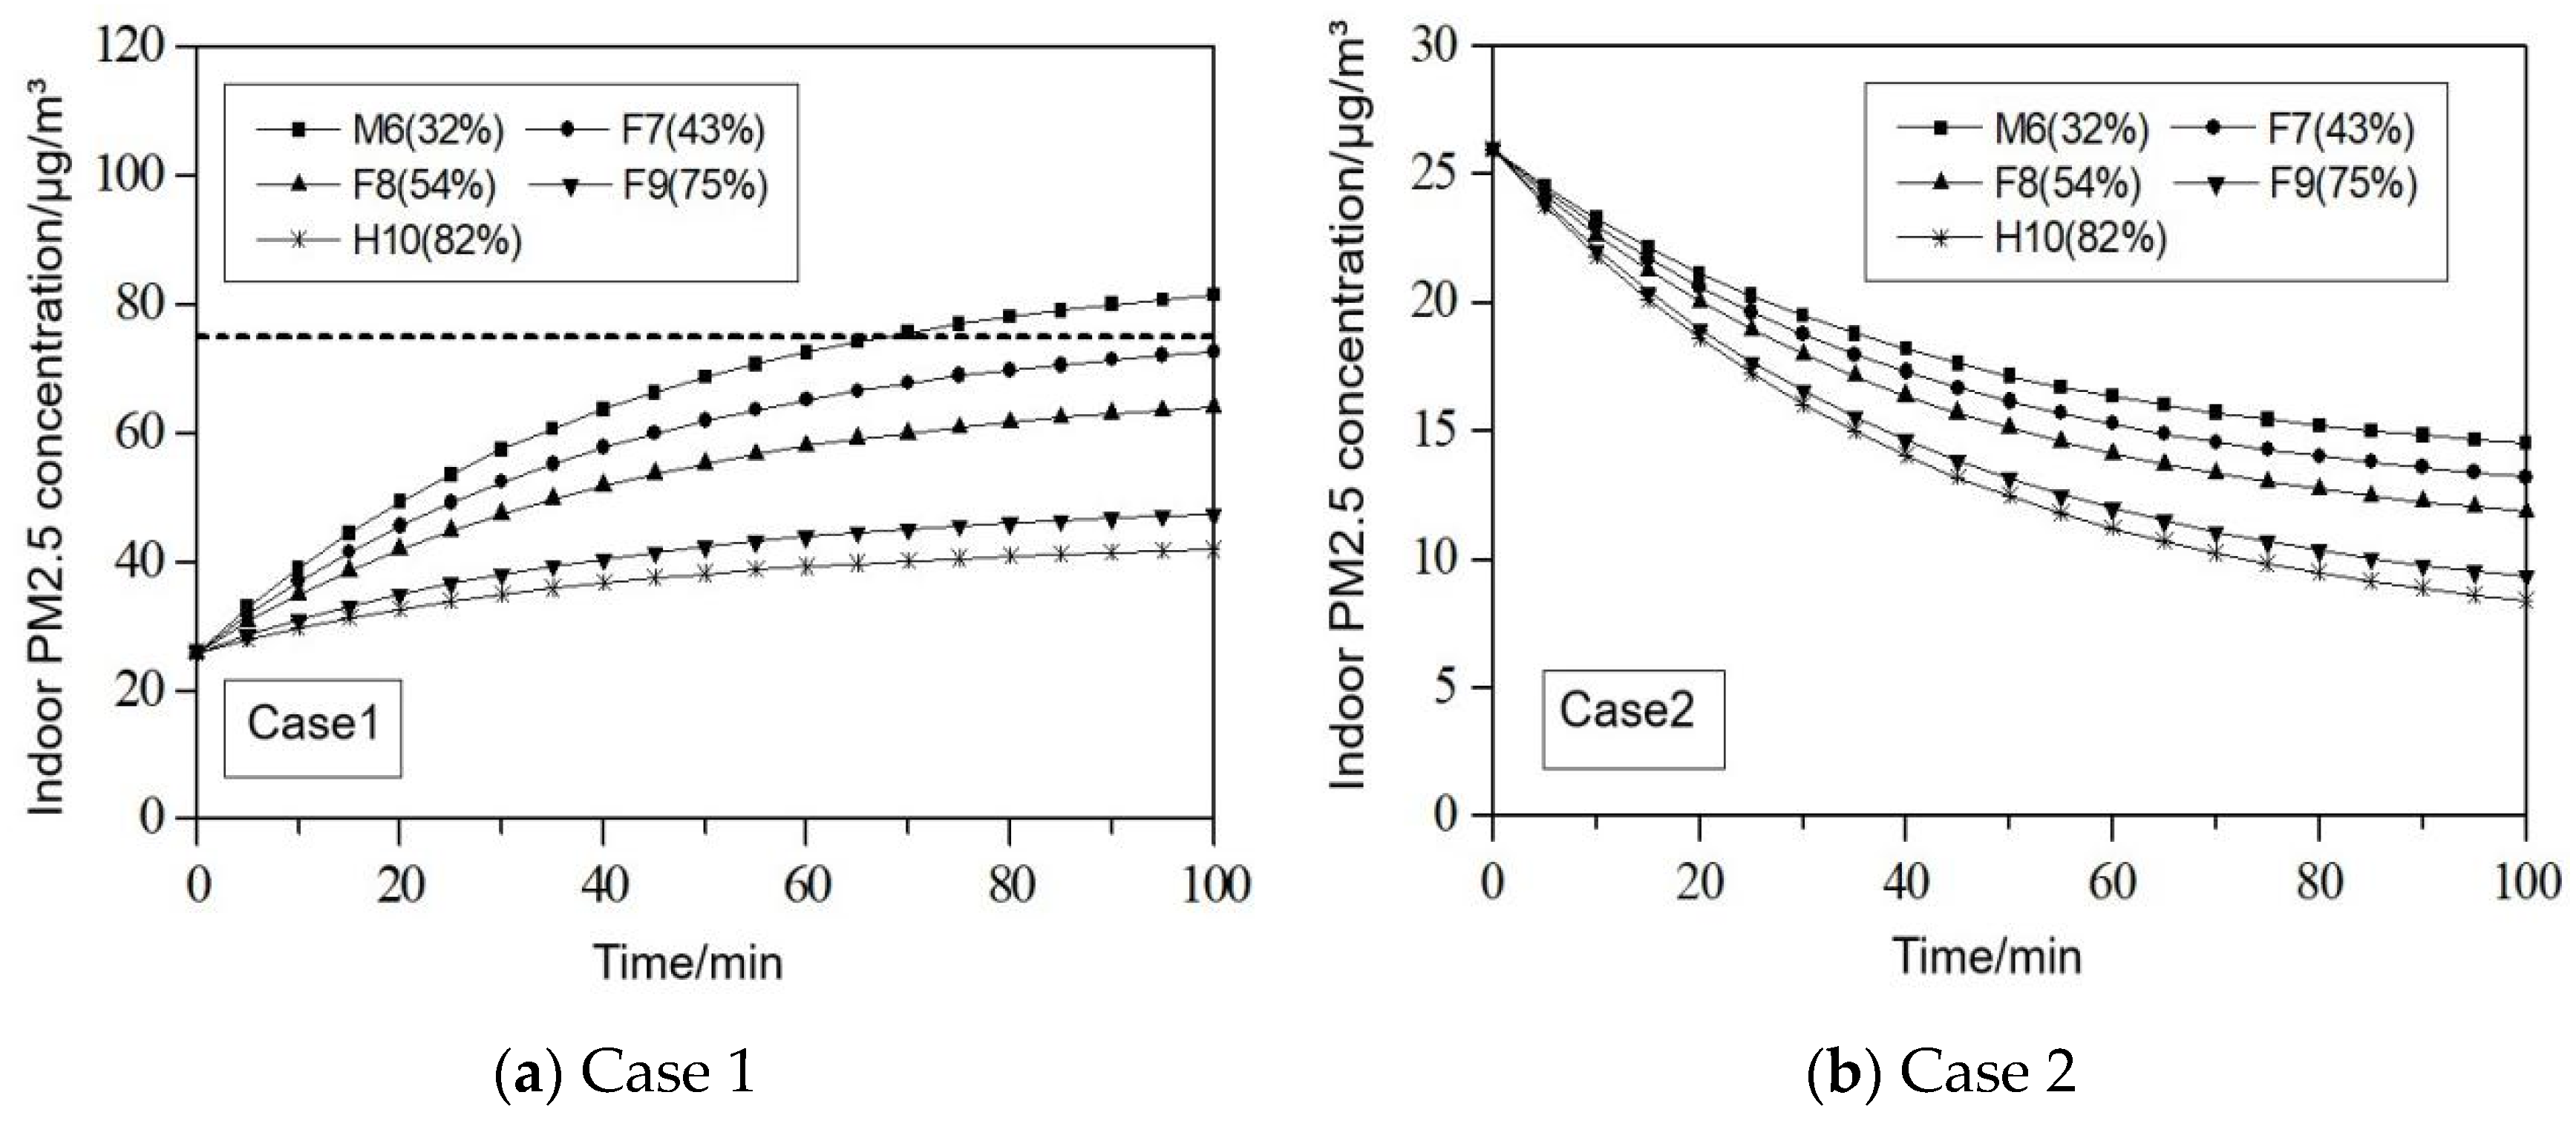
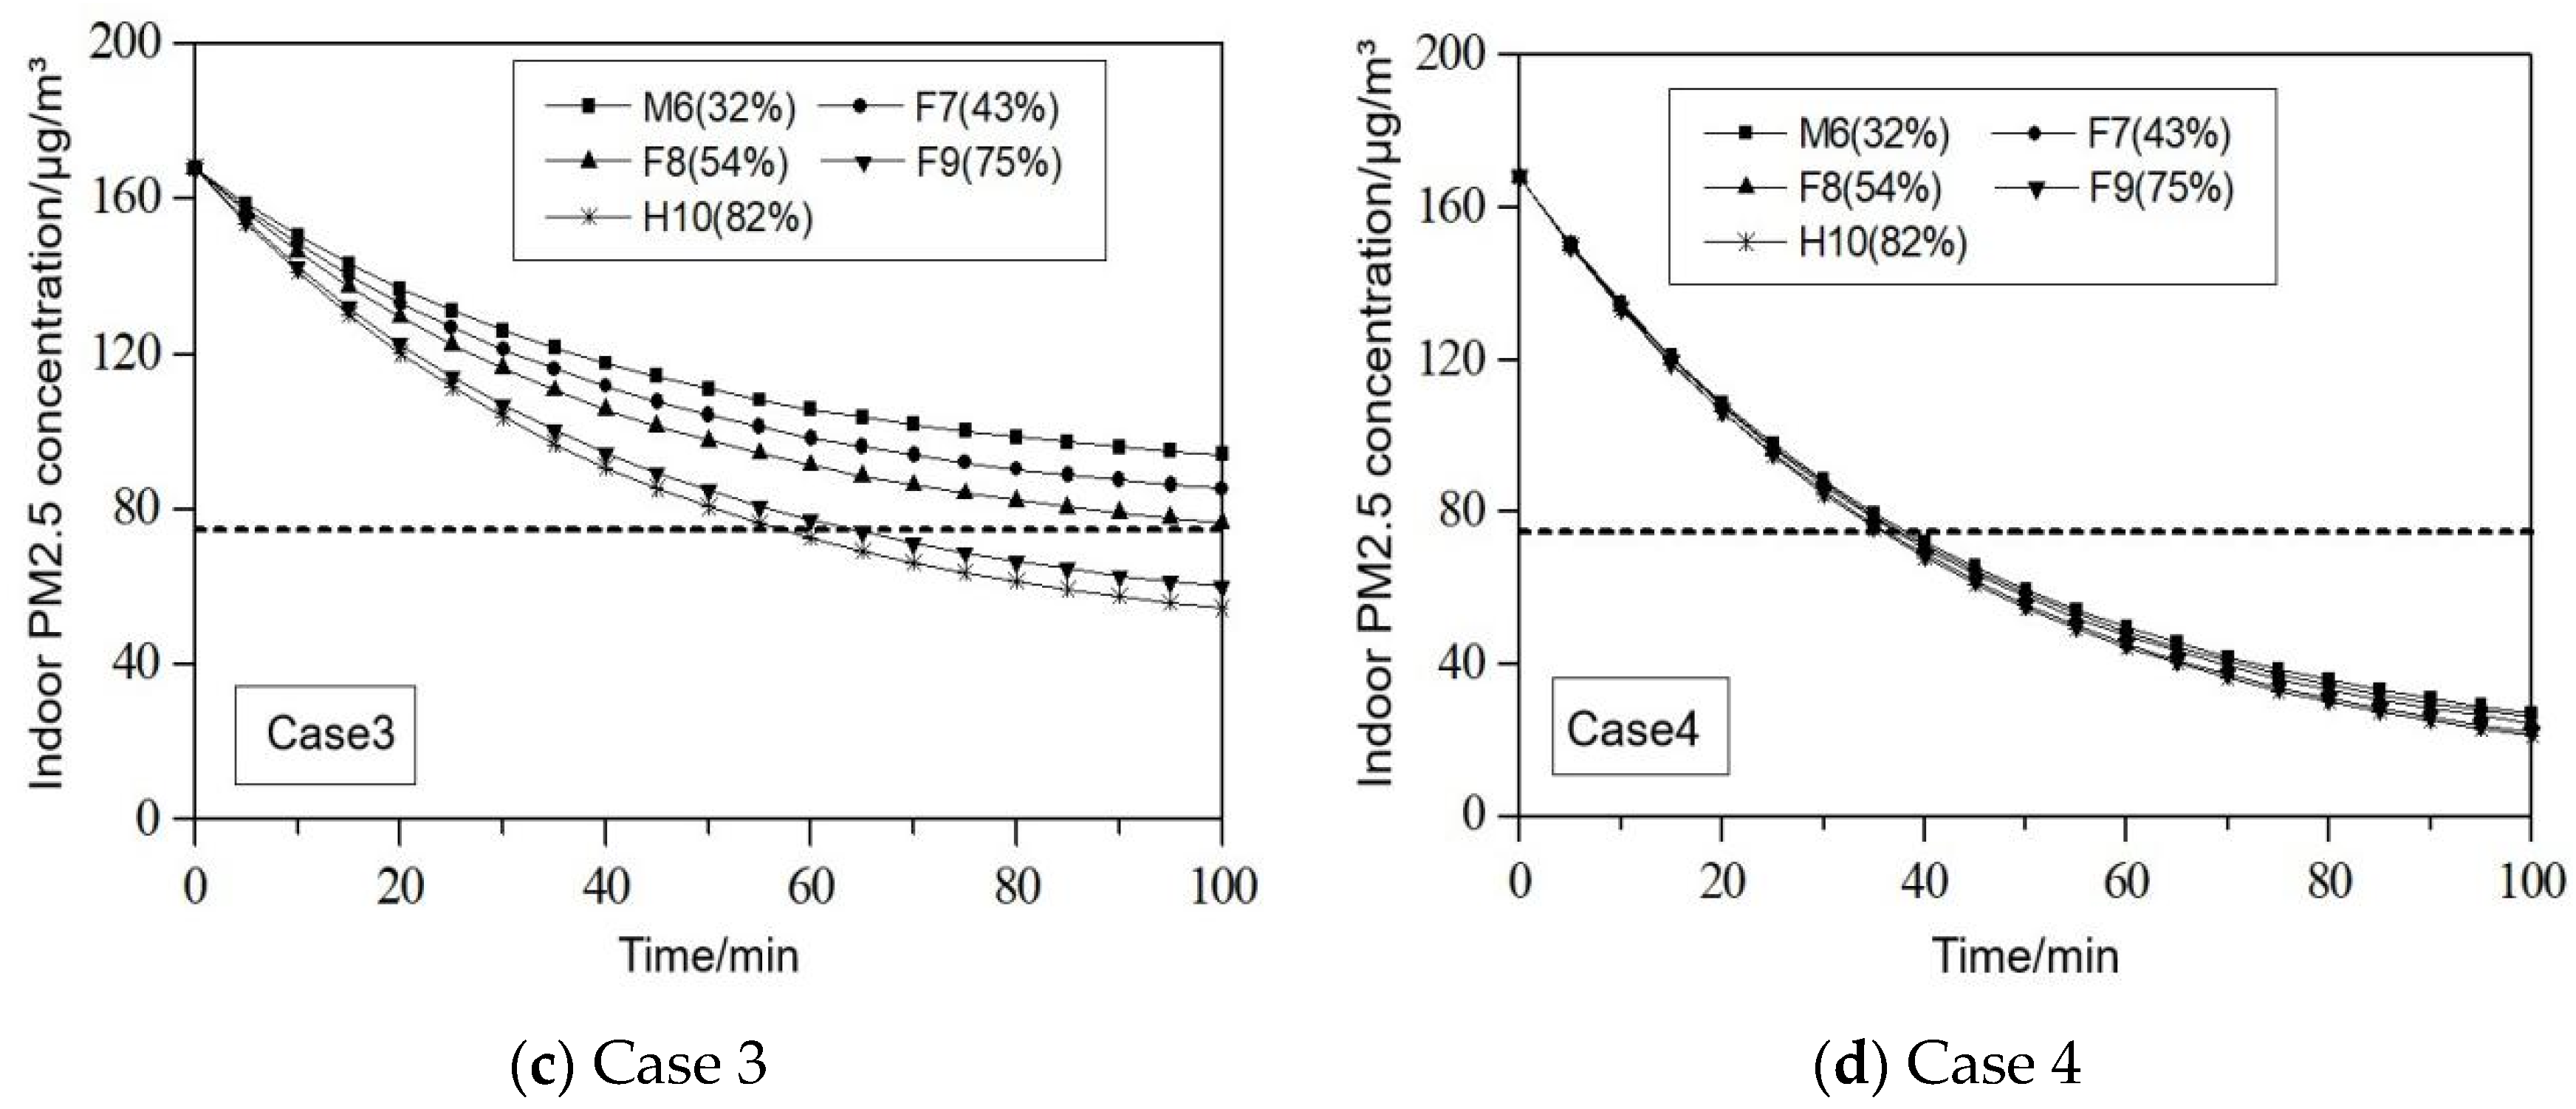
Case 1 (Cout > C0) typically arises in environments devoid of indoor pollution sources but subjected to severe outdoor pollution. Cases 2 and 3 (Cout = C0) are commonly observed in spaces with natural ventilation or mechanical ventilation systems lacking filtration. Conversely, Case 4 (Cout < C0) represents the inverse scenario of Case 1, often occurring in households with low outdoor PM2.5 concentrations but significant indoor pollution sources such as smoking or cooking. Based on the above operational conditions, we further investigate the influence of various filter grades on the efficacy of indoor PM2.5 removal and the duration required for purification. The findings from these calculations are illustrated in Figure 7.
Figure 7a shows that in the absence of indoor pollution sources but under severe outdoor PM2.5 pollution, the indoor PM2.5 concentration gradually escalates due to the fresh air filter’s inadequacy in effectively filtering outdoor particles. The steady-state indoor PM2.5 concentrations for M6, F7, F8, F9, and H10 filters are 86.9, 77.3, 67.8, 49.5, and 43.4 μg/m3, respectively, marking increases of 3.34, 2.97, 2.61, 1.90, and 1.67 times the initial concentration. This period sees mechanical ventilation introducing additional outdoor PM2.5, thereby elevating indoor PM2.5 levels. Figure 7b depicts a scenario where the outdoor PM2.5 concentration is the same as the indoor initial concentration; natural ventilation through opening windows can improve indoor air quality when outdoor PM2.5 concentrations are low and there is no indoor pollution source. Figure 7c reveals that during severe outdoor pollution, indoor PM2.5 concentrations across various filter levels in mechanical ventilation exhibit a declining trend, albeit at differing decay rates. The PM2.5 purification capacity of a fresh air system equipped with an F8 filter is notably insufficient, reducing indoor PM2.5 concentration from an initial 168 μg/m3 to 75 μg/m3 after 108 min of operation. Enhancing the filter level to F9 and H10 reduces purification times to 64 and 57 min, respectively. Figure 7d demonstrates the scenario of low outdoor PM2.5 concentrations with indoor pollution; steady-state indoor PM2.5 concentrations with M6 to H10 filters are 13.4, 12, 10.5, 7.7, and 6.7 μg/m3, respectively, with each filter requiring approximately 35 min for purification. The indoor-originated nature of pollution reduces the influence of mechanical ventilation’s temporal patterns on indoor PM2.5 concentrations. Under these circumstances, natural ventilation through window opening serves as an effective strategy for diluting indoor PM2.5 levels, while ensuring the maintenance of indoor thermal comfort conditions.

6. Non-Steady State Control of Indoor PM2.5

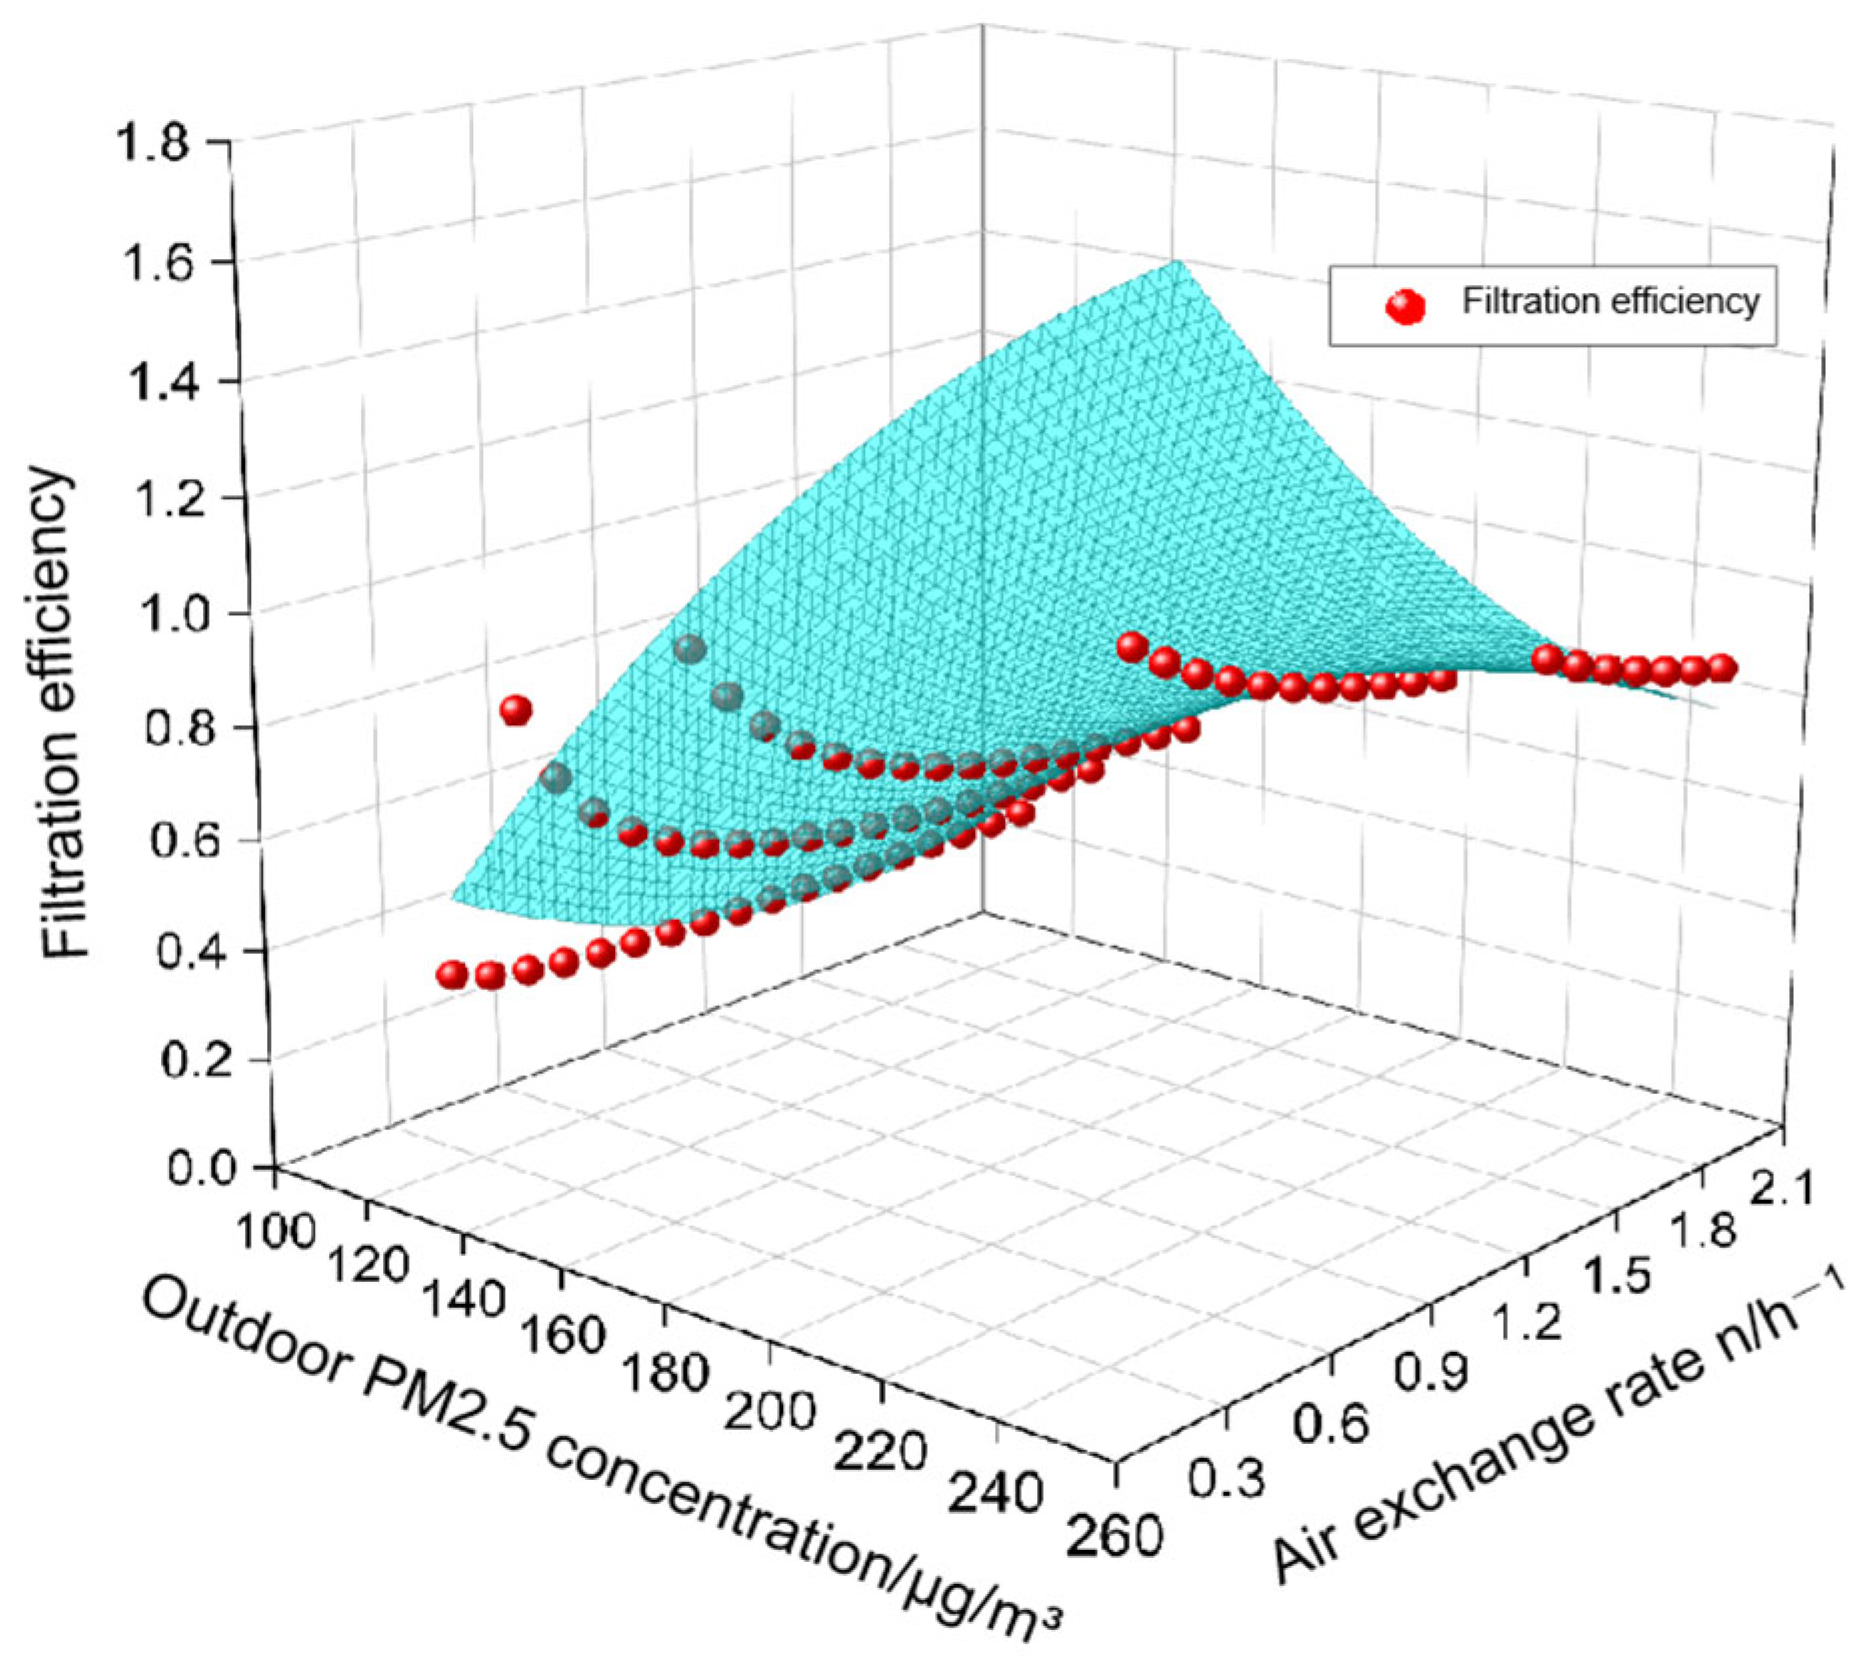
By developing a non-steady-state model of indoor PM2.5 dynamics within ventilation and purification systems, a dynamic control strategy for fresh air systems is proposed, integrating real-time outdoor PM2.5 concentrations and ventilation air exchange rates. Assuming a purification period of 60 min and a target indoor PM2.5 concentration of 75 μg/m3, Figure 8 illustrates the calculated filtration efficiencies of the ventilation and purification system.
Based on the above calculation results, an empirical relationship between the filtration efficiency of the ventilation system and outdoor PM2.5 concentration, as well as ventilation air exchange rates is derived, as shown in Equation (6).
z = e + a * x + b * y + c * x 2 + d * y 2 + f * x * y
Calculation results: x is the outdoor PM2.5 concentration, μg/m3; y is the mechanical ventilation air exchange rate, h−1; z is the filter efficiency. (Parameter values: e = −1.6, a = 0.023, b = −0.1, c= −3.4 × 10⁻⁵, d = 0.18, f = −0.0037, R2 = 0.95).
When the fresh air filter is selected, the ventilation air exchange rate can be dynamically adjusted using the empirical Equation (6) to address fluctuations in outdoor PM2.5 concentrations. For instance, in a fresh air system equipped with H10 filters, when the outdoor PM2.5 concentration is 150 μg/m3, the corresponding ventilation air exchange rate is 0.45 h−1. If the outdoor PM2.5 concentration rises to 176 μg/m3, the air exchange rate should be increased to 1 h−1. In cases of severe outdoor pollution, where PM2.5 concentrations reach 250 μg/m3, the air exchange rate must be further elevated to 1.65 h−1 to ensure the indoor PM2.5 concentration remains within acceptable limits.

7. Conclusions

To address issues such as the relatively insufficient stability of indoor PM2.5 caused by the intermittent operation of mechanical ventilation systems and the fluctuation of outdoor PM2.5 concentrations, the non-uniform mixing model was used to analyze the impact of factors such as filtration efficiency and ventilation rate on the temporal characteristics of ventilation systems. Taking a specific residential building as the research object, and under the specific scenario of high outdoor PM2.5 concentrations, calculations for filter design and selection were conducted for mechanically ventilated rooms in four Chinese cities (e.g., Beijing, Xi’an, Zhengzhou, and Wuhan) based on the unsteady-state model. The conclusions are as follows.
(1)
When calculated using the steady-state model, implementation of M6 air filters can result in the number of days meeting the indoor standards reaching 317, 328, 312, and 347, achieving “excellent” indoor air quality proportions of 65.3%, 71.6%, 65.4%, and 72% respectively. With F9 filters, the “non-guaranteed days” reduced to 8, 8, 11, and 1 day respectively, while “excellent” air quality days increased to 81.5%, 86%, 84.5%, and 90.9%. Further upgrading to H10 filters resulted in “non-guaranteed days” of 7, 7, 8, and 0 days, with “excellent” air quality proportions reaching 87.4%, 90.8%, 86.6%, and 93.7% respectively.
(2)
The increase in the air exchange rate of mechanical ventilation systems exhibits a limited effect on steady-state calculations but significantly influences unsteady-state models. When the air exchange rate is elevated from 1 h−1 to 2 h−1, the number of indoor non-guaranteed days in Beijing, Xi’an, and Zhengzhou decreases markedly. Specifically, for F9 filters, the reduction rates are 53%, 43%, and 57%, respectively; for H10 filters, the rates are 66%, 52%, and 60%. Consequently, the number of indoor non-guaranteed days in Beijing, Xi’an, and Zhengzhou is reduced to 10, 10, and 11 days, respectively. In Wuhan, the number of indoor non-guaranteed days using F8 filters is 12 days, achieving an indoor air quality assurance rate of 97%.
(3)
When the fresh air system is equipped with H10 filters and the outdoor PM2.5 concentration is 150 μg/m3, the corresponding ventilation air exchange rate is 0.45 h−1. However, when the mechanical ventilation air exchange rate is increased to 1 h−1, the corresponding outdoor PM2.5 concentration rises to 176 μg/m3. In cases of severe outdoor pollution, where the outdoor PM2.5 concentration reaches 250 μg/m3, the air exchange rate must be further increased to 1.65 h−1 to ensure compliance with indoor PM2.5 concentration control requirements.
This study utilizes a non-uniform mixing model to control indoor PM2.5 concentration in a ventilation filtration system by integrating ventilation rates, filtration efficiency, and outdoor PM2.5 concentrations. Future research can employ CFD simulations and experimental testing to investigate the impact of different filter combinations on the indoor particle concentration, thereby deriving more general conclusions.

Author Contributions

Conceptualization, W.X.; methodology, W.X.; writing—original draft preparation, W.X.; writing—review and editing, Y.F. and P.H.; investigation, P.S. All authors have read and agreed to the published version of the manuscript.

Funding

This research was supported by the National Key Project of the Ministry of Science and Technology, China on “Green Buildings and Building Industrialization” through Grant (No. 2016YFC0700503).

Data Availability Statement

Dataset available on request from the corresponding author.

Conflicts of Interest

The authors declare no conflicts of interest.

Nomenclature

VVolume of the house, m3
QfVolume of fresh air, m3/h
QiVolume infiltrated through the building shell, m3/h
εfNon-uniform mixing coefficient
PPenetration coefficient
KIndoor particle deposition rate, h−1
CoutConcentration of outdoor PM2.5, μg/m3
CinConcentration of indoor PM2.5, μg/m3
ηmFiltration efficiency of the air filter
C0Initial concentration of indoor PM2.5, μg/m3
nAir exchange rate of mechanical ventilation, h−1
aAir exchange rate of infiltration, h−1
CSteady-state concentration of indoor PM2.5, μg/m3
REffective cleaning rate, h−1

References

  1. Abbey, D.E.; Burchette, R.J.; Knutsen, S.F.; McDonnell, W.F.; Lebowitz, M.D.; Enright, P.L. Long-term Particulate and Other Air Pollutants and Lung Function in Nonsmokers. Am. J. Respir. Crit. Care Med. 1998, 158, 289–298. [Google Scholar] [CrossRef]
  2. Song, Y.W.; Kim, S.E.; Park, J.C. Indoor Air Pollutant (PM10,CO2) Reduction Using a Vortex Exhaust Ventilation System in a Mock-up Room. Buildings 2025, 15, 144. [Google Scholar] [CrossRef]
  3. Martins, N.R.; Da, G.G.C. Impact of Outdoor PM2.5 on Natural Ventilation Usability in California’s Nondomestic Buildings. Appl. Energy 2017, 189, 711–724. [Google Scholar] [CrossRef]
  4. Liu, L.H.; Xiang, B.; Si, P.F.; Shi, L.J. A Mathematical Model for Predicting Indoor PM2.5 Concentration Considering Uneven Mixing and Fractional Efficiency of A Filter. Indoor Built Environ. 2024, 3, 451–464. [Google Scholar] [CrossRef]
  5. Li, Y.Q.; Fan, Y.J.; Zhi, C.Q. Multi-objective Optimization of Mechanical Ventilation with The Aid of Purifiers in Two Scenarios: Regular Operation and Mitigating The Spread of Respiratory Infectious Diseases. Build. Simul. 2023, 16, 795–811. [Google Scholar] [CrossRef]
  6. Barbosa, S.; Ip, K. Perspectives of Hybrid Ventilation Strategies for Office Buildings in the UK. Energy Build. 2014, 77, 335–344. [Google Scholar]
  7. Teh, K.J.L.; Razali, H.; Lim, C.H. Field Investigation of Thermal Comfort and Indoor Air Quality Analysis Using a Multi-Zone Approach in a Tropical Hypermarket. Buildings 2025, 15, 1677. [Google Scholar] [CrossRef]
  8. Xie, W.; Fan, Y.S.; Zhang, X.; Tian, G.J.; Si, P.S. A Mathematical Model for Predicting Indoor PM2.5 Concentration under Different Ventilation Methods in Residential Buildings. Build. Serv. Eng. Res. Technol. 2020, 41, 694–708. [Google Scholar] [CrossRef]
  9. Kim, J.H.; Kim, H.G.; Yeo, M.S. Ventilation and Filtration Control Strategy Considering PM2.5, IAQ, and System Energy. Atmosphere 2020, 11, 1140. [Google Scholar] [CrossRef]
  10. Haenninen, O.O.; Palonen, J.; Tuomisto, J.T.; Tuomi, T.Y.; Seppaenen, O.; Jantunen, M.J. Reduction Potential of Urban PM2.5 Mortality Risk Using Modern Ventilation Systems in Buildings. Indoor Air 2005, 15, 246–256. [Google Scholar] [CrossRef]
  11. Kulmala, M.; Asmi, A.; Pirjola, L. Indoor Air Aerosol Model: The Effect of Outdoor Air, Filtration and Ventilation on Indoor Concentrations. Atmos. Environ. 1999, 33, 2133–2144. [Google Scholar] [CrossRef]
  12. Jamriska, M.; Morawska, L.; Ensor, D.S. Control Strategies for Sub-micrometer Particles Indoors: Model Study of Air Filtration and Ventilation. Indoor Air 2003, 13, 96–105. [Google Scholar] [CrossRef]
  13. Ben, D.T.; Waring, M.S. Impact of Natural Versus Mechanical Ventilation on Simulated Indoor Air Quality and Energy Consumption in Offices in Fourteen US Cities. Build. Environ. 2016, 104, 320–336. [Google Scholar] [CrossRef]
  14. Sawant, A.A.; Na, K.; Zhu, X.N.; Cocker, K.; Butt, S.; Song, C.; Cocker, D.R. Characterization of PM2.5 and Selected Gas-phase Compounds at Multiple Indoor and Outdoor Sites in Mira Lo, California. Atmos. Environ. 2004, 38, 6269–6278. [Google Scholar] [CrossRef]
  15. Zender-Wiercz, E. Improving The Indoor Air Quality Using The Individual Air Supply System. Int. J. Environ. Sci. Techol. 2017, 15, 689. [Google Scholar] [CrossRef]
  16. Miller, S.L.; Facciola, N.A.; Toohey, D.; Zhai, J. Ultrafine and Fine Particulate Matter Inside and Outside of Mechanically Ventilated Buildings. Int. J. Environ. Res. Public Health 2017, 14, 128. [Google Scholar] [CrossRef] [PubMed]
  17. Ruan, T.C.; Rim, D.Y. Indoor Air Pollution in Office Buildings in Mega-cities: Effects of Filtration Efficiency and Outdoor Air Ventilation Rates. Sustain. Cities Soc. 2019, 49, 101609. [Google Scholar] [CrossRef]
  18. Brent, S.; Atila, N.; Siegel, J. The Effects of Filtration on Pressure Drop and Energy Consumption in Residential HVAC Systems. HVAC&R Res. 2010, 16, 273–294. [Google Scholar] [CrossRef]
  19. Montgomery, J.F.; Green, S.I.; Rogak, S.N.; Bartlett, K. Predicting The Energy Use and Operation Cost of HVAC Air Filters. Energy Build. 2012, 47, 643–650. [Google Scholar] [CrossRef]
  20. Kim, J.H.; Yeo, M.S. Effect of Flow Rate and Filter Efficiency on Indoor PM2.5 in Ventilation and Filtration Control. Atmosphere 2020, 11, 1061. [Google Scholar] [CrossRef]
  21. Xu, W.H. Calculation Method of Air Filter Efficiency in Comfort Air Conditioning. HVAC 2001, 31, 42–44. [Google Scholar]
  22. Wang, Q.Q.; Li, G.Z.; Zhu, R.X.; Wang, J.L.; Zhao, L.; Wang, X.F.; Meng, C. Determination of PM2.5 Outdoor Design Concentration for Air Filter Design and Selection. Build. Sci. 2015, 31, 71–77. [Google Scholar]
  23. Si, P.F.; Fan, Y.S.; Li, A.G.; Rong, X.Y.; Xie, W.; Gong, R. Optimization in Selection of The Filter for Central Air Conditioning System in Public Buildings. HVAC 2011, 41, 63–66. [Google Scholar]
  24. Zhang, C.Q.; Gao, J.; Zeng, L.J.; Ye, W. Filtering Load of Outdoor PM2.5 for Buildings Based on The Concept of Filtering Concentration Days. J. Tongji Univ. 2017, 45, 1345–1351. [Google Scholar]
  25. Tu, Y.; Tu, G.B.; Wang, C. Discussion on Filtering Measures to Smog for Air Conditioning and Ventilation Systems in Public Buildings. HVAC 2020, 50, 55–63. [Google Scholar]
  26. China National Environmental Monitoring Centre. China National Urban Air Quality Real-Time Release Platform. Available online: https://www.cnemc.cn/ (accessed on 1 January 2017).
  27. GB/T 18883-2002; Standards for Indoor Air Quality. Standards Press of China: Beijing, China, 2002.
  28. GB/T 18883-2022; Standards for Indoor Air Quality. Standards Press of China: Beijing, China, 2022.
  29. JGJ/T 309-2013; The Standard of The Measurement and Evaluation for Efficiency of Building Ventilation. China Architecture & Building Press: Beijing, China, 2013.
  30. ASHRAE 62.1-2016; Ventilation for Acceptable Indoor Air Quality. American National Standards Institute: Washington, DC, USA, 2019.
  31. Xie, W. Prediction and Control of Indoor PM2.5 Concentration Under Different Ventilation Modes in Residential Buildings. Ph.D. Thesis, Xi’an University of Architecture and Technology, Xi’an, China, 2022. [Google Scholar]
  32. Fan, Y.S.; Xie, W.; Zhang, X.; Yu, J.W.; Si, P.F. Pollution Characteristics of Indoor Particle Matter at Infiltration Ventilation Building. Chin. J. Environ. Eng. 2018, 12, 1128–1134. [Google Scholar]
  33. Ministry of Ecology and Environment of the People’s Republic of China. Available online: https://www.mee.gov.cn/ (accessed on 10 March 2017).
  34. GB 50736-2012; Design Code for Heating Ventilation and Air Conditioning of Civil Buildings. China Architecture & Building Press: Beijing, China, 2012.
  35. Lam, K.S.; Chan, F.S.; Fung, W.Y.; Lui, B.S.S.; Lau, L.W.L. Achieving “Excellent” Indoor Air Quality in Commercial Offices Equipped with Air-handling Unit-respirable Suspended Particulate. Indoor Air 2006, 16, 86–97. [Google Scholar] [CrossRef]
  36. Xu, Z.L. Principles of Air Cleanliness Technology; China Building Industry Press: Beijing, China, 2016. [Google Scholar]
  37. Xu, W.H.; Han, H. Critical Filtration Efficiency and Minimum Air Changes of Comfort Air Conditioning Systems. HVAC 2002, 32, 85–88. [Google Scholar]
Figure 1. Indoor particle concentration model of fresh air system.
Buildings 15 02838 g001
Figure 2. Daily average outdoor PM2.5 concentration for the year 2017.
Buildings 15 02838 g002aBuildings 15 02838 g002b
Figure 3. Indoor PM2.5 concentration areas corresponding to different filters.
Buildings 15 02838 g003aBuildings 15 02838 g003b
Figure 4. Number of days corresponding to different pollution levels for various filter.
Buildings 15 02838 g004
Figure 5. The impact of filter efficiency on purification time.
Buildings 15 02838 g005
Figure 6. The impact of ventilation exchange rate on the purification time.
Buildings 15 02838 g006
Figure 7. Indoor PM2.5 concentration changes with different levels of filters.
Buildings 15 02838 g007aBuildings 15 02838 g007b
Figure 8. Calculation results of the filtration efficiency of the ventilation system.
Buildings 15 02838 g008
Table 1. Domestic and international indoor PM2.5 control standards.
Target PollutantChinaUnited StatesEuropeCanada
PM2.575 μg/m3 [24 h]15 μg/m3 [1 y]10 μg/m3 [1 y]100 μg/m3 [1 h]
65 μg/m3 [24 h]25 μg/m3 [24 h]40 μg/m3 [L]
Note: [24 h] Daily average value, [1 y] Annual average value, [1 h] Hourly average value, [L] Long-term value.
Table 2. Number of non-guaranteed days for steady-state and non-steady-state models.
CityFilter LevelCalculation ModelAir Exchange Rate
1 h−12 h−13 h−14 h−1
BeijingF8Steady-state24262830
Non-steady-state52443534
F9Steady-state8777
Non-steady-state341697
H10Steady-state7633
Non-steady-state291076
Xi’anF8Steady-state17192021
Non-steady-state40282523
F9Steady-state8887
Non-steady-state2313106
H10Steady-state7766
Non-steady-state211077
ZhengzhouF8Steady-state24262727
Non-steady-state56393029
F9Steady-state111098
Non-steady-state30131110
H10Steady-state8765
Non-steady-state271187
WuhanF8Steady-state5556
Non-steady-state211287
F9Steady-state1000
Non-steady-state8210
H10Steady-state0000
Non-steady-state5100
Table 3. Outdoor PM2.5 concentration and initial indoor PM2.5 concentration.
Working ConditionOutdoor PM2.5 Concentration Cout (μg/m3)Initial Indoor PM2.5 Concentration C0 (μg/m3)
Case 116826
Case 22626
Case 3168168
Case 426168
Disclaimer/Publisher’s Note: The statements, opinions and data contained in all publications are solely those of the individual author(s) and contributor(s) and not of MDPI and/or the editor(s). MDPI and/or the editor(s) disclaim responsibility for any injury to people or property resulting from any ideas, methods, instructions or products referred to in the content.