Review

Dose–Response Functions for Assessing Corrosion Risks to Urban Heritage Materials from Air Pollution Under Climate Change: Insights from Europe and China

1
School of Design Engineering, Wuhan Qingchuan University, Wuhan 430204, China
2
School of Urban Design, Wuhan University, Wuhan 430072, China
*
Author to whom correspondence should be addressed.
Buildings 2025, 15(13), 2271; https://doi.org/10.3390/buildings15132271
Submission received: 27 May 2025 / Revised: 19 June 2025 / Accepted: 26 June 2025 / Published: 27 June 2025

Abstract

Urban heritage materials face accelerated decay due to the synergistic effects of air pollution and climate change. Dose–response functions (DRFs) have emerged as a key tool to quantify and predict these risks. This review synthesizes the scientific development of DRFs, their application in Europe and China, and their role in policy and heritage management. European initiatives have refined DRFs to incorporate multi-pollutant and climate interactions, providing spatial risk maps and informing pollution control measures. In China, recent applications adapt European insights to local contexts, revealing strong influences of particulate matter. While DRFs offer clear quantitative estimates, their empirical nature and simplified assumptions necessitate complementary methods, including sensor networks, remote sensing, and machine learning models. Future research should integrate multivariate modelling, expand empirical data, and couple DRFs with real-time monitoring to better protect urban heritage materials amid environmental change.

1. Introduction

Cultural heritage, treasured for its historical, aesthetic, scientific, social, and spiritual value, predominantly originates in urban areas. The deterioration of cultural heritage is a complex process involving the physicochemical properties of building materials, local meteorological conditions, and air quality [1,2,3]. According to the United Nations Educational, Scientific and Cultural Organization (UNESCO), air pollution—primarily driven by industrialization and rapid urbanization—has emerged as a critical threat to heritage sites, accelerating the natural corrosion of historical buildings and monuments [4,5,6]. Air pollutants such as sulfur dioxide (SO2), nitrogen oxides (NOx), ozone (O3), and particulate matter (PM) expedite the natural decay of traditional materials, leading to metal corrosion, stone weathering, and surface soiling [7]. While SO2 levels have declined over the past decades, concentrations of PM and NOx still exceed or closely approach the European Union’s limit values, resulting in synergistic effects from multiple pollutants [8]. Climate change further intensifies these impacts by altering environmental conditions: elevated temperatures, shifting humidity and precipitation patterns, and more frequent extreme weather events all contribute to the acceleration of material decay and the complexity of degradation mechanisms [9]. Consequently, safeguarding urban heritage in the face of evolving climatic and pollution challenges has become an urgent scientific and policy priority.
Europe has taken an early lead in researching the impact of air pollution on heritage risks, establishing comprehensive assessment methods, monitoring systems, and management mechanisms. The European Union developed pollution-material corrosion models based on dose–response functions (DRFs) within the framework of the International Co-operative Programme on Effects on Materials including Historic and Cultural Monuments (ICP Materials) [10,11,12,13], enabling effective evaluation of corrosion rates in heritage materials at regional scales. Since the first annual report was published in 1987 [14], this model has been widely applied in the conservation and management practices of several EU member states.
A DRF is an empirical relationship linking the “dose” of environmental aggressors (pollutant levels, moisture, etc.) to the material’s “response” in terms of corrosion or surface loss [15]. DRFs have been developed over decades of research—notably in Europe—to predict corrosion rates of materials of cultural heritage importance under various pollution and climate conditions [14]. They distill complex decay processes into mathematical forms that can be used to map corrosion risk, estimate material loss over time, and inform policy (for example, by setting tolerable pollution levels to protect monuments) [16]. While originally formulated for Europe’s environment, these functions offer valuable insights for other regions, including fast-developing countries like China where severe air pollution has imperiled countless heritage sites.
This review comprehensively evaluates how climate change and air pollution jointly influence the deterioration of urban heritage materials, and how dose–response functions (DRFs) have been developed and applied to assess corrosion risks. It analyzes the scientific foundations and evolution of DRFs in cultural heritage conservation, and, through case studies, explores their application in European and Chinese contexts. This review highlights regional differences in environmental data integration, implementation challenges, and policy use. It further discusses the advantages and limitations of DRFs as a planning tool for heritage preservation and air quality management. In addition, it examines other advanced corrosion risk assessment techniques—such as machine learning models, multi-sensor monitoring networks, remote sensing, and AI-enhanced simulations—comparing their capabilities, advantages, and limitations with traditional DRFs approaches. Finally, the review identifies future research directions to enhance these approaches and to better integrate them with emerging technologies and climate change scenarios, thereby enabling more proactive and precise protection of cultural heritage in the face of environmental change.

2. Impacts of Climate Change on Urban Heritage

Urban heritage buildings, often centuries old and exposed to the open air, are particularly sensitive to climate factors such as temperature, humidity, and the frequency of extreme weather events (Table 1). Atmospheric pollution remains the primary driver of decay, and its effects can be exacerbated or modified by climate change-related shifts in precipitation, humidity, and other environmental variables.

2.1. Temperature and Thermal Stress

Climate warming means higher average temperatures and more frequent extreme heat events, leading to thermal expansion and internal stress in materials. Under intense heatwaves, stone and masonry structures can experience thermoclastism (thermal cracking and exfoliation), particularly when daily temperature fluctuations are significant. Higher temperatures also accelerate certain chemical corrosion reactions. For example, in metal corrosion, reaction rates generally increase with rising temperatures, implying that warmer climates will enhance the corrosion of iron, bronze, and copper alloys under otherwise comparable conditions. The combined effects of temperature and humidity are even more complex. In arid climates, extremely high temperatures may slow corrosion by reducing moisture, while in humid climates, moderate temperature increases often promote electrochemical corrosion by keeping surfaces damp for longer overnight [18]. European climate models illustrate these nuances. In Northern Europe, warmer and wetter conditions increase corrosion rates for metals and limestone, whereas in Southern Europe, despite hotter temperatures, the drier conditions can actually reduce corrosion rates for some materials due to decreased moisture.

2.2. Humidity, Precipitation, and Time of Wetness

Moisture is a critical factor for practically all material degradation. High humidity and frequent precipitation provide the water needed for corrosion (in the case of metals) and for dissolution or salt weathering of stone [19]. Climate change influences both average humidity and rainfall patterns. Regions experiencing more rainfall and higher relative humidity in a warmer climate are likely to see increased corrosion of metals, glass, and stone surfaces. More precipitation (especially in polluted atmospheres) means more wet deposition of acidic compounds and longer periods where surfaces stay wet—effectively increasing the time of wetness, which strongly correlates with corrosion rates. For example, increased annual rainfall can accelerate the surface recession of carbonate stones (limestone, marble) through both acid rain dissolution and wash-off of protective layers. Laboratory and field studies have long shown that when limestone is frequently wetted by rain (especially if the rain is acidic), the dissolution of calcite is significantly higher, leading to surface loss (often measured in µm per year of recession) [20]. Warmer temperatures can amplify this by causing more evaporation during rainfall, which concentrates acids, or by extending the frost-free season so that moisture remains liquid and active on surfaces for more of the year. Importantly, humidity also contributes to the salt crystallization cycle in the stone [21]. Many historic masonry structures contain soluble salts; when the soluble salts repeatedly dissolve and recrystallize under humidity fluctuations, they cause granular disintegration of the stone surface.

2.3. Extreme Weather and Disasters

Intense storms, floods, and other disasters—whose frequency and severity are linked to climate trends—pose severe threats to heritage materials [22]. Heavy rainfall and rising sea levels place urban heritage sites near coasts or rivers at higher risk of flooding, causing immediate structural damage and triggering long-term material decay, such as wood rot, salt weathering on plaster, and corrosion of iron clamps within masonry. Studies estimate that a substantial proportion of World Heritage sites already face occasional flooding risks, with projections indicating a significant increase by 2100 under high-emission scenarios [9]. Flooding not only physically erodes surfaces but also deposits pollutants and salts that lead to corrosion and stone spalling, effects that can persist long after waters recede. Similarly, more frequent intense storms can abrade stone surfaces (due to wind-driven rain or sand) and accelerate the loss of protective patinas on metals. While wildfires and heatwaves may have a less direct relationship with corrosion, they can cause stone exfoliation and ceramic cracking, exposing fresh surfaces to subsequent chemical attack [23].

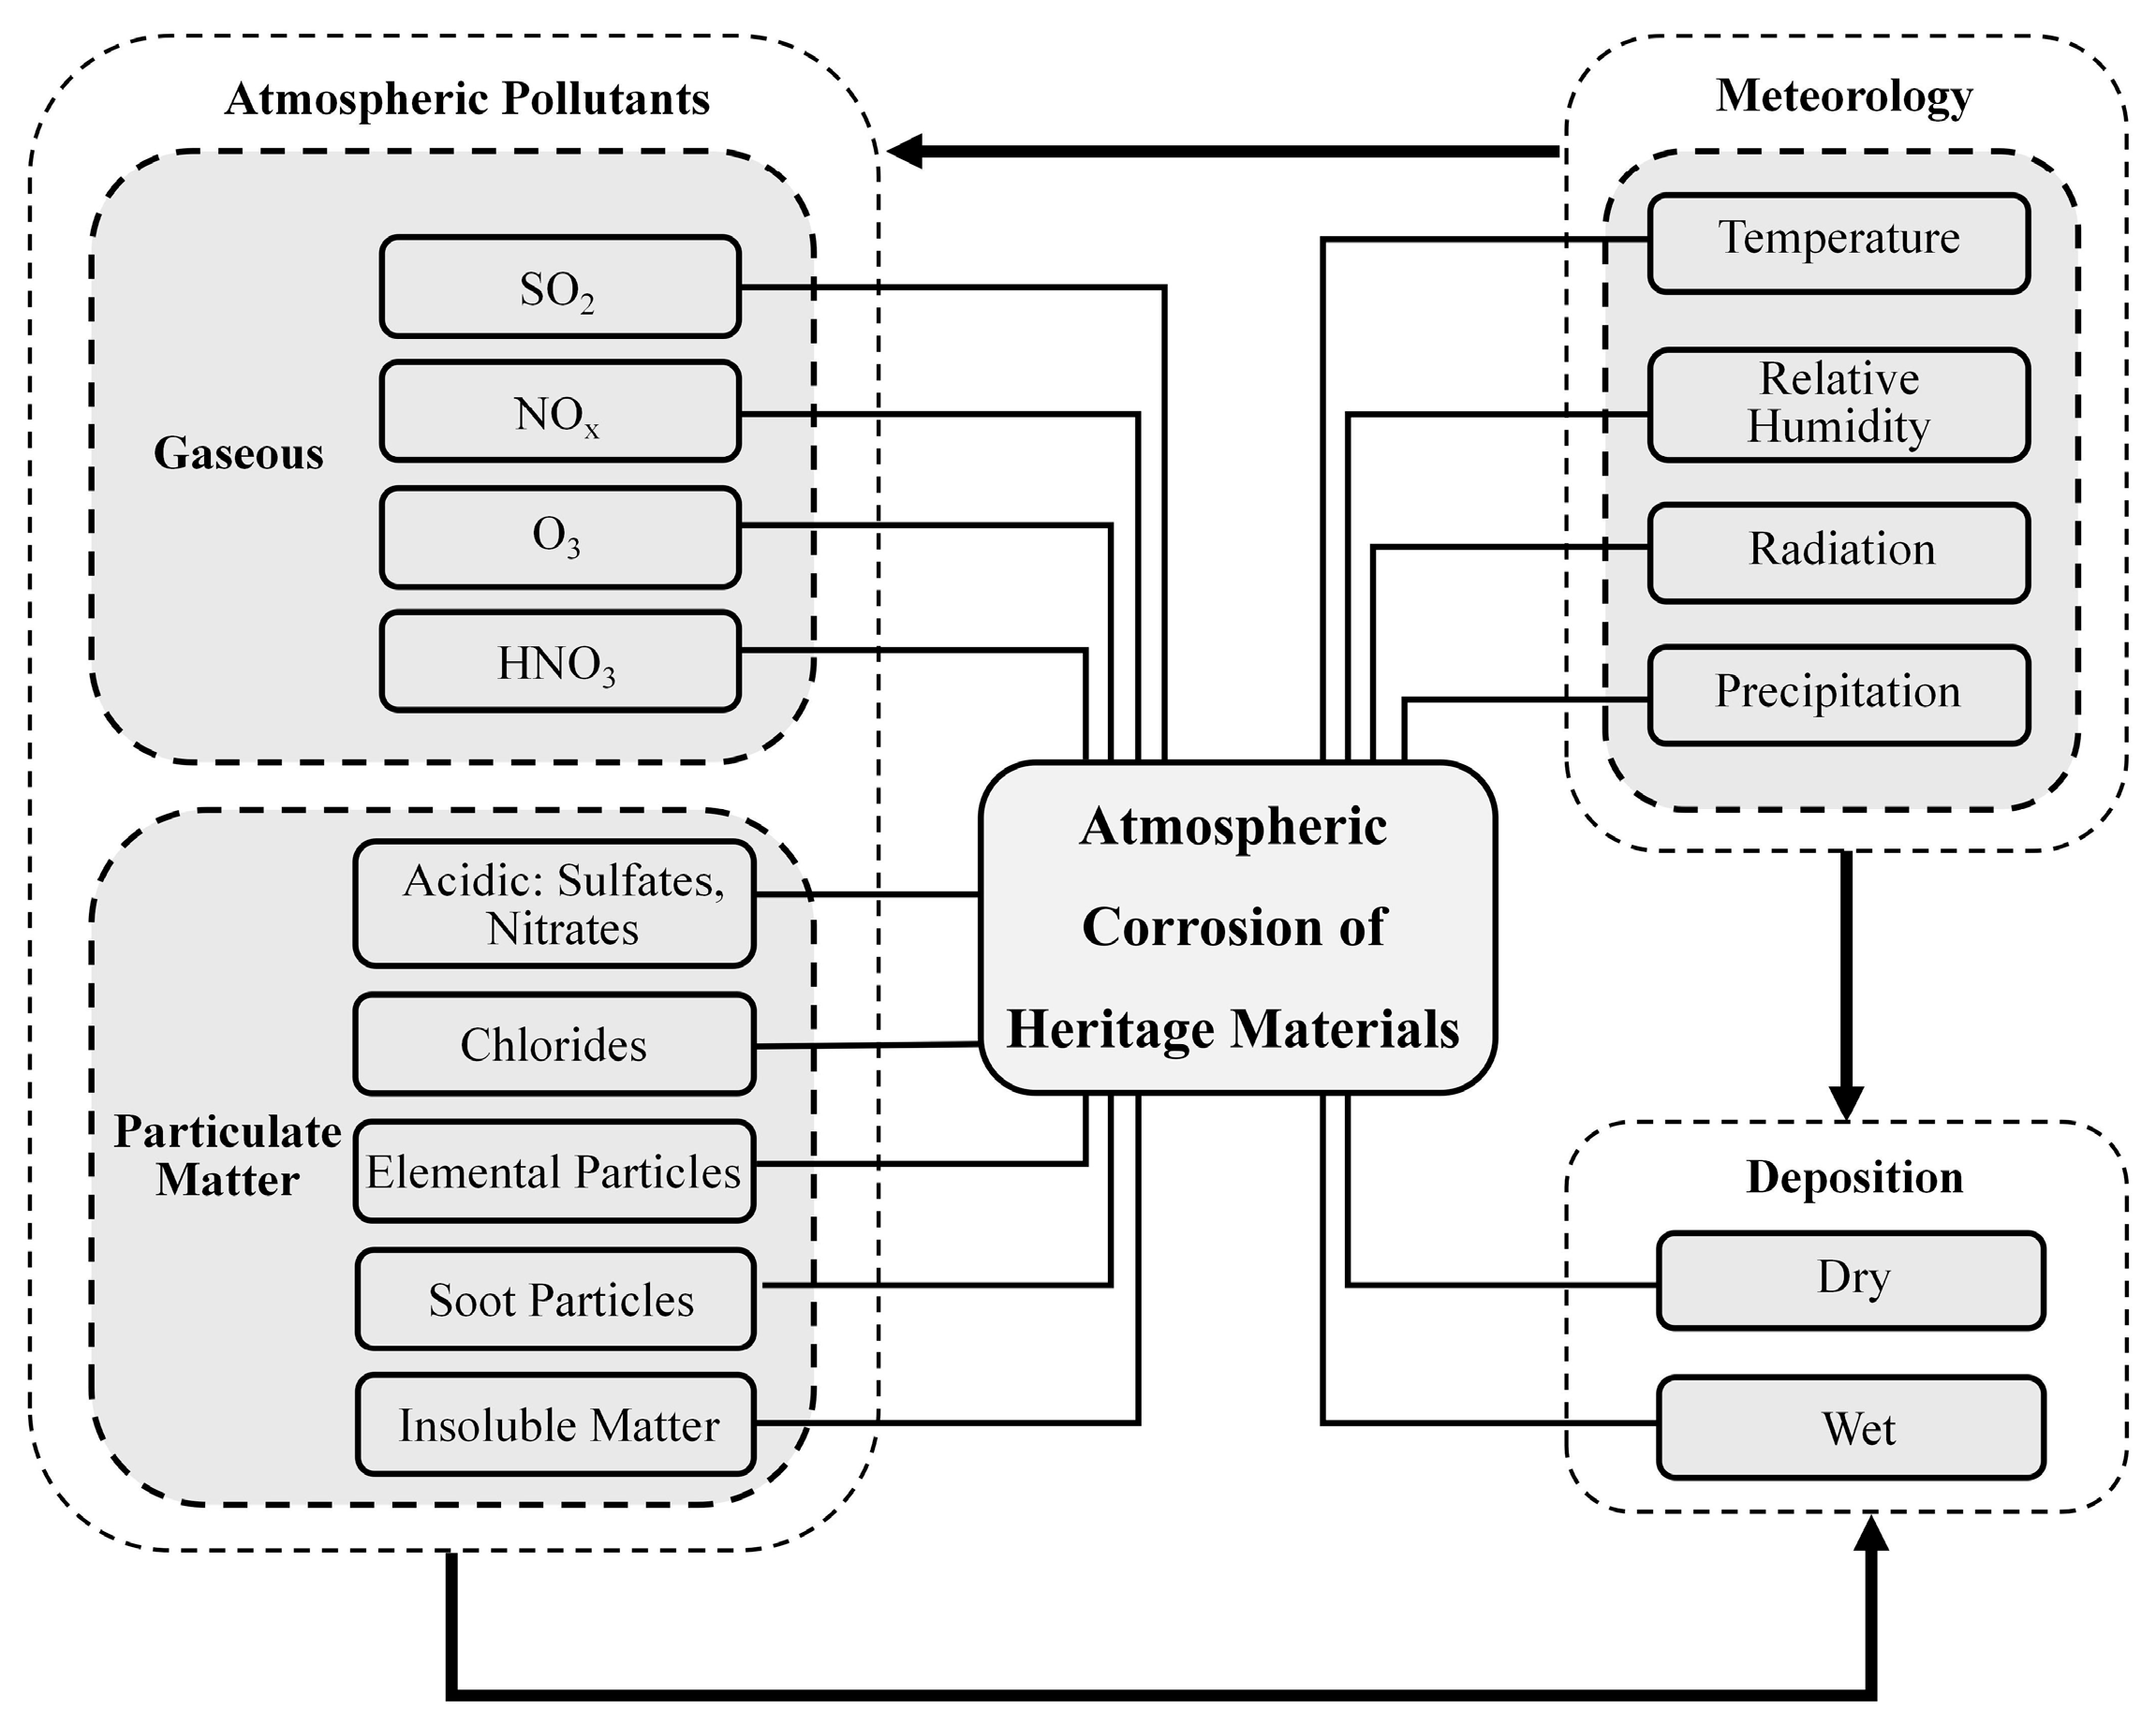
2.4. Atmospheric Pollution

Air pollution poses a significant threat to the preservation of cultural heritage by accelerating material deterioration through chemical reactions with atmospheric pollutants. Major corrosive components include sulfur dioxide (SO2), nitrogen oxides (NOx), ozone (O3), and particulate matter (PM), all of which contribute to the formation of aggressive environments [19]. The typical corrosion process involves the conversion of SO2 and NOx into sulfuric and nitric acids in the presence of moisture, forming acid rain that dissolves calcareous materials such as limestone and marble [24]. Additionally, PM, especially fine particles containing heavy metals or carbonaceous matter, deposits on surfaces, catalyzing further chemical and electrochemical reactions. Ozone contributes to the oxidation of organic materials and accelerates weathering of historical paints and varnishes [25]. These pollutants collectively lead to surface roughening, pitting, loss of material cohesion, and aesthetic degradation, ultimately compromising the structural integrity.
At the same time, the corrosion processes affecting cultural heritage materials due to air pollutants involve interactions with meteorological conditions [26] (Figure 1). Climate change can modulate the dispersion and chemical transformation of pollutants. For example, rising temperatures can enhance ground-level O3 formation, while shifts in precipitation patterns can alter the way pollutants are washed away. Photochemical smog—comprising O3 and other oxidants—can worsen during heatwaves, exposing traditional materials to higher doses of O3. Ozone’s strong oxidative capacity directly corrodes materials such as copper and certain types of stone, and it can also embrittle organic materials, including historic polymers, wood, and textiles.

3. Development and Scientific Basis of Dose–Response Functions for Heritage Material Corrosion

Dose-response functions (DRFs) are quantitative models that relate environmental conditions to material deterioration rates. In the context of heritage conservation, DRFs typically express corrosion depth or surface recession per year as a function of pollutant concentrations and climate factors [27]. The scientific basis of DRFs lies in extensive field exposure programs and laboratory studies that have measured material loss under controlled doses of pollutants and weathering. Common heritage materials—such as carbon steel, zinc, copper, bronze, and calcareous stone (limestone, marble, sandstone)—have been the subject of internationally coordinated corrosion studies. This section details how DRFs were developed, the underlying mechanisms they capture, and their evolution from simple single-pollutant formulas to today’s multi-pollutant models.

3.1. Concept and Development

Before quantitative models became widespread, heritage conservation primarily relied on qualitative surveys. Professionals inspected monuments for visible signs of decay—such as stone spalling, rust stains, or black crusts—and classified patterns of deterioration based on observation. These assessments are still valuable for on-site diagnostics. However, their subjective nature and lack of predictive power have prompted growing interest in quantitative indicators. By the 1990s, researchers began adopting mapping techniques. Some manually plotted deterioration onto photogrammetric elevations, while others used basic 2D GIS tools to visualize which parts of a structure were most affected [28]. At the same time, materials scientists conducted accelerated aging experiments in laboratories. They exposed stone or metal samples to cycles of high SO2 gas, acid sprays, salt fogs, UV radiation, and temperature or humidity changes to simulate long-term weathering. Although these tests cannot fully replicate natural aging, they help identify the environmental factors that drive specific types of damage [29]. Still, accelerated tests may exaggerate the effects of individual stressors under artificial conditions. For this reason, combining laboratory results with field data is generally more reliable [30].
The development of dose–response functions (DRFs) marked a significant shift in heritage risk assessment, from largely descriptive or experimental methods to predictive, data-driven modelling. Dose-response functions (DRFs) enable heritage scientists to generate iso-corrosion maps, which are spatial representations that use contour lines to represent areas with equal predicted corrosion rates. These maps facilitate visual comparison of material degradation across different regions under specific environmental or pollution conditions.
In 1979, the United Nations Economic Commission for Europe (UNECE) adopted the Convention on Long-range Transboundary Air Pollution (CLRTAP), establishing a cooperative framework that outlined specific measures for its 51 parties to reduce emissions of air pollutants. This initiative subsequently led to a series of international cooperative programs aimed at addressing the risks that climate change poses to urban heritage. One of the most important projects was the ICP Materials Program launched in 1985 [14], which aimed to “perform a quantitative evaluation of the effects of multi-pollutants such as S and N compounds, O3 and particles as well as climate parameters on the atmospheric corrosion of important materials, including cultural heritage [31,32,33]”. Under ICP Materials, standard sample plates of various materials were exposed at dozens of sites across Europe (and later elsewhere), and the corrosion or material loss was measured after fixed periods (1 year, 4 years, 8 years, etc.). By statistically correlating these losses with the measured environmental data at each site (pollutant levels, rain acidity, temperature, relative humidity, etc.), researchers derived empirical equations—the dose–response functions.
Dose–response functions (DRFs) establish a link between environmental exposure and material degradation. They relate the “dose” of aggressive agents, such as air pollutants, to the “response” of materials in terms of corrosion or decay. Early DRFs primarily targeted sulfur dioxide (SO2), which was the dominant pollutant at the time. In the late 1980s, European air still contained high levels of SO2 due to coal combustion. Acid deposition was widely recognized as a major cause of stone erosion and metal corrosion. In response, the first phase of the ICP Materials program, completed in 1995, developed DRFs for a range of materials. These included carbon steel, zinc, copper, bronze, several types of stone, and protective coatings, all tested under SO2-rich conditions. The results were used to produce technical manuals that guided the creation of environmental corrosivity maps and the identification of “critical levels” of pollution for material protection [26,34,35] (see Table 2). Some DRFs incorporated piecewise temperature functions, denoted as f(T). These functions adjust corrosion estimates based on temperature, enhancing corrosion at moderate levels but reducing it at extreme highs or lows. For example, the early DRF for carbon steel (see Formula (1)) included an SO2-related term modulated by f(T), which increased corrosion rates above approximately 10 °C. For calcareous stones such as limestone, some baseline dissolution occurs even in relatively clean rain (pH ≈ 5.6). This is reflected in a constant baseline rate of 2.7 µm/year in the DRF, with pollution contributing additional damage (see Formula (6)). Both dry and wet deposition processes play a role. SO2 can form sulfate crusts on damp surfaces through dry deposition. These crusts are then dissolved and washed away by rainwater, compounding the damage over time [20].
Here, f(T) is a temperature-dependent correction factor that adjusts the effect of temperature on corrosion rates; the constant represents the background value of natural weathering; R represents the surface recession or corrosion depth after one year of exposure, in units of μm; M L represents the mass loss, in units of g/m2; R h represents the annual average relative humidity, in units of %; R h 60 is equal to R h 60 when Rh is greater than 60; otherwise, it is 0; Rain represents the annual precipitation, in units of mm/year; T represents the annual average temperature, in units of °C; S O 2 represents the annual average concentration of sulfur dioxide, in units of μg/m3; O 3 represents the annual average concentration of ozone, in units of μg/m3; H N O 3 represents the annual average concentration of nitric acid, in units of μg/m3; P M 10 represents the average concentration of inhalable particulate matter, in units of μg/m3; [H+] represents the annual average concentration of hydrogen ions in rain, in units of mg/L; C l represents the annual average concentration of chloride ions in rain, in units of mg/L; and t represents the duration of exposure, in units of years.
With the implementation of various measures under the Convention on Long-range Transboundary Air Pollution (CLRTAP), SO2 concentrations have significantly declined across much of Europe, accompanied by a reduction in the acidity of atmospheric deposition. As a result, material degradation rates due to sulfur compounds have decreased markedly, reaching near-background levels in some regions, primarily because of the reduced use of coal. However, this does not mean that urban environments have become clean. The increase in automobile traffic has led to elevated levels of nitrogen compounds, ozone, and particulate matter [36,37,38,39].
Second-generation DRFs emerged in the late 1990s and early 21st century. Studies by Tidblad et al. [39] showed that the corrosion risks to cultural heritage had shifted from SO2-dominated pollution scenarios to a combined impact of multiple pollutants, including major contributors such as HNO3 and PM [40]. Recognizing that materials are now exposed to lower SO2 levels but higher concentrations of nitrates, ammonia, ozone, and fine particulate matter, the EU’s initiatives—such as the Model for Multi-Pollutant Impact and Assessment of Threshold Levels for Cultural Heritage (MULTI-ASSESS) [41], Assessment of Air Pollution Effects on Cultural Heritage—Management Strategies (CULT-STRAT) [35], and Noah’s Ark project [41,42,43,44]—have generated new DRFs. These updated DRFs typically still include an SO2 term but add NOx/HNO3, O3, and PM components (Table 2). For example, the DRF for limestone (used in recent European mapping studies) is given in formula 12, which includes terms for SO2, HNO3, PM10, Rain[H+], and relative humidity (Rh). The constant term of 4.0 µm/year reflects background decay even in clean air. Notably, the coefficients suggest that for limestone, a given concentration of HNO3 (0.078) may be even more aggressive than the same concentration of SO2 (0.0059).
A similar multi-pollutant function for carbon steel is Formula (8), with a piecewise f T accounting for temperature. Here, dry SO2 and particles drive much of the corrosion, modulated by time of wetness and temperature. The exponents and functional forms (like S O 2 0.6 ) were obtained by regression to best fit multi-year corrosion data across many sites [27]. The inclusion of terms for O3 is seen in copper DRFs (Formula (10)), and the model uses an term S O 2 0.4 O 3 R h 60 indicating that copper corrosion is accelerated by a combination of SO2 and ozone under humid conditions. This aligns with known chemistry: O3 can deteriorate protective cuprite layers, allowing more SO2 attack [45].
Modern dose–response functions (DRFs) often include a term for nitric acid (HNO3), especially when modeling corrosion of calcareous stones, which are highly vulnerable to strong acids. Nitrogen dioxide (NO2) can also oxidize on moist surfaces to produce HNO3, contributing to this effect. Ozone (O3), while less directly corrosive, generally acts synergistically with sulfur dioxide (SO2). In most DRFs, ozone appears as a multiplicative factor alongside SO2 or relative humidity (Rh), suggesting its influence is most significant under humid conditions. Particulate matter is another key component. It is typically represented by PM10 concentrations. Although its coefficients in DRFs are usually smaller than those for gaseous pollutants, its contribution to surface degradation is notable. In many urban environments today—particularly in regions with high particulate pollution such as China—PM can be a major factor in material recession. Precipitation is also routinely accounted for in DRFs. It is included as a term multiplied by the acidity of rainfall, expressed as hydrogen ion concentration [H+]. While clean rain (pH ≈ 5.6) contributes relatively little to corrosion, even this mildly acidic precipitation can slowly dissolve carbonate stones. DRFs address this with a baseline loss value per millimeter of rainfall, regardless of acidity. SO2 continues to be a dominant term in most DRFs. It can dry-deposit onto surfaces, when moisture is present, form sulfite and sulfate compounds. These species aggressively corrode both metals and stones. In metals, they promote sulfate corrosion; in calcareous stones, they lead to the formation of gypsum crusts. Even in models that account for multiple pollutants, SO2 typically remains the principal driver of decay. This reflects not only its ongoing impact but also the lingering effects of historical pollution—such as accumulated sulfates embedded within materials [20]. Although DRFs are empirical models, they have been validated through comparison with real-world observations. Predicted corrosion rates have been mapped onto heritage sites, including several UNESCO World Heritage locations across Europe. These comparisons generally show strong agreement, successfully identifying high-risk areas (industrial and urban centers) and distinguishing them from lower-risk rural regions [40].
The materials discussed above—primarily metals and stones—have well-established dose–response functions (DRFs). However, non-metallic and non-stone heritage materials, such as wood and glass, have received comparatively limited attention within existing DRF frameworks. Among them, glass, as a silicate-based material, is vulnerable to chemical corrosion from acidic gases and rainfall, as well as surface soiling caused by particulate matter [46]. During the MULTI-ASSESS project, several DRFs were developed for glass, analogous to those for metals and stone, and have been applied to assess the deterioration risk of stained glass windows under varying environmental conditions [47].
For transparent materials, two types of dose-response functions have been proposed.
(1)
The first is based on a multilinear regression model, in which haze formation is treated as a time-dependent variable influenced by ambient concentrations of SO2, NO2, and PM10 (measured in μg/m3) (Lombardo et al., 2010) [48] (see Formula (13)).
H = 0.2529 [ S O 2 ] + 0.1080 [ N O 2 ] + 0.1473 [ P M 10 ] 1 + 382 t 1.86
Here, H represents the haze level, expressed as a percentage (%), and t denotes the exposure time, measured in days.
(2)
The second utilizes a neural network model [49] (see Formulas (14)–(17)) that applies a nonlinear parametric regression using a hyperbolic tangent function. Once trained, the model is straightforward to use and offers flexibility in capturing complex environmental interactions.
H e s t = 4.81 H n o r m + 5.27
H n o r m = 3.951 39.193 t a n ( S 1 ) + 44.067 t a n ( S 2 )
S 1 = 1.498 0.145 t 387.18 275.17 + 0.031 [ S O 2 ] 9.7 11.82 + 0.297 [ N O 2 ] 33.29 19.37   + 0.280 [ P M 10 ] 28.93 15.68
S 2 = 1.45 0.073 t 387.18 275.17 + 0.033 [ S O 2 ] 9.7 11.82 + 0.281 [ N O 2 ] 33.29 19.37   + 0.261 [ P M 10 ] 28.93 15.68
Here, H e s t represents the estimated haze level, expressed as a percentage (%); H n o r m represents the normalized haze level, expressed as a percentage (%); and S 1 ,   S 2 represent two neurons.
These functions show that higher concentrations of particulate matter accelerate the accumulation of soot and dust on surfaces, including glass, leading to faster loss of transparency. They complement chemical corrosion models by accounting for surface-level soiling. However, it is important to note that pollution-induced degradation is a multifactorial process. Variables such as particle composition, rainfall-induced washing, wind action, and emerging pollutants (e.g., organic aerosols) also play significant roles in determining corrosion and soiling rates [50].
In contrast, the deterioration of wooden heritage structures is primarily driven by moisture and biological activity. Brischke and Rapp (2008) [51] conducted exposure tests on wood samples at 23 sites across Europe, establishing a biological dose–response model based on the relationship among wood moisture content, temperature, and the progression of fungal decay. Unlike inorganic materials, wood is organic and highly susceptible to biodeterioration under humid conditions [52]. To date, no widely accepted DRFs have been established that directly relate atmospheric pollutant concentrations—such as SO2 or NOx—to wood degradation rates. Furthermore, global exposure programs have not included wood as a standard reference material in pollutant-based deterioration studies, highlighting the urgent need for further research in this area.

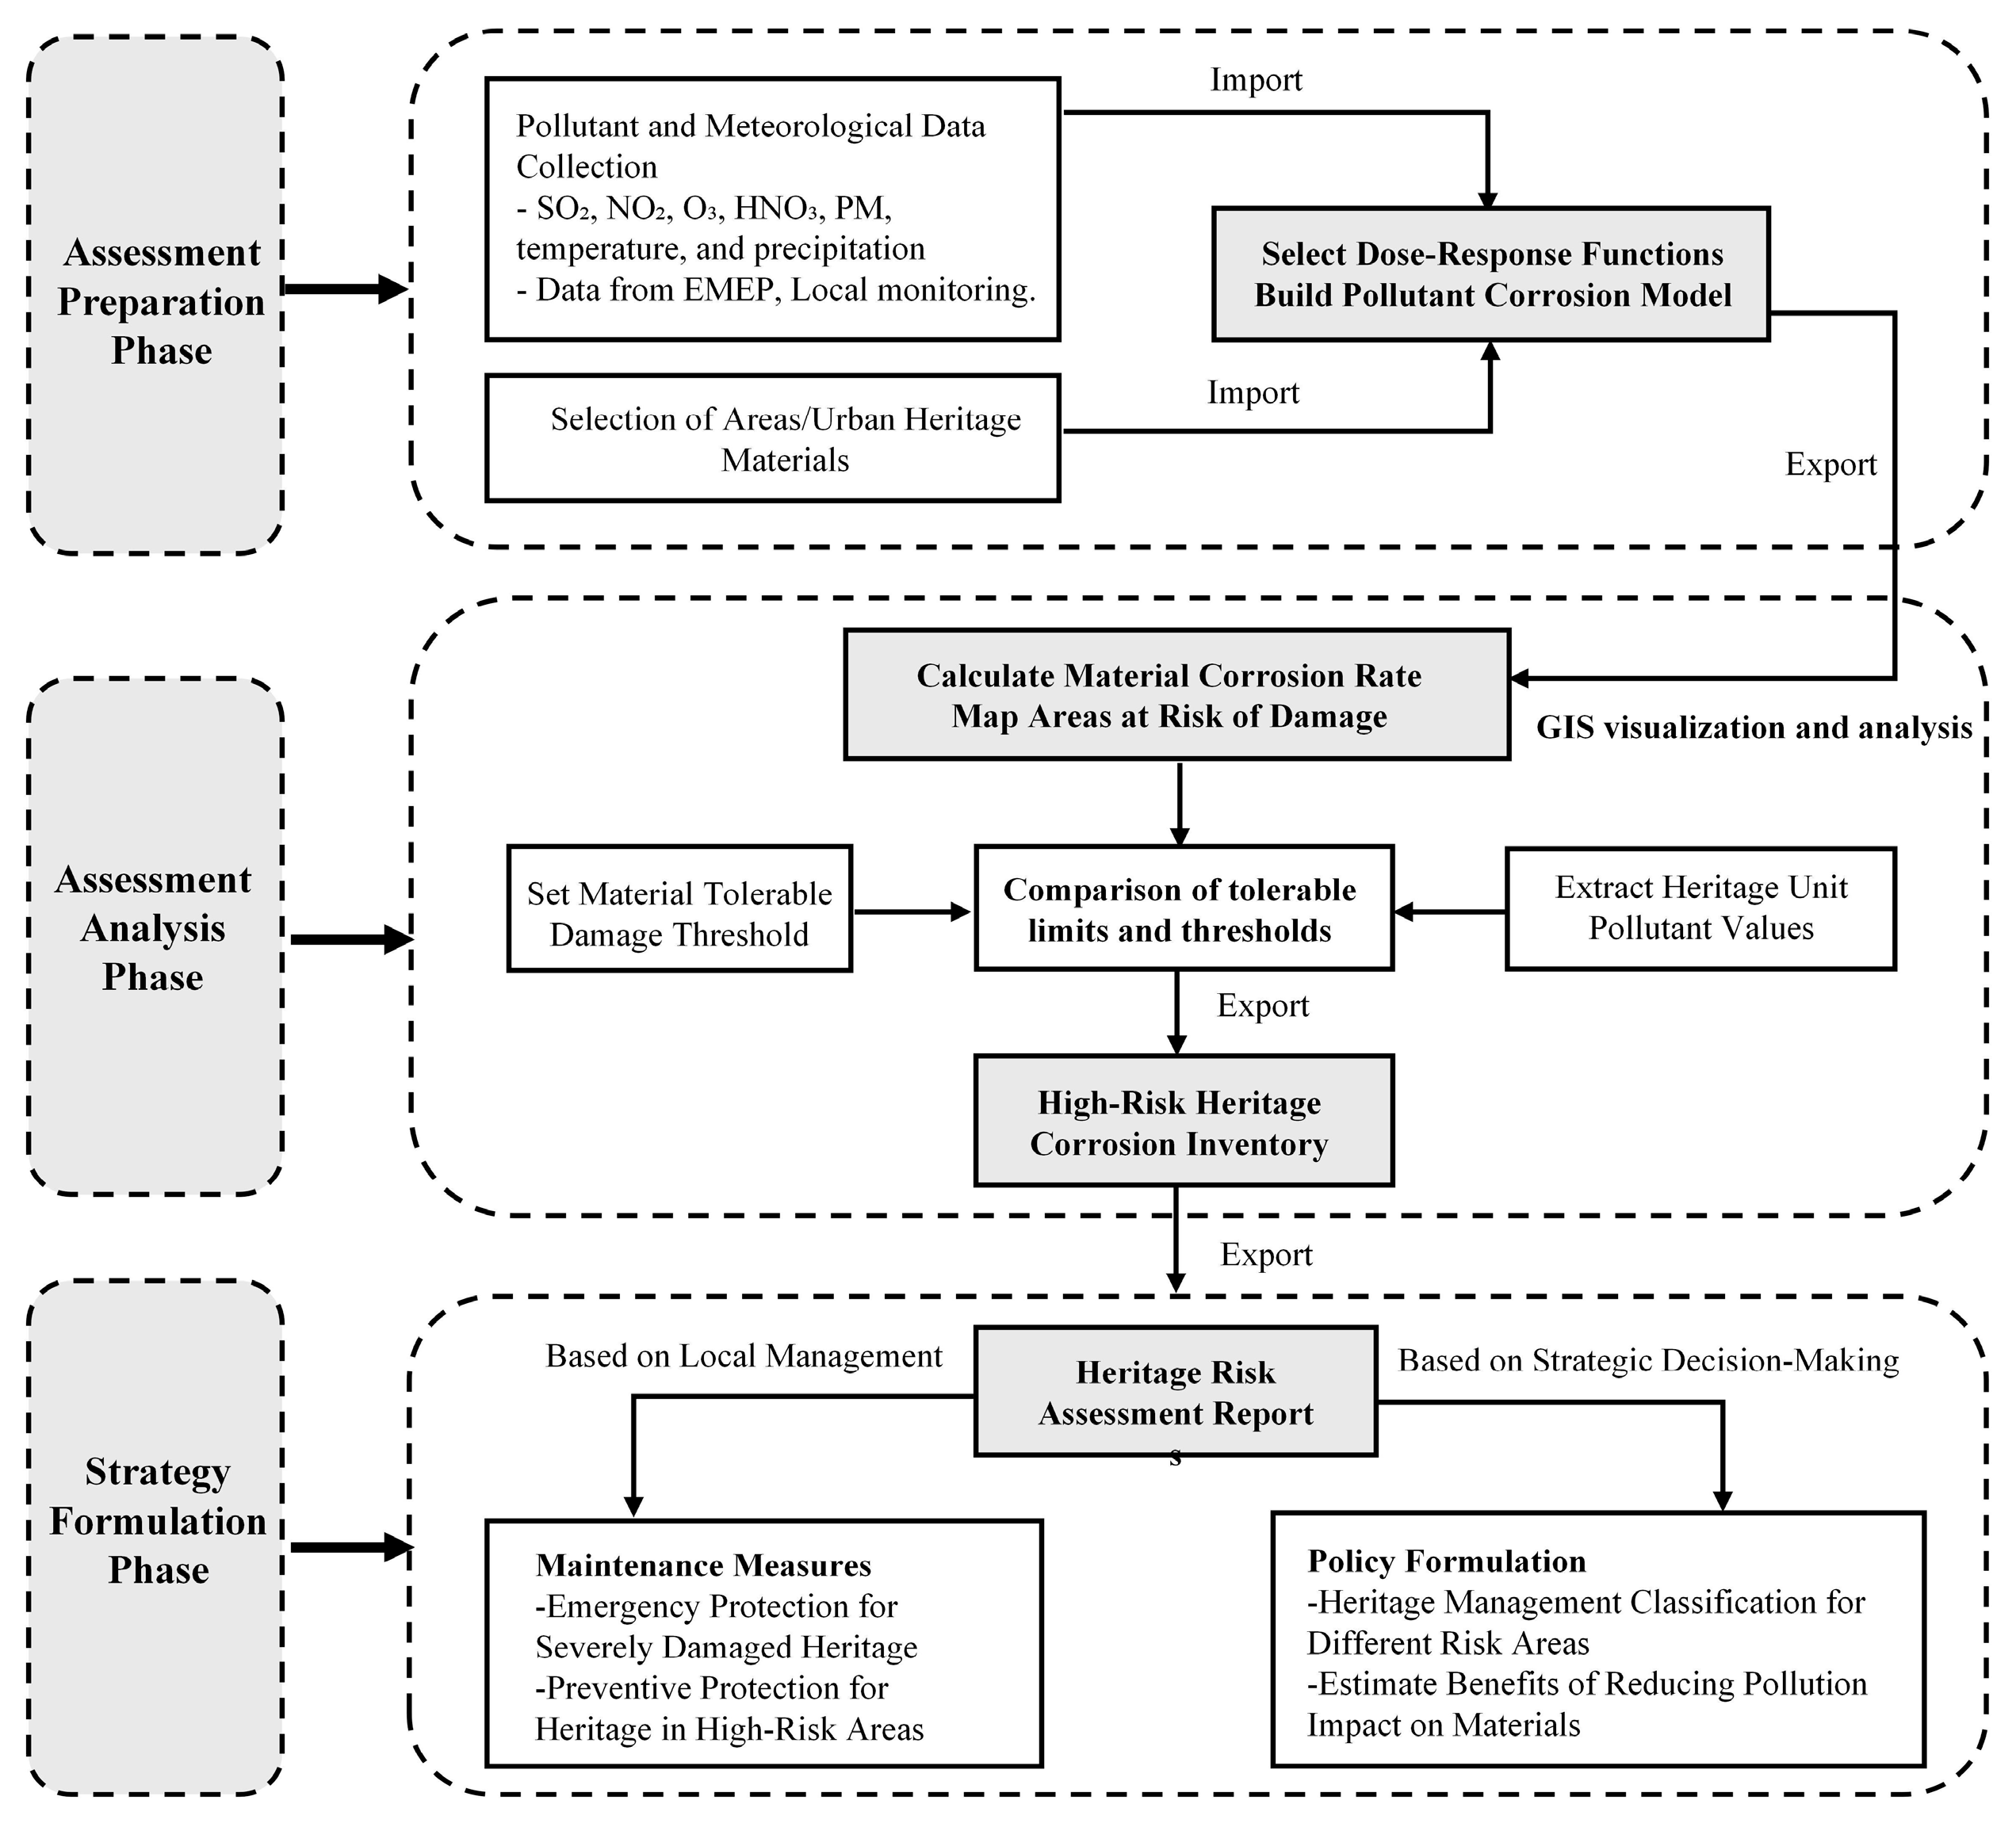
3.2. Process of Assessing Heritage Degradation Using DRFs

The assessment process consists of three main phases—preparation, analysis, and strategy formulation—which progress sequentially (Figure 2). In the preparation phase, the primary input data for the assessment models include annual average concentrations of air pollutants and climatic parameters, typically obtained from measurements or simulations. If climate data for a particular year are unavailable, long-term average climate data can be used as substitutes. It is recommended to obtain climate and pollution data from national or international meteorological centers, international organizations (e.g., WMO), international research programs (e.g., EMEP), or national environmental protection agencies. The pollutants considered in the assessment include gaseous pollutants (SO2, NO2, O3, and HNO3), particulate matter (PM), temperature, and precipitation [39]. The key material types assessed are metals and stone materials that constitute cultural heritage, such as steel, zinc, aluminum, copper, bronze, and limestone. Each material requires specific sets of pollutant and climate data for evaluation (Table 3). For example, SO2 concentration data are essential for evaluating all materials, whereas HNO3 concentration data are required only for the assessment of zinc and limestone. The assessment area can range from metropolitan regions and cities to specific heritage zones, encompassing the cultural heritage materials within these boundaries. Based on the types of pollutants in the region, the corresponding corrosion models for those pollutants are selected.
During the assessment analysis phase, pollutant corrosion models are used to calculate the corrosion or soiling rates for each evaluated material. Atmospheric deterioration of cultural heritage is a cumulative and irreversible process that continues even in the absence of pollutants [32]. Therefore, “critical” values are not as easily defined as in natural ecosystems. Technical, economic, and social factors must be comprehensively considered to determine the so-called “acceptable” or “tolerable” rates of degradation. Acceptable corrosion or degradation rates are typically expressed as a multiple (n) of the background corrosion rate. The ICP Materials program has established reference values to represent background corrosion rates [26], with n = 2.5 set for 2020 and n = 2 for 2050. The corresponding tolerable degradation rates are shown in Table 4. The determination of tolerable degradation thresholds for heritage materials is grounded in empirical observations of background corrosion rates under clean-air conditions, as established by the ICP Materials program. These background rates serve as scientific baselines, to which a multiplicative factor (n) is applied to define acceptable deterioration limits—n = 2.5 for the year 2020 and n = 2.0 for 2050—reflecting progressively stricter environmental targets. The resulting thresholds, expressed in micrometers of surface loss per year, differ across materials due to inherent variations in their physicochemical properties, environmental sensitivity, and conservation priorities. Metals such as steel and carbon steel, which are more prone to rapid corrosion, are assigned higher tolerable rates, while more corrosion-resistant materials like aluminum and bronze have lower limits. Stone materials, including limestone and sandstone, receive intermediate thresholds based on their porosity, mineral composition, and historical susceptibility to weathering. These differentiated values ensure that material-specific degradation processes are realistically accounted for, allowing for risk-informed preservation strategies tailored to each material’s durability and cultural significance.
By comparing the deterioration rates calculated by the assessment models with these benchmark values, it can be determined whether they fall within the tolerable range. Based on the geographic location of the heritage, high-resolution risk assessment maps are generated. The grid size of these maps should be 1 km2 or smaller, and the grid area can follow the European Monitoring and Evaluation Programme (EMEP) framework (0.1° × 0.1°). All spatial representations and interpolation methods should be completed using open-source geographic information system (GIS) software. Finally, in the strategy formulation phase, the resulting heritage risk assessments are compiled into evaluation reports, which are then submitted to decision-makers to inform policy development.

4. Applications of Dose–Response Functions: Europe and China

4.1. Case Studies in Europe and China

As a key tool for assessing the corrosion risks to heritage materials, DRFs were first systematically developed in Europe. Following major smog events in the mid-20th century, Europe integrated air pollution into urban environmental management, and DRFs were widely applied in heritage conservation, particularly within the ICP Materials project framework [39]. European studies have shown that despite air quality improvements in recent decades, some urban areas still face risks exceeding tolerable corrosion rates, especially in regions with high human activity. For example, the work by Spezzano et al. [53], based on the EMEP database [54] and DRFs, mapped corrosion rates for 375 World Heritage sites (Figure 3). They found that the corrosion rates of materials such as steel, zinc, bronze, limestone, sandstone, and copper exceeded the thresholds set by the ICP Materials project in certain locations, highlighting the need for focused attention and conservation efforts.
For instance, Figure 3a shows that the predicted first-year recession rate for Portland limestone across 1276 grid cells in the study area generally approached the background value (3.2 μm), but 109 grid cells exceeded the ICP Materials program’s 2050 conservation target (6.4 μm), with 16 grid cells even surpassing the 2020 threshold (8.0 μm). For sandstone (Figure 3b), 31 grid cells exceeded the 2050 target (5.5 μm), and 16 exceeded the 2020 threshold (7.0 μm). The overall degradation rates were relatively low, mainly due to the significant decline in SO2 concentrations. Nevertheless, even with substantial reductions in SO2 and other pollutants since the 1980s, some heritage sites in industrial and densely populated areas still face corrosion risks above safe rates. Copper (Figure 3c) exhibited particularly notable corrosion risks. Of the 1276 grid cells, 871 exceeded the 2050 target (0.64 μm), and 165 surpassed the 2020 threshold (0.8 μm), indicating a widespread distribution of high-risk corrosion zones.
The primary sources of pollution include vehicle emissions and maritime shipping, with certain industrial cities in Italy and Russia standing out as particularly problematic. Transboundary pollution also exacerbates regional corrosion risks. Italy, in particular, faces heightened risks not only due to its abundance of cultural heritage but also because it is among the most polluted countries in Europe. The country’s motorization rate ranks among the highest in Europe, with an average of 625 vehicles per 1000 inhabitants, compared to 562 in Germany, 479 in France, and 472 in the United Kingdom [55]. In Russia, the heritage sites in Saint Petersburg face the highest levels of corrosion risk. As an industrial city second only to Moscow in industrial output, Saint Petersburg suffers from severe air pollution. Although local emissions are the main source of urban air pollution in Europe, transboundary pollutant transport also plays a significant role. These findings help to identify existing risks and highlight heritage sites that require special attention, providing a basis for more targeted site-specific analysis and policy development.
In the past decade, China has gradually integrated DRFs into heritage corrosion risk management, driven by rapid industrialization and aggressive air pollution control efforts. Wang et al. [7] investigated changes in air pollution and limestone heritage corrosion risks across the country between 2006 and 2020—a period marked by substantial shifts. Due to stringent policies, SO2 pollution was reduced by approximately half (Figure 4), leading to a decrease in the annual surface recession rate of limestone from 9.69 μm in 2006 to 6.71 μm in 2020, a reduction of 30%. By 2020, the number of heritage sites with corrosion rates below the “safe” threshold of 8 μm/year had increased by 41.4% (Figure 5), resulting in an estimated maintenance cost savings of 136.2 million CNY. However, regional disparities remain pronounced. The Tibetan Plateau exhibits the lowest corrosion rates, while southern China continues to experience high corrosion levels due to high humidity and elevated PM pollution. Broader multi-pollutant DRFs studies have indicated that in some Chinese megacities, the combined effects of high particulate matter (PM) and acidic pollutants (SO2, NOx) result in sandstone, bronze, and other materials experiencing some of the highest corrosion rates globally [40]. This contrasts with that noted in Europe, where SO2 historically dominated, China’s PM10 and HNO3 levels are higher, with PM10 showing the strongest spatial correlation with limestone corrosion—exceeding that of SO2. This suggests that when applying DRFs models in China, it is often necessary to recalibrate coefficients to reflect the distinct high-PM pollution characteristics.

4.2. Comparisons and Adaptation Challenges

Europe and China represent two distinct scenarios for heritage corrosion: Europe’s “post-pollution environment” following significant pollution reductions, and China’s “dynamic transitional period” of gradual pollution improvement. DRFs studies in Europe reveal that as major pollutants are brought under control, the relative importance of climatic factors and residual pollutants (such as ozone) has increased—a trend also anticipated in China. Both contexts have demonstrated that DRFs are essential tools for the quantitative and scientific management of corrosion risks, yet both face the challenge of maintaining up-to-date, locally relevant models. However, China’s wide range of climatic zones—from the tropical climate of Hainan to the arid conditions of Xinjiang and the cold environment of Heilongjiang—poses significant challenges for directly applying European DRFs. In addition to climate, differences in material characteristics must also be considered. For example, Chinese limestone differs from Europe’s Portland limestone in both chemical composition and environmental adaptability. These regional and material variations highlight the need for comprehensive localization and field-exposure validation when adapting European DRFs for use in China.
Overall, Europe’s long-standing efforts—exemplified by initiatives like the ICP Materials program—have provided a robust scientific and policy foundation for DRF models. In contrast, China’s rapid pollution control measures and flexible policy adjustments have created a unique testing ground for verifying the applicability and limitations of DRFs in rapidly urbanizing environments. The comparative and complementary experiences of these two regions underscore that DRFs are central tools for quantifying and managing urban heritage risks. However, in emerging environments and diverse climatic zones, continuous refinement and supplementation of these models are essential. In particular, particulate matter pollution plays a pivotal role in heritage corrosion in China, suggesting that DRFs must place greater emphasis on PM’s contribution. Studies from both regions highlight specific heritage sites that require heightened attention, particularly those located in areas with intense human activity. These findings underscore the need for targeted policies and interventions to reduce air pollution in urban environments and around vulnerable historic buildings and monuments.
Across Europe and China, the application of dose–response research has led to concrete benefits for heritage preservation. Both regions have adopted stricter pollution standards with cultural heritage in mind. Europe’s NECD (National Emission Ceilings Directive) and the Gothenburg Protocol included targets to cut corrosion to half of the levels in the 1980s [56], while China’s Class I air quality standards aim to keep pollutant concentrations low around sensitive sites [57]. Dose–response data have also informed conservation funding. By estimating annual material loss, authorities can better plan cleaning and repair cycles. In Italy, this has supported increased funding for monument maintenance in polluted cities. In China, the national heritage agency cited reduced maintenance costs—thanks to improved air quality—as justification for continued investment in pollution control, treating it as a form of preventive conservation. International organizations such as UNESCO and the World Bank have used DRF-based damage estimates to support funding decisions for at-risk sites. Another major outcome is expanded environmental monitoring. In Europe, long-term corrosion test sites established by ICP Materials are now co-located near key monuments [58], such as in Prague, Paris, and Stockholm, to track the benefits of emission reductions. Similarly, China has installed air quality sensors at sites like the Mogao Caves and Temple of Heaven [59], enabling real-time data collection to inform localized risk models. This reflects the growing recognition that continuous monitoring is essential for applying DRFs effectively and adjusting protection strategies as needed.
Beyond Europe and China, underrepresented regions such as Southeast Asia, Sub-Saharan Africa, and Latin America face distinct challenges in applying dose–response functions to heritage conservation. These regions often contend with higher levels of particulate pollution, biomass burning, and less regulated industrial emissions, as well as extreme climate variability—ranging from tropical humidity to high-altitude aridity. Moreover, the lack of long-term exposure data and site-specific material studies limits the direct transferability of European-derived DRFs. For effective global application, it is necessary to expand empirical research, develop localized functions, and establish regional monitoring networks. International cooperation and technology transfer will be essential to address the growing corrosion risks facing heritage sites in these climate-stressed and pollution-prone environments.

5. Advantages, Disadvantages, and Complementarities of DRFs and Other Methods

DRFs play a significant role in heritage conservation planning and air quality management, yet like any tool, they come with both advantages and limitations. Understanding these is crucial for practitioners to use DRFs appropriately and for policymakers to weigh their reliance on such models. DRFs represent a mature, model-based approach, whereas emerging technologies—such as sensor-based monitoring, machine learning, and remote sensing—offer distinct advantages. In this section, we discuss the primary strengths of using DRFs in planning and policy, as well as the notable drawbacks or limitations, particularly in the context of protecting cultural heritage under ever-changing environmental conditions.

5.1. Complementary to Other Advanced Methods

A major development in recent decades has been the deployment of electronic sensors for real-time monitoring of environmental conditions and material corrosivity at heritage sites. These range from simple data loggers that record temperature and relative humidity (Rh) to advanced corrosion sensors. For example, under the EU’s MUSECORR project, the AirCorr corrosion logger was developed [60]. This device measures corrosion rates by tracking the electrical resistance of thin metal strips exposed to the environment. As the metal corrodes, its cross-sectional area decreases, leading to an increase in resistance. Changes in resistance can be converted into equivalent metal loss, providing a direct indicator of the air’s corrosivity. MUSECORR demonstrated that such real-time corrosion monitoring is feasible not only in museums but also at outdoor heritage sites, offering immediate feedback to conservation personnel on the effectiveness of environmental control measures.
Sensor networks are increasingly used to complement DRFs, as they can detect local variations and short-term fluctuations that annual average models often overlook [61]. Expanding on basic single-sensor setups, researchers have developed multi-sensor systems capable of monitoring multiple environmental parameters at once. These systems typically measure temperature, relative humidity, and pollutant gases using electrochemical sensors for SO2, NO2, and O3. They also include probes that track corrosion rates, all integrated into a single platform. When deployed at heritage sites, these multi-sensor units provide a detailed and continuous view of the microenvironment. The collected data can be analyzed in real time to assess material risk and environmental stress. Some systems go further by incorporating imaging sensors, enabling multi-source data fusion [62,63]. For example, combining visual image recognition with corrosion current sensors has been shown to improve the accuracy of corrosion assessments for steel samples [18]. These innovations represent a significant advancement in heritage risk assessment. Rather than relying on static equations, these systems continuously measure site-specific conditions and calculate risk directly on-site, offering timely and dynamic insights for conservation efforts.
Another methodological leap has been the use of remote sensing and geospatial imaging to assess the condition of heritage sites. Satellite or aerial data can be used to evaluate the environmental exposure of sites. For example, Visone et al. [15] combined satellite rainfall data (from the CHIRPS dataset) with the Lipfert-based stone corrosion model to estimate climate-driven stone loss in Matera, Italy. Local instrument measurements were used to calibrate the satellite precipitation data, and yearly climate factors (adjusted for rising CO2 and temperature) were incorporated to project material loss from the 1980s to 2040. This “satellite-sensed data–DRFs” approach is innovative because it enables global or regional mapping without relying on intensive ground monitoring. Remote sensing has also been used to monitor urbanization and microclimatic changes around heritage sites. This includes identifying urban heat islands that may place stress on historic materials and applying InSAR techniques to assess ground stability and its potential impact on heritage structures [64,65]. These methods allow for corrosion risk evaluation without relying solely on chemical measurements.
Traditional corrosion models, including DRFs, are typically empirical regression models based on predetermined variables. In contrast, machine learning (ML) can identify complex patterns in large datasets without requiring a predefined functional form [66,67]. ML models are capable of handling multiple environmental variables at once. These include temperature, relative humidity, SO2, NO2, O3, PM2.5, PM10, wind speed, and even human activities that influence CO2 levels. By analyzing these variables together, ML can detect correlations linked to observed material decay. For example, neural networks have been used to predict future corrosion rates based on historical sensor data under varying environmental conditions. ML techniques have also been applied to classify corrosion products from microscopy images of metal artifacts and to optimize the selection of corrosion inhibitors for traditional metals [66]. Broader research in corrosion science has shown that ML models, such as random forests and neural networks, are particularly effective in capturing nonlinear and multifactorial interactions that simpler models often overlook. One example is the ability of ML to detect that a combination of high NO2 and moderate SO2 produces a greater corrosive effect than the sum of their individual impacts. This allows for more accurate and adaptive predictions. However, despite these advantages, many ML-based corrosion models still face limitations. Their accuracy and generalizability often decrease when applied in real-world conditions, especially if trained on limited datasets or when important variables are missing [68].
DRFs and alternative methods, including sensor networks, machine learning models, and remote sensing, show notable differences in cost, accuracy, scalability, and responsiveness (see Table 5). DRFs and remote sensing provide broad, cost-effective overviews of corrosion risk across countries or regions, helping to identify priority areas for intervention [65,69,70]. In contrast, sensor networks and machine learning models deliver detailed, dynamic insights at the site level—sensors by measuring corrosive conditions in real time [71], and ML by predicting outcomes under complex scenarios such as climate change or pollution events with greater accuracy [72,73].

5.2. Advantages and Disadvantages of DRFs

The greatest strength of DRFs lies in their ability to provide quantitative estimates of material degradation based on scientific equations, allowing heritage managers to quickly input pollution and climate data and intuitively obtain corrosion rates (Table 6). This quantitative capability offers a scientific foundation for setting measurable conservation targets [69]. For instance, in European practice, the annual corrosion rate for sensitive limestone is controlled to approximately 8 μm/year, serving as a benchmark for risk assessment. Additionally, by directly linking pollutant concentrations to material damage, DRFs enhance the visibility of heritage conservation within air quality management and policy, enabling it to be included in cost-benefit analyses of pollution control measures. More importantly, DRFs have the capacity to predict future scenarios by simulating corrosion risks under IPCC climate scenarios. Research by Sabbioni et al. [9] using DRFs to project scenarios up to 2100 suggests that even if pollution is controlled, climate warming and increased humidity will still elevate metal corrosion rates in some regions. Such predictions enable managers to take proactive measures, such as increasing inspection frequency or applying protective coatings. Visualized corrosion risk maps also play a crucial role in raising public awareness and garnering broader support for environmental governance.
However, DRFs also present several limitations. As formula-based models, they simplify complex corrosion processes and often overlook certain climatic variables or localized micro-environmental effects. Most DRFs rely on stable annual average conditions, which makes them less effective at capturing sudden corrosion spikes caused by extreme weather events or short-term pollution episodes. Meteorological or anthropogenic disasters, such as acid rain incidents, can exceed the predictive capacity of these models. This highlights the need to incorporate multi-hazard risk assessments into heritage conservation. Furthermore, the applicability of DRFs is often region specific. When applied in different geographic or climatic contexts, the parameters typically require recalibration. Differences in material types can also influence prediction accuracy, as DRFs may not fully reflect the behavior of diverse heritage materials. A more fundamental limitation is that DRFs only quantify material loss. They do not account for the cultural significance embedded in carvings and decorative details, where even minimal deterioration may cause irreversible damage. Therefore, while DRFs remain an important tool in heritage conservation and pollution management by offering scientific rigor, quantitative clarity, and support for long-term strategies, they should not be used in isolation. To ensure a more comprehensive and effective conservation approach, DRFs need to be integrated with significance assessments, real-time site monitoring, and multidimensional risk evaluations. This combined methodology provides a stronger foundation for sustainable protection of cultural heritage.

6. Conclusions and Future Perspectives

The assessment of corrosion risks to urban heritage materials has evolved from field observations to data-driven science. Dose-response functions (DRFs), as a core tool, link environmental stressors to material deterioration processes, establishing a quantitative framework. This paper systematically reviews the combined effects of climate change and air pollution on the corrosion of heritage materials, as well as the development and application of DRFs in Europe and China. The main conclusions are as follows:
(1)
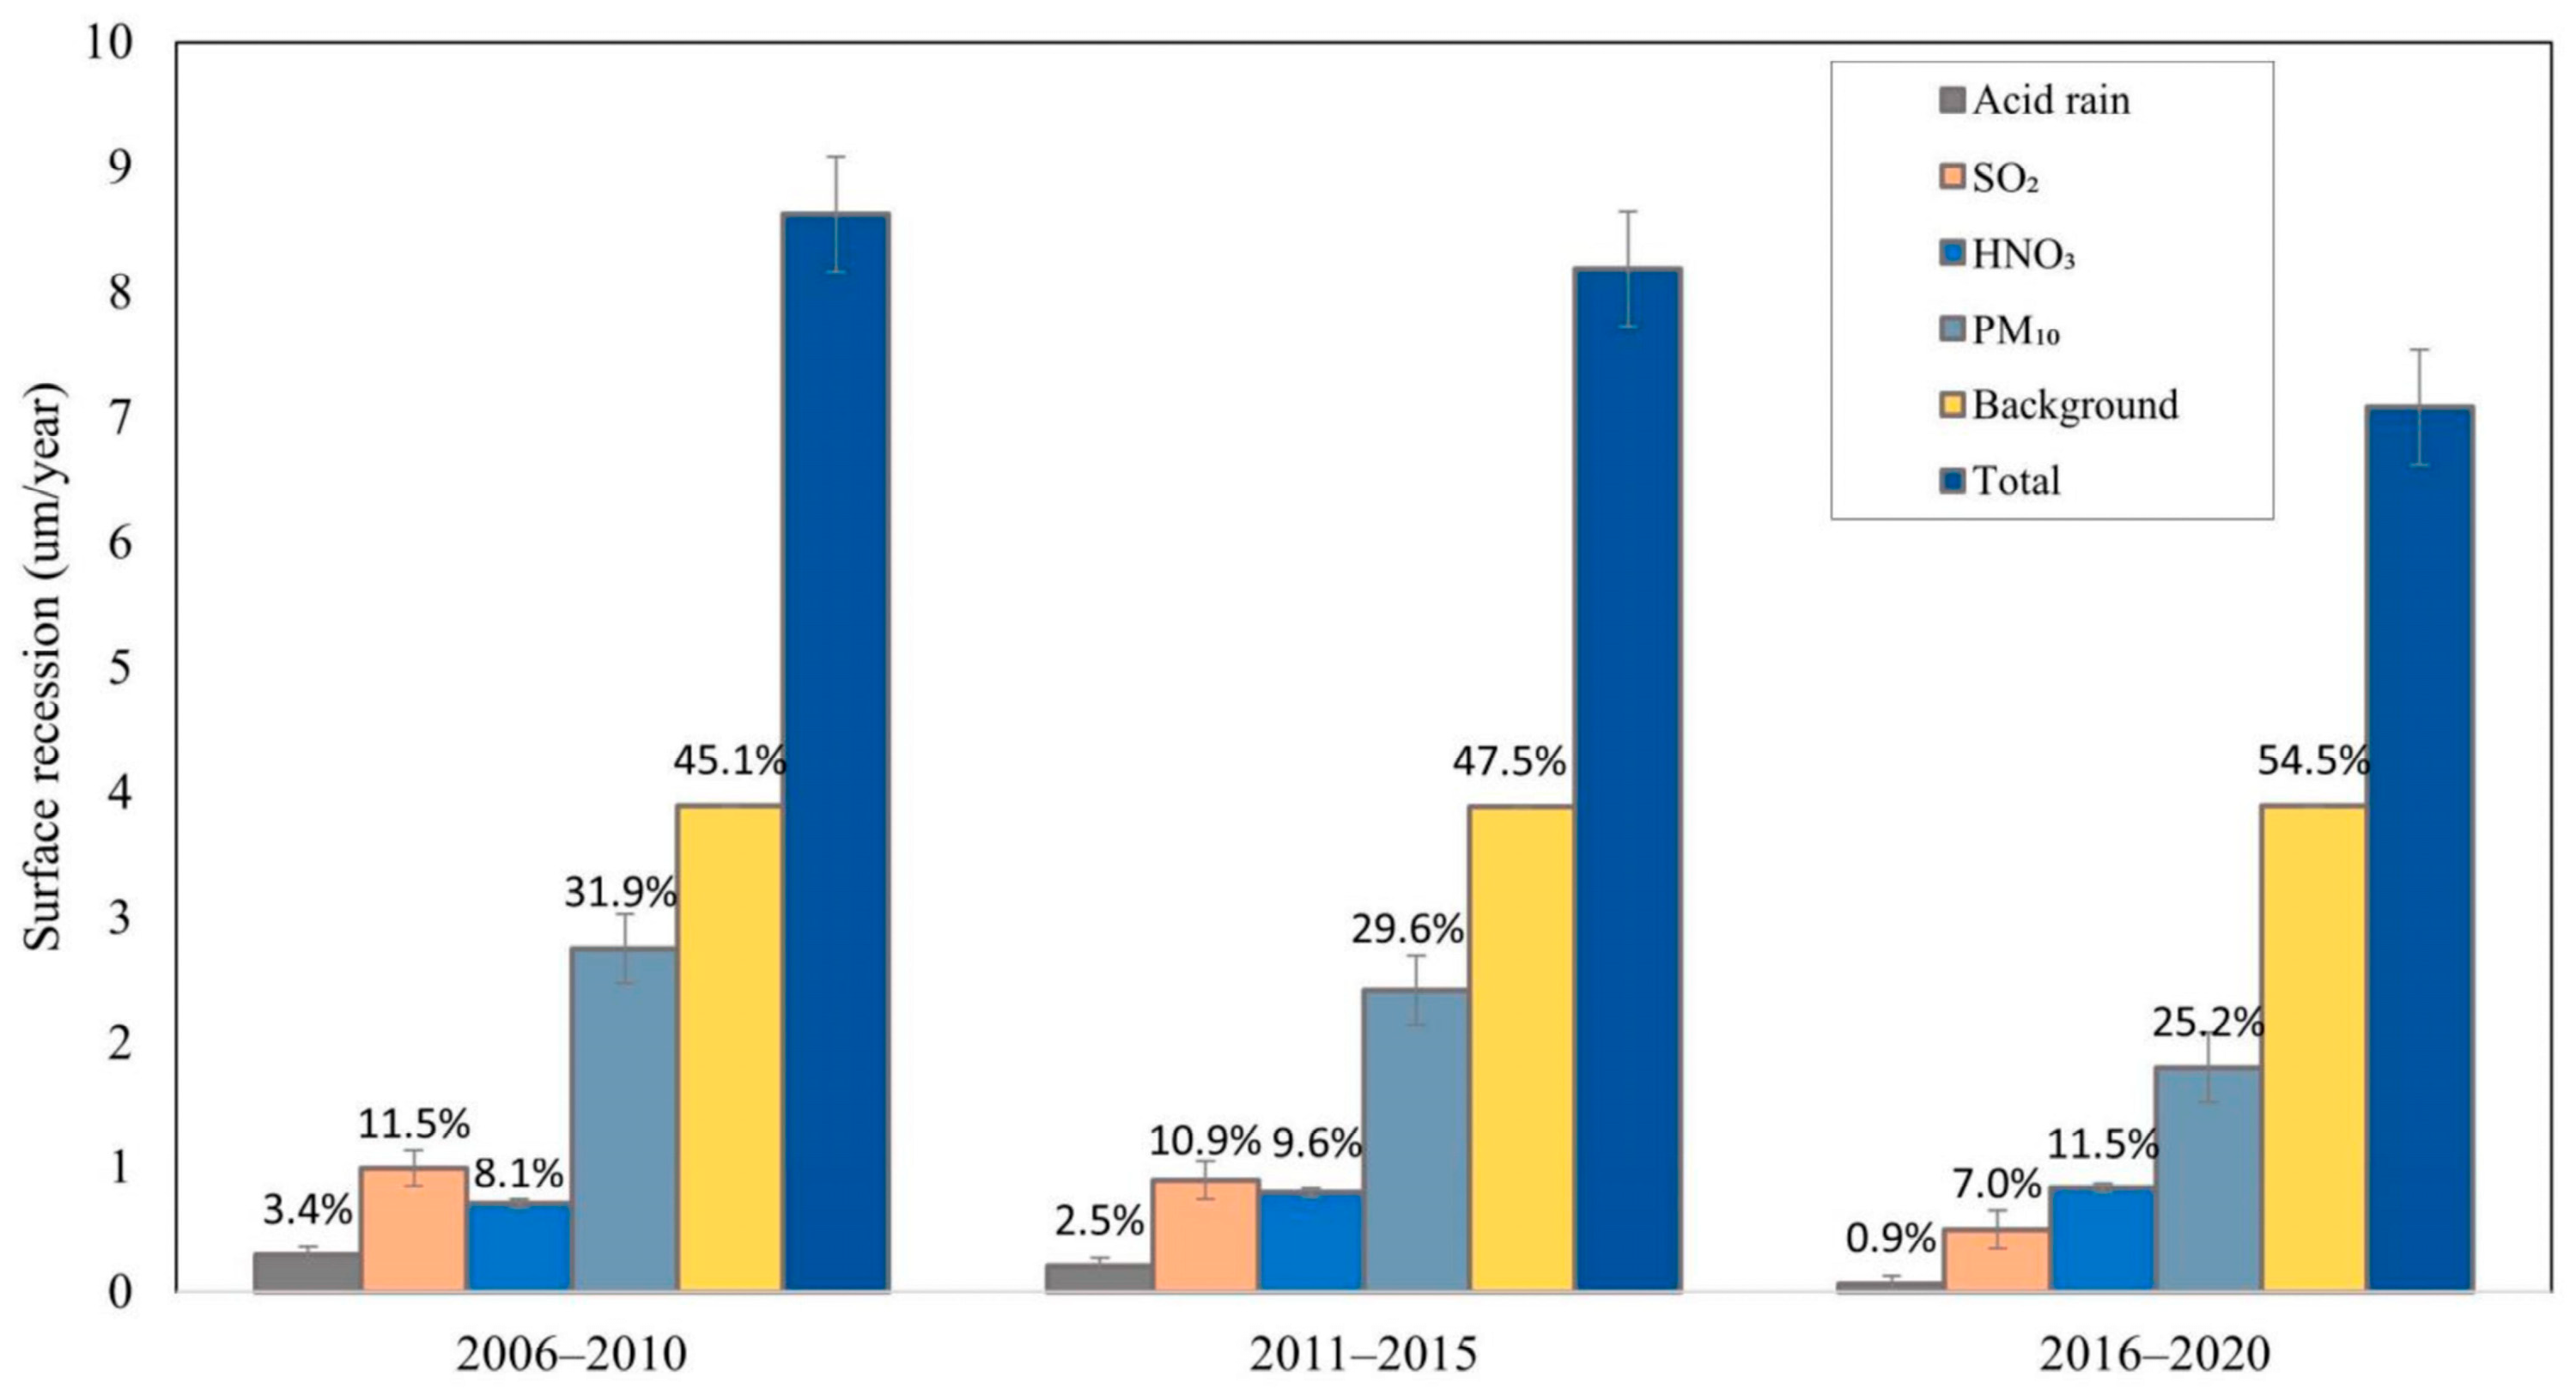
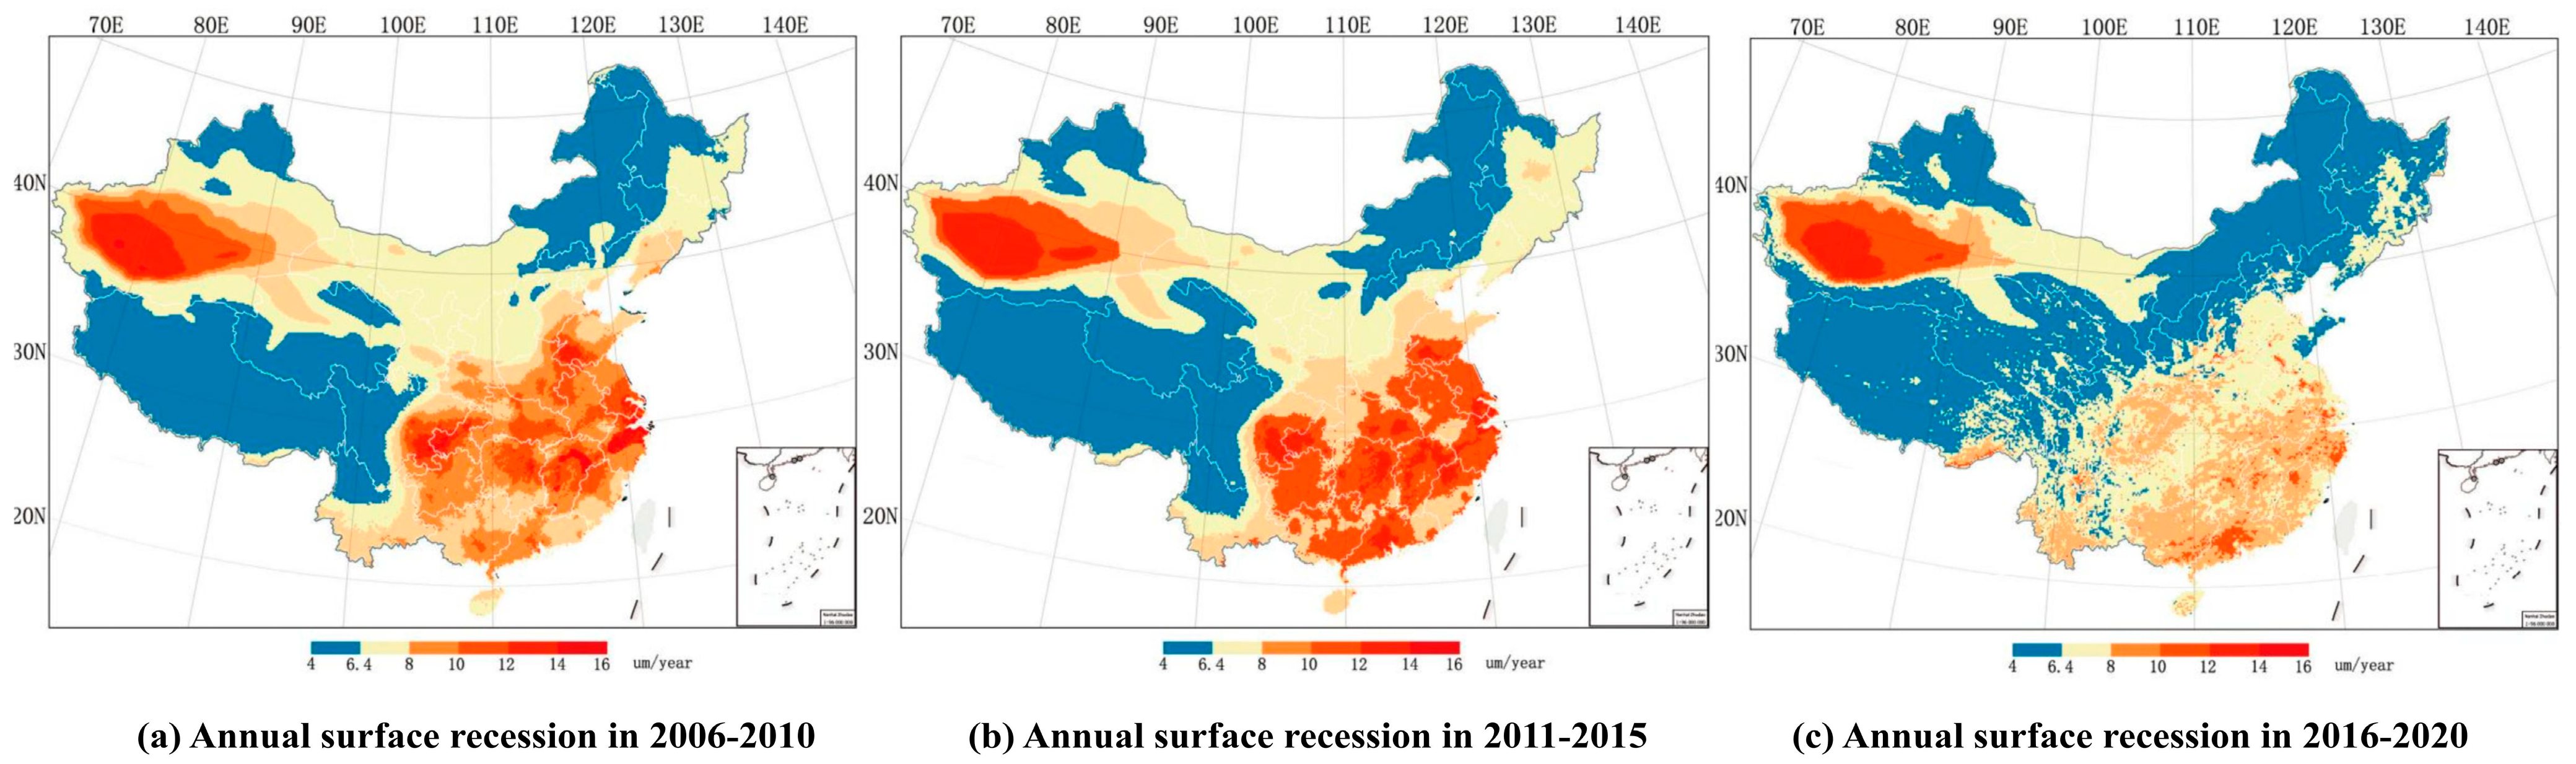
DRFs provide a quantitative assessment of how major pollutants (SO2, NOx/HNO3, O3, PM) and climate variables (precipitation, humidity, temperature) affect the corrosion of materials such as limestone, sandstone, copper, and steel. By translating scientific data into management thresholds, DRFs support proactive conservation strategies ranging from pollution control to material-level interventions. European initiatives like ICP Materials and MULTI-ASSESS have incorporated multi-pollutant and climate factors, marking a transition from SO2-dominated models to more complex pollutant regimes. In China, localized adaptations, particularly in response to high particulate matter levels, have helped reduce corrosion risks and generate significant economic benefits.
(2)
Despite their strengths in quantification and simplicity, DRFs have limitations. They often overlook microclimatic effects and sudden damage from extreme events such as floods or heatwaves. Moreover, their material scope is limited, making them less effective for diverse heritage materials like marble, stained glass, or terracotta. These gaps highlight the need for model refinement and broader applicability.
(3)
Emerging technologies offer valuable support. Sensor networks allow real-time microclimate and corrosion tracking, remote sensing extends spatial coverage, and machine learning models help reveal complex environmental interactions. No single tool is sufficient—integrating DRFs with these technologies enables more responsive and precise risk management.
(4)
The comparison of European and Chinese experiences highlights the need for continuous model updates. In Europe, residual ozone and climate now play larger roles. In China, rapid pollution reduction and climate diversity demand recalibrated DRFs, tailored to local conditions through field validation—especially in monsoon, arid, and alpine zones.
Future research directions should focus on the synergistic advancement of multivariable nonlinear modeling, empirical data updates, and sensor IoT integration:
(1)
Although DRFs have been developed, these models require further refinement and the inclusion of additional material types, particularly non-metallic and non-stone materials such as wood.
(2)
Integrate multivariable nonlinear modeling and machine learning. Combining physicochemical corrosion mechanisms with data-driven models (e.g., machine learning) can better capture complex, nonlinear interactions between multiple pollutants and climate factors, improving the accuracy of DRF-based risk predictions.
(3)
Expand empirical data collection across diverse climates. Long-term exposure studies should be extended to underrepresented climatic zones—such as monsoon, arid, and alpine regions—especially in Asia, Africa, and Latin America. This will support both regional adaptation and global applicability of DRFs.
(4)
Enhance DRF responsiveness through IoT and real-time monitoring. Sensor networks and IoT platforms can provide continuous microclimate and material condition data, allowing real-time comparison with DRF predictions. This enables the establishment of a dynamic “prediction–validation–adjustment” loop for responsive risk management. By integrating DRFs with machine learning and IoT feedback, the field can move from static, average-based models to dynamic systems that respond to rapidly changing urban environments, allowing for more precise, timely, and sustainable cultural heritage protection.

Author Contributions

Z.B.: Conceptualization, visualization, formal analysis, writing—original draft preparation. Y.Y.: Supervision, writing—review and editing. All authors have read and agreed to the published version of the manuscript.

Funding

This research received no external funding.

Data Availability Statement

Not applicable.

Conflicts of Interest

The authors declare no conflicts of interest.

References

  1. Grossi, C.M.; Murray, M.; Butlin, R.N. Response of porous building stones to acid deposition. Water Air Soil Pollut. 1995, 85, 2713–2718. [Google Scholar] [CrossRef]
  2. Cavalagli, N.; Kita, A.; Castaldo, V.; Pisello, A.; Ubertini, F.J.C.; Materials, B. Hierarchical environmental risk mapping of material degradation in historic masonry buildings: An integrated approach considering climate change and structural damage. Constr. Build. Mater. 2019, 215, 998–1014. [Google Scholar] [CrossRef]
  3. Vidal, F.; Vicente, R.; Bastos, A.; Ferro Rocha, A.; Mendes Silva, J. Atmospheric corrosion in two different urban environments in Portugal: Results of one-year exposure. Corros. Eng. Sci. Technol. 2019, 54, 614–626. [Google Scholar] [CrossRef]
  4. UNESCO. Operational Guidelines for the Implementation of the World Heritage Convention; UNESCO World Heritage Centre: Paris, France, 2023. [Google Scholar]
  5. Brimblecombe, P.; Lefèvre, R.-A. Weathering of materials at Notre-Dame from changes in air pollution and climate in Paris, 1325–2090. J. Cult. Herit. 2021, 50, 88–94. [Google Scholar] [CrossRef]
  6. Bonazza, A.; Sardella, A.; Kaiser, A.; Cacciotti, R.; De Nuntiis, P.; Hanus, C.; Maxwell, I.; Drdácký, T.; Drdácký, M. Safeguarding cultural heritage from climate change related hydrometeorological hazards in Central Europe. Int. J. Disaster Risk Reduct. 2021, 63, 102455. [Google Scholar] [CrossRef]
  7. Wang, X.M.; Li, H.M.; Wang, Y.F.; Zhao, X.F. Quantifying the Potential Co-Benefit of Air Quality Improvement on Cultural Heritage in China. Sustainability 2023, 15, 8709. [Google Scholar] [CrossRef]
  8. EEA. Air Quality in Europe; European Environment Agency: Copenhagen, Denmark, 2019. [Google Scholar]
  9. Sesana, E.; Gagnon, A.S.; Ciantelli, C.; Cassar, J.; Hughes, J.J. Climate change impacts on cultural heritage: A literature review. Wiley Interdiscip. Rev. Clim. Change 2021, 12, e710. [Google Scholar] [CrossRef]
  10. Karaca, F. Mapping the corrosion impact of air pollution on the historical peninsula of Istanbul. J. Cult. Herit. 2013, 14, 129–137. [Google Scholar] [CrossRef]
  11. Watt, J.; Jarrett, D.; Hamilton, R. Dose–response functions for the soiling of heritage materials due to air pollution exposure. Sci. Total Environ. 2008, 400, 415–424. [Google Scholar] [CrossRef]
  12. Tzanis, C.; Varotsos, C.; Christodoulakis, J.; Tidblad, J.; Ferm, M.; Ionescu, A.; Lefevre, R.-A.; Theodorakopoulou, K.; Kreislova, K. On the corrosion and soiling effects on materials by air pollution in Athens, Greece. Atmos. Chem. Phys. 2011, 11, 12039–12048. [Google Scholar] [CrossRef]
  13. Varotsos, C.; Tzanis, C.; Cracknell, A. The enhanced deterioration of the cultural heritage monuments due to air pollution. Environ. Sci. Pollut. Res. 2009, 16, 590–592. [Google Scholar] [CrossRef] [PubMed]
  14. RISE Research Institutes of Sweden. ICP Materials. Available online: https://www.ri.se/en/icp-materials (accessed on 1 May 2025).
  15. Visone, F.; Abate, N.; Sileo, M.; Masini, N. Assessing Stone Material Recession of Cultural Heritage: New Approach Based on Satellite-Based Rainfall Data and Dose-Response Functions—Case of UNESCO Site of Matera. Remote Sens. 2025, 17, 1443. [Google Scholar] [CrossRef]
  16. Grau-Bové, J.; Orr, S.A.; Thomas, H.; Andrews, M. Using damage functions to map heritage climatology at a global scale. Sci. Total Environ. 2025, 963, 178350. [Google Scholar] [CrossRef] [PubMed]
  17. UNESCO World Heritage Centre. Climate Change and World Heritage; UNESCO World Heritage Centre: Paris, France, 2007. [Google Scholar]
  18. Wu, W.; Xu, D.; Liu, L.; Wang, B.; Cheng, X.; Zhang, X.; Li, X. Fusion of multi source data for atmospheric corrosion evaluation using sensors and image recognition. npj Mater. Degrad. 2025, 9, 13. [Google Scholar] [CrossRef]
  19. Yan, Y.; Wang, Y. A Review of Atmospheric Deterioration and Sustainable Conservation of Calcareous Stone in Historical Buildings and Monuments. Sustainability 2024, 16, 10751. [Google Scholar] [CrossRef]
  20. Coletti, C. Climate Change Threats to Stone Cultural Heritage: State of the Art of Quantitative Damage Functions and New Challenges for a Sustainable Future. Heritage 2024, 7, 3276–3290. [Google Scholar] [CrossRef]
  21. Sun, B.; Li, X.; Peng, N.; Sheng, Y.; Liang, Y. Experimental Study on Salt-Bearing Sandstone Samples Under the Change of Temperature and Humidity Cycle. Int. J. Archit. Herit. 2024, 1–12. [Google Scholar] [CrossRef]
  22. Giglio, F.; Frontera, P.; Malara, A.; Armocida, F. Materials and climate change: A set of indices as the benchmark for climate vulnerability and risk assessment for tangible cultural heritage in Europe. Sustainability 2024, 16, 2067. [Google Scholar] [CrossRef]
  23. Vasanelli, E.; Quarta, G.; Masieri, M.; Calia, A. High temperature effects on the properties of a high porosity calcareous stone building material. Eur. J. Environ. Civ. Eng. 2022, 26, 6733–6745. [Google Scholar] [CrossRef]
  24. Czarnecki, S.; Moj, M.; Banaszak, A.; Chowaniec-Michalak, A.; Jamroz, P.; Dzimitrowicz, A.; Sadowski, L. Mechanical and chemical wear of epoxy composites filled with waste bricks. Wear 2025, 571, 205815. [Google Scholar] [CrossRef]
  25. Akhter, P.; Arshad, A.; Hussain, M. A review on environmental impacts of paints and strategies for producing eco-friendly-paints. Int. J. Environ. Sci. Technol. 2025, 22, 555–578. [Google Scholar] [CrossRef]
  26. Kucera, V. Model for Multi-Pollutant Impact and Assessment of Threshold Levels for Cultural Heritage; Michael Melcher and Manfred Schreiner Institute of Sciences and Technologies in Art: Vienna, Austria, 2005. [Google Scholar]
  27. Broomandi, P.; Tleuken, A.; Zhaxylykov, S.; Nikfal, A.; Kim, J.R.; Karaca, F. Assessment of potential benefits of traffic and urban mobility reductions during COVID-19 lockdowns: Dose-response calculations for material corrosions on built cultural heritage. Environ. Sci. Pollut. Res. 2022, 29, 6491–6510. [Google Scholar] [CrossRef] [PubMed]
  28. Meng, L.; Yan, C.; Lv, S.; Sun, H.; Xue, S.; Li, Q.; Zhou, L.; Edwing, D.; Edwing, K.; Geng, X. Synthetic aperture radar for geosciences. Rev. Geophys. 2024, 62, e2023RG000821. [Google Scholar] [CrossRef]
  29. Timoncini, A.; Brattich, E.; Bernardi, E.; Chiavari, C.; Tositti, L. Safeguarding outdoor cultural heritage materials in an ever-changing troposphere: Challenges and new guidelines for artificial ageing test. J. Cult. Herit. 2023, 59, 190–201. [Google Scholar] [CrossRef]
  30. Avenel, C.; Raccurt, O.; Gardette, J.-L.; Therias, S. Review of accelerated ageing test modelling and its application to solar mirrors. Sol. Energy Mater. Sol. Cells 2018, 186, 29–41. [Google Scholar] [CrossRef]
  31. Ivaskova, M.; Kotes, P.; Brodnan, M.J.P.E. Air pollution as an important factor in construction materials deterioration in Slovak Republic. Procedia Eng. 2015, 108, 131–138. [Google Scholar] [CrossRef]
  32. De la Fuente, D.; Vega, J.M.; Viejo, F.; Díaz, I.; Morcillo, M. Mapping air pollution effects on atmospheric degradation of cultural heritage. J. Cult. Herit. 2013, 14, 138–145. [Google Scholar] [CrossRef]
  33. Wu, P.-S.; Hsieh, C.-M.; Hsu, M.-F. Using heritage risk maps as an approach to estimating the threat to materials of traditional buildings in Tainan (Taiwan). J. Cult. Herit. 2014, 15, 441–447. [Google Scholar] [CrossRef]
  34. Tidblad, J. Mapping Manual Ch 4 Final-Update; UBA: Dessau-Roßlau, Germany, 2021. [Google Scholar]
  35. CULT-STRAT. Assessment of Air Pollution Effects on Cultural Heritage—Management Strategies; European Commission: Brussels, Belgium, 2007. [Google Scholar]
  36. Torkmahalleh, M.A.; Hopke, P.K.; Broomandi, P.; Naseri, M.; Abdrakhmanov, T.; Ishanov, A.; Kim, J.; Shah, D.; Kumar, P. Exposure to particulate matter and gaseous pollutants during cab commuting in Nur-Sultan city of Kazakhstan. Atmos. Pollut. Res. 2020, 11, 880–885. [Google Scholar] [CrossRef]
  37. Ferm, M.; De Santis, F.; Varotsos, C. Nitric acid measurements in connection with corrosion studies. Atmos. Environ. 2005, 39, 6664–6672. [Google Scholar] [CrossRef]
  38. Kucera, V.; Tidblad, J.; Kreislova, K.; Knotkova, D.; Faller, M.; Reiss, D.; Snethlage, R.; Yates, T.; Henriksen, J.; Schreiner, M.; et al. UN/ECE ICP materials dose-response functions for the multi-pollutant situation. Water Air Soil Pollut. Focus 2007, 7, 249–258. [Google Scholar] [CrossRef]
  39. Tidblad, J.; Kucera, V.; Ferm, M.; Kreislova, K.; Brüggerhoff, S.; Doytchinov, S.; Screpanti, A.; Grøntoft, T.; Yates, T.; De La Fuente, D. Effects of air pollution on materials and cultural heritage: ICP materials celebrates 25 years of research. Int. J. Corros. 2012, 2012, 496321. [Google Scholar] [CrossRef]
  40. Broomandi, P.; Jahanbakhshi, A.; Fathian, A.; Darynova, Z.; Janatian, N.; Nikfal, A.; Kim, J.R.; Karaca, F. Impacts of ambient air pollution on UNESCO world cultural heritage sites in Eastern Asia: Dose-response calculations for material corrosions. Urban Clim. 2022, 46, 101275. [Google Scholar] [CrossRef]
  41. Bonazza, A.; Messina, P.; Sabbioni, C.; Grossi, C.M.; Brimblecombe, P. Mapping the impact of climate change on surface recession of carbonate buildings in Europe. Sci. Total Environ. 2009, 407, 2039–2050. [Google Scholar] [CrossRef] [PubMed]
  42. Sabbioni, C.; Cassar, M.; Brimblecombe, P.; Tidblad, J.; Kozlowski, R.; Drdácký, M.; Sáiz-Jiménez, C.; Grøntoft, T.; Wainwright, I.; Ariño, X. Global climate change impact on built heritage and cultural landscapes. In Proceedings of the International Conference on Heritage, Weathering and Conservation, HWC 2006, Madrid, Spain, 21–24 June 2006; pp. 395–401. [Google Scholar]
  43. Grossi, C.M.; Brimblecombe, P.; Harris, I. Predicting long term freeze–thaw risks on Europe built heritage and archaeological sites in a changing climate. Sci. Total Environ. 2007, 377, 273–281. [Google Scholar] [CrossRef]
  44. Sabbioni, C.; Brimblecombe, P.; Cassar, M. The Atlas of Climate Change Impact on European Cultural Heritage; European Union: Brussels, Belgium, 2010. [Google Scholar]
  45. Schröder, S.A.; Costantini, I.; Etxebarria, I.; Madariaga, J.M.; Arana, G. Assessment of marine and urban-industrial environmental impact on stone acting as the base of a quaternary bronze sculpture. Microchem. J. 2024, 204, 111187. [Google Scholar] [CrossRef]
  46. Melcher, M.; Wiesinger, R.; Schreiner, M. Degradation of glass artifacts: Application of modern surface analytical techniques. Acc. Chem. Res. 2010, 43, 916–926. [Google Scholar] [CrossRef] [PubMed]
  47. Verney-Carron, A.; Sessegolo, L.; Lefèvre, R.-A.; Brimblecombe, P. Modelling the Alteration of Medieval Stained Glass as a Function of Climate and Pollution: Comparison between Different Methodologies. Heritage 2023, 6, 3074–3088. [Google Scholar] [CrossRef]
  48. Lombardo, T.; Ionescu, A.; Chabas, A.; Lefèvre, R.-A.; Ausset, P.; Candau, Y. Dose–response function for the soiling of silica–soda–lime glass due to dry deposition. Sci. Total Environ. 2010, 408, 976–984. [Google Scholar] [CrossRef]
  49. Verney-Carron, A.; Dutot, A.; Lombardo, T.; Chabas, A. Predicting changes of glass optical properties in polluted atmospheric environment by a neural network model. Atmos. Environ. 2012, 54, 141–148. [Google Scholar] [CrossRef]
  50. Vidović, K.; Hočevar, S.; Menart, E.; Drventić, I.; Grgić, I.; Kroflič, A. Impact of air pollution on outdoor cultural heritage objects and decoding the role of particulate matter: A critical review. Environ. Sci. Pollut. Res. 2022, 29, 46405–46437. [Google Scholar] [CrossRef] [PubMed]
  51. Brischke, C.; Rapp, A.O. Dose–response relationships between wood moisture content, wood temperature and fungal decay determined for 23 European field test sites. Wood Sci. Technol. 2008, 42, 507–518. [Google Scholar] [CrossRef]
  52. Brischke, C.; Alfredsen, G. Wood-water relationships and their role for wood susceptibility to fungal decay. Appl. Microbiol. Biotechnol. 2020, 104, 3781–3795. [Google Scholar] [CrossRef]
  53. Spezzano, P. Mapping the susceptibility of UNESCO World Cultural Heritage sites in Europe to ambient (outdoor) air pollution. Sci. Total Environ. 2021, 754, 142345. [Google Scholar] [CrossRef] [PubMed]
  54. EMEP. EMEP MSC-W Modelled Air Concentrations and Depositions. 2015. Available online: https://emep.int/mscw/mscw_moddata.html (accessed on 1 May 2025).
  55. UNECE. Transport Statistics Infocards. 2020. Available online: http://www.unece.org/trans/main/wp6/infocards.html (accessed on 1 May 2025).
  56. Hettelingh, J.-P.; Posch, M. Critical load exceedances under equitable nitrogen emission reductions in the EU28. Atmos. Environ. 2019, 211, 113–119. [Google Scholar] [CrossRef]
  57. Wang, Z.; Tan, Y.; Guo, M.; Cheng, M.; Gu, Y.; Chen, S.; Wu, X.; Chai, F. Prospect of China’s ambient air quality standards. J. Environ. Sci. 2023, 123, 255–269. [Google Scholar] [CrossRef]
  58. Tidblad, J.; Kreislová, K.; Faller, M.; De la Fuente, D.; Yates, T.; Verney-Carron, A.; Grøntoft, T.; Gordon, A.; Hans, U. ICP materials trends in corrosion, soiling and air pollution (1987–2014). Materials 2017, 10, 969. [Google Scholar] [CrossRef]
  59. Yang, X.; Wu, F.; Xu, R.; Li, N.; Zhang, Z.; Xue, P.; Wang, W.; Zhao, X. Concentrations, sources, and influential factors of water-soluble ions of atmospheric particles in Dunhuang Mogao Grottoes, a world heritage site in China. J. Arid Land 2022, 14, 1395–1412. [Google Scholar] [CrossRef]
  60. Prosek, T.; Kouril, M.; Dubus, M.; Taube, M.; Hubert, V.; Scheffel, B.; Degres, Y.; Jouannic, M.; Thierry, D. Real-time monitoring of indoor air corrosivity in cultural heritage institutions with metallic electrical resistance sensors. Stud. Conserv. 2013, 58, 117–128. [Google Scholar] [CrossRef]
  61. Dereszynski, E.W.; Dietterich, T.G. Spatiotemporal models for data-anomaly detection in dynamic environmental monitoring campaigns. ACM Trans. Sens. Netw. (TOSN) 2011, 8, 1–36. [Google Scholar] [CrossRef]
  62. Pavlopoulos, L.; Michalis, P.; Vlachos, M.; Georgakopoulos, A.; Tsiakos, C.; Amditis, A. Integrated sensing solutions for monitoring heritage risks. In Proceedings of the IGARSS 2024–2024 IEEE International Geoscience and Remote Sensing Symposium, Athens, Greece, 7–12 July 2024; pp. 3352–3355. [Google Scholar]
  63. Martinelli, L.; Calcerano, F.; Adinolfi, F.; Chianetta, D.; Gigliarelli, E. Open HBIM-IoT Monitoring Platform for the Management of Historical Sites and Museums. An Application to the Bourbon Royal Site of Carditello. Int. J. Archit. Herit. 2025, 19, 153–170. [Google Scholar] [CrossRef]
  64. Li, M.; Gao, X.; Yang, M.; Tang, L.; Tang, B.-H. Evaluating the stability of architectural heritage from the perspective of InSAR: A practical study on Jianchuan Ancient Town. Herit. Sci. 2024, 12, 394. [Google Scholar] [CrossRef]
  65. Moise, C.; Dana Negula, I.; Mihalache, C.E.; Lazar, A.M.; Dedulescu, A.L.; Rustoiu, G.T.; Inel, I.C.; Badea, A. Remote sensing for cultural heritage assessment and monitoring: The case study of Alba Iulia. Sustainability 2021, 13, 1406. [Google Scholar] [CrossRef]
  66. Stoean, R.; Bacanin, N.; Stoean, C.; Ionescu, L.; Atencia, M.; Joya, G. Computational framework for the evaluation of the composition and degradation state of metal heritage assets by deep learning. J. Cult. Herit. 2023, 64, 198–206. [Google Scholar] [CrossRef]
  67. Coelho, L.B.; Zhang, D.; Van Ingelgem, Y.; Steckelmacher, D.; Nowé, A.; Terryn, H. Reviewing machine learning of corrosion prediction in a data-oriented perspective. npj Mater. Degrad. 2022, 6, 8. [Google Scholar] [CrossRef]
  68. Jia, H.; Qiao, G.; Han, P. Machine learning algorithms in the environmental corrosion evaluation of reinforced concrete structures—A review. Cem. Concr. Compos. 2022, 133, 104725. [Google Scholar] [CrossRef]
  69. Sorrentino, B.; Screpanti, A.; De Marco, A. Corrosion on cultural heritage buildings in Jordan in current situation and in future climate scenarios. Sci. Rep. 2024, 14, 25373. [Google Scholar] [CrossRef]
  70. Neocleous, K.; Christofe, A.; Agapiou, A.; Evagorou, E.; Themistocleous, K.; Hadjimitsis, D. Digital mapping of corrosion risk in coastal urban areas using remote sensing and structural condition assessment: Case study in Cyprus. Open Geosci. 2016, 8, 662–674. [Google Scholar] [CrossRef]
  71. Agbota, H.; Mitchell John, E.; Odlyha, M.; Strlič, M. Remote assessment of cultural heritage environments with wireless sensor array networks. Sensors 2014, 14, 8779–8793. [Google Scholar] [CrossRef]
  72. Ruiz, D.; Casas, A.; Escobar, C.A.; Perez, A.; Gonzalez, V. Advanced machine learning techniques for corrosion rate estimation and prediction in industrial cooling water pipelines. Sensors 2024, 24, 3564. [Google Scholar] [CrossRef]
  73. Zhang, H.; Shu, B.; Liu, Y.; Wei, Y.; Zhang, H. Cultural Heritage Risk Assessment Based on Explainable Machine Learning Models: A Case Study of the Ancient Tea Horse Road in China. Land 2025, 14, 734. [Google Scholar] [CrossRef]
  74. Franzoni, E.; Sassoni, E. Correlation between microstructural characteristics and weight loss of natural stones exposed to simulated acid rain. Sci. Total Environ. 2011, 412, 278–285. [Google Scholar] [CrossRef] [PubMed]
  75. Shin, B.; Choi, C.; Qiu, R.; Kim, S.; Kim, H.; Moon, S.; Son, G.; Kim, J.; Han, H.; Yeom, Y.S. Photon dose response functions for accurate skeletal dosimetry for Korean and Asian populations. Nucl. Eng. Technol. 2024, 56, 2195–2207. [Google Scholar] [CrossRef]
  76. Grøntoft, T.; Hallett, K.; Blades, N. Environmental dose-response functions of silk and paper exposed in museums. Polym. Degrad. Stab. 2024, 227, 110878. [Google Scholar] [CrossRef]
  77. Moreno, M.; Ortiz, R.; Ortiz, P. Remote sensing to assess the risk for cultural heritage: Forecasting potential collapses due to rainfall in historic fortifications. Int. J. Build. Pathol. Adapt. 2024, 42, 92–113. [Google Scholar] [CrossRef]
  78. Cuca, B.; Zaina, F.; Tapete, D. Monitoring of damages to cultural heritage across Europe using remote sensing and earth observation: Assessment of scientific and grey literature. Remote Sens. 2023, 15, 3748. [Google Scholar] [CrossRef]
  79. Su, T.-C. Environmental risk mapping of physical cultural heritage using an unmanned aerial remote sensing system: A case study of the Huang-Wei monument in Kinmen, Taiwan. J. Cult. Herit. 2019, 39, 140–151. [Google Scholar] [CrossRef]
Figure 1. Mechanisms of interaction between air pollutants and meteorological conditions in atmospheric corrosion processes.
Buildings 15 02271 g001
Figure 2. Schematic diagram of the multi-pollution risk assessment process.
Buildings 15 02271 g002
Figure 3. Risk map for corrosion decline of materials and damage rate arranged from greatest to least (R, μm, first year exposure) in the European region [53], The red horizontal lines in the figure below represent critical thresholds between 2020 and 2050, beyond which material degradation would be considered high risk or unacceptable based on conservation criteria.
Buildings 15 02271 g003
Figure 4. The contribution of different pollutants to heritage recession [7].
Buildings 15 02271 g004
Figure 5. Estimated annual surface recession of limestone material of heritage sites in 2006–2020 [7].
Buildings 15 02271 g005
Table 1. Main risks of climate change and their impact on cultural heritage [17].
Climate IndicatorClimate Change RisksPhysical, Social, and Cultural Impacts on Cultural Heritage
Humidity ChangesFloods; Heavy rainfall; Changes in soil chemistry; Groundwater changes; Humidity cycle changesFloods erode heritage materials, causing cracks and expansion; Increased groundwater levels lead to instability of historical buildings; Drainage system failures; Humidity and drying affect the surface salt crystallization and dissolution of archaeological sites
Temperature ChangesDaily, seasonal, extreme events; Increased freeze-thaw, Wetting timeThermal stress leads to the deterioration of building structures; Frost action after internal wetting of masonry materials
Wind EnvironmentIncreased frequency of strong winds, gusts; Wind transport of salt; Wind transport of sandIncreased static and dynamic loads on historical buildings; Internal structural damage and collapse of buildings; Accelerated surface erosion of artifacts
Air PollutionChanges in precipitation pH; Changes in pollutant depositionCarbonating dissolution causing stone decay; Black crust formation on materials; Metal corrosion
Biological EffectsSpread of invasive species; Growth and increase of mold; Changes in lichen biology; Reduction of original plant speciesOrganic materials subjected to biological attack by insects, molds, fungi, termites, etc.; Structural timber and wood veneer decay
Table 2. Dose–response functions of air pollution on the corrosion of heritage materials [26,34,35].
ScenarioMaterialDose–Response Function
SO2 Dominated ScenarioCarbon steel M L = 34 S O 2 0.13 e 0.020 R h + f ( T ) t 0.33
W h e n   T 10   ° C , f T = 0.059 T 10 , o t h e r w i s e   f T = 0.036 T 10
(1)
Zinc M L = 1.4 S O 2 0.22 e 0.018 R h + f ( T ) t 0.85 + 0.029 R a i n H + t
W h e n   T 10   ° C , f T = 0.062 T 10 , o t h e r w i s e   f T = 0.021 T 10
(2)
Aluminum M L = 0.0021 S O 2 0.23 R h · e f T t 1.2 + 0.000023 R a i n C l t
W h e n   T 10   ° C , f T = 0.031 T 10 , o t h e r w i s e   f T = 0.061 T 10
(3)
Copper M L = 0.0027 S O 2 0.32 O 3 0.79 R h · e f ( T ) t 0.78 + 0.050 R a i n H + t 0.89
W h e n   T 10   ° C , f T = 0.083 T 10 , o t h e r w i s e   f T = 0.032 T 10
(4)
Bronze M L = 0.026 S O 2 0.44 R h · e f ( T ) t 0.86 + 0.029 R a i n H + t 0.76 + 0.00043 R a i n C l t 0.76
W h e n   T 11   ° C , f T = 0.060 T 11 , o t h e r w i s e   f T = 0.067 T 11
(5)
Limestone R = 2.7 S O 2 0.48 e 0.018 T t 0.96 + 0.019 R a i n H + t 0.96 (6)
Sandstone R = 2.0 S O 2 0.52 e f ( T ) t 0.91 + 0.028 R a i n H + t 0.91
W h e n   T 10   ° C , f T = 0 , o t h e r w i s e   f T = 0.013 T 10
(7)
Multi-PollutantCarbon Steel R = 6.5 + 0.178 S O 2 0.6 R h 60 e f T + 0.166 R a i n H + + 0.076 P M 10
W h e n   T < 10   ° C , f T = 0.15 T 10 , o t h e r w i s e   f T = 0.054 T 10
(8)
Zinc R = 0.49 + 0.066 S O 2 0.22 e 0.018 R h + f T + 0.0057 R a i n H + + 0.192 H N O 3
W h e n   T < 10   ° C , f T = 0.062 T 10 , o t h e r w i s e   f T = 0.021 T 10
(9)
Copper M L = 4.2 + 0.00201 S O 2 0.4 O 3 R h 60 e f T + 0.0878 R a i n H +
W h e n   T < 10   ° C , f T = 0.083 T 10 , o t h e r w i s e   f T = 0.032 T 10
(10)
Bronze R = 0.15 + 0.000985 S O 2 R h 60 e f ( T ) + 0.00465 R a i n H + + 0.00432 P M 10
W h e n   T < 11   ° C , f T = 0.060 T 11 , o t h e r w i s e   f T = 0.067 T 11
(11)
Limestone R = 4.0 + 0.0059 S O 2 R h 60 + 0.054 R a i n H + + 0.078 H N O 3 R h 60 + 0.0258 P M 10
H N O 3 = 516 e 3400 ( T + 273 ) · N O 2 O 3 R h 0.5
(12)
Table 3. Environmental data required to assess the dose–response function for the subject material (X for mandatory, — for non-mandatory) [39].
ScenarioMaterialTemperature (T)Relative Humidity (Rh)Sulfur Dioxide (SO2)Ozone (O3)Nitric Acid (HNO3)Particulate Matter (PM10)Precipitation (Prec)pHChloride Ions (Cl)
SO2-Dominated ScenarioCarbon SteelXXX
ZincXXXXX
AluminumXXXXX
CopperXXXXXX
BronzeXXXXX
LimestoneXXXX
SandstoneXXXX
Multi-Pollutant ScenarioCarbon SteelXXXXXX
ZincXXXX
BronzeXXXXXX
LimestoneXXXXXX
Table 4. Degradation criteria for materials at recommended target levels [26,34,35].
MaterialTolerable Deterioration RateUnit
Year 2020 (n = 2.5)Year 2050 (n = 2)
Steel and Carbon Steel2016µm, surface recession or corrosion depth per year
Zinc1.10.9
Aluminum0.220.18
Copper0.80.64
Bronze0.60.5
Limestone86.4
Sandstone75.5
Table 5. Comparison of DRFs and alternative methods (sensor networks, ML models, remote sensing) by cost, accuracy, scalability, and responsiveness.
MethodCost (Hardware/Software and Maintenance)Accuracy (Micro-Environment and Complex Interactions)Scalability (Across Sites/Regions)Responsiveness (Timeliness/Real-Time Feedback)Practical
Deployment (Equipment, Data Needs, Integration)
References
Dose–Response
Functions
(DRFs)
Low: Uses existing environmental data; requires minimal equipmentModerate: Captures broad pollution–climate effects but misses microclimates and complex interactionsHigh: Easily applied via GIS; enables consistent regional corrosion risk mapping once data are availableLow: Based on long-term averages; not real-time; suited for planning, not immediate feedbackEasy: No hardware needed; uses existing data with simple software or spreadsheet-based formulas[69]
Real-Time Sensor MonitoringModerate–High: Requires sensor installation and regular maintenance (e.g., batteries, calibration)High: Offers sensitive in situ measurements at micro-scale; accuracy depends on sensor quality and placementModerate: Scalable with added sites, but expansion requires more devices and infrastructure; complexity grows with scaleHigh: Provides near real-time monitoring; logs data frequently and alerts to rapid environmental changesIntermediate: Requires on-site hardware and network setup; signal issues possible; needs data management software[71]
Remote Sensing and ImagingLow–Moderate: Free data/software enable low-cost analysis; high-res imagery or drones increase costModerate: Accurate for macro-scale mapping; limited micro-scale detection; captures indirect corrosion indicatorsHigh: One satellite image covers large areas; ideal for multi-site comparison and long-term monitoringModerate: Suitable for seasonal tracking; not real-time—may miss sudden changes due to periodic satellite passesStraightforward: No on-site setup; integrates via GIS with heritage data; requires validation and adequate resolution[65,70]
Machine Learning ModelsModerate: Costs lie in data collection and model development; uses affordable computing and existing datasetsHigh: ML predicts corrosion more accurately than formulas; accuracy depends on training data qualityModerate: Applicable across sites with similar data; can integrate with GIS for regional risk mappingHigh: Ingests real-time data and provides instant risk forecasts, enabling proactive conservationChallenging: Requires extensive data for training; user-friendly front end, but complex back-end development and validation[72,73]
Table 6. Comparison of the advantages and limitations of DRFs and alternative corrosion risk assessment tools for heritage materials.
ApproachPrinciple & DataAdvantagesLimitationsReferences
Dose-Response Functions (DRFs)Empirical equations linking environmental dose (pollutant concentrations, rainfall, etc.) to material corrosion rate (µm/yr or mass loss); derived from multi-site exposure data(1) Simple: Needs only standard environmental data (annual SO2, NOx, RH, etc.) to estimate decay
(2) Validated: Built on decades of data, calibrated for common materials across climates
(3) Mapping and Policy: Enables regional risk mapping and air quality policy thresholds
(4) Scenario Testing: Predicts long-term impacts under future climate/pollution scenarios
(1) Limited scope: Only valid within the studied conditions, not for extreme climates or pollution
(2) Simplified: Ignores microclimates and short-term spikes (uses annual averages)
(3) One-material focus: Cannot directly assess combined effects (e.g., mortar-stone)
(4) Static: Provides average corrosion rates, not real-time alerts or fine-scale mapping
[74,75,76]
Real-Time Sensor MonitoringIn situ sensors measuring environmental parameters and corrosion proxies (e.g., electrical resistance probes, atmospheric corrosion monitors for metal loss, pollutant gas sensors)(1) Direct measurement: Tracks actual material corrosion or gas levels on-site
(2) High temporal resolution: Detects diurnal or episodic changes (e.g., overnight corrosion)
(3) Preventive insight: Gives immediate feedback for quick mitigation (e.g., ventilation)
(4) Local accuracy: Captures microclimate effects at specific site points (e.g., showcases, shelters)
(1) Coverage: Limited range—many sensors needed for large sites, costly to deploy
(2) Maintenance: Needs power, calibration, and replacements; drift may degrade data
(3) Data interpretation: Large datasets require expert or automated analysis; raw data needs conversion to material loss units
(4) Specificity: Sensors (e.g., silver) target specific materials; hard to generalize results to others
[62,63]
Remote Sensing and ImagingRemote data assess heritage environments (satellite climate/pollution) or material condition (high-res damage imaging); techniques: satellite Earth observation, drones, laser scanning, spectral imaging(1) Broad coverage: Satellites offer uniform pollution/climate data, enabling global heritage risk maps
(2) Non-contact: LiDAR/photogrammetry creates 3D models to assess erosion/cracks without touching the site
(3) Change detection: Comparing images over time reveals subtle changes (mm-scale loss, color, structure)
(1) Resolution: Satellite data is often too coarse for microclimates (e.g., 10 km grid can’t resolve street-level variations)
(2) Indirect: Remote sensing sees symptoms (like discoloration), needing expert interpretation to link to actual corrosion
(3) Technical needs: Specialized skills for data processing (LiDAR, SAR, etc.), not always available to heritage teams
(4) Costs: High-end imaging (e.g., satellite tasking, LIDAR flights) can be costly
[77,78,79]
Machine Learning ModelsData-driven models use historical data to predict corrosion; inputs are environmental time series; outputs are past corrosion data; methods: neural networks, random forests, etc.(1) Complexity: Models non-linear interactions (thresholds, synergies) missed by linear DRFs
(2) Adaptive: Learns and improves with more data, tailored to site or material
(3) High-dimensional: Can include new data types (spectral data, images) for holistic predictions
(4) Scenario flexibility: Once trained, can test any hypothetical scenario rapidly
(1) Data hungry: Needs lots of historical corrosion data, often missing for heritage sites
(2) Black box: Hard to explain predictions, less intuitive than formulas—can reduce trust
(3) Overfitting: Risks poor performance in new conditions if it learns spurious patterns
(4) Limited adoption: Still experimental, not yet part of standards for cultural heritage
[66,67,68]
Disclaimer/Publisher’s Note: The statements, opinions and data contained in all publications are solely those of the individual author(s) and contributor(s) and not of MDPI and/or the editor(s). MDPI and/or the editor(s) disclaim responsibility for any injury to people or property resulting from any ideas, methods, instructions or products referred to in the content.

