Abstract
To address the engineering issues of difficult quality control, complex construction processes, and long construction periods in cast-in-place protective walls for manually excavated piles, a prefabricated protective wall structure is proposed. This study aims to investigate its mechanical properties and key influencing parameters through experiments. Six groups of prefabricated wall segment specimens with different wall thicknesses (50 mm, 65 mm) and concrete strengths (C50 concrete, reactive powder concrete RPC) were designed, and two-point bending tests were conducted to systematically analyze their failure characteristics, crack development patterns, and strain distribution laws. The test results show that the peak vertical bending displacements at mid-span of the specimens are 11–18 mm (1.83–2.71% of the radius). The 65-mm-thick specimens exhibit 3–10% higher flexural strength than the 50-mm-thick ones, and reactive powder concrete (RPC) specimens of the same thickness show an 8.3% increase in strength compared to C50 concrete specimens. When the load reaches 80% of the ultimate load, abrupt changes in concrete strain occur at the mid-span and loading points, while the strain at the fixed end is only 15–20% of the mid-span strain. The prefabricated protective wall demonstrates superior deformation resistance, with vertical displacements (3–5% of the radius) significantly lower than those of cast-in-place walls. This research clarifies the influence of wall thickness and concrete strength on the mechanical properties of prefabricated protective walls, providing key mechanical parameters to support their engineering applications.
1. Introduction
In recent years, with the rapid development of the civil engineering industry and the continuous optimization of foundation design, pile foundations have been widely used in bridge foundations and transmission line tower foundations. Due to the advantages of low cost, low noise, strong site adaptability, no restrictions on aperture and hole shape, simple operation, and easy guarantee of pile shaft verticality and pile quality, manual dug piles have been widely applied in engineering [1]. However, manual dug pile construction also faces some inherent challenges. Due to poor working conditions, harsh environment, and high labor intensity in the well, construction safety and quality control are particularly important [2]. At present, traditional cast-in-place concrete protective wall construction technology is often used for manual dug piles. Workers work in the well, the cast-in-place concrete protective wall construction process is complex, the concrete curing period is long, and safety accidents such as hole collapse are very likely to occur [3]. Therefore, it is necessary to address the shortcomings of cast-in-place concrete protective walls and refer to the support principle of shield tunnel segments to propose a set of prefabricated protective walls that can quickly support the hole wall soil to ensure the safety of operators and the quality of pile formation.
In the construction process of shield tunnel segments, the degree of mechanized application is high, the construction speed is fast, the construction safety is remarkable, and the impact on the surroundings is small. It has been widely used in the construction of underground projects such as highway tunnels, urban subway tunnels, and railway tunnels [4,5]. As the initial support framework of shield tunnels, shield segments are assembled by connecting several prefabricated segments or blocks with bolts. Segments must meet the requirements of strength and stiffness, not only bearing the surrounding soil pressure, water pressure, and some special loads, but also meeting the requirements of crack width, diameter deformation, etc. [6]. With the continuous increase of tunnel diameter and burial depth and the increasingly complex stratum crossed, the load that the segment structure needs to bear also increases, and the stress mode becomes more complex, which puts forward higher requirements for the mechanical properties of the segment structure [7]. During the construction and operation of segment structures, problems such as excessive segment deformation, segment joint cracking, concrete spalling, and cracking exist, which bring greater safety hazards to the long-term operation of tunnels [8,9,10,11,12]. Nowadays, most shield tunnel structures in China adopt prefabricated reinforced concrete segments, which are usually assembled by connecting multiple prefabricated segments with bolts. The segment structure is a prefabricated structure connected by circumferential and longitudinal bolts [13].
At the moment, cast-in-place reinforced concrete protective walls are mostly used in manual dug pile construction, but the quality of protective walls is poor due to on-site mixing in cast-in-place protective walls. The common cross-sectional forms of manual dug piles include rectangular, circular, elliptical, and other special forms, with the circular cross-section being the most common [14]. A prefabricated structure is an integral structure formed by connecting prefabricated components with connectors and assembling them on site. It has the advantages of controllable quality, high construction efficiency, labor saving, and less environmental pollution, and can improve the integrity and deformation resistance of the structure [15,16]. The introduction of prefabrication technology into the retaining wall structure proposes a prefabricated retaining wall type, and experimental studies on the flexural performance of its segments have been conducted. The application of reactive powder concrete (RPC) with numerous advantages [17,18,19] in this structure can not only enhance the deformation resistance of components by virtue of its ultra-high strength and excellent toughness, but also significantly improve the impermeability and durability of materials through its dense microstructure [20,21]. These material properties are reflected in the structure as more uniform crack distribution and more stable load-bearing capacity of the segments under flexural loads, effectively delaying the crack propagation process and improving structural ductility [22]. This enables the prefabricated retaining wall to have stronger resistance to flexural failure while maintaining a thin section. Meanwhile, relying on the high durability advantages of RPC materials, the maintenance requirements throughout the structure’s life cycle can be significantly reduced, achieving synergistic optimization of construction efficiency and long-term performance.
This research aligns with governmental directives for sustainable development, thereby exerting significant societal impacts. The adoption of prefabricated protective walls in manual dug pile construction can reduce on-site construction waste, conserve resources, and lower energy consumption, in line with the principles of green construction advocated by the government. Additionally, the enhanced safety and quality control provided by prefabricated structures can minimize potential construction accidents, protecting the lives and property of workers and reducing the social and economic losses caused by safety incidents. From an industrial development perspective, the introduction of this innovative technology promotes the industrialization of the construction industry, creating new employment opportunities and driving technological innovation, which is conducive to the long-term sustainable development of the construction industry and the overall economy.
The novelty of this study addresses a critical research gap: while cast-in-place protective walls for manually excavated piles suffer from inherent flaws (e.g., complex construction, long curing periods, and high safety risks), the application of prefabricated technologies—proven effective in shield tunnel segments—has remained unexplored in this context. This work uniquely introduces a prefabricated protective wall structure to manually excavated pile engineering, aiming to revolutionize construction efficiency and safety and thus promoting the industrialization of related construction practices.
2. Materials
To determine the mechanical properties of materials used for the precast protective wall, relevant mechanical tests were conducted on the steel bars and concrete before manufacturing the precast protective wall [23]. The mix proportion of the concrete referred to Reference [24]. Steel fibers and mineral admixtures were added to the RPC to improve its mechanical properties and durability [25]. The mechanical property of the materials is shown in Table 1 and Table 2. Each series involved testing 3 specimens to ensure the reliability and consistency of the data.

Table 1.
The mechanical properties of steel bars.

Table 2.
The mechanical properties of concrete.
3. Experimental Programs
3.1. Specimen
The prefabricated protective wall is a 360—degree ring assembled from three identical protective wall segments, as shown in Figure 1. Each segment is designed with a trapezoidal cross-section, which enhances the overall stability and load-bearing capacity of the assembled ring structure. In addition to using bolts to connect the ribs of the prefabricated protective wall, U-shaped clips are also employed to link the prefabricated protective wall rings. These U-shaped clips are installed at specific intervals along the circumferential direction of the assembled rings, providing an additional layer of connection security and preventing relative displacement between rings. After each section of the manual dug pile is excavated, the prefabricated protective wall is assembled in one piece.
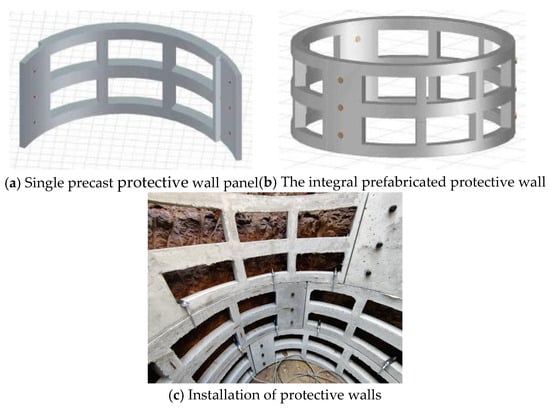
Figure 1.
The prefabricated protective wall.
The designed height of the prefabricated protective wall segment is 500 mm. To ensure a secure and even connection between segments, three bolt holes are equidistantly arranged along the central axis at the assembly ribs on the left and right sides of a single segment, with the distance between bolt holes set to 150 mm. The distance from the bolt holes to the upper and lower edges of the protective wall is 100 mm, and the distance from the bolt holes to the outer edge is also 100 mm, which helps to evenly distribute the connection force and avoid stress concentration. The bolt holes of the protective wall segments should be treated with anti-corrosion measures, and galvanized sleeves are recommended. The galvanized sleeves not only protect the bolts from rusting but also provide a smooth surface for easy bolt installation and removal. The specific layout of bolt holes on the connecting ribs of the protective wall is shown in Figure 2. Additionally, before assembly, the surfaces of the connection ribs of the protective wall segments should be cleaned to remove any debris, oil, or rust, ensuring a tight and reliable connection. After assembly, the bolts should be tightened to a specified torque value to guarantee the integrity and stability of the prefabricated protective wall structure, and the U-shaped clips should be firmly snapped into place to reinforce the connection between the rings.
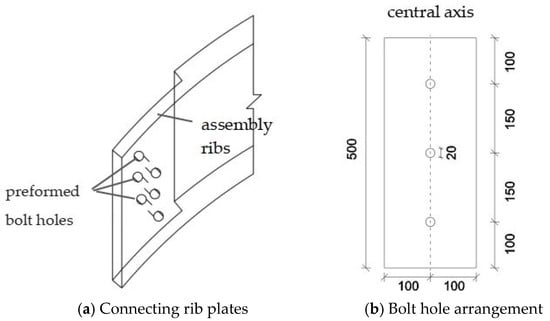
Figure 2.
Layout of bolt holes on connecting ribs of retaining wall.
The inner diameter of the prefabricated protective wall segments is 1.2 m, with outer diameters of 1.3 m and 1.33 m, wall thicknesses of 50 mm and 65 mm, and a wall height of 500 mm. HRB400 grade steel bars are used, with each segment containing 4 vertical steel bars and 3 horizontal steel bars. The reserved holes measure 300 mm in length and 150 mm in width. The parameters of the specimens are detailed in Table 3.

Table 3.
Parameters of the specimens.
3.2. Test Set-Up and Procedure
In this test, a 20-ton screw jack was used to apply loads to the distribution beam, and readings were taken via a pressure sensor connected to a data acquisition instrument [26]. The protective wall was placed below the reaction frame. The loading span of the distribution beam was 412 mm in length and 500 mm in width. Below the distribution beam was a circular tube with an outer diameter of 50 mm and a wall thickness of 10 mm. A rubber pad measuring 500 mm in length, 60 mm in width, and 25 mm in thickness was placed between the distribution beam and the protective wall. The base supporting the protective wall consisted of a sliding trolley and a fixed steel seat. The supporting position was in close contact with the protective wall, and the fixed end remained stationary relative to the ground. During the flexural performance test of the protective wall, one end was fixed while the other end was allowed to move horizontally. Load-controlled stepwise loading was adopted, with the screw jack manually operated via an iron rod. The load was increased in increments of 0.5 kN, with each load level maintained for 5 min. The test set-up is shown in Figure 3.

Figure 3.
Test set-up.
3.3. Measurement Scheme
The main measurement contents of the test include: the load-bearing capacity and displacement of the protective wall segments, the concrete strain, and the development of cracks. Displacement meters with a range of 50 mm were used to measure the deformation of the protective wall. The measuring point layout is shown in Figure 4.
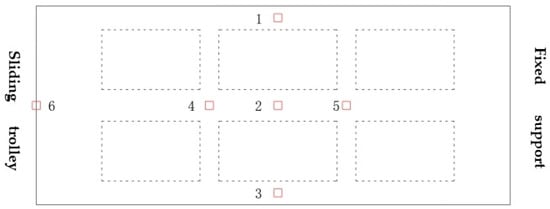
Figure 4.
Displacement meter layout.
The measurement of concrete strain on the surface of the protective wall uses BFH120-50AA concrete strain gauges. The strain gauges on the side arc surface and inner arc surface of the protective wall are arranged at the position close to the rib plate at the movable end, at the two loading points, at the mid-span, and close to the rib plate at the fixed end. The data is obtained by accessing the DH3816Y data acquisition instrument, and the layout of the measuring points is shown in Figure 5. During the test, the development of cracks is recorded by using a marker pen to mark the position of the cracks and the loading time, and a crack observation instrument is used to detect the width of the cracks.
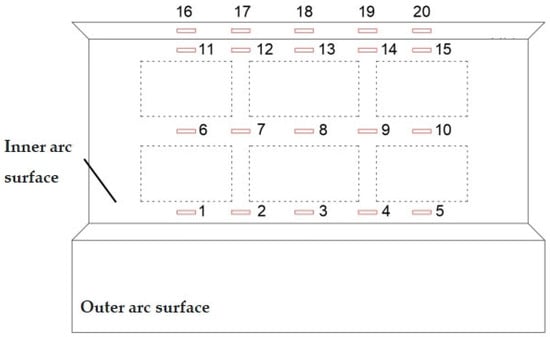
Figure 5.
Layout of concrete strain gauge.
The flowchart of the bending performance test for the prefabricated protective wall is shown in Figure 6.
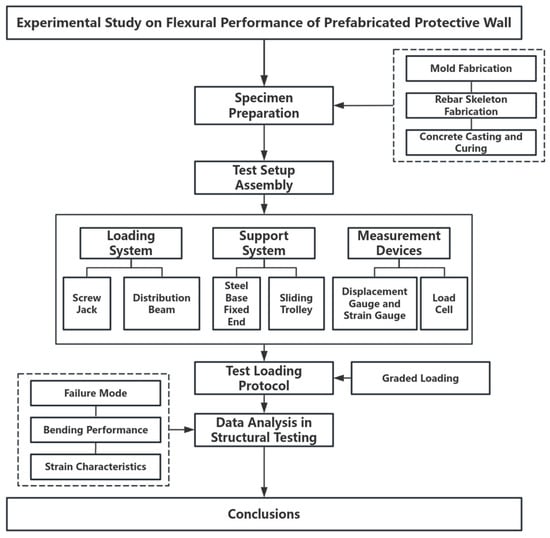
Figure 6.
Experimental procedure.
4. Test Results and Analysis
4.1. Failure Mode
When the C50-65 mm (Specimens with a wall thickness of 65 mm made of C50) protective wall segment was loaded to 2.5 kN, the first vertical crack appeared on the side arc surface at the mid-span of the protective wall, with a vertical length of 40 mm. This crack extended toward the inner arc surface, with a width of 0.08 mm. Meanwhile, a second vertical oblique crack formed on the side arc surface below the distribution beam, with a length of 50 mm on the side arc surface and a width of 0.2 mm. When loaded to 4 kN, a transverse crack appeared on the side arc surface of the protective wall below the distribution beam, with a length of 70 mm and a width of 0.28 mm. As loading continued to 6.65 kN, the protective wall could no longer bear the vertical force. Cracks emerged above the mid-span of the protective wall, penetrating transversely with a width of 4.8 mm. Subsequently, concrete began to spall, and the steel bars on the outer surface at the mid-span of the protective wall were exposed, as shown in Figure 7.
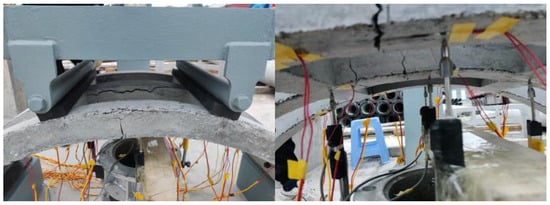
Figure 7.
Failure mode of C50-65 mm retaining wall segment.
When the RPC-65 mm protective wall segment was loaded to 2.5 kN, the first vertical crack appeared on the middle crossbeam at the mid-span of the protective wall, with a length of 10 mm and a width of 0.06 mm. At 5 kN loading, the sixth crack formed on the middle crossbeam below the distribution beam on the inner arc surface of the protective wall, with a length of 50 mm and a width of 0.2 mm. As loading continued, new cracks continuously developed. Transverse cracks appeared at the mid-span of the segment and the movable end of the trolley. When loaded to 7 kN, accompanied by a “click” sound, the protective wall concrete finally began to spall, as shown in Figure 8.
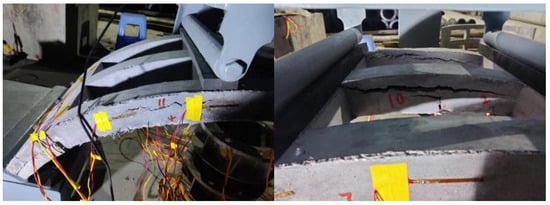
Figure 8.
Failure mode of RPC-65 mm retaining wall segment.
When the C40-65 mm (Specimens with a wall thickness of 65 mm made of C40) protective wall segment was loaded to 3 kN, cracks appeared on both sides of the lower end of the distribution beam on the side arc surface of the protective wall. On the side arc surface at the lower end of the distribution beam near the sliding trolley, the crack width was 40 mm with a crack width of 0.08 mm. On the side arc surface at the lower end of the distribution beam near the fixed end, the crack width was 20 mm with a crack width of 0.08 mm. When loaded to 6.45 kN, a transverse crack appeared on the outer arc surface at the mid-span of the protective wall segment, with a crack width of 80 mm. As the load level gradually increased, multiple transverse cracks occurred on the protective wall segment near the fixed end and at the mid-span, leading to concrete cracking at these multiple transverse cracks. Eventually, the concrete of the protective wall began to spall, as shown in Figure 9.
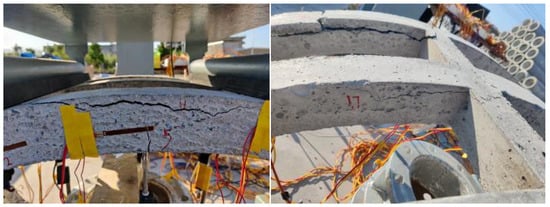
Figure 9.
Failure mode of C40-65 mm retaining wall segment.
When the C50-50 mm (Specimens with a wall thickness of 50 mm made of C50) protective wall segment was loaded to 1 kN, the first vertical crack appeared at the mid-span of the side arc surface, with a length of 20 mm and a width of 0.08 mm. When loaded to 3 kN, a crack formed between the mid-span of the segment and the distribution beam near the sliding trolley end, with a length of 15 mm and a width of 0.08 mm. As loading continued to 6.45 kN, with the continuous increase of the load value, multiple transverse cracks developed in the segment between the distribution beam and the fixed support. Along with the extension of these transverse cracks, a “click” sound was heard, followed by concrete cracking at multiple transverse cracks. Finally, the protective wall concrete began to spall, exposing the internal steel bars, as shown in Figure 10.
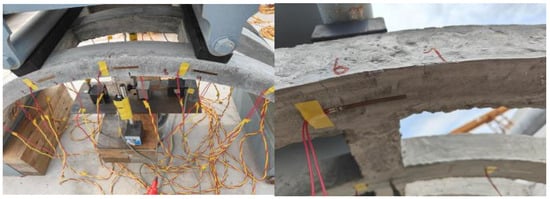
Figure 10.
Failure mode of C50-50 mm retaining wall segment.
When the RPC-50mm (Specimens with a wall thickness of 50 mm made of RPC) protective wall segment was loaded to 2 kN, the first vertical crack formed on the side arc surface of the side crossbeam at the mid-span below the distribution beam. At 4 kN loading, cracks appeared on the side arc surface of the crossbeam near the sliding end side hole, specifically on the outer crossbeam and middle crossbeam. When loaded to 4.5 kN, multiple small cracks emerged on the side arc surface near the fixed end. During the loading to 6.8 kN, the previously formed cracks continuously expanded. Eventually, the segment concrete cracked and fractured, the crack width increased, the protective wall lost its load-bearing capacity, and the loading test was terminated, as shown in Figure 11.
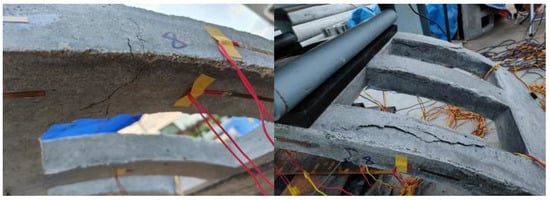
Figure 11.
Failure mode of RPC-50 mm retaining wall segment.
When the C40-50 mm (Specimens with a wall thickness of 50 mm made of C40) protective wall segment was loaded to 3 kN, the first crack with a width of 0.02 mm appeared on the side arc surface of the outer crossbeam at the mid-span. When loaded to 4.5 kN, a vertical crack with a width of 0.06 mm occurred at a position halfway between the mid-span and the loading rod near the fixed end. When loaded to 6.25 kN, the protective wall segment cracked severely and lost its overall stability, leading to the termination of the loading test, as shown in Figure 12.
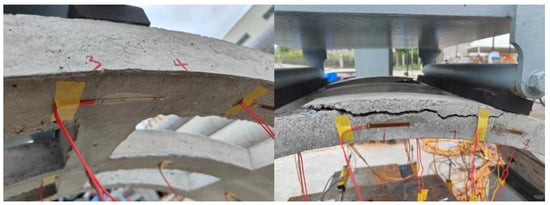
Figure 12.
Failure characteristic diagram of C40-50 mm retaining wall segment.
Failure modes of segments differ significantly with wall thickness and concrete strength: 65-mm-thick specimens (e.g., C50-65) initiated cracks at 2.5 kN and failed at 6.65 kN with mid-span concrete spalling, while 50-mm-thick segments (e.g., C50-50) cracked at 1 kN and failed at 6.45 kN, showing 8.7% lower ultimate load. RPC segments (e.g., RPC-65) exhibited 9.1% higher ultimate load (7 kN) than C50 counterparts, with more uniform crack development and delayed spalling due to superior tensile ductility.
4.2. Load-Displacement Curve
Figure 13 shows the displacement-load curves of protective wall segments with different concrete strengths and wall thicknesses. As the concrete strength increases from C40 to C50 and then to RPC, the mid-span moment values of the segments generally exhibit an upward trend under the same displacement. This indicates that higher concrete strength enables the segments to withstand greater bending moments, with RPC materials showing particularly prominent advantages in mechanical properties.
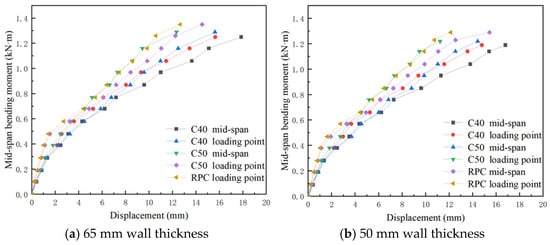
Figure 13.
Load-displacement curve.
For segments with the same concrete strength, the curve of mid-span moment versus loading point displacement always lies above the curve of mid-span moment versus mid-span displacement. This suggests that the mid-span position is more prone to deformation under the same bending moment. All curves demonstrate a positive correlation between displacement and moment, where the mid-span moment increases continuously with the displacement of the segment.
At small displacements, the curves rise relatively gently. As the displacement increases, the curves become steeper, indicating an accelerated growth rate of the moment. This phenomenon suggests that the influence of deformation on the moment becomes more significant in the later stage of loading.
Load-displacement curves show higher-strength materials (RPC > C50 > C40) exhibit steeper slopes, with RPC-65 resisting 1.4 kN·m at 18 mm deflection (8.3% higher than C50-65). 65-mm-thick walls demonstrate 19% higher ultimate load and 3–5% smaller mid-span displacements (11–18 mm) than 50-mm-thick ones, outperforming cast-in-place walls in deformation resistance.
Linear regression analysis was performed on the elastic stage (load ≤ 60% of ultimate load) for each specimen, fitted by the formula M = kδ + b (where M is the mid-span moment, δ is the displacement, and k is the stiffness coefficient). The results show that the RPC-65 with a 65-mm wall thickness has a stiffness coefficient of 0.078 kN·m/mm (R2 = 0.992), which is 2.6% higher than that of C50-65 (0.076 kN·m/mm, R2 = 0.989) and 16.4% higher than that of C40-65 (0.067 kN·m/mm, R2 = 0.985), consistent with the increase in elastic modulus of RPC (3.77 × 10⁴ MPa) compared to C40 (3.46 × 10⁴ MPa).
The inflection point (e.g., 5.6 kN for RPC-65, corresponding to 80% of the ultimate load) in the load-displacement curve marks the transition from the elastic to plastic stage, where the slope of the moment-displacement curve decreases by 56%, indicating the first cracking of the concrete tension zone. In engineering design, 70% of the inflection point load (3.9 kN) is recommended as the allowable working load, with a safety factor of 1.25 meeting the requirements of GB 50010-2010 [27].
4.3. Concrete Strain
Figure 14 shows the load-strain curves of concrete on the inner arc surface of the 65 mm-thick protective wall.
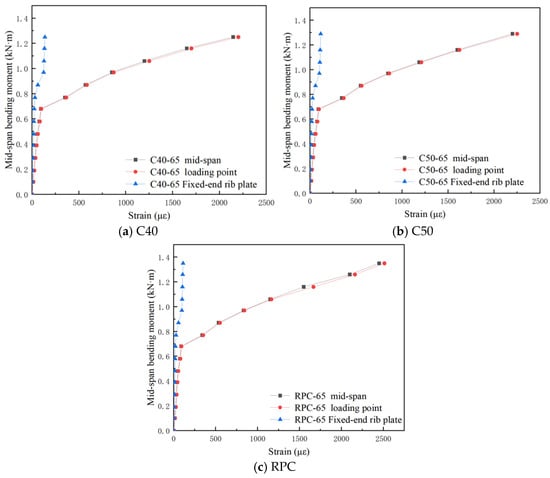
Figure 14.
Load strain curve of inner arc surface of 65 mm retaining wall segment.
At small strain values (elastic stage), the slopes of the three curves are compared. The RPC curve has the largest slope, indicating that the RPC material has a relatively high elastic modulus and the strongest ability to resist deformation in the elastic stage; the C40 curve has a relatively smaller slope and a lower elastic modulus. Under the same strain increment in the initial stage, the increase in mid-span bending moment corresponding to the RPC protective wall segment is greater than that of the C40 and C50 protective wall segments, reflecting the better mechanical properties of the RPC material in the elastic stage.
As the strain increases, the mid-span bending moment values corresponding to the end points of the curves are observed. The mid-span bending moment value corresponding to the end point of the RPC protective wall segment curve is the largest, followed by C50, and C40 is the smallest. This indicates that the 65 mm protective wall segment made of RPC material has the strongest ultimate load-bearing capacity, can withstand greater bending moments, and the C40 material is relatively weaker.
The curves at the mid-span position of the protective wall segments with various concrete strengths show that the mid-span bending moment value at the mid-span position is relatively large under the same strain. This is because the mid-span is a key load-bearing part, where deformation and stress concentration are more obvious. As the strain increases, the growth trend of the mid-span bending moment value is more significant, indicating that deformation has a greater impact on the bending moment at the mid-span position during the loading process. The trend of the curve at the loading point position is similar to that at the mid-span position, but the mid-span bending moment value under the same strain is slightly smaller than that at the mid-span position. This reflects that although the loading point bears the load, there are differences in the characteristics of deformation and bending moment growth between it and the mid-span position. Relatively speaking, the contribution of deformation to the bending moment at the loading point is slightly smaller.
The curve at the position near the rib plate of the fixed end corresponds to the smallest mid-span bending moment value under the same strain. This shows that the deformation and bending moment growth at the position near the rib plate of the fixed end are relatively slow during the loading process. This is due to the constraint effect of the fixed end, which limits the development of deformation at this position, resulting in smaller bending moments when it undergoes the same strain.
Figure 15 shows the load-strain curves of concrete on the inner arc surface of the protective wall with a 50 mm wall thickness. The concrete strain values at the mid-span and loading point of the segment suddenly changed when the mid-span bending moment reached 0.57 kN·m. In contrast, the strain value of the segment near the fixed-end rib plate continued to increase but with relatively small overall variation, indicating that the mid-span and loading point are the first and most severely damaged positions under bending.
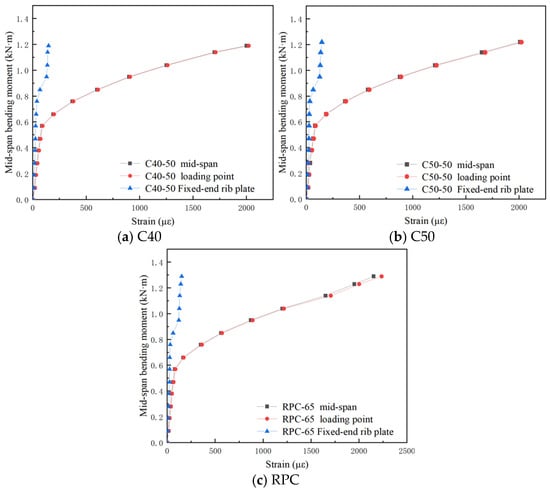
Figure 15.
Load strain curve of inner arc surface of 50 mm retaining wall.
Overall, for protective wall segments with the same concrete strength but different wall thicknesses, the overall load-bearing capacity of the 65 mm-thick segment is 19% higher than that of the 50 mm-thick segment. This shows that increasing the wall thickness can inhibit the development of cracks.
Figure 16 shows the load-strain curves of concrete on the side arc surface of the protective wall.
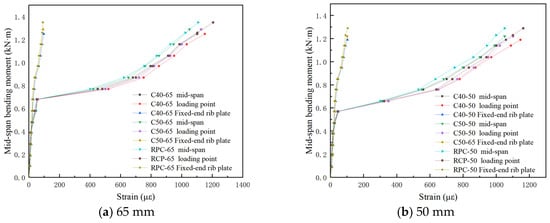
Figure 16.
Load strain diagram of side camber of retaining wall.
The concrete strain at the mid-span and loading point positions increases significantly in the later stage. For the 65 mm-thick protective wall, an inflection point appears simultaneously when the mid-span bending moment reaches 0.68 kN·m, while for the 50 mm-thick protective wall, the inflection point appears simultaneously at 0.57 kN·m. Prior to these points, the concrete strain remains relatively small.
The strain values near the fixed-end rib plate are significantly smaller than those at the mid-span and loading point. The strain of the 50 mm-thick protective wall is generally higher than that of the 65 mm-thick one, indicating that the surface damage degree of the 50 mm-thick protective wall is more severe than that of the 65 mm-thick one during the test. The strain at the mid-span and loading point positions is generally higher than that near the fixed-end rib plate, a characteristic observed in both wall thicknesses.
Concrete strain at mid-span and loading points increases abruptly at 80% of ultimate load (e.g., RPC-65 mid-span strain surges from 1000 με to 2500 με), while fixed-end strain remains 15–20% lower. RPC segments show 23% smaller strain increments than C50 under the same load, attributed to higher elastic modulus (3.77 × 10⁴ MPa), and 65-mm walls mitigate strain growth by 40% compared to 50-mm walls.
The RPC-65 segment (65-mm thickness RPC) achieves the highest ultimate load (7 kN), 8.5% higher than C40-65 and 3% higher than RPC-50, validating synergistic benefits of material and thickness. Practically, prefabricated walls shorten construction period from 7–10 to 2–3 days, reduce defect rate to <3%, and offer superior deformation resistance over cast-in-place counterparts.
Bilinear model fitting was conducted on the mid-span strain data of RPC-65: the elastic stage (P < 5.6 kN) is expressed as ε = 357P (R2 = 0.996), and the plastic stage (P ≥ 5.6 kN) as ε = 820P−2592 (R2 = 0.981). The strain growth rate at the inflection point surges from 357 με/kN to 820 με/kN, corresponding to the rapid propagation of concrete cracks.
The constraint effect index η = εmid-span/εfixed-end was defined. For RPC-65, η = 6.25, indicating that the fixed-end constraint reduces strain by 84%; for C40-50, η = 6.33, demonstrating similar constraint efficiency and verifying the universality of boundary conditions for different materials.
4.4. Economic Comparison
Table 4 highlights the prefabricated C50 wall’s significant advantages over cast-in-place counterparts: a 16.6% higher load-load-bearing capacity, 41.9% faster installation reducing construction time, a 28.6% lower deformation ratio for better structural stability, and notable cost savings—10.1% in construction costs and 23.2% in annual maintenance—due to efficient material use and enhanced durability, making it a more economical and performance-driven choice for retaining wall applications.

Table 4.
Economic analysis.
5. Discussion and Conclusions
5.1. Discussion
(1) Comparison of Failure Modes
The failure mode of the prefabricated protective wall segments, characterized by concrete crushing at the mid-span and fixed end with crack propagation as the primary failure mechanism, aligns with the observations of Li et al. (2018) [1]. They reported that prefabricated reinforced concrete protective walls for manual bored piles failed primarily due to crack development and concrete spalling. However, the present study reveals that RPC segments exhibit more uniform crack distribution and delayed spalling compared to C50 segments, which is in contrast to the findings of Mo et al. (2007) [12]. They found that steel fiber-reinforced concrete segments showed improved crack resistance but did not specifically compare RPC with conventional concrete.
The increase in ultimate load with wall thickness (8.7% higher for 65-mm vs. 50-mm walls) is consistent with the research of Pan (2015) [7], who studied the influence of shield tunnel lining thickness on stress and deformation. Pan concluded that thicker linings could bear higher loads, which supports the present study’s findings. However, the current study further demonstrates that combining RPC material with increased thickness (RPC-65) results in a 9.1% higher ultimate load than C50-65, highlighting the synergistic effect of material and design, which was not explicitly addressed in previous studies.
(2) Load-Displacement and Strain Behavior
The load-displacement curves show that RPC segments have steeper slopes and higher stiffness coefficients, indicating better deformation resistance. This is in line with the results of Liu et al. (2022) [22], who found that coarse aggregate reactive powder concrete (CA-RPC) had improved flexural behavior. The present study’s finding that RPC-65 has a stiffness coefficient of 0.078 kN·m/mm, 2.6% higher than C50-65, supports the superiority of RPC materials in mechanical properties.
The strain analysis reveals that the fixed-end constraint effectively reduces local deformation, with the strain at the fixed end being 15–20% of that at the mid-span. This is consistent with the three-dimensional numerical simulation by Ju et al. (2005) [6], which showed that boundary constraints significantly influenced the stress and deformation of shield tunnel linings. However, the current study introduces a constraint effect index η, which quantifies the reduction in strain due to fixed-end constraints (η = 6.25 for RPC-65), providing a new perspective for evaluating boundary effects that was lacking in previous research.
(3) Economic and Technical Advantages
The economic comparison in Table 4 shows that the prefabricated C50 wall offers significant improvements in load-bearing capacity (+16.6%), installation time (−41.9%), and cost savings (−10.1% construction cost, −23.2% maintenance cost) compared to cast-in-place walls. These results are consistent with the findings of Jia et al. (2023) [16], who reported that prefabricated shield segment structures improved construction efficiency and reduced costs. However, the present study focuses on manual dug pile applications, whereas previous economic analyses were primarily conducted for shield tunnel projects, highlighting the broader applicability of prefabricated technologies.
The reduction in construction period from 7–10 days to 2–3 days and the defect rate to <3% demonstrate the practical advantages of prefabricated walls. This is in line with the construction technology research of Wu et al. (2021) [4] and Li et al. (2022) [5], who emphasized the efficiency and quality control benefits of prefabrication in tunnel construction. The current study extends these benefits to manual dug pile foundations, filling a research gap in the application of prefabricated protective walls in this context.
5.2. Conclusions
This paper presents a factory-made and site-assembled prefabricated protective wall structure. Through two-point bending tests on single wall segments, it investigated the failure features, crack development, and concrete strain of walls with varying strengths and thicknesses. The key findings are:
(1) Tested walls failed due to concrete crushing at mid-span and the upper part of the fixed end, while prefabricated segments failed mainly via crack propagation. Initial crack loads increased with increasing concrete strength and wall thickness. The 65 mm-thick specimens had 8.7% higher ultimate load than 50 mm—thick ones, and RPC specimens outperformed C50 ones of the same thickness by 9.1%.
(2) Mid-span and loading point vertical bending displacements (11–18 mm, 1.83–2.71% of the radius) were lower than those of cast-in-place walls. Strain data indicated that fixed-end constraints effectively reduced local deformation.
(3) RPC material had a higher elastic modulus, resulting in 23% less strain increment under the same load and better deformation resistance. 65 mm-thick wall had 19% higher load-bearing capacity and 40% slower crack growth than 50 mm-thick ones.
(4) The prefabricated protective wall shortens the construction period from 7–10 to 2–3 days, reduces the defect rate from 12–15% to under 3%, and enhances deformation resistance compared to traditional cast-in-place walls, offering an efficient and safe solution for manual dug pile projects. The study has two key limitations: First, the tests only use static two-point bending, failing to model dynamic field conditions like soil pressure fluctuations or seismic forces. Second, the economic analysis focuses on short-term construction costs, ignoring long-term sustainability factors such as lifecycle carbon emissions and climate resilience.
Future work will include cyclic loading and 3D stress testing to simulate real excavation scenarios. We will conduct full-scale field trials in diverse geological settings to validate adaptability. Life cycle assessment will be integrated to create a comprehensive model covering material production, transport, and disposal, aligned with international standards. These steps will bridge the gap between lab results and practical engineering, advancing prefabricated retaining wall technology industrialization.
Author Contributions
Y.M.: Methodology, writing—review & editing; H.D.: Formal analysis, Writing—original draft; S.N.: Data curation, Methodology; K.Z.: Project administration, Writing—review & editing; H.L.: Investigation, Writing—original draft; D.W.: Conceptualization, Supervision, Writing—original draft. All authors have read and agreed to the published version of the manuscript.
Funding
This research was supported by a grant from Shandong Electric Power Engineering Consulting Institute Corp., Ltd. Project No.: 37-2024-34-K0019.
Data Availability Statement
Dataset available on request from the authors.
Acknowledgments
We would like to thank Shandong Electric Power Engineering Consulting Institute Corp., Ltd. for financially supporting this research.
Conflicts of Interest
Authors Yidan Ma, Hengchen Du and Kai Zhu were employed by the company Shandong Electric Power Engineering Consulting Institute Corp, Ltd. The remaining authors declare that the research was conducted in the absence of any commercial or financial relationships that could be construed as a potential conflict of interest. The authors declare that they have no known competing financial interests or personal relationships that could have appeared to influence the work reported in this paper. Authors Yidan Ma, Hengchen Du and Kai Zhu were employed by the company Shandong Electric Power Engineering Consulting Institute Corp, Ltd, who provided funding and teachnical support for the work. The funder had no role in the design of the study; in the collection, analysis, or interpretation of data, in the writing of the manuscript, or in the decision to publish the results.
References
- Li, M. Construction Technology of Prefabricated Reinforced Concrete Protective Wall for Manual Bored Piles. Technol. Innov. Appl. 2018. (In Chinese) [Google Scholar] [CrossRef]
- Li, X. Research on Pile Foundation Construction Technology in High-Rise Building Engineering. Technol. Innov. Appl. 2023, 13, 181–184. (In Chinese) [Google Scholar] [CrossRef]
- Nan, B. Application of Prefabricated Reinforced Concrete Protective Wall Technology in Manual Bored Pile Construction. J. Wuhan Eng. Vocat. Tech. Coll. 2011, 23, 30–32. (In Chinese) [Google Scholar]
- Wu, F.; Gong, Q.; Li, Z.; Qiu, H.; Jin, C.; Huang, L.; Yin, L. Development and Application of Cutterhead Vibration Monitoring System for TBM Tunnelling. Int. J. Rock Mech. Min. Sci. 2021, 146, 104887. [Google Scholar] [CrossRef]
- Li, Z.; Gong, Q.; Wu, F. Construction Technology of Earth Pressure Balance and TBM Double-Mode Shield Tunneling; China Architecture & Building Press: Beijing, China, 2022; (In Chinese). [Google Scholar] [CrossRef]
- Ju, Y.; Xu, G.; Mao, L.; Duan, Q.; Zhao, T. Three-Dimensional Numerical Simulation and Model Test Study on Stress and Deformation of Shield Tunnel Lining Structure. Eng. Mech. 2005, 22, 157–165. (In Chinese) [Google Scholar]
- Pan, J. Analysis of the Influence of Shenzhen Composite Strata on the Stress and Deformation of Shield Tunnel Lining Segments. Ph.D. Thesis, Beijing Jiaotong University, Beijing, China, 2015. (In Chinese). [Google Scholar]
- Dong, X. Study on the Failure Mechanism of Shield Lining Integral Ring. Chin. J. Geotech. Eng. 2014, 36, 417–426. [Google Scholar]
- Huang, H.; Shao, H.; Zhang, D.; Wang, F. Deformational Responses of Operated Shield Tunnel to Extreme Surcharge: A Case Study. Struct. Infrastruct. Eng. 2017, 13, 345–360. [Google Scholar] [CrossRef]
- Huang, Z.; Fu, H.; Chen, W.; Zhang, J.; Huang, H. Damage Detection and Quantitative Analysis of Shield Tunnel Structure. Autom. Constr. 2018, 94, 303–316. [Google Scholar] [CrossRef]
- Wang, Q.; Wu, Y.; Wang, Y. Analysis of Deformation Characteristics During Convergence Rectification of Shield Tunnel Segments in Operation Period. Urban Mass Transit 2018, 21, 131–134. (In Chinese) [Google Scholar] [CrossRef]
- Mo, H.; Chen, J.; Liang, S. Improvement of Local Mechanical Properties of Concrete Segments by Steel Fiber Addition. J. S. China Univ. Technol. (Nat. Sci. Ed.) 2007, 116–121. (In Chinese) [Google Scholar]
- Liu, J.; Shi, C.; Gong, C.; Lei, M.; Wang, Z.; Peng, Z.; Cao, C. Investigation of Ultimate load-bearing capacity of Shield Tunnel Based on Concrete Damage Model. Tunn. Undergr. Space Technol. 2022, 125, 104510. [Google Scholar] [CrossRef]
- Ma, B. Brief Discussion on Support Technology of Manual Bored Piles in Deep Foundation Pit Construction. Sci. Technol. Inf. 2007, 26, 109+120. (In Chinese) [Google Scholar]
- Huang, C. Design and Research of Prefabricated Structures in High-Rise Residential Buildings. Build. Technol. 2023, 54, 2389–2393. [Google Scholar]
- Jia, Y.; Yang, W.; Wu, F. Research on Assembled Integral Shield Segment Structure and Mechanical Properties. Urban Rapid Rail Transit 2023, 36, 59–65. (In Chinese) [Google Scholar]
- Dawood, E.T.; Abdullah, M.H. Performance of green RPC containing nanoparticles and reinforced with hybrid fibers used for repairing damaged concrete. Case Stud. Constr. Mater. 2020, 13, e00428. [Google Scholar] [CrossRef]
- Revathi, S.; Brindha, D.; Harshani, R. Effect of incorporating fibers in reactive powder concrete—A review. Mater. Today Proc. 2023. [Google Scholar] [CrossRef]
- Bakhbergen, U.; Shon, C.-S.; Zhang, D.; Kryzhanovskiy, K.; Kim, J.R. Assessment of Reactive powder concrete subjected to three different sodium sulfate Concentrations: Compressive Strength, Absorption, Porosity, Microstructure, and durability. Constr. Build. Mater. 2022, 325, 126804. [Google Scholar] [CrossRef]
- Liu, H.; Lyu, X.; Zhang, Y.; Luo, G.; Li, W. Bending resistance and failure type evaluation of basalt fiber RPC beam affected by notch and interfacial damage using acoustic emission. Appl. Sci. 2020, 10, 1138. [Google Scholar] [CrossRef]
- Ge, L.; Zhang, Y.; Sayed, U.; Li, H. Study on properties of basalt fiber reinforcing reactive powder concrete under different curing conditions. J. Mater. Res. Technol. 2023, 27, 5739–5751. [Google Scholar] [CrossRef]
- Liu, Z.; Alsomiri, M.; Li, M.; Chen, X.; Meng, J. Experimental investigation on the flexural behavior of coarse aggregate reactive powder concrete (CA-RPC) bridge deck. Eng. Struct. 2022, 271, 114951. [Google Scholar] [CrossRef]
- GB/T 50081-2019; Standard Test Methods for Physical and Mechanical Properties of Concrete. China Architecture and Building Press: Beijing, China, 2019.
- Ju, Y.; Zhang, H.; Wang, D.; Kong, X.; Ma, Y.; Zhang, X.; Bai, J. Effect of mineral admixtures on the resistance to sulfate attack of reactive powder concrete. J. Clean. Prod. 2024, 440, 140769. [Google Scholar] [CrossRef]
- Wang, D.; Ju, Y.; Shen, H.; Xu, L. Mechanical properties of high-performance concrete reinforced with basalt fiber and polypropylene fiber. Constr. Build. Mater. 2019, 197, 464–473. [Google Scholar] [CrossRef]
- GB/T 30100-2013; Test Methods for Building Wall Panels. China Standards Press: Beijing, China, 2013.
- GB 50010–2010; Code for Design of Concrete Structures. China Architecture & Building Press: Beijing, China, 2011.
Disclaimer/Publisher’s Note: The statements, opinions and data contained in all publications are solely those of the individual author(s) and contributor(s) and not of MDPI and/or the editor(s). MDPI and/or the editor(s) disclaim responsibility for any injury to people or property resulting from any ideas, methods, instructions or products referred to in the content. |
© 2025 by the authors. Licensee MDPI, Basel, Switzerland. This article is an open access article distributed under the terms and conditions of the Creative Commons Attribution (CC BY) license (https://creativecommons.org/licenses/by/4.0/).