Abstract
A nonlinear incremental time history analysis is performed on plan and vertical asymmetric reinforced concrete (RC) buildings under sequential events of the 2011 Great Japan earthquake and tsunami. The symmetric and plan asymmetric buildings with a unidirectional eccentricity of 6 m to 18 m with an interval of 6 m are considered. The vertical mass and stiffness asymmetric structures are also analyzed considering material nonlinearity. Maximum inundation depths of 6.0 m and 3.0 m are simulated to account for the near-shore and far-shore conditions. A total time duration of 58.69 min. is taken for the earthquake and tsunami, including a time gap of 30 min. between the earthquake and tsunami. The symmetric structure showed structural adequacy against earthquakes and tsunamis, with a maximum inundation depth of 3.0 m. The plan asymmetric structure with 6.0 m eccentricity has shown displacements below the yield displacement (i.e., the maximum lateral displacement before inelastic behavior) under the earthquake, but yielded under the tsunami a time of structural adequacy (the time duration during which the building remains within elastic limits under sequential loading) of up to 42.56 min. In comparison to the symmetric building, the buildings with higher eccentricities (12.0 m and 18.0 m) failed under seismic loading alone, exhibiting 94.12% and 45.94% greater displacements, respectively, both exceeding the yield threshold. Vertical stiffness asymmetric structures displaced more than yield displacement under the earthquake, whereas mass asymmetric structures with asymmetry at the first or second floors have been found resilient under the sequential earthquake and tsunami up to the inundation depth of 3.0 m. From this, it is concluded that vertical evacuation is limited to the first or second floors of the studied building. It is recommended to construct the RC buildings away from the seashore to ensure the safety of the occupants. The construction of the plan and stiffness of asymmetric structures shall be avoided in the seashore locations.
1. Introduction
Sequential natural disaster events are becoming frequent in different places across the globe. The common sequential events so far are earthquakes and aftershocks, earthquake and fire, cyclone and hurricane, hurricanes and earthquakes (in Southern California on 20 August 2023), volcanic eruption and landslide-triggered tsunami (Java Sumantra volcanic eruption-triggered landslide and tsunami 2018, Indonesia Java Island on 4 December 2022), subsea earthquake and tsunami (India Ocean tsunami 2004, Pangadaran earthquake and tsunami at South of Java Island 2006, Great Japan tsunami 2011, Philippines tsunami 2012), etc. Tsunamis are devastating natural phenomena known for their immense intensity and widespread impact on human lives. The 2004 Indian Ocean tsunami, triggered by a massive 9.3-magnitude undersea earthquake, exemplifies the catastrophic potential of these events. This catastrophic event claimed over 230,000 lives across 12 countries in the Indian Ocean [1]. This tsunami inundated coastal communities with run-up to a maximum distance of 5 km into the shore, and the inundating depth varied from 9.0 m near the shoreline and 7.0 m to 3.0 m in the coastal areas, depending upon the distance from the shoreline. In 2010, the Chilean coast was struck by a similar tragedy when an offshore earthquake of magnitude 8.8 caused a tsunami that claimed 521 lives [2] and destroyed most of the non-engineered structures. Though the toll was lower compared to the Indian Ocean disaster, the impact was nevertheless significant on the infrastructure, highlighting the lethal potential of tsunamis. The 2011 Great Japan Earthquake (also known as the Tohoku earthquake) and tsunami further highlighted the catastrophic impact of tsunamis, resulting in nearly 19,000 fatalities; 6000 injuries [3]; and the collapse of over 121,000 buildings. The staggering economic toll, estimated at USD 235 billion [4], exemplifies the profound socio-economic ramifications of these disasters. This tsunami affected various sectors such as fisheries, agriculture, tourism, supply chain mechanisms, electric power, industrial production, and insurance companies of various public and private organizations. Coastal cities worldwide face significant tsunami risks, with approximately 60% identified as vulnerable by the United Nations [5]. Governments and policymakers in growing cities of coastal areas should be aware of tsunami preparedness. Global population growth has doubled over the past 40 years [6], and especially in coastal areas, the population growth is more. Researchers are familiar with seismic activities due to extensive prior research. However, the limited research on tsunami analysis results in unfamiliarity with or unawareness of preparedness. This unfamiliarity necessitates a visual representation (Figure 1) to understand terms associated with tsunamis.
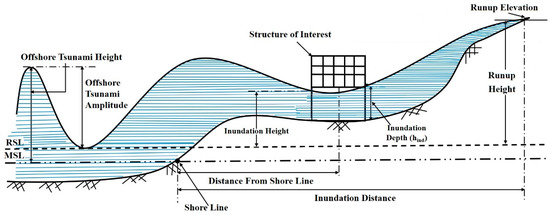
Figure 1.
Terminology used for tsunamis.
Buildings with plan irregularities, such as torsional eccentricity, often experience amplified lateral displacements and stress concentrations under seismic loading, resulting in early yielding and potential failure during sequential earthquake [7] and tsunami events [8]. Asymmetric mass and stiffness distribution in plan induces significant torsional responses, exacerbating damage during strong ground motions.
Similarly, in-height irregularities such as vertical stiffness or mass asymmetries can significantly influence the structural performance under multi-hazard loading. Buildings with soft story or mass concentration at intermediate floors are more vulnerable to seismic- and tsunami-induced forces, leading to drift concentration and localized failures [9,10,11]. Recent findings by Del Zoppo et al. [11] also highlight that vertical irregularities alter the natural period and damping characteristics, making structures more susceptible to sequential loading effects. Recent work by Ruggieri and Uva [12] emphasized extending response spectrum concepts to nonlinear static analyses for irregular structures, highlighting how traditional linear models inadequately capture irregular buildings’ nonlinear dynamic behavior. Their findings underscore the critical need to refine seismic assessment methods when dealing with plan and height irregularities. Using a modern technique approach, Kazemi et al. [13] developed a machine learning-based approach for seismic fragility and vulnerability assessment of RC structures. The study utilized extensive nonlinear Incremental Dynamic Analyses to generate structural response data under varying earthquake intensities. Machine learning models were trained to predict the seismic performance and damage probabilities efficiently.
From the experience of the tsunami, it is evident that the tsunami affects mainly the coastal infrastructure, leading to loss in the public and private sectors, causing socio-economic loss, etc. Assessing the structural damage pattern is essential to understand the effect of the loading patterns of successive earthquake and tsunami events. Park et al. [14] developed collapse-level tsunami fragility curves using a sophisticated analytical approach. Their methodology involved utilizing an equivalent single-degree-of-freedom system (SDOF) and a two-phase analysis, which includes only earthquake analysis in the first phase and successive tsunamis considered in the second phase of a wooden frame residential structure. Initially, a deterministic SDOF model was subjected to various ground motions scaled to different intensity levels using nonlinear time history analysis. Subsequently, the researchers applied tsunami forces to the damaged model through a nonlinear static procedure analysis, assuming an inundation depth varying from 0.0 m to 5.0 m, with an increment of 0.1 m. From the study, it is found that the 1.96 m inundation depth may have a 50% probability of structural failure only under a tsunami. It was also found that the inundation depths of 1.85 m and 1.69 m may cause a 50% probability of failure under the design basis earthquake and maximum considered earthquake loading, respectively.
Scott and Mason [15] conducted spectral analysis on a single-degree-of-freedom system (without any vertical asymmetry in mass and stiffness), considering the material as elastoplastic with constant ductility under sequential earthquakes and tsunamis. A single spectrum is developed for the events of sequential earthquakes and tsunamis. The study found that the system response amplification under a tsunami after an earthquake was significant in estimating the structural response. It also highlighted the need for more detailed analysis to improve the accuracy and applicability of these measures for complex systems. The parametric study on the ductility of the structure showed that as the ductility of the system increased, the spectral response was reduced under tsunami loading. The nonlinear response spectra also revealed that the spectral response under the hydrodynamic load exceeded the response in the natural period of the system. Fragility assessment of a reinforced concrete (RC) structure under tsunami loading using nonlinear static and dynamic analyses was conducted by Petrone et al. [16]. The study examines how different tsunami loading approaches impact the structural performance of a 10-story RC tsunami evacuation building subjected to the 2011 Tohoku tsunami wave. To evaluate the structural response under tsunami forces, the researchers compare nonlinear static analyses of a constant-height pushover (CHPO) and variable-height pushover (VHPO) with nonlinear dynamic analysis. The results reveal that VHPO provides a reliable estimate of demand parameters and aligns closely with collapse fragility curves derived from dynamic analysis under varied tsunami loads, while CHPO tends to overestimate inter-story drift ratios and underestimate shear demands.
Takahashi and Hachiro [17] conducted a comprehensive analysis to assess the resilience of buildings against combined earthquake and tsunami forces. The researchers utilized sequential nonlinear time history response analysis that simulates the dynamic behavior of structures under successive seismic and tsunami waves. The studies revealed that the Froude number of the tsunami wave affected the structural and inter-story displacements. The damage caused by the earthquake affected the structural stiffness and natural period of the system, thus resulting in large displacements under the tsunami. Goda et al. [18] examined the complex interaction of natural hazards on buildings and infrastructure along Palu Bay. The researchers studied the effect of the tsunami on the infrastructure after the 2018 Sulawesi earthquake. It was found that many of the port structures, buildings, and other kinds of infrastructure facilities were destroyed due to the earthquake and tsunami. During the tsunami, mudslides were observed in the coastal area, which caused the destruction. The study also showed that a strike–slip earthquake of magnitude 7.5 could trigger destructive tsunami waves along the coast of Palu Bay. Rossetto et al. [8] conducted a detailed study comparing a nonlinear response analysis and tsunami variable-depth pushover analysis of a 10-story tsunami vertical evacuation building. The findings suggested that employing a seismic nonlinear response history analysis for assessing ground shaking, followed by transient free vibration and tsunami pushover analysis, yields excellent predictions of the structural response. Petrone et al. [19] investigated the behavior of seismically designed RC frame vertical evacuation buildings under both seismic and tsunami forces, particularly emulating the conditions of the 2011 Great Tohoku earthquake. The study employed nonlinear time history analyses, studying two scenarios: tsunami inundation alone and the sequential occurrence of earthquake ground motion followed by tsunami inundation. The findings discovered that when analyzing the seismic response, the structure’s ability to withstand and deform under seismic forces is primarily determined by its strength, ductility, and stiffness, and the structure is safe against seismic loads. On the other hand, the structure’s strength played a dominant role when assessing the response to the tsunami, but structural stability could not be obtained under a tsunami, even though the structure was safely designed for an earthquake. In a similar study conducted by Tagle et al. [20,21], the behavior of a typical Chilean RC shear wall building was investigated under the combined impact of an earthquake and tsunami. The focus was on an 18-floor RC wall building erected in 2005 in Santiago, Chile. The researchers employed a simplified model for this building and analyzed it using a double-pushover analysis method. The study revealed that the Froude number of the tsunami flow predominantly influenced the building’s response to the tsunami. However, it was noted that severe seismic damage can compromise the building’s resilience against tsunamis. In a case study, Cortez et al. [22] investigated the structural response of a five-story RC frame building subjected to seismic ground motion and a maximum tsunami inundation depth of 8 m. They employed synthetic seismic records and tsunami time histories to simulate the dual hazards. Utilizing a fixed-base and soil–structure interaction model, they employed nonlinear response history analysis to assess the structural performance. The study found that the roof displacement exhibited a large displacement to the tsunami when the building experienced significant displacement and damage due to a prior earthquake. Ji et al. [23] established a relationship between tsunami forces and the spectral acceleration of the preceding ground motion. Employing a comprehensive numerical analysis, the study evaluated inelastic displacement ratios across various single-degree-of-freedom systems, considering factors such as vibration periods, ductility, soil types, post-yield stiffness, and damping ratios. The findings revealed that when structures endure earthquake and tsunami combinations, the demand for inelastic displacement ratios increases, compared to seismic events alone. In a recent study, Harati and van de Lindt [24] utilized nonlinear time history analysis for earthquake loading, followed by a nonlinear static procedure for tsunami impacts. The study examines ductile and nonductile RC building archetypes, assessing the influence of extended seismic shaking on successive earthquake–tsunamis. The authors found that long-duration earthquakes can significantly elevate the probability of structural failure, increasing up to 40% for low- to mid-rise RC buildings.
Naskar et al. [9] examine the impact of vertical irregularities in buildings subjected to tsunami forces. Their study highlights how height and mass distribution variations can significantly alter a structure’s response to tsunami loading. The research emphasizes that irregular buildings experience amplified stress concentrations, making them more vulnerable to structural failure than regular buildings. The researchers concluded that vertical mass asymmetric buildings are more susceptible than symmetric ones. Rossetto et al. [8] and Del Zoppo et al. [10,11] performed tsunami analysis on RC buildings for the development of a fragility function to predict the vulnerability of buildings under tsunami force. Hanggara and Wijeyewickrema [25] assessed the vulnerability of the RC buildings in Indonesia against the tsunami inundation force by developing the fragility curve, and the study revealed that the buildings without openings had a probability of failure.
In summary, earlier works such as those by Park et al. [14], Scott and Mason [15], and Petrone et al. [16] focused on simplified systems (SDOF models or elastoplastic assumptions) or on individual tsunami/earthquake scenarios. While these studies were instrumental in highlighting the effect of sequential hazards, they did not account for material and geometric nonlinearities in complex, multi-story asymmetric buildings, nor did they investigate different types of vertical and plan irregularities simultaneously.
Del Zoppo et al. [10,11] and Rossetto et al. [8] focused on fragility functions and variable-height pushover analyses, which, although useful for performance prediction, do not directly compute time-dependent structural adequacy under sequential dynamic loading, as our study does.
Some studies (e.g., Harati and van de Lindt [24], Ji et al. [23]) considered nonlinear analyses but focused primarily on fragility shifts or displacement ratios rather than practical design thresholds for evacuation timing.
To our knowledge, no prior studies explicitly quantify the time of structural adequacy (i.e., the duration for which a building remains structurally sound under a sequential earthquake–tsunami event) for different asymmetry configurations. This gap is crucial for emergency planning and vertical evacuation design. This gap motivates the present study, which aims to address the structural response and time of structural adequacy of the RC plan and vertical stiffness or mass asymmetric buildings subjected to sequential earthquake and tsunami forces. To execute this, a nonlinear time history analysis is performed under the sequential earthquake and tsunami of the 2011 Great Tohoku earthquake ground acceleration of magnitude 9.1 and Japan tsunami (Figure 2a). The analysis focuses on determining the performance of the asymmetric buildings under these extreme events and determining the time of structural adequacy in each type of building to safeguard the refugees. The study also focuses on evaluating the safe process of vertical evacuation after an earthquake and during the tsunami wave run-up and receding events.
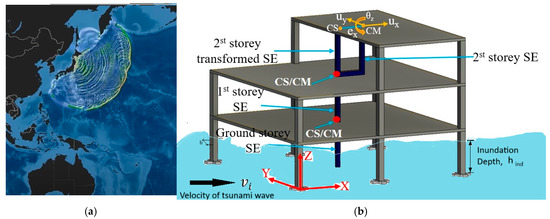
Figure 2.
(a) Generation of tsunami waves at Epicenter of Earthquake; (b) Tsunami propagation and idealization of structure.
2. Modeling and Methodology
The present study aims to comprehensively analyze the effects of earthquake and tsunami forces on plan and vertically asymmetric RC frame buildings. A ten-story framed building is considered for the sequential analysis. To simplify the model of the asymmetric RC building under lateral loads, a single super-element (SE) (Figure 2b) model is utilized to simulate the effect of the restraining system on each floor of the building [7]. Chopra and De la Llera [7] explained the SE model’s motive, emphasizing its advantages over conventional 3D finite element models. The super-element approach simplifies the structural analysis by representing each story with a single element that captures both elastic and inelastic behavior, reducing computational complexity while maintaining accuracy. Their study found that peak response errors typically remain below 20% for most practical structures. In the SE model, each building floor is represented by a single element, and the equivalent stiffness of all the columns and the core of the building on each floor is modeled. This element represents the floor’s major structural response in three degrees of freedom, i.e., longitudinal, lateral displacements, and rotation about the vertical axis of the building. The shift of the center of stiffness or center of mass (Figure 2b) in any floor due to the asymmetry in the vertical direction or in the plan is also considered in the modeling. The present study is performed by developing a mathematical model using MATLAB 2021a code. The events of the earthquake and the tsunami are simulated at a time step of below one-tenth of the fundamental natural period of the structure to maintain the accuracy of the response of the structure.
The validation of the structural evaluation (SE) model was conducted in a previous study [26] by comparing key dynamic parameters with Thambiratnam & Corderoy [27], specifically, the fundamental period and the time history of story displacements. The results demonstrated a strong correlation between the SE model predictions and the published study values, indicating high model accuracy. This strong correlation indicates that the simplified analytical approach adopted in the SE model effectively captures the essential dynamic behavior of the structure, thus making it suitable for further analytical studies and performance assessments under various loading conditions.
The artistic view of the earthquake and tsunami is shown in Figure 2b. It illustrates a building subjected to sequential natural events: first, a strong earthquake of magnitude 9.1, followed by a subsequent tsunami triggered by the earthquake. The present study examines various asymmetric building configurations and their responses under these sequential events.
A sequential time history analysis is performed by considering the nonlinear behavior of the building material. The material nonlinearity is incorporated using a hysteresis curve generated for a concrete column of size 0.35 m × 0.35 m [28] under lateral loads (Figure 3).
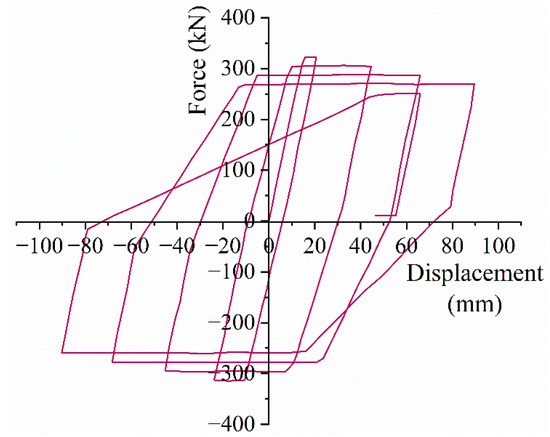
Figure 3.
Material behavior curve under lateral cyclic load of RCC column of 0.35 m × 0.35 m [28].
The nonlinear time history analysis is performed in two stages. In the first stage, the building is analyzed under the time history of the earthquake force of the 2011 Great Japan earthquake of 9.1 magnitude. If the building is not yielded beyond the yield limit under the earthquake, then the structure is analyzed under the tsunami, i.e., in the second stage.
In the present study, the decision to terminate the sequential tsunami analysis once the lateral displacement exceeds the yield limit was a deliberate modeling assumption aligned with the primary objective: to evaluate the time available for occupant evacuation before structural compromise rather than to assess post-yield damage progression or collapse mechanisms. The yield displacement was considered a threshold of structural adequacy, beyond which the building is deemed no longer safe for occupancy or evacuation purposes due to the onset of significant inelastic behavior. This approach prioritizes occupants’ safety and conservative design assessment over a complete failure-mode simulation.
Newmark’s beta method is used to solve the nonlinear equation of motion (Equation (1)). A MATLAB code is developed using the average acceleration method at each time step. The choice of MATLAB provides an efficient platform for customized numerical analysis, including implementation of Newmark’s β method, nonlinear material modeling via user-defined hysteretic laws, and the Newton–Raphson method. The most important thing for choosing MATLAB is to assign the tsunami flow characteristics during the tsunami analysis. The Newton–Raphson iteration technique [29,30] is used at each time step to consider the material nonlinearity. Convergence was checked based on the residual norm of the force vector, with a tolerance of 1 × 10⁻³. Iterations continued until the residual fell below this threshold. Furthermore, to ensure accurate dynamic response capture, the time step was selected as less than one-tenth of the fundamental period of the structure, as recommended in dynamic analysis best practices.
The earthquake force is evaluated considering the mass of each floor of the building and the seismic ground acceleration. The elements of the nodal mass of the matrix are evaluated using the lumped mass technique (Equation (2)). The mass matrix of each floor is evaluated using the nodal mass matrix. The mass matrices of each floor are assembled according to the connectivity of the building to estimate the global matrix.
The elemental stiffness matrix for each restraining element [31] is evaluated considering the coupling effect of the displacement and the torsional rotation. The nodal stiffness matrix (Equation (3)) is formulated for each restoring element in the structure. The nodal torsional stiffness depends on the eccentricities (Equations (4)–(6)), radius of gyration, and frequency ratio of the structure (ratio of the uncoupled natural frequency in rotation degree of freedom to the translation degree of freedom).
Considering both the material properties and geometric characteristics of each individual element, the elemental stiffness matrix is evaluated (Equation (7)). Then, these elemental matrices are assembled to form the SE stiffness matrix (KSE) for each floor. The SE stiffness matrices of all the floors are assembled to form the global stiffness matrix.
The earthquake force vector can be expressed in Equation (8) by considering the earthquake force in Y direction () and moment about the Z-axis ().
To simplify the complex analysis of buildings’ response to tsunamis, the study employed certain assumptions, which are listed below:
- The building is assumed to be located near the seashore in the case of 6.0 m inundation depth and far from the seashore, i.e., 3.0 m inundation depth.
- No natural or artificial obstacles exist between the seashore and the buildings.
- Debris impact force is neglected.
- The study considers only the drag and buoyancy forces over the buildings.
- The effect of surrounding buildings or objects is neglected.
- The slamming load on the ground floor slab is neglected.
- Slapping loads are also neglected.
Previous studies [32,33] have identified the hydrodynamic component as the primary contributor to the overall tsunami force. The hydrostatic force (FH) and drag force (FD) [34] are evaluated as stated in Equations (9) and (10), respectively. The tsunami force vector consists of the hydrostatic and drag force and moment about the vertical axis, as stated in Equation (11). Only the drag and hydrostatic forces of the outer walls are considered when the inundation depth () is more than 3.0 m in height, indicating the interaction of outer walls only in the event of a tsunami. The drag coefficient () of 1.6 is used for the columns and core, while 2.0 is used for the floors above the ground floor [35]. The mass matrix of each element is evaluated, whereas the elements inundated under the tsunami wave are modeled by considering the effect of buoyancy up to the depth of inundation of the structural element at an instantaneous time.
The density () of the sea water is 1025.6 kg/m3, and the tsunami impact factor () is taken as 1.25, according to the guidelines of FEMA P-55 [34].
Sequential time history analysis involves simulating the behavior of the structure over time, considering the dynamic effects of external loads, such as earthquake, tsunami, and material nonlinearity. In the context of the Great Japan Earthquake and Tsunami of 2011, the analysis aims to understand how buildings respond to the complex forces exerted by the seismic event and subsequent tsunami. The time history of the ground acceleration of the Tohoku earthquake is shown in Figure 4. Two peaks of ground accelerations were recorded in the Tohoku earthquake. The maximum peak ground acceleration record is considered for the present analysis (Figure 5a). The flow velocity and inundation depth of the tsunami with respect to time [36] are obtained from the video recording data of the event at Fujitsuka, ref. [37] global coordinates: 38.191667, 140.954167, and are presented in Figure 5b, which is approximately 1.27 km from the shoreline. The tsunami flow velocity and the inundation depth are indicated for both the tsunami run-up and the tsunami recede. It was reported that the peak flow velocity was 6.3 m/s during the tsunami run-up and 7.5 m/s during the event of the tsunami recede. Similarly, the inundation depth increased from 0.0 m to 18.0 m. The peak inundation depth was stable for 75.0 s. Later, the depth of inundation was reduced drastically from 18.0 m to 0.0 m, indicating that the tsunamis receded. The tsunami run-up was held for about 851 s (14.18 min), whereas the tsunami recede was held from 2886 s to 3562 s, i.e., about 676 s (11.27 min).
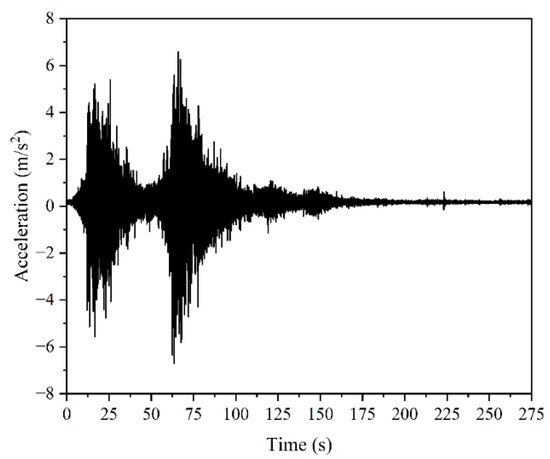
Figure 4.
The ground acceleration time history of the 2011 Great Tohoku Earthquake [38].
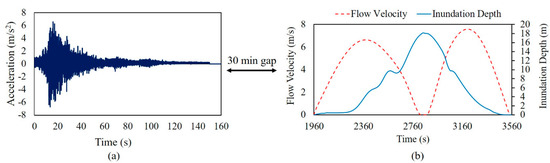
Figure 5.
(a) Ground acceleration time history of the 2011 Japan Earthquake (California Geological Survey & U.S. Geological Survey, 2005) [38]; (b) Video recording data of tsunami flow velocity and inundation depth at Fujitsuka, Japan, during the 2011 Tsunami [37].
In this study, a 30-min gap time between the earthquake and the arrival of the sequential tsunami is considered, reflecting typical near-field tsunami travel times observed during the 2011 Tohoku earthquake and tsunami. Tsunami arrival times are highly variable and depend on factors such as the earthquake’s fault location, rupture characteristics, and proximity to the coastline. In near-shore subduction zones, tsunami waves can reach coastal areas within 10–20 min, while in more distant regions, travel times may exceed an hour. The selected 30-min window provides a conservative and practical basis for sequential hazard modeling.
The total time split of earthquake and tsunami episodes, including the gap, is provided in Table 1. From the study of inundation depth and flow velocity, it was observed that the tsunami run-up event was slightly slower than the event of the tsunamis receding. The tsunami run-up and recede were both considered in the present study. The response of the structure under the run-up and recede was evaluated considering the instantaneous run-up, flow velocity, inundation depth, direction of the flow, and recede flow velocity.

Table 1.
The split and cumulative time of the 2011 Tohoku earthquake and tsunami events.
The characteristics of tsunami flow are scaled down to simulate flow for the inundation depths of 6.0 m and 3.0 m. The Froude scaling law is used to scale down the inundation depth (Equation (12)) and flow velocity (Equation (13)). The scaled-down inundation depth and flow velocities with respect to time, for the scale ratios of 6 and 3, are shown in Figure 6a and Figure 6b, respectively. The selected inundation depths are considered to represent near-shore and far-shore locations of the structures. The structure that is inundated at a depth of 6.0 m is nearer to the shore than the structure inundated at a depth of 3.0 m. In the case of an inundation depth of 3.0 m (Figure 6a), the flow velocity varied from 0.0 m/s to 2.6 m/s during the run-up. After reaching the maximum inundation depth, the direction of the tsunami changed towards the shore, and the recede flow velocity increased up to the peak of 3.0 m/s. Later, the flow velocity decreased to 0 m/s as the inundation depth was reduced to 0.0 m. The run-up flow velocity is increased from 0 m/s to 3.79 m/s, and the receding flow velocity is increased from 0 m/s to 4.39 m/s when the inundation depth is 6.0 m (Figure 6b).

Figure 6.
Scaled-down tsunami flow characteristics for inundation depths of (a) 3 m and (b) 6 m.
Plan asymmetric buildings are characterized by replacing the stiffness center from the geometric center of the building in the longitudinal direction. The plan eccentricities of 6.0 m, 12.0 m, and 18.0 m are considered. Similarly, the vertical asymmetric building is modeled by varying the mass distribution or stiffness properties along the structure’s height.
The current study employs sequential nonlinear analysis to assess the performance of different building configurations. The flow chart of the sequential analysis is shown in Figure 7.
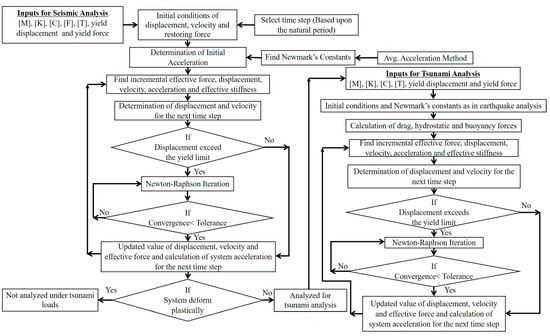
Figure 7.
Flow chart of the earthquake and tsunami sequential analysis.
3. Analytical Study of RC Buildings
3.1. Analysis of Symmetric and Plan Asymmetric Buildings Under Earthquake and Tsunami
A 10-story RC building with a longitudinal dimension of 42.0 m and a lateral dimension of 18.0 m is selected for the study. The columns in the building are uniformly spaced at an interval of 6 m in both the longitudinal and transverse directions, as shown in Figure 8. Each column has dimensions of 0.35 m × 0.35 m, while the core has a width of 3.0 m and a breadth of 2.5 m, with a wall thickness of 0.20 m. Each floor maintains a height of 3.0 m. Parameters such as the modulus of elasticity (30,000 N/mm2) and concrete density (25 kN/m3) are factored to assess dead load and stiffness matrix elements. Each floor bears a dead load of 7.06 kN/m2, encompassing the weight of peripheral walls, slab, beams, lintels, partition walls, and other structural elements. A live load of 3.5 kN/m2 is considered for all the floors, and 1.75 kN/m2 of live load is applied on all floors for the sequential analysis. The building’s plan asymmetry is simulated by varying the eccentricity to 6 m, 12 m, and 18 m. The present study conducts a sequential time history analysis under the ground acceleration of the 2011 Great Tohoku earthquake and Japan tsunami. The ground acceleration record of a massive 9.1-magnitude earthquake is shown in Figure 4. Initially, the structure is analyzed under the earthquake ground acceleration time history. The nonlinearity of the material is considered to assess the yielding of SE structural members on each floor. The earthquake force is applied in the perpendicular direction of the longitudinal axis of the building, as shown in Figure 8. As the structural relative stiffness is lower in the lateral direction when compared with the longitudinal direction, the load application is selected in the lateral direction of the building. Newmark’s Beta method and the Newton–Raphson iteration technique are used to solve the equation of motion (Equation (1)) at each time step. Initial conditions of zero velocity and displacement are applied at the beginning of the analysis to account for no displacement in the structure before the ground acceleration. The acceleration is estimated for the second time step under the load. Structural velocity and displacement are evaluated for the second time step. The above process is repeated for the entire analysis, considering the material nonlinearity under the earthquake and tsunami. The time history of the force and moment on the first floor during the sequential analysis of the earthquake and tsunami for the symmetric and plan asymmetric building with 6 m eccentricity are shown in Figure 9a and Figure 9b, respectively. The force and moment are evaluated under the earthquake ground acceleration and tsunami inundation depths of 3.0 m and 6.0 m. The response time history in the lateral direction under the earthquake is shown in Figure 10 for the symmetric and plan asymmetric buildings.
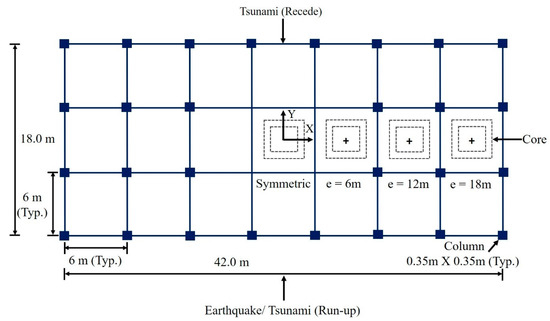
Figure 8.
Plan view of plan asymmetric buildings.
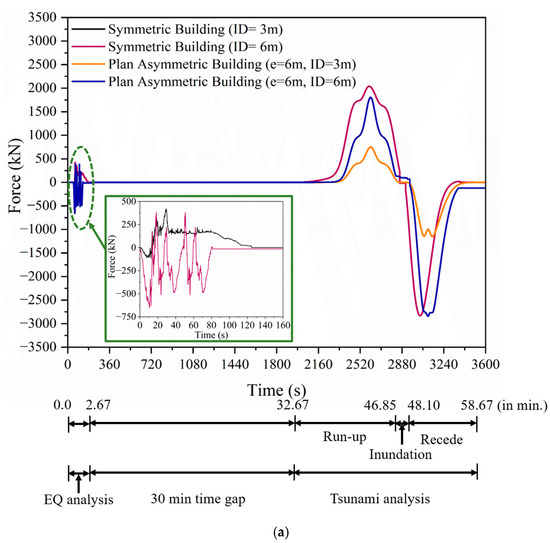
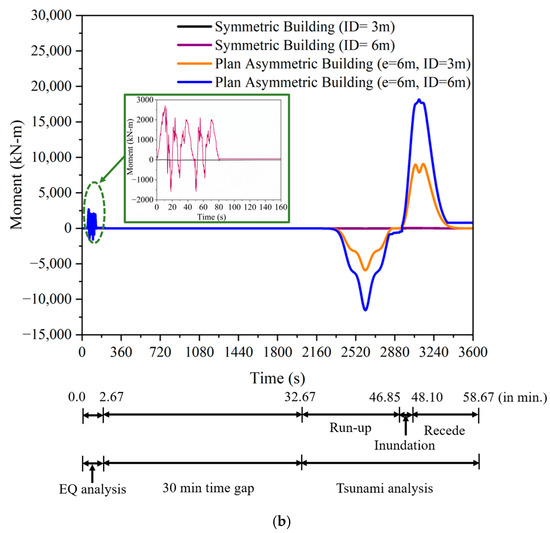
Figure 9.
Sequential time history of (a) force in the Y direction and (b) moment about a vertical axis in a symmetric and plan asymmetric building (e = 6 m) for the first floor.
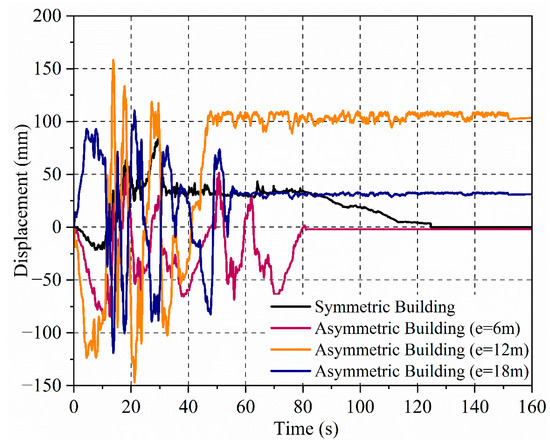
Figure 10.
Lateral displacement time history of earthquake analysis of the plan asymmetric buildings at the top floor.
From the response time history (Figure 10) of the building, the symmetric structure and building with 6.0 m eccentricity showed displacement below the yield threshold of 89.47 mm. This indicates that these buildings do not yield when subjected to earthquake forces, implying that they can withstand seismic activities without undergoing significant plastic deformations. On the other hand, buildings with plan eccentricities of 12.0 m and 18.0 m experience displacements exceeding the yield value. This means that these buildings undergo plastic deformations and fail under earthquake forces. As a result, these buildings are not considered viable for sequential analysis. Since they fail under the earthquake forces, further analysis of their response to additional sequential loads would be impractical and irrelevant, given their compromised structural state.
The earthquake event takes place for 160 s (Figure 4). A time gap of 30 min is observed in the field during the event. Hence, the same is considered in the sequential analysis. The seismic ground acceleration is applied up to 150 s, and no force is applied to the structure in further steps. The response curve shows that the structural response for symmetric and asymmetric structures with 6.0 m eccentricity is reduced, stating that the building is returning to its original condition by approximately 160 s. This behavior is observed due to the damping present in the structures. A sequential analysis under tsunami loading with maximum inundation depths of 3.0 m and 6.0 m is performed. The sequential responses of symmetric and asymmetric buildings with 6.0 m eccentricity are shown in Figure 11. For the symmetric building with a 3.0 m inundation depth, the response history in Figure 11 indicates that the response of the structure under seismic and tsunami forces is within acceptable limits, as the displacements remain below the yield value. Thus, the studied symmetric building can withstand the combined effects of the earthquake and the subsequent 3.0 m tsunami inundation, demonstrating adequate resilience under these conditions.
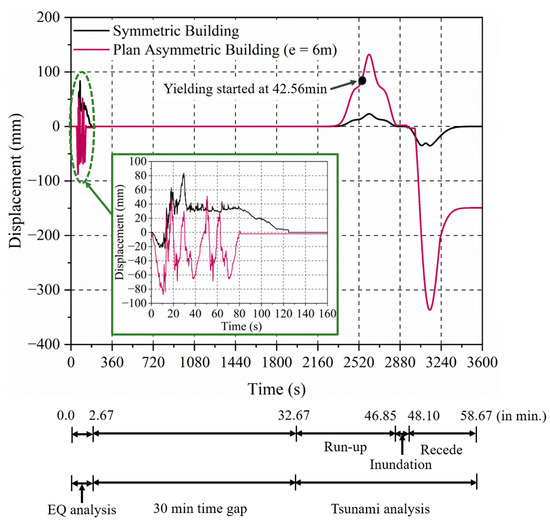
Figure 11.
Sequential displacement time history of symmetric building and building with 6 m eccentricity under inundation depth of 3.0 m.
On the other hand, the building with 6.0 m eccentricity exhibits different behavior under a 3.0 m inundation depth. The analysis reveals that this building undergoes yielding during the sequential tsunami run-up loading, with the first yield point occurring at 2553.84 s (42.56 min), specifically, in the first story. The tsunami force is maximum, with a peak run-up velocity of 2.75 m/s. The drag force dominates, causing structural yielding, although the inundation depth is 1.0 m. The significant displacement due to the 6 m eccentricity makes this building less capable of withstanding the tsunami with an inundation depth of 3.0 m. The main reason for the failure of this building is observed due to the maximum drag force and moment caused by the tsunami drag. The above study shows that the structural adequacy with 6.0 m eccentricity is up to 42.56 min under the sequential events.
After successfully analyzing the first scenario, the symmetric building shows resilience when the building is located away from the seashore. The same building is tested for near-seashore conditions, where the inundation depth is 6.0 m. The sequential analysis is performed similarly with the Japan earthquake and 6.0 m inundation depth tsunami flow characteristics. The sequential time history is shown in Figure 12. In the sequential analysis, the building successfully sustained the earthquake force within the yield limit. However, the building started yielding when the sequential tsunami force was applied after a 30 min time gap. The first yielding is observed at 2433.36 s (40.56 min) in the ground story. This timing indicates that the period of structural adequacy is up to 40.56 min with an inundation depth of 6.0 m. The tsunami run-up velocity is about 3.85 m/s, and the inundation depth is 2.0 m at the time of yielding. The yielding, in this case, is caused by the drag force.
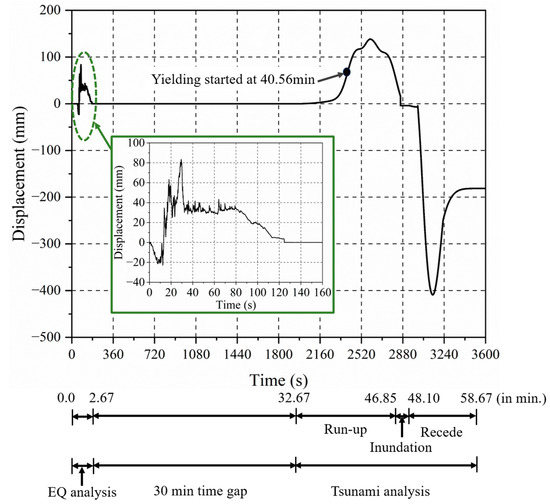
Figure 12.
Lateral displacement time history of symmetric building for inundation depth of 6 m.
The peak inter-story drift ratio (ISDR) of symmetric and plan asymmetric buildings with 6.0 m eccentricity is studied. The study primarily examines the response of the ground story during these dual hazards.
The ground story experiences the most significant response regarding inter-story drift during the earthquake and subsequent tsunami (Figure 13). Specifically, Figure 13b highlights that those buildings that ultimately fail exhibit larger ISDR values than those that survive.
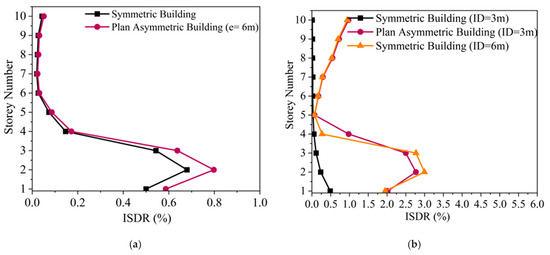
Figure 13.
(a) ISDR of a plan asymmetric building under an earthquake; (b) ISDR of a plan asymmetric building under a tsunami.
3.2. Analysis of Vertical Asymmetric Buildings Under the Sequential Earthquake and Tsunami
Vertical mass asymmetry is also becoming common in RCC structures these days. The asymmetry of stiffness and mass in the vertical direction of the structure is studied separately. A 10-story symmetric building is considered for the present study. (Figure 8).
3.2.1. Stiffness Asymmetric Buildings
The study examines a distinct form of vertical asymmetry in buildings, focusing on their stiffness during seismic and tsunami events. According to the Indian Standard, IS 1893 (Part 1): 2002 [36], the stiffness asymmetric story is defined as a story that has a lateral stiffness lower by 70% of the story above it or 80% of the average of the three stories above the floor. A lateral story stiffness of 65% is considered in the soft story. The stiffness asymmetry in a particular story is achieved by reducing the column dimensions and core wall thickness. Three key locations are targeted for inducing stiffness asymmetry, i.e., the ground story (SAG) and middle story (SAM). Another case of lower stiffness on the top story (SAT) is also considered to account for the cost reduction of the building. The considered stiffness asymmetric cases are shown in Figure 14.
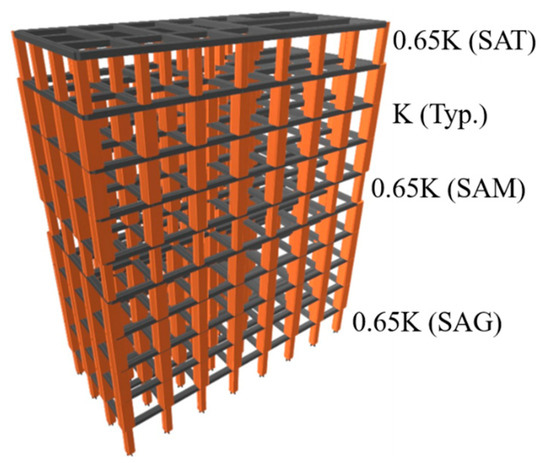
Figure 14.
Vertical stiffness asymmetric buildings with different scenarios of SAG, SAM, and SAT.
The initial step in assessing vertical stiffness asymmetric buildings involves analyzing their performance during an earthquake. This analysis aims to identify which building models could withstand the forces experienced during the 2011 Great Tohoku earthquake. The intention is to filter out models that fail under these conditions before proceeding to a more detailed sequential time history analysis, including earthquake and tsunami loadings. The lateral response time histories of the buildings for the first floor are illustrated in Figure 15. The analysis revealed that the lateral responses of all three cases exceeded the yield limit of the structural material. Exceeding these limits indicates that the buildings have undergone plastic deformations even after removing the earthquake load. Since all the analyzed building cases exceeded the yield limits during the earthquake, it implies that these structures would not remain intact if subjected to additional forces, such as those from a sequential tsunami loading. Therefore, conducting a sequential analysis, which assesses the building’s performance under earthquake forces followed by tsunami forces, is deemed illogical and unrealistic. If the buildings are already failing under earthquake forces, they are unlikely to survive the additional forces imposed by a tsunami. Hence, analysis under sequential tsunami loading is not performed for the vertical stiffness asymmetric buildings.
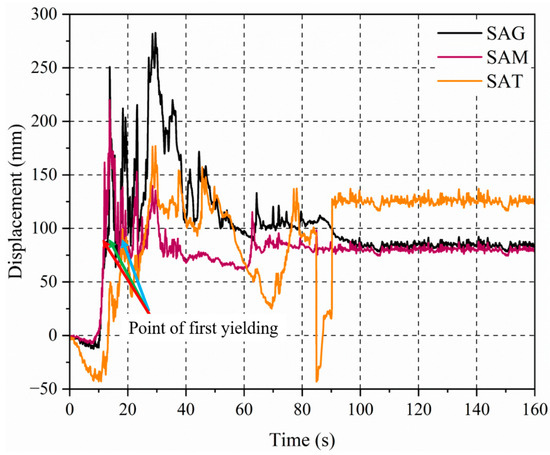
Figure 15.
First-floor displacement time history of vertical stiffness asymmetric buildings under earthquake.
3.2.2. Mass Asymmetric Buildings
Vertical mass asymmetric buildings are structures designed to mimic the conditions experienced during tsunami inundation flow, specifically, for vertical evacuation of the building. The asymmetry in these buildings is achieved by redistributing mass from all floors to one specific floor, creating a vertical mass asymmetry. In this context, dead load refers to the permanent weight of structural elements, such as columns, walls, slabs, beams, partition walls, and cores. The estimated dead load is 7.06 kN/m2 on all the floors. The live load is considered as 3.5 kN/m2. The 50% live load is considered for the event of a tsunami. The variation of the vertical mass asymmetry from the first floor to the upper floors is considered for sequential analysis to explore different vertical evacuation scenarios, which is shown in Figure 16. According to IS 1893 (Part-1): 2002 [36], mass asymmetry can be considered where the seismic weight of a particular story is more than 200% of the adjacent floors. A total combined dead load and live load of 7.935 kN/m2 is applied on all the floors, while 23.805 kN/m2 is applied on the mass asymmetric floor, which is about 200% more than the adjacent floors.
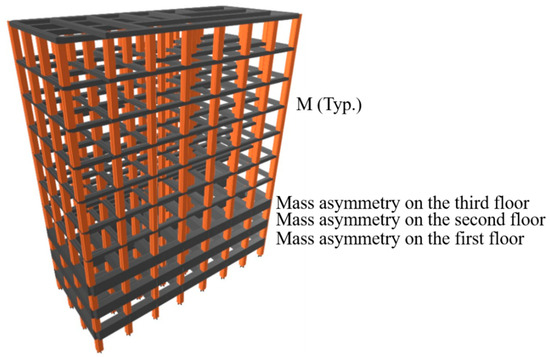
Figure 16.
Building models with vertical mass asymmetry on the first, second, and third floors.
Initially, the vertical mass asymmetry on the first floor was studied, and later, it was extended to the second and third floors. This simulation of mass asymmetric distribution is performed to study the movement of occupants to higher elevations during the event of the tsunami to safeguard their lives.
The primary objective is to identify which vertical evacuation can withstand earthquake and tsunami loads. A detailed earthquake analysis of each model is performed. The nonlinear response time history of the studied mass asymmetric cases for the top floor in the lateral direction is shown in Figure 17. The analysis reveals that the lateral response of models having mass asymmetry at the third floor and above exceeds the yield limit, indicating that these buildings experience significant plastic deformations and structural failure under earthquake loading. In contrast, the model with vertical mass asymmetry at the first and second floors performs satisfactorily under the earthquake load. It does not exceed the yield limit, demonstrating its capacity to handle seismic forces without undergoing detrimental deformations. Consequently, these two models are deemed suitable for the sequential analysis, including the earthquake and the tsunami forces.
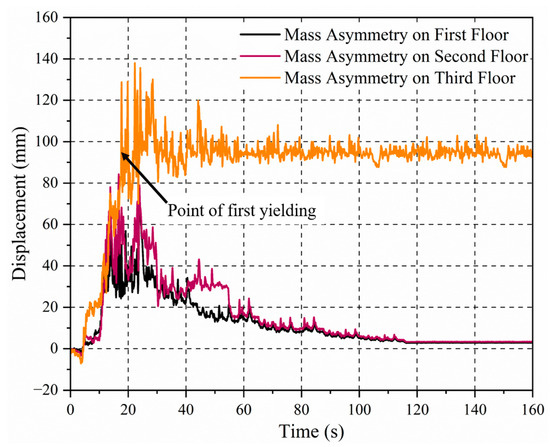
Figure 17.
Top-floor displacement time history of vertical mass asymmetric buildings under earthquake.
The study evaluates the earthquake and tsunami resilience of vertical mass asymmetry in first- and second-floor building models by performing a sequential nonlinear time history analysis. In the first condition, the building models are situated significantly far from the seashore, specifically, in an area where the tsunami inundation depth is 3.0 m. The analysis specifically addresses the nonlinear response in the lateral direction exerted by the earthquake and tsunami. The response time history of the heavy mass at the first or second story of the building is shown in Figure 18. The results show that the displacement in both buildings is below the yield displacement under the seismic and tsunami forces, demonstrating resilience under the earthquake and tsunami with a maximum inundation depth of 3.0 m. The analysis confirms that mass asymmetry at the first and second story can endure the intense shaking of an earthquake and tsunami with an inundation depth of 3.0 m. This is a significant finding, as it suggests that the building can be used as an evacuation building for the tsunami inundation depth of up to 3.0 m. Still, the vertical evacuation is limited to the first and second floors only.
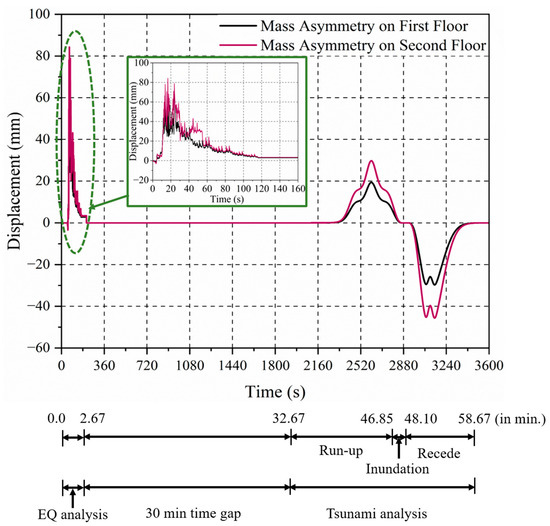
Figure 18.
Top-story displacement time history of vertical mass asymmetry at first and second floors for inundation depth of 3 m in the Y direction.
The initial scenario, where the buildings are far from the seashore, demonstrated sufficient resilience against sequential forces. To investigate deeper into the behavior of the vertical mass asymmetric buildings under severe conditions, an inundation depth of 6.0 m is considered. The time history response of the sequential analysis is shown in Figure 19. Initially, both buildings successfully resisted the forces of the earthquake. However, with a gap of 30 min after the event of an earthquake, the buildings are subjected to tsunami loading. This sequential analysis revealed that the building with mass asymmetry on the first floor responded with a structural adequacy up to 2440.89 s (40.68 min). In comparison, the mass asymmetry on the second floor showed a structural adequacy up to 2408.13 s (40.14 min). Both the mass asymmetric systems showed closer structural adequacy (i.e., just a 0.54 min difference). Both the structures yielded during the tsunami run-up due to the increased drag force and inundation depth. The inundation depth is about 2.0 m and the tsunami flow velocity is about 3.85 m/s during the yielding of the structure.
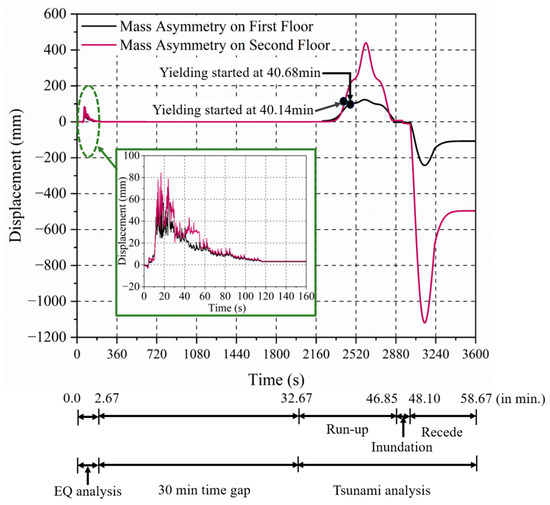
Figure 19.
Top-floor displacement time history of the vertical mass asymmetry at the first and second floors for inundation depth of 6 m in the Y direction.
The study shows that the vulnerability of vertical mass asymmetric buildings to sequential natural disasters increases when the structure is built closer to the shoreline, even though vertical evacuation is at the first and second floors. The flow velocity is observed to be more than 3.0 m/s at the time of yielding, contributing to the drag force increase. A building that can withstand an earthquake has no guarantee to withstand a tsunami, especially with a significant inundation depth and tsunami flow velocity. This highlights the importance of considering multiple hazard scenarios in the design and assessment of buildings, ensuring that the structure can withstand the sequential loading of the events.
The study successfully conducted nonlinear sequential analysis on vertical mass asymmetric buildings, focusing on their ISDR during combined earthquake and tsunami events. This analysis is crucial for understanding how vertical mass distribution influences building response and resilience under extreme conditions. Similar to plan asymmetric buildings discussed earlier, vertical mass asymmetric models exhibit comparable trends in ISDR. Figure 20 indicates that buildings with mass asymmetry on the second floor show significant peak ISDR values, especially under tsunami conditions with a 6 m inundation depth.
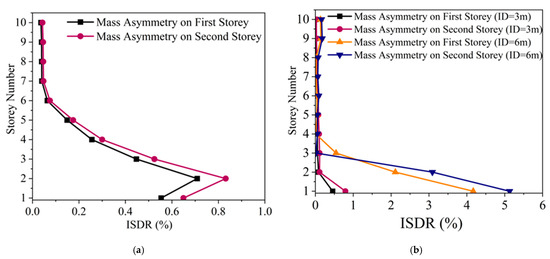
Figure 20.
ISDR of the vertical mass asymmetry on the first and second floors for (a) earthquake and (b) tsunami analysis.
4. Results and Discussions
Symmetric buildings and plan and vertical asymmetric buildings are analyzed under the 2011 Great Tohoku earthquake and Japan tsunami, with an inundation depth of 3.0 m and 6.0 m. The use of the super-element (SE) approach and MATLAB-based implementation significantly enhances the computational efficiency of the proposed sequential nonlinear time history analysis. Traditional 3D finite element models for asymmetric RC buildings are computationally intensive due to their high degrees of freedom and nonlinear material modeling requirements. By contrast, the SE method simplifies the modeling process by condensing each story into a single representative element, capturing buildings’ responses effectively. This reduces the computational complexity drastically without compromising the accuracy of critical building response parameters such as displacement, inter-story drift, and base shear.
The peak forces and moments experienced by various buildings during an earthquake and subsequent tsunami are listed in Table 2.
Table 2.
Base shear and moment during the earthquake and tsunami.
The moment about the vertical axis of the building increases as the eccentricity increases in the plan asymmetric structures. Compared to symmetric structures, the total base shear is reduced by 10.42% and increased by 15.33% in vertical stiffness and mass asymmetric structures, respectively. The force due to the tsunami is increased by 22.63% and 159.14% with the inundation depth of 3.0 m and 6.0 m, respectively, compared with the earthquake force in symmetric buildings. The increment is observed due to an increase in the velocity of the flow. In the case of vertical mass asymmetric structures, the force under a tsunami increased by 6.33% and 124.69% with inundation depths of 3.0 m and 6.0 m when compared with the earthquake force.
The plan asymmetric structures attained large moments as the eccentricity increased. The yield displacements in the plan asymmetric structures are observed due to the moment about the vertical axis of the building. The vertical stiffness and mass asymmetric structures have not experienced any moment, as in the case of plan asymmetric structures.
From the nonlinear time history analysis, the obtained peak displacements are listed in Table 3. The time of structural adequacy and the yielding conditions observed for the considered RC buildings are listed in Table 4. From the study, it is observed that the symmetric structure did not fail under the event of both an earthquake and tsunami with an inundation depth of 3.0 m, but the structure could not withstand the tsunami loading under the inundation depth of 6.0 m.
Table 3.
Peak displacements for different buildings under earthquake and tsunami.
Table 4.
Time of structural adequacy and yielding of the structures.
During a 6.0 m inundation depth, the drag force is increased. The structure showed a time of structural adequacy of 40.56 min for the earthquake and tsunami inundation depth of 6.0 m. The plan asymmetry with 6.0 m eccentricity under the earthquake was found to displace below the yield value. In comparison to the symmetric building, the buildings with higher eccentricities (12.0 m and 18.0 m) failed under seismic loading alone, exhibiting 94.12% and 45.94% greater displacements, respectively, both exceeding the yield threshold. The structural adequacy time is about 42.56 min when the inundation depth is 3.0 m in the case of a plan asymmetric structure with an eccentricity of 6.0 m.
Vertical stiffness and mass asymmetric cases were also studied to account for the different field scenarios. The vertical stiffness asymmetric structures responded with more than 100% displacements in SAG, SAM, and SAT than the symmetric structure. All the studied vertical stiffness asymmetric structures were found to have displacements higher than the yield displacement under the earthquake. Hence, the structures were not analyzed under sequential tsunami loading.
The vertical mass asymmetry at the first, second, or third floors is studied in three cases. The displacement with mass asymmetry at the first and second floors is found below the yield displacement, while the mass asymmetry on the third floor shows displacements larger than the yield displacement under the earthquake. As the mass asymmetry on the third floor failed under an earthquake, further floors were not studied.
The displacement with mass asymmetry on the first, second, or third floors showed a 13.92% reduction, 3.39%, and 66.43% higher displacements than the symmetric building. The tsunami analysis is conducted for the building with mass asymmetry on the first or second floors. In the tsunami analysis, it is observed that the structural response is found below the yield displacement during the entire period of the tsunami, when the inundation depth is up to 3.0 m. When the tsunami inundation depth is increased to 6.0 m, the mass asymmetric structures are displaced more than the yield displacement.
The time of structural adequacy is found to be about 40.68 min and 40.14 min, with mass asymmetry at the first and second floors, respectively. The additional time of structural adequacy, i.e., 54 s, is observed when the mass asymmetry is on the first floor, when compared with the mass asymmetry on the second floor. Even though this time is very short, the time for the occupant to vacate the building is crucial in such events.
Compared to the symmetric structure, buildings with mass asymmetry at the first and second floors exhibit a slightly reduced structural adequacy time. However, introducing mass asymmetry at the lower floor enhances overall stability under lateral loads. This configuration helps in better distributing seismic forces, improving resistance against displacement and deformation. Thus, careful placement of mass irregularities can optimize a building’s performance under earthquake-induced lateral forces.
Mechanically, the peak displacement observed in the structure with mass asymmetry at the third floor is significantly higher than that of structures with mass asymmetry at the first or second floors. This behavior can be attributed to the amplified inertia effects associated with mass concentration at higher elevations. Under dynamic loading conditions, such as during earthquake and tsunami events, mass located at elevated stories increases the overturning moment and lateral inertia forces acting on the structure. Consequently, this mass-induced amplification leads to higher modal participation factors, resulting in larger inter-story drifts and peak displacements in the upper levels.
In all the studied cases of sequential analysis, it is observed that the structural yielding started in the event of a tsunami run-up. This is observed due to the increased inundation depth and flow velocity, which contributed to the drag force on the structure.
In the present study, the nonlinear sequential time history analysis is performed on symmetric, plan asymmetric, and vertically (stiffness or mass) asymmetric buildings to evaluate their survival time under both earthquake and tsunami loading, when the buildings do not fail during the preceding earthquake. The sequential tsunami analysis is terminated once the lateral displacement exceeds the yield value. The present study mainly focused on finding the time for safe evacuation of the building.
The details about the time of structural adequacy, flow velocity, and inundation depth observed at the yielding of buildings are provided in Table 5. The structural adequacy time is close to 40 min, and the flow velocity during yielding is about 3.7 m/s in the analyzed symmetric and vertical mass asymmetric structures. The plan asymmetric structure with 6.0 m eccentricity showed a time of structural adequacy of up to 42.56 min when the inundation depth was about 1.6 m during yielding. The study clearly shows that the flow velocity affects the tsunami force.
Table 5.
Details of time and flow characteristics at the first yielding.
The sensitivity of buildings subjected to earthquake and tsunami loadings can be generalized using a parameter called the Response Index (RI). The RI quantifies the relative difference in peak displacement between the two loading conditions, providing a practical measure of asymmetry in structural behavior. It is calculated using Equation (14).
where Rts and Req are the peak responses of a building under a tsunami and an earthquake, respectively. The RI value ranges from 0 to 1. The higher values refer to greater differences in the structural response under the two loading scenarios.
Buildings with increased plan eccentricity exhibited significantly higher moments about the vertical axis under both earthquake and tsunami loading (as high as 246,192.4 kN-m for 18 m eccentricity under a 6.0 m tsunami). This increased torsional demand leads to early yielding and reduces the time of structural adequacy. Notably, plan asymmetric buildings with 12.0 m and 18.0 m eccentricity failed under earthquake loading alone, indicating that such configurations are highly vulnerable to initial seismic damage, making them unsuitable for tsunami resilience analysis.
Vertical stiffness irregularities, particularly soft-story configurations, resulted in peak displacements exceeding 100% of the symmetric building’s displacement under seismic loading. Since all vertical stiffness asymmetric cases failed during the earthquake phase, they were not subjected to tsunami analysis. These results reinforce the need to discourage soft-story configurations in high-risk coastal zones.
The location of the mass irregularity significantly affected the structural performance. Mass concentration at the first or second floors improved resilience under sequential loading with a 3.0 m tsunami, but similar configurations failed under a 6.0 m tsunami. In contrast, mass placed at the third floor led to significant displacement and failure during the earthquake due to higher modal participation and inertia effects. This suggests that vertical evacuation strategies should be carefully planned: only the lower floors (first or second) of a vertical mass asymmetric building can be considered viable for refuge, especially when tsunami inundation depths are within moderate limits.
ISDRs were higher in buildings that ultimately failed, especially in plan and vertical mass asymmetric cases under tsunami loading. The ISDR peaked at the ground or second floors, confirming localized drift concentration in asymmetrically loaded or mass-distributed configurations. These findings suggest a need for performance-based design checks focusing on drift control in sequential hazard scenarios
In tsunami-exposed regions, priority should be given to symmetric building designs due to their superior performance under sequential loading. Building codes should incorporate stricter limitations on torsional irregularity to address vulnerabilities in both seismic- and tsunami-prone areas. Additionally, soft-story configurations—characterized by vertical stiffness asymmetry—should be explicitly restricted in high-risk coastal zones. Finally, careful attention must be given to vertical mass distribution, ensuring that vertical evacuation floors are located at lower levels, where the impact of mass-induced inertia is minimized.
5. Conclusions
This study presents a nonlinear sequential time history analysis to assess the performance of symmetric and asymmetric 10-story RC buildings during the 2011 Great Tohoku earthquake and Japan tsunami. The main conclusions derived from this study are as follows:
- For the considered structures, the results decisively indicate that symmetric structures exhibit superior resilience, while asymmetric configurations, particularly those with large plan and stiffness irregularities, experience significant structural vulnerabilities, often leading to failure under an earthquake.
- Under seismic loading, plan asymmetric buildings with large eccentricities failed, while stiffness-asymmetric structures suffered excessive deformations due to uneven stiffness distribution.
- Vertical mass asymmetry shows a dual impact: when concentrated on lower floors, it enhances tsunami resilience; when shifted to upper floors, it amplifies vulnerability under seismic and tsunami loading. Furthermore, the tsunami inundation depth and flow velocity emerge as critical determinants of structural failure.
- The time of structural adequacy is found to be close to 40 s, whether the inundation depth is 3.0 m or 6.0 m in a symmetric plan asymmetric structure with 6 m eccentricity and mass asymmetry at the first and second floors. Hence, the occupants of the buildings should be evacuated before the tsunami run-up.
- The Response Index (RI) highlights the variation in structural responses under sequential earthquake–tsunami loading. For a 3.0 m tsunami, RI values were 0.56 (symmetric), 0.74 (plan asymmetric, 6 m), 0.62 (mass asymmetry at first floor), and 0.46 (second floor), indicating greater sensitivity in asymmetric configurations. For a 6.0 m tsunami, RI increased to 0.80 (symmetric), 0.71 (first-floor mass asymmetry), and 0.92 (second floor), demonstrating that a higher inundation depth amplifies structural response nonlinearity and drift demands. The RI increases with the degree of asymmetry, highlighting that mass and plan irregularities exacerbate the sensitivity of buildings to different loading conditions.
- This study can identify optimal design strategies to improve resilience in high-risk seismic and tsunami-prone areas by analyzing these factors. The findings will contribute to developing safer, more sustainable built environments, reducing structural vulnerabilities and ensuring better disaster preparedness.
The findings demonstrate that symmetric reinforced concrete buildings exhibit superior resilience under sequential earthquake–tsunami events. This supports the recommendation that torsional irregularities in plan (e.g., eccentricities beyond 6.0 m) and vertical stiffness asymmetries (e.g., soft stories) should be avoided in new constructions near coastlines. Structural designers can use the time of structural adequacy as a benchmark to determine if a building provides a sufficient evacuation window before a tsunami impact.
The results indicate that mass asymmetry at lower floors (first or second) can improve tsunami resilience without compromising seismic performance. This insight offers a practical retrofitting strategy: reinforcing lower stories or redistributing critical mass downward in existing buildings to improve stability under lateral loads. Conversely, soft-story retrofits must target enhanced stiffness continuity to avoid early seismic yielding.
By introducing and quantifying the time of structural adequacy, we provide an evidence-based metric to support vertical evacuation decisions. For example, buildings with mass asymmetry at the first or second floor were found structurally adequate up to ~40.6 min during a 6.0 m tsunami. This allows emergency managers to determine safe occupancy zones and prioritize evacuation routes within multi-story shelters.
6. Limitations and Future Study
The present study primarily considered the drag force induced by tsunami flow as the dominant loading mechanism affecting building performance under sequential earthquake and tsunami events. However, in real tsunami scenarios, other significant forces, such as debris impact forces, shielding effects due to the presence of nearby structures, and flow channelization effects, can substantially influence the structural response. These additional load effects were not incorporated into the current analysis due to the limited availability of reliable field data, especially from the 2011 Great Tohoku Earthquake and Tsunami. The omission of these factors presents a limitation in fully replicating the complex interaction between tsunami forces and structural systems, potentially leading to conservative or simplified estimations of structural performance.
Future research can build upon the current work by incorporating a broader range of tsunami-induced forces, including debris impact modeling and the influence of shielding and channelization effects. Furthermore, the study can be expanded to analyze a greater diversity of asymmetric building configurations, considering various plan and vertical irregularities. In addition, the scope can be extended to fragility analyses to quantify probabilistic damage states, performance-based seismic and tsunami assessments to establish performance objectives, and progressive collapse analyses to investigate failure propagation under multi-hazard scenarios. Incorporating multi-force tsunami loading models, which simulate debris impact and shielding phenomena, would provide a more comprehensive understanding of structural vulnerabilities. A comprehensive sensitivity analysis can be conducted by varying material, damping, and drag parameters to evaluate their influence on displacement, structural adequacy time, and failure mechanisms.
Furthermore, experimental validations and high-fidelity numerical simulations could be employed to refine load assumptions and improve the predictive accuracy of sequential analysis frameworks. Ultimately, such advancements will contribute to the development of more resilient, sustainable, and disaster-prepared urban infrastructure.
Author Contributions
Conceptualization, S.M.; Methodology, P.K. and S.M.; Formal analysis, P.K.; Investigation, P.K.; Data curation, P.K.; Writing—original draft, P.K. and S.M.; Writing—review and editing, M.A.; Visualization, P.K. and M.A.; Project administration, S.M.; Supervision, S.M. All authors have read and agreed to the published version of the manuscript.
Funding
This research received no external funding.
Data Availability Statement
The original contributions presented in this study are included in the article. Further inquiries can be directed to the corresponding author.
Acknowledgments
The authors gratefully acknowledge the use of earthquake strong motion data obtained from the Strong Motion Virtual Data Center (https://strongmotioncenter.org/, accessed on 5 January 2024). The data used in this study were provided by the originating agencies and institutions, and their contributions are sincerely appreciated. Specific waveform and metadata files for the Tohoku, Japan, 2011 earthquake event were accessed from the Virtual Data Centre’s repository.
Conflicts of Interest
The authors declare no conflicts of interest.
Nomenclatures
| b | Width of wave-facing element |
| [C] | Global Damping matrix |
| Drag coefficient | |
| Eccentricity in the x and y direction, respectively (i.e., distance between the center of mass and the center of stiffness) | |
| {FH}, {FD} | Hydrostatic and drag force due to tsunami |
| Force due to earthquake or tsunami | |
| Nodal force vector due to earthquake | |
| Nodal force vector due to tsunami | |
| Nodal earthquake force in the y direction | |
| Inundation depth of tsunami wave | |
| Acceleration due to gravity | |
| Rotational nodal mass moment of inertia | |
| Tsunami importance factor | |
| Nodal stiffness | |
| [kSE] | Elemental Stiffness matrix |
| [KSE] | Stiffness matrix of single super element of each floor |
| [K] | Global stiffness matrix |
| Nodal coupled stiffness about the x and y axes, respectively | |
| Nodal translational stiffness in the x and y directions, respectively | |
| Nodal torsional stiffness about the z-axis | |
| Original inundation depth of tsunami flow | |
| Desired inundation depth of flow | |
| [m] | Mass matrix of lumped node |
| [M] | Global mass matrix |
| Nodal moment about the vertical axis due to earthquake and tsunami forces, respectively | |
| m1 and m2 | Nodal mass of longitudinal and lateral degrees of freedom |
| Radius of gyration | |
| Original flow velocity of the tsunami | |
| Desired flow velocity | |
| Incident flow velocity of tsunami waves | |
| Systems displacement, velocity, and acceleration, respectively | |
| Density of sea water | |
| Scale ratio | |
| Frequency ratio | |
| Abbreviations | |
| EQ | Earthquake |
| SE | Single super Element |
| SAG | Stiffness asymmetry on the ground story |
| SAM | Stiffness asymmetry on the middle story |
| SAT | Stiffness asymmetry on the top story |
| ID | Inundation Depth |
| ISDR | Inter-story drift ratio |
| MSL | Mean Sea Level |
| RSL | Reference Sea Level |
References
- Leelawat, N.; Suppasri, A.; Murao, O.; Imamura, F. A study on the influential factors on building damage in Sri Lanka during the 2004 Indian Ocean tsunami. J. Earthq. Tsunami 2016, 10, 1640001. [Google Scholar] [CrossRef]
- Palermo, D.; Nistor, I.; Saatcioglu, M.; Ghobarah, A. Impact and damage to structures during the 27 February 2010 Chile tsunami. Can. J. Civ. Eng. 2013, 40, 750–758. [Google Scholar] [CrossRef]
- Daniell, J.E.; Vervaeck, A.; Wenzel, F. A timeline of the Socio-economic effects of the 2011 Tohoku Earthquake with emphasis on the development of a new worldwide rapid earthquake loss estimation procedure. In Proceedings of the Australian Earthquake Engineering Society 2011 Conference, Adelaide, Australia, 18–20 November 2011; pp. 18–20. [Google Scholar]
- Kajitani, Y.; Chang, S.E.; Tatano, H. Economic impacts of the 2011 Tohoku-Oki earthquake and tsunami. Earthq. Spectra 2013, 29 (Suppl. S1), 457–478. [Google Scholar] [CrossRef]
- Sundermann, L.; Schelske, O.; Hausmann, P. Mind the Risk: A Global Ranking of Cities Under Threat from Natural Disasters; Swiss Re: Zürich, Switzerland, 2013; Available online: http://www.indiaenvironmentportal.org.in/content/389862/mind-the-risk-a-global-ranking-of-cities-under-threat-from-natural-disasters/#:~:text=Natural%20Disasters-,Mind%20the%20risk:%20A%20global%20ranking%20of%20cities%20under%20threat,earthquakes%20and%20other%20natural%20hazards (accessed on 27 March 2024).
- Satake, K. Advances in earthquake and tsunami sciences and disaster risk reduction since the 2004 Indian Ocean tsunami. Geosci. Lett. 2014, 1, 15. [Google Scholar] [CrossRef]
- De Llera, J.C.L.; Chopra, A.K. A simplified model for analysis and design of asymmetric-plan buildings. Earthq. Eng. Struct. Dyn. 1995, 24, 573–594. [Google Scholar] [CrossRef]
- Rossetto, T.; De la Barra, C.; Petrone, C.; De la Llera, J.C.; Vásquez, J.; Baiguera, M. Comparative assessment of nonlinear static and dynamic methods for analysing building response under sequential earthquake and tsunami. Earthq. Eng. Struct. Dyn. 2019, 48, 867–887. [Google Scholar] [CrossRef]
- Naskar, M.; Roy, R.; Mayengbam, S.S. Response of Vertically Irregular Buildings to Tsunami. In Recent Advances in Civil Engineering; Springer Nature: Singapore, 2023; pp. 161–168. [Google Scholar]
- Del Zoppo, M.; Di Ludovico, M.; Prota, A. A mechanics-based method towards risk assessment of RC buildings under tsunami and flow-type hazards. Eng. Struct. 2022, 264, 114452. [Google Scholar] [CrossRef]
- Del Zoppo, M.; Di Ludovico, M.; Lignola, G.P.; Prota, A. Time-dependent tsunami fragility analysis for reinforced concrete building stock. Eng. Struct. 2025, 330, 119931. [Google Scholar] [CrossRef]
- Ruggieri, S.; Uva, G. Extending the concepts of response spectrum analysis to nonlinear static analysis: Does it make sense? Innov. Infrastruct. Solut. 2024, 9, 235. [Google Scholar] [CrossRef]
- Kazemi, F.; Asgarkhani, N.; Jankowski, R. Machine learning-based seismic fragility and seismic vulnerability assessment of reinforced concrete structures. Soil Dyn. Earthq. Eng. 2023, 166, 107761. [Google Scholar] [CrossRef]
- Park, S.; van de Lindt, J.W.; Cox, D.; Gupta, R.; Aguiniga, F. Successive earthquake-tsunami analysis to develop collapse fragilities. J. Earthq. Eng. 2012, 16, 851–863. [Google Scholar] [CrossRef]
- Scott, M.H.; Mason, H.B. Constant-ductility response spectra for sequential earthquake and tsunami loading. Earthq. Eng. Struct. Dyn. 2017, 46, 1549–1554. [Google Scholar] [CrossRef]
- Petrone, C.; Rossetto, T.; Goda, K. Fragility assessment of a RC structure under tsunami actions via nonlinear static and dynamic analyses. Eng. Struct. 2017, 136, 36–53. [Google Scholar] [CrossRef]
- Takahashi, N.; Hachiro, Y. Sequential time-history analysis of building structures under earthquake and tsunami loads. In Proceedings of the Eleventh US National Conference on Earthquake Engineering, Los Angeles, CA, USA, 25–29 June 2018. [Google Scholar]
- Goda, K.; Mori, N.; Yasuda, T.; Prasetyo, A.; Muhammad, A.; Tsujio, D. Cascading geological hazards and risks of the 2018 Sulawesi Indonesia earthquake and sensitivity analysis of tsunami inundation simulations. Front. Earth Sci. 2019, 7, 261. [Google Scholar] [CrossRef]
- Petrone, C.; Rossetto, T.; Baiguera, M.; De la Barra Bustamante, C.; Ioannou, I. Fragility functions for a reinforced concrete structure subjected to earthquake and tsunami in sequence. Eng. Struct. 2020, 205, 110120. [Google Scholar] [CrossRef]
- Tagle, S.J.; Jünemann, R.; Vásquez, J.; Llera, J.C.; Baiguera, M. Performance of RC wall building subjected to earthquake and tsunami in sequence. In Proceedings of the 17th World Conference on Earthquake Engineering, Sendai, Japan, 27 September–2 October 2020. [Google Scholar]
- Tagle, S.J.; Jünemann, R.; Vásquez, J.; Llera, J.C.; Baiguera, M. Performance of a reinforced concrete wall building subjected to sequential earthquake and tsunami loading. Eng. Struct. 2021, 238, 111995. [Google Scholar] [CrossRef]
- Cortez, C.; Jünemann, R.; Fernández, C.; Urrutia, A.; Crempien, J.G.F.; Cienfuegos, R. Performance of an RC building under seismic and tsunami actions in sequence via nonlinear dynamic analysis including soil-structure interaction. Eng. Struct. 2022, 272, 114942. [Google Scholar] [CrossRef]
- Ji, D.; Wen, W.; Zhai, C.; Lu, D. Inelastic displacement ratios for SDOF structures subjected to earthquake-tsunami loadings. J. Earthq. Eng. 2022, 26, 7768–7786. [Google Scholar] [CrossRef]
- Harati, M.; van de Lindt, J.W. Impact of long-duration earthquakes on successive earthquake-tsunami fragilities for reinforced concrete frame archetypes. J. Struct. Eng. 2024, 150, 04024126. [Google Scholar] [CrossRef]
- Hanggara, D.; Wijeyewickrema, A.C. Vulnerability assessment of reinforced concrete buildings in Indonesia subjected to tsunami inundation forces. Int. J. Disaster Resil. Built Environ. 2020, 11, 204–218. [Google Scholar] [CrossRef]
- Madhuri, S.; Kumar, P. Response of asymmetric reinforced concrete buildings under directional seismic loads. Asian J. Civ. Eng. 2024, 25, 1625–1640. [Google Scholar] [CrossRef]
- Thambiratnam, D.P.; Corderoy, H.J.B. Effects of asymmetry on the response of multistorey buildings to earthquakes. Eng. Struct. 1994, 16, 210–221. [Google Scholar] [CrossRef]
- Saatcioglu, M.; Ozcebe, G. Response of reinforced concrete columns to simulated seismic loading. ACI Struct. J. 1989, 86, 3–12. [Google Scholar] [CrossRef]
- Chopra, A.K. Dynamics of Structures: Theory and Applications to Earthquake Engineering, 4th ed.; Pearson Education: London, UK, 2012. [Google Scholar]
- Paz, M.; Leigh, W. Structural Dynamics: Theory and Computation, 5th ed.; Springer: New York, NY, USA, 2004. [Google Scholar]
- Mevada, S.V.; Jangid, R.S. Seismic response of torsionally coupled system with magnetorheological dampers. Adv. Civ. Eng. 2012, 2012, 381834. [Google Scholar] [CrossRef][Green Version]
- Attary, N.; Unnikrishnan, U.V.; van de Lindt, J.W.; Cox, D.T.; Barbosa, A.R. Performance-based tsunami engineering methodology for risk assessment of structures. Eng. Struct. 2017, 141, 676–686. [Google Scholar] [CrossRef]
- Alam, M.S.; Barbosa, A.R.; Scott, M.H.; Cox, D.X.; van de Lindt, J.W. Development of physics-based tsunami fragility functions considering structural member failures. J. Struct. Eng. 2018, 144, 04017221. [Google Scholar] [CrossRef]
- FEMA. Coastal Construction Manual: Principles and Practices of Planning, Siting, Designing, Constructing, and Maintaining Residential Buildings in Coastal Areas, 4th ed.; FEMA: Washington, DC, USA, 2011; Volume 2. [Google Scholar]
- ASCE/SEI 7–10; Minimum Design Loads and Associated Criteria for Buildings and Other Structures. American Society of Civil Engineers: Reston, VA, USA, 2017; p. 42. [CrossRef]
- IS 1893 (Part-1); Criteria for Earthquake Resistant Design of Structures—General Provision and Buildings (Fifth Revision). Bureau of Indian Standard: New Delhi, India, 2002.
- Koshimura, S.; Hayashi, S. Tsunami flow measurement using the video recorded during the 2011 Tohoku tsunami attack. In Proceedings of the IEEE International Symposium on Geoscience and Remote Sensing (IGARSS), Munich, Germany, 22–27 July 2012; pp. 6693–6696. [Google Scholar]
- California Geological Survey and U.S. Geological Survey. Center for Engineering Strong Motion Data (CESMD). 2005. Available online: https://www.strongmotioncenter.org/ (accessed on 5 January 2024).


Disclaimer/Publisher’s Note: The statements, opinions and data contained in all publications are solely those of the individual author(s) and contributor(s) and not of MDPI and/or the editor(s). MDPI and/or the editor(s) disclaim responsibility for any injury to people or property resulting from any ideas, methods, instructions or products referred to in the content. |
© 2025 by the authors. Licensee MDPI, Basel, Switzerland. This article is an open access article distributed under the terms and conditions of the Creative Commons Attribution (CC BY) license (https://creativecommons.org/licenses/by/4.0/).