Abstract
This study presents a comprehensive Life Cycle Assessment (LCA) of the NENGOUE residence, a multi-occupancy building located in Yaoundé, Cameroon, over an 80-year lifespan. The analysis encompasses four life cycle phases—construction, use, renovation, and deconstruction—and evaluates twelve environmental impact categories. The results reveal that the use phase contributes overwhelmingly to environmental burdens, accounting for over 96% of total impacts. To mitigate this dominance, two alternative scenarios were assessed: a sustainable transport model and the integration of a photovoltaic system. In the first scenario, environmentally friendly commuting strategies, such as increased walking, cycling, and public transport, led to a 17.10% reduction in greenhouse gas (GHG) emissions. In the second, rooftop photovoltaics offset 69.29% of the building’s electricity needs, resulting in a 26.72% GHG reduction. A third, combined scenario demonstrated the highest environmental gains, achieving a 42.97% reduction in GHG emissions, alongside substantial improvements across other impact categories, including acidification (−38.4%), cumulative energy demand (−28.3%), and photochemical ozone formation (−40.18%). In addition to the environmental benefits, the study highlights the importance of considering social acceptance, behavioral change, and economic feasibility for real-world implementation. The willingness of residents to adopt sustainable mobility practices, cultural preferences, safety concerns, and the initial cost barriers associated with photovoltaic technology are identified as critical factors. These findings underscore the need for integrated strategies that combine technological innovation with inclusive urban planning and stakeholder engagement. The proposed approach demonstrates that aligning environmental measures with local socio-economic realities can significantly enhance the sustainability of residential buildings, contributing meaningfully to climate change mitigation in Sub-Saharan African cities.
1. Introduction
The residential building sector accounts for more than 22% of the global final energy consumption, ranking among the most energy-intensive sectors, alongside transportation and industry [1]. It is also directly responsible for over 6% of global greenhouse gas (GHG) emissions and indirectly for more than 11%, resulting in a combined GHG impact of over 17% [1]. Such a significant contribution cannot be overlooked, especially as the global environmental situation becomes increasingly alarming. According to the United Nations Environment Programme (UNEP), human activities are driving three interrelated environmental crises: pollution and waste, climate change, and biodiversity loss coupled with ecosystem degradation [2]. In an effort to address what has become one of the most pressing global concerns, several international organizations, in collaboration with national governments, have initiated actions aimed at promoting sustainable development to help preserve the “blue planet”. In this context, the United Nations (UN) developed the eight Millennium Development Goals (MDGs) and the 17 Sustainable Development Goals (SDGs). It also established the Conference of the Parties (COP) at the Earth Summit in Rio de Janeiro in 1992 to reduce greenhouse gas (GHG) emissions and minimize human impact on climate change [3]. More recently, on 20 September 2023, the UN held the Climate Ambition Summit in New York, USA [4], with objectives that included limiting global warming to 1.5 °C and catalyzing “a decisive political moment to demonstrate global collective will to accelerate the pace and scale of a just transition towards a more equitable, renewable energy-based, and climate-resilient global economy” [4].
Numerous additional initiatives have emerged worldwide, with many countries adopting regulations aimed at improving energy use and protecting the environment. For example, the European Union’s Ecodesign Regulation prohibits the sale of energy-related products that do not meet minimum performance standards [5], France’s Energy Transition Law promotes a low-carbon economy [6], and in West Africa, energy labeling has been introduced for electric lamps and new household appliances [7], among others. Several methodologies can be utilized to evaluate the environmental performance of buildings. Among them, Life Cycle Assessment (LCA) has emerged as a widely acknowledged and internationally standardized scientific approach. It remains the only method with full scientific validation for assessing environmental impacts at the building level, offering a comprehensive and quantitative evaluation across the entire life cycle of a structure. Most peer-reviewed studies addressing environmental performance in the construction sector are grounded in this methodology [8]. The concept of LCA dates back to 1969, when the Midwest Research Institute (MRI) conducted an early assessment for the Coca-Cola Company. The objective was to provide evidence-based guidance on selecting the most environmentally appropriate packaging option. However, due to the proprietary nature of the data, the findings of this pioneering work were never released to the public [9]. In subsequent decades, particularly during the 1970s, global events such as oil crises and a surge in environmental, industrial, and natural disasters—ranging from toxic emissions and severe storms to nuclear accidents like the Chernobyl disaster—heightened global awareness of ecological issues. These crises prompted the development of energy efficiency evaluation tools, which temporarily overshadowed more comprehensive frameworks like LCA [10]. Nonetheless, progress in environmental data collection eventually led to the release of the first publicly accessible LCA database in Switzerland, known as BUWAL [11].
The international standards ISO 14040 and ISO 14044 [12,13] were revised to provide more precise guidelines for conducting Life Cycle Assessment (LCA), thereby solidifying its methodological foundations. Today, LCA is widely acknowledged as the most robust and comprehensive multi-criteria tool for evaluating environmental impacts, including at the full building scale [14]. During the 2010s, the operational phase of a typical building was found to account for approximately 60–90% of its total environmental footprint, primarily due to energy demands for heating and cooling [15]. Rossi et al. [16] performed a comparative life cycle analysis of a conventional residential building constructed using two distinct techniques alongside a metal-framed dwelling across three European nations—Belgium, Portugal, and Sweden. Despite the climatic differences among these countries, the operational stage consistently emerged as the dominant contributor to environmental impact in all cases. Citherlet [17] underscored the significance of the construction and end-of-life phases, particularly when annual energy consumption falls below 150 MJ/m2, suggesting that the relative impact of these phases becomes more pronounced. Research by Thormark [18,19] in Switzerland investigated the environmental potential of recycling building materials, while Blengini [20] explored the demolition phase of a four-decade-old residential structure in Italy. Both studies revealed that material reuse typically yields greater environmental benefits than recycling.
Erlandsson and Levin [21] examined the ecological implications of renovating existing homes in Switzerland, concluding that renovation is generally a more sustainable approach compared to demolition and new construction. However, they noted that restrictive urban planning regulations often hinder the adoption of optimal energy efficiency strategies. One persistent challenge in neighborhood-scale climate analysis has been the limited availability of consistent and high-resolution data regarding life cycle carbon emissions and energy usage. Addressing this issue, Nematchoua et al. [22] conducted a 2022 study that compared urban, rural, and sustainable neighborhood typologies adaptable to diverse geographic regions. Their work provided strategic recommendations to curb emissions and minimize energy consumption. Notably, the combination of widespread building retrofits and rooftop photovoltaic systems was identified as a promising approach, supporting the feasibility of achieving carbon neutrality at the neighborhood level by 2050.
This study aims to minimize the environmental impacts and costs associated with a residential building throughout its entire life cycle, with the overarching goal of achieving nearly zero energy consumption. Specifically, the research focuses on the NENGOUE residence, a four-story building (ground floor plus three levels) located in the Simbock neighborhood of Yaoundé. The methodology involves conducting a dynamic thermal analysis of the building using architectural simulation software, followed by a comprehensive Life Cycle Assessment (LCA) of the case study. The environmental cost of the resulting impacts is then quantified using the Global Method Monetization (MMG) approach. Subsequently, various scenarios are developed to enhance the building’s energy performance while simultaneously reducing its environmental cost. These alternative scenarios are compared to the baseline configuration, ultimately leading to the identification of the optimal scenario, which serves as an optimized model for the case study.
2. Materials and Methods
2.1. Building Description
The building analyzed in this study, referred to as “Residence NENGOUE”, is situated in a suburban area of Yaoundé, at the boundary between the SIMBOCK and MBALGONG neighborhoods within the MBANKOMO District, approximately 100 m from the MEFOU River. It is a residential structure surrounded by other dwellings on both sides, with its main façade facing a narrow street. The building comprises a ground floor and three upper floors. The ground floor includes four commercial shops, an unused garage, and two residential rooms. Each of the three identical upper floors consists of one apartment containing a living room, kitchen, and two bedrooms—a master bedroom with an en-suite bathroom and a secondary bedroom with access to a shared bathroom—along with three studio apartments per floor. Constructed in 2021, the building is considered relatively new. Figure 1 presents a top-down view of the structure, geolocated using Google Maps at coordinates 3°48′27″ north latitude and 11°27′57″ east longitude.
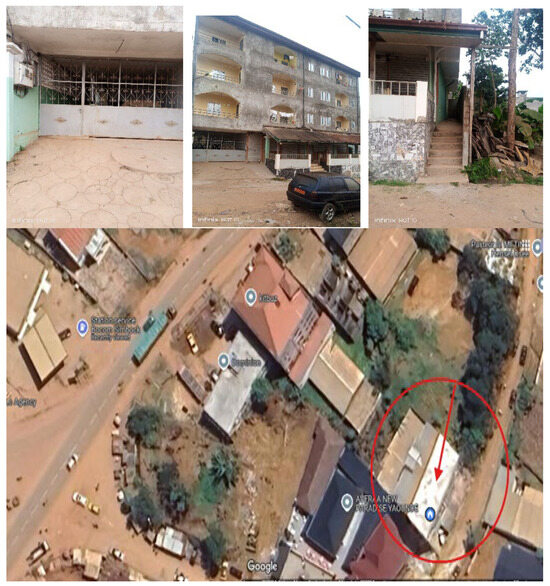
Figure 1.
Location of Residence NENGOUE (over) and main façade of Residence NENGOUE (below).
In this study, we selected “NENGOUE residence” as a case study, because this building is located on the outskirts of Yaoundé, Cameroon’s largest city, and represents a typical example of urban housing in Sub-Saharan Africa, characterized by rapid urbanization, high population density, and socio-economic diversity. The architectural typology—a reinforced concrete structure with a corrugated metal roof and limited natural ventilation—is commonly found in many urban areas across the region. Furthermore, this case study was chosen due to the availability of comprehensive data, including architectural plans, material properties, and localized climatic data, which allowed for a reliable and precise energy simulation. Most importantly, the insights gained from this study are transferable to similar urban settings in Sub-Saharan Africa, offering valuable guidance for improving energy performance and climate resilience in resource-constrained environments. The building has a total floor area of approximately 420 m2. Energy consumption patterns are primarily driven by the use of lighting, refrigeration, fans, and, increasingly, air-conditioning systems during the hot seasons. The building is connected to the national power grid and does not currently utilize renewable energy technologies. Mobility patterns of the residents are characterized by a high dependence on individual motorized transport due to limited access to reliable public transportation, which significantly contributes to the overall environmental impacts during the use phase. This contextualization allows the findings of the study to be interpreted within a realistic urban African framework and provides insights into the applicability of sustainable interventions in similar settings.
2.2. Building Modeling
To perform this modeling, we obtained a photocopy of the 2D plans of the building from the owner of the residence. Using the “Modeleur” component of Pléiades software version 6.25.3, we were able to create a digital model of the building, as shown in Figure 2 below.
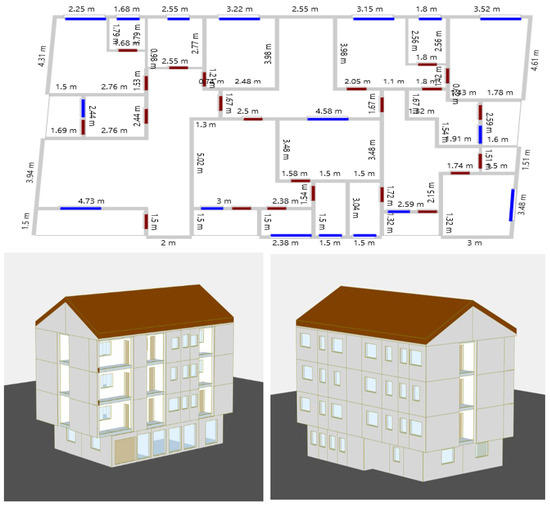
Figure 2.
Layout plan of levels 1, 2, and 3 in the Pléiades Modeleur (figure above). North and west façades (left side) and south and east façades (right side).
2.3. Detailed Inventory of the Building Parameters
2.3.1. Construction Data
The modeling of a building in Pléiades Modeleur follows the sequential order of tabs, starting with the input of envelope elements (including wall compositions, floors, partitions, roofing, and surface states), followed by the definition of openings (doors and windows) and, finally, the thermal bridges. It is worth noting that the software provides predefined compositions for these elements, although users also have the option to modify existing compositions or create custom ones by inputting the specific characteristics of materials. Material quantities (e.g., volumes of concrete, steel, aluminum, and timber) were obtained directly from the architectural and structural drawings of the NENGOUE residence, provided by the project’s engineering team. Energy use data for the operational phase were derived from dynamic thermal simulations using EnergyPlus software, version 8.4.0 calibrated with real-time meteorological data for Yaoundé and typical user behavior in residential buildings. Where available, transport patterns and distances were based on site-specific information, including the locations of suppliers and construction sites, as well as interviews with local contractors and transportation service providers. When local data were not available, we relied on regionally appropriate averages from the Ecoinvent 3.1 database, adjusted to reflect the Sub-Saharan African context. To ensure data quality, all inputs were validated through cross-referencing with published literature on similar housing projects in Cameroon and other parts of Sub-Saharan Africa.
2.3.2. Composition of the Envelope Elements
The Pléiades library allows users to select different types of predefined envelope elements, including walls; floors (ground, intermediate, and top floors); and roofs. In addition to these default elements, the software also enables users to create custom envelope compositions. To achieve this, it is crucial to define key material parameters, such as thickness (e), thermal conductivity (λ), density (ρ), and thermal resistance (R). Based on the available data, we aimed to model these elements as accurately as possible to reflect real-world conditions. The Table 1 shows some wall materials of residence evaluated.

Table 1.
Composition of the walls of the NENGOUE residence.
The “Joinery” tab of the Pléiades library allows for the input of the building’s doors and windows. In our case study, the exterior and interior doors are made of wood, while the garage gate and sliding patio doors are made of aluminum. The properties, contained in Table 2, are described below.
Table 2.
Properties of the Joinery of the NENGOUE residence.
Pléiades provides the ability to import weather files from major meteorological stations for dynamic thermal simulation (DTS) calculations. It natively uses weather files in .TRY format. In our case study, we use a TRY data file for the city of Yaoundé from the Meteocalc meteorological station. The LCA was conducted in accordance with ISO 14040 and ISO 14044 standards. The functional unit was defined as 1 m2 of usable floor area of the NENGOUE residence over a 50-year lifespan, allowing for comparison with other residential buildings in similar climatic and socio-economic contexts. The system boundaries covered a cradle-to-grave approach, including raw material extraction, transportation, construction, operation (energy use), maintenance, and end-of-life stages (demolition and disposal). The analysis was performed using the Pleaides LCAv 6.25.3 tool with the Ecoinvent 3.1 database, which offers a comprehensive inventory of environmental data relevant to Sub-Saharan conditions. Key assumptions included the use of regionally typical materials (e.g., cement, steel, aluminum, and local wood); standard transport distances based on Cameroonian infrastructure; a 50-year service life; and disposal practices common in urban Cameroon (e.g., landfilling and partial recycling).
2.4. Dynamic Thermal Analysis
2.4.1. Building Zoning
Zoning is the basic structure of the thermal model. A thermal zone thus represents a volume from which scenarios such as occupancy, electrical energy dissipation, solar gains, conductive heat transfer, etc. can be applied. Depending on the needs, different zoning approaches can be used. For our study, we performed zoning based on the rooms of the building, as the thermal behaviors in different room types vary significantly. For example, the thermal behaviors in the living room, kitchen, bathroom, and bedroom differ greatly. All the thermal zones created in Pléiades Modeleur are shown in Table 3 below.
Table 3.
Thermal zones for the case study.
2.4.2. Heating Setpoint
For better thermal comfort of the building occupants, the interior temperatures of the rooms should vary depending on whether one is in a bedroom, living room, bathroom, or kitchen. In our context, the building under study is located in a tropical zone, which is sufficiently warm; therefore, there is no need to apply heating setpoints.
2.4.3. Building Occupancy
To obtain the occupancy profile, we conducted a survey among the building’s residents, which allowed us to create an overview of the occupancy for each part of the building. The Pléiades Modeleur software enabled us to model these behaviors through occupancy scenarios specific to each of the thermal zones concerned. The values in the various tables represent the number of people present in the room during the considered time slot.
- (a)
- Description of the Occupancy Scenarios
Since the building is a four-story structure, its occupancy scenarios depend not only on the type of dwelling (bedroom, studio, or apartment) but also on the behavior within each considered thermal zone.
2.5. Life Cycle Analysis
Pléiades software enabled the execution of a Life Cycle Assessment (LCA) by evaluating twelve environmental impacts. To achieve this, the software uses the building geometry from the dynamic thermal simulation (DTS) performed in Pléiades Modeleur and transfers it to the EQUER component for the LCA.
2.5.1. Calculation Parameters
In the absence of detailed information regarding the materials used in the building envelope, the default parameters provided by Pléiades software have been adopted. These include an estimated 5% surplus of materials during construction and predefined lifespans for various components: exterior and interior doors, as well as glazing, are assumed to last 30 years, while interior and exterior surface coatings are expected to have a lifespan of 10 years. The service life of the building equipment is set at 20 years. The habitable surface area (SHAB) is generally considered to be 20% less than the net floor area (SHON) [23]. Additionally, the average transportation distance between the production site and the construction site is set at 100 km. For thermal comfort analysis, the discomfort range is defined between 24 °C (lower limit) and 28 °C (upper limit) [23].
2.5.2. Project Association
For Life Cycle Assessment (LCA) calculations, Pléiades software uses the EQUER calculation engine, developed by the Center for Energy Efficiency of Systems at Mines ParisTech. This engine allows for the evaluation of embodied energy and, of course, its contribution to global warming. It can utilize the calculation results from the COMFIE dynamic thermal simulation (DTS) module, the RT2012 regulatory module, or perform an independent analysis from scratch. The calculations rely on the Ecoinvent environmental database version 3.1.
2.5.3. Energy
According to KB SAP CONSULTING [23], the energy mix is distributed as follows: 62% from hydropower, 24% from thermal power plants, and 14% from natural gas.
2.5.4. Water
The national water policy published in 2019 [24] showed that the daily water consumption in Cameroon per capita is 50 L/day.
2.5.5. Waste
In Pléiades software, we entered the following waste-related data: average daily waste generation per inhabitant: 850 g [25], recycling rates: 73% for glass and 43% for paper, incinerated waste: around 30%, with an energy recovery efficiency of 5%, and distance to landfill: as determined by Google Maps, the distance from the building to the NKOLFOULOU landfill is 23 km.
2.5.6. Transportation
The NENGOUE residence is situated in the Simbock suburb, approximately 10.4 km from Yaoundé’s administrative center, located at the National Museum (according to Google Maps data). In Pléiades software, the transportation-related parameters were defined as follows: approximately 80% of the building’s occupants engage in daily commuting, primarily for work or educational purposes (students and pupils). The average weekly distance for home-to-commerce trips was set at 3.1 km—corresponding to the distance between the Bocom Service Station and the Simbock Entrance—where the majority of commercial activities and public transportation access points are located. Additionally, the average daily home-to-work travel distance was estimated at 5 km, reflecting the typical commuting patterns of the residents.
2.6. Simulation
The Life Cycle Assessment (LCA) was conducted over a period of 80 years, evaluating twelve environmental impacts for a building with 40 occupants. The Pléiades Results module also allows for the generation of various types of graphs and curves, enabling easy comparison of the results.
2.7. The MMG (Global Method Monetize)
Table 4 summarizes the environmental costs that will be used throughout this study.
Table 4.
Summary of the environmental cost per unit of the CEN indicators [26].
Pléiades is a proprietary software developed by the French company IZUBA Énergies (Paris, France) which core expertise lies in energy and environmental optimization in the building sector [27].
3. Results
3.1. Analysis and Result of the Initial Scenario
Table 5 presents the results of the environmental impact assessment derived from the Life Cycle Assessment (LCA) of the initial scenario.
Table 5.
Calculation of environmental impacts for the initial scenario.
By calculating the average of the twelve environmental impacts from Table 6, we observe that the usage phase is the stage of the LCA that contributes to almost all environmental impacts, accounting for 96.53%, compared to only 2.32% for construction, 0.34% for renovation, and 0.79% for deconstruction.
Table 6.
Detailed results of the LCA of the initial scenario.
Results of the MMG. Based on this method, the results of the initial scenario for each of the seven environmental impacts are detailed in Table 7.
Table 7.
Results of the MMG for the initial scenario for the seven environmental indicators of the LCA.
By examining the environmental cost related to greenhouse gas (GHG) emissions at each phase, we observe that the usage phase accounts for 94.40%, while the construction, renovation, and deconstruction phases represent 5.24%, 0.26%, and 0.099%, respectively. Furthermore, the overall impact cost of GHG emissions and eutrophication amounts to 25.10% and 62.82%, respectively.
3.2. Validation of the Results
These results are consistent with the literature, which estimates that the usage phase accounts for 60–90% of environmental burdens [28]. This aligns with our study, where we observe a value of 94.40%. Furthermore, the impact indicators for greenhouse gas (GHG) emissions and eutrophication together represent 87.92% of the building’s environmental cost. This confirms the findings of Nematchoua and Reiter [29] in their study on the evaluation of environmental costs comparing traditional neighborhoods with eco-districts, where they obtained values of 55.4% for eutrophication and 31.2% for GHG emissions, resulting in a combined cost of 86.6%.
3.3. Impact of the Building Lifespan and Resident Transportation
3.3.1. Impact of the Building Lifespan
Depending on whether the Life Cycle Assessment (LCA) is conducted over a long period (80–100 years), a medium-term period (25–50 years), or a shorter period (5–10 years or even just 1 year), the results vary significantly. Certain life cycle phases contribute more, depending on the lifespan, and some impact indicators become more pronounced as the lifespan increases or decreases.
It is important to note that the only phase that remains unchanged, regardless of the considered lifespan, is the construction phase. However, as the lifespan extends, human activity related to the building increases. Naturally, the usage phase generates the vast majority of the building’s environmental impacts. All indicators are particularly significant during this phase; the impacts from the construction phase are compounded by those of other phases, with the usage phase accounting for at least 90% of total impacts. Our analysis showed that, even within a lifespan of just ten years, the usage phase already accounted for more than 70% of the total environmental impacts of the building.
3.3.2. Scenario of Resident Transportation
It is important to recall that the building is primarily occupied by families and some students. Additionally, nearby grocery stores facilitate easy access to daily supplies. We assume that students attend schools and universities within the vicinity.
To implement this scenario, it is assumed that nearly 90% of residents adopt environmentally friendly transportation methods, such as bicycles, and live in close proximity to their workplaces and essential supply stores. The planning criteria include a maximum distance of 500 m from homes to stores and to the public transportation network and a 3-km distance from homes to workplaces. Additionally, 90% of occupants are expected to commute daily, primarily using buses as their mode of public transportation. Table 8 presents the results of the calculation of the environmental impacts of the LCA of the transport variant.
Table 8.
Detailed results of the LCA of the transport variant over 80 years.
When we average the contributions of the twelve environmental impacts in Table 8, it is very clear that the use phase is the most contributory, with a rate of 96.26% on all impacts, while construction, renovation, and reconstruction constitute 2.69%, 0.39%, and 0.82%, respectively. Furthermore, the value of the greenhouse effect impact indicator decreased from 3132.31 t CO2 eq. to 2596.72 t CO2 eq., a decrease of 17.1% from its initial value. According to these results, the NENGOUE residence emits 32.46 t CO2 eq./year on the 880.89 m2 of its surface area or 36.85 kg CO2 eq./m2/year.
The shift in transportation modes leads to an overall reduction in environmental impacts, which, in turn, significantly lowers the building’s environmental footprint. In this variant, the following reductions are observed compared to the initial scenario: greenhouse gas emissions decrease by 17.10%, acidification drops by 12.74%, and cumulative energy demand is reduced by 9.31%. Water usage and inert waste decrease by 1.98% and 1.94%, respectively, while abiotic resource depletion remains unchanged. Eutrophication is reduced by 2.33%, photochemical ozone formation drops by 22.60%, and aquatic ecotoxicity falls by 21.19%. Additionally, radioactive waste decreases by 3.01%, human toxicity is reduced by 14.18%, and odors decline by 5.16%.
The results of the MMG for the transport scenario are detailed in Table 9.
Table 9.
Annual results of the MMG for the transport variant.
The environmental cost over 80 years has decreased by 7.58%.
3.4. Renovation and PV Scenarios
The choice of insulation materials is particularly critical in achieving the Q-ZEN standard of the 2021 PEB, which is one of the objectives set in this study. The following criteria will guide our selection process: (i) Thermal conductivity: This parameter determines the energy performance of an insulating material; the closer it approaches zero, the higher the quality of the insulation. However, thermal conductivity alone does not account for factors that may disqualify a material, such as its contribution to greenhouse gas emissions. (ii) Relevant applications: This refers to the specific areas of a building where the insulation material is most suitable for use. (iii) Contribution to greenhouse gas emissions: The lower the material’s environmental impact, the more suitable it will be for selection. (iv) Thermal phase shift: This represents the time required for heat to pass through the insulation. This criterion is particularly crucial in our case, as it ensures that the internal temperature of the building remains stable without rapid fluctuations. (v) Embodied energy: The higher the embodied energy, the lower the insulation’s environmental performance. This factor is closely linked to greenhouse gas emissions, as both tend to increase in parallel. By prioritizing insulation materials with a low contribution to greenhouse gas emissions, we have selected the materials listed in Table 10 for application in passive design strategies.
Table 10.
Characteristics of the insulators selected in this study.
In this table, we observe that the insulation materials combining the most criteria to ensure indoor comfort are natural or bio-based. Among them, cellulose wadding has the lowest average thermal phase shift.
3.4.1. Impact of Renewable Energy: Use of a Photovoltaic System
In the initial scenario, the building is solely powered by the national electricity provider. In this scenario, we install a photovoltaic system to supply the building with electricity. Photovoltaic panels are installed on two-thirds of the roof, covering a total photovoltaic field area of 159.84 m2. The selected inverter is the Sunny Boy SB 3000 TL, with a nominal power output of 3.2 kW and a maximum voltage of 550 V. The chosen photovoltaic modules are monocrystalline, specifically the E19-318E model, with a peak power of 318 W. They are arranged in 14 strings, each consisting of seven modules connected in series. The modules are oriented due south and tilted at an angle of 30°, as recommended by experts for optimal energy production in the city of Yaoundé.
The use of a photovoltaic panel system significantly reduces electricity costs and provides flexibility to enhance indoor comfort. With an annual energy consumption of 72,585 kWh, the photovoltaic system generates 50,294 kWh per year, covering approximately 69.29% of the building’s energy needs. Thus, the system supplies nearly 70% of the total annual consumption.
The annual energy production of the photovoltaic system is illustrated in Figure 3 below.
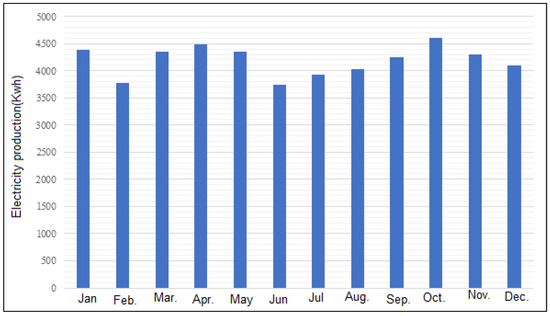
Figure 3.
Annual electricity production by the PV system.
The results below illustrate a generalized decrease in almost all impacts. Let us now proceed with the environmental classification of the NENGOUE residence. Its quantity of CO2 emissions per year amounts to 28,691 kg CO2 eq. Consequently, the building emits 32.57 kg CO2 eq/m2/year, which corresponds to class D. Despite the decrease in absolute value of the various impacts, in terms of percentages, the values remain close to the initial and transport scenarios.
In terms of environmental impacts, the reductions achieved in this scenario compared to the initial scenario are as follows: 26.72% reduction in greenhouse gas emissions, 26.61% reduction in acidification, 21.88% reduction in cumulative energy demand, 19.91% reduction in water consumption, 0.80% reduction in inert waste production, 38.48% reduction in abiotic resource depletion, 3.93% reduction in eutrophication, 20.17% reduction in photochemical ozone formation, 22.09% reduction in aquatic ecotoxicity, 22.29% reduction in radioactive waste generation, 20.39% reduction in human toxicity, and 36.19% reduction in odor emissions (see Figure 4).
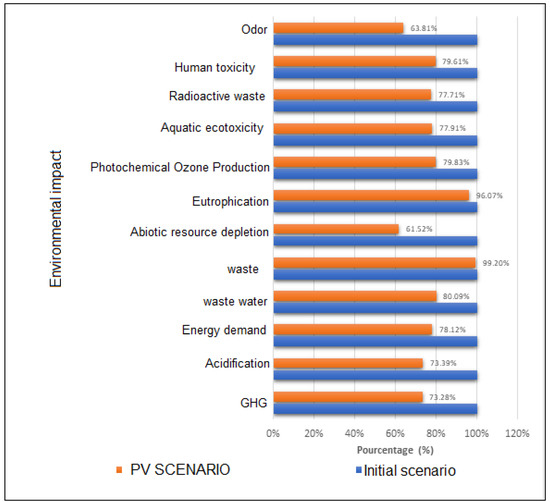
Figure 4.
Comparison between the initial scenario and the renewable energy impact scenario.
By applying the renewable energy impact scenario, the NENGOUE residence achieves an overall environmental cost savings of 11.87% compared to the initial scenario. The distribution of this gain across different phases is as follows: 15.88% savings during the construction phase, 11.92% savings during the operational phase, 66.05% increase during the renovation phase, and 0.69% savings during the demolition phase. Noting that the operational phase remains the most significant, the overall gain is very close to this phase. This comparison is limited to only seven impact categories, whereas the Pléiades software provided results for twelve. In terms of individual contributions, greenhouse gas emissions (20.87%) and eutrophication (68.49%) account for the highest impact reductions.
3.4.2. Renovation
For the external wall coating, we will use two types of coatings (interior and exterior): mortar and lime (500 < ρ < 750), according to Pléiades, with a thermal conductivity of λ = 0.3 W/(m·K) and a thickness of one centimeter. The interior coatings will have the same thickness but will be made of gypsum plaster with bulk perlite, with a conductivity of λ = 0.18 W/(m·K), leading to thermal resistances of Re_ext = 0.034 (m2·K)/W and Re_int = 0.05 (m2·K)/W. Thermal resistance calculations and heat transfer coefficients for these walls can be quickly determined. We will retain only the bricks and replace the remaining materials. For the external walls, the total thermal resistance (including wall and coatings) is R = 0.339 (m2·K)/W, and the thermal transmittance or thermal conductance is U = 2.95 W/(m2·K). These values indicate very poor insulation performance. For proper thermal insulation, R should be high (greater than 4.15), and U should be close to zero (U_max = 0.24 W/(m2·K) to meet the Q-ZEN standard). Similarly, for the internal walls, the total thermal resistance (including wall and coatings) is R = 0.249 (m2·K)/W, with a thermal transmittance U = 4.76 W/(m2·K). Considering the balance between insulation quality, cost, greenhouse gas emissions, and thermal phase shift, cork panels prove to be the best choice for both interior and exterior walls. We will not use wood fiber panels in the walls due to space constraints, despite their superior thermal phase shift properties. Instead, their use will be prioritized for floors (both upper and lower), attics, and roofing.
Regarding surface finishes, we will favor those with an infrared emissivity close to 1, a solar absorptivity close to 0, and optical properties with a reflectance percentage close to 100%. Based on the Life Cycle Assessment (LCA) results obtained, the building emits 2607.27 t CO2 eq over 80 years for this variant, corresponding to 32,590.875 kg CO2 per year or 39.97 kg CO2 eq/m2/year, placing it in energy class D.
- (i)
- Comparison between the initial scenario/scenario Impact of wall insulation and change in surface conditions
By applying this scenario, its effect is direct on several environmental impacts; in fact, the greenhouse effect (−16.76%), the inert waste produced (−17.27%), the photochemical ozone production (−27.05%), the aquatic ecotoxicity (−21.56%), and the human toxicity (−14.08%) decrease. The results are shown in Figure 5.
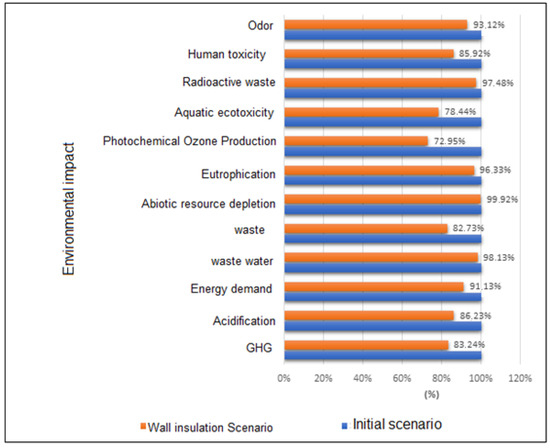
Figure 5.
Comparison of the initial scenario/Impact of wall insulation and change in the surface conditions.
By making a comparison via different costs, we see that, as always, the use phase is the one that produces the greatest contribution of impacts. The environmental cost depends greatly on that of the use phase. There is a decrease in the environmental cost of 8.54%, distributed as follows: construction (−11.94%), use (−8.52%), renovation (+19.77%), and deconstruction (+0.96%).
In this research, we chose to use wood fiber panels to insulate the roofs, because we want to limit air infiltration as much as possible. We considered for the attic the slabs, and we added our wood fiber panels, which thickness we determined. The calculations show that a thickness of 28.3 cm of the wood fiber panels would be needed to insulate the attic. Overall, the roof was made of an aluminum alloy with a thickness of 0.05 mm, thermal conductivity λ = 160 W/(m·K), i.e., a thermal resistance of 0.00 (m2·K)/W, and a thickness of wood fiber panels of 29.5 cm, which ensured good thermal insulation. Referring to the LCA results, we deduce that the building emits for this variant 3113.53 t CO2 eq over 80 years or 38,919.125 kg CO2 per year or 44.18 kg CO2 eq/m2/year, which corresponds to class D. Figure 6 shows the comparison between roof insulation and the initial scenarios.
- (ii)
- Comparison between the initial and roof insulation scenarios
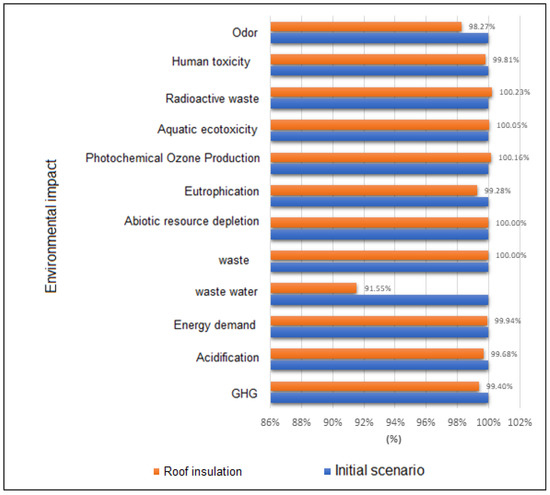
Figure 6.
Comparison between the scenarios/impacts of attic and roof insulation.
Regarding these results, we deduce that the impacts of roof insulation are low compared to the other strategies. The stage use remains the most important.
3.4.3. Mixed Scenario
The optimal building model sought and meeting the Q-ZEN standard is a building that meets the following requirements: (i) Exterior and interior wall insulation with a thermal transmittance coefficient not exceeding Umax = 0.24 W/(m2·K). (ii) Insulation of the ceiling floors, each with the same Umax = 0.24 W/(m2·K). (iii) Attic and roof insulation, each not exceeding Umax = 0.24 W/(m2·K). (iv) Lightweight doors and façades with a value not exceeding Umax = 2 W/(m2·K). (v) Windows with a frame not exceeding Umax = 1.5 W/(m2·K) and with glazing not exceeding Umax = 1.1 W/(m2·K). (vi) Use of renewable energy. The construction of this building is the result of a combination of all the previously developed scenarios. The results are given in Figure 7 below.
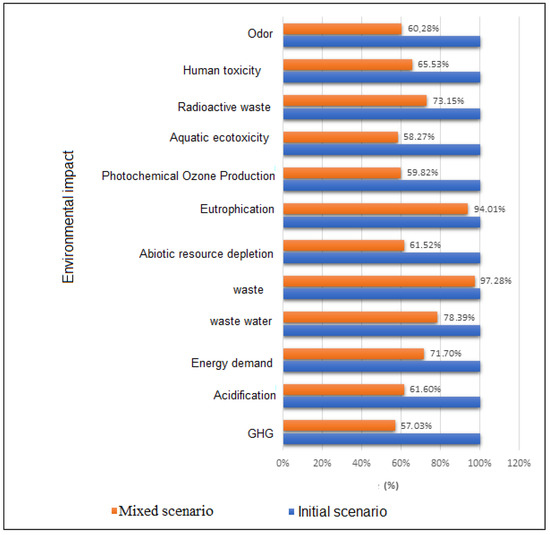
Figure 7.
Comparison between the initial and optimal scenarios.
Figure 7 shows a significant decrease in the various environmental impacts of the building under the combined scenario compared to the initial scenario. The following reductions can be noted: 42.97% for the greenhouse effect, 38.4% for acidification, 28.30% for the cumulative energy demand, 21.61% for water used, 2.72% for inert waste produced, 38.48% for abiotic resource depletion, 5.99% for eutrophication, 40.18% for photochemical ozone production, 41.73% for aquatic ecotoxicity, 26.85% for radioactive waste, and 34.47% for human toxicity.
4. Discussion
The results obtained are consistent with those reported in previous research, as observed in the literature. Although the operational phase remains the most environmentally costly, its impact was reduced by nearly 20% compared to the initial scenario. As expected, the impacts associated with the construction and renovation phases increased by 8.44% and 104.35%, respectively, while the deconstruction phase showed a slight decrease of 0.35%. The overall environmental cost was also reduced by approximately 20%, which is close to the 30% reduction commonly reported in the literature [30]. Furthermore, Martin Bodmer observed a reduction in operational energy consumption ranging from 30% to 80% following renovation efforts [31]. In this study, operational energy consumption decreased from 90,925 kWh before renovation to 62,102.14 kWh after renovation, representing a reduction of 31.70%. These results are satisfactory and align well with previous studies. The implementation of this optimized building design resulted in an 18.82% reduction in the initial environmental cost, amounting to a total savings of USD 102,764.70 over 80 years or approximately USD 1285 annually. With this optimized design, the annual environmental cost decreased from USD 6825.50 to USD 5541. Overall, the optimized building scenario offers both financial savings and substantial environmental benefits.
4.1. Dominance of the Use Phase in the Life Cycle
The analysis reveals that the use phase dominates the building’s environmental impacts, accounting for approximately 96.53% of the total life cycle impacts. This strong contribution is physically linked to the sustained energy consumption for heating, cooling, lighting, and appliances throughout the 80-year operational period. In addition, regular occupant transport to and from the building further amplifies energy and emissions footprints over time. These findings are consistent with earlier Life Cycle Assessments of residential and tertiary buildings, which typically report that the use phase represents between 80% and 90% of the total environmental burdens. For instance, a study evaluating passive houses highlighted that, despite improvements in the construction phase, the operational energy demand remained the predominant factor due to long-term energy use. Similarly, other researchers concluded that, unless renewable energy or passive systems are employed, the use phase will continue to drive the majority of environmental impacts. This alignment with the literature reinforces the need to prioritize operational efficiency in sustainable construction strategies and to consider passive design, high-performance envelopes, and optimized building systems.
4.2. Impact of the Sustainable Transportation Scenario
When a sustainable transportation scenario is introduced, the share of the use phase slightly decreases to 96.26%, yet noticeable reductions are observed across several indicators. Climate change-related emissions drop by 17.10%, while the acidification potential decreases by 12.74%, and photochemical ozone formation falls by 22.60%. These reductions are physically attributed to a lower dependence on individual motor vehicles and the greater use of public transport, bicycles, and walking.
Comparatively, the literature on urban mobility and low-carbon neighborhoods suggests that transportation behavior significantly influences the overall environmental impact. Similar studies in European urban districts showed that shifting 30% of trips to public transit and cycling could cut CO2 emissions by 15–25%, which aligns with the present results. The physical explanation lies in the high energy intensity of private car use compared to shared and non-motorized modes, particularly when the electricity grid is not fully decarbonized. This scenario confirms that promoting compact urban planning and investing in active transport infrastructure can complement building-level interventions.
4.3. Contribution of Renewable Energy
In the scenario where 69.29% of annual electricity consumption is met through on-site solar photovoltaic systems, the results show substantial environmental improvements. Greenhouse gas emissions are reduced by 26.72%, the cumulative energy demand by 21.88%, and abiotic resource depletion by 38.48%. This is largely due to the substitution of conventional grid electricity—often derived from fossil fuels—with clean, renewable power. The literature consistently emphasizes the benefits of integrating photovoltaics into building design. For instance, studies of nearly zero energy buildings across Europe have shown that PV systems can reduce operational emissions by up to 40%, depending on location and system efficiency. Another analysis revealed that self-generated renewable energy significantly reduces upstream environmental loads, including those related to resource extraction and pollutant generation. Thus, the present findings are in strong agreement with published results, underscoring the importance of on-site renewables in reducing long-term environmental impacts and enhancing the energy autonomy of buildings.
4.4. Synergy in the Combined Scenario
When both renewable energy and sustainable transportation measures are combined, their effects amplify. This scenario achieves the most favorable environmental profile, with a 42.97% reduction in greenhouse gas emissions, a 38.40% decline in acidification potential, and a 28.30% decrease in cumulative energy demand. Freshwater ecotoxicity and human toxicity indicators are also improved, with reductions of 41.73% and 34.47%, respectively. This synergistic improvement exceeds the individual contributions of the isolated measures, confirming the advantage of integrated strategies. Previous work in the field of sustainable urbanism shows similar synergies. Studies combining building-integrated renewables with behavioral changes and sustainable transport indicate total environmental improvements between 35% and 50%. This convergence validates the present methodology and suggests that system-level thinking—rather than single-solution approaches—is crucial in sustainability planning. The resulting emissions intensity of 32.57 kg CO2-eq/m2/year corresponds to a class D energy performance level. While this rating still leaves room for improvement, it represents a meaningful advance compared to the baseline and highlights the effectiveness of combined interventions in dense urban environments.
4.5. Comparative Summary with the Literature
The implementation of rooftop photovoltaic systems in Cameroon presents both promising economic opportunities and certain constraints. The average cost of installing a residential photovoltaic system in the country is currently estimated at USD 1000–1500 per kWp based on local market data and regional suppliers. For an average household requiring approximately 3 kWp, the initial investment would therefore range from USD 3000 to 4500. However, with an average solar irradiation of 5–6 kWh/m2/day, such installations can generate a substantial amount of electricity, with a payback period estimated between 6 and 9 years, depending on electricity tariffs and the availability of subsidies. Few comparison of results were showed into the Table 11.
Table 11.
Comparison of results with the literature.
Although there is a lack of strong national incentive policies, some local initiatives and international cooperation programs—such as those supported by GIZ, the European Union, or the African Development Bank—offer partial financing or low-interest loans to support energy transition. Furthermore, the continued global decline in the cost of solar equipment could significantly enhance the economic viability of these solutions in the near future.
Regarding sustainable transportation, the development of electric public transport networks or soft mobility systems (e.g., bike-sharing programs and pedestrian pathways) is currently hindered by inadequate urban infrastructure and budgetary constraints. Nevertheless, intermediate solutions such as the conversion of conventional motorcycle taxis to electric versions or the gradual introduction of hybrid buses in major cities like Douala or Yaoundé may represent a cost-effective alternative in the medium term. Although electric vehicles generally involve 30–50% higher upfront costs compared to internal combustion models, these are offset by lower operational and maintenance costs, as well as economies of scale, as fleets expand.
Ultimately, the success of such strategies will require the establishment of incentive-based regulatory frameworks, adapted fiscal policies, and increased public awareness of the long-term economic and environmental benefits of clean technologies. The adoption of sustainable practices such as rooftop photovoltaics and sustainable mobility in urban African settings, including Cameroon, cannot be fully understood without accounting for the complex social, behavioral, and cultural dynamics at play. Social perceptions and trust in technology often influence the uptake of renewable energy solutions. In many urban communities, solar technologies are still perceived as unreliable or suitable only for rural or low-income households. This perception can be reinforced by poorly maintained demonstration projects or a lack of technical support after installation. Similarly, the lack of awareness and environmental education means that many citizens are unaware of the long-term financial and ecological benefits of energy efficiency and renewable energy. On a behavioral level, daily habits and mobility routines are deeply entrenched. The preference for informal and flexible transportation options, such as motorcycle taxis (“benskin”), often outweighs the interest in structured public transport systems, especially when the latter are perceived as inefficient or unsafe. Even when alternatives exist, resistance to change—driven by convenience, status symbols associated with certain types of vehicles, or lack of perceived immediate benefit—can slow down adoption. From a cultural perspective, collective decision-making within households or communities can also delay technological uptake.
4.6. Limitations and Perspectives
While this study provides valuable insights into the environmental performance of the NENGOUE residence through Life Cycle Assessment, several limitations must be acknowledged:
- Data Representativeness: Some input data, especially for material quantities and operational energy use, were based on design assumptions and national averages due to the unavailability of measured data. This may affect the accuracy of the Life Cycle Inventory, particularly for transport behavior and occupancy profiles.
- Behavioral Variability: The adoption of sustainable transport modes relies heavily on user behavior, cultural acceptance, safety perceptions, and infrastructure availability. These factors introduce significant variability and uncertainty into the predicted environmental benefits of the transport scenario.
- Photovoltaic System Performance: The modeled efficiency of the PV system assumes optimal solar radiation and minimal maintenance degradation. In practice, performance can be affected by dust accumulation, shading, poor maintenance, and inverter losses, potentially reducing the anticipated energy generation and impact reductions.
- Generalizability: The study focuses on a single urban residential case in Douala, Cameroon. While it offers relevant insights, the findings may not be directly transferable to other building types or climatic contexts without adaptation.
- Tool and Database Limitations: The environmental impact results depend on the Ecoinvent database and the ReCiPe method. While robust, these tools reflect European datasets, which may not perfectly capture local construction practices or energy mix characteristics in Cameroon.
- Future work should address these limitations by incorporating field measurements, more detailed user surveys, and locally calibrated environmental datasets.
5. Conclusions
This study provided a comprehensive Life Cycle Assessment (LCA) of the NENGOUE residence, evaluating different mitigation scenarios to reduce its environmental impacts throughout all life stages—construction, operation, renovation, and deconstruction. The results clearly indicate that the use phase is, by far, the most environmentally impactful, contributing over 96% of the total emissions and impacts across all scenarios. This finding underscores the critical role of daily energy use and mobility behaviors in shaping a building’s life cycle footprint. The first scenario, focused on low-impact transportation planning, led to a 17.10% reduction in greenhouse gas emissions and improvements in acidification (−12.74%) and photochemical ozone formation (−22.60%). These results demonstrate the importance of urban planning that promotes mixed use neighborhoods, pedestrian-friendly infrastructure, and public transport connectivity. Policymakers should therefore encourage zoning regulations that reduce commuting distances while investing in bike lanes, green corridors, and affordable, efficient public transport systems to support behavioral shifts toward low-carbon mobility. The second scenario, which integrated rooftop photovoltaics, covered approximately 70% of the residence’s annual electricity demand and led to a 26.72% reduction in greenhouse gas emissions and a 21.88% decrease in the cumulative energy demand. These findings support the implementation of incentive-based policies, such as feed-in tariffs, tax credits, or subsidized installation programs for residential solar PV systems. Urban planning regulations should also encourage or mandate the inclusion of renewable energy systems in new developments, particularly in sunny regions such as Cameroon.
The combined scenario (transport + photovoltaics) yielded the most substantial environmental gains, with a 42.97% decrease in greenhouse gas emissions and notable improvements across nearly all impact categories. This highlights the synergistic benefits of combining behavioral change with technological innovation.
Based on these findings, the study offers the following urban planning and policy recommendations to guide real-world implementation:
- Integrate LCA-based indicators into local and national urban planning guidelines to support low-carbon infrastructure choices.
- Promote compact urban design to shorten travel distances and enhance accessibility to essential services.
- Adopt building codes and incentives that mandate or encourage renewable energy integration and energy-efficient technologies in residential construction.
- Launch public awareness campaigns and education programs to influence energy and mobility behaviors at the household level.
- Develop financing mechanisms (e.g., green mortgages and microcredit for solar PV) to enhance affordability and access to sustainable solutions for low- and middle-income households. Achieving high environmental performance in residential buildings in Sub-Saharan African cities requires a multidimensional strategy, one that combines urban design, policy innovation, and behavioral change. Future work should expand this type of multi-scenario LCA approach to different urban contexts and building typologies to support data-driven policymaking for equitable and climate-resilient urban development.
Author Contributions
Conceptualization, M.K.N. and M.M.A.M.; methodology, M.K.N.; software, M.M.A.M.; validation, M.K.N.; formal analysis, M.K.N.; investigation, M.M.A.M.; resources, M.M.A.M.; data curation, M.K.N.; writing—original draft preparation, M.K.N.; writing—review and editing, M.K.N. and M.M.A.M.; visualization, M.K.N.; supervision, M.K.N.; project administration, M.M.A.M. All authors have read and agreed to the published version of the manuscript.
Funding
This research received no external funding.
Data Availability Statement
The data presented in this study are available on request from the corresponding author.
Conflicts of Interest
The authors declare no conflicts of interest.
References
- GlobalABC. Rapport Sur La Situation Mondiale Des Bâtiments Et De La Construction En 2020: Vers Un Secteur Des Bâtiments Et De La Construction à émission Zéro, Efficace Et Résilient. 2020. Available online: https://globalabc.org/sites/default/files/2021-01/Buildings-GSR-2020_ES_FRENCH.pdf (accessed on 10 June 2024).
- ONU Programme Pour L’environnement. Programme Des Nations Unies Pour. Stratégie Du Programme Des Nations Unies Pour L’environnement Pour 2022–2025 Visant à Remédier Aux Problèmes Des Changements Climatiques, De La Dégradation De La Nature Et De La Pollution. 2022. Available online: https://www.unep.org/fr/resources/pour-lhumanite-et-pour-la-planete-strategie-du-pnue-pour-2022-2025 (accessed on 14 August 2024).
- Compte CO2. Les COP: Une Brève Histoire De La COP1 à La COP27. 2024. Available online: https://www.compteco2.com/article/historique-cop-conference-des-parties (accessed on 23 April 2024).
- Nations Unies. Promouvoir Le Développement Durable. 2024. Available online: https://www.un.org/fr/our-work/support-sustainable-development-and-climate-action (accessed on 23 April 2024).
- Union Européenne. Directive 2009/125/CE Du Parlement Européen Et Du Conseil Du 21 Octobre 2009 Établissant Un Cadre Pour La Fixation D’exigences En Matière D’écoconception Applicables Aux Produits Liés à L’énergie. 2009. Available online: https://eurlex.europa.eu/LexUriServ/LexUriServ.do?uri=OJ:L:2009:285:0010:0035:fr:PDF (accessed on 5 August 2024).
- République Française. Loi N° 2015-992 Du 17 Août 2015 Relative à La Transition Énergétique Pour La Croissance Verte. 17 Août 2015. Available online: https://www.legifrance.gouv.fr/loda/id/JORFTEXT000031044385 (accessed on 5 August 2024).
- Union Economique et Monétaire Ouest Africaine. La Directive N° 04/2020/CM/UEMOA Portant étiquetage énergétique Des Lampes électriques Et Des Appareils électroménagers. 26 Juin 2020. Available online: https://www.pseau.org/outils/biblio/resume.php?d=11833 (accessed on 5 August 2024).
- Peuportier, B.; Popovici, E.; Troccmé, M. Analyse du cycle de vie à l’échelle du quartier, bilan et perspectives du projet ADEQUA. Build. Environ. 2013, 3, 17. [Google Scholar]
- Hunt, R.; Franklin, W.; Hunt, R. LCA—How it came about. Int. J. Life Cycle Assess. 1996, 1, 4–7. [Google Scholar] [CrossRef]
- Bribian, I.Z.; Uson, A.A.; Scarpellini, S. Life cycle assessment in buildings: State-of-the-art and simplified LCA methodology as a complement for building certification. Build. Environ. 2009, 44, 2510–2520. [Google Scholar] [CrossRef]
- Jolliet, O.; Saadé, M.; Crettaz, P. Analyse Du Cycle De Vie: Comprendre Et Réaliser Un écobilan; Presses Polytechniques Et Universitaires Romandes: Lausanne, Switzerland, 2005; p. 242. [Google Scholar]
- ISO 14040:2006; Environmental Management—Life Cycle Assessment—Principles and Framework. ISO: Geneva, Switzerland, 2006.
- ISO 14044:2006; Environmental management—Life Cycle Assessment—Requirements and Guidelines. ISO: Geneva, Switzerland, 2006.
- Reiter, S. Life cycle assessment of buildings—A review. In Proceedings of the Arcelor-Mittal International Network in Steel Construction, Sustainable Workshop and Third Plenary Meeting, Bruxelles, Belgium, 7 July 2010; p. 1. [Google Scholar]
- Buyle, M.; Braet, J.; Audenaert, A. Review on LCA in the Construction Industry: Case Studies. Math. Model. Simul. Appl. Sci. 2013, 98–104. Available online: http://www.wseas.us/e-library/conferences/2012/Rovaniemi/INEE/INEE-16.pdf (accessed on 18 June 2025).
- Rossi, B.; Marique, A.F.; Glaumann, M.; Reiter, S. Life-cycle assessment of residential buildings in three different European locations, basic tool. Build. Environ. 2012, 51, 395–401. [Google Scholar] [CrossRef]
- Citherlet, S.; Defaux, T. Energy and environmental comparison of three variants of a family house during its whole life span. Build. Environ. 2007, 42, 591–598. [Google Scholar] [CrossRef]
- Thormark, C. A low energy building in a life cycle—Its embodied energy, energy need for operation and recycling potential. Build. Environ. 2002, 37, 429–435. [Google Scholar] [CrossRef]
- Thormark, C. The effect of material choice on the total energy need and recycling potential of a building. Build. Environ. 2006, 41, 1019–1026. [Google Scholar] [CrossRef]
- Blengini, G.A.; Di Carlo, T. The changing role of life cycle phases, subsystems and materials in the LCA of low energy buildings. Energy Build. 2010, 42, 869–880. [Google Scholar] [CrossRef]
- Erlandsson, M.; Levin, P. Environmental assessment of rebuilding and possible performance improvements effect on a national scale. Build. Environ. 2005, 40, 1459–1471. [Google Scholar] [CrossRef]
- Nematchoua, M.K.; Sadeghi, M.; Reiter, S. Strategies and scenarios to reduce energy consumption and CO2 emission in the urban, rural and sustainableneighbourhoods. Sustain. Cities Soc. 2021, 72, 103053. [Google Scholar] [CrossRef]
- Groupe Kedibuild. Situation énergétique Au Cameroun. 2021. Available online: https://drive.google.com/file/d/14ppOS44StkpGKno03s5OotWBHplBMNWY/view (accessed on 10 October 2024).
- Ministry of Water and Energy. LA-Paulitique-Nationale-de-LEau-au-Cameroun. 2019. Available online: https://minee.cm/wp-content/uploads/2024/02/LA-Paulitique-Nationale-de-lEau-au-cameroun-30-nov-2019-SGPR.pdf (accessed on 10 August 2024).
- Ministry of the Environment, Nature Protection and Sustainable Development. National Waste Management Strategy. 2021. Available online: https://minepded.gov.cm/2021/09/29/strategie-national-de-gestion-des-dechets/ (accessed on 10 August 2024).
- Nematchoua, M.K.; Reiter, S. Evaluation of bioclimatic potential, energy consumption, CO2-emission, and life cycle cost of a residential building located in Sub-Saharan Africa; a case study of eight. Solar Energy 2021, 218, 512–524. [Google Scholar] [CrossRef]
- Kemajou, A.; Tseuyep, A.; Egbewatt, N.E. Le confort thermique en climat tropical humide vers un réaménagement des normes ergonomiques. J. Renew. Energ. 2012, 15, 427–438. [Google Scholar] [CrossRef]
- Smith, V.T. Eutrophication; Impacts of Excess Nutrient Inputs on Freshwater, Marine and Terrestrial Ecosystem. J. Environ. Pollut. 1999, 100, 179–196. [Google Scholar] [CrossRef] [PubMed]
- Nematchoua, M.K.; Reiter, S. Analysis, reduction and comparison of the life cycle environmental costs of an eco-neighborhood in Belgium. Sustain. Cities Soc. 2019, 48. [Google Scholar] [CrossRef]
- Effy Connect. Comment Bien Choisir Son Isolant Thermique? 2022. Available online: https://www.effy.fr/travaux-energetique/isolation/isolant (accessed on 9 October 2024).
- Buyle, M.; Braet, J.; Audenaert, A. Life cycle assessment in the construction sector: A review. Renew. Sustain. Energy Rev. 2013, 26, 379–388. [Google Scholar] [CrossRef]
- Ramesh, T.; Prakash, R.; Shukla, K.K. Life cycle energy analysis of buildings: An overview. Energy Build. 2010, 42, 1592–1600. [Google Scholar] [CrossRef]
- Fthenakis, V.M.; Kim, H.C.; Alsema, E. Emissions from photovoltaic life cycles. Environ. Sci. Technol. 2008, 42, 2168–2174. [Google Scholar] [CrossRef] [PubMed]
- Creutzig, F.; Jochem, P.; Edelenbosch, O.Y.; Mattauch, L.; van Vuuren, D.P.; McCollum, D.; Minx, J. Transport: A roadblock to climate change mitigation? Science 2015, 350, 911–912. [Google Scholar] [CrossRef] [PubMed]
Disclaimer/Publisher’s Note: The statements, opinions and data contained in all publications are solely those of the individual author(s) and contributor(s) and not of MDPI and/or the editor(s). MDPI and/or the editor(s) disclaim responsibility for any injury to people or property resulting from any ideas, methods, instructions or products referred to in the content. |
© 2025 by the authors. Licensee MDPI, Basel, Switzerland. This article is an open access article distributed under the terms and conditions of the Creative Commons Attribution (CC BY) license (https://creativecommons.org/licenses/by/4.0/).