1. Introduction
Osijek-Baranja County school buildings, despite their significant economic, cultural, and historical importance, are showing signs of degradation. This is mostly due to a lack of accurate and comprehensive information about their condition, which is essential for effective building facilities maintenance management [
1,
2]. Also, the literature states that 90% of the European building stock was built before 1990 [
3,
4]. Furthermore, studies emphasize that a significant portion of the participants involved in the construction sector, including designers, contractors, suppliers, and owners, are expending a substantial sum of money in their search for, verification of, and recreation of facilities information that should already be easily accessible [
5]. Additionally, a significant portion, namely 75–80%, of the expenses associated with a building are incurred throughout the operational and maintenance stage of its life cycle [
6,
7]. Moreover, it is commonly recognized that the operational and maintenance phase of the building life cycle has the most significant environmental impact [
8].
Building degradation is quantitatively assessed by building condition assessments (BCAs), which collect information to determine the timing and kind of predictive, preventative, or corrective measures required to uphold the desired level of performance [
8]. Considering that costs tend to increase consistently due to either inefficient maintenance methods or a lack of routine maintenance, this is a significant issue, particularly for buildings with a projected lifespan of 50 years or more [
8,
9,
10,
11]. BCA is the initial step in the asset management and maintenance process. It involves evaluating the physical components and conditions of buildings to determine appropriate maintenance and improvement methods [
12,
13]. There are various definitions of a building condition assessment, but it can be said that in general, a BCA is an assessment that identifies significant deficiencies for all of the systems in a facility [
14]. Multiple methodologies exist for conducting a BCA since it can also be conducted at the component level, wherein each significant piece of equipment is assessed, and the value and remaining service life of the equipment are evaluated [
14]. Overall, it has been noticed that a significant obstacle to the advancement of an effective BCA procedure is the inherent subjectivity and resulting lack of precision [
14].
Facility managers make decisions on maintenance and renovation strategies based on limited information about the current condition of the building facilities’ components [
2,
15]. The limited data available are inadequate for monitoring and predicting indicators of wear, tear, and aging in building facilities components [
16]. This limits efforts to improve benchmarking outcomes and identify significant changes in circumstances that may impact the efficiency of these components. This problem emphasizes the need for a condition assessment framework that can provide a proactive representation of the repair and maintenance needs [
17]. Given the critical role that building conditions play, this assessment process is particularly significant for educational institutions since the condition of school buildings is a crucial factor in influencing the overall school environment, impacting not only the safety and health of students and staff but also the quality of education and student performance [
18]. Therefore, the condition of these buildings must be appropriately and thoroughly evaluated to ensure they provide a conducive, secure, and supportive learning atmosphere [
19]. It is even reported that the school building condition is connected to school absenteeism due to the poor conditions [
20].
This study focuses on evaluating the condition of school buildings, a critical process in the life cycle of comprehensive asset and facility management. The primary goal of this paper is to identify school buildings that are a high priority for renovation due to their poor conditions. Instead of only grading multiple components, this study seeks to also assign a single overall grade to each building using advanced machine learning models, which allows for a clearer assessment of their overall condition. This evaluation is crucial to ensure that the buildings can effectively support the school’s core operations and provide a quality learning environment for all users.
The remainder of this paper is organized as follows:
Section 2 presents a literature review of conducted research on BCAs regarding various educational buildings;
Section 3 presents the methodology used for developing the BCA framework;
Section 4 provides the analysis of the school sample;
Section 5 presents the Excel-based element-level grading system;
Section 6 presents the developed ANN and RF models;
Section 7 provides the results;
Section 8 presents the validation of the developed framework on an external set of schools; in
Section 9, a discussion is presented; and in
Section 10, conclusions are made.
2. Overview of BCA Research in Educational Buildings
Evaluating the condition of educational buildings is essential for efficient resource allocation, ensuring safety, and prioritizing maintenance. The literature has explored a variety of methodologies ranging from matrix-based approaches to machine learning models, each contributing to advancements in building condition assessment (BCA). Matrix-based frameworks have been widely employed in building evaluations. For example, the CSP1 Matrix proved useful in analyzing the conditions of smart schools in Malaysia. It demonstrated reliability in identifying deficiencies but had limitations in generating detailed inspection reports [
21,
22]. Kejeh et al. extended this idea with a 3 × 3 matrix in Nigeria. For the facility’s present condition, ten key elements were used in the evaluation process. These elements included whether the building appeared to be in good condition, whether the water system was functional, whether the waste system was operational, and other similar criteria. Each element was rated on a scale from 1 to 3, based on its current state. The average of these ten scores represented the overall present condition score of the facility. To assess the maintenance state of the building, a 3 × 3 matrix—a simple table consisting of three rows and three columns—was used. This matrix cross-tabulates the facility’s present condition score with its maintenance practice score to categorize the overall maintenance state. Once both scores are determined, the corresponding position in the matrix indicates the maintenance status of the building [
23]. In Croatian schools, a similar structured approach was adopted. Tijanić Štrok et al. developed a division model based on visual inspections and systematic questionnaires, revealing that mechanical systems, particularly cooling systems, were in critical condition. This study emphasized the financial constraints affecting building maintenance in Croatian schools [
24]. Decision-making models such as the Analytic Hierarchy Process (AHP) and Analytical Network Process (ANP) have added quantitative rigor to BCA evaluations. Marzouk and Awad applied an AHP-fuzzy model to Egyptian schools, producing comprehensive indexes for various building components such as flooring, windows, and doors [
25]. Similarly, Eweda et al. used AHP and ANP in Canada to develop condition indexes for school spaces, integrating physical and environmental factors into assessments. Their assessment framework incorporated both physical and environmental factors. The environmental factors considered included indoor air quality, thermal comfort, lighting adequacy, noise levels, and overall classroom ambiance—elements that influence the learning environment and occupant well-being. Based on the evaluation, buildings were assigned performance grades ranging from A (excellent) to F (failure) [
26,
27,
28]. Automation in BCA has gained interest. Ahluwalia proposed a framework for Toronto schools that incorporated digital drawings, field data automation, and capital replacement indicators. This approach reduced inspection time and costs while enhancing data accuracy [
13]. Similarly, Elhakeem and Hegazy developed a visual guidance system that supported staff with limited expertise, improving efficiency and reducing subjectivity [
29]. Machine learning models have significantly advanced BCA by enabling predictive analytics and automating evaluations. Mohamed and Marzouk combined ANN with Structural Equation Modelling (SEM) to assess building components in Cairo. Their methodology identified critical maintenance factors and prioritized repairs based on their importance [
2]. Hassan et al. demonstrated ANNs’ robustness in predicting the deterioration of educational building elements, achieving high accuracy in case studies [
30]. Sadick and Issa employed statistical and environmental models to assess schools, finding that relative humidity was a critical factor influencing building envelope condition [
31]. The reviewed literature illustrates the evolution of BCA methodologies, from manual matrix-based frameworks to automated, machine learning-driven approaches. Each method offers unique advantages and limitations. Matrix-based frameworks are simple to use and provide an accessible way to assess building conditions, but they may oversimplify the evaluation process and lack precision. Decision-making tools like AHP and ANP introduce more quantitative depth, allowing for systematic assessments, but they rely on subjective judgment and can be computationally demanding. Machine learning approaches, such as artificial neural networks (ANNs) and random forests (RFs), enhance predictive precision by analyzing large datasets and identifying complex patterns, yet they require extensive data and computational resources and can be harder to interpret compared to traditional methods. Transitioning to machine learning techniques offers the potential to overcome some of the limitations of the earlier approaches, providing more accurate and dynamic assessments of building conditions. As is well known in the field of BCA, the assessment can be conducted in a variety of ways. It can be conducted at the component level, where each element is assessed to determine its worth and remaining lifespan, while it can also be conducted at the building level, where the emphasis is on evaluating the state of the whole building and assigning a value to it, as opposed to evaluating each of its constituent parts [
32]. To the best of the authors’ knowledge, ANNs have been used in only three papers regarding BCA [
2,
30,
33], while RFs have not been applied to BCA yet. This is likely due to a combination of factors, including the technical limitations of earlier data collection methods, the complexity of implementing RFs in this context, and the lack of exploration into their potential applicability. Despite their extensive use in the field of energy efficiency in buildings [
34,
35,
36,
37,
38,
39], RFs’ ability to handle complex, non-linear relationships in building data might not have been fully recognized or leveraged in BCA studies until now.
While the primary focus of this study is on the structural and material condition of building elements, it is important to note that building condition assessment is often interlinked with indoor environmental quality. Among these, thermal comfort plays a significant role in occupant satisfaction and overall building performance. Thermal comfort has emerged as a critical aspect of indoor environmental quality (IEQ), particularly in educational buildings where occupant satisfaction and performance are closely linked to environmental conditions. Several studies emphasize that thermal comfort is influenced by a combination of structural, environmental, and human factors, all of which significantly impact building energy use and occupant behavior pattern [
40]. Within higher education settings, thermal comfort is consistently cited as one of the least satisfactory IEQ parameters, despite growing alignment with international green building standards [
41]. The recent literature highlights the integration of facility management, smart technologies, and sustainable practices as essential for maintaining optimal thermal environments in learning spaces [
42]. Strategies such as adaptive thermal control models and AI-driven management systems have demonstrated improvements in both energy efficiency and user comfort in school buildings [
43]. Moreover, thermal comfort inconsistencies due to seasonal ventilation challenges, such as those observed during and after COVID-19, suggest the need for more dynamic and user-centered approaches to indoor climate control [
44]. These findings support the inclusion of thermal comfort considerations in building condition assessments, as they directly affect the usability and sustainability of educational facilities [
45].
This study aims to advance BCA methodologies by addressing gaps in the literature, specifically regarding the application of machine learning techniques. While traditional BCA methods like matrix-based frameworks and decision-making tools offer reliability and accessibility, machine learning has demonstrated potential to enhance predictive accuracy and reduce subjectivity. Despite the promise of these techniques, ANNs have seen limited application in BCA, and RFs have not been utilized for this purpose to date. In this study, a systematic Excel-based model will be developed to grade each building component individually, providing a detailed and transparent method for component-level evaluation which will aggregate these grades to derive an overall building condition grade. These grades will serve as targets to train the ANN and RF prediction models of the total school grade, not grading each element separately. To evaluate the effectiveness of machine learning approaches, ANN and RF model accuracy will be compared in predicting the total building grade. Accuracy is chosen as the primary metric because it provides a straightforward measure of the overall correctness of the models in predicting the total building grade.
The methodology combines the strengths of manual grading with advanced computational techniques, aiming to accomplish the following: 1. assess the performance of an ANN and RF in handling complex datasets and predicting overall grades; 2. provide insights into the comparative advantages and limitations of these machine learning models in BCA; 3. address the gap in the literature regarding the use of RFs in BCA, contributing novel findings to the field.
3. Methodology
3.1. Research Area: Osijek-Baranja County in Croatia
Osijek-Baranja County, located in eastern Croatia, presents a unique setting for evaluating the condition of school buildings within the context of Croatia’s Long-Term Strategy for National Building Stock Renovation by 2050 [
46]. This strategy, which aims to improve the energy performance, sustainability, and overall condition of the building stock in Croatia, is critical for addressing both the challenges of aging infrastructure and the need for energy efficiency improvements in public buildings, including schools. In this context, BCA plays a crucial role. With a significant portion of Croatian buildings being older, many need substantial renovations to meet current standards for energy efficiency and safety. The region of Osijek-Baranja County, with its mix of urban and rural areas, reflects this challenge. Urban areas such as Osijek have a higher concentration of older buildings that are likely to require more urgent renovations and ongoing maintenance. On the other hand, rural schools may face difficulties with less frequent access to resources for repairs and assessments, making it harder to address deteriorating conditions. Croatia’s long-term renovation strategy highlights the necessity of a systematic, nationwide approach to building renovation. The BCA process provides a structured, empirical way to monitor the condition of school buildings and prioritize those that require immediate attention. The region, with its mix of historical schools and newer educational institutions, faces the ongoing challenge of keeping buildings in good condition to ensure a safe and conducive learning environment.
3.2. Data Collection
The Ordinance on Systematic Energy Management in the Public Sector (Official Gazette 18/2015) was adopted in 2015 which prescribes the obligation to manage energy and water consumption, the analysis of consumption, the method of reporting on energy and water consumption, and the methodology of systematic energy management in the public sector [
47]. Also, the Energy Management Information System (EMIS) was developed to provide support for strategic planning of energy and sustainable management of energy resources in buildings that are owned or used by cities, counties, or the Government of the Republic of Croatia, as well as in buildings of other government budgetary and extra-budgetary users and public authorities [
48]. The authors requested these data from the EMIS department for research and obtained them in December 2023. Besides the data on the energy consumption of each building, the EMIS system also contains information regarding the year of construction, constructive elements of buildings, and their specifications. Every building has information regarding door and window material, external wall material, roof construction material, roof cover material, and floor material. Since the data that are input depend on the responsibility of building managers, specific information was found to be missing for some buildings. To address this issue, the missing data were filled out using the Croatian Methodology of Energy Audit of Buildings, which provides a standardized approach to identifying the characteristic constructive elements associated with specific construction periods [
49]. This methodology was chosen because it offers a reliable and systematic framework for inferring missing building details based on the year of construction, ensuring that the imputed data are consistent with commonly used materials and construction practices from that time period. By relying on a national, officially recognized methodology, the imputation process ensures a high level of accuracy and consistency in the missing data. Furthermore, it minimizes subjectivity and potential errors that might arise from assumptions made without a standardized reference, thereby enhancing the overall reliability of the data used in the analysis.
Therefore, according to the building’s construction period, the missing information was filled with the characteristic materials used in that period.
Since the material is provided for each element, their lifetime was analyzed using the values of the sustainable use life of building elements. These values were obtained from the tables of sustainable use life of building elements provided in the Croatian Ordinance on property valuation methods (Official Gazette 105/15) [
50]. These data were collected for 166 primary and secondary schools in Osijek-Baranja County in Croatia.
Using the provided sustainable use life for schools [
50] and their year of construction, the remaining lifetime of each school was calculated by subtracting the construction year from the corresponding sustainable use life value. Similarly, the remaining lifetime of each building element was calculated using the material-specific sustainable use life values in relation to the school’s construction year. In cases where a specific building component had been renovated, the year of renovation was used instead of the construction year to reflect the updated condition and extend the component’s remaining life accordingly. While this approach provides a standardized and practical means of estimating remaining lifespans, it does not explicitly account for variable degradation rates or environmental influences such as humidity, exposure to harsh weather, or maintenance frequency.
The building components considered for rating the building condition were the age of the building, doors, windows, external walls, roof, roof cover, and floor. The sustainable use life of each evaluated component is presented in
Table 1 [
50].
Since there are various remaining lifetimes of each of the analyzed components, the scale used to rate each of them is presented in
Table 2.
Using the provided condition scale, the total building condition was calculated as a geometric mean of the conditioned categories obtained for each component. It is essential to clarify that condition category 1, which includes a remaining lifetime of less than 0%, concerns the components that have exceeded their sustainable use life.
4. Analysis of the School Sample
A descriptive statistical analysis regarding the year of construction and renovation, together with the age of both, was conducted using TIBCO Statistica
® 14.1.0 [
51], for the school sample and is presented in
Table 3.
The descriptive statistical analysis of the construction and renovation dates for the sample of schools reveals significant insights into the age and maintenance of educational facilities. The dataset comprises 166 schools with a mean construction year of 1972.61, indicating that many schools were built around the early 1970s. The oldest school dates to 1900, while the most recent one was constructed in 2022, showing a broad range of building ages. The lower quartile value of 1959 suggests that 25% of the schools were built before this year, and the upper quartile value of 1994 indicates that another 25% were constructed after this date. The high standard deviation of 27.82 years reflects the wide variation in construction years.
Regarding renovations, data are available for 123 schools, with the average last renovation occurring in 2012.33. Renovations span from 1991 to 2023, highlighting schools that have not been renovated in decades and those recently renovated. The lower quartile of 2006 and the upper quartile of 2019 values suggest that many schools underwent renovations relatively recently or a considerable time ago. The mean age since construction is 51.39 years, with schools ranging from 2 to 124 years old, and the standard deviation of 27.82 years again points to a considerable range. In contrast, the mean age since the last renovation is 11.68 years, ranging from 1 to 33 years, with a standard deviation of 7.64 years, less dispersed than the construction data. This underscores the diversity in the ages of school buildings, with some having been recently built or renovated and others potentially already overdue for renovation. This disparity highlights the need for ongoing maintenance and possibly increased investment in renovating older schools to ensure all facilities meet contemporary educational and safety standards.
Also, in
Table 4, a descriptive statistical analysis regarding the remaining sustainable life use for the evaluated components was conducted for the school sample.
The analysis in
Table 4 provides a detailed examination of the remaining sustainable life of various components within the school sample, offering critical insights into these structures’ maintenance needs and longevity. The “Age of Building” category, which includes data for 166 schools, shows an average remaining sustainable life of 18.61 years. However, the data reveal a stark disparity with a minimum value of −54 and a maximum of 68, indicating that some buildings are already significantly beyond their expected sustainable life. In contrast, others still have considerable time left. The lower quartile is five years, meaning that 25% of the buildings have five or fewer years of sustainable life remaining, while the upper quartile is 40 years, indicating that another 25% have more than 40 years left. The high standard deviation of 27.82 underscores the broad variation in the data. For specific components, the remaining sustainable life varies widely: windows average 11.13 years but range from −84 to 46 years, with a high standard deviation of 30.17, suggesting some are long overdue for replacement. Roof construction has the most substantial average remaining life at 64.64 years, with a minimum of −4 and a maximum of 110 years and a lower quartile of 49 and an upper quartile of 86 years, indicating generally good longevity.
In contrast, roof coverage is more delicate, with an average remaining life of only 3.10 years and a range from −74 to 46 years, reflecting potential issues requiring urgent attention. External doors and walls show a similar pattern of variance, with means of 8.56 and 36.93 years, respectively, and significant standard deviations (29.26 for doors and 27.65 for walls), highlighting diverse conditions across the sample. Floor construction has a relatively stable perspective, with an average of 46.81 years remaining but, again, a wide range (−44 to 98 years) and a high standard deviation of 32.18 point to substantial variability. These statistics collectively suggest that while some components of the school buildings are in good condition, others are significantly degraded and need immediate repair or replacement, underlining the importance of targeted maintenance and renovation strategies.
5. Excel-Based Element-Level Grading
After the remaining lifetime of each component was determined, it was possible to grade each component and obtain each school’s total grade as an average mean of all component grades.
Table 5 shows the frequency of each condition category from 1 to 5 among each component.
The data reveal diverse conditions across the components. For instance, the building age shows many buildings in the best (63 in category 5) and worst (29 in category 1) conditions, indicating a mix of well-maintained and deteriorated structures. Similarly, the condition of windows varies, with a notable number in the worst condition category (47) but also a considerable amount in the good condition (45 in category 4). Roof construction and roof coverage exhibit more concerning distributions, particularly in the lower categories, suggesting widespread issues with these components; notably, 68 instances of roof coverage fall into category 1, implying a poor condition. The frequency of categories for external doors and walls also demonstrates variability, with substantial numbers in both the lower and upper condition categories. Floor construction appears somewhat better, with a higher frequency in the mid-to-upper categories (50 in category 3 and 63 in category 4). These distributions highlight the uneven state of maintenance across different building components, emphasizing the need for targeted interventions to address specific issues and enhance the overall condition of school facilities.
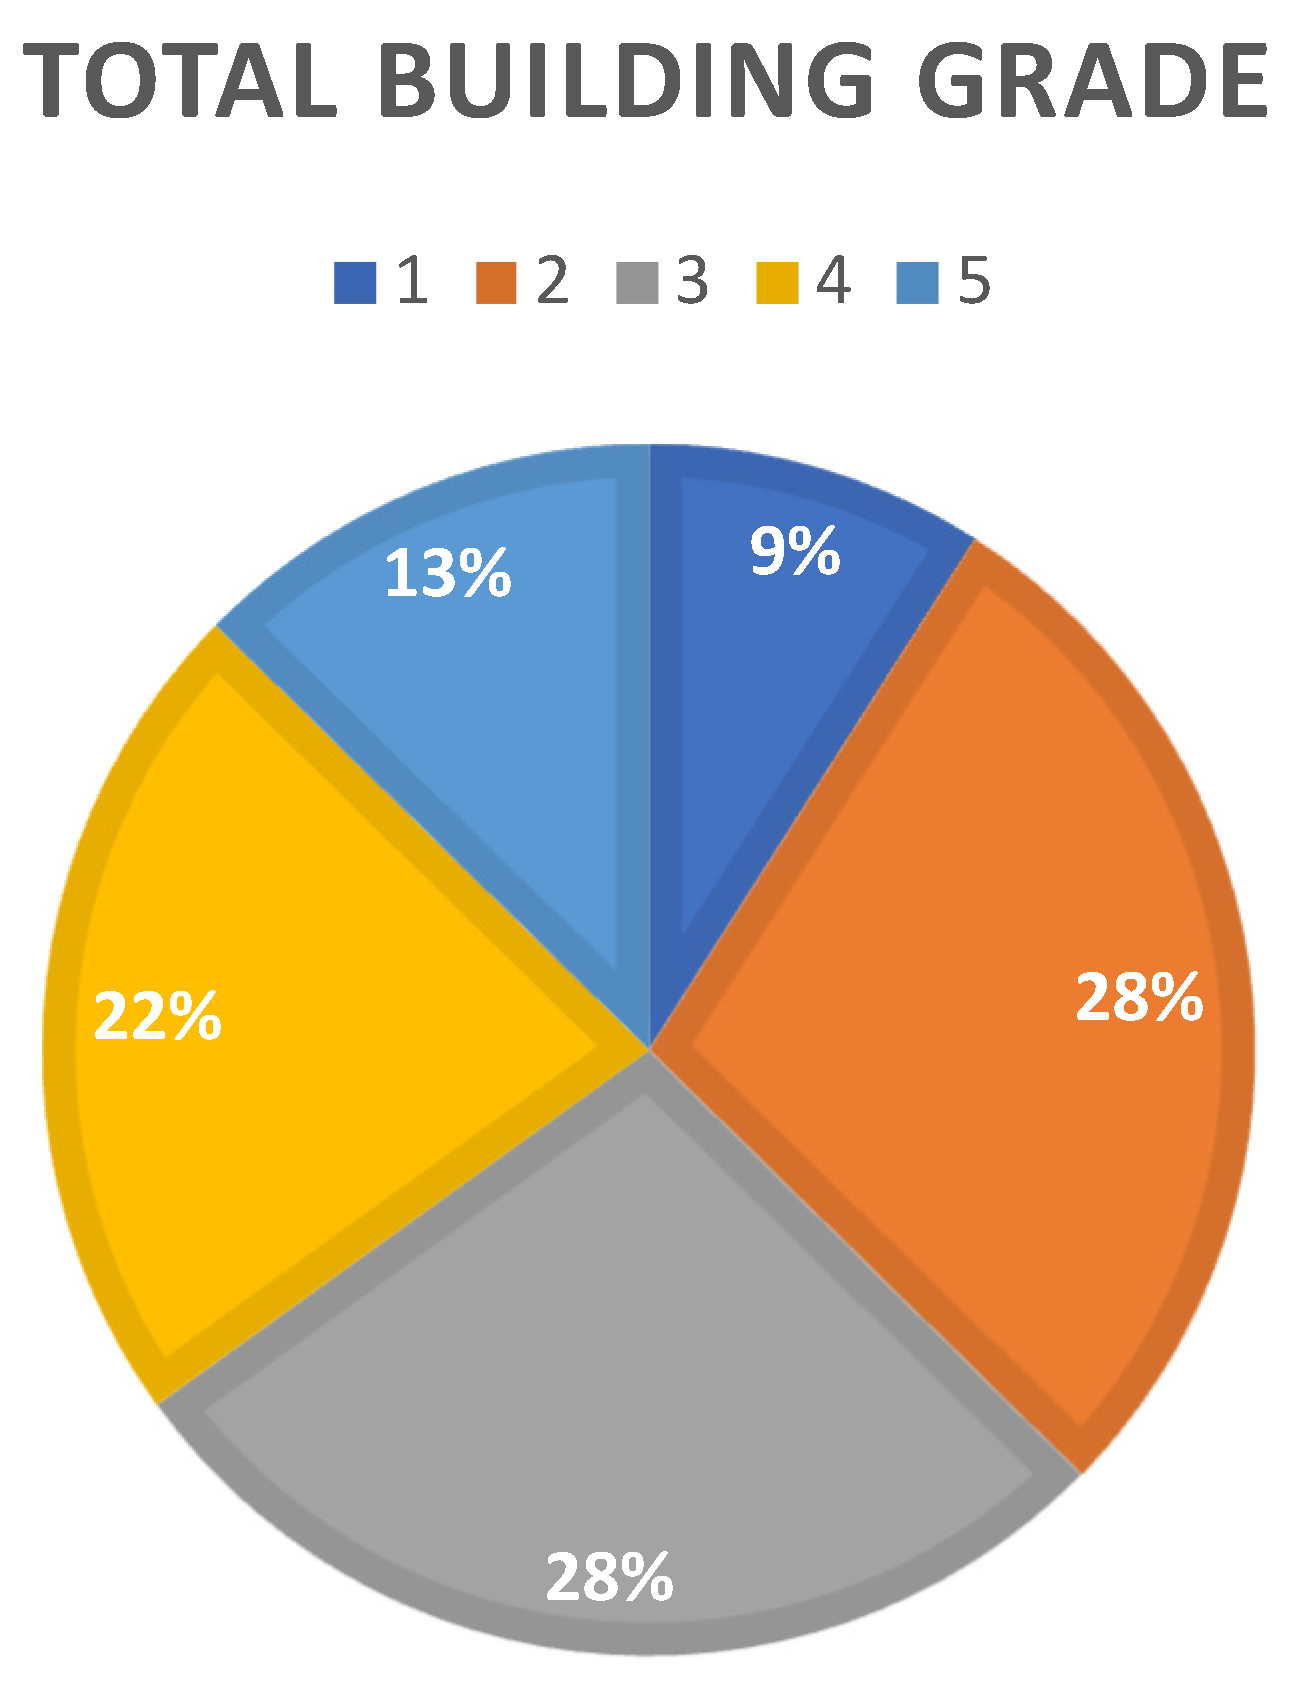
Furthermore, using the component grades, the total grade of each school was calculated, and the results of the total grade calculation are presented in
Figure 1 and
Table 6.
The distribution of total grades across the schools, categorized from 1 to 5, provides an overview of the overall condition of the school buildings as assessed by the various component grades. According to the data, 15 schools fall into the lowest grade of 1, indicating significant deficiencies across multiple building components. The largest group of schools, with a total grade of 2, comprises 47, suggesting that a substantial portion of the facilities are in poor condition but not at the worst level. The category with a total grade of 3 includes 46 schools, representing a middle where facilities are generally in fair condition but still have room for improvement. Meanwhile, 37 schools received a total grade of 4, indicating that these buildings are in relatively good condition, with most components likely well-maintained. The highest-grade category, 5, consists of 21 schools, showing a smaller group of facilities in excellent condition overall. This distribution highlights a diverse range of facility conditions, with a notable concentration of schools in the lower-to-mid-range categories, pointing to widespread needs for improvement and maintenance. These total grades are further used as a database in the next section to train the ANN and RF models to predict the total school grade.
6. Developed Models for Predicting the Total Grade
6.1. Variables
For the development of the ANN and RF models to predict the total school building grade, input variables are determined to be the remaining lifetimes of each element, without grading each specific element. The input and output variables are shown in
Table 7.
The remaining lifetimes of elements showed high correlation with the output variable as can be seen in
Table 8.
It is essential to observe that a positive value signifies a positive correlation, indicating that an increase in one variable results in an increase in the other [
52]. Conversely, a negative value signifies a negative correlation, indicating that an increase in one variable will decrease the other. However, in this case, there are no such relationships. All of the correlations are very significant, as indicated by their high values and the red markings. These noted correlations have a significance level of
p < 0.05.
In this study, a crucial step was taken to ensure the reliability of the developed models. The initial data set was split into two sets using a random process: the training set, which was used to create or develop a model, and the validation set, which was used solely to validate the developed models’ error assessment predictions. In the training set, 117 school buildings’ worth of data were chosen at random, accounting for 70.5% of the total of 166 school buildings, and 49 school buildings were in the validation set, or 29.5% of the total. Similar ratios were also used in [
53,
54].
6.2. ANN Model
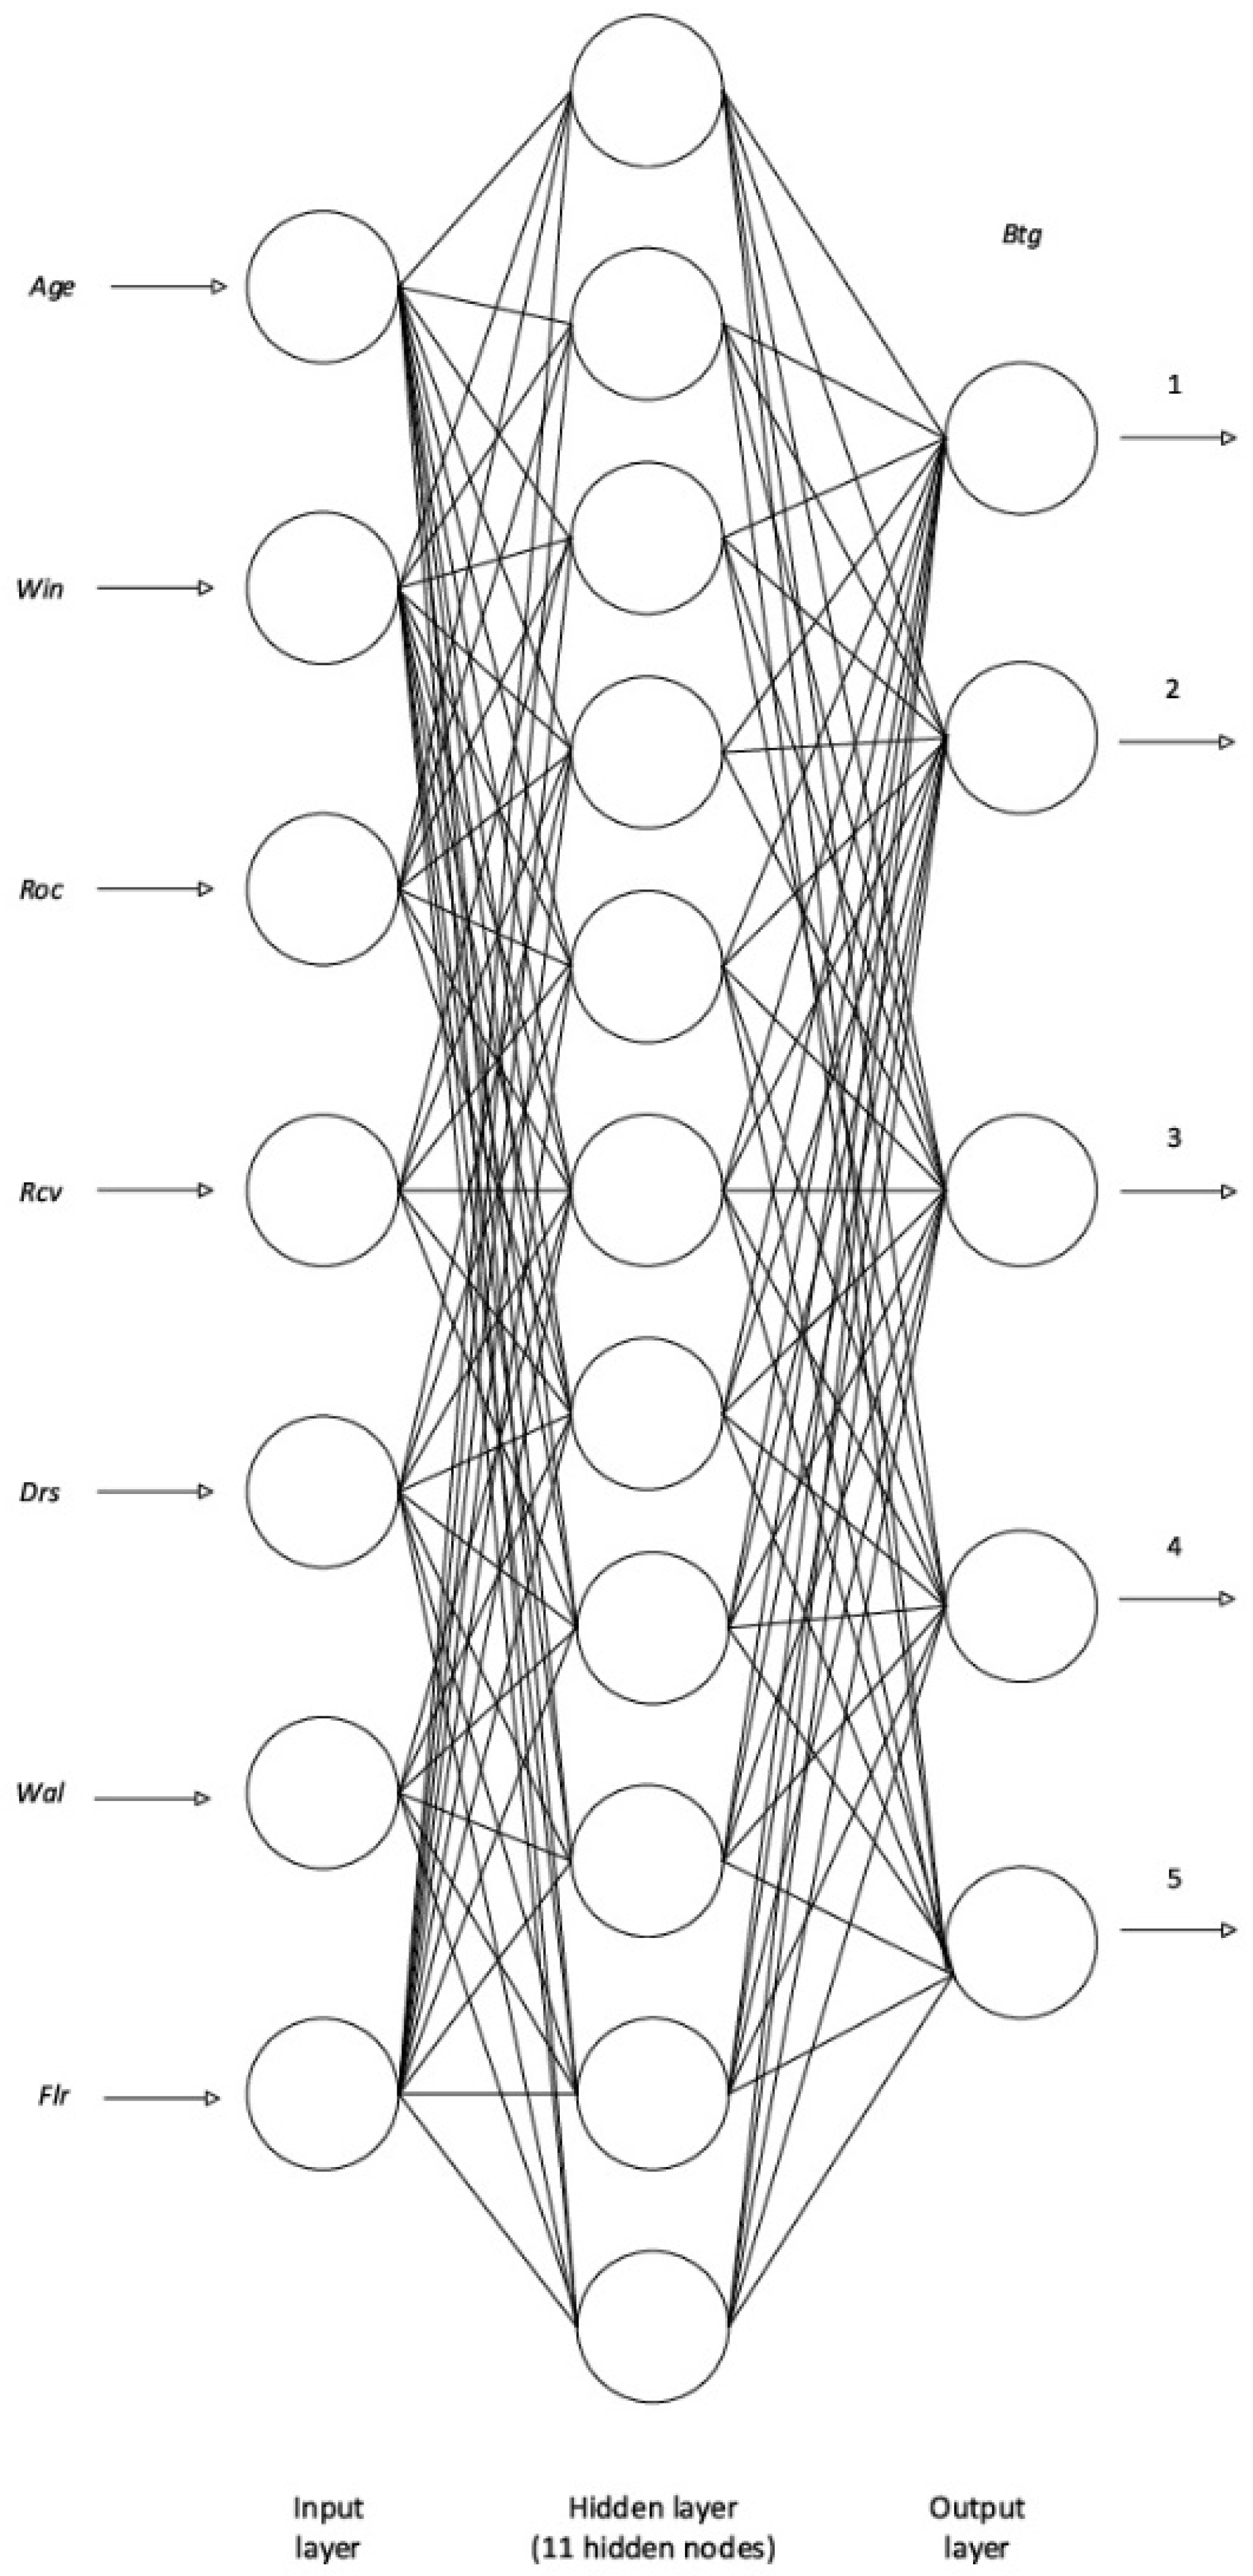
A multilayer perceptron (MLP), a type of ANN, was employed to construct the model. MLPs consist of multiple layers of interconnected nodes, typically including an input layer, one or more hidden layers, and an output layer. Each node within a layer is connected to every node in the adjacent layer, enabling the model to learn complex relationships by adjusting the weights between the nodes through training. This architecture allows MLPs to capture non-linear patterns in data, making them particularly effective for tasks like forecasting and classification [
55]. Due to the nature of the output variables, a classification ANN algorithm was used.
Figure 2 shows the architecture of the optimal selected ANN model.
The architecture of MLP refers to the number of layers and the number of nodes in each layer. In this case, 7-11-5 indicates the following:
If 7, there is an input layer with 7 nodes. These nodes represent the features or variables that are fed into the network;
If 11, there is one hidden layer with 11 nodes. This layer performs the main information processing and learning within the network;
If 5, there is an output layer with 5 nodes. This node represents the network’s prediction or output value, i.e., the school grades from 1 to 5.
The number of hidden layers and neurons was determined based on empirical testing and the balance between model complexity and performance. A single hidden layer was chosen to maintain model interpretability and avoid overfitting, given the dataset size. The number of neurons (11) was selected through experimentation, comparing different configurations to identify the structure that yielded optimal predictive performance during model training and validation. While more complex architectures could be explored, the chosen configuration was found to provide a suitable trade-off between accuracy and computational efficiency for this study.
6.3. RF Model
Random forests are a larger set or ensemble of decision trees [
56]. The name of the algorithm comes from the machine learning technique that the algorithm uses. The algorithm creates a large number of decision trees from the available data for learning—a forest of random trees. When constructing each tree in the forest, the algorithm randomly selects a subset of data and a subset of the input variables of the set [
57,
58]. RFs have many interesting features such as precise prediction power (comparable to or even outperforming ANNs and support vector algorithms), a low tendency of overtraining the model, not requiring a computer with high processing power, and having the ability to work very well with data with large dimensions [
59]. One of the main advantages of the RF algorithm is resistance to training and growing a large number of random decision trees, where it does not create a risk of overlearning the model (each tree is a completely independent random experiment). The algorithm is also robust to exceptions in the data and automatically handles missing values [
60].
In this case, since the output variable is the school building’s total grade from 1–5, the classification RF algorithm was used. The predictor importance values for an RF model indicate how influential each variable is in predicting the output variable, in this case the school building’s total grade. The number of trees was selected to be 100. It is noted in the literature that in the examined datasets, the biggest performance gain is achieved when training the first 100 trees [
61].
Table 9 shows the predictor importance of the input variables. These values are typically normalized so that the most important variable has an importance of 1.
The roof construction (Roc) variable (rank 100, importance 1000) is the most significant predictor, making it the strongest factor in determining the building’s grade. This aligns with the intuition that the condition of the roof plays a critical role in a building’s overall structure and longevity. Walls (Wal) ranked 93 with an importance of 0.929, indicating that the condition of the walls is also a crucial factor in assessing the building’s condition. Doors (Drs), with a rank of 87 and importance of 0.875, and windows (Win), ranked 81 with an importance of 0.805, both have substantial influence, highlighting the significance of the building’s exterior elements in overall grading. Floors (Flr), ranked 78 with an importance of 0.780, also play a notable role in the grade calculation, suggesting that the condition of the floors is a key predictor of the building’s state. Age (rank 76, importance 0.762), though slightly lower, remains an important factor, reinforcing the idea that older buildings are more likely to experience deterioration over time. Finally, roof covering (Rcv), with a rank of 69 and an importance score of 0.688, while still an important predictor, has a somewhat lower impact compared to the other structural components. In conclusion, the results demonstrate that critical structural elements, particularly the roof, walls, doors, and windows, along with the building’s age, are the most influential predictors in determining a building’s grade. These findings suggest that predictive models, like random forests (RFs), that account for these variables are likely to provide reliable assessments of building condition.
7. Results
The following coefficients were used to estimate the prediction error of the developed models: mean absolute percentage error (
MAPE), coefficient of determination (
R2), mean square error (
MSE), root mean square error (
RMSE), and coefficient of variation of the root mean square error (
CVRMSE). Unlike most error metrics,
MAPE (mean absolute percentage error) does not have a strict upper limit. The reason for this is because it involves taking the absolute value of the percentage error [
62]. The closer the coefficient of determination
R2 value is to 1, the more representative the prediction model is [
63]. Generally, a lower
MSE is desirable as it signifies that the model’s predictions are, on average, closer to the actual values. Conversely, a high
MSE suggests that the model’s predictions are consistently far off from the real values [
64]. Typically, the upper limit for
CVRMSE of 30% is used to measure representativeness [
65]. The equations utilized to compute the statistical techniques for prediction error estimation are displayed in
Table 10.
Table 11 presents the values of the aforementioned coefficients for estimating the prediction error of the developed ANN model and the RF model in the model training set with included additional metrics, i.e., precision, recall, and F1.
The comparative performance of ANN and RF demonstrates the suitability of advanced machine learning methods for BCA. The ANN model exhibits better predictive accuracy, with an R2 of 0.987 and a MAPE of 0.50%, indicating near-perfect alignment with the actual grades. In contrast, the random forest model, while performing adequately (R2 = 0.924), has higher error metrics, such as a MAPE of 2.99%. These results suggest that while both models can be utilized for BCA, the ANN model provides a more reliable framework for precise grade prediction. The ANN model performs well with precision, recall, and F1 scores of 0.983, indicating high accuracy in classifying the target variable. In contrast, the RF model, with scores around 0.920 for precision and 0.906 for recall, performs slightly worse, showing more false positives and missed cases.
Table 12 presents the values of the aforementioned coefficients for estimating the prediction error of the developed ANN model and the RF model in the model validation set with included additional metrics, i.e., precision, recall, and F1.
The validation results underscore better predictive capability of the ANN model for building total grade (Btg) assessment. With R2 = 0.940 and MAPE of 2.55%, the ANN achieves high accuracy and low error, making it a reliable tool for assessing building conditions. The RF model, while slightly less precise in terms of MAPE = 2.66%, also exhibits strong generalization performance, suggesting it is a viable alternative or complementary approach. The ANN model achieves precision, recall, and F1 scores of 0.927, 0.918, and 0.920, respectively, indicating strong performance with a slight edge over the RF model, which has scores of 0.920, 0.915, and 0.915. Both models perform similarly in terms of classification, with RF slightly lagging in recall and F1. However, both models are well suited for the task, with similar accuracy and error rates.
8. Validation of the Framework on an External Sample of Schools
As for the development, the data on schools for validation were obtained from EMIS [
48]. A total of 20 schools were used for the validation of the developed models, with 10 schools from inland Croatia and 10 from the coastal region. By including schools from coastal Croatia, such as those in coastal and island areas, as well as schools from inland Croatia, the models are tested under various urban, rural, and specific regional conditions. In this way, the validation confirms how robust the models are and how ready they are for use in real-world conditions within the educational system across Croatia.
The counties of continental Croatia include the City of Zagreb, Zagreb County, Krapina-Zagorje County, Varaždin County, Koprivnica-Križevci County, Međimurje County, Bjelovar-Bilogora County, Virovitica-Podravina County, Požega-Slavonia County, Brod-Posavina County, Osijek-Baranja County, Vukovar-Srijem County, Karlovac County, and Sisak-Moslavina County.
The counties of coastal Croatia include Primorje-Gorski Kotar County, Lika-Senj County, Zadar County, Šibenik-Knin County, Split-Dalmatia County, Istria County, and Dubrovnik-Neretva County.
Osijek-Baranja County will be excluded from the validation sample, considering that all models were developed using a sample of schools from this county. Considering that the Republic of Croatia has 21 counties, excluding Osijek-Baranja County leaves 20. The sample consists of 20 schools because one school was selected from each county to ensure diversity in the sample. Among these 20 schools, 6 are secondary schools to include larger schools with a greater number of students in the analysis.
Firstly, their grades were obtained using the Excel-based traditional grading system, and then these grades were predicted using the remaining lifetimes of elements.
Table 13 presents the values of the aforementioned coefficients from
Table 10 for estimating the prediction error of the developed ANN model and the RF model in the external validation set.
The table compares the performance of the two models—the ANN and RF—in predicting the building total grade (Btg), and both models deliver excellent results. The ANN model slightly outperforms the RF model across all metrics. It achieves a higher R2 value (0.799 vs. 0.747), indicating that it explains more variance in the dependent variable. It also has lower error values, with an MSE of 0.200 and an RMSE of 0.447 compared to the RF’s MSE of 0.150 and RMSE of 0.388. The RF model further demonstrates greater precision in its predictions, with lower CVRMSE (19.56% vs. 18.44%) and MAPE (9.17% vs. 7.71%). However, it is worth noting that both models achieve high R2 values and low error metrics, reflecting their strong performance and reliability in predicting the building total grade. The ANN model performs slightly better than the RF model, with precision, recall, and F1 scores of 0.849, 0.800, and 0.807, respectively. The RF model has scores of 0.809 for precision, 0.775 for recall, and 0.776 for F1, indicating slightly lower performance.
9. Discussion
The systematic management of public sector buildings is essential for sustainability and operational efficiency. Implementing the Ordinance on Systematic Energy Management in the Public Sector (Official Gazette 18/2015) in Croatia underscores the government’s commitment to this goal. However, beyond regulatory frameworks, the practical application of these policies, as evidenced in the EMIS, reveals strengths and areas for improvement in public sector infrastructure management. A critical aspect of this study was using EMIS data to assess the condition of 166 primary and secondary schools in Osijek-Baranja County. These data, while comprehensive, were supplemented with historical construction characteristics from the Croatian Methodology of Energy Audit of Buildings to fill gaps, demonstrating the necessity for robust data collection mechanisms. The varying completeness of the data highlights an ongoing challenge in relying on decentralized data input, particularly in ensuring uniformity and accuracy across many buildings. The condition of the buildings was assessed using a detailed methodology that considered the sustainable use life of various building components. The first part of the study utilized an Excel-based scoring system to assign grades to individual building elements, such as windows, roofs, and floors, based on their remaining sustainable life of use. This matrix-based approach ensured simplicity and transparency, enabling practitioners to easily evaluate and grade each component systematically. While the machine learning models (ANN and RF) excel in predictive accuracy, the Excel grading framework introduces a clear, step-by-step process for initial assessments. This hybrid approach ensures that stakeholders with varying levels of technical expertise can contribute to the assessment process, bridging the gap between manual evaluation and algorithmic precision. The Excel model enabled a component-level analysis of building elements, forming the foundation for the subsequent machine learning models. The ANN and RF models utilized data from the Excel grading system to predict the overall building total grade (Btg). This synergy between traditional and modern techniques ensures that the assessment process retains its transparency while benefiting from advanced data-driven insights. The integration of both approaches enhances the robustness of the BCA framework, making it adaptable to a variety of use cases, including large-scale assessments and policy-driven renovations.
While the AI models demonstrated increased predictive accuracy and the ability to handle complex, non-linear relationships within the data, it is important to also recognize the strengths and limitations of traditional grading methods. Traditional systems, such as the Excel-based grading used in this study, offer simplicity and ease of implementation, making them accessible to practitioners. They provide clear and interpretable results, which can be beneficial in practical decision-making. In contrast, the AI-based models are more objective and provide higher precision in predictions, particularly as data complexity increases. They excel in identifying underlying relationships between variables that might not be immediately apparent with traditional methods. However, these models require large, high-quality datasets for effective training and can be computationally intensive, which may pose challenges for some users, particularly in resource-limited settings. Furthermore, AI models can be less interpretable, making it harder for practitioners to understand the reasoning behind the predictions. The choice between these methods should consider the specific needs, the availability of resources, and the desired level of interpretability.
The combined methodology aligns directly with Croatia’s Long-Term Strategy for National Building Stock Renovation by 2050. The Excel-based grading system offers a practical tool for initial assessments of building elements, while the ANN and RF models provide detailed, predictive analyses necessary for prioritizing renovations. Together, these methods support the strategy’s goals of improving public building management, ensuring that limited resources are allocated effectively. The findings also revealed significant disparities in the condition of these components, particularly in elements such as windows and roofs, which frequently exceeded their expected lifespan. This suggests a systemic issue in maintenance practices or funding allocation, where preventative maintenance may not be adequately prioritized or funded. A notable aspect of the analysis was the wide variance in the age and renovation history of the buildings. The data showed that while some buildings have been relatively recently constructed or renovated, a substantial number are significantly older, with some dating back over a century. This age disparity is crucial as it indicates a potential misalignment between the age of infrastructure and the resources allocated for their maintenance. Older buildings, often with outdated materials and construction techniques, require more frequent and intensive maintenance to meet current safety and efficiency standards. The condition ratings across the schools, with a significant number falling into the lower categories, underscore the urgent need for targeted interventions. The prevalence of poor or fair ratings in critical components like roof coverage and windows not only reflects on the immediate physical condition of the buildings but also has broader implications for energy efficiency and safety. The findings suggest that these buildings may continue to deteriorate without significant investment in renovation and maintenance, potentially compromising their usability and safety.
10. Conclusions
This study highlights the significant potential of systematic building condition management for public sector buildings, focusing on the schools in Osijek-Baranja County, Croatia. Utilizing data from EMIS, the analysis reveals considerable variations in the condition of building components, underscoring the need for targeted maintenance and renovation strategies. The findings emphasize the value of data-driven approaches in identifying and addressing deficiencies across public buildings, aiming to enhance safety, efficiency, and overall functionality.
This research presents a comprehensive framework for BCA by integrating an Excel-based component level grading system with advanced machine learning models, namely ANN and RF. The Excel grading system provides a transparent and systematic approach for evaluating individual building elements, while the machine learning models enhance the predictive accuracy of the overall building condition grade (Btg). The results demonstrate the better performance of the ANN model in predicting the overall building condition, with high R2 and low MAPE values in both the training and validation datasets. Meanwhile, the RF model provides interpretable insights into predictor importance, complementing the ANN’s precision with actionable information for stakeholders. Additionally, by performing the validation on an external data set of one school from each of the remaining 20 counties of Croatia (excluding Osijek-Baranja County on which models were developed) it can be concluded that both the ANN and RF models demonstrate excellent performance in predicting the building total grade (Btg), with both models achieving high R2 values and low error metrics. The ANN model outperforms the RF slightly across all key metrics, showing better predictive power and precision. However, both models offer reliable and accurate results, making them both viable options for this type of analysis.
For school management, the ability to quickly evaluate building conditions without relying solely on visual inspections represents a significant advancement. Using EMIS data allows for rapid and comprehensive assessments, which can streamline decision-making processes, reduce reliance on subjective evaluations, and ensure that maintenance efforts are focused where they are most needed.
One significant direction for future research is the inclusion of cultural heritage buildings, which were excluded from the current analysis due to their complexity and specificity. Developing a tailored framework for managing and maintaining these buildings while balancing preservation with modern efficiency needs represents an area for future exploration. Such research could integrate conservation practices with energy management techniques to create a framework that respects historical value while ensuring functional and sustainable use. Also, the framework could be extended beyond Croatia and applied to other Eastern European countries (Slovenia, Hungary, Bosnia and Herzegovina, and Serbia) with similar construction characteristics.
Additionally, expanding the research to encompass a broader range of public buildings, such as libraries, museums, and government offices, would provide a more comprehensive understanding of infrastructure needs across different sectors. This expanded approach could lead to more effective policies and strategies for public sector building management, contributing to overall improvements in public infrastructure.
While accuracy has been the primary metric used in this study to evaluate the effectiveness of machine learning models, future research could benefit from incorporating additional performance indicators such as precision, recall, and the F1-score. These metrics are particularly valuable in situations where the data are imbalanced, as they offer a deeper understanding of how well the models perform across different categories. In cases where certain condition categories, such as “poor” or “failed” components, are more critical to identify accurately, metrics like precision and recall can help ensure that these categories are detected with higher reliability. Therefore, exploring these additional performance metrics in future studies would contribute to a more comprehensive evaluation of the machine learning models’ capabilities and their practical applicability in building condition assessments.
In summary, this study provides insights into the current state of school buildings in Osijek-Baranja County and shows the applicability of the system for expanding systematic management practices across Croatia. By addressing identified challenges and pursuing new research directions, policymakers and administrators can enhance their public building maintenance and renovation strategies, ensuring long-term benefits for current and future infrastructure.


