Article

Research on the Flexural Behavior of Profiled Steel Sheet–Hollow Concrete Composite Floor Slab

1
School of Civil Engineering, Liaoning Petrochemical University, No. 1, West Section of Dandong Road, Wanghua District, Fushun 113001, China
2
School of Transportation and Geomaties Engineering, Shenyang Jianzhu University, No. 25, Hunnan Middle Road, Hunnan District, Shenyang 110168, China
*
Author to whom correspondence should be addressed.
Buildings 2025, 15(12), 2140; https://doi.org/10.3390/buildings15122140
Submission received: 21 May 2025 / Revised: 14 June 2025 / Accepted: 17 June 2025 / Published: 19 June 2025
(This article belongs to the Section Building Structures)

Abstract

In order to reduce the self-weight of steel sheet–concrete composite slabs and fully apply the superior performance of the composite slabs, this paper proposes a kind of open-profiled steel sheet–hollow concrete composite floor slab. Flexural behavior tests are conducted to five pieces of composite floor slabs with different parameters, and numerical simulation methods were applied to perform finite element analysis on the composite slabs with different hollow rates, reinforcement ratios, and steel sheet thicknesses. At the same time, the calculation methods were discussed for the flexural bearing capacities under different anchorage conditions. The results indicate that, when the profiled steel sheet is in a low anchorage degree, end debonding is one of the important failure modes for the composite floor slabs, and the flexural bearing capacity of the composite floor slabs is significantly reduced. The reinforcement arrangement in the tensile zone has a significant impact on the bearing capacity, deflection, and ductility coefficient of the composite floor slabs. When the reinforcement ratio increases from 0% to 0.6%, the ultimate bearing capacity is increased by 182.5%, and the ductility coefficient is increased by 246.0%. The ultimate deflection of specimens with a reinforcement ratio of 0.6% is 22.4 times of that of the specimens without reinforcement arrangement. When the hollow rate is less than 20%, the influence of the concrete hollow radius on the flexural bearing capacity, ductility coefficient, and maximum crack width is relatively small. As the thickness of the steel sheet increases, the increasing range in ultimate bearing capacity gradually decreases, the deflection gradually decreases, and the ductility coefficient gradually increases; increasing the thickness of composite floor slabs can help reduce deformation. The theoretical calculation values obtained by applying the flexural bearing capacity calculation method proposed in the paper match with the test results, and the method has a certain reference value for the engineering practice.

1. Introduction

The profiled steel sheet–concrete composite slab refers to the composite force system component [1] formed by the combination of profiled steel sheet and concrete through the bonding capacity or mechanical connection, and the two working together. The profiled steel sheet–concrete composite floor slab is a common structural form in high-rise buildings and industrial plants. It combines the tensile strength of steel and the compressive strength of concrete, and both can deform simultaneously under stress. It has the advantages of high bearing capacity, low cost, and good fire resistance, etc., [2,3]. Traditional composite slabs often adopt solid concrete design [4,5,6], resulting in excessive self-weight of the floor slabs in high-rise and super high-rise buildings, which not only affects the structural safety but also increases the construction costs. In order to meet the demand for lightweight and high-strength floor slabs in high-rise buildings, light aggregate concrete is currently used to achieve the weight reduction in the composite slabs [6,7,8,9]. However, the cost of light aggregate concrete is significantly higher than that of ordinary concrete, which limits its widespread application. In contrast, the composite slabs with hollow structures can effectively reduce the amount of the concrete used and ensure the structural behavior while having more economic advantages, thus making it a better solution with development potentials. In addition, the profiled steel sheets can be divided into three structural forms: open, closed, and tapered type. Open-profiled steel sheets have a larger sectional inertia moment, can reduce unnecessary support settings during the construction, are easy to produce, and have the advantages of low price, etc. At present, there are relatively few studies by scholars on the open-profiled steel sheet–hollow concrete composite slabs, especially regarding the influence mechanism of the hollow form on the structural behavior and the design theoretical system which is not yet fully understood.
The research on the profiled steel sheet–solid concrete composite floor slab can be traced back to the 1960s and 1970s. From as early as 1967, the American Iron and Steel Institute (AISI) has conducted a great number of test studies on the failure mechanism of profiled steel sheet–concrete composite floor slabs. The results showed that the vast majority of specimens were subjected to a longitudinal shear bond failure under load, and there were relatively few specimens that suffered a flexural failure [10]. The studies by Wright et al. [11] indicated that the thickness increase in the profiled steel sheets can improve the bearing capacity of the concrete, and the changes in concrete strength have little effect on the ultimate bearing capacity. As understanding of composite floor slabs has evolved, scholars have studied the shear bond behavior of composite floor slabs [12,13,14]. Studies have shown that, because the composite floor slabs are in the ductile failure mode, the longitudinal shear bond strength of composite floor slabs is usually calculated using the m-k method and partial shear connection method. By setting up shear transfer devices, the bearing capacity of profiled steel sheets can be further improved. In recent years, Soltanalipour et al. [15,16] have studied the loading method of open-profiled steel sheet–concrete composite floor slabs, and the analysis shows that the composite floor slabs have better shear-bearing capacity and ductility in the quarter point loading method compared to the uniform loading method. Grossi et al. [17] conducted test research on open-type profiled steel sheet–concrete composite floor slabs, and the results showed that adding additional reinforcement in the tensile zone can significantly improve the ductility and ultimate shear-bearing capacity of the composite slabs. Heweidak’s [18] research indicates that the profiled composite slab’s performance depends on the composite interaction at the longitudinal direction of the concrete–steel interface.
Both the solid and hollow structures rely on the interface bonding or mechanical interlock of the profiled steel sheet and concrete to achieve a combined effect. The two failure modes have similarities; both may suffer a longitudinal shear failure, a flexural failure, or a local buckling failure, and the pore structure of the hollow slab only changes the local details of the failure path. At present, the research and application of hollow forms in the field of architecture are increasing day by day [19,20,21,22]. Chung [23] developed a new type of hollow slab, which effectively reduced the amount of concrete used and the self-weight of concrete structures. Prakashan [24] conducted test studies on four different hollow concrete slabs and pointed out that the hollow slabs were superior to the solid concrete slabs in the aspect of behaviors. Alzein [25] compared domestic and foreign research results in terms of the hollow shape, bearing capacity and deformation, shear performance, failure mode, and ductility, etc. Zhao Weinan [26] conducted finite element analysis on the flexural bearing capacity of the double tube core cast-in-place prestressed concrete hollow slabs. Research has shown that there is not much difference in the flexural stiffness of double tube core cast-in-place prestressed concrete hollow slabs in the two directions. The variation in the hollow rate of the hollow slabs within a certain scope has little effect on the bearing capacity. Mahdi [27] studied the effect on the behavior of reinforcement concrete hollow slabs by changing the size and quantity of hollow holes. The results indicated that as the hollow aperture increased, the ultimate strength decreased and the ultimate deflection increased; four hollow holes with a diameter of 75 mm were used in the hollow slabs, which reduced the ultimate strength by 80.61% and increased the ultimate deflection by 22.81% compared to the solid slabs. Liu Yongwei [28] pointed out that there was not much difference in the bearing capacity between the concrete hollow composite floor slabs doped with iron tailings and the ordinary concrete composite floor slabs. As the thickness of the slab increased, the ultimate bearing capacity showed an upward trend. Zhang Haihui [29] found that small-span closed hollow composite floor slabs suffered a flexural shear failure, but for the large-span composite floor slabs, the main behavior was a flexural failure.
In a word, scholars have conducted systematic test studies, numerical simulations, and theoretical analysis on hollow floor slabs. However, research on open-profiled steel sheet–hollow concrete composite floor slabs is still relatively limited. The combination of profiled steel sheet–concrete composite floor slabs and hollow forms can not only effectively reduce the self-weight of the structure but also give full play to the advantages of both structures, which not only conforms to the vigorously promoted concept of green building development, but also has significant economic benefits. In view of this, this paper will adopt a combination method of tests, simulations, and theoretical studies to study the flexural behavior of open-profiled steel sheet–hollow concrete composite floor slabs, and consider the influence of different hollow rates, reinforcement ratios, and other parameters on the flexural behavior of the composite floor slabs.

2. Test Plan

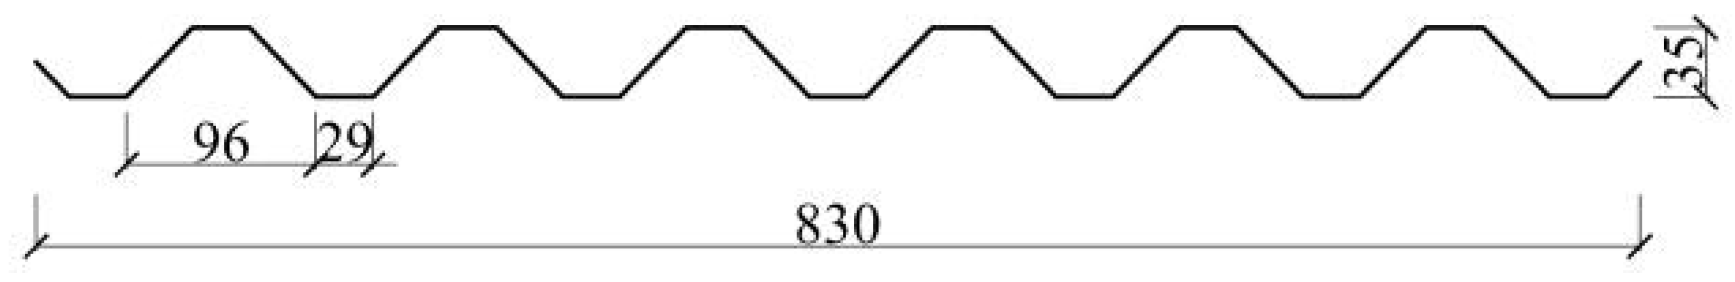
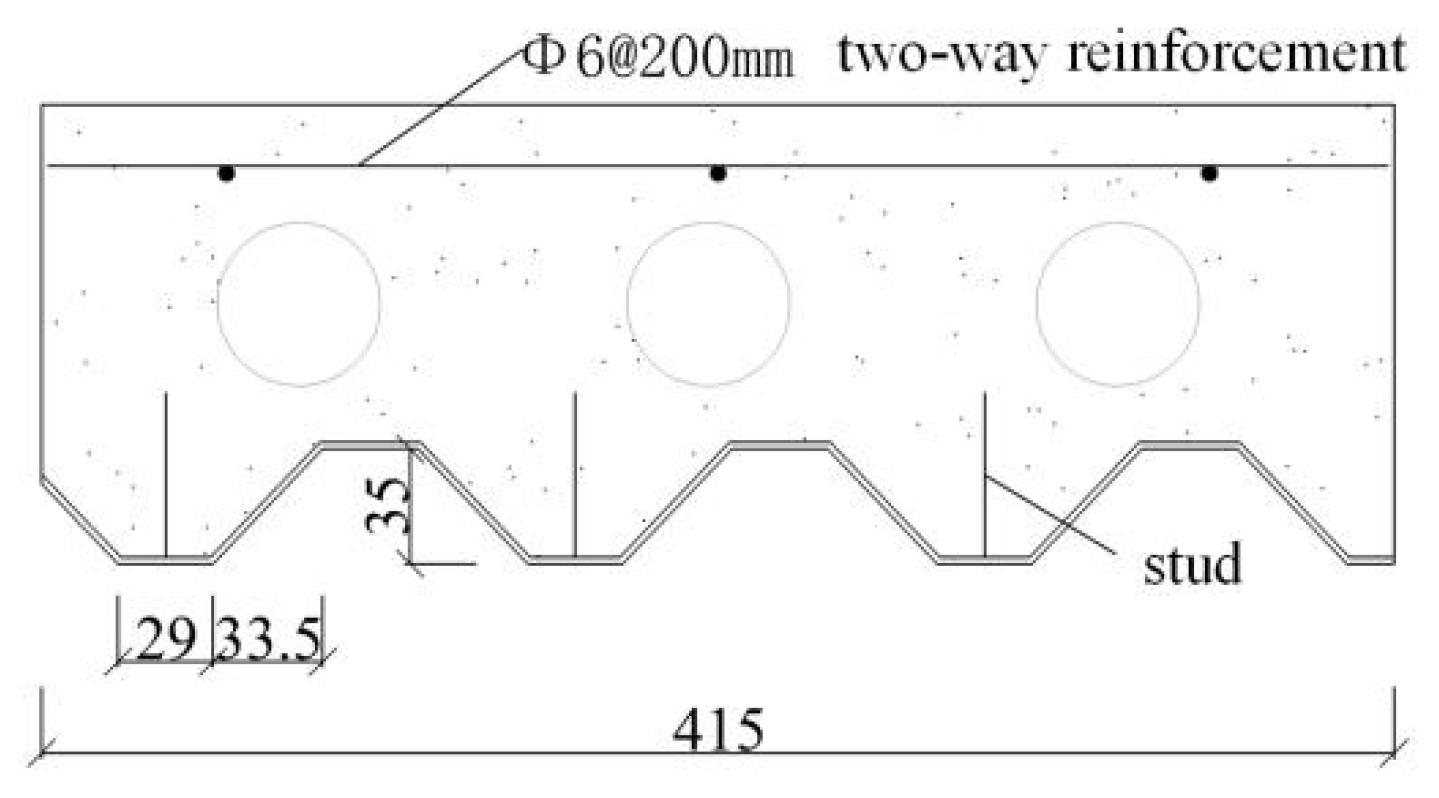
2.1. Test Specimens and Equipment

The profiled steel sheet used in the test is an open YX29-125-830 steel sheet, made of Q235 with a thickness of 0.8 mm. YX29-125-830 steel plates are a common type of open-profiled steel sheet, widely used in engineering practices. The design of the grooves in this type of steel plates provides space for electrical and heating pipelines in actual engineering projects and further reduces the self-weight of the concrete. Its versatility allows the research results to be effectively applied in engineering practices. Under the premise of meeting most conventional usage requirements and considering local market supply conditions, it was determined through calculations that steel plates with a thickness of 0.8 mm offer the best “performance/cost” ratio. The section dimensions are shown in Figure 1, and the section parameters are listed in Table 1. The longitudinal tensile reinforcement is A10mm HPB300 reinforcement, and the mechanical properties of the reinforcement are shown in Table 2. Five composite slabs with a thickness of 140 mm were produced, and Figure 2 shows the section dimensions of the composite floor slabs. Bolts were evenly placed with the calculation span of 1800 mm, shear span of 450 mm, slab width of 415 mm, slab thickness of 140 mm, and lower flange of 200 mm. The variation parameters are the hollow rate and reinforcement ratio of the composite floor slabs. The design parameters of each specimen are shown in Table 3. The concrete mix ratio for C30 concrete is cement/sand/gravel/water = 1:1.23:3.01:0.41.

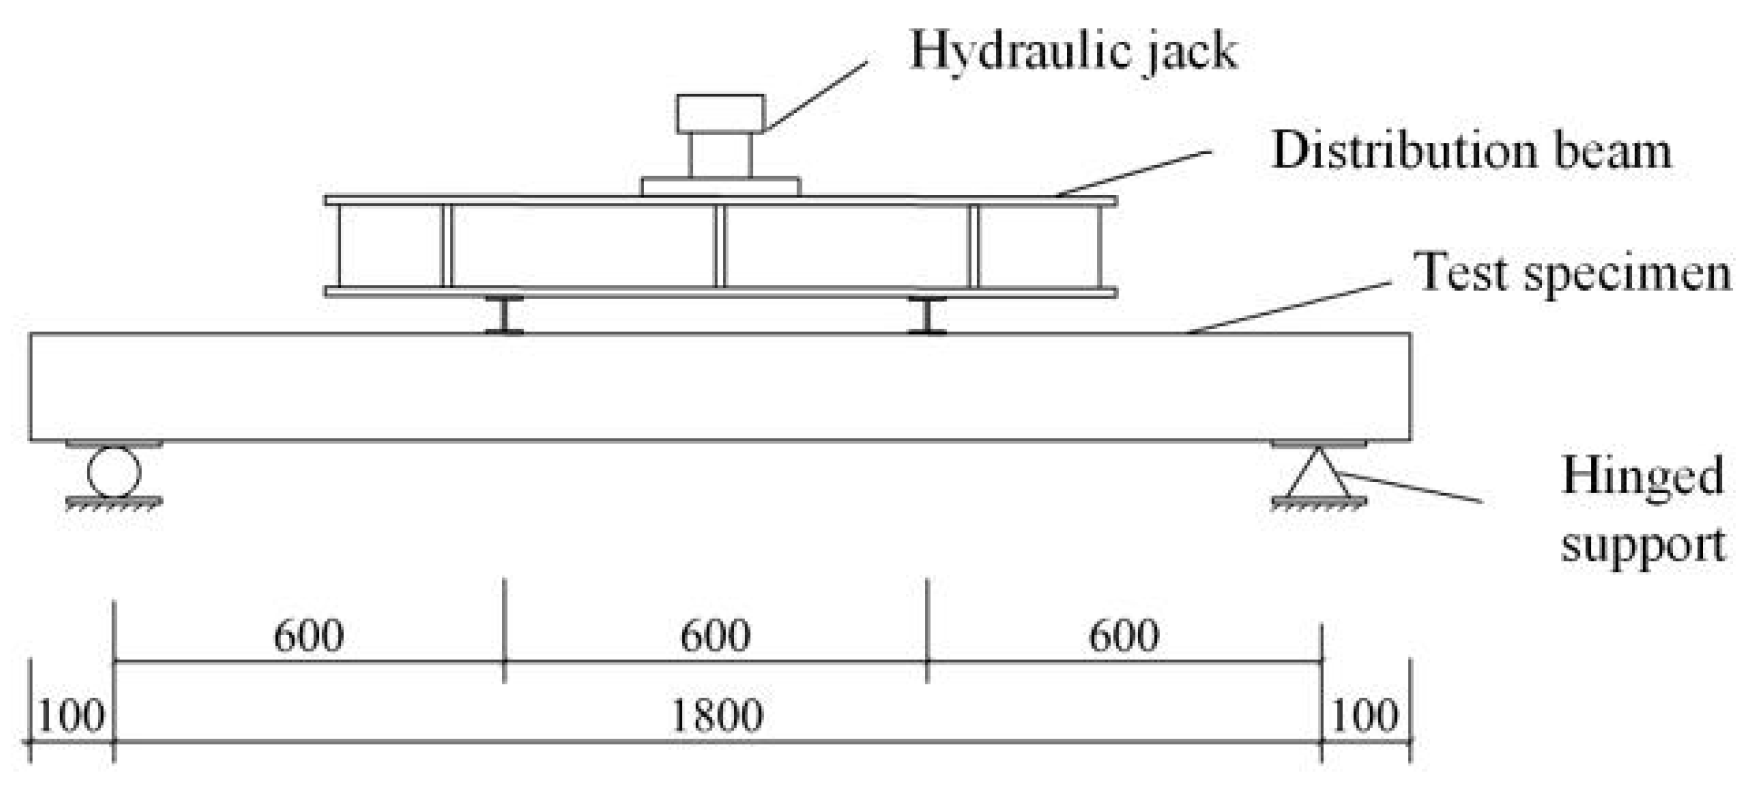
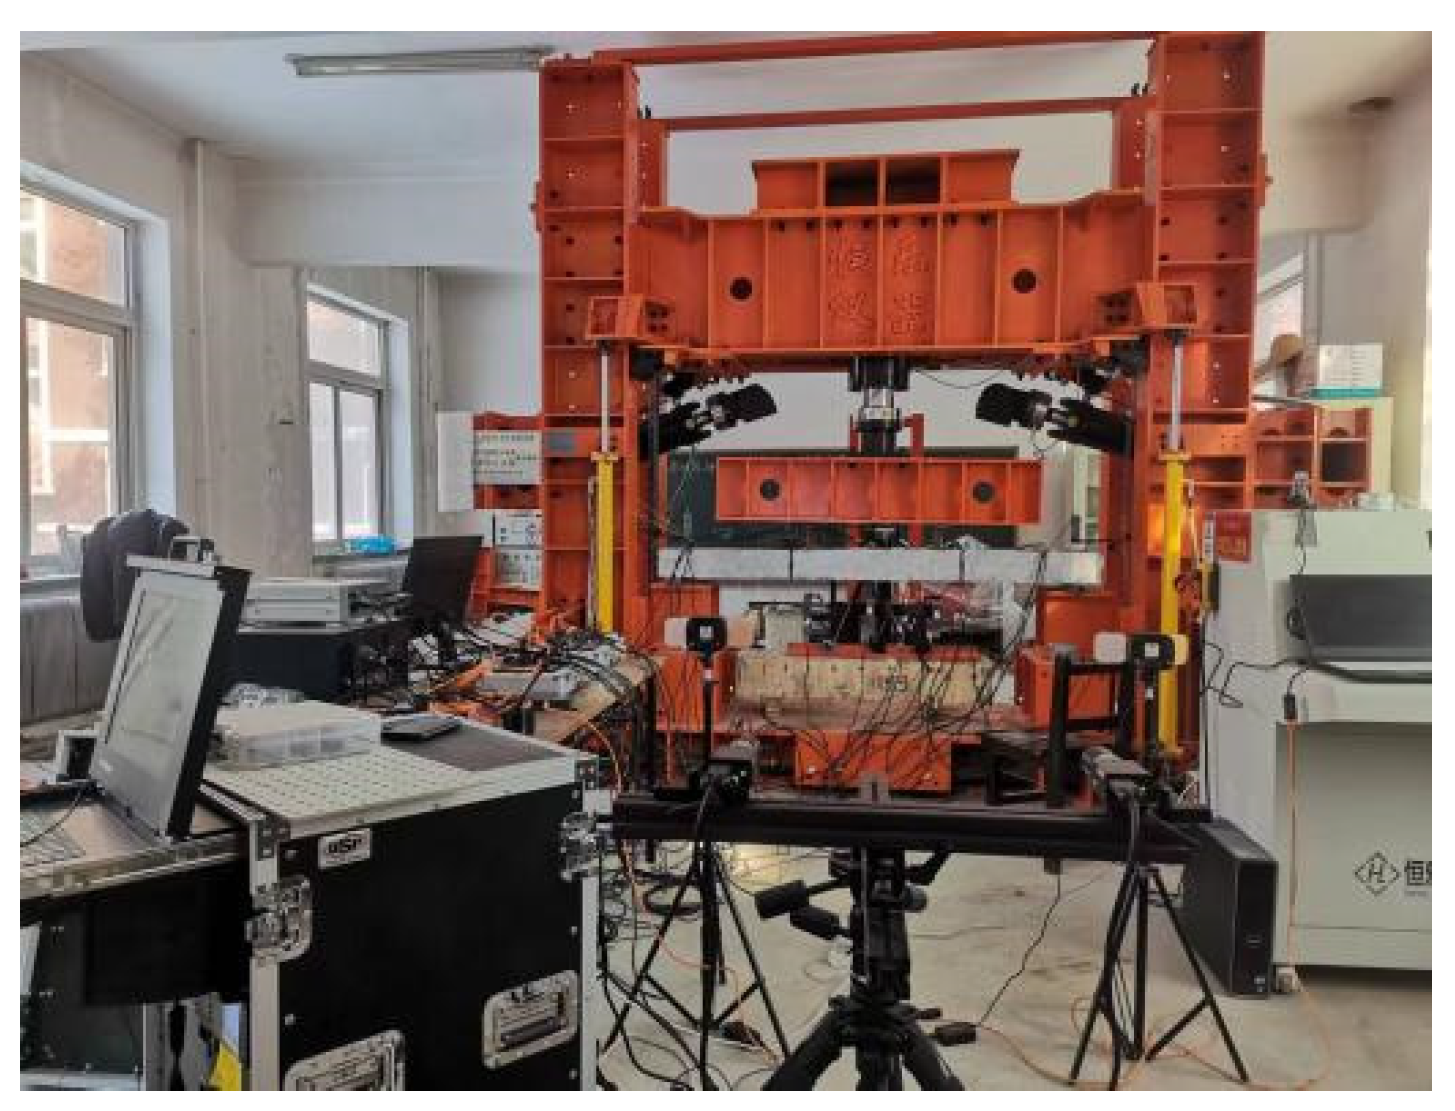
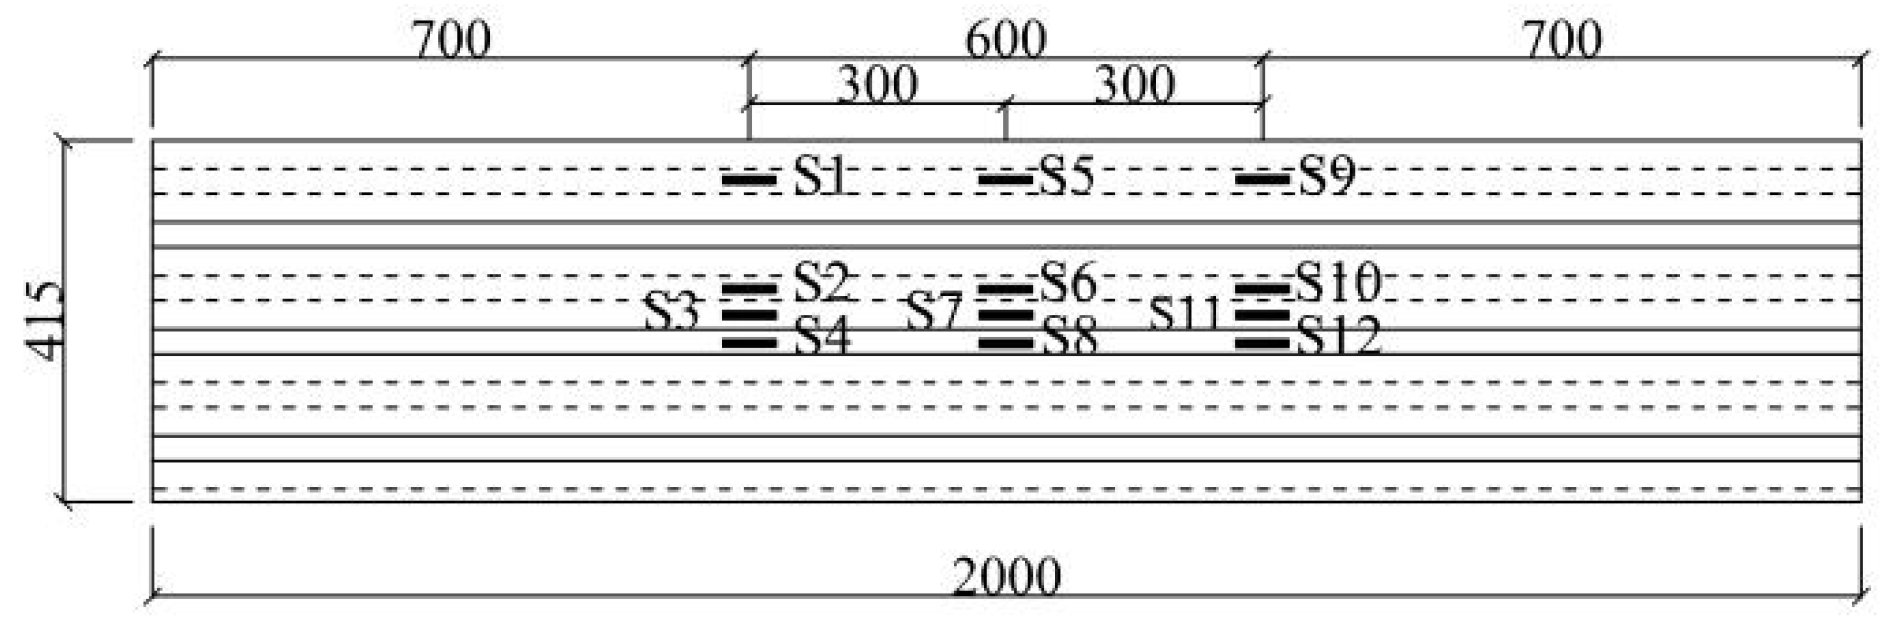
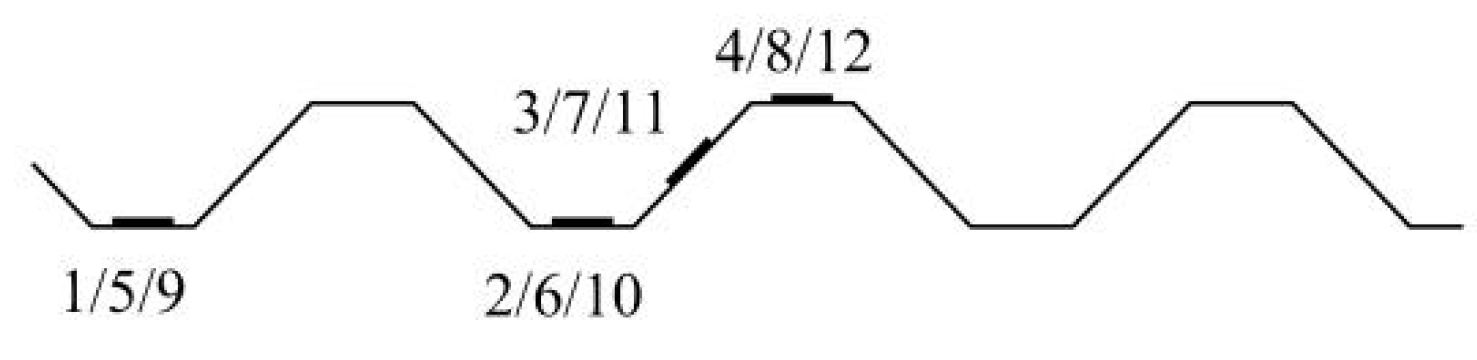
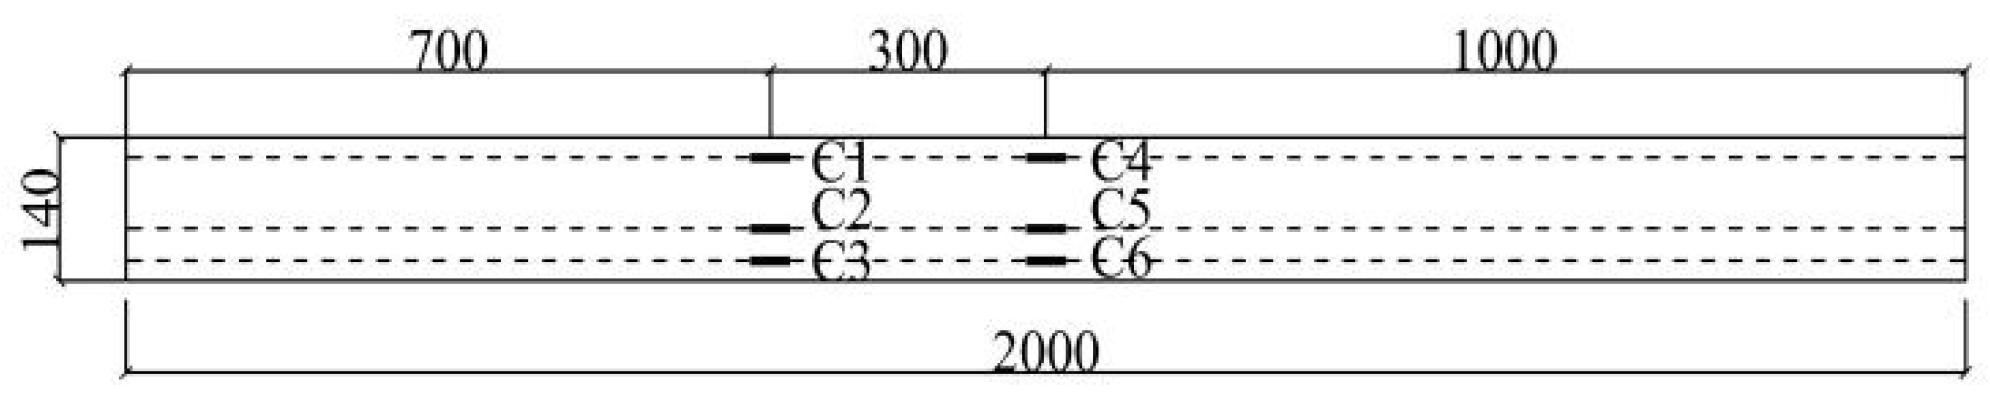
2.2. Test Loading Plan and Measurement Content

The test loading equipment adopts an electro-hydraulic servo large structure multi-directional loading system. A four-point loading and graded vertical loading method is used for the load control of the composite floor slabs. Before formal loading, perform a 2 kN preloading and pause for more than 3 min to observe whether the load–deformation is normal, so as to ensure the stability of the load and deformation. After unloading, official load starts. The test load is applied at 5 kN for each level, with a loading speed of 0.05 kN/s, and the load is maintained for 5 min [30]. Record various data including loads, concrete strains, profiled steel sheet strains, and reinforcement strains, etc., until the specimen fails. The test loading device and test site are shown in Figure 3 and Figure 4.
Figure 5 and Figure 6 show the arrangement of strain measurement points for the profiled steel sheets. The strain gauges of the concrete are arranged along the height direction at the mid-span and load point position on one side of the composite floor slab, as shown in Figure 7.

3. Analysis of Test Phenomena and Results
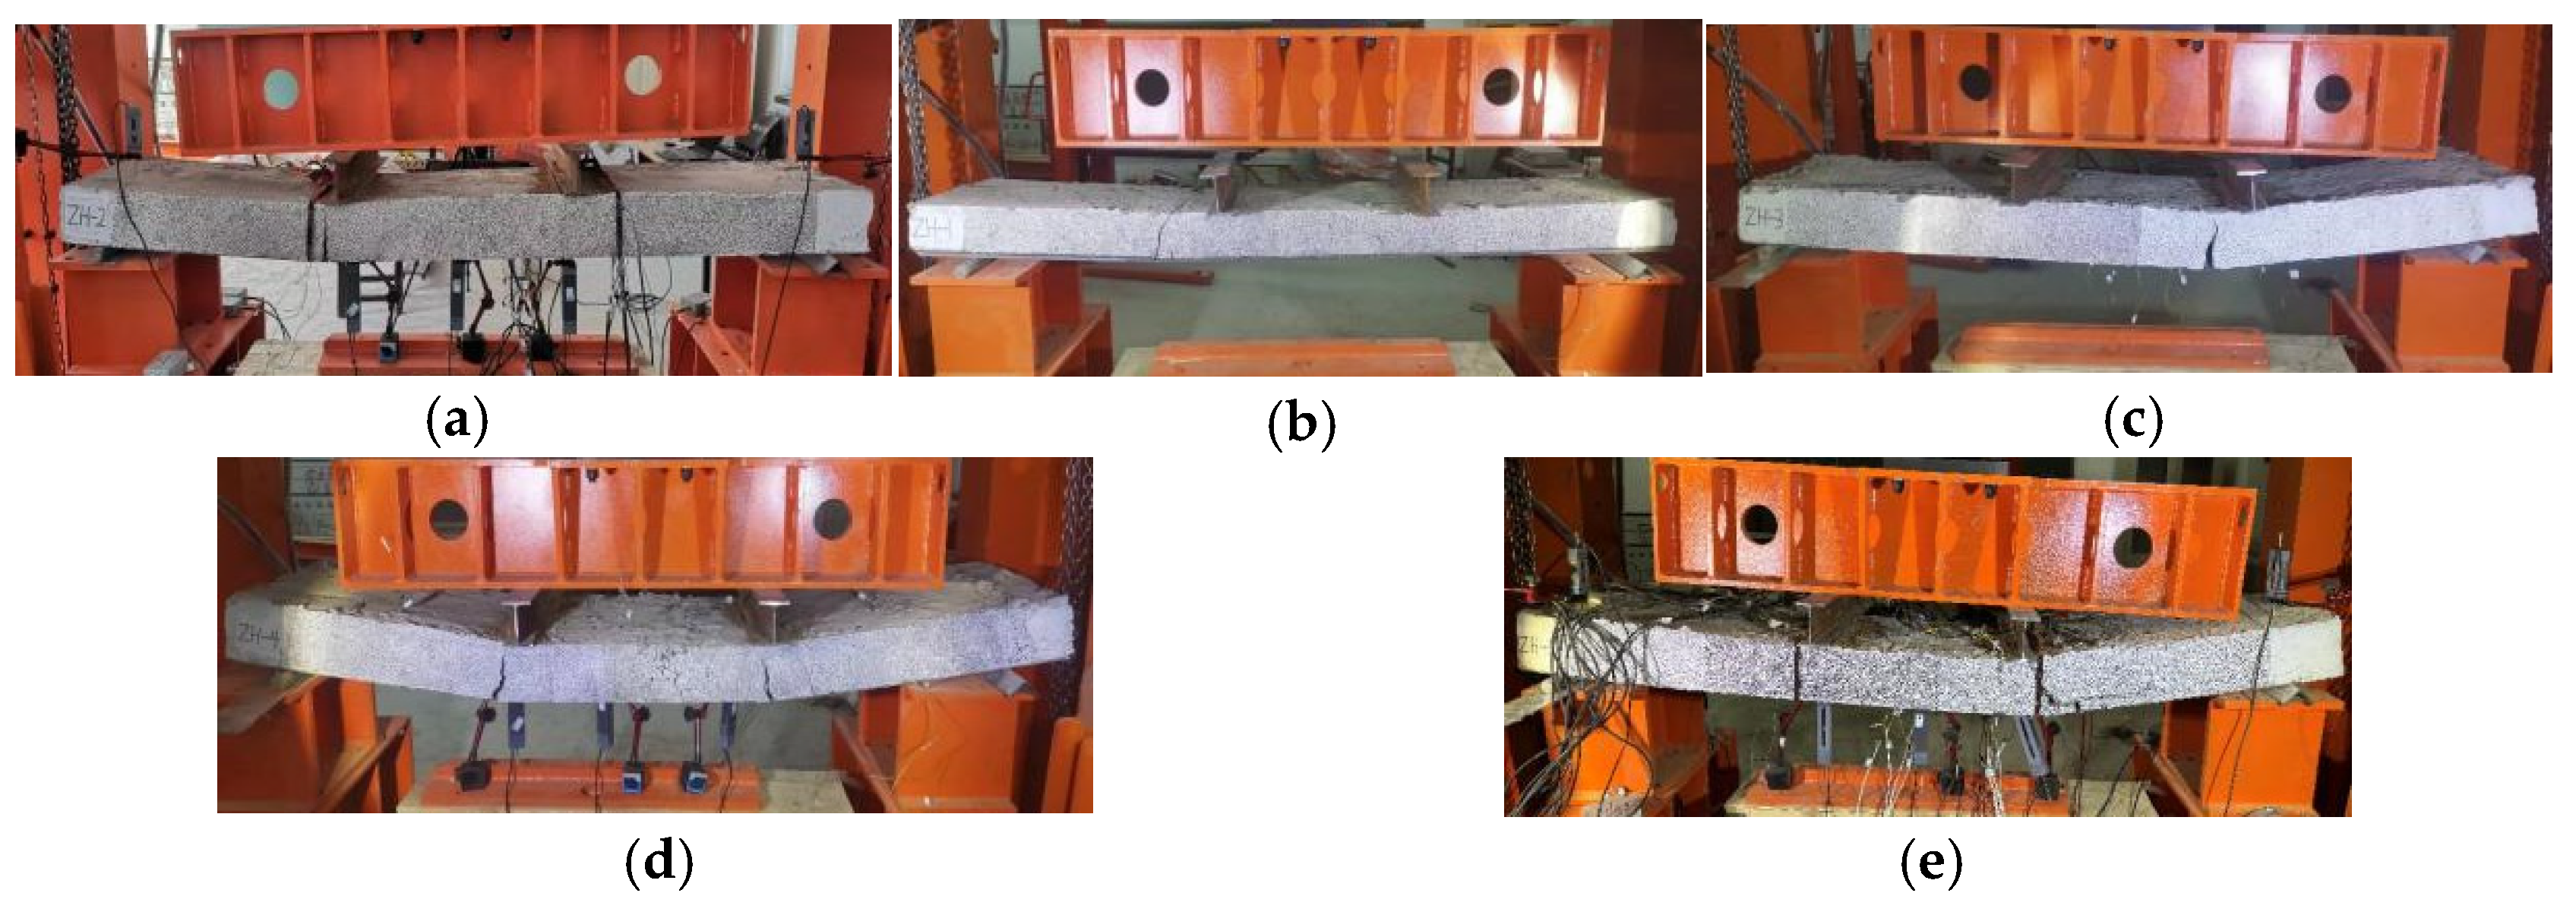
3.1. Test Phenomena

During the loading process, the five pieces of specimens maintained a relatively large initial composite floor slab end without slips, and the bonding state between the profiled steel sheet and concrete was good, with no sound or cracks produced. At this time, the components were in the elastic stage. The stiffness and cracking load values of the composite floor slabs are relatively high. We continue to load until the elasto-plastic stage; specimens ZH-1 and ZH-2 showed obvious inflection points in the curve during the loading process due to the low anchorage degree of the profiled steel sheet, and the contact surface between the profiled steel sheet and the concrete separated vertically. The load continues to rise, and the end of the slab began to slip. The profiled steel sheet and concrete are further debonding, causing cracks in the concrete. The concrete near the tensile zone failed, and the composite slab suffered a brittle failure. Due to the good bonding between the profiled steel sheet and concrete inside the composite floor slab, specimen ZH-3 suffered a ductile failure. For the specimens ZH-1, ZH-2, and ZH-3 without reinforcement arrangement, during the entire loading process, cracks only appeared near one loading point at one side and eventually formed the main crack. Tensile reinforcement was installed inside the concrete of specimens ZH-4 and ZH-5, causing significant slips between the profiled steel sheet and the concrete; the concrete immediately cracked and the tensile reinforcement began to work, leading to a ductile failure of the composite slab. The failure figures of each specimen are shown in Figure 8.

3.2. Analysis of Test Results
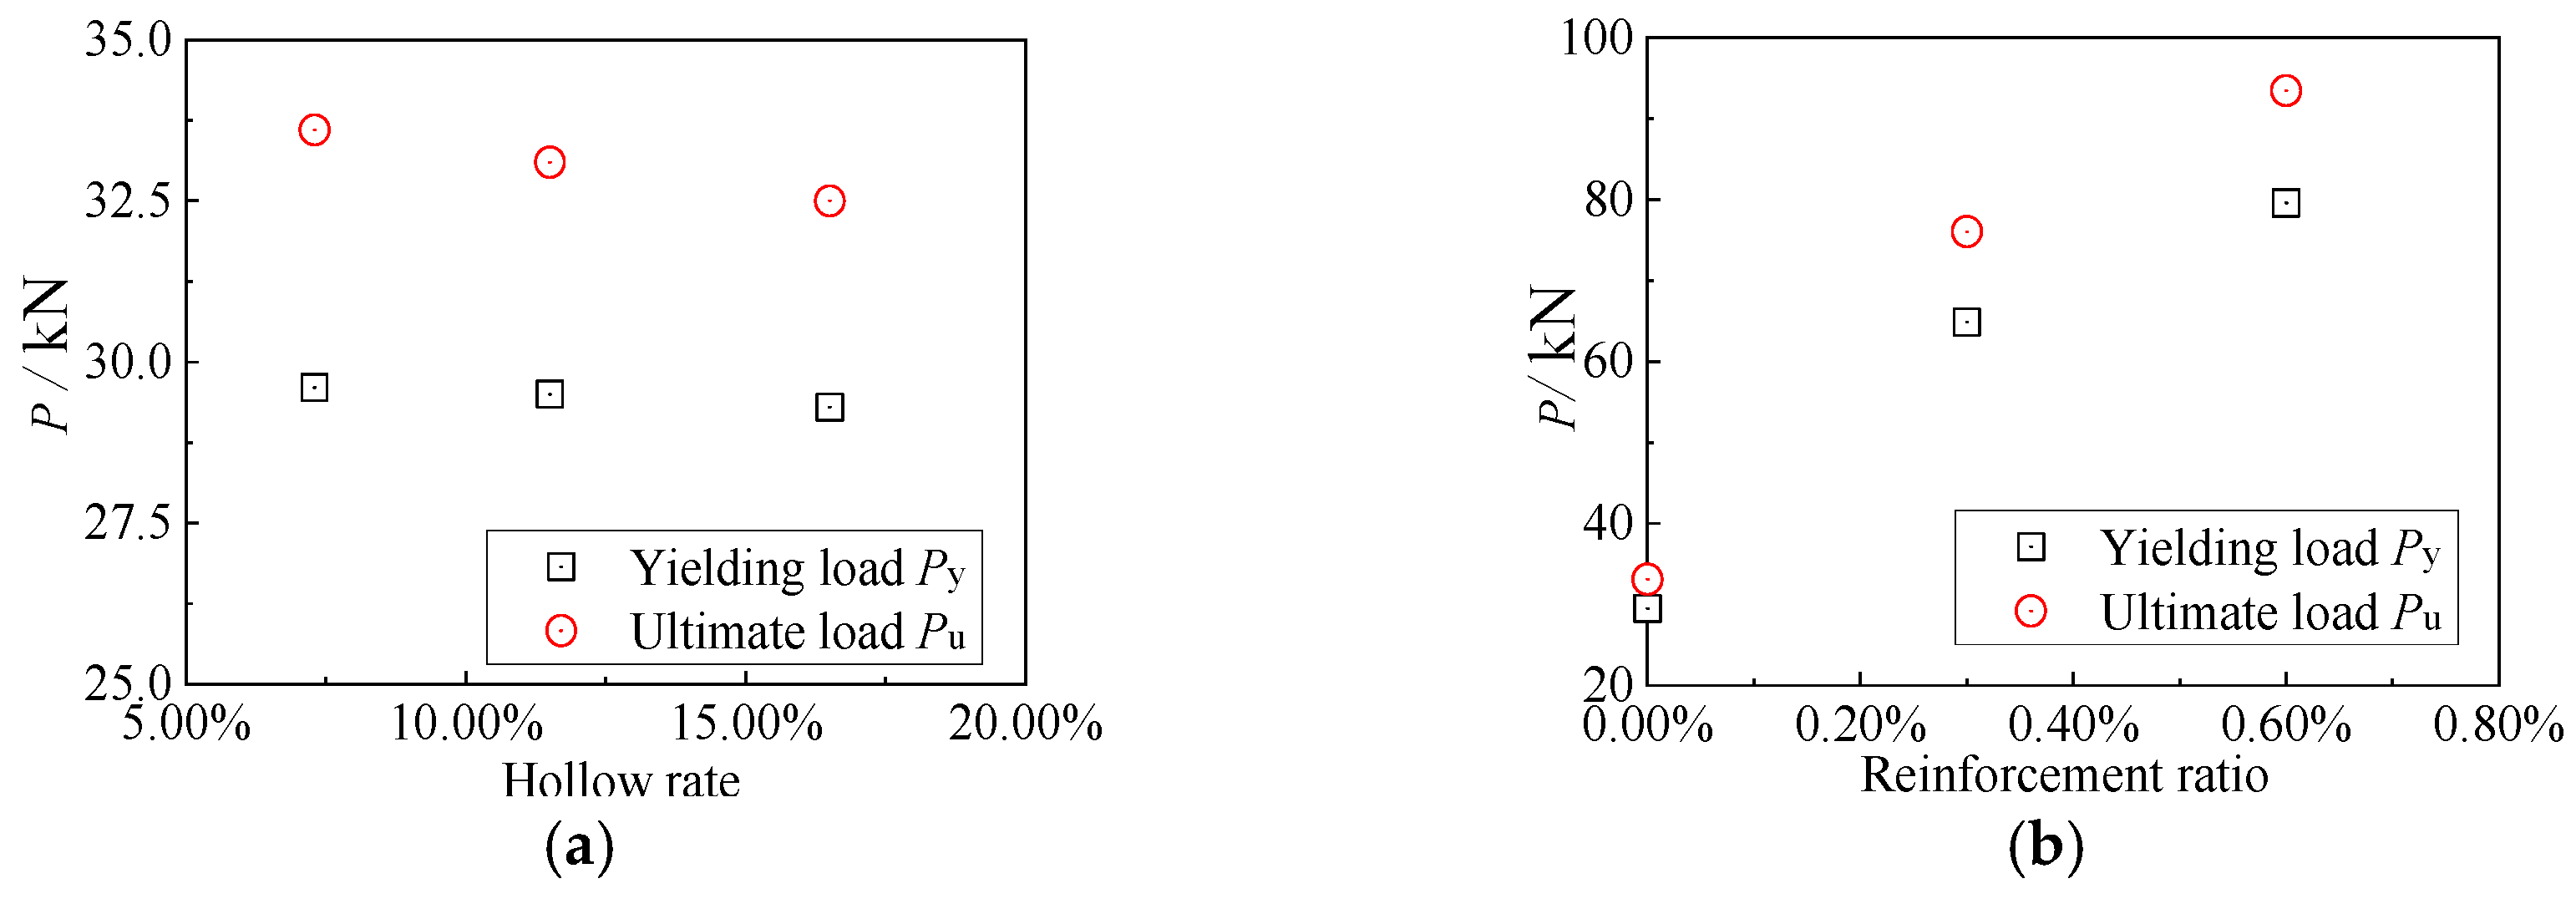
The load–deflection curve is shown in Figure 9. From the test results of all specimens in this study, it can be seen that the anchoring effect has a significant impact on the bearing capacity and other flexural mechanical properties of the specimens. During the test, it was found that the anchoring effect of ZH3 was much better than that of ZH-1 and ZH-2. The possible reasons may be related to the vertical degree of the rivets in the specimens (if the rivets are tilted during the concrete pouring process, the anchoring effect is weaker than when completely vertical) and the connection degree between the rivet head and the profiled steel sheet. At the same time, whether the concrete near the rivets is densely compacted also affects the anchoring effect [18].
Table 4 shows the test results of the bearing capacity of the composite floor slabs, in which the cracking load is P c r , the yielding load is P y (define the load corresponding to the yielding of the profiled steel sheet as the yielding load), the deflection corresponding to yielding load is Δ y , the ultimate load value is P u , and the deflection corresponding to ultimate load is Δ u .

3.2.1. Key Loads

Figure 10 shows the influence rules of the hollow rate and reinforcement ratio on the yielding load Py and the ultimate load Pu of the composite slab.
Test specimens ZH-1, ZH-2, and ZH-3 are composite floor slabs with hollow rates of 11.5%, 7.3%, and 16.5%, respectively. As we can see from Figure 10, the hollow rate increases from 7.3% to 16.5%, and the cracking load, yielding load, and ultimate load of the composite floor slabs reduce by 4.2%, 1.0%, and 3.3%, respectively. The increase in hollow rate has a relatively small influence on the bearing capacity of the composite floor slabs, because the hollow rate of the concrete in composite floor slabs is not large, and it has a relatively small influence on the height of the compression zone of the slab. Test specimens ZH-1, ZH-4, and ZH-5 are the composite floor slabs with reinforcement ratios of 0%, 0.3%, and 0.6%, respectively. The reinforcement ratio increases from 0% to 0.6%, and the cracking load, yielding load, and ultimate load of the composite floor slab increase by 105.7%, 169.8%, and 182.5%, respectively. We can see that the composite floor slabs with reinforcement arrangement have a significant improvement in flexural bearing capacity compared to the composite floor slabs without reinforcement arrangement. As the load increases, the deformation of the external profiled steel sheet increases, the concrete within the composite slab enters the cracking stage, the longitudinal reinforcement in the slab is subjected to tension, and the tensile strain in the reinforcement undergoes a sudden change. Over time, the longitudinal reinforcement enters the yield stage, and the tensile strain rapidly increases. At the final failure of the specimen, for the reinforced composite slab, in addition to the external profiled steel sheet, the reinforcement within the slab also bears the external load, thus significantly increasing the load-carrying capacity of the specimen. Unlike ordinary reinforced concrete components, the deformation of the reinforcement in the profiled steel sheet hollow slab composite structure is always less than the deformation of the profiled steel sheet. After the concrete in the compression zone fails, the composite slab enters a “post-peak” behavior stage. At this point, the additional load required for further deformation of the component is mainly borne by the tensile deformation of the tension reinforcement and the plastic tensile deformation of the external profiled steel sheet. The reinforcement plays a primary tensile role to improve the mechanical properties of the component.
When the composite slab reaches its ultimate load-carrying capacity, the profiled steel sheet in the mid-span region of the pure bending section yields, while the remaining parts of the steel sheet generally do not yield. The extent of the yielding section is closely related to the anchoring degree of the steel sheet. Generally, the higher the anchoring degree, the larger the yielding range.

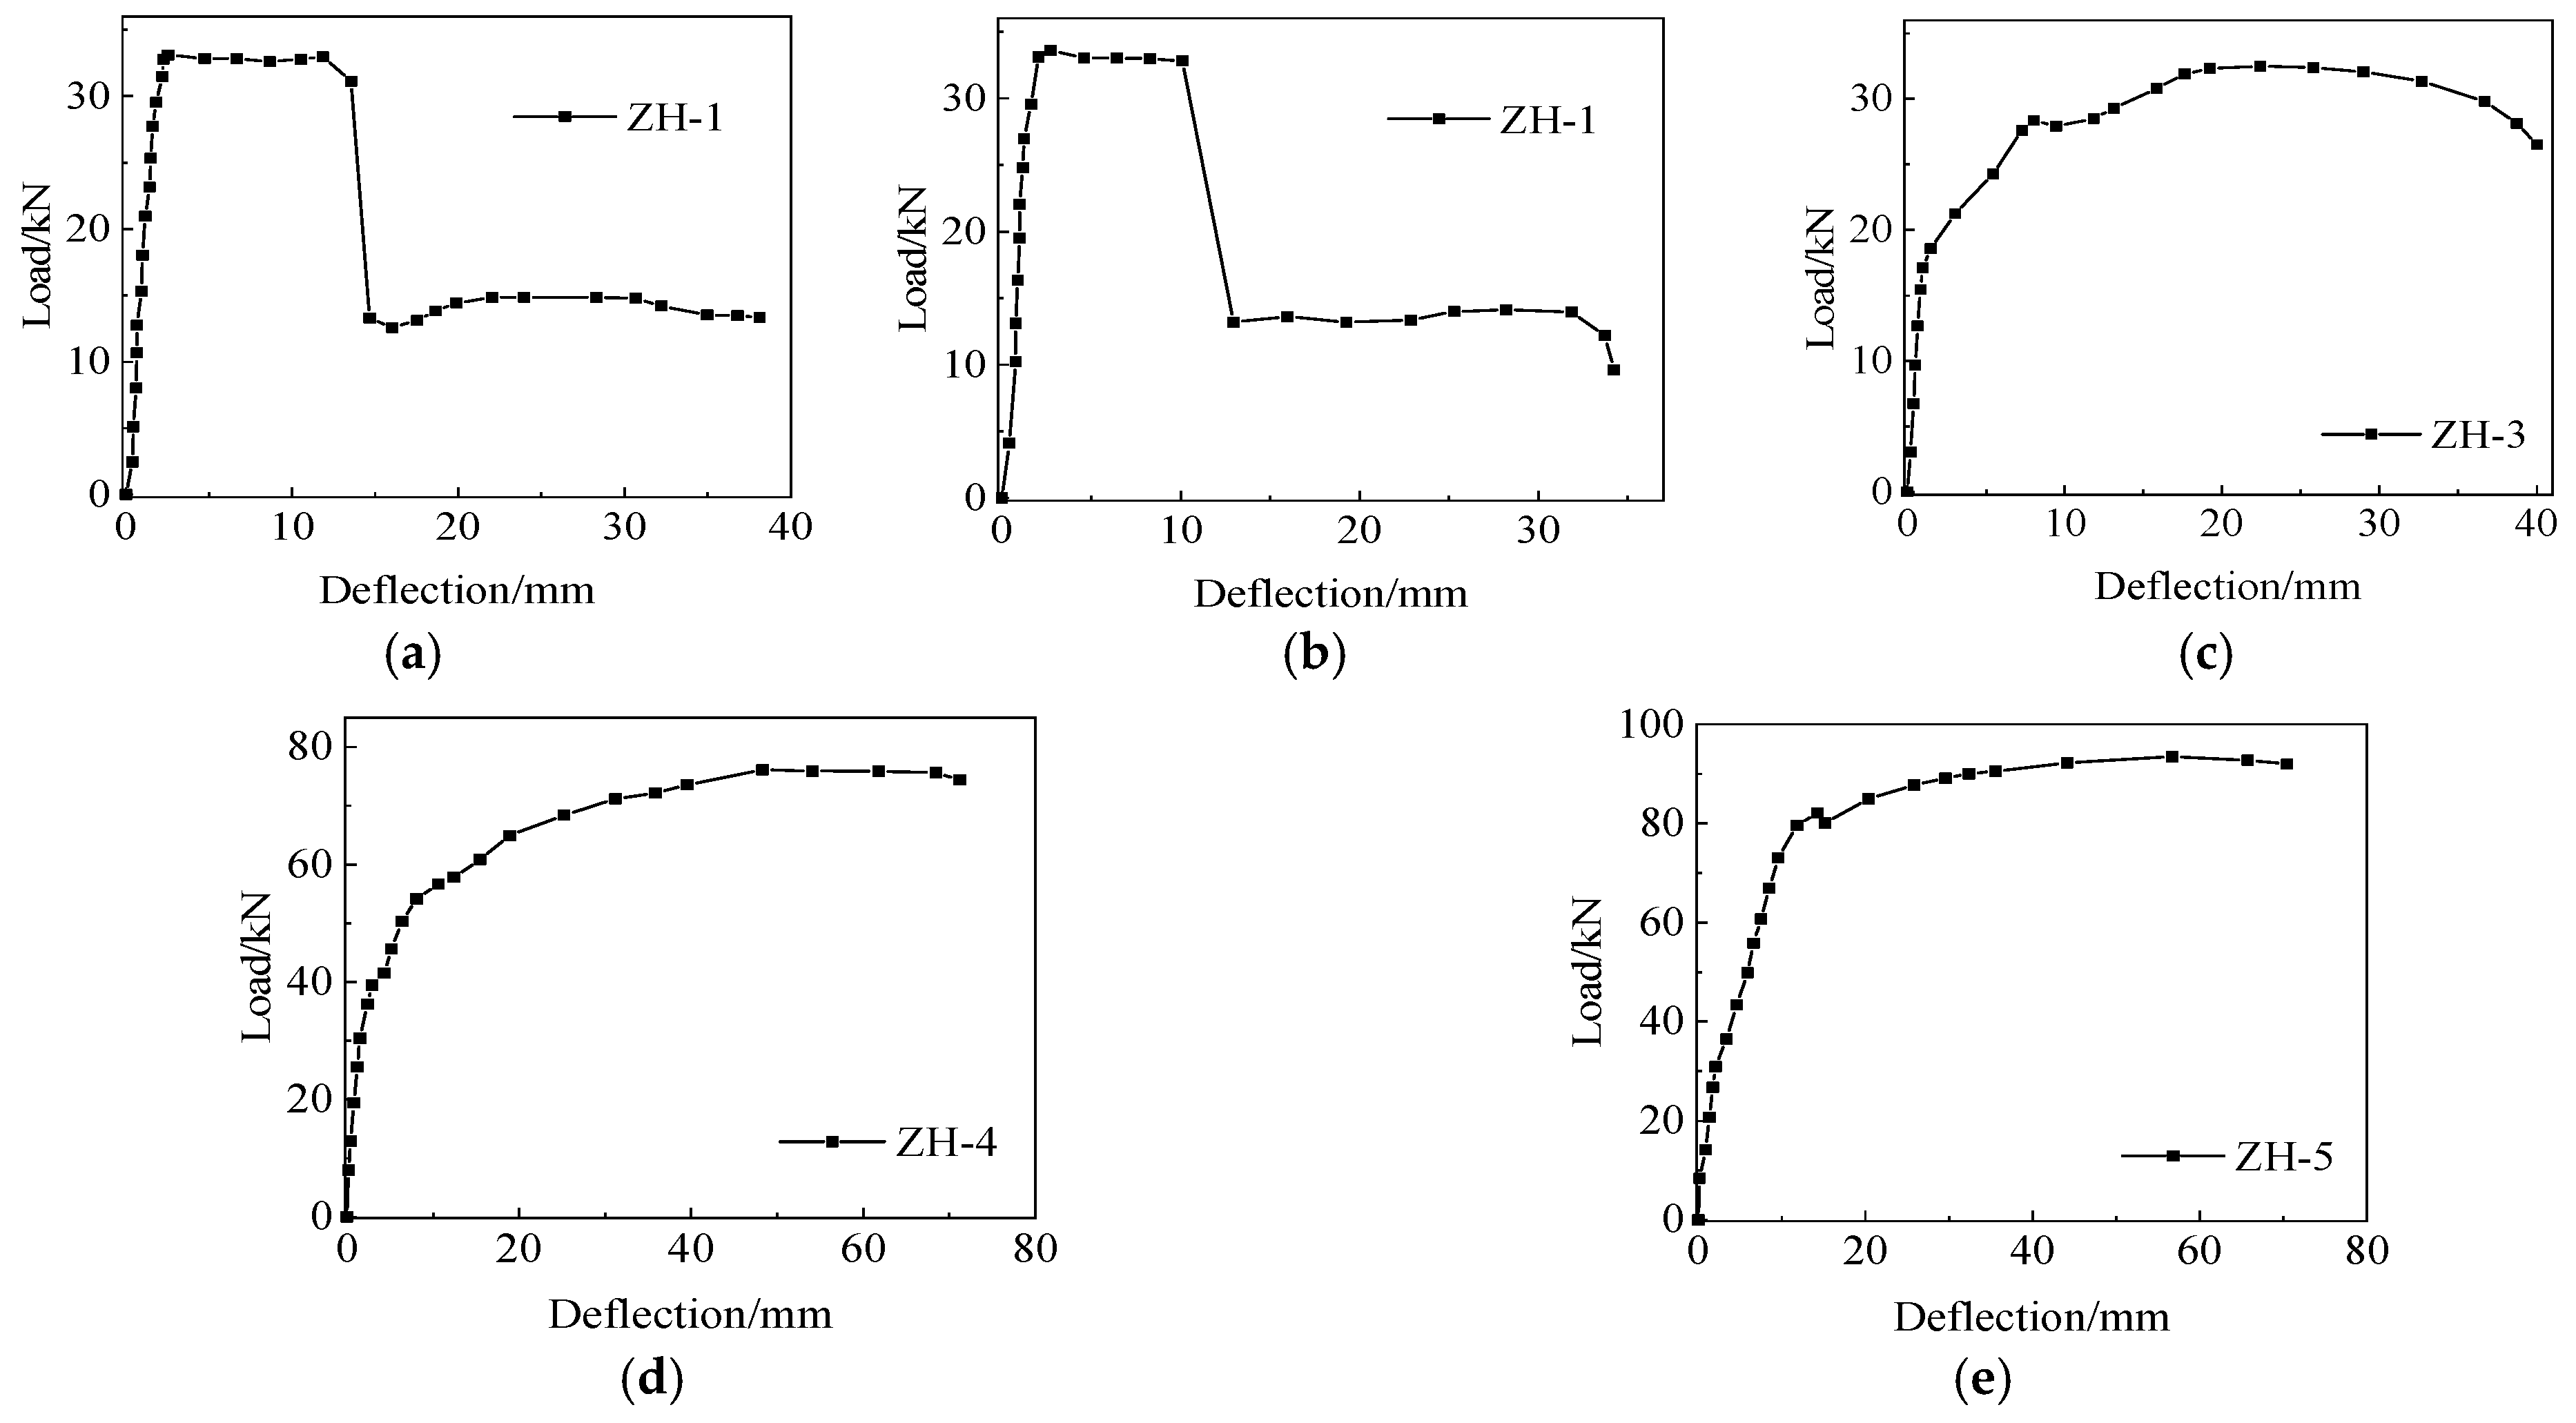
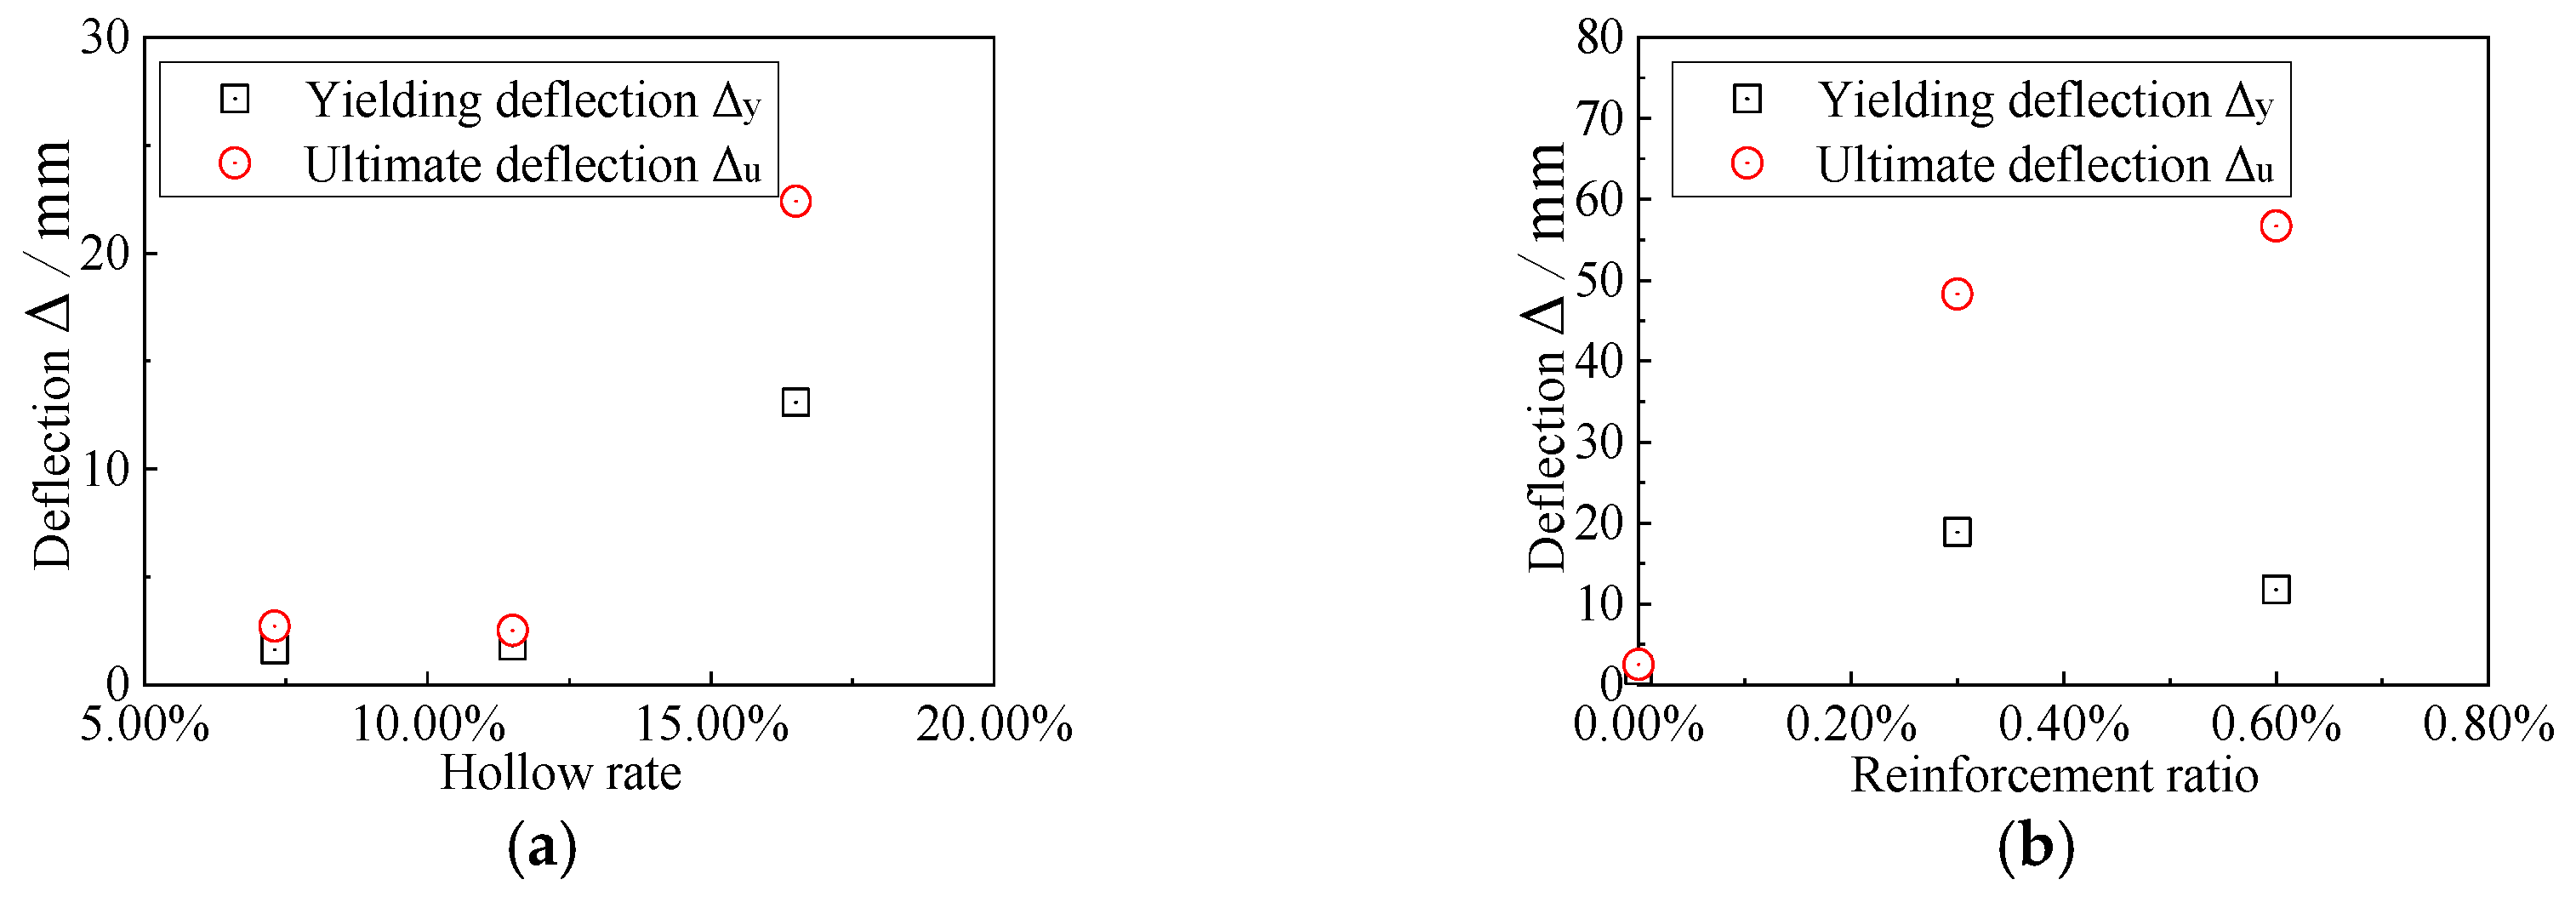
3.2.2. Mid-Span Deflection

Figure 11 shows the influence rules of the hollow rate and reinforcement ratio on the yielding deflection and ultimate deflection of the composite slabs.
Figure 11a indicates that the hollow rate increases from 7.3% to 16.5%; the yielding deflection and ultimate deflection of the composite floor slab show an increasing trend with the increase in the hollow rate and are closely related to the bonding degree. It can be concluded from Figure 11b that, with the increase in reinforcement ratio, the ultimate deflection significantly increases. The ultimate deflection of the specimen with a reinforcement ratio of 0.6% is 22.4 times that of the specimen without reinforcement arrangement, and Δ u reaches 56.7 mm.

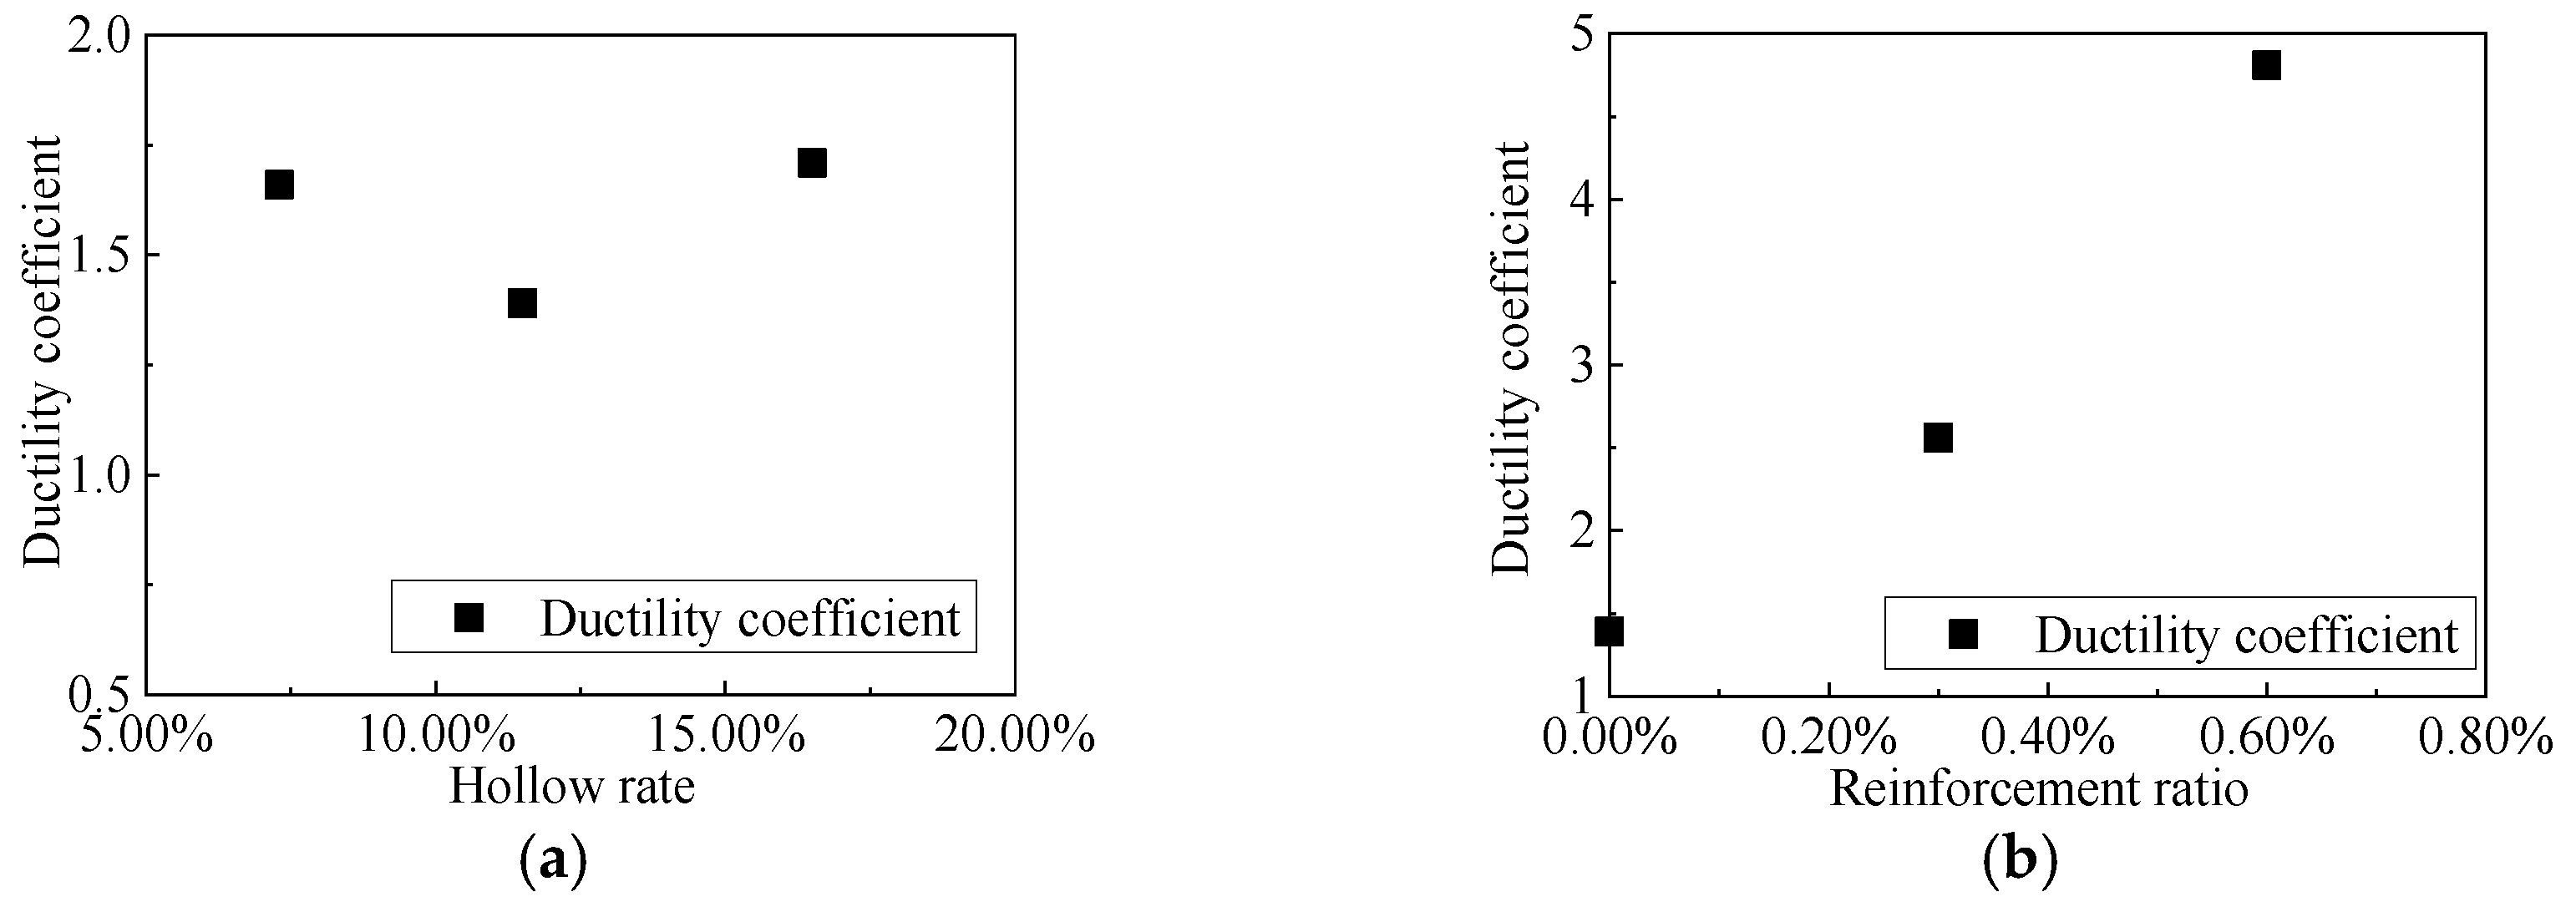
3.2.3. Ductility Coefficient

Figure 12 shows the influence rules of the hollow rate and reinforcement ratio on the ductility coefficient of the composite slabs.
It can be observed from Figure 12 that, when the hollow rate is less than 20%, the effect of hollow rate on ductility coefficient is relatively small. The reinforcement ratio of the composite floor slab increases from 0% to 0.6%, and the ductility coefficient is increased by 246.0%. The ductility coefficient of the composite floor slabs with reinforcement arrangement is significantly improved compared to those without reinforcement arrangement. This is because when the concrete in the composite slab is under tension, the reinforcement bears some of the tensions, reduces the stress on the concrete, and delays cracking; thus, the structure can maintain better stiffness and ductility during normal use.

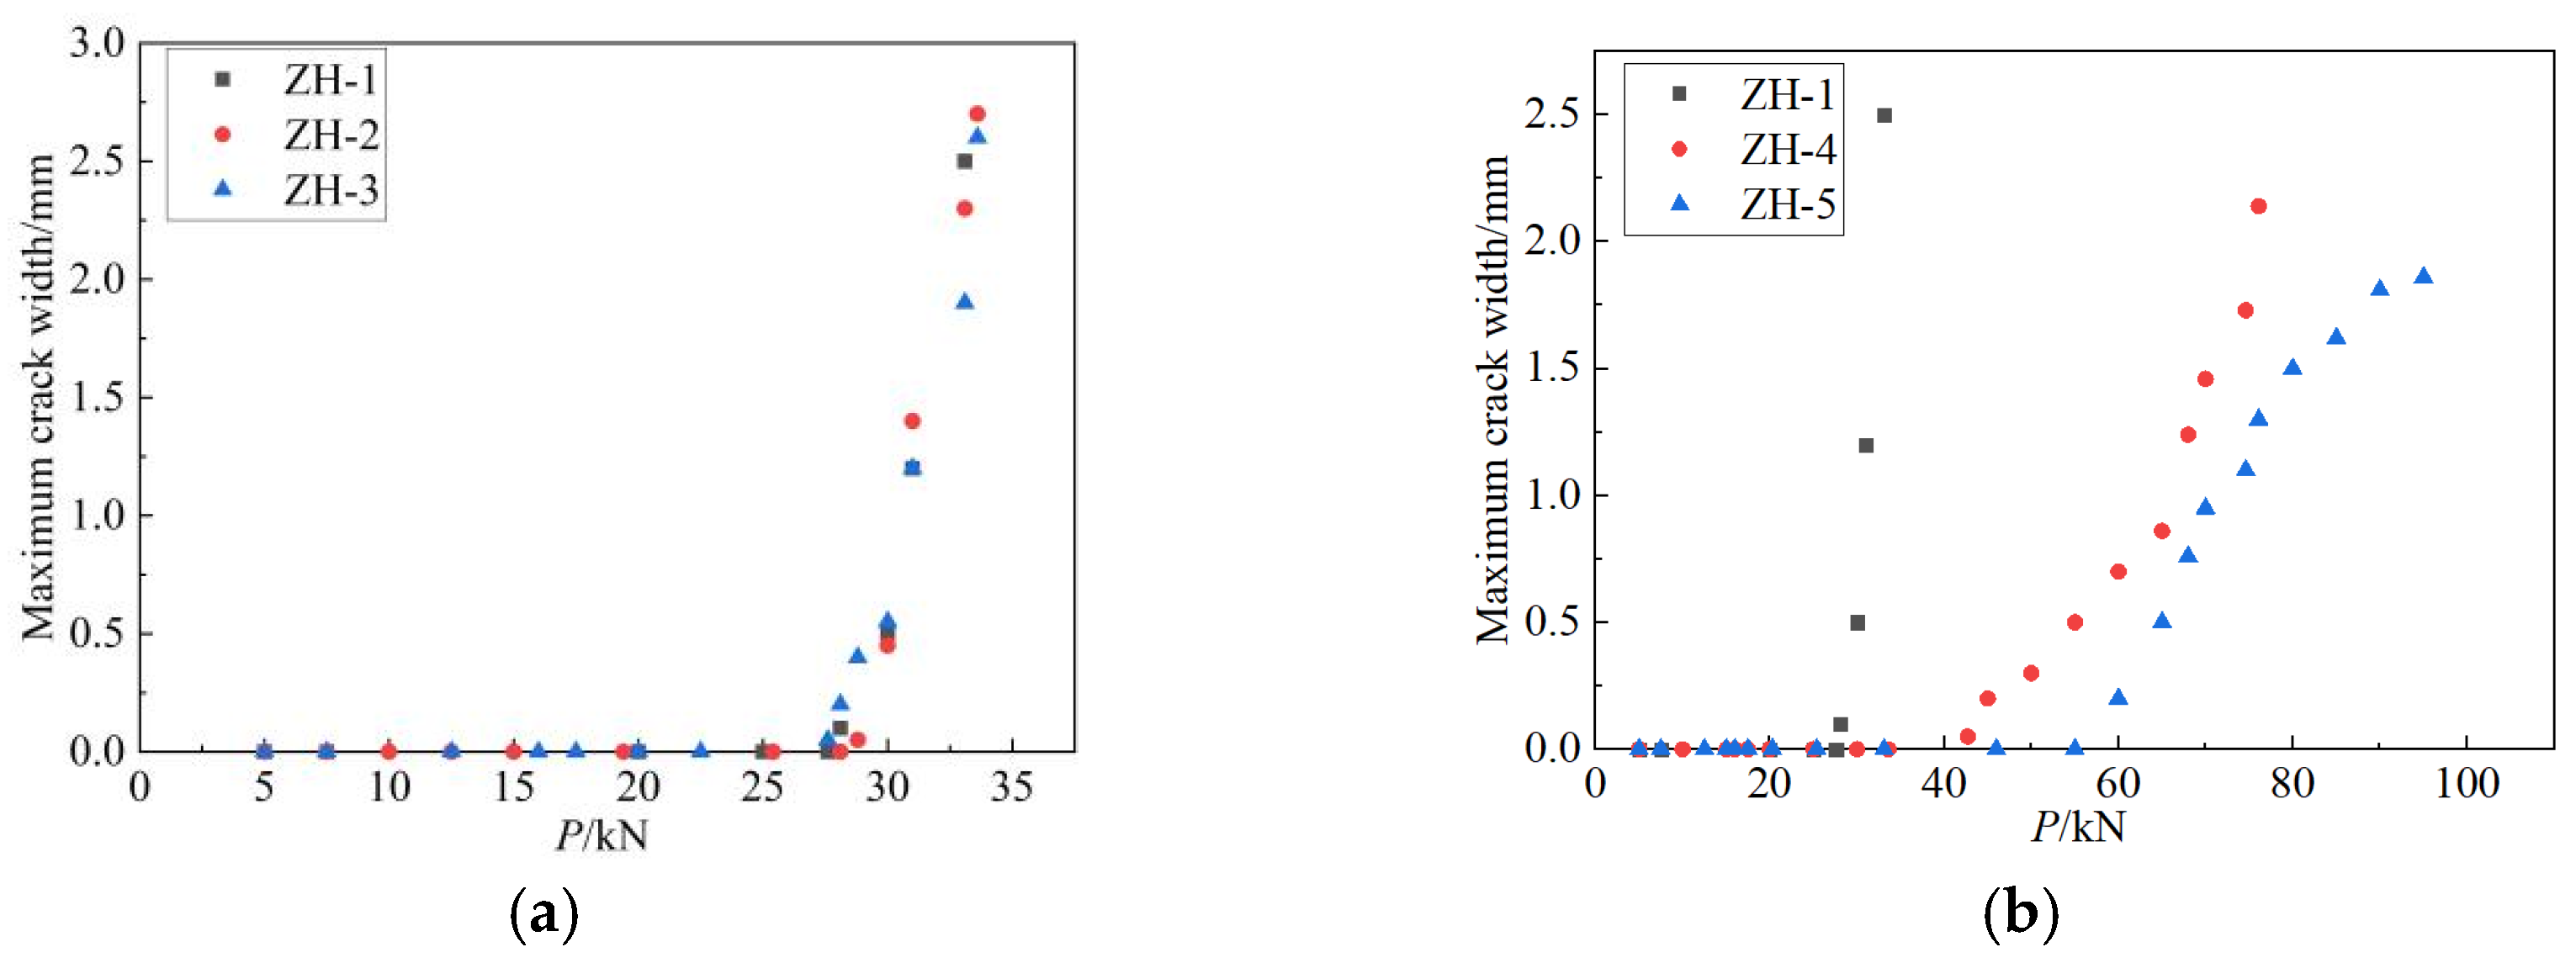
3.2.4. Crack Analysis

Figure 13 shows the influence rules of the hollow rate and reinforcement ratio on the maximum crack width of the composite slabs.
Based on the results presented in Figure 13, when the hollow rate is less than 20%, the effect of the hollow rate on the maximum crack width is relatively small. The maximum crack width decreased by 25.6% when the reinforcement ratio of the composite floor slabs increased from 0% to 0.6%. The composite floor slab with reinforcement arrangement has a significant impact on crack width, as the reinforcement arrangement can effectively limit the development of cracks.

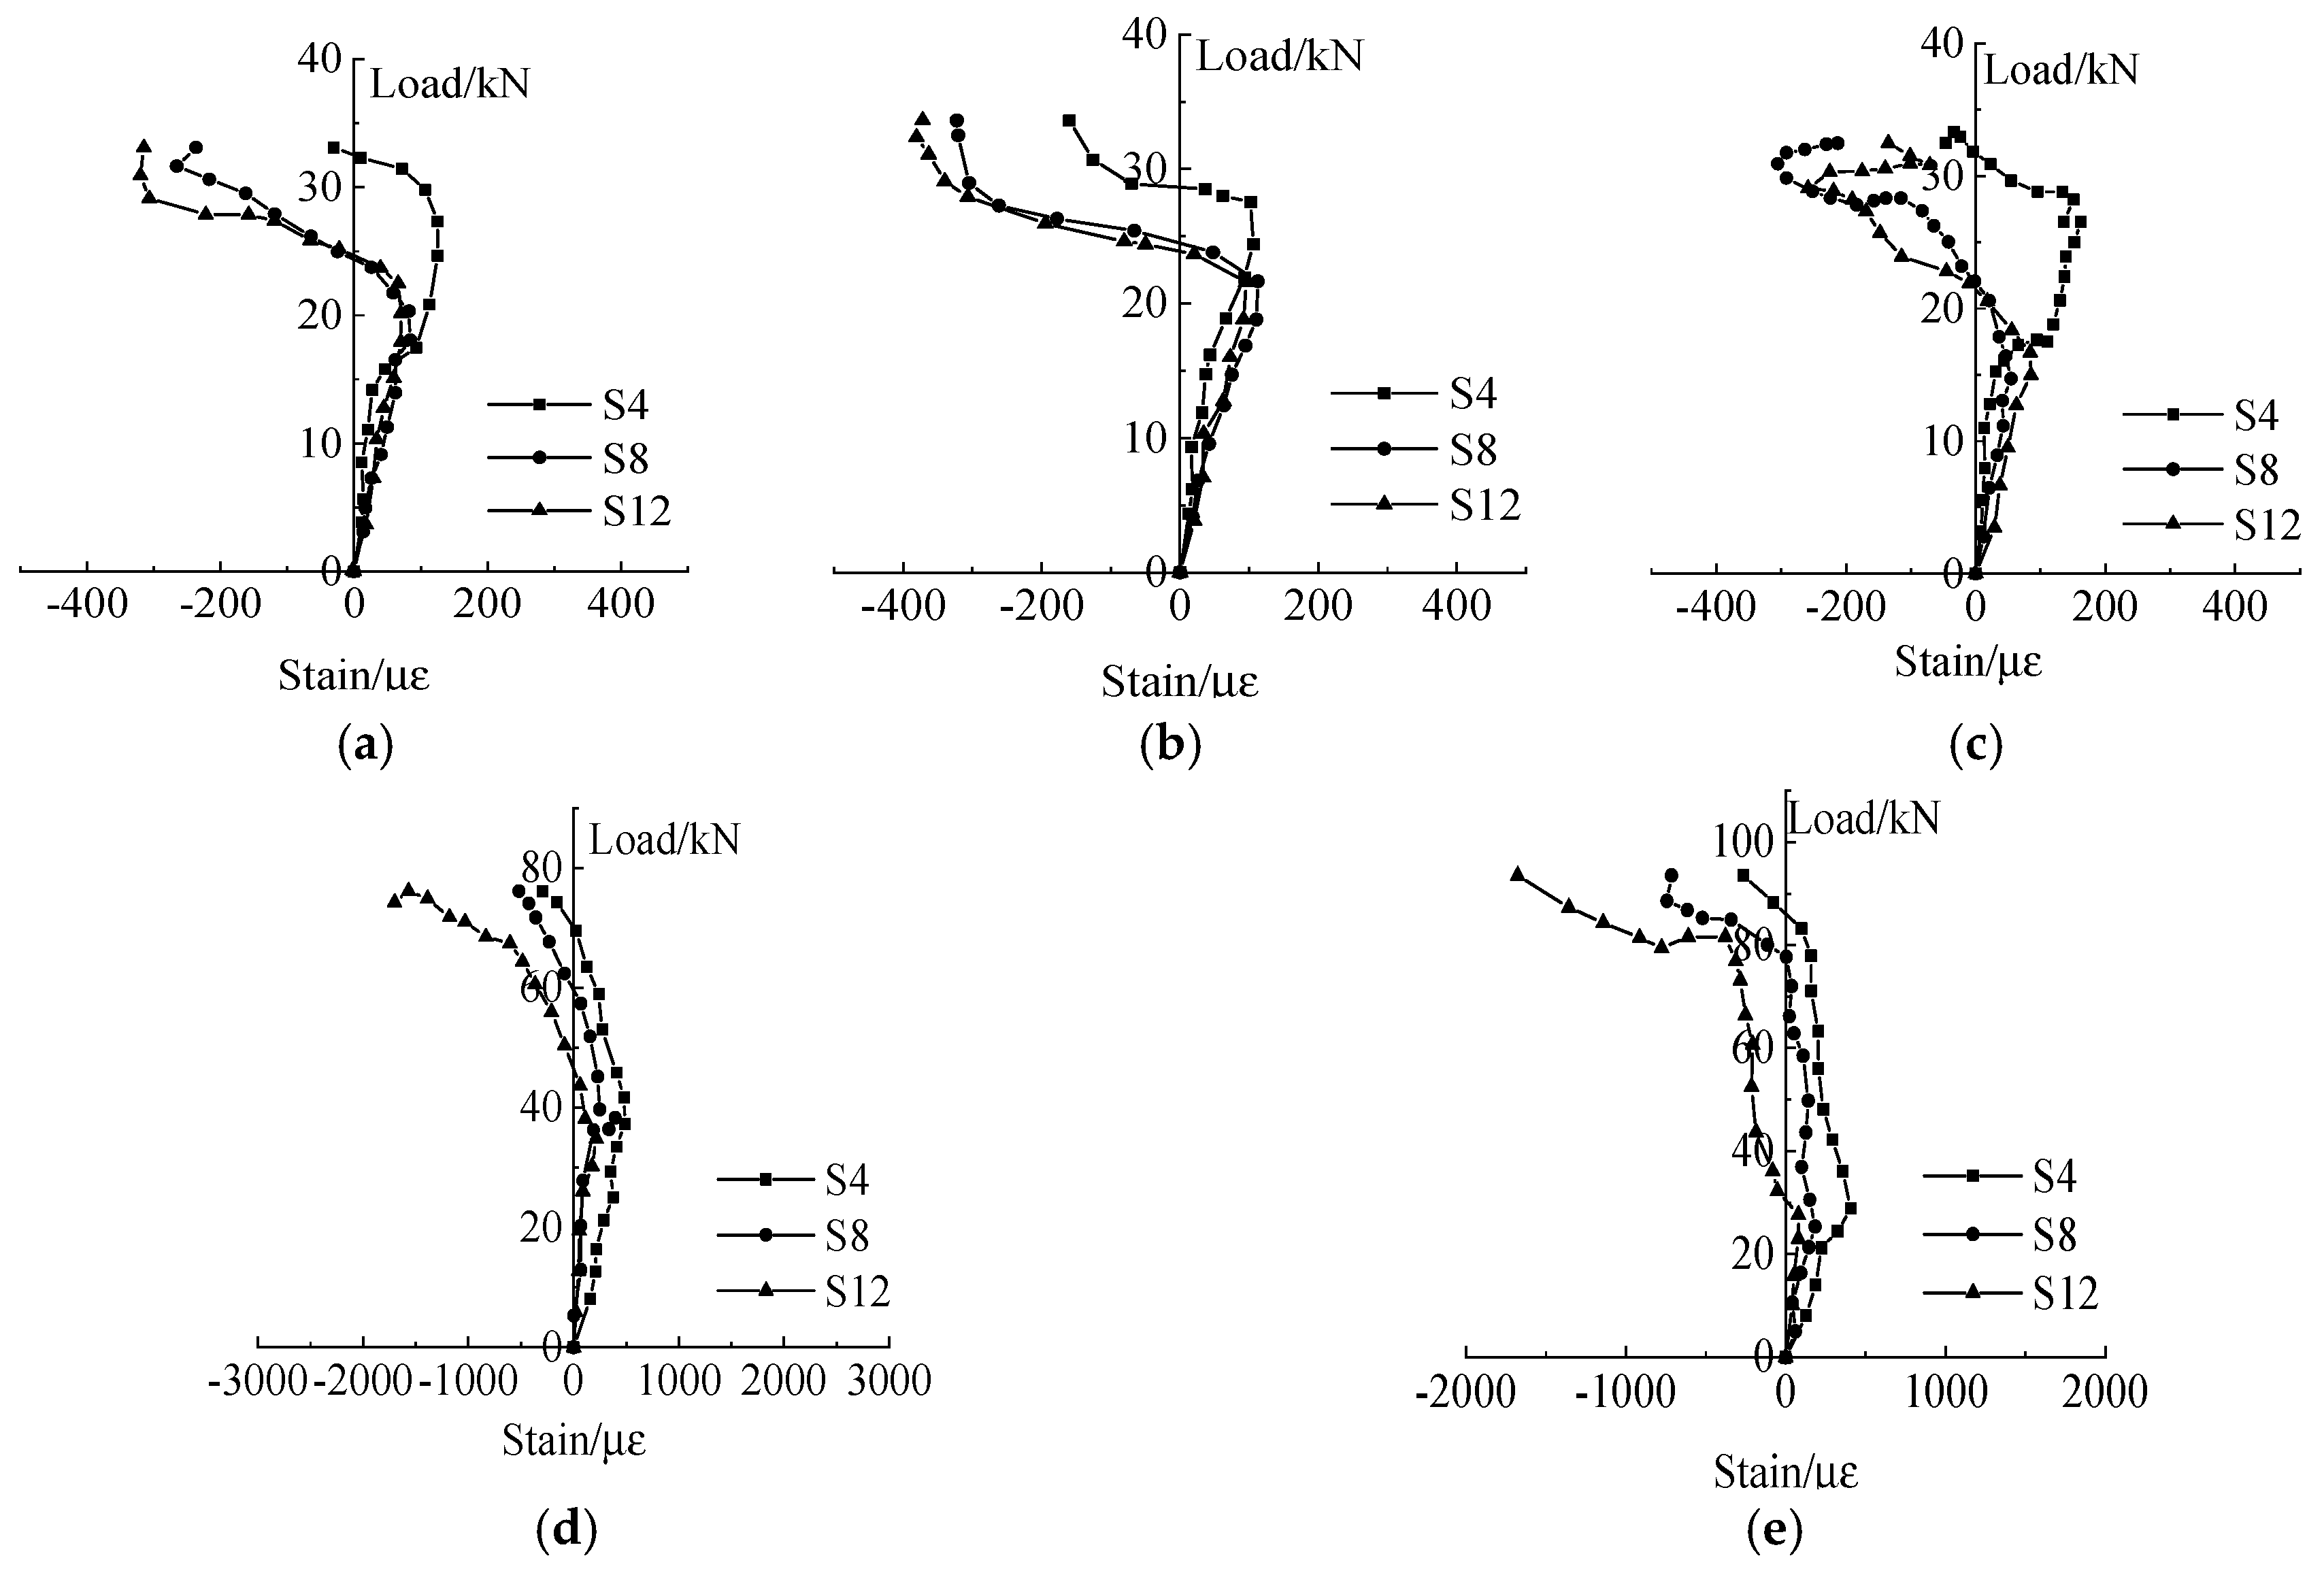
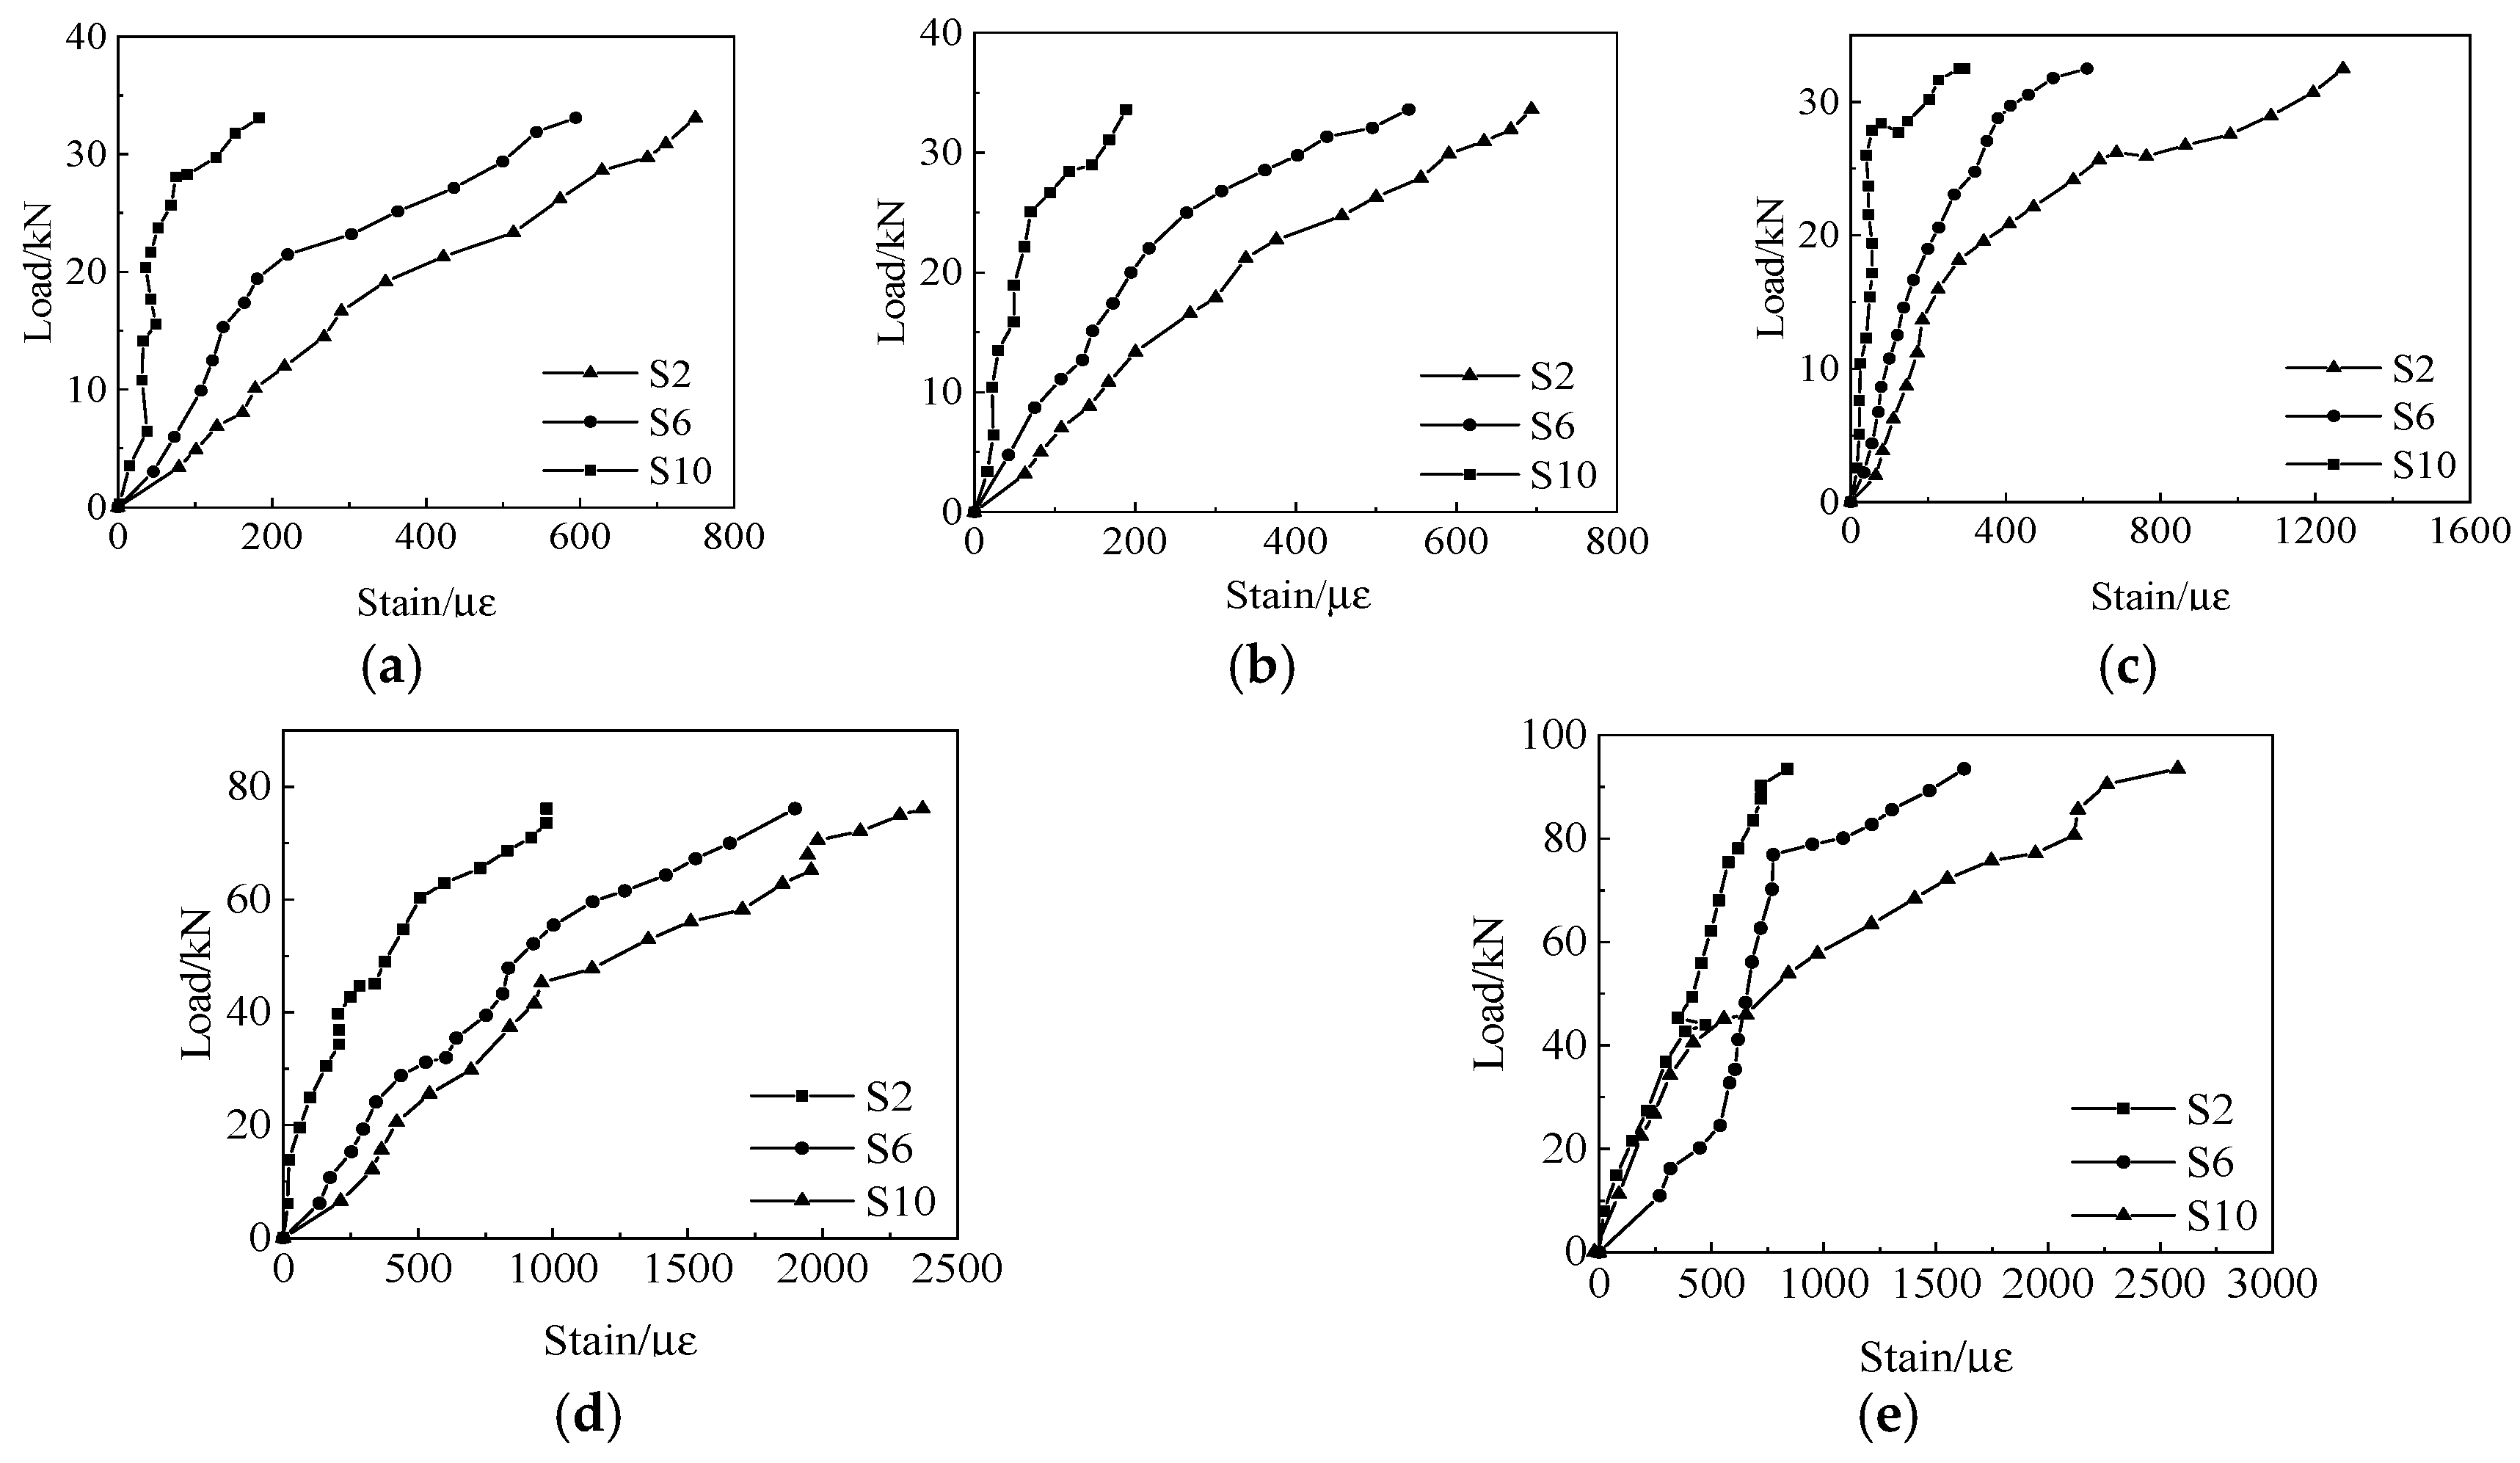
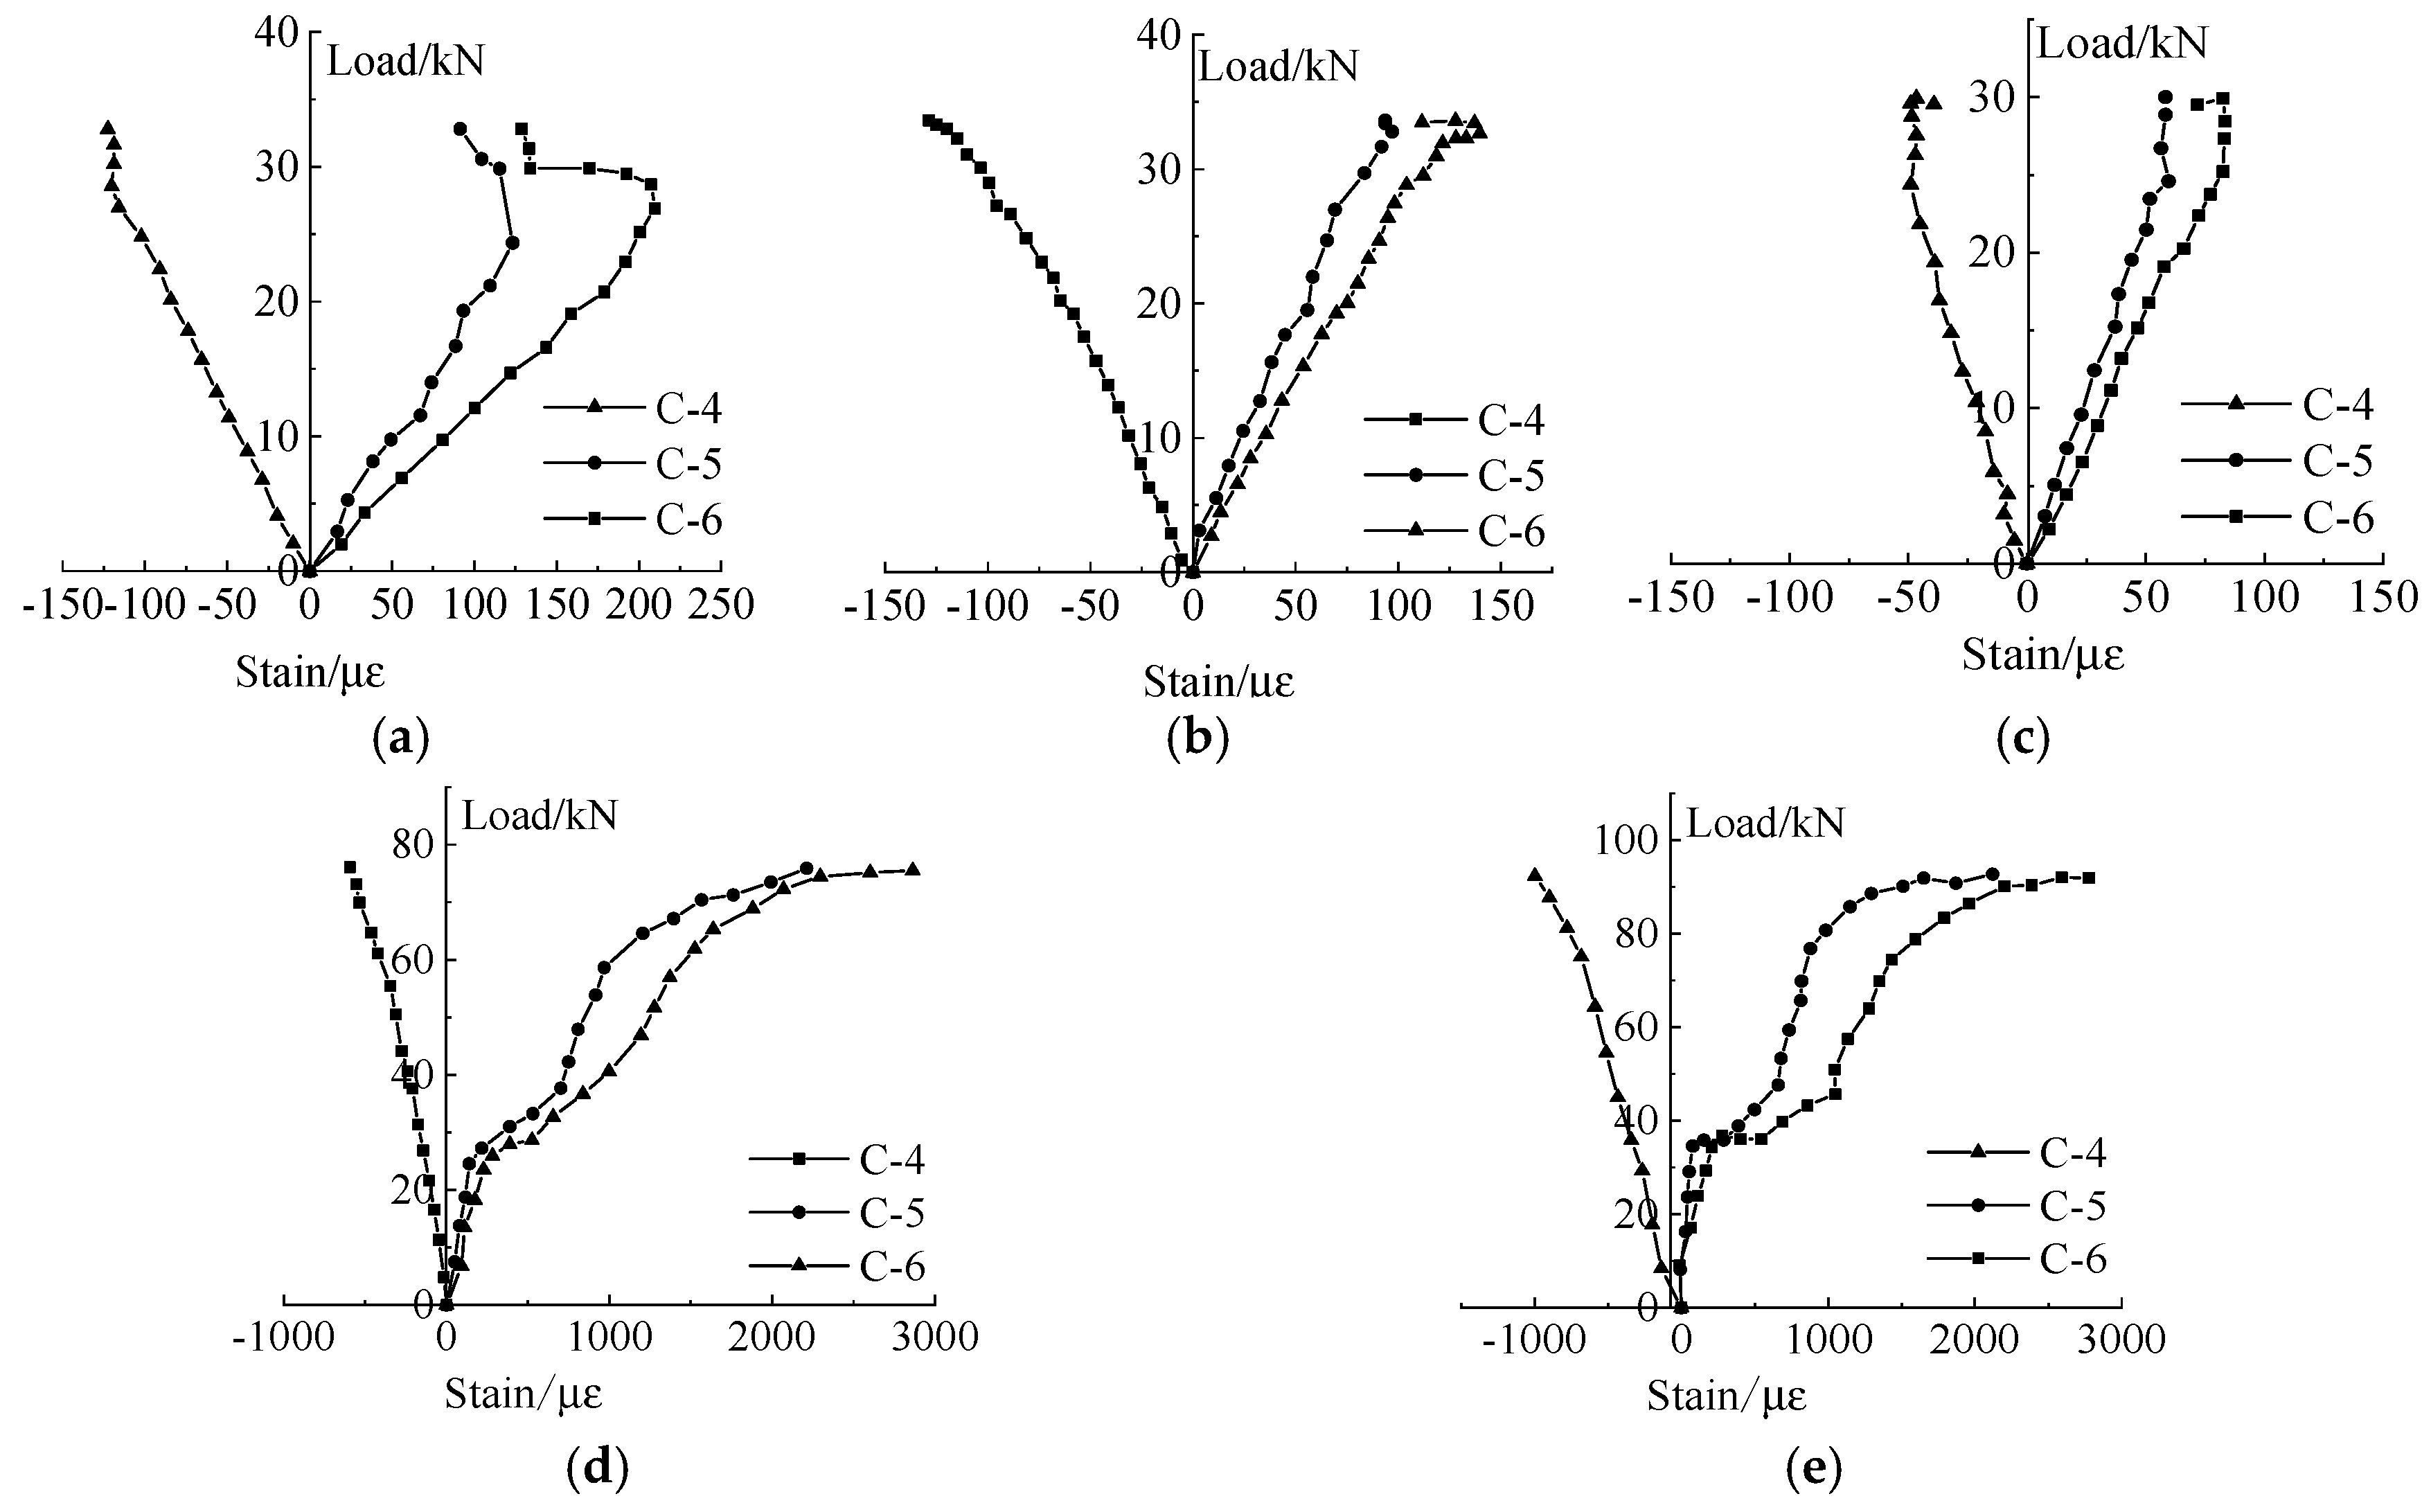
3.2.5. Key Position Strain Analysis

Figure 14 and Figure 15 show the load−strain curves of the upper and lower flanges of the profiled steel sheet, respectively.
It can be concluded from Figure 14 and Figure 15 that the upper flanges of the five pieces of the specimens’ profiled steel sheets have all transitioned from a tensile state to a compressive state without yielding. When the specimens ZH-1, ZH-2, and ZH-3 reach the ultimate bearing capacity, we can only see the lower flange yielding at the profiled steel sheet loading point of the specimen ZH-3. The reason is that the profiled steel sheet and concrete in the specimens ZH-1 and ZH-2 without the reinforcement arrangement suffer significant slips, and the profiled steel sheet cannot fully play its tensile role. Once cracks appear in the upper concrete slab, it will quickly fail; the anchorage force of the profiled steel sheet in specimen ZH-3 is relatively good, the specimen suffers a ductile failure, and the lower flange of the profiled steel sheet plays a certain tensile role. The lower flanges of the profiled steel sheets of specimens ZH-4 and ZH-5 yield at the mid span and one loading point, due to the good ductility by the specimens with reinforcement arrangement, and the profiled steel sheets can continue to show the tensile strength. On the same section, the strain on the lower flange is the largest, followed by the web plate, and the strain on the upper flange is relatively small.
Figure 16 is the load-strain curve of the concrete.
According to Figure 16, under the load of the composite floor slab, the concrete shows a characteristic of top compression and bottom tension along the height, and the strain of the specimens with reinforcement arrangement is significantly higher than that without reinforcement arrangement.

4. Finite Element Comparison

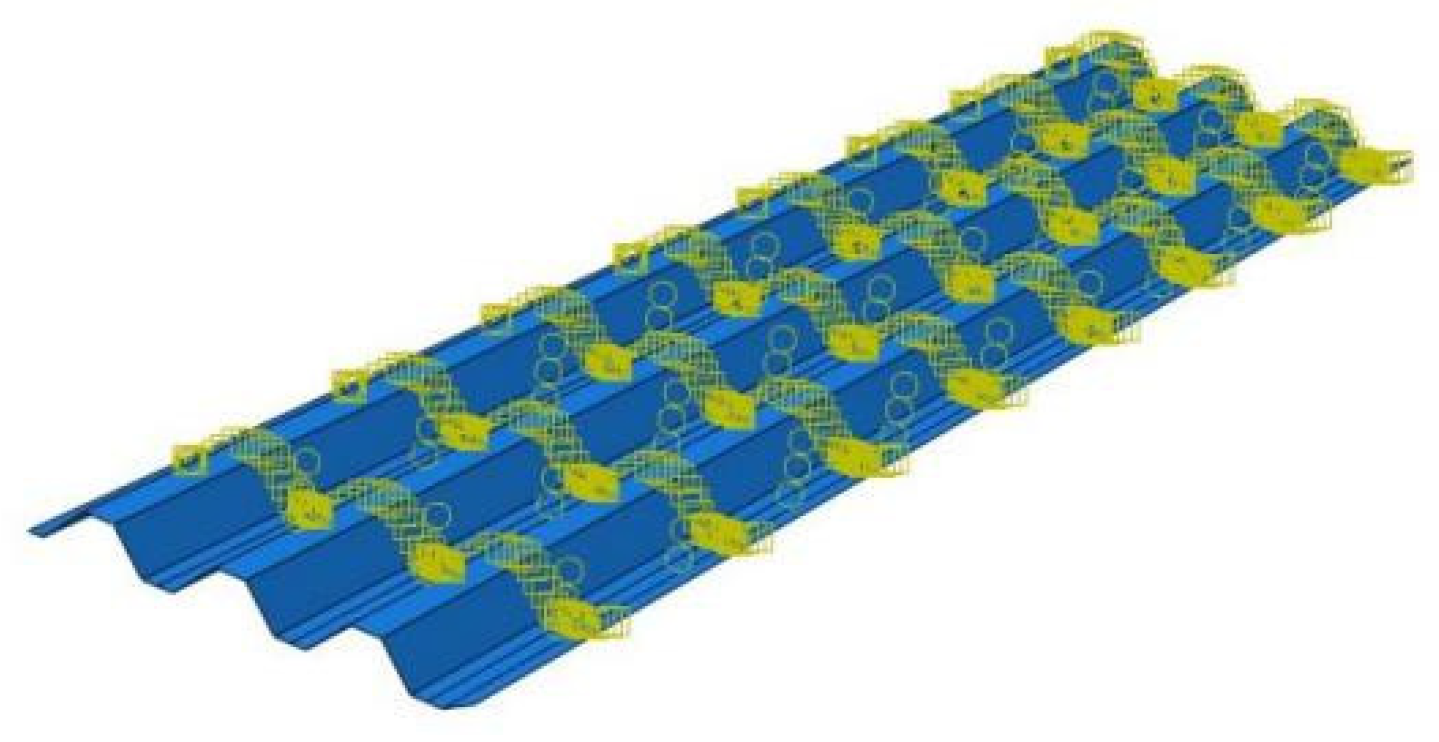
4.1. Element Selection and Mesh Generation

We used ABAQUS 2020 software to establish a finite element model of the composite slab, as shown in Figure 17. The hollow concrete slab adopts three-dimensional solid element C3D8R, the profiled steel adopts shell element S4R, the structural reinforcement adopts truss element T3D2, and the shear bolts adopt the beam element B31 for simulations. The model adopts a structured mesh generation method to appropriately densify the grid at the hollow part of the composite slab.

4.2. Contact Configurations

In order to improve the calculation efficiency and convergence of the model, Tie is used to simulate the contact between the profiled steel and concrete, assuming no relative slip between the two. In reality, welding is used between the reinforcement and profiled steel, as well as between the profiled steel and bolts. Therefore, in the modeling process, the Merge method is used to form a component. We used Embedded to simulate the contact among reinforcement, bolts, and concrete. The Tie is set between the loading and support pads and the composite slab, as shown in Figure 18.

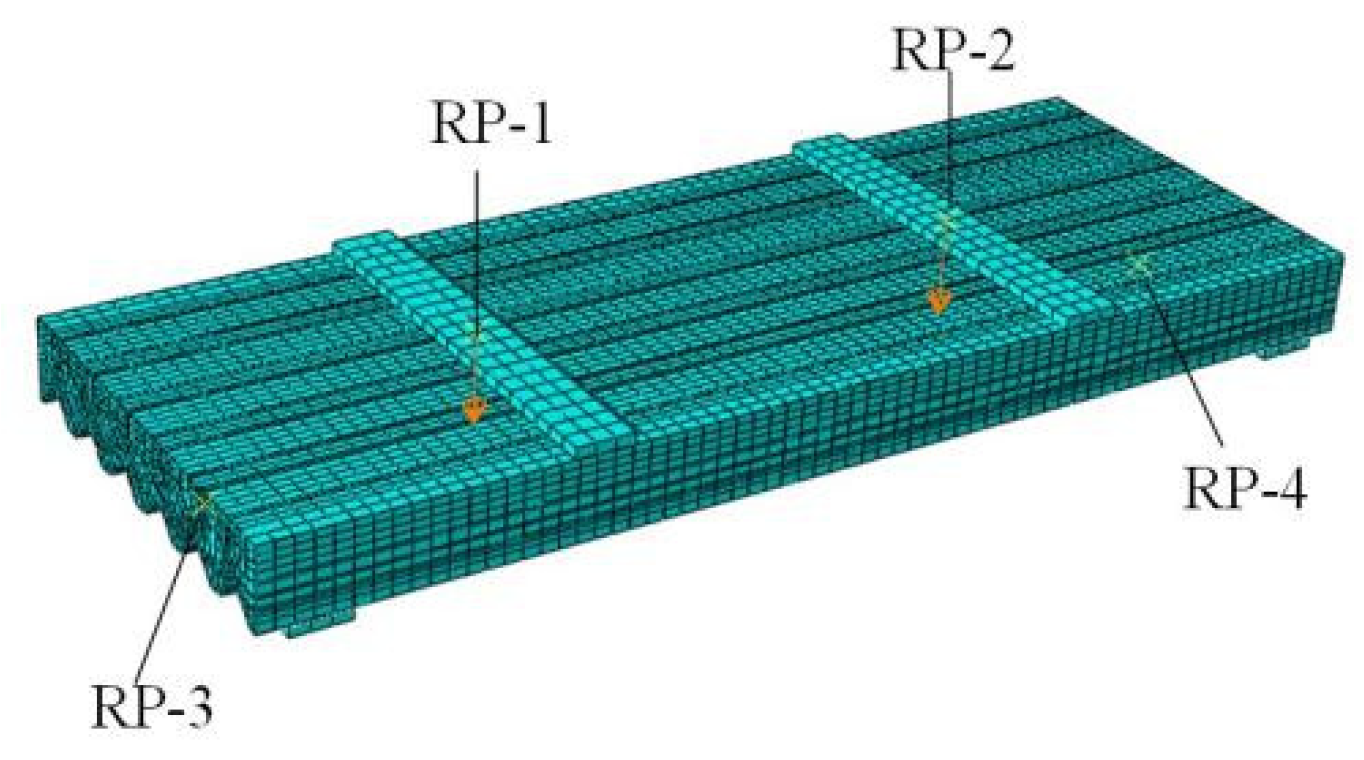
4.3. Loading Method and Boundary Conditions

The model adopts quarter-point loading and establishes reference points RP-1 to RP-4 on the pad. The reference points are coupled with the pad. We applied vertical displacement loads on two reference points, RP-1 and RP-2, while setting gravity loads to simulate the self-weight of the composite slab. The boundary conditions of the composite slab are set as simply supports at both ends, with U1 = U2 = 0 set at reference point RP-3 and U2 = 0 set at RP-4.

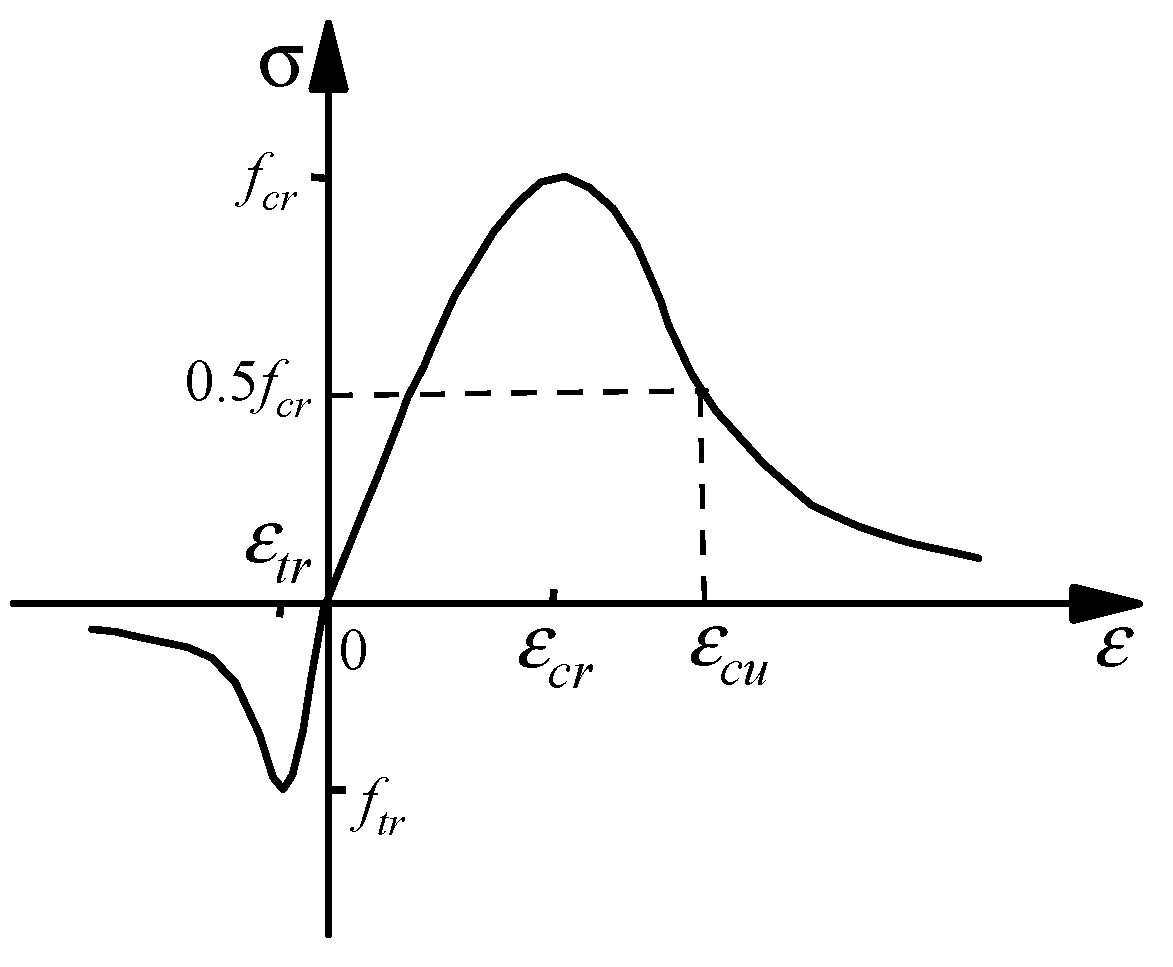
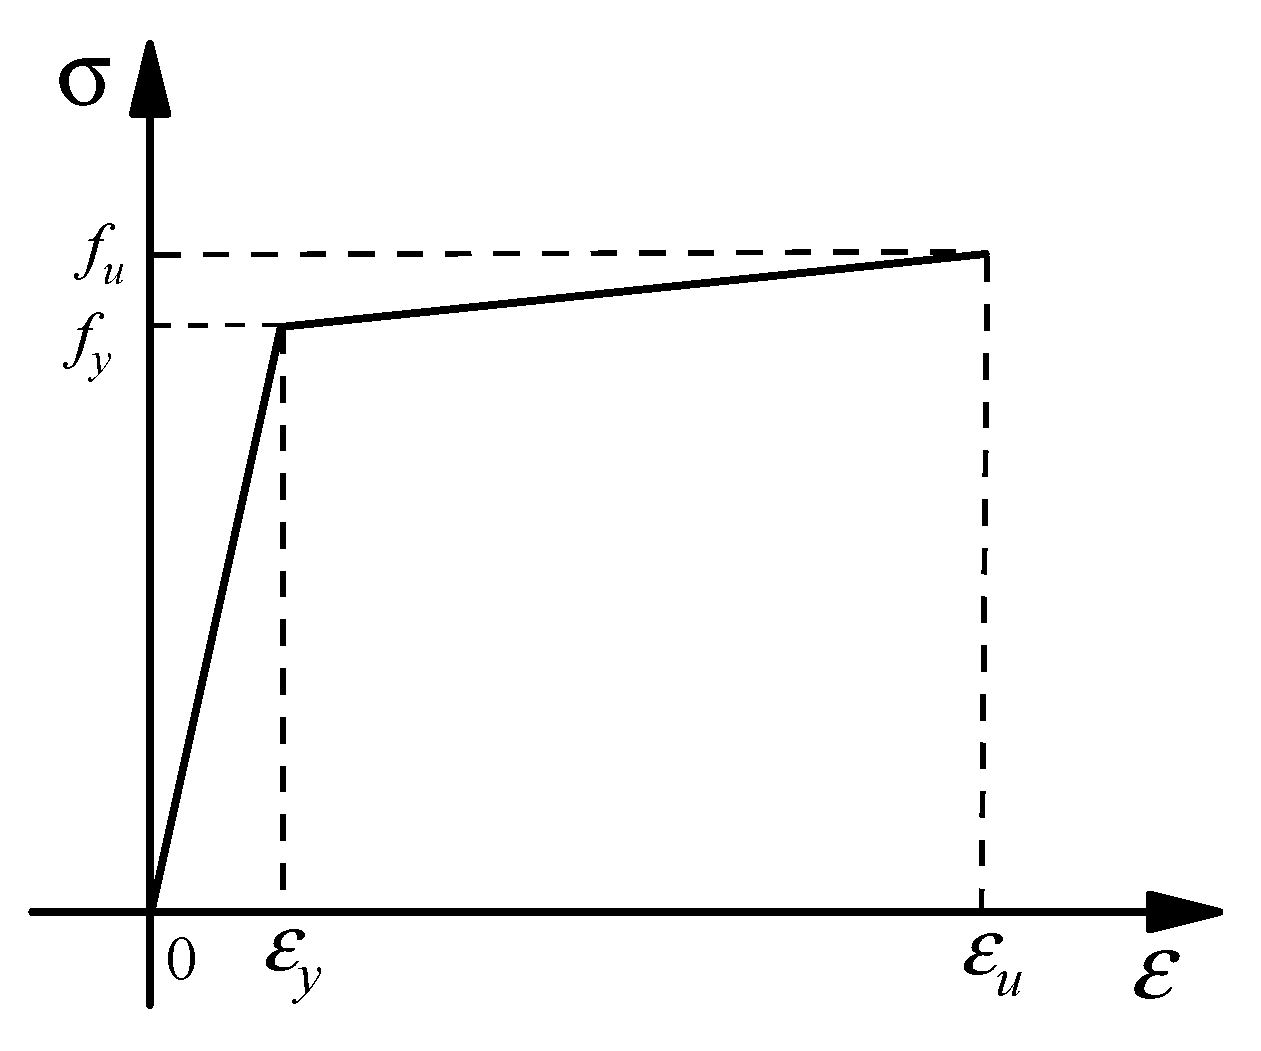
4.4. The Constitutive Relationship Between Concrete and Steel

C30 concrete adopts a plastic damage constitutive model, and its stress–strain relationship is based on the compressive and tensile constitutive model of concrete obtained from the “Code for Design of Concrete Structures” [31], as shown in Figure 19. The constitutive relationship of steel adopts a bilinear elasto-plastic model based on Mises yielding criterion, as shown in Figure 20. Steel is in the elasto stage before reaching the yielding strength and in the plastic stage after reaching the yielding strength. The constitutive relationship between reinforcement and bolts adopts an ideal elasto-plastic model.
The constitutive relationship of concrete under compression can be expressed as
σ = 1 d c E c ε
in which σ is the compression stress, ε is the compression strain, d c is the evolution parameters of uniaxial compression damage, and E c is the elastic modulus of the concrete.
d c = 1 ρ c α c x 1 2 + x                     x > 1 1 ρ c n n 1 + x n                           x 1
x = ε ε c , r
ρ c = f c , r E c ε c , r
n = E c ε c , r E c ε c , r f c , r
Here, α c is the parameter value of the descending section of the uniaxial compression stress-strain curve of the concrete, f c , r is uniaxial compressive strength of the concrete, ε c , r is the representative value of the uniaxial compressive strength, and f c , r is the corresponding peak compressive strain of the concrete.
The tensile constitutive relationship of the concrete can be expressed as
σ = 1 d t E c ε
in which σ is the tensile stress, ε is the tensile strain, d t is the evolution parameters of uniaxial tensile damage of the concrete, and E c is the elastic modulus of the concrete.
d t = 1 ρ t α t x 1 1.7 + x                             x > 1 1 ρ t 1.2 0.2 x 5                                                         x 1
x = ε ε t , r
ρ t = f t , r E c ε t , r
Here, α t is the parameter value of the descending section of the uniaxial tensile stress–strain curve of the concrete, f t , r is the representative value of uniaxial tensile strength of the concrete, and ε t , r is the peak tensile strain of the concrete corresponding to f t , r .
The stress–strain relationship of the profiled steel sheet can be calculated by the following formula:
σ p = E s ε s ε s < ε y f y , r + k ε s ε y ε y < ε s ε u
in which E s is the elastic modulus of the steel sheet, σ p is the stress for the steel sheet, ε s is the strain for the steel sheet, f y , r is the yielding strength of the steel sheet, ε y is the yielding strain of the steel corresponding to f y , r , f u is the ultimate strength of the steel sheet, ε u is the ultimate strain of the steel sheet corresponding to f u , E s is the slope of the steel hardening section, and in the paper, we take it as 0.01 E s .

4.5. Finite Element Model Verification

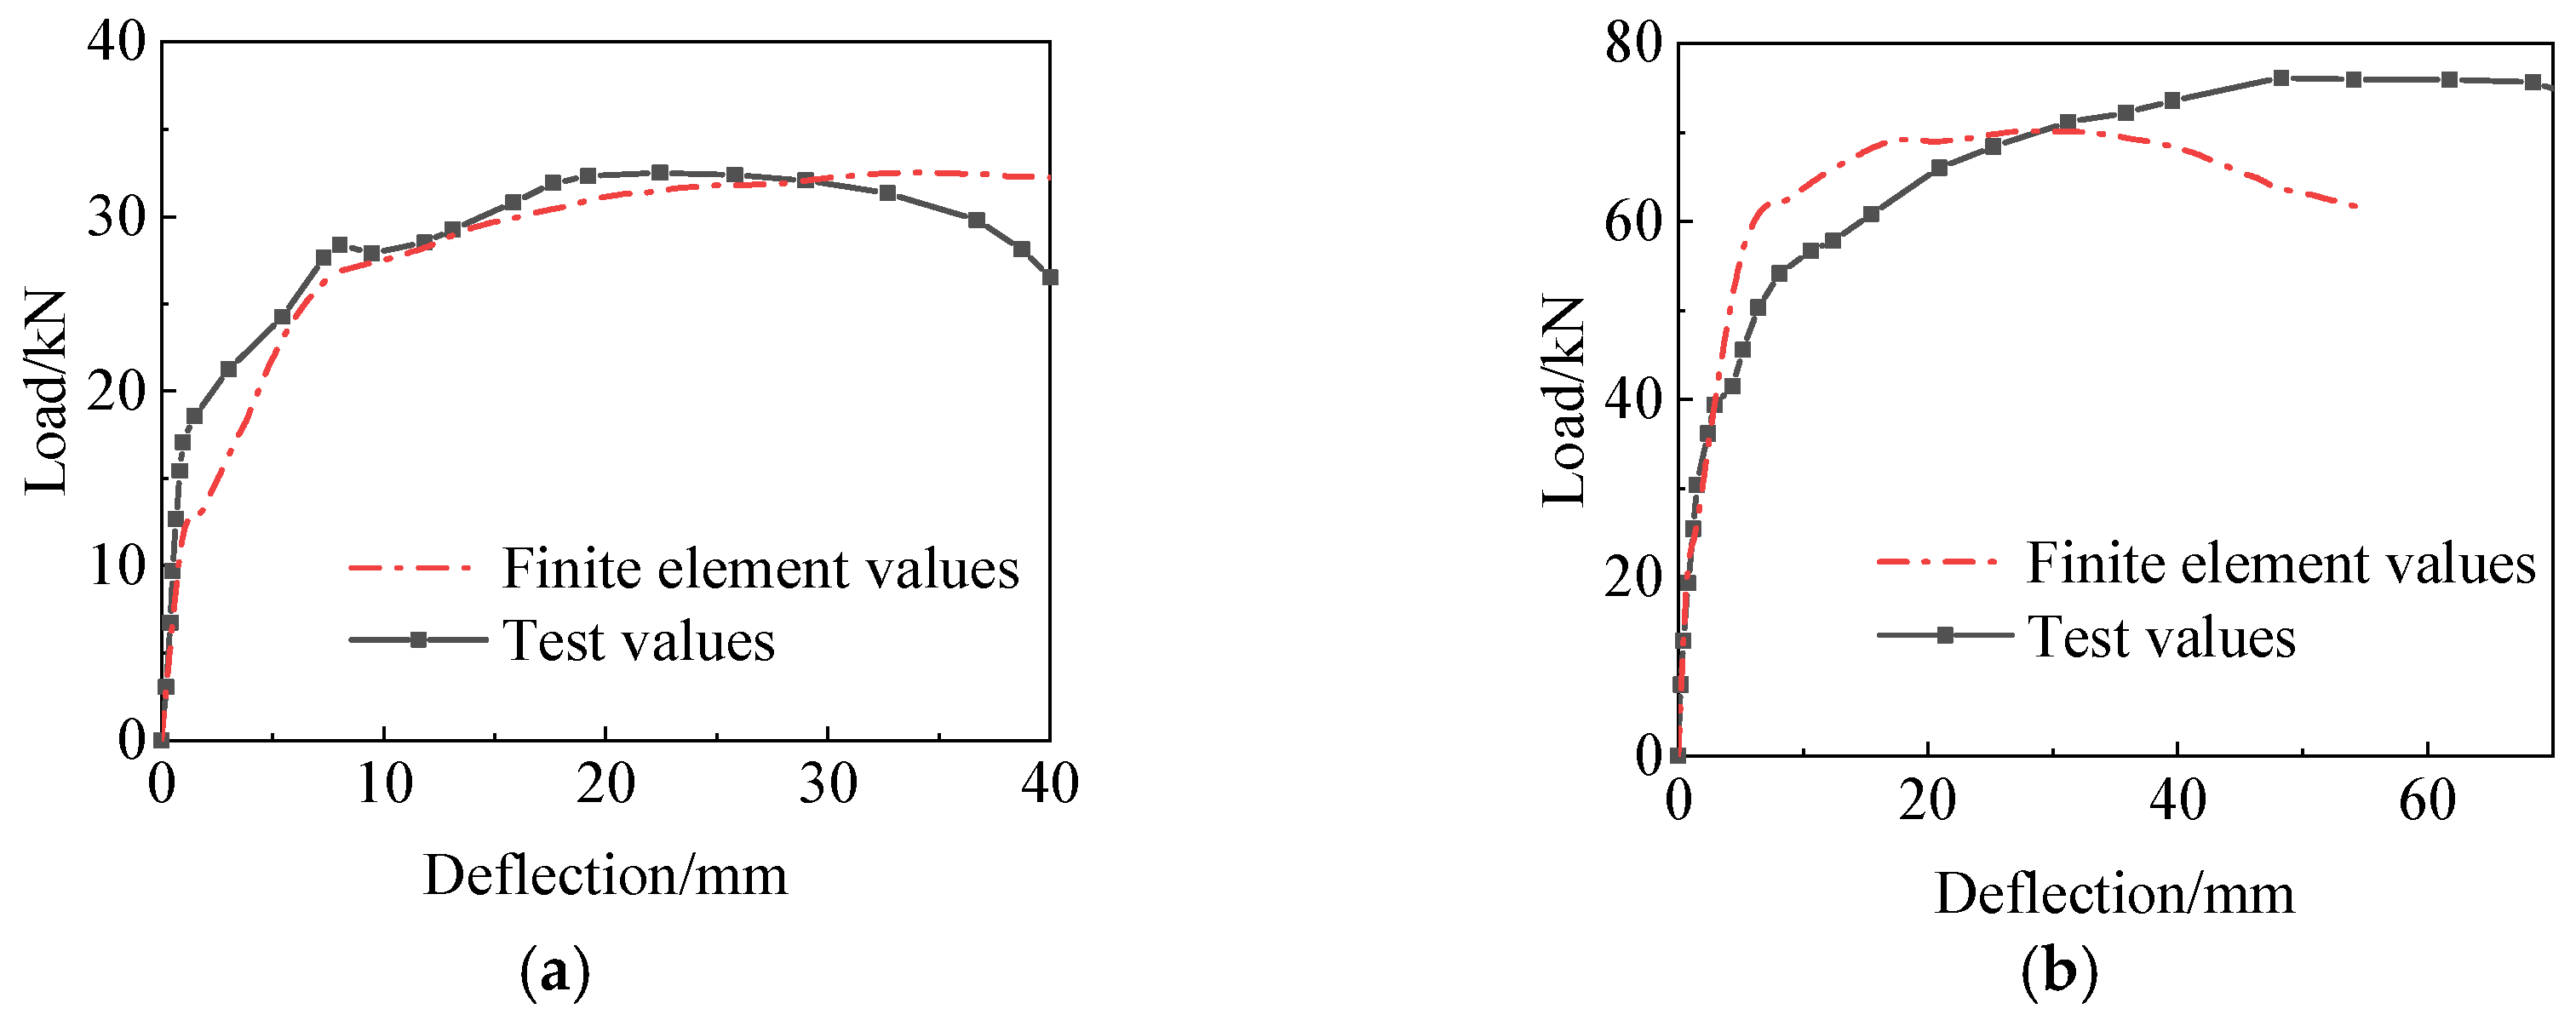
4.5.1. Model Accuracy Verification

  • Comparison of load–deflection curves
Taking ZH-3 and ZH-4 as examples, the comparison of load–deflection curves is shown in Figure 21, and the calculation results are shown in Table 5.
It can be observed from Figure 21 and Table 5 that the simulated curve is in good agreement with the test curve, especially in the elasto section, where the two curves are almost identical. The error of the yielding load for specimen ZH-3 is 3.4%, and the error of the ultimate load is 2.2%. The error of yielding load for specimen ZH-4 is 2.8%, and the error of ultimate load is 7.8%.
2.
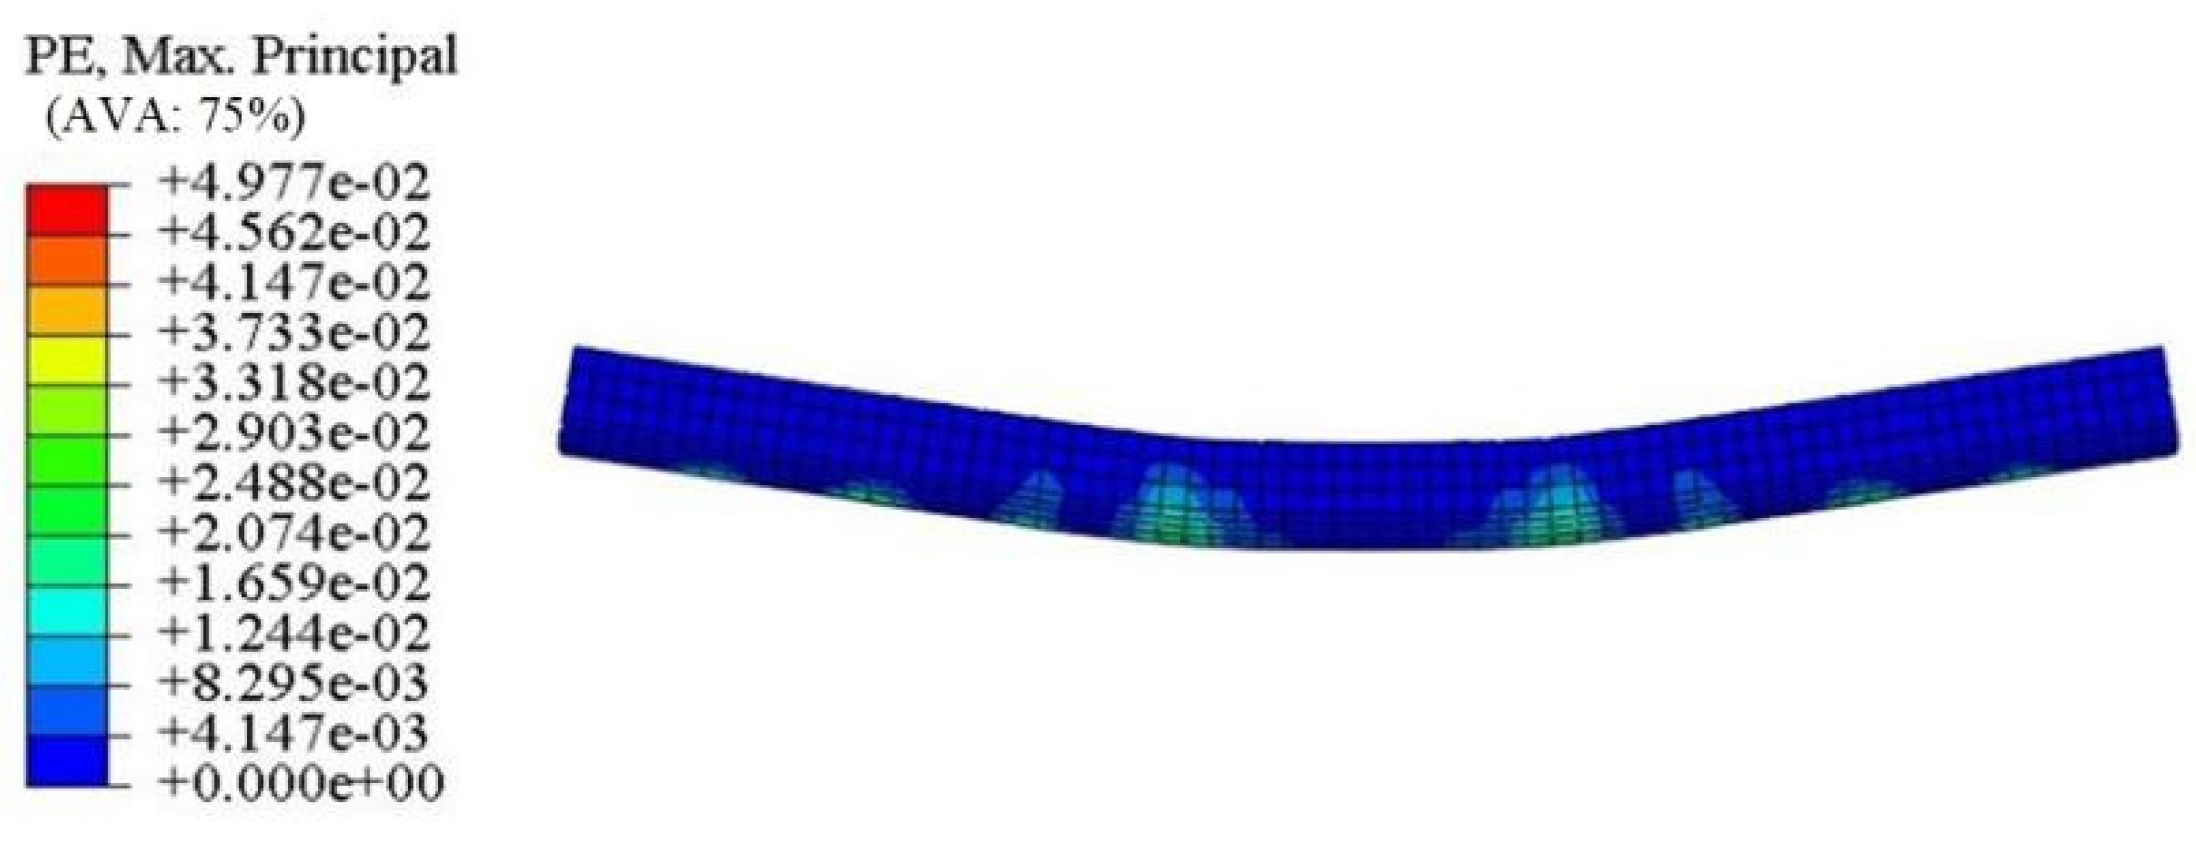
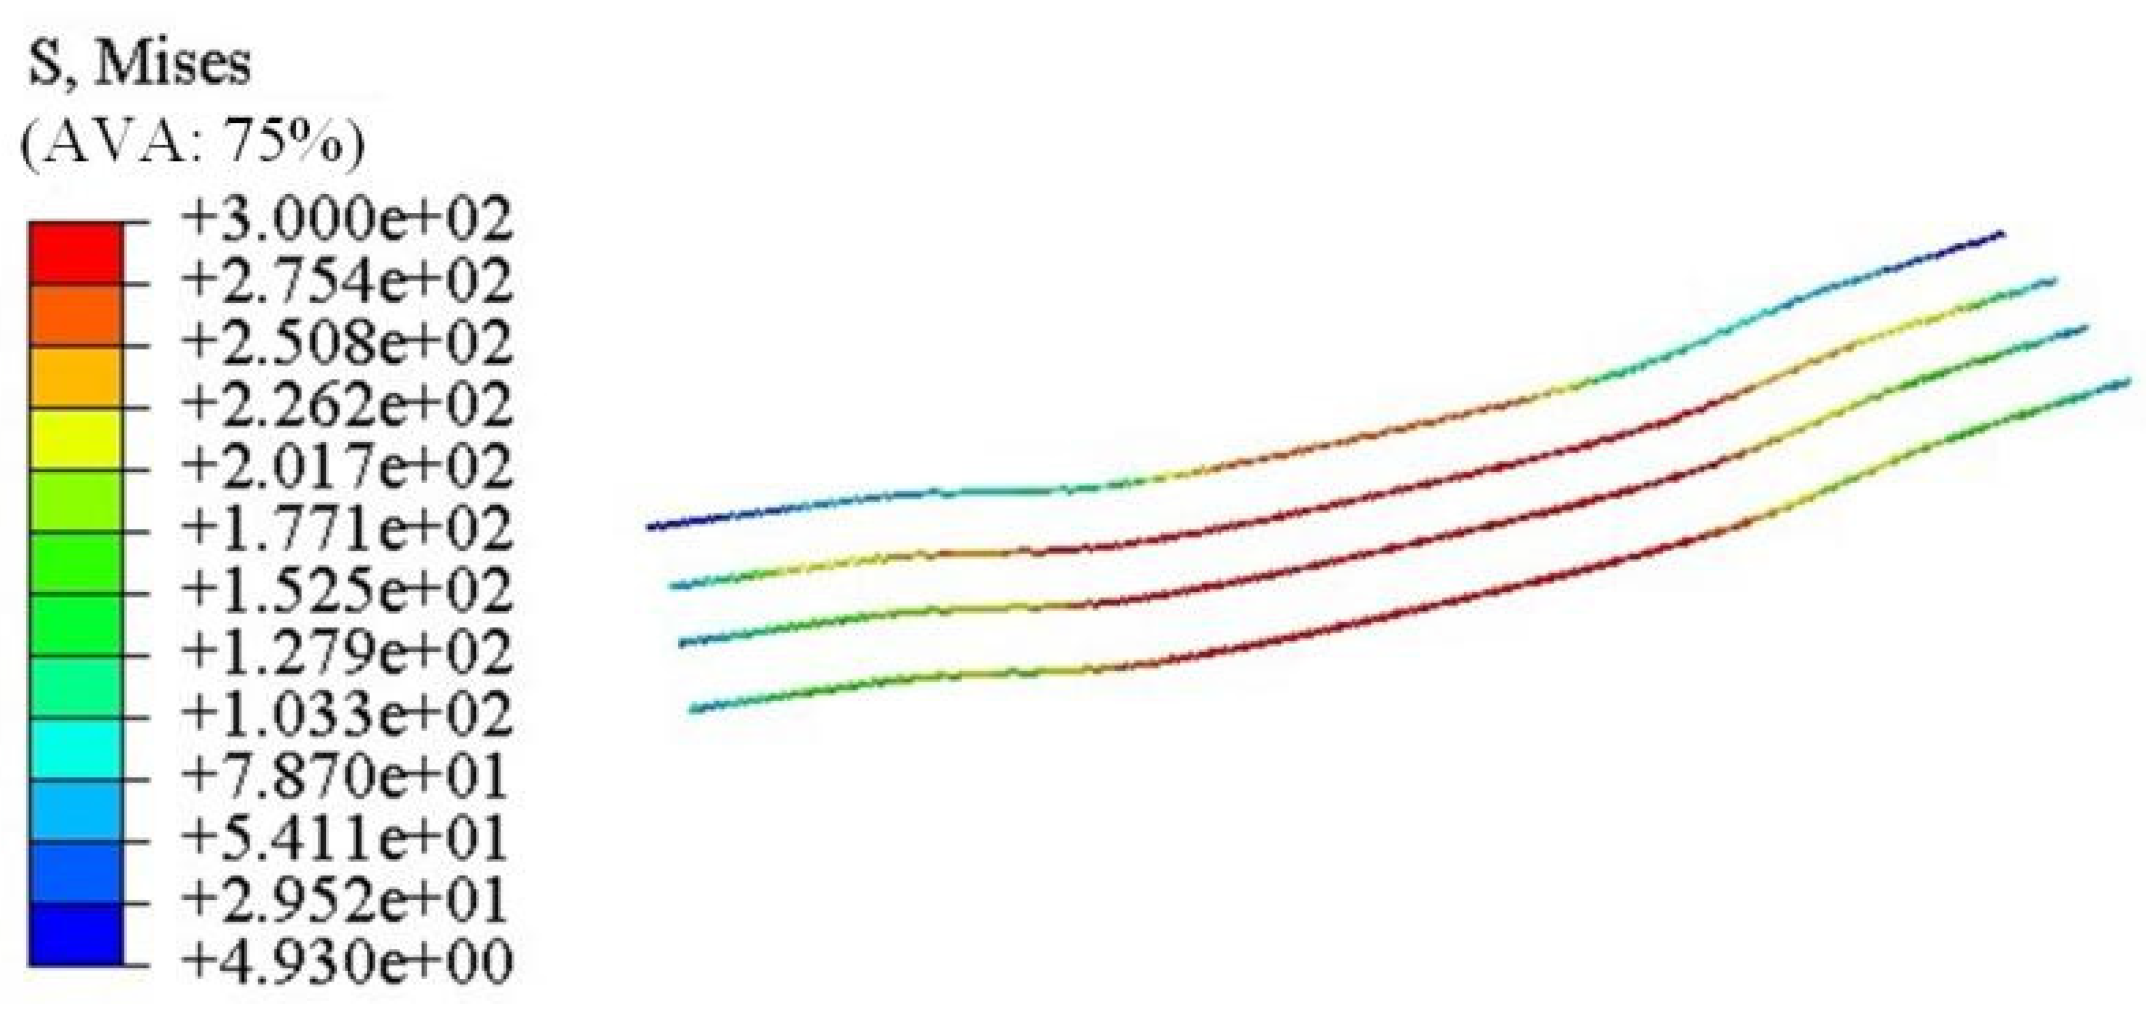
Stress and strain analysis of the composite floor slabs
The stress cloud map of the profiled steel sheet of specimen ZH-5 is shown in Figure 22. When the composite floor slab reaches its ultimate bearing capacity, all the mid-span lower flanges and web plates yield, but the upper flange does not yield. Stress concentration occurs at the bolt position, which is consistent with the test results. Figure 23 shows the plastic strain cloud map of the concrete, which can determine the location and trend of the cracks. The plastic strain at the loading point and pure flexural section is relatively large, which is consistent with the crack propagation rules. Figure 24 is the stress cloud map of the reinforcement. We can see from the figure that, when the composite floor slab reaches the ultimate bearing capacity, the stress near the mid span and loading point has already yielded, and the stress gradually decreases from the mid span area to both ends. The stress at the end of the composite floor slab is relatively small, which is consistent with the test results.

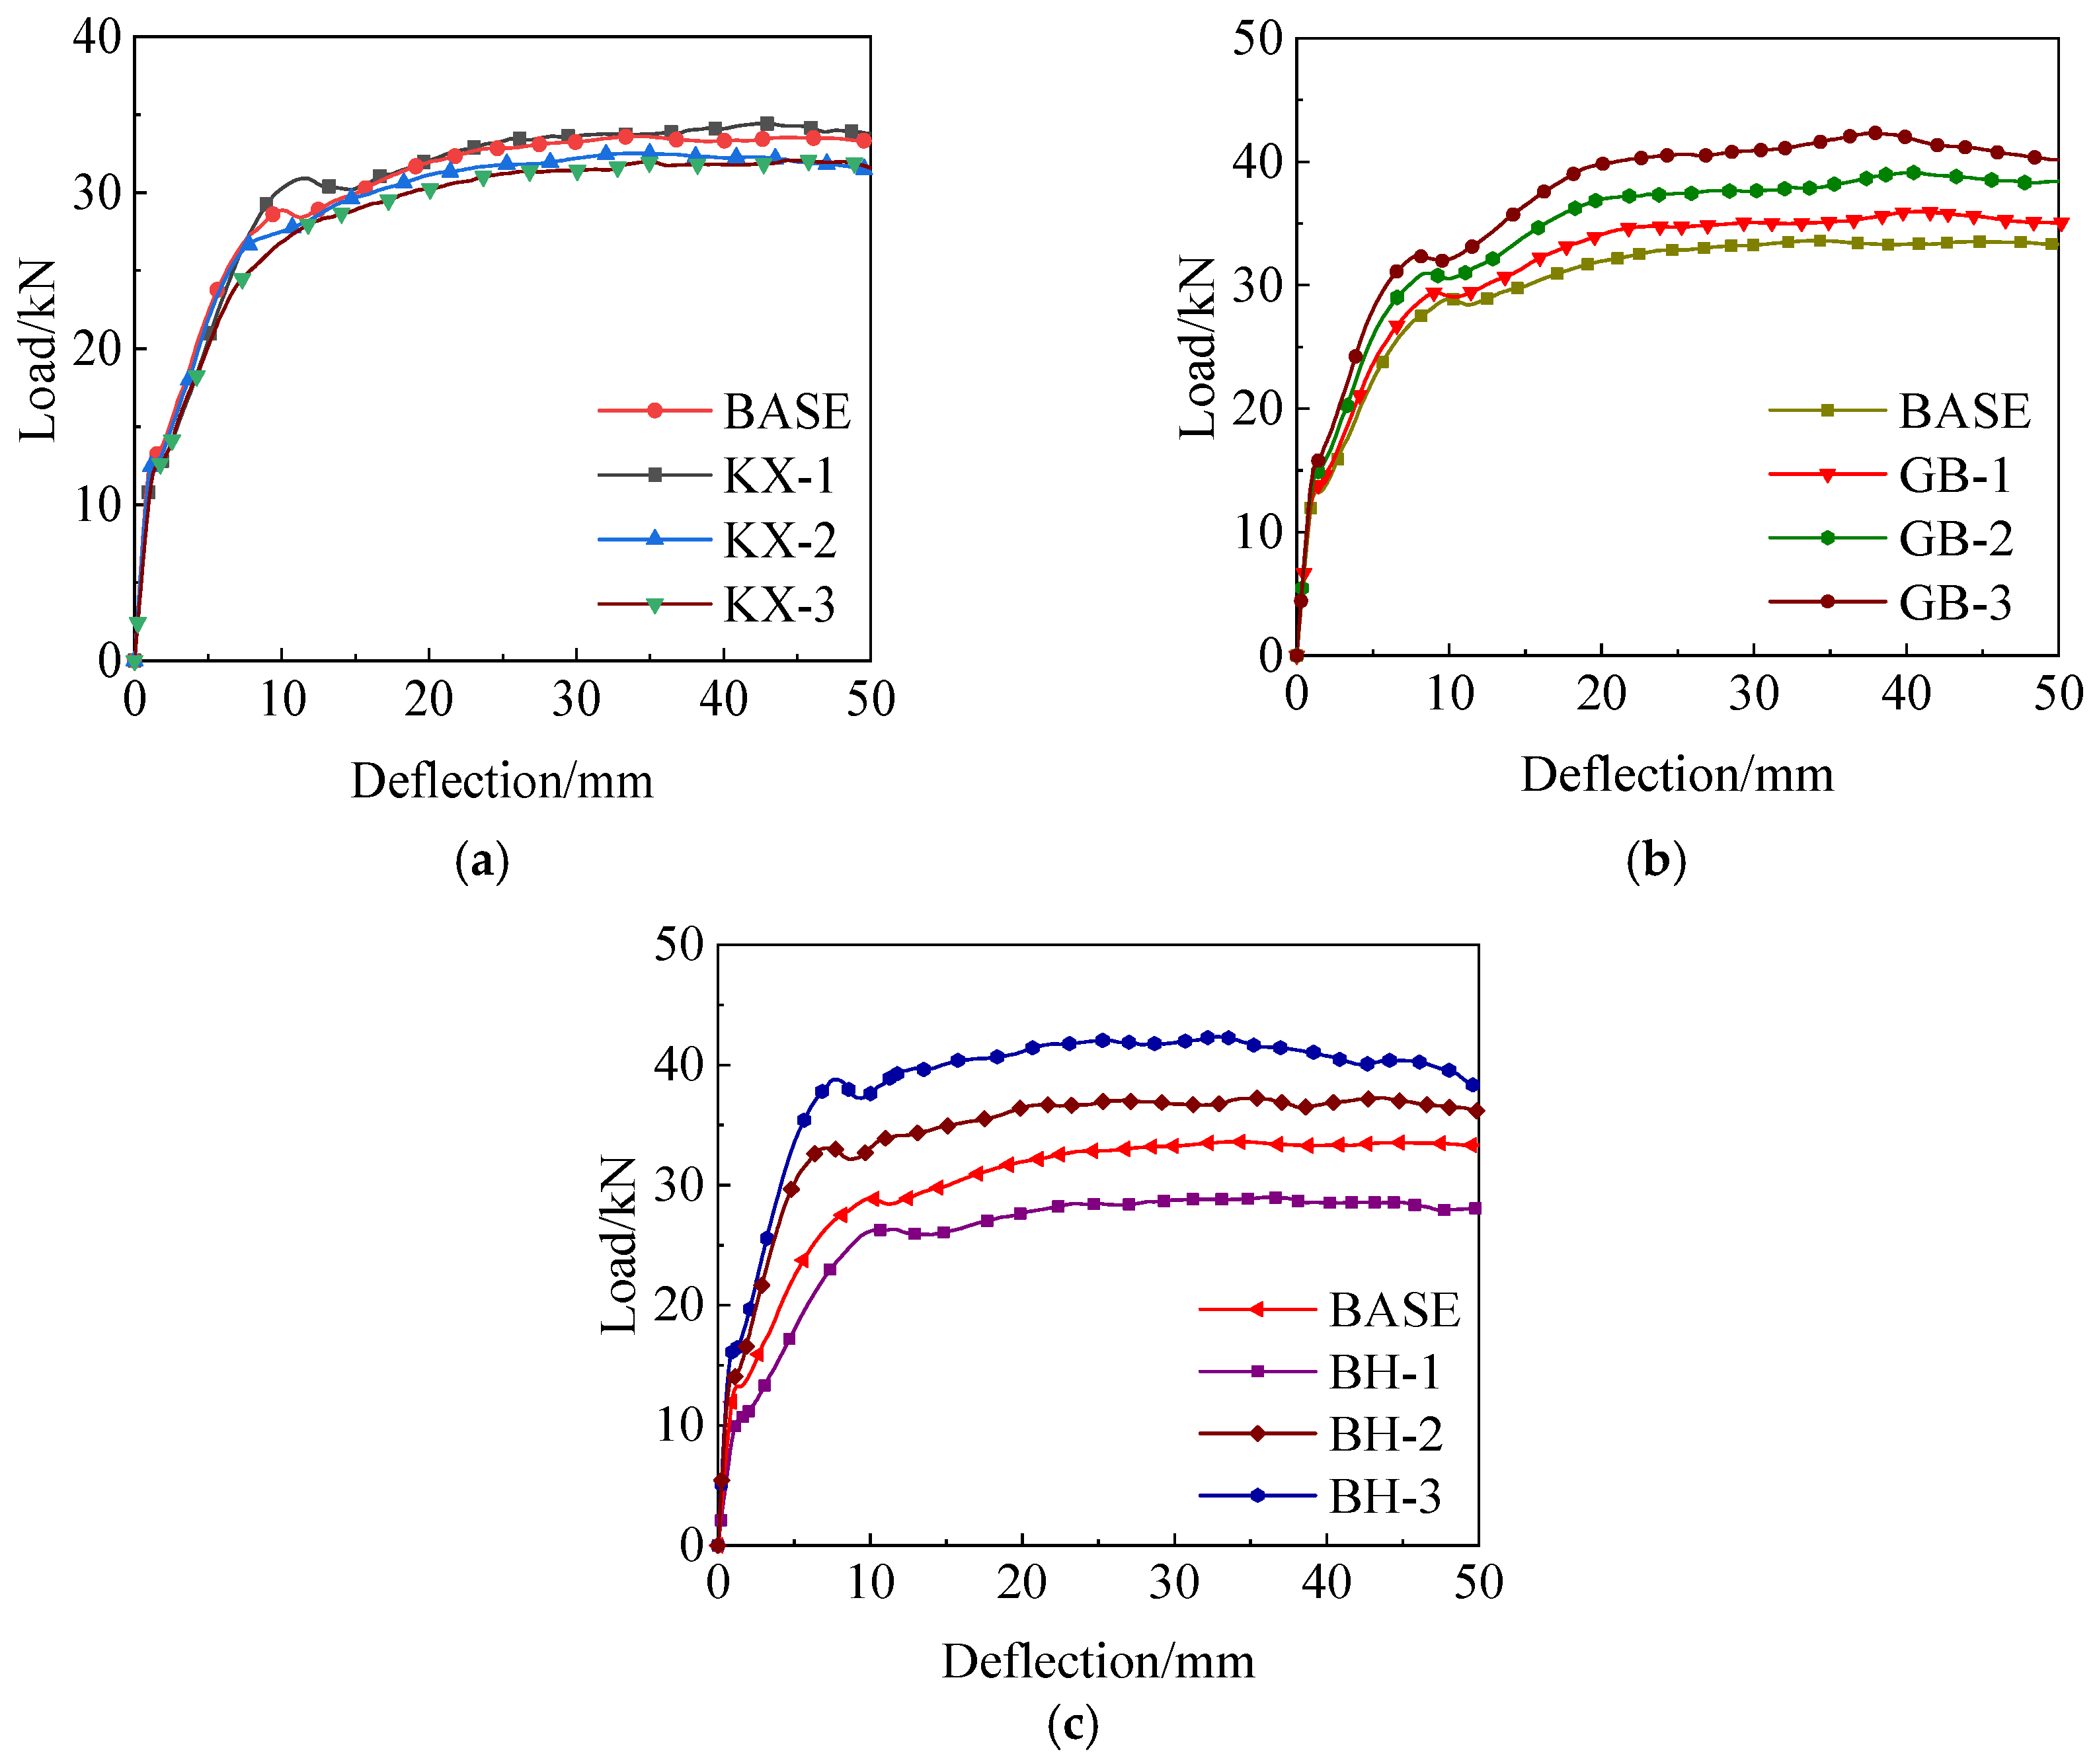
4.5.2. Analysis of the Factors Influencing the Parameters of the Profiled Steel Sheet-Hollow Concrete Composite Floor Slabs

Based on the validated finite element modeling method in the previous section, a variable parameter analysis is conducted on the profiled steel sheet–hollow concrete composite floor slab. Using specimen ZH-1 as the standard model specimen, the influence rules of the changes in hollow rate, the profiled steel sheet thickness, and composite floor slab thickness on the flexural bearing capacity are studied.
  • The influence of the hollow rate
In order to study the effect of the hollow rate on the flexural bearing capacity of the composite floor slabs, the hollow rates are set at 7.3%, 11.5%, 16.5%, and 22.5%, respectively, corresponding to No. KX-1, BASE, KX-2, and KX-3. We left the parameters of the concrete, such as the hollow height and reinforcement ratio, etc., unchanged. The comparison of load-deflection curves is shown in Figure 25a.
2.
The influence of the thickness of the profiled steel sheet
Considering the influence of the thickness of the profiled steel sheet on the flexural bearing capacity, combined with the specific structural characteristics of the specimens, the thicknesses of the profiled steel sheets are selected as 0.8 mm, 0.9 mm, 1.0 mm and 1.1 mm, corresponding to specimens No. BASE, GB-1, GB-2, and GB-3. We left the parameters such as the hollow rate and reinforcement ratio, etc., unchanged. The comparison of load–deflection curves is shown in Figure 25b.
3.
The influence of the composite slab thickness
Considering the influence of the thickness of the composite floor slab on flexural bearing capacity, four specimens are selected with the composite floor slab thicknesses of 130 mm, 140 mm, 150 mm, and 160 mm, and corresponding to No. BH-1, BASE, BH-2, and BH-3. We maintained the factors such as the reinforcement ratio and hollow rate, etc., unchanged. The comparison of load–deflection curves is shown in Figure 25c.
The finite element calculation results with different parameters are shown in Table 6.
Based on the results presented in Table 6, while maintaining other parameters unchanged, the hollow rate of the composite floor slab increases from 7.3% to 22.5%, and the yielding bearing capacity and ultimate bearing capacity decreases by 9.9% and 6.3%, respectively; the yielding deflection and ultimate deflection increases by 44.3% and 21.9%, respectively. The hollow rate has little effect on the ultimate bearing capacity of the composite floor slab, but has a significant impact on the deflection. When the thickness of the steel sheet increases from 0.9 mm to 1.1 mm, its yielding load and ultimate load increases by 9.4% and 23.9%, respectively; the yielding deflection and ultimate deflection decreases by 8.1% and 4.0%, respectively. The increasing range of the ultimate bearing capacity decreases with the increase in the steel sheet thickness, the deflection decreases with the increase in the steel sheet thickness, and the ductility coefficient increases with the increase in the steel sheet thickness. The reason for this is that, as the thickness of the profiled steel sheet increases, its section area, moment of inertia, and resistance moment also increase accordingly, which further enhances the bearing capacity of the composite floor slab. At the same time, the deflection decreases when the specimen reaches the ultimate bearing capacity, which indicates an increase in the stiffness of the composite floor slab. The thickness of the composite slab increases from 130 mm to 160 mm, the yield load increases by 37.1%, the ultimate load increases by 46.1%, and the yielding deflection and ultimate deflection decreases by 23.0% and 17.9%, respectively. The deflection decreases when the specimen reaches the ultimate bearing capacity, which indicates that increasing the thickness of the composite floor slab helps to reduce deformation.

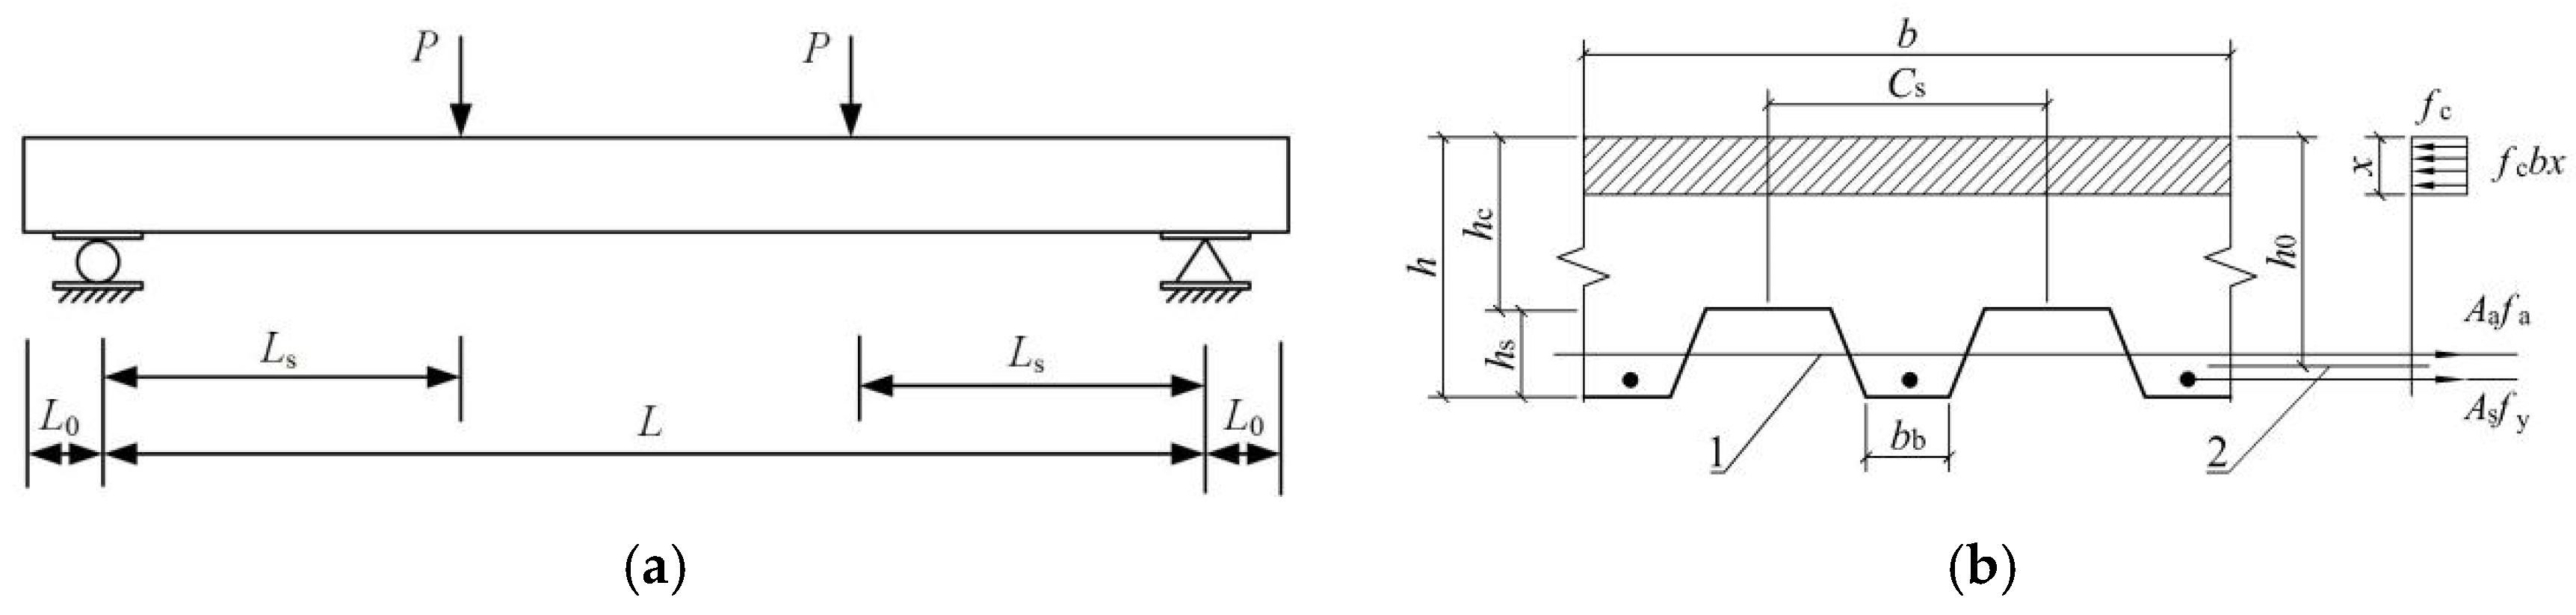
5. Calculation of Normal Section Flexural Bearing Capacity of the Composite Reinforced Concrete

5.1. Calculation of Normal Section Flexural Bearing Capacity in Full Anchorage Stage

The concrete hollow area section of the hollow concrete composite floor slab proposed in the paper is relatively small, so there is no need for an equivalent transformation of the section when calculating the bearing capacity. The “Code for design of composite structures” (JGJ0138-2016) [32] provides a plastic analysis calculation method for the flexural bearing capacity of the concrete composite floor slabs. It is believed that the concrete does not work in the tensile zone, and the strength of the materials in the tensile and compressive zones of the composite structures can be fully utilized. The bearing capacity calculation model is shown in Figure 26, and the formula is as follows:
M f c b x h 0 x 2
f c b x = A a f a + A s f y
in which M represents the design bending moment within the calculation width of the composite floor slab; b is the calculation width of the composite floor slabs, generally taken as 1 m; x is the height of the concrete compression zone; h 0 is the effective height of the composite floor section; A a is the section area of the profiled steel sheet within the calculation width; A s is the section area of tensile reinforcement within the calculation width; f a is the design value of tensile strength of the profiled steel sheet; f y is the design value of tensile reinforcement strength; and f c is the design value of the compressive strength of the concrete.
The comparison between the calculation results in Equation (11) and the actual measured ultimate bearing capacity is shown in Table 7.
We can see from Table 7 that the ultimate bending moment values calculated by using the formula in the “Code for design of composite structures” are all larger than the test values. Among them, the theoretical values of specimens ZH-1 to ZH-2 are nearly three times larger than the test values, and those of specimens ZH-4 to ZH-5 are 30% to 40% larger. This indicates that it is not scientific enough to calculate the composite floor slab of the profiled steel sheet–hollow concrete by using the “Code for design of composite structures”. The above formula for flexural bearing capacity is based on the premise that the anchorage between the profiled steel sheet and concrete is very sufficient. However, in actual situations, the anchorage of the profiled steel sheet is insufficient, and the slip of the composite floor slab is large, which greatly weakens the bearing capacity.

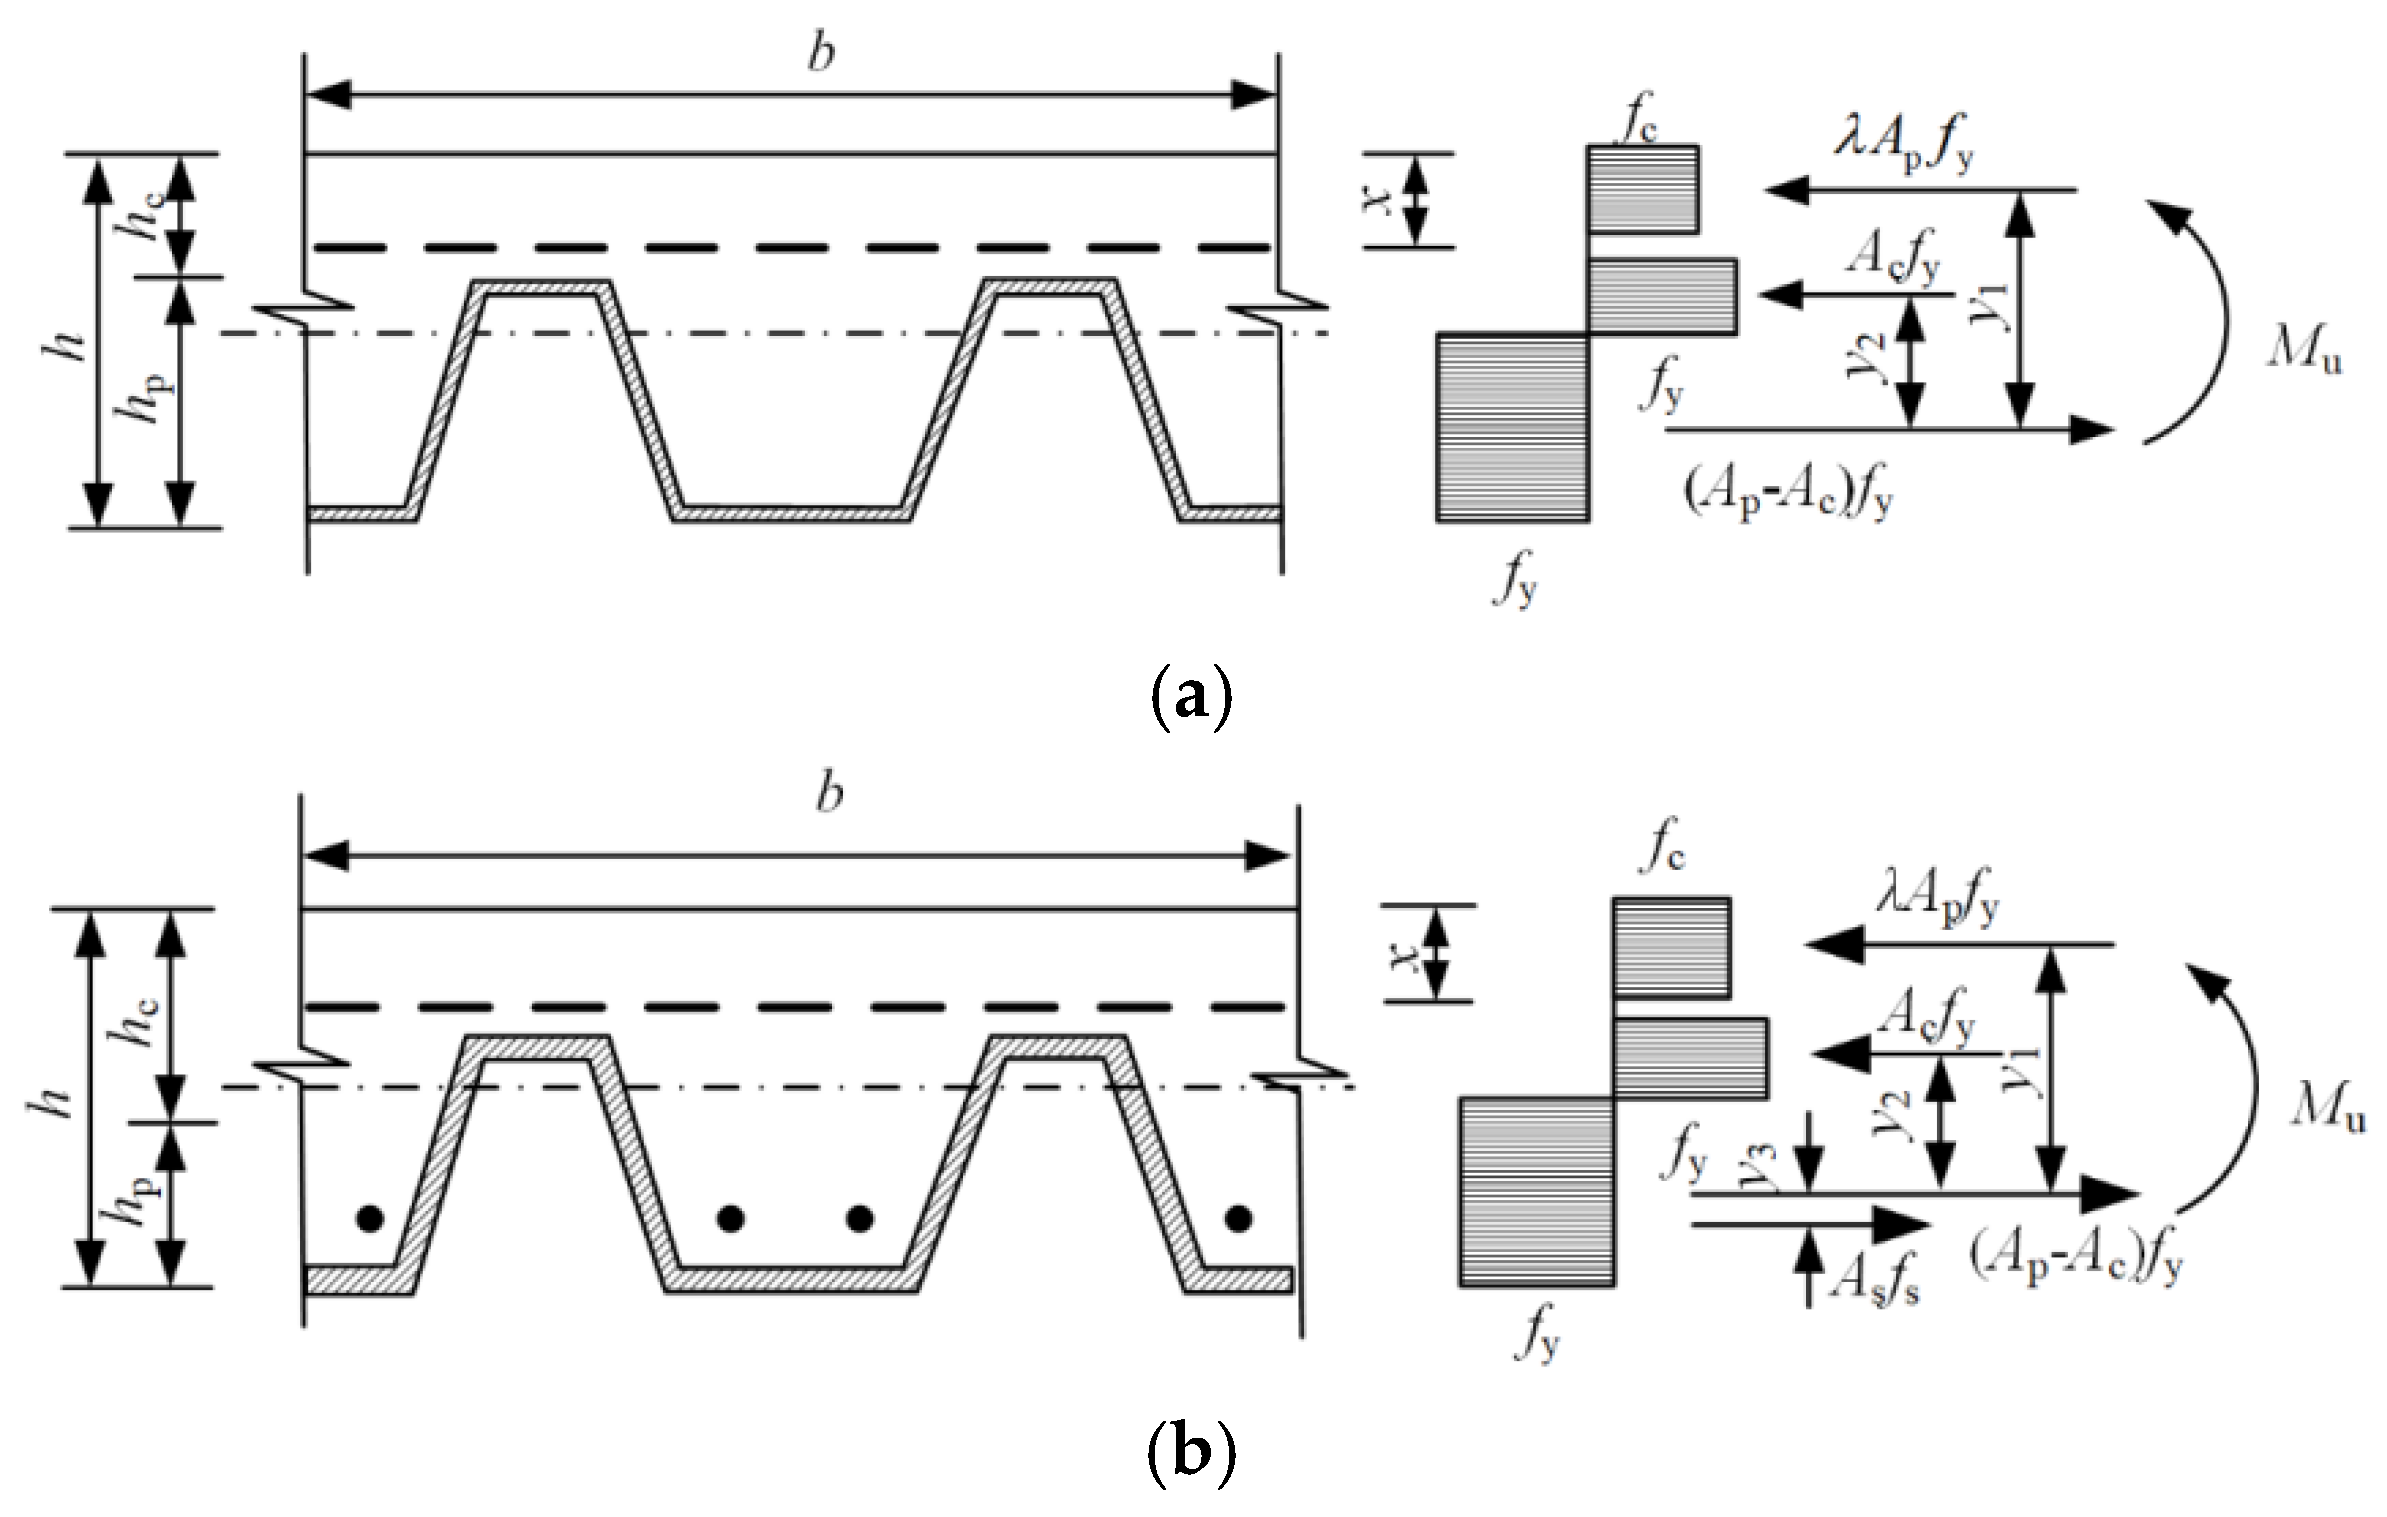
5.2. Calculation of Normal Section Flexural Bearing Capacity Considering the Anchorage Degree

Combing the test results, it is found that there is insufficient anchorage in the five specimens during the test process, resulting in a significant decrease in the ultimate flexural bearing capacity. Thus, we can see that the bolts between the profiled steel sheet and concrete can effectively enhance the collaborative working ability between the two, and its anchorage degree is of great significance to the calculation of the ultimate flexural capacity. Therefore, it is necessary to conduct more in-depth research on the calculation methods of the flexural bearing capacity for different anchorage degrees.
The calculation diagram of the profiled steel sheet–hollow concrete floor slab is shown in Figure 27a, and that of the bending moment considering section balance is shown in Figure 27.
Based on the research conducted by Nie Jianguo et al. [33] from Tsinghua University on the bearing capacity of tapered profiled steel sheet–concrete composite slabs with and without end bolts, this paper introduced the concept of anchorage degree. Based on the assumption of the plane section, the profiled steel sheet and concrete are regarded as an ideal elasto-plastic model, ignoring the favorable effects of the frictional resistance at the support on the anchorage degree. The calculation formula of the ultimate flexural bearing capacity applicable to open-profiled steel sheet–hollow concrete composite floor slabs is proposed as follows. In this paper, the size of the holes is relatively small (less than 16.5%). The test results show that under these conditions, the influence of the hollow ratio on the ultimate bearing capacity is very small, with changes in cracking load, yield load, and ultimate load all being less than 5%. Therefore, in the calculations of this paper, the influence of the hollow ratio was ignored.
When the profiled steel sheet is higher than the top surface of the neutral axis (see Figure 27), according to the conditions of the force balance and bending moment balance, the calculation formula for the ultimate flexural bearing capacity without reinforcement arrangement (see Figure 27a) can be obtained:
A c = A p 1 λ 2 f y
M u = λ A p f y y 1 + A c f y y 2
in which λ is the anchorage degree and the above formula is applicable to λ < 1 . When λ = 1 , the above formula is not applicable any more, and the ultimate bending moment bearing capacity needs to be calculated based on the fully bonding condition; A p is the section area of the profiled steel sheet, f y is the yielding strength of the steel sheet, y 1 is the distance from the centroid position of the section of the profiled steel sheet in the tensile zone to that of the concrete in the compressive zone, and y 2 is the distance from the centroid position of the section of the profiled steel sheet in the tensile zone to that of the profiled steel sheet in the compressive zone.
When the profiled steel sheet is higher than the top surface of the neutral axis (see Figure 27b), according to the conditions of force balance and bending moment balance, the calculation formula for the ultimate flexural capacity with reinforcement arrangement can be obtained:
A c f y = A s f s + A p A c f y λ A p f y
M u = λ A p f y y 1 + A c f y y 2 + A s f s y 3
in which A s is the section area of ordinary reinforcement; f s is the yielding strength of the ordinary reinforcement; A c , A p , f y , y 1 , and y 2 are the same as Equations (13) and (14); and y 3 is the distance from the centroid position of the section of the profiled steel sheet in the tensile zone to that of the ordinary reinforcement in the tensile zone.
When the top surface of the profiled steel sheet is lower than the top surface of the neutral axis, the calculation formula for the ultimate flexural bearing capacity without reinforcement is
M u = λ A p f y y 1
in which A p , f y , and y 1 are the same as Equation (16).
When the profiled steel sheet is below the top surface of the neutral axis, the calculation formula for the ultimate flexural capacity with reinforcement arrangement is
M u = λ A p f y y 1 + A s f s y 3
in which A p , A s , f y , f s , y 1 , and y 3 are the same as Equation (16).
The anchorage degree λ in Equations (13)–(18) is calculated according to the following formula:
λ = τ ¯ u b L s + L 0 + n P a A p f y
in which τ ¯ u is the average ultimate shear strength between the profiled steel sheet and concrete, which can be determined by the test results. When the test data is limited, the recommended value of 0.62 in Ref. [33] can be used. b is the width of the slab; L s is the shear span length, it represents the distance from the loading position to the support, which is taken as L/3 in the paper, and L is the net span of the slab; L 0 is the length of the support extending outside the composite slab; n is the number of bolts on one side of the slab; and P a is the shear-bearing capacity of a single bolt, which can be calculated according to the prevailing Chinese “Standard for design of steel structures” (GB50017-2017) [34]:
P a = 0.43 A s E c f c 0.7 A s f u
in which A s is the section area of the bolt rod, E c is the elastic modulus of the concrete, f c is the axial compressive strength of the concrete, and f u is the ultimate tensile strength of the bolt.
The comparison among the calculation, test, and simulated values of the ultimate bending moment of the composite floor slab is shown in Table 8.
It can be concluded from Table 8 that the average value of M p / M u is 1.2 and the standard deviation is 0.15. It shows that the theoretical bending moment value calculated by using the formula for the normal section flexural bearing capacity under different anchorage degrees has a relatively small error compared to the test bending moment value.
Taking the open-profiled steel sheet–concrete composite slab as an example in Ref. [13], the profiled steel sheet thickness is 0.8 mm, and the comparison of the calculation results by using the formula proposed in the paper with the test results is shown in Table 9.
As shown in Table 9, the average value of M p / M u is 0.93 and the standard deviation is 0.06. It can be seen that the formula proposed in the paper can be used to calculate the ultimate bending moment value of the open-profiled steel sheet–hollow concrete composite floor slabs.

6. Conclusions

In this paper, the bending behavior and the design theory of open-profiled steel sheet–hollow concrete composite floor slabs are studied by using a combination of tests, numerical simulations, and theoretical analysis methods on five pieces of the composite floor slabs. The flexural bearing capacity and the law of deflection of the composite floor slabs are also analyzed, and the formula of flexural bearing capacity of section under different anchorage conditions are established. The main conclusions are as follows:
(1)
The failure mode of the hollow concrete composite floor slabs is closely related to the interface bonding state and reinforcement arrangement conditions; when the profiled steel sheet is in a relatively low anchorage working condition, the specimens without reinforcement arrangement fail due to interface debonding and slip effects during the loading process, and the specimens exhibit a brittle failure characteristics. When the profiled steel sheet forms an effective combination with the concrete, its lower flange fully exerts its tensile performance, and the failure mode of the specimen changes to a ductile failure.
(2)
Increasing the hollow rate within a certain range (not larger than 16.5%) has little effect on the flexural bearing capacity. As the reinforcement ratio increases from 0% to 0.6%, the ultimate bearing capacity is increased by 182.5%, and the ductility coefficient is increased by 246.0%. The ultimate deflection of specimens with a reinforcement ratio of 0.6% was 22.4 times that of specimens without reinforcement arrangement. When the thickness of the steel sheet increases from 0.9 mm to 1.1 mm, its ultimate load and ultimate deflection increases by 23.9% and 4.0%, respectively. The reinforcement ratio has a significant impact on the ultimate bearing capacity, deflection, and ductility coefficient of the composite floor slabs.
(3)
The upper flange of the profiled steel sheet of all specimens undergoes a transition of the tensile and compressive state, but does not reach yielding, which indicates that this part mainly undertakes the pressure transmission role in the structural system. The specimens with a reinforcement arrangement show significant ductility advantages, and the double-position yielding phenomenon of the lower flange indicates that the reinforcement arrangement can compensate for the stiffness degradation caused by interface slip.
(4)
The anchorage degree of the composite floor slabs has a significant impact on the ultimate flexural bearing capacity. The existing method for the normal section flexural bearing capacity is based on the condition that the composite floor slabs are in a fully anchorage state. In order to better analyze the normal section flexural bearing capacity of the composite slabs under different anchorage states, a calculation method for the flexural bearing capacity under different anchorage degrees is proposed. The theoretical results are in good agreement with the experimental values, which have a certain reference value for the engineering practice.

Author Contributions

Software, J.W.; Validation, J.W.; Investigation, Y.Y.; Data curation, X.W.; Writing—original draft, W.W.; Writing—review & editing, G.Z.; Funding acquisition, Y.Y. All authors have read and agreed to the published version of the manuscript.

Funding

This work is supported by the National Natural Science Foundation of China (Grant number: 52278454).

Data Availability Statement

The original contributions presented in this study are included in the article. Further inquiries can be directed to the corresponding author.

Conflicts of Interest

The authors declare that they have no known competing financial interests or personal relationships that could have appeared to influence the work reported in this paper.

References

  1. Islam, S.M.Z.; Ahmed, B.; Sayed, A.; Siddique, M.J. Structural strength and behavior of profiled steel sheet-concrete composite slab. In Proceedings of the 5th International Conference on Civil Engineering for Sustainable Development (ICCESD 2020), Khulna, Bangladesh, 7–9 February 2020. [Google Scholar]
  2. Zhao, H.; Zhao, J.; Wang, R.; Zhang, W.; Liu, F.; Wu, S. Thermal behavior of composite slabs with closed profiled steel decking and recycled aggregate concrete in fire. Fire Saf. J. 2022, 132, 103637. [Google Scholar] [CrossRef]
  3. Siddh, S.P.; Patil, Y.D.; Patil, H.S. Experimental studies on behaviour of composite slab with profiled steel sheeting. Mater. Today 2017, 4, 9792–9796. [Google Scholar] [CrossRef]
  4. Guo, F.; Li, G.; Yang, Z.; Zhang, X. Research on Bond-Slippage Property of Long-Span Opened Profiled Steel Sheeting—Concrete Composite Slabs. Ind. Constr. 2017, 47, 190–195. (In Chinese) [Google Scholar]
  5. Baskar, R.; Antony, J.C. Experimental and Numerical Studies on Composite Deck Slabs. Int. J. Eng. Res. Dev. 2012, 12, 22–32. [Google Scholar]
  6. Al-Azzawi, A.A.; Al-Aziz, B.M.A. Behavior of reinforced lightweight aggregate concrete hollow-core slabs. Comput. Concr. 2018, 21, 117–126. [Google Scholar]
  7. Li, X.; Zheng, X.; Ashraf, M.; Li, H. Experimental study on the longitudinal shear bond behavior of lightweight aggregate concrete-closed profiled steel sheeting composite slabs. Constr. Build. Mater. 2017, 156, 599–610. [Google Scholar] [CrossRef]
  8. Aarthi, D.; Jeyshankaran, E.; Aranganathan, N. Comparative study on longitudinal shear resistance of light weight concrete composite slabs with profiled sheets. Eng. Struct. 2019, 200, 109738. [Google Scholar] [CrossRef]
  9. Lv, J.; Zhou, T.; Wu, H.; Sang, L.; He, Z.; Li, G.; Li, K. A New Composite Slab Using Crushed Waste Tires as Fine Aggregate in Self-Compacting Lightweight Aggregate Concrete. Materials 2020, 13, 2551. [Google Scholar] [CrossRef]
  10. Ekberg, C.E., Jr.; Schuster, R.M.; Porter, M.L. Further Investigation of Light Gage Steel Forms As Reinforcement for Concrete Slabs. In AISI-Specifications for the Design of Cold-Formed Steel Structural Members; Missouri University of Science and Technology: Rolla, MO, USA, 1969; Available online: https://scholarsmine.mst.edu/ccfss-aisi-spec/89 (accessed on 12 May 2025).
  11. Wright, H.D.; Evans, H.R.; Harding, P.W. The use of profiled steel sheeting in floor construction. J. Constr. Steel Res. 1987, 7, 279–295. [Google Scholar] [CrossRef]
  12. Chen, S. Load carrying capacity of composite slabs with various end constraints. J. Constr. Steel Res. 2003, 59, 385–403. [Google Scholar] [CrossRef]
  13. Cifuentes, H.; Medina, F. Experimental study on shear bond behavior of composite slabs according to Eurocode 4. J. Constr. Steel Res. 2013, 82, 99–110. [Google Scholar] [CrossRef]
  14. Ahmed, S.M.; Avudaiappan, S.; Sheet, I.S.; Flores, E.I.S.; Pina, J.C.; Yanez, S.J.; Guzmán, C.F. Prediction of longitudinal shear resistance of steel-concrete composite slabs. Eng. Struct. 2019, 193, 295–300. [Google Scholar] [CrossRef]
  15. Soltanalipour, M.; Ferrer, M.; Marimon, F.; Holomek, J.; Bajer, M.; Melcher, J.; Karmazínová, M. Shear transfer behavior incomposite slabs under 4-point standard and uniform-load tests. J. Constr. Steel Res. 2020, 164, 105774. [Google Scholar] [CrossRef]
  16. Soltanalipour, M.; Ferrer, M.; Marimon, F. An experimentally validated study for open rib profiles steel-concrete composite slabs behavior in partial connection. In Proceedings of the 14th Nordic Steel Construction Conference, Copenhagen, Denmark, 18–20 September 2019; Volume 3, pp. 271–276. [Google Scholar]
  17. Grossi, L.; Santos, C.; Malite, M. Longitudinal shear strength prediction for steel-concrete composite slabs with additional reinforcement bars. J. Constr. Steel Res. 2020, 166, 105908. [Google Scholar] [CrossRef]
  18. Heweidak, M.; Kafle, B.; Al-Ameri, R. Shear-Bond Behaviour of Profiled Composite Slab Incorporated with Self-Compacted Geopolymer Concrete. Appl. Sci. 2022, 12, 8512. [Google Scholar] [CrossRef]
  19. Lim, S.S.; Wong, J.Y.; Yip, C.C.; Pang, J.-W. Flexural strength test on new profiled composite slab system. Case Stud. Constr. Mat. 2021, 15, e00638. [Google Scholar] [CrossRef]
  20. Shi, G. Study on the Method for Calculating the Flexural Rigidity of Reinforced Concrete Truss Hollow Composite Slabs. Buildings 2025, 15, 586. [Google Scholar] [CrossRef]
  21. Yang, L.; Shen, Q.; Lu, M.; Yang, X. Experimental Study on Bending Behaviors of Ultra-High-Performance Fiber-Reinforced Concrete Hollow-Core Slabs. Buildings 2025, 15, 812. [Google Scholar] [CrossRef]
  22. Gu, G. Study On Shear Experiment and Grouting Reinforcement Method of Prestressed Hollow Slab Beam. Master’s Thesis, Southeast University, Shenyang, China, 2021. (In Chinese). [Google Scholar]
  23. Chung, L.; Lee, S.-H.; Cho, S.-H.; Woo, S.-S.; Choi, K.-K. Investigations on flexural strength and stiffness of hollow slabs. Adv. Struct. Eng. 2010, 13, 591–601. [Google Scholar] [CrossRef]
  24. Prakashan, L.; George, J.; Edayadiyil, J.B.; George, J.M. Experimental study on the flexural behavior of hollow core concrete slabs. Appl. Mech. Mater. 2017, 857, 107–112. [Google Scholar] [CrossRef]
  25. Alzein, R.; Kumar, M.V. Development of Concrete Slabs by Using Hollow Core Action Integrated with Profiled Steel Sheets: State of the Art Review. Int. J. Steel Struct. 2023, 23, 645–663. [Google Scholar] [CrossRef]
  26. Zhao, W. Study on Mechanical Behavior of the Cast-in-Situ Pre-Stressed Concrete Two-Way Hollow Slab with Tube Fillers. Master’s thesis, Xiangtan University, Xiangtan, China, 2015. (In Chinese). [Google Scholar]
  27. Mahdi, A.A.; Ismael, M.A. Structural Behavior of Hollowcore One Way Slabs of High Strength Self-compacting Concrete. Int. J. Eng. 2021, 34, 39–45. [Google Scholar]
  28. Liu, Y. Study on Mechanical Properities of Fabricated Prestressed Iron Tailings Concrete Hollow Slabs. Master’s thesis, Hebei Institute of Architecture and Technology, Zhangjiakou, China, 2018. (In Chinese). [Google Scholar]
  29. Zhang, H. Development and Mechanical Performance Research of New Hollow Composite Slabs. Master’s Thesis, Shenyang Jianzhu University, Shenyang, China, 2020. (In Chinese). [Google Scholar]
  30. GB/T 50152-2012; Standard for Test Method of Concrete Structures. China Architecture Publishing & Media Co., Ltd.: Beijing, China, 2012.
  31. GB 50010-2010; National Standards of the People’s Republic of China-Code for Design of Concrete Structures. China Architecture Publishing & Media Co., Ltd.: Beijing, China, 2010.
  32. JGJ 138-2016; Code for Design of Composite Structures. China Architecture Publishing & Media Co., Ltd.: Beijing, China, 2016.
  33. Nie, J.G.; Tang, L.; Huang, L. Load-carrying and Deforming Capacities of Composite Slabs with Re-entrant Trough Profiled Steel Sheeting(I): Experiment and Longitudinal Shear Capacity. Build. Struct. 2007, 1, 60–64. [Google Scholar]
  34. GB 50017-2017; Standard for Design of Steel Structures. China Architecture Publishing & Media Co., Ltd.: Beijing, China, 2017.
Figure 1. Section shape of the profiled steel sheet.
Buildings 15 02140 g001
Figure 2. Section dimensions of the composite floor slab.
Buildings 15 02140 g002
Figure 3. Test loading device.
Buildings 15 02140 g003
Figure 4. Test site.
Buildings 15 02140 g004
Figure 5. Strain arrangement of the profiled steel sheet.
Buildings 15 02140 g005
Figure 6. Distribution of section strain measurement points of the profiled steel sheet.
Buildings 15 02140 g006
Figure 7. Arrangement of strain gauge on the concrete side.
Buildings 15 02140 g007
Figure 8. Figure of final failure of the specimens. (a) Specimen ZH-1. (b) Specimen ZH-2. (c) Specimen ZH-3. (d) Specimen ZH-4. (e) Specimen ZH-5.
Buildings 15 02140 g008
Figure 9. Mid-span load–deflection curve. (a) Specimen ZH-1. (b) Specimen ZH-2. (c) Specimen ZH-3. (d) Specimen ZH-4. (e) Specimen ZH-5.
Buildings 15 02140 g009
Figure 10. Comparison of yielding load Py and ultimate load Pu. (a) Influence of hollow rate. (b) Influence of reinforcement ratio.
Buildings 15 02140 g010
Figure 11. Comparison of yielding deflection and ultimate deflection. (a) Influence of hollow rate. (b) Influence of reinforcement ratio.
Buildings 15 02140 g011
Figure 12. Comparison of ductility coefficient. (a) Influence of hollow rate. (b) Influence of reinforcement ratio.
Buildings 15 02140 g012
Figure 13. Comparison of maximum crack width. (a) Influence of hollow rate. (b) Influence of reinforcement ratio.
Buildings 15 02140 g013
Figure 14. Load-strain curve of the upper flange. (a) Specimen ZH-1. (b) Specimen ZH-2. (c) Specimen ZH-3. (d) Specimen ZH-4. (e) Specimen ZH-5.
Buildings 15 02140 g014
Figure 15. Load-strain curve of the lower flange. (a) Specimen ZH-1. (b) Specimen ZH-2. (c) Specimen ZH-3. (d) Specimen ZH-4. (e) Specimen ZH-5.
Buildings 15 02140 g015
Figure 16. The load-strain curve of the concrete. (a) Specimen ZH-1. (b) Specimen ZH-2. (c) Specimen ZH-3. (d) Specimen ZH-4. (e) Specimen ZH-5.
Buildings 15 02140 g016
Figure 17. Composite plate model.
Buildings 15 02140 g017
Figure 18. Contact surface configurations.
Buildings 15 02140 g018
Figure 19. Uniaxial compression and tensile stress-strain curves of the concrete.
Buildings 15 02140 g019
Figure 20. Steel constitutive relationship curve.
Buildings 15 02140 g020
Figure 21. Comparison of load-deflection curves for specimens ZH-3 and ZH-4. (a) Specimen ZH-3. (b) Specimen ZH-4.
Buildings 15 02140 g021
Figure 22. Stress cloud map of the profiled steel sheet.
Buildings 15 02140 g022
Figure 23. Strain cloud map of the concrete.
Buildings 15 02140 g023
Figure 24. Stress cloud map of the reinforcement.
Buildings 15 02140 g024
Figure 25. Comparison of load-deflection curves under different parameters. (a) The influence of different hollow rates. (b) The influence of different thicknesses of the profiled steel sheets. (c) The influence of different thickness of the composite floor slabs.
Buildings 15 02140 g025
Figure 26. Calculation model for flexural capacity of the composite floor slabs. (a) Calculation diagram of profiled steel sheet–hollow concrete slabs. (b) Composite floor section stress.
Buildings 15 02140 g026
Figure 27. The calculation diagram of bending moment considering section balance. (a) Without reinforcement arrangement. (b) With reinforcement arrangement.
Buildings 15 02140 g027
Table 1. Section parameters of the profiled steel sheets.
Width/mmThickness
/mm
Yielding Strength
f y /MPa
Tensile Strength
f u /MPa
Elastic Modulus E /MPaSection Inertia Moment
I a /(cm4/m)
Weight Per Square Meter/kg
8300.8227.83319.042.06 × 105181.310.46
Table 2. Reinforcement behavior parameters.
Reinforcement Specification f y /MPa f u /MPa E /MPaElongation After Fracture/%
A103004202.06 × 10525
Table 3. Design dimensions of the specimens.
No.Reinforcement ArrangementReinforcement Ratio/%Hollow Radius/mmHollow Rate/%
ZH-1002511.5
ZH-200207.3
ZH-3003016.5
ZH-42A100.32511.5
ZH-54A100.62511.5
Table 4. Test results of bearing capacity.
No. P c r /kN P y /kN Δ y /mm P u /kN Δ u /mmDuctility Coefficient
ZH-128.129.51.8233.12.531.39
ZH-228.829.61.6433.62.721.66
ZH-327.629.313.132.522.41.71
ZH-442.764.918.976.148.32.56
ZH-557.879.611.893.556.74.81
Table 5. Comparison of finite element calculation values and test values of the specimens.
No. P y /kN Δ y /mm P u /kN Δ u /mm
Test Value Finite Element Test Value Finite Element Test Value Finite Element Test Value Finite Element
ZH-329.428.413.112.332.531.822.424.6
ZH-464.966.718.913.476.170.148.332.4
Table 6. Finite element calculation values with different parameters.
No.Hollow RateReinforcement RatioThickness of Steel Sheet/mmThickness of Composite Slab/mm P y /kN Δ y /mm P u /kN Δ u /mmDuctility Coefficient
BASE11.5%0%0.814027.67.432.622.33.01
KX-17.3%0%0.814029.47.033.521.93.13
KX-216.5%0%0.814027.49.631.824.62.56
KX-322.5%0%0.814026.510.131.426.72.64
GB-111.5%0%0.914026.87.334.822.13.03
GB-211.5%0%1.014028.57.037.321.83.11
GB-311.5%0%1.114030.26.840.421.43.15
BH-111.5%0%0.813025.99.628.422.42.33
BH-211.5%0%0.815032.95.936.519.93.37
BH-311.5%0%0.816035.55.741.518.33.21
Table 7. Comparison between calculation and test values of ultimate bending moment of the composite floor slabs.
No. Theoretical   Value   M p /kN·m Test   Value   M u /kN·m M p / M u
ZH-126.810.12.7
ZH-226.89.82.7
ZH-326.89.03.0
ZH-431.722.81.39
ZH-536.528.11.3
Table 8. Comparison of calculation, test, and simulated ultimate bending moment of the composite floor slabs.
No. Theoretical   Value   M p /kN·m Test   Value   M u /kN·m Simulated   Value   M f /kN·m M p / M u
ZH-113.510.110.81.3
ZH-213.59.910.81.3
ZH-313.59.810.81.3
ZH-424.522.825.11.1
ZH-524.928.125.80.9
Average value---1.2
Standard deviation---0.15
Table 9. Specific parameters of the test sheet.
No.Ls/mmL/mmh/mm Test   Value   M u /kN·m Theoretical   Value   M p /kN·m M p / M u
AWS-1655230014013.15613.2401.01
AWL-110104000180 23.845 21.6650.91
BTS-1750300018022.01320.5080.93
BTL-1117547025039.55633.9150.86
Note: L is the calculated span. Ls is the shear span length. h is the height of the composite floor section.
Disclaimer/Publisher’s Note: The statements, opinions and data contained in all publications are solely those of the individual author(s) and contributor(s) and not of MDPI and/or the editor(s). MDPI and/or the editor(s) disclaim responsibility for any injury to people or property resulting from any ideas, methods, instructions or products referred to in the content.

