
Time-Dependent Bearing Capacity of Jacked Piles in Soft Soil Based on Non-Darcy Seepage

Abstract
1. Introduction
2. Theoretical Analysis
2.1. Consolidation Governing Equation
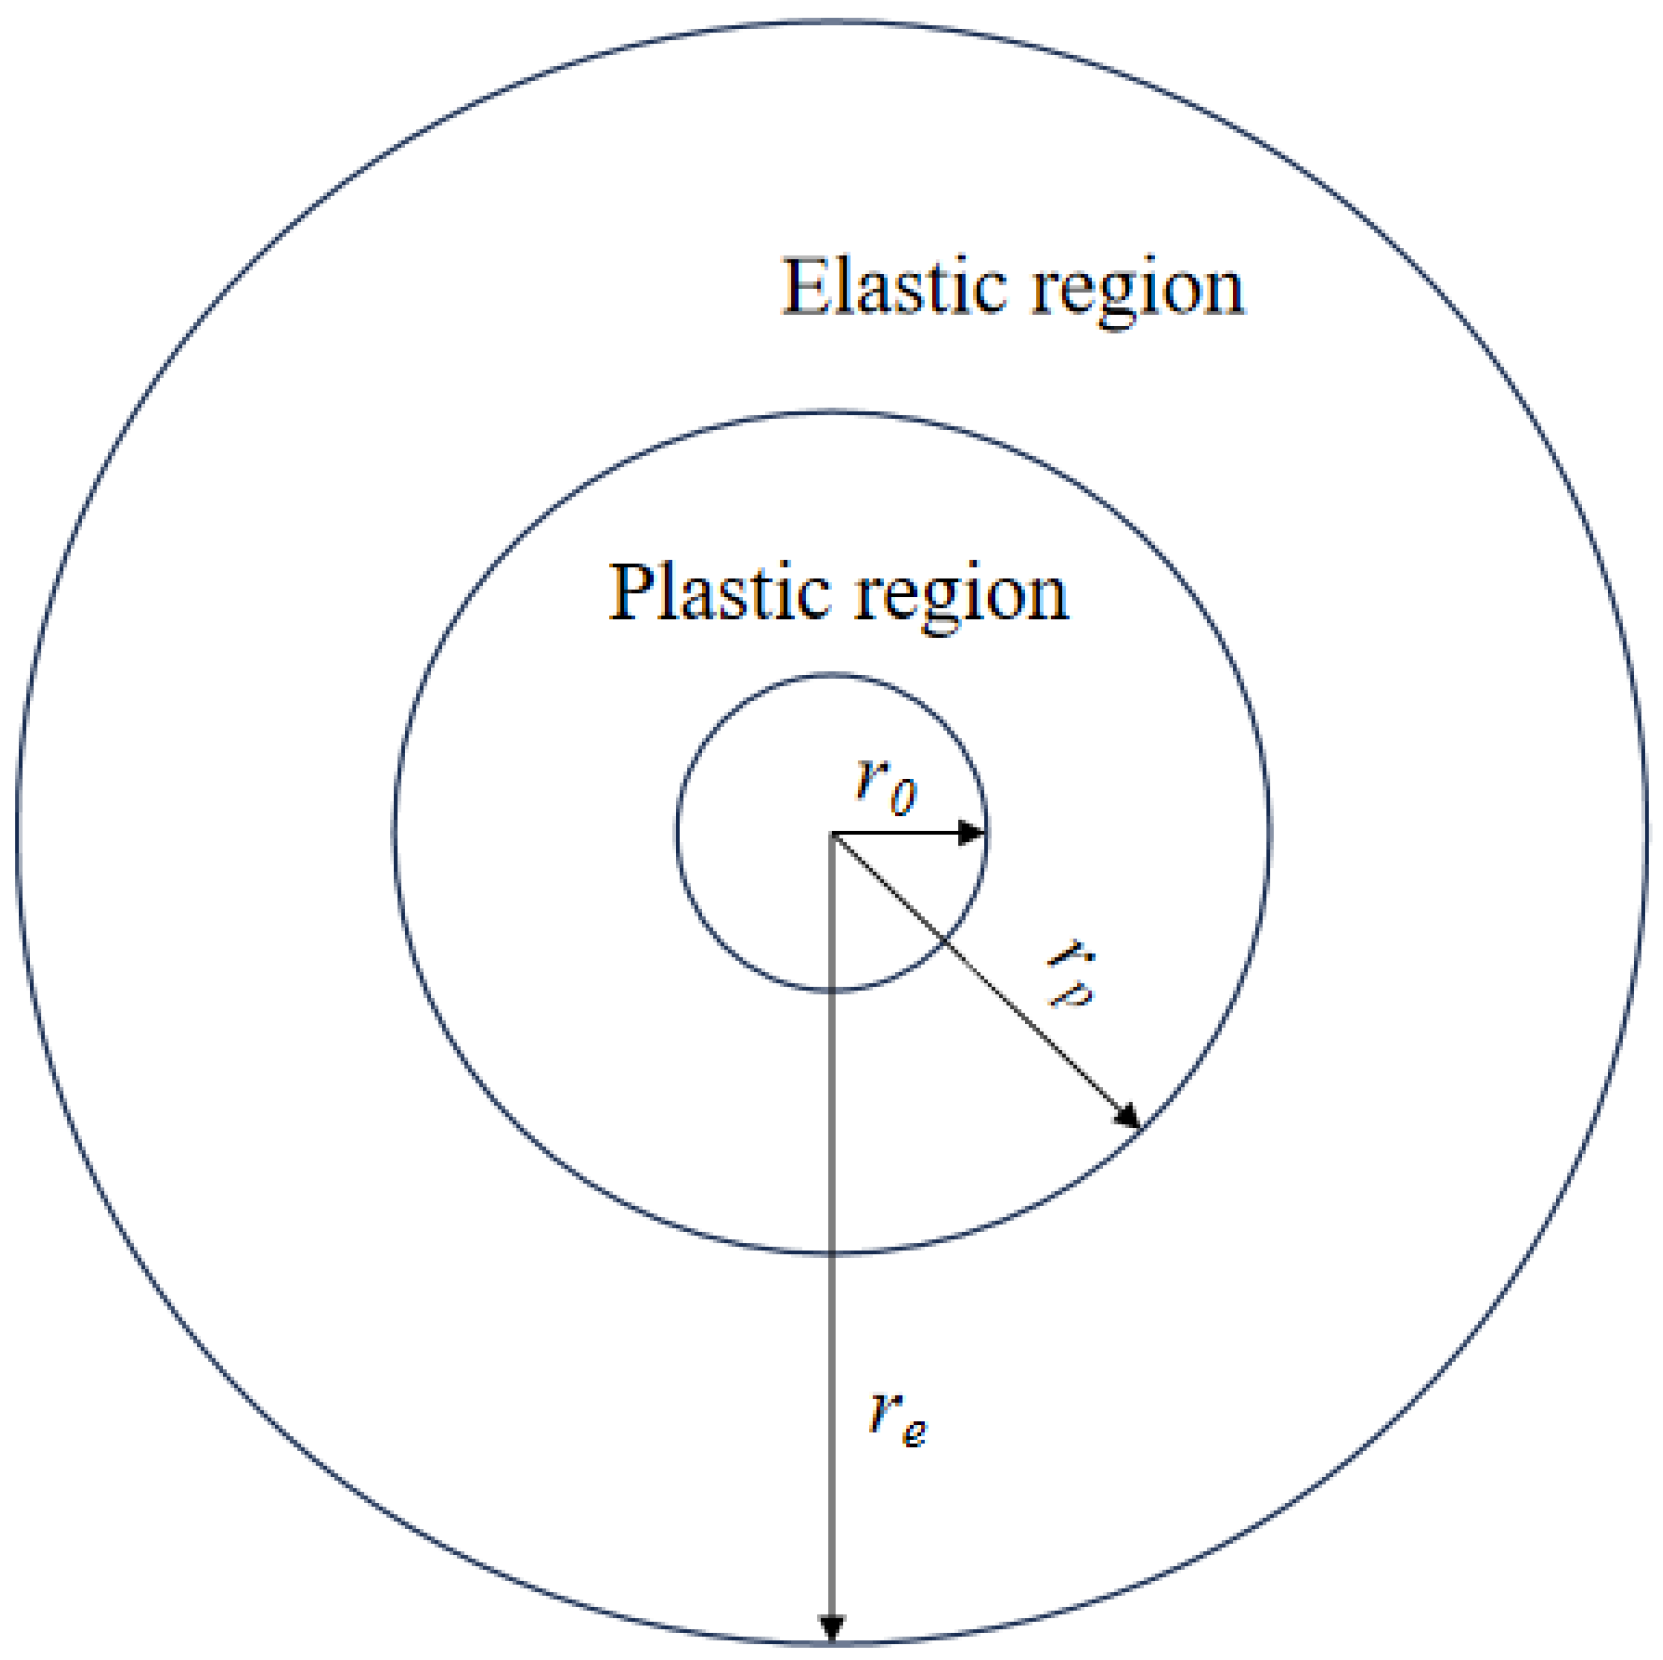
2.1.1. Fundamental Assumption
2.1.2. Consolidation Governing Equations
2.1.3. Initial EPWP
2.1.4. Solution Constraints
- (1)
- Initial condition
- (2)
- Boundary conditions
2.2. Finite Difference Solution of the Consolidation Control Equation
2.2.1. Non-Dimensionalization
- (1)
- Initial condition
- (2)
- Boundary conditions
2.2.2. Finite Difference Solution
2.3. Calculate the Pile Consolidation Degree
3. Numerical Simulation
3.1. Numerical Model
3.1.1. Basic Information of the Model
- Determine the soil constitutive model
- 2.
- Set up pile–soil contact
- 3.
- Boundary conditions
- 4.
- Initial in situ stress equilibrium
3.1.2. Modeling Steps
- (1)
- Soil modeling. CAX4P elements, which are four-node x axisymmetric pore pressure elements with structured meshing.
- (2)
- Pile configuration. A discrete rigid body (r = 0.25 m) using two-node axisymmetric elements, 10 m penetration via displacement boundary.
- (3)
- Geometry optimization. A 60° tapered pile tip with arc transition.
- (4)
- Constraint solution. A frictionless rigid pipe with 1 mm diameter along the central axis to prevent soil displacement crossover.
3.2. Results and Discussion
3.2.1. Pile Sinking Process
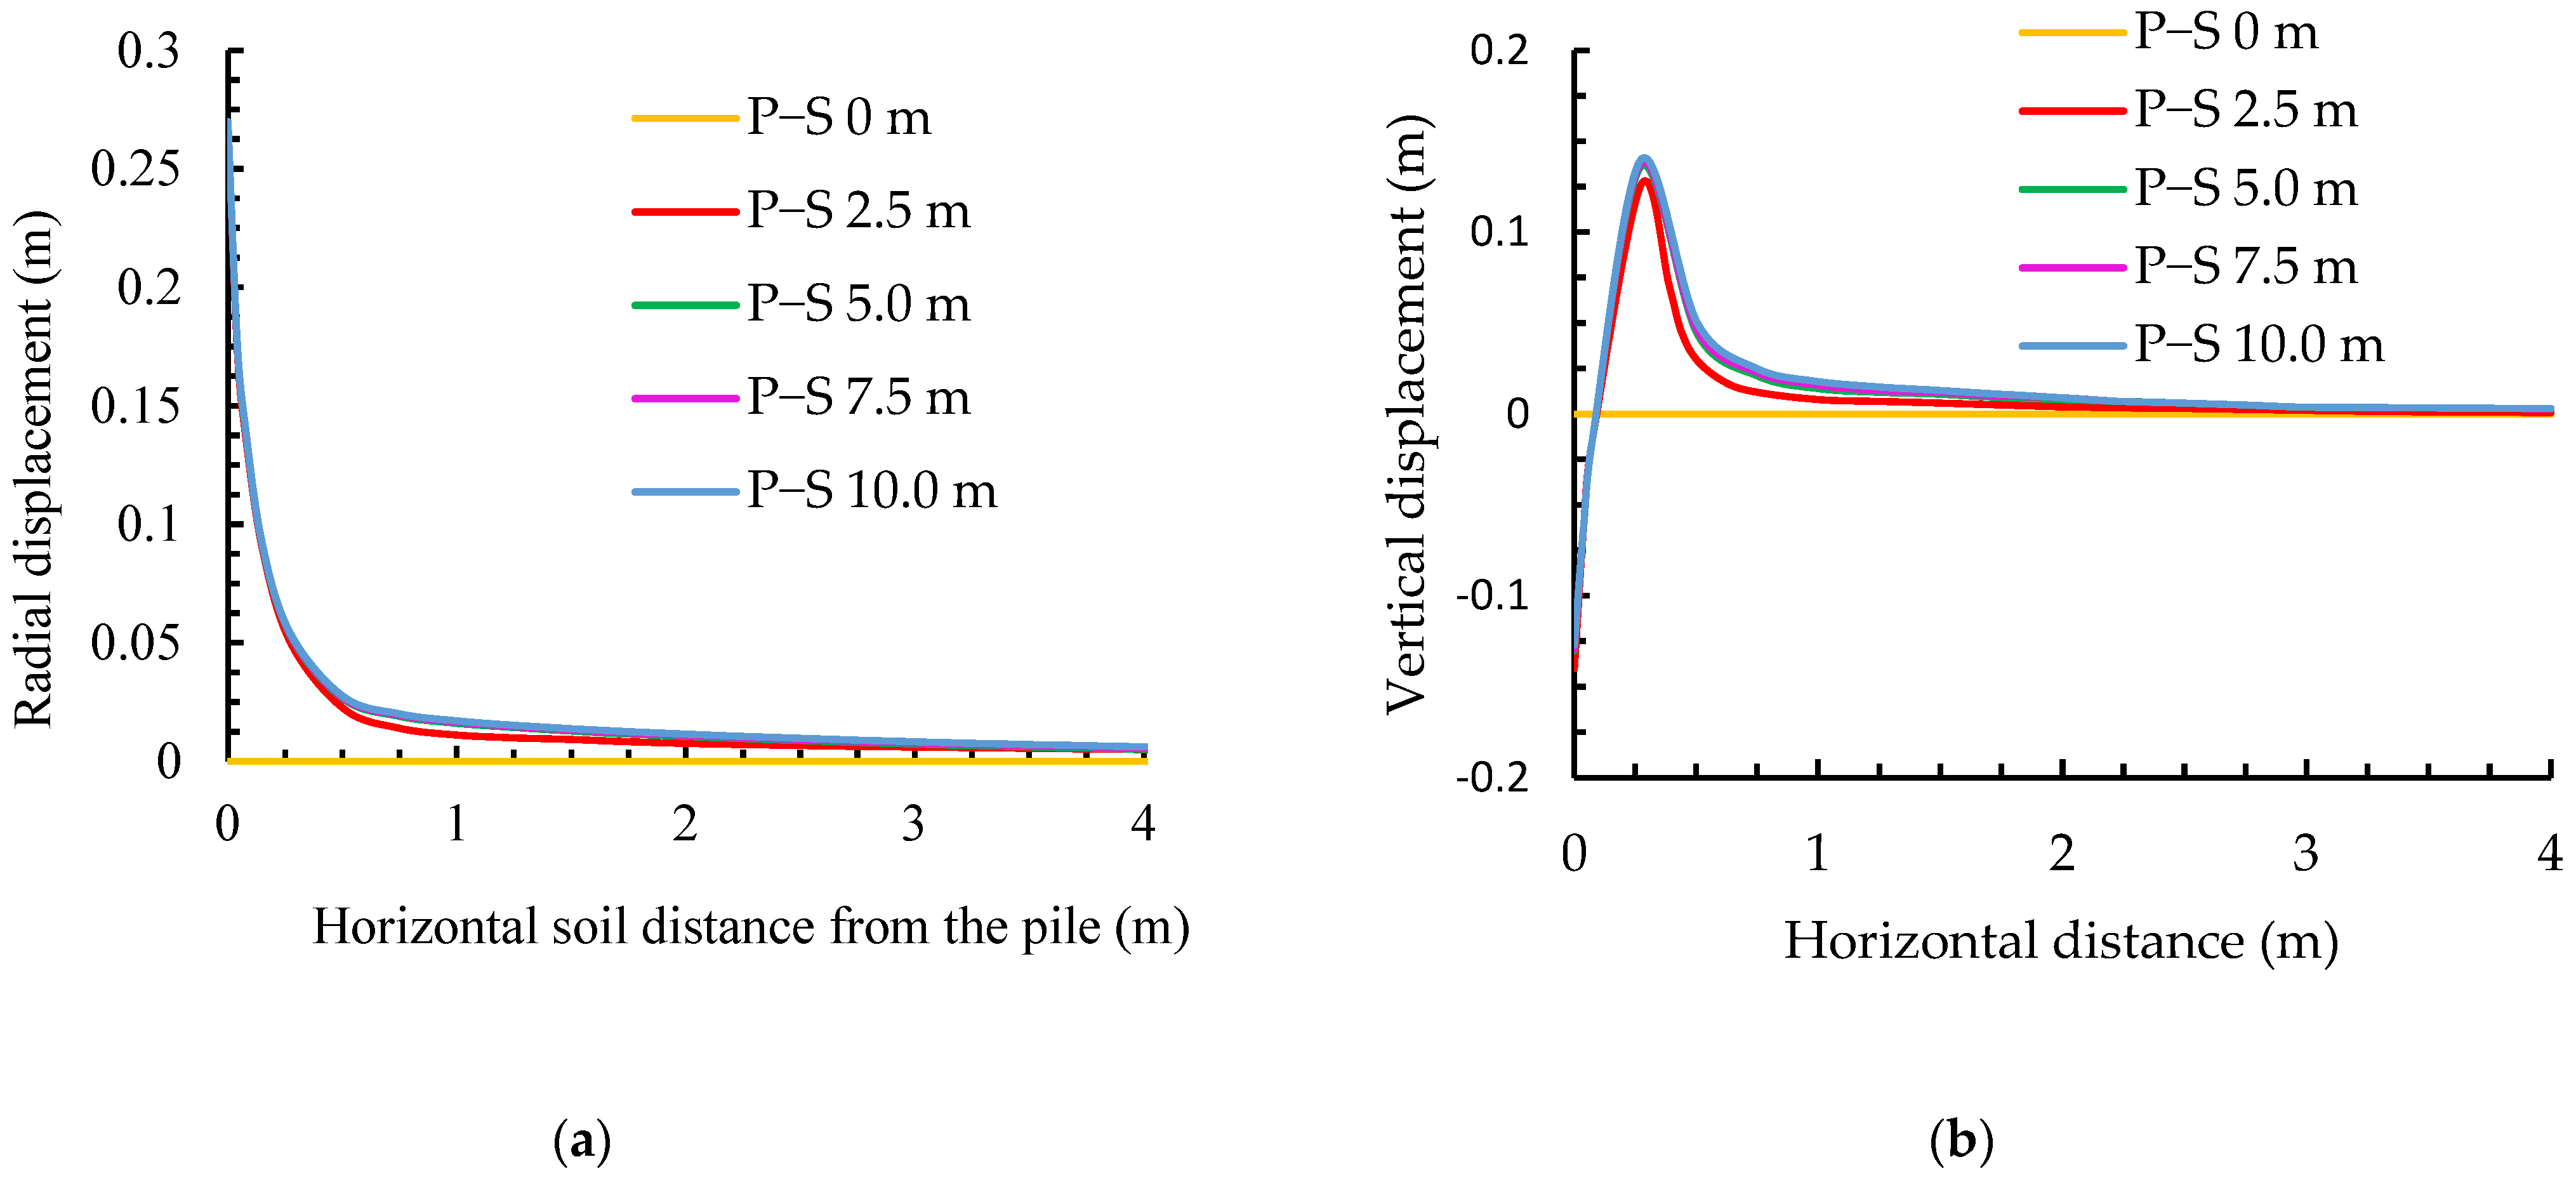
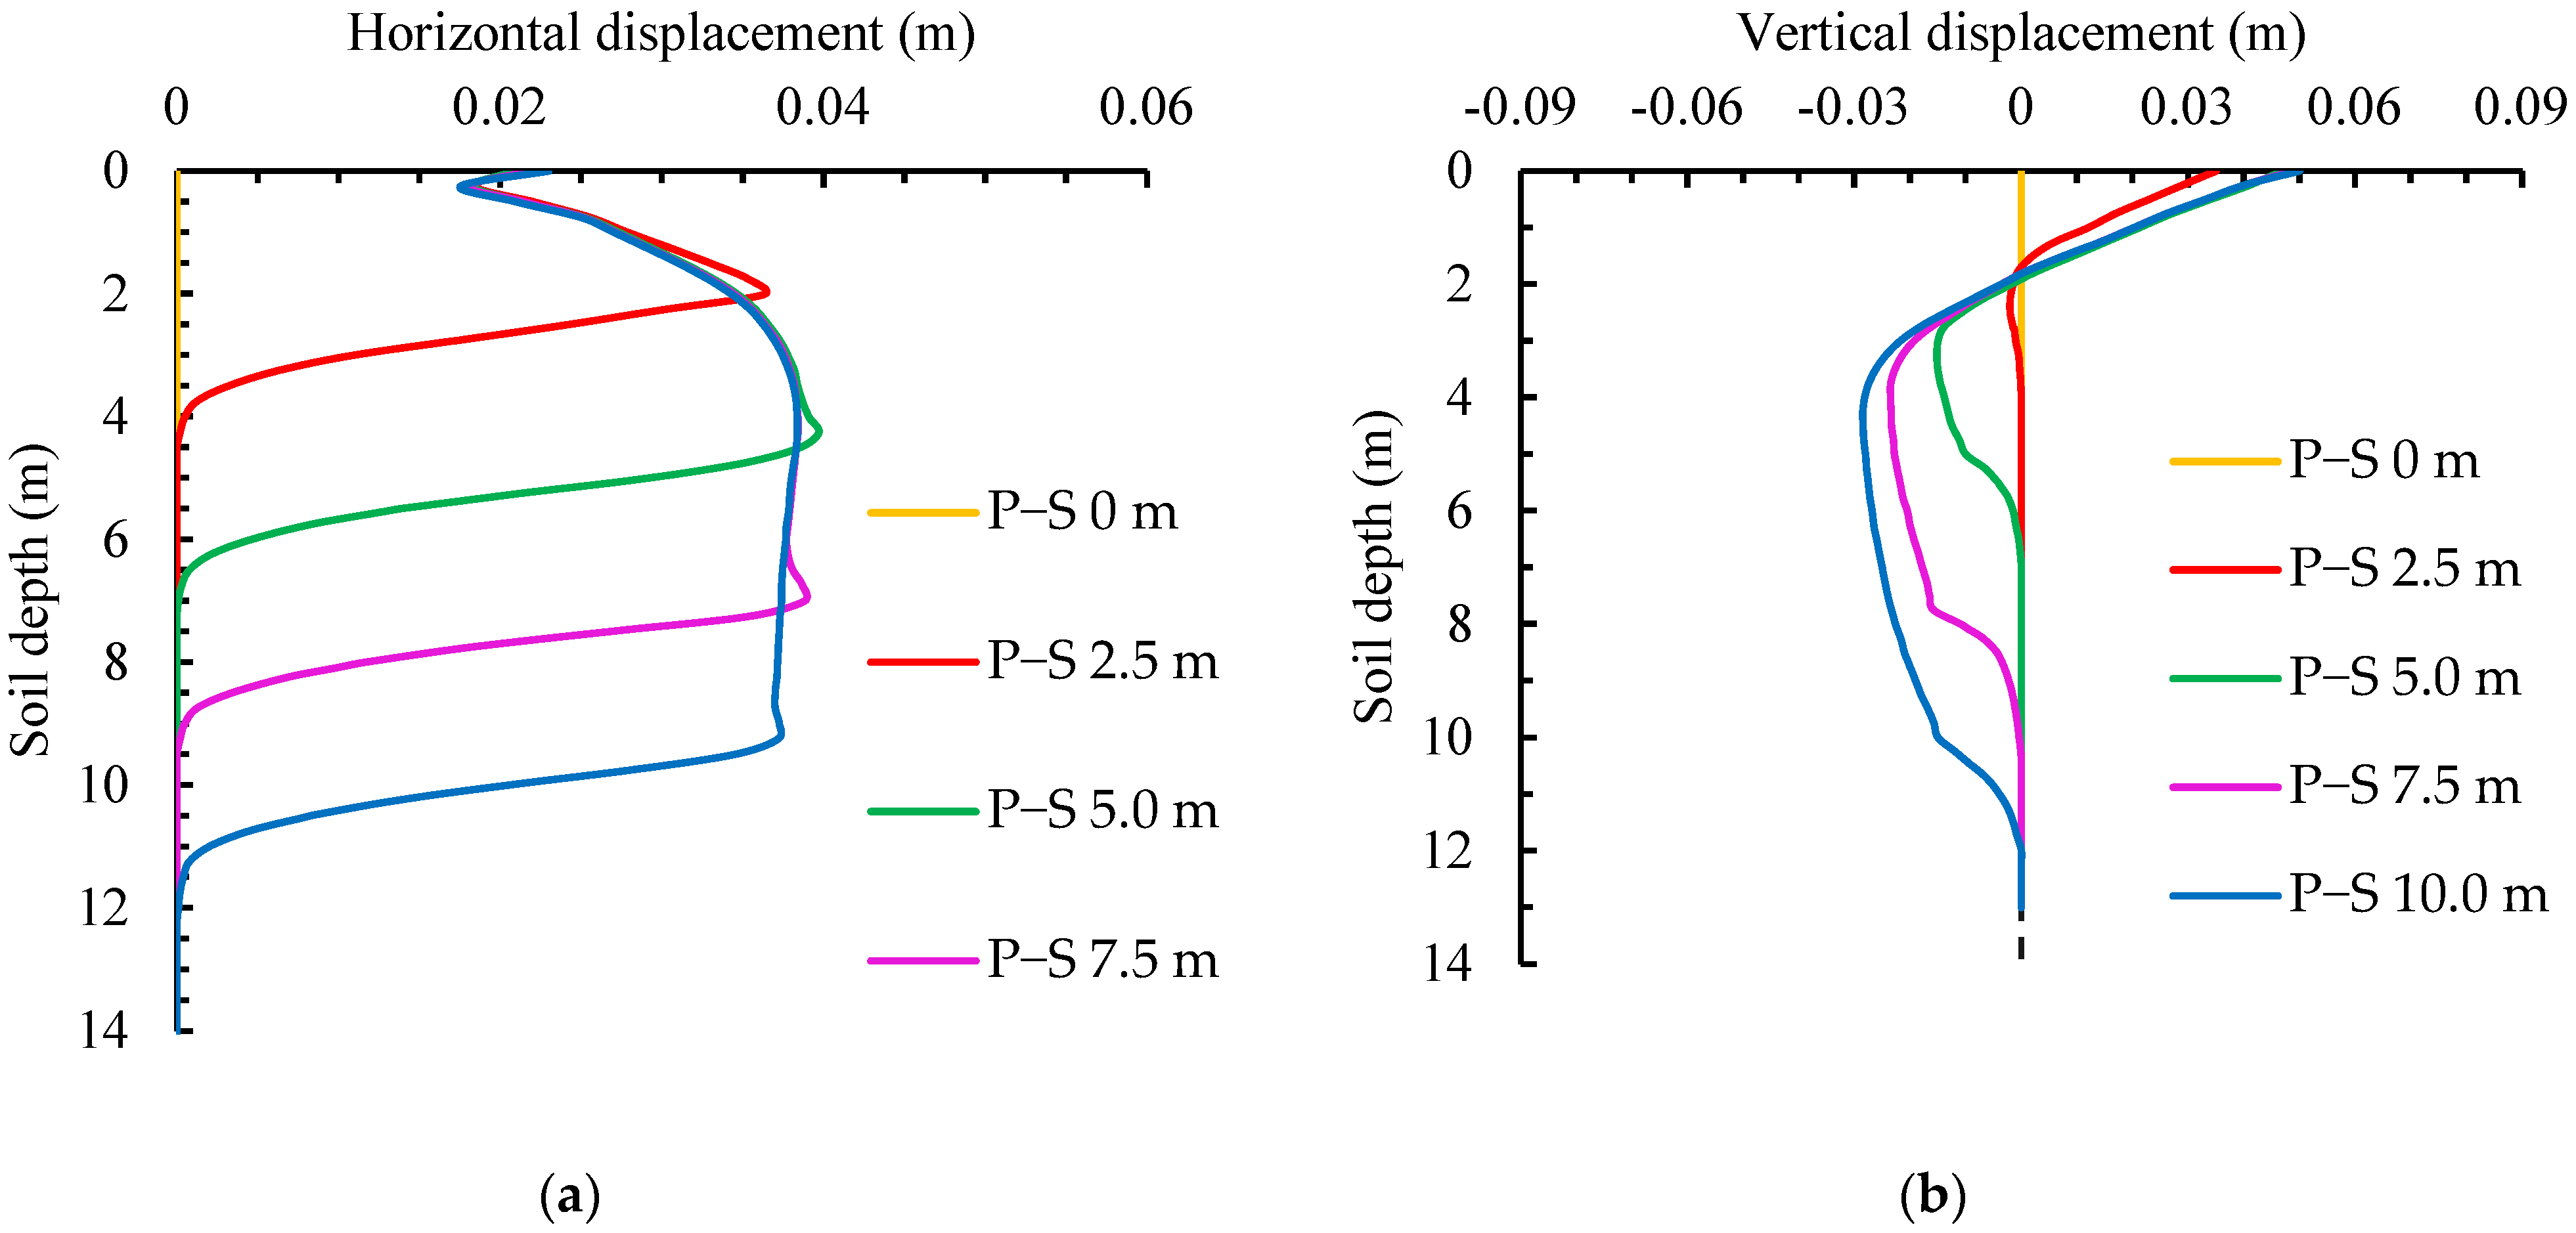
- Displacement
- (1)
- Pile installation
- (2)
- After pile installation
- 2.
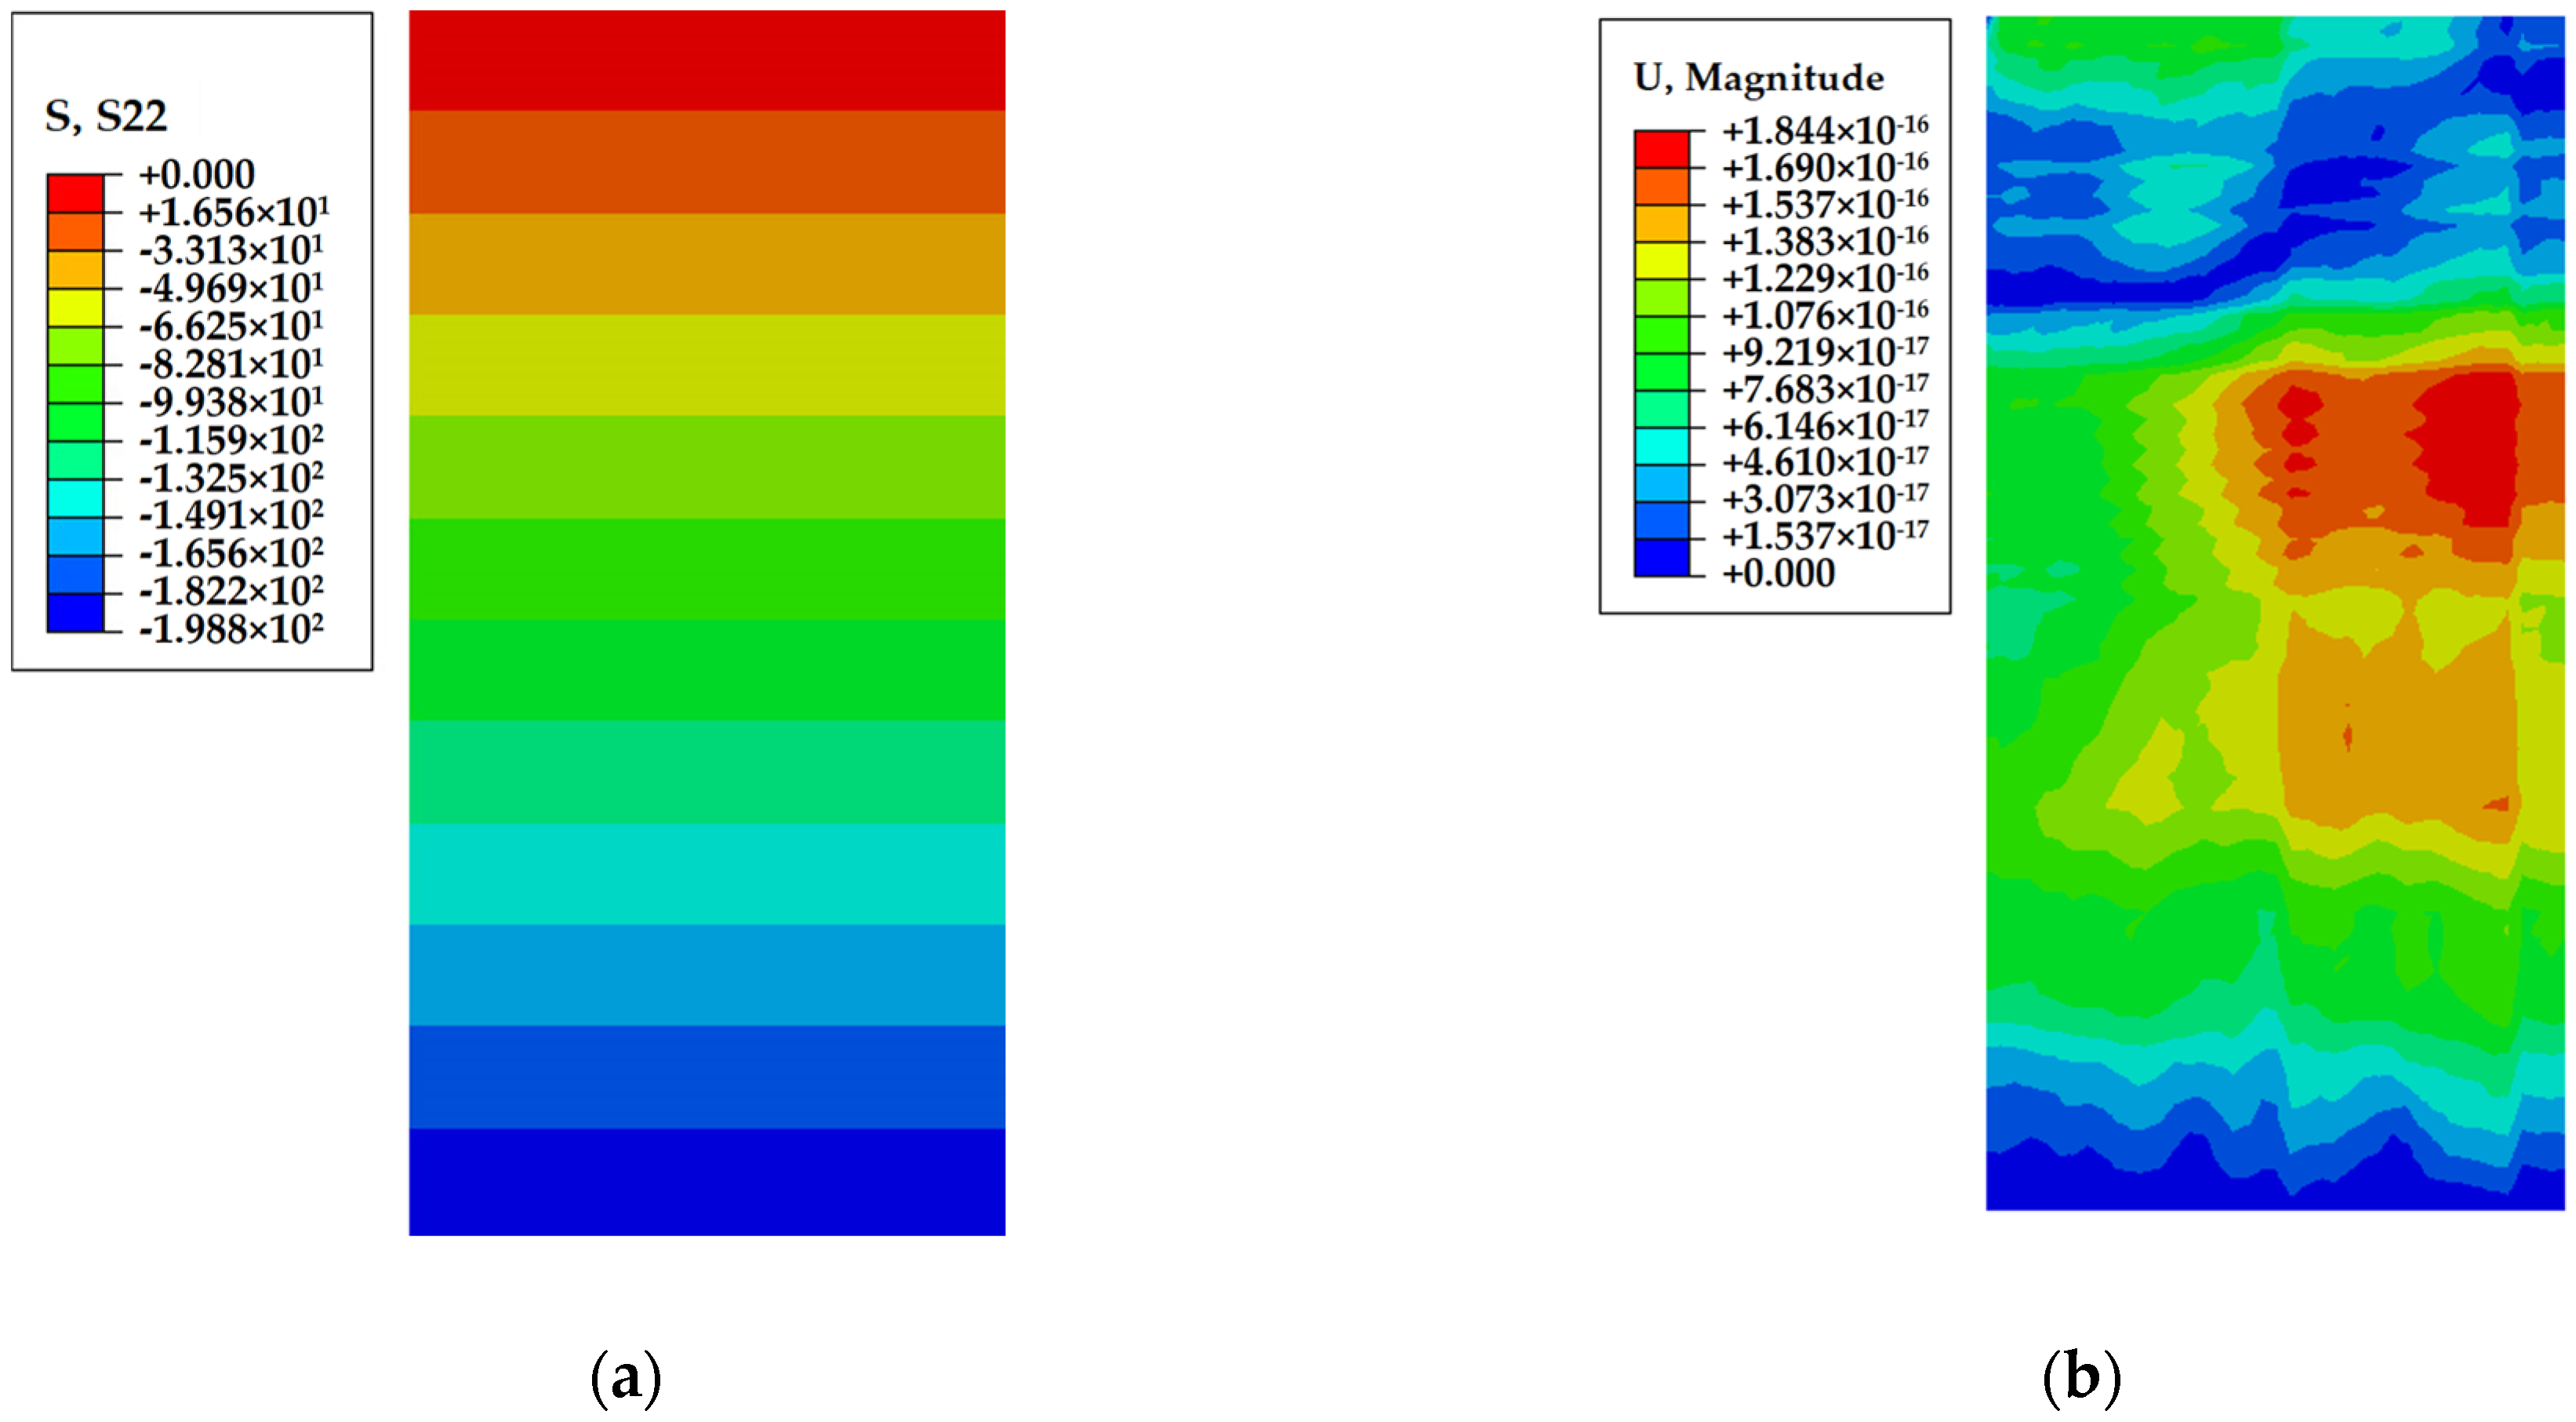
- Stress
- (1)
- Stress during pile driving
- (2)
- Stress post-pile driving
- 3.
- Pore pressure of soil
- (1)
- EPWP variation during pile driving
- (2)
- Soil EPWP field post-pile driving
3.2.2. Soil Reconsolidation Around Piles
- EPWP dissipation
- 2.
- Soil Stress Changes
3.2.3. Impact of Various Parameters on Soil Squeezing
- Pile diameter
- 2.
- Friction Coefficient
3.2.4. Impact of Soil Parameters on the Reconsolidation Process
- Permeability coefficient
- 2.
- Poisson’s ratio
4. Analysis of the Timeliness of Piles’ Bearing Capacity
- (1)
- Ultimate frictional resistance in Equation (31).
- (2)
- Ultimate end resistance in Equation (35)
5. Conclusions
- (1)
- A radial consolidation equation for soil around statically pressed piles in soft-soil foundations based on non-Darcy seepage was established by incorporating the Slepicka exponential seepage equation. Subsequently, the EPWP in the soil surrounding the piles was solved using the Crank–Nicolson difference method.
- (2)
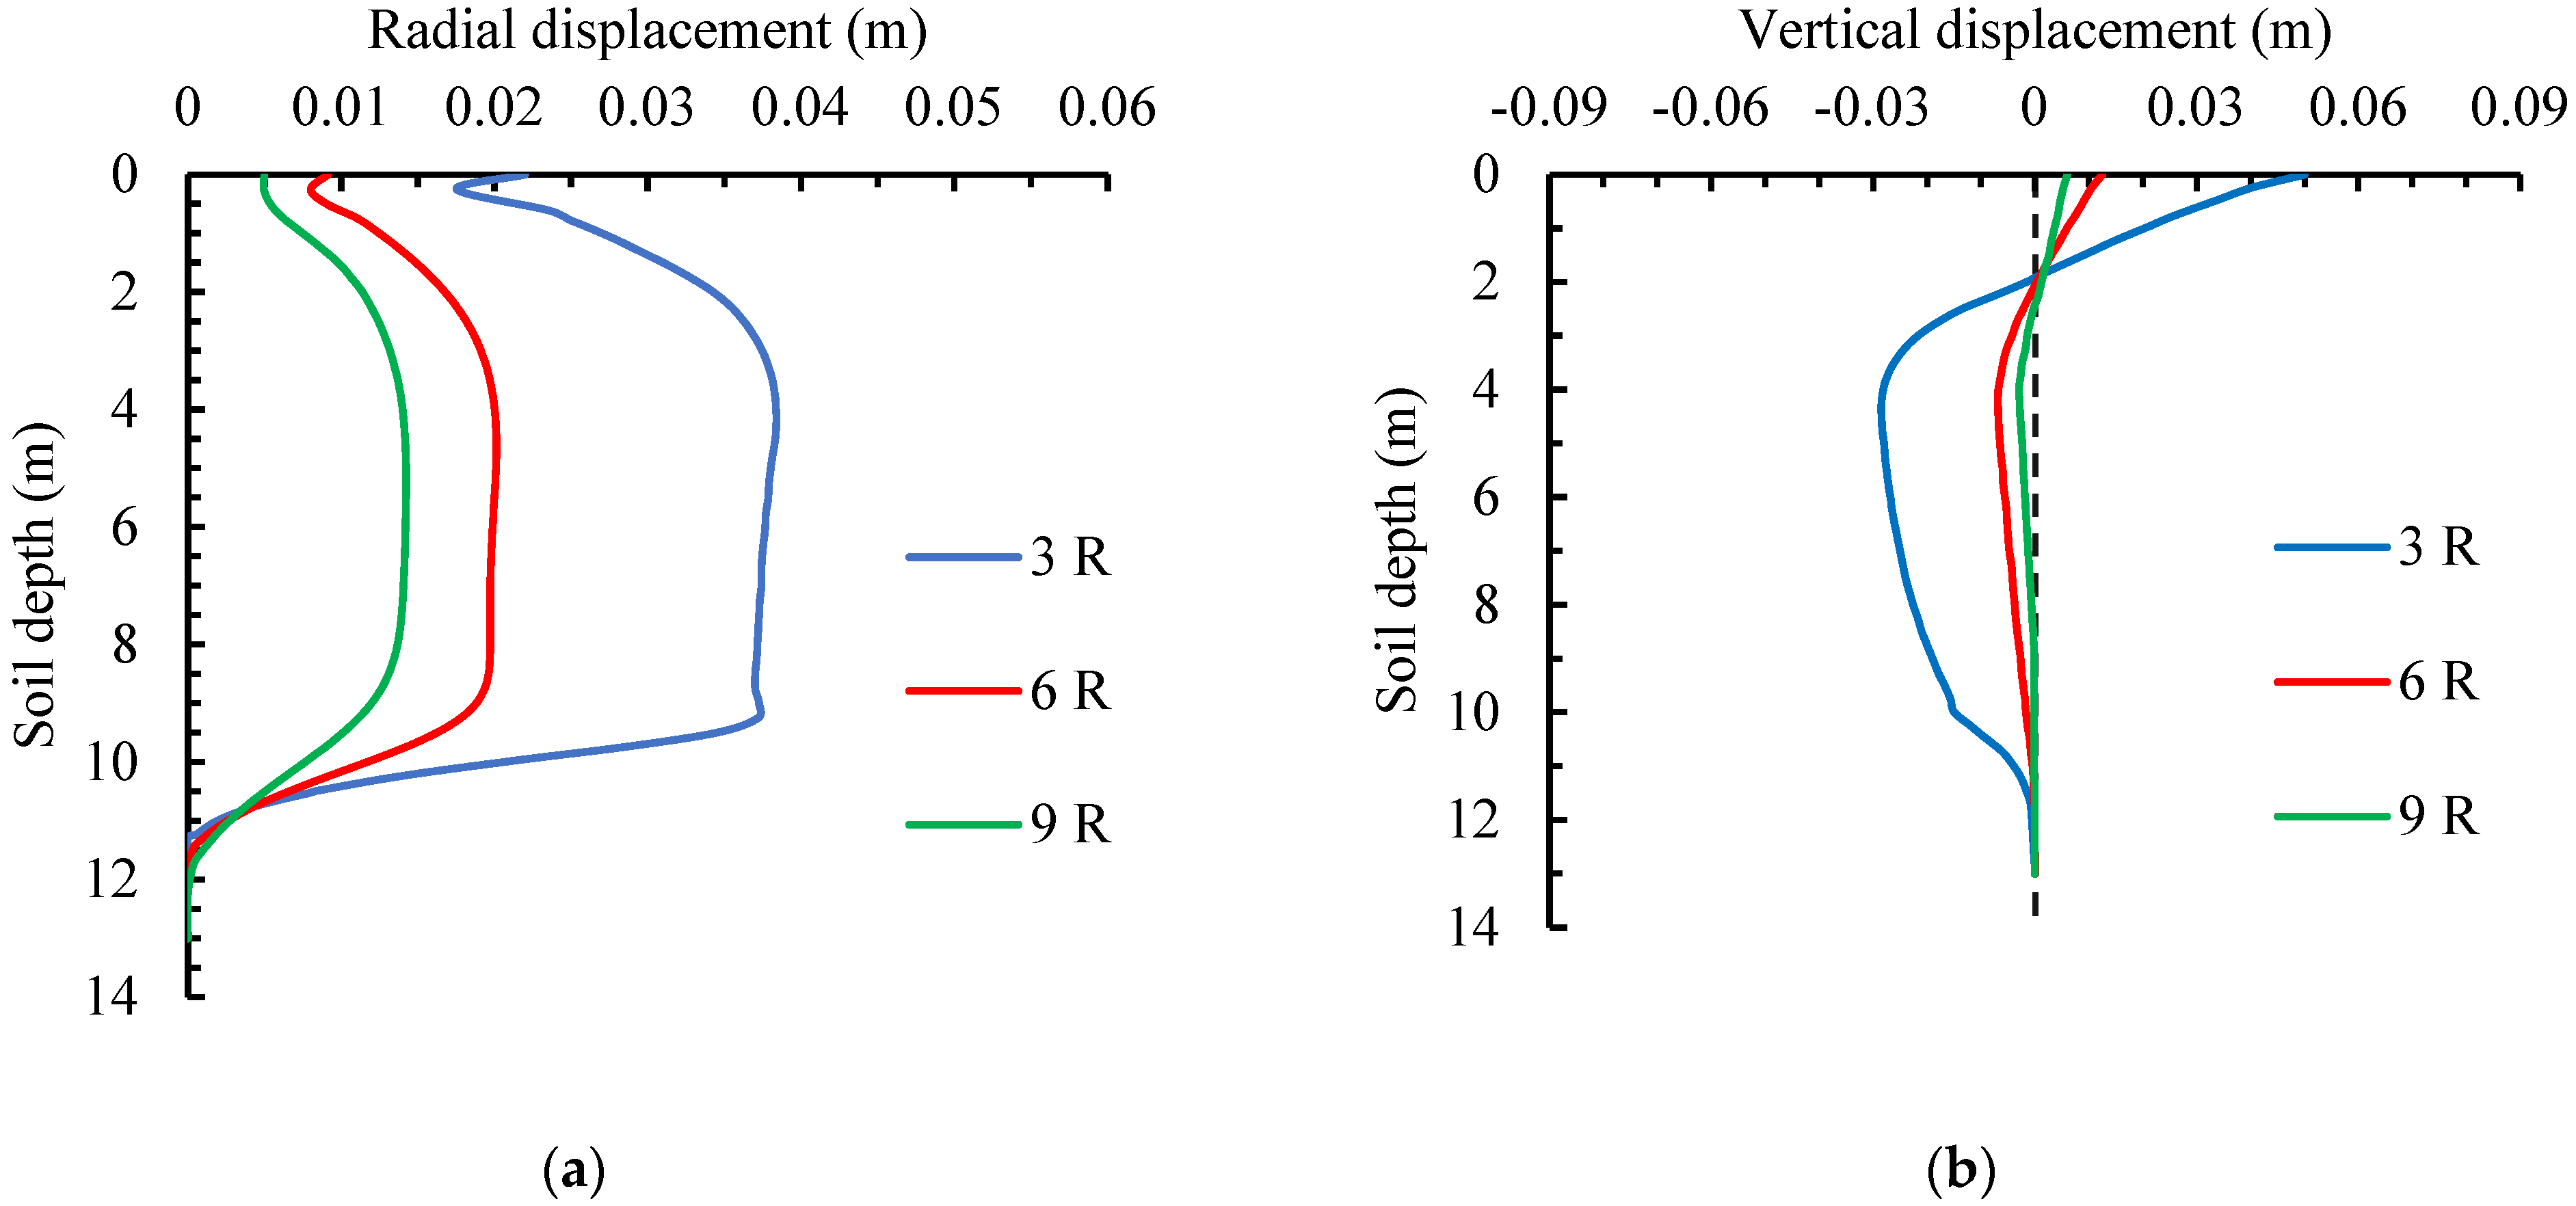
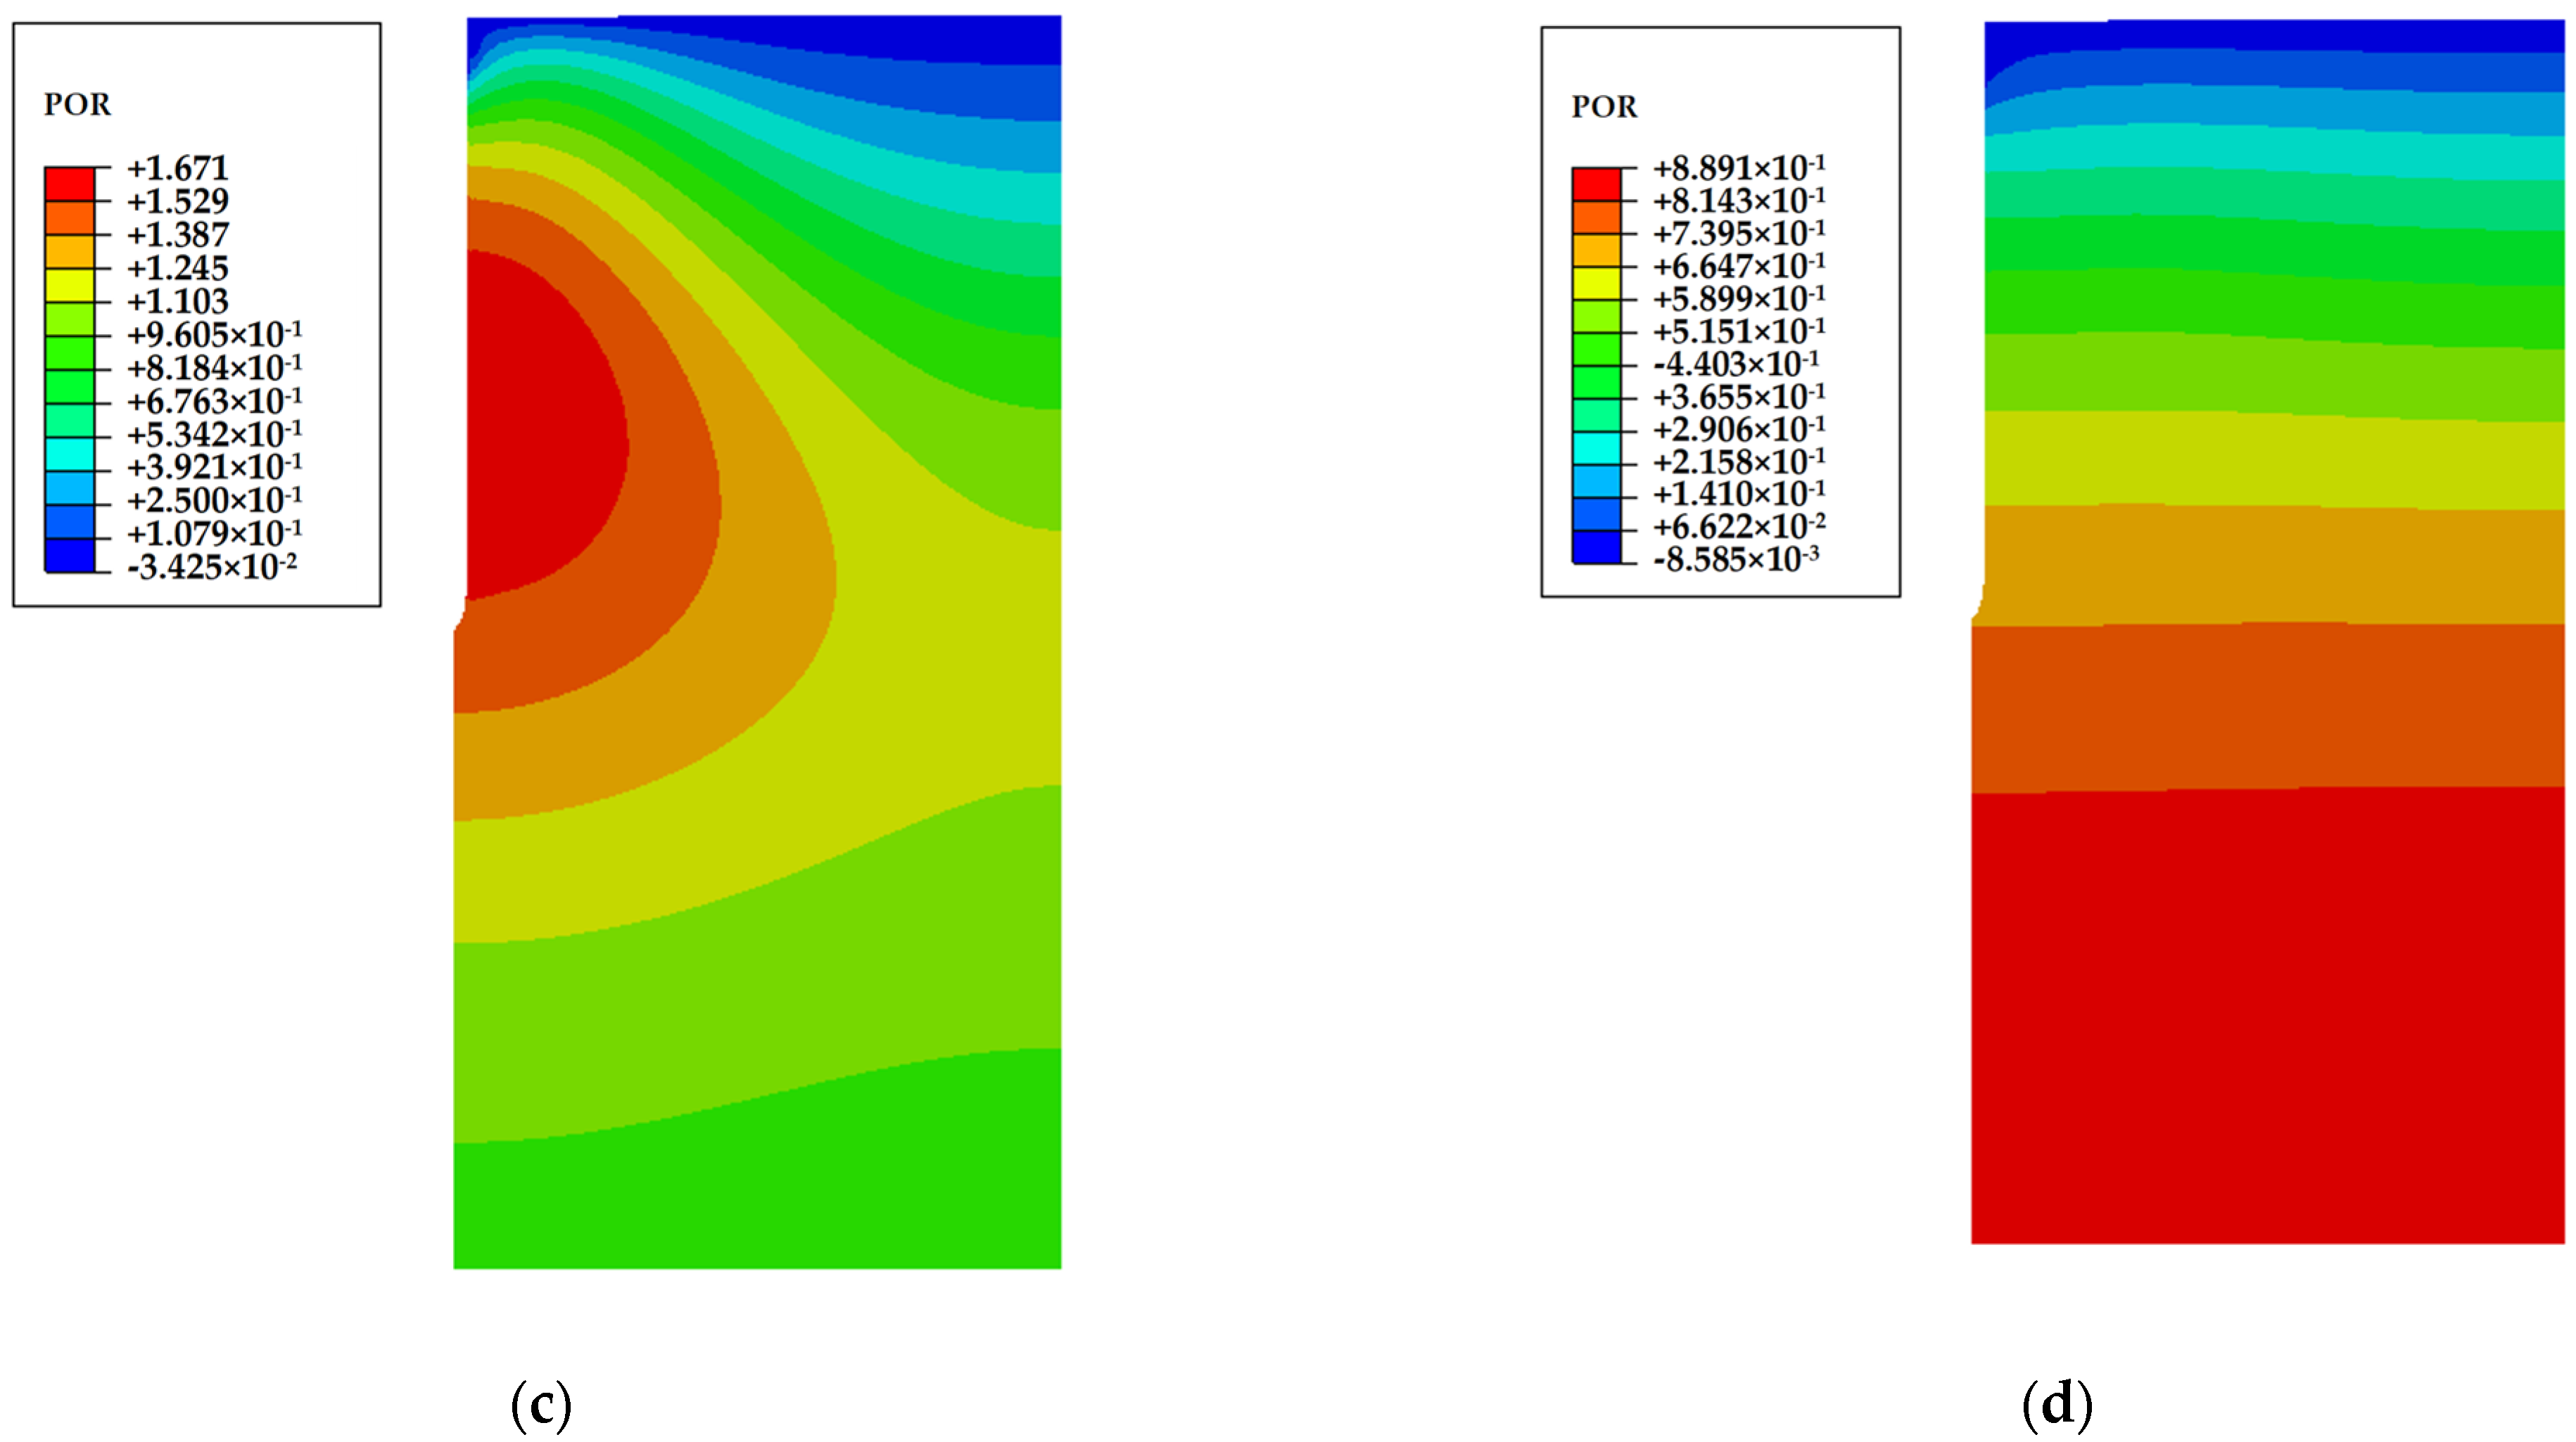
- The radial displacement of the soil decreases logarithmically as the radial distance increases. The vertical displacement drops rapidly in the range of 2 m underground. Then, it first increases and finally stabilizes with depth, reaching its peak near the pile tip. Both the radial and vertical stresses decreased with the increase in radial distance and rise with the increase in depth, attaining their maximum values at the pile tip. EPWP decays logarithmically in the radial direction, increases linearly within the pile body along the vertical direction, and spikes sharply at the pile tip.
- (3)
- In the early consolidation stage, the soil around the pile consolidates, which significantly enhances the soil strength and effective stress. As a result, the bearing capacity of the statically pressed piles is greatly increased. In the later stage (5 days after consolidation), with the gradual dissipation of EPWP in the surrounding soil, the bearing capacity of the piles continues to increase steadily. Therefore, in practical projects, when designing pile foundations, the timeliness of the pile foundation bearing capacity should be fully considered.
Author Contributions
Funding
Data Availability Statement
Conflicts of Interest
Abbreviations
| EPWP | Excess pore water pressure |
| NCL | Normal consolidation line |
| POR | Pore Pressure Ratio |
| P-S | Pile sinking |
References
- Cao, L.; Teh, C.; Chang, M. Undrained cavity expansion in modified Cam clay I: Theoretical analysis. Geotechnique 2001, 51, 323–334. [Google Scholar] [CrossRef]
- Wang, J.T.; Song, X.H.; Zhang, L.W. Research on Time Effect of Bearing Capacity of Jacked Pile in Soft Soil. Adv. Mater. Res. 2012, 403, 1896–1899. [Google Scholar] [CrossRef]
- Chen, S.; Abousleiman, Y. Exact undrained elasto-plastic solution for cylindrical cavity expansion in modified Cam Clay soil. Géotechnique 2012, 62, 447–456. [Google Scholar] [CrossRef]
- Grevtsev, A.; Fedorovskii, V. Formula for Limiting Pressure of Cavity Expansion and its Practical Application. Soil Mech. Found. Eng. 2013, 50, 179–186. [Google Scholar] [CrossRef]
- Li, L.; Li, J.; Sun, D.A.; Gong, W. Analysis of time-dependent bearing capacity of a driven pile in clayey soils by total stress method. Int. J. Geomech. 2017, 17, 04016156. [Google Scholar] [CrossRef]
- Cheng, T.; Yu, Z.; Zheng, J.; Du, J.; Zhang, Y.; Garg, A.; Garg, A. Improvement of the cavity expansion theory for the measurement of strain softening in over consolidated saturated clay. Measurement 2018, 119, 156–166. [Google Scholar] [CrossRef]
- Zhou, P.; Li, J.; Li, L.; Liu, G.; Li, P. Investigation of the time-dependent bearing capacity of a jacked pile in saturated structured clays. Comput. Geotech. 2023, 161, 105599. [Google Scholar] [CrossRef]
- Zhong, W.; Wan, Q.; Nie, N.; Ding, H.; Gao, F.; Xu, C. Research on the Optimal Design of Retaining Piles of a Wide Metro Tunnel Foundation Pit Based on Deformation Control. Buildings 2024, 14, 1906. [Google Scholar] [CrossRef]
- Basu, P.; Prezzi, M.; Salgado, R.; Chakraborty, T. Shaft resistance and setup factors for piles jacked in clay. J. Geotech. Geoenviron. Eng. 2014, 140, 04013026. [Google Scholar] [CrossRef]
- Abu-Farsakh, M.; Rosti, F.; Souri, A. Evaluating pile installation and subsequent thixotropic and consolidation effects on setup by numerical simulation for full-scale pile load tests. Can. Geotech. J. 2015, 52, 1734–1746. [Google Scholar] [CrossRef]
- Shao, Y.; Wang, S.-c.; Guan, Y. Numerical simulation of soil squeezing effects of a jacked pipe pile in soft foundation soil and in foundation soil with an underlying gravel layer. Geotech. Geol. Eng. 2016, 34, 493–499. [Google Scholar] [CrossRef]
- Sabetamal, H.; Carter, J.P.; Nazem, M.; Sloan, S.W. Coupled analysis of dynamically penetrating anchors. Comput. Geotech. 2016, 77, 26–44. [Google Scholar] [CrossRef]
- Dou, J.; Chen, J.; Liao, C. Method for estimating initial excess pore pressure during pile jacking into saturated fine-grained soil. Comput. Geotech. 2019, 116, 103203. [Google Scholar] [CrossRef]
- Karlsson, M.; Yannie, J.; Dijkstra, J. Modeling aging of displacement piles in natural soft clay. J. Geotech. Geoenviron. Eng. 2019, 145, 04019070. [Google Scholar] [CrossRef]
- Su, D.; Wu, Z.; Lei, G.; Zhu, M. Numerical study on the installation effect of a jacked pile in sands on the pile vertical bearing capacities. Comput. Geotech. 2022, 145, 104690. [Google Scholar] [CrossRef]
- Zuo, H.L.; Wang, L.; Gao, H.Y.; Guo, L. Study on vertical bearing capacity and time effect of the Jacked-in PHC pipe pile in the cohesive soil area. Adv. Mater. Res. 2012, 368, 2706–2710. [Google Scholar] [CrossRef]
- Ng, K.W.; Roling, M.; AbdelSalam, S.S.; Suleiman, M.T.; Sritharan, S. Pile setup in cohesive soil. I: Experimental investigation. J. Geotech. Geoenviron. Eng. 2013, 139, 199–209. [Google Scholar] [CrossRef]
- Attar, I.H.; Fakharian, K. Influence of soil setup on shaft resistance variations of driven piles: Case study. Int. J. Civ. Eng. Trans. B Geotech. Eng. 2013, 11, 4–5. [Google Scholar]
- Elkasabgy, M.; El Naggar, M.H. Axial compressive response of large-capacity helical and driven steel piles in cohesive soil. Can. Geotech. J. 2015, 52, 224–243. [Google Scholar] [CrossRef]
- Afshin, A.; Rayhani, M. Evaluation of bearing capacity with time for small-scale piles driven into Leda clay. Int. J. Geotech. Eng. 2015, 9, 307–315. [Google Scholar] [CrossRef]
- Wang, Y.-Y.; Sang, S.-K.; Zhang, M.-Y.; Jeng, D.-S.; Yuan, B.-X.; Chen, Z.-X. Laboratory study on pile jacking resistance of jacked pile. Soil Dyn. Earthq. Eng. 2022, 154, 107070. [Google Scholar] [CrossRef]
- Wang, D.; Yang, X.; Zhang, S.; Chen, C.; Zhao, Y. Long-Term Bearing Capacity of Concrete Pile Composite Foundation under Composite Salt Erosion. Buildings 2024, 14, 289. [Google Scholar] [CrossRef]
- Slepicka, F. Contribution to the solution of the filtration law. Int. Union Geod. Geophys. Comm. Subterr. Waters 1960, 1, 245–258. [Google Scholar]
- Schmidt, J.D.; Westmann, R.A. Consolidation of porous media with non-Darcy flow. J. Eng. Mech. Div. 1973, 99, 1201–1216. [Google Scholar] [CrossRef]
- Hajduk, E.L. Full Scale Field Testing Examination of Pile Capacity Gain with Time; University of Massachusetts Lowell: Lowell, MA, USA, 2006. [Google Scholar]
- Zhao, C.; Fei, Y.; Zhao, C.; Jia, S. Analysis of expanded radius and internal expanding pressure for undrained cylindrical cavity expansion. Int. J. Geomech. 2018, 18, 04017139. [Google Scholar] [CrossRef]
- Guo, W.D. Theory and Practice of Pile Foundations; CRC Press: Boca Raton, FL, USA, 2012. [Google Scholar]
- Janbu, N. Static bearing capacity of friction piles. In Proceedings of the Sechste Europaeische Konferenz Fuer Bodenmechanik Und Grundbau, Vienna, Austria, 22–24 March 1976. [Google Scholar]


| Effective Unit Weight (kN∙m−3) | Consolidation Parameter | Spring-Back Parameters | Poisson Ratio | Destructive Parameter | Permeability Coefficient k (m/s) | NCL Calculates the Intercept e* |
|---|---|---|---|---|---|---|
| 10 | 0.15 | 0.05 | 0.3 | 1 | 1.1 |
Disclaimer/Publisher’s Note: The statements, opinions and data contained in all publications are solely those of the individual author(s) and contributor(s) and not of MDPI and/or the editor(s). MDPI and/or the editor(s) disclaim responsibility for any injury to people or property resulting from any ideas, methods, instructions or products referred to in the content. |
© 2025 by the authors. Licensee MDPI, Basel, Switzerland. This article is an open access article distributed under the terms and conditions of the Creative Commons Attribution (CC BY) license (https://creativecommons.org/licenses/by/4.0/).
Share and Cite
Wu, L.; Zhao, C.; Bian, X.; Wei, X. Time-Dependent Bearing Capacity of Jacked Piles in Soft Soil Based on Non-Darcy Seepage. Buildings 2025, 15, 1760. https://doi.org/10.3390/buildings15111760
Wu L, Zhao C, Bian X, Wei X. Time-Dependent Bearing Capacity of Jacked Piles in Soft Soil Based on Non-Darcy Seepage. Buildings. 2025; 15(11):1760. https://doi.org/10.3390/buildings15111760
Chicago/Turabian StyleWu, Lin, Cong Zhao, Xiaoya Bian, and Xiang Wei. 2025. "Time-Dependent Bearing Capacity of Jacked Piles in Soft Soil Based on Non-Darcy Seepage" Buildings 15, no. 11: 1760. https://doi.org/10.3390/buildings15111760
APA StyleWu, L., Zhao, C., Bian, X., & Wei, X. (2025). Time-Dependent Bearing Capacity of Jacked Piles in Soft Soil Based on Non-Darcy Seepage. Buildings, 15(11), 1760. https://doi.org/10.3390/buildings15111760