
Fatigue Bond Behavior of Steel Rebars in Recycled Aggregate Concrete Containing Recycled Rubber

Abstract
1. Introduction
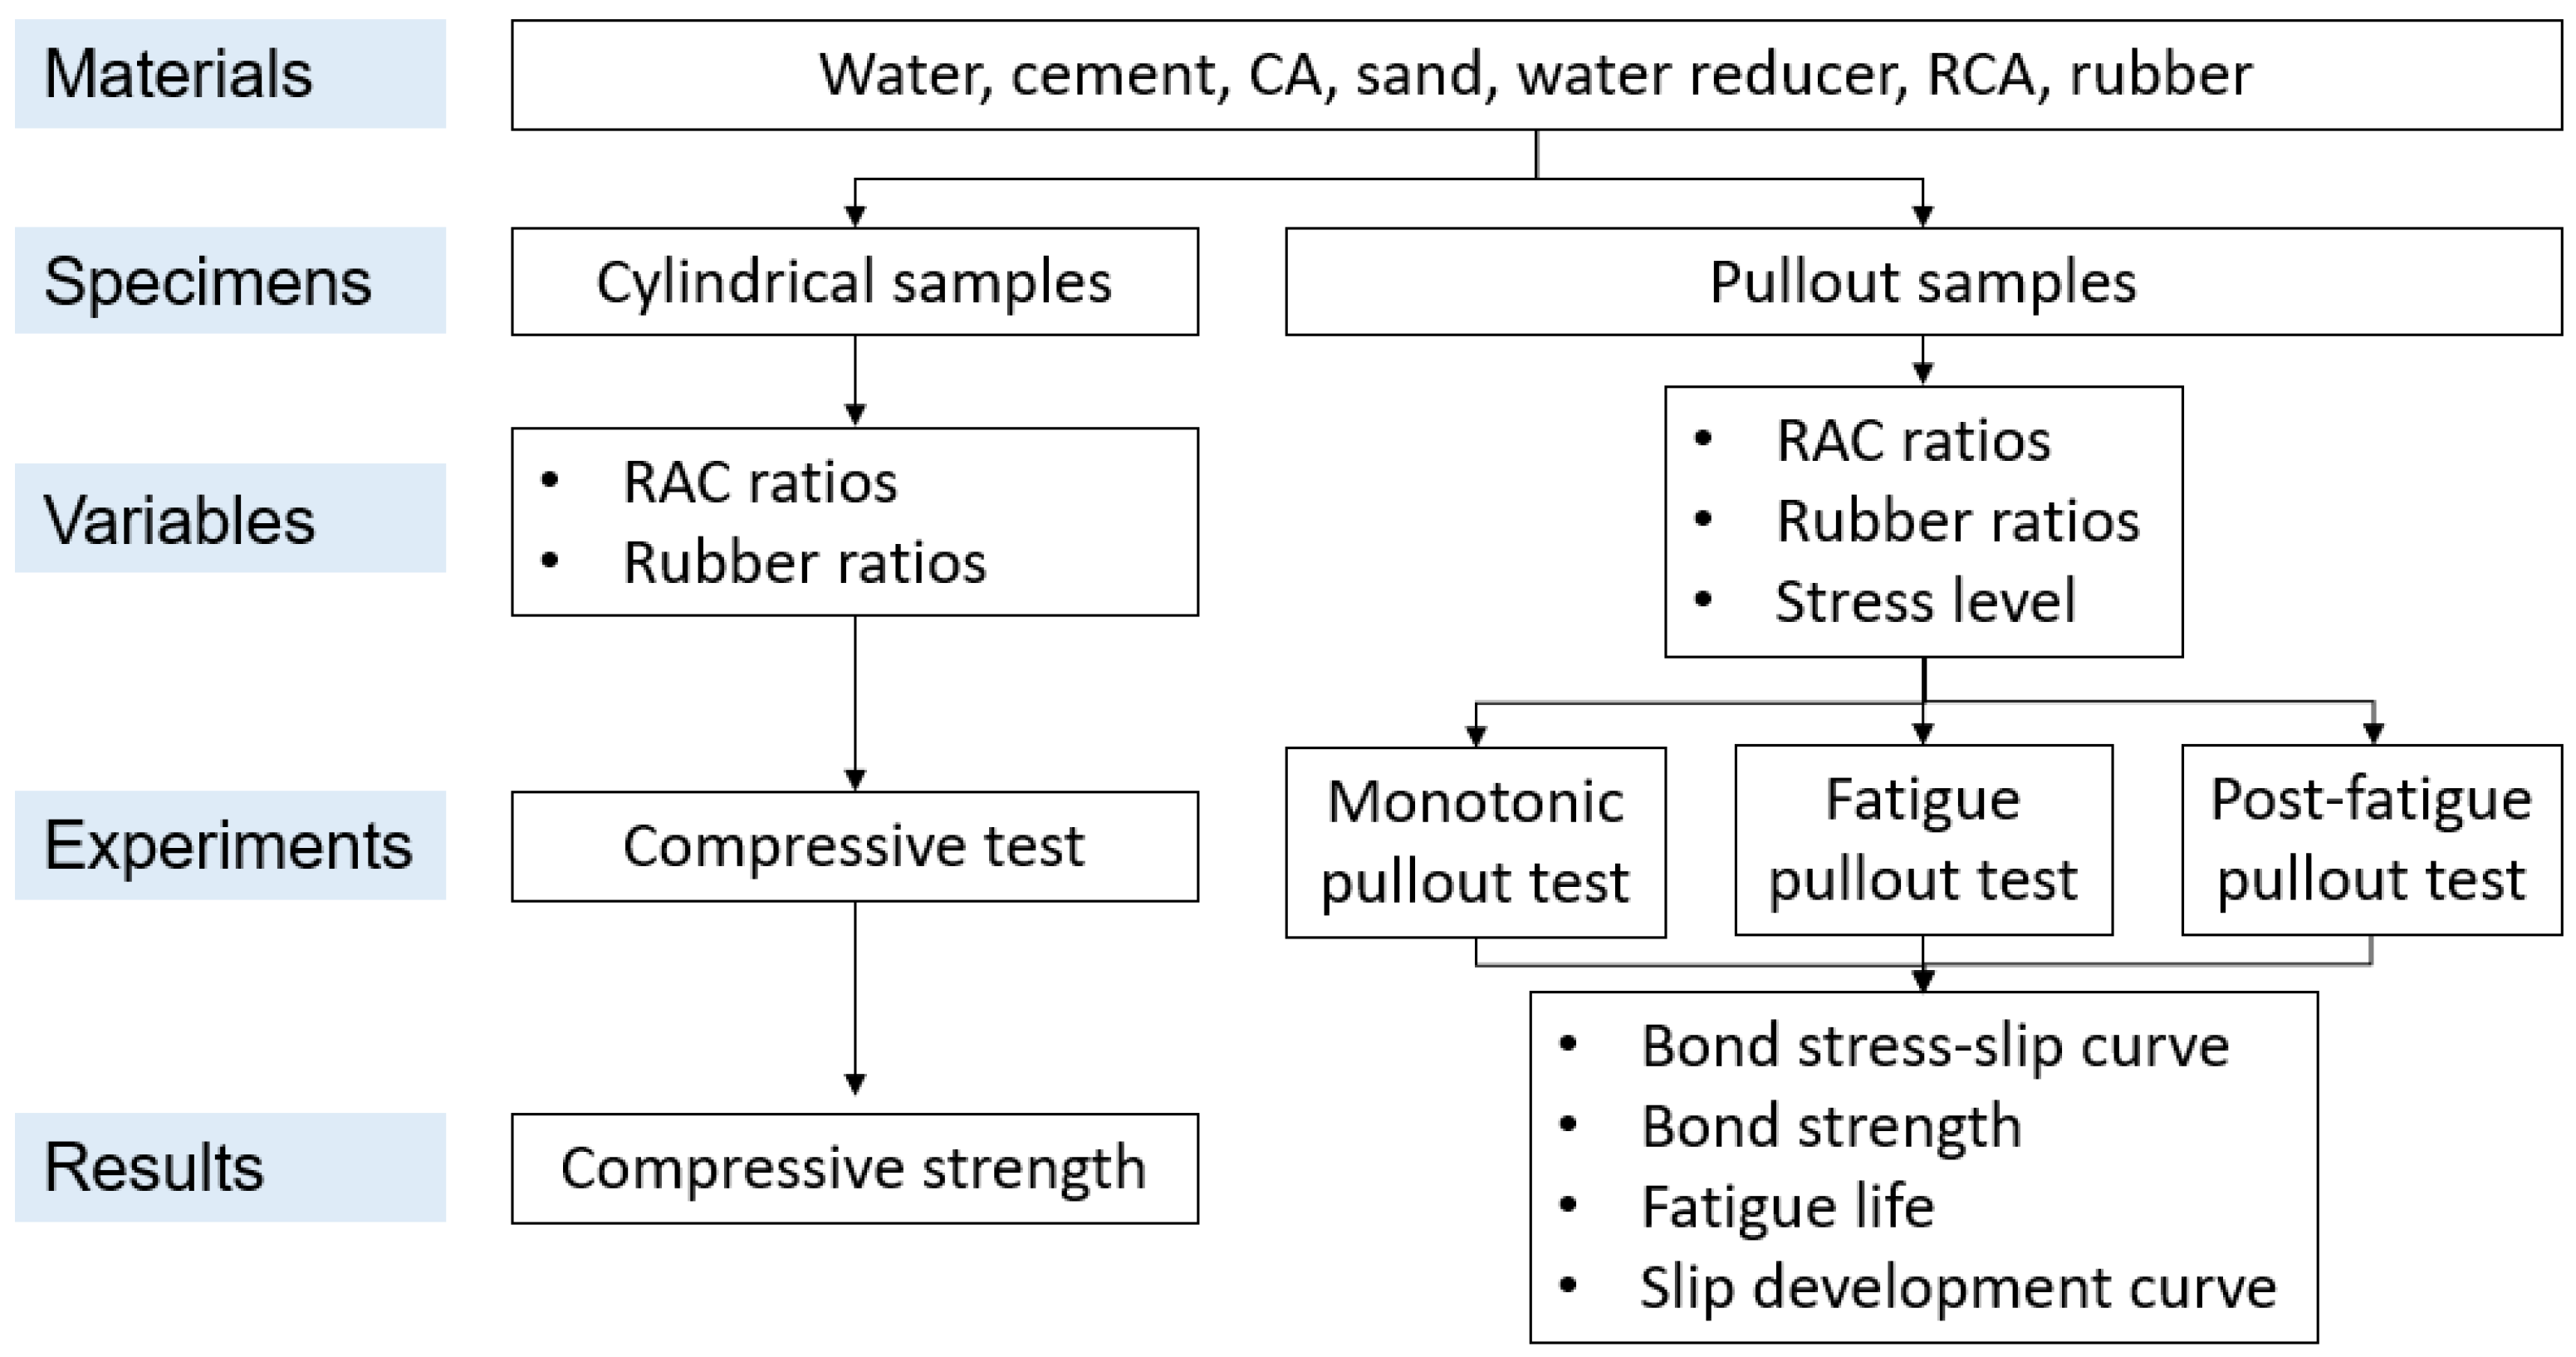
2. Experimental Program
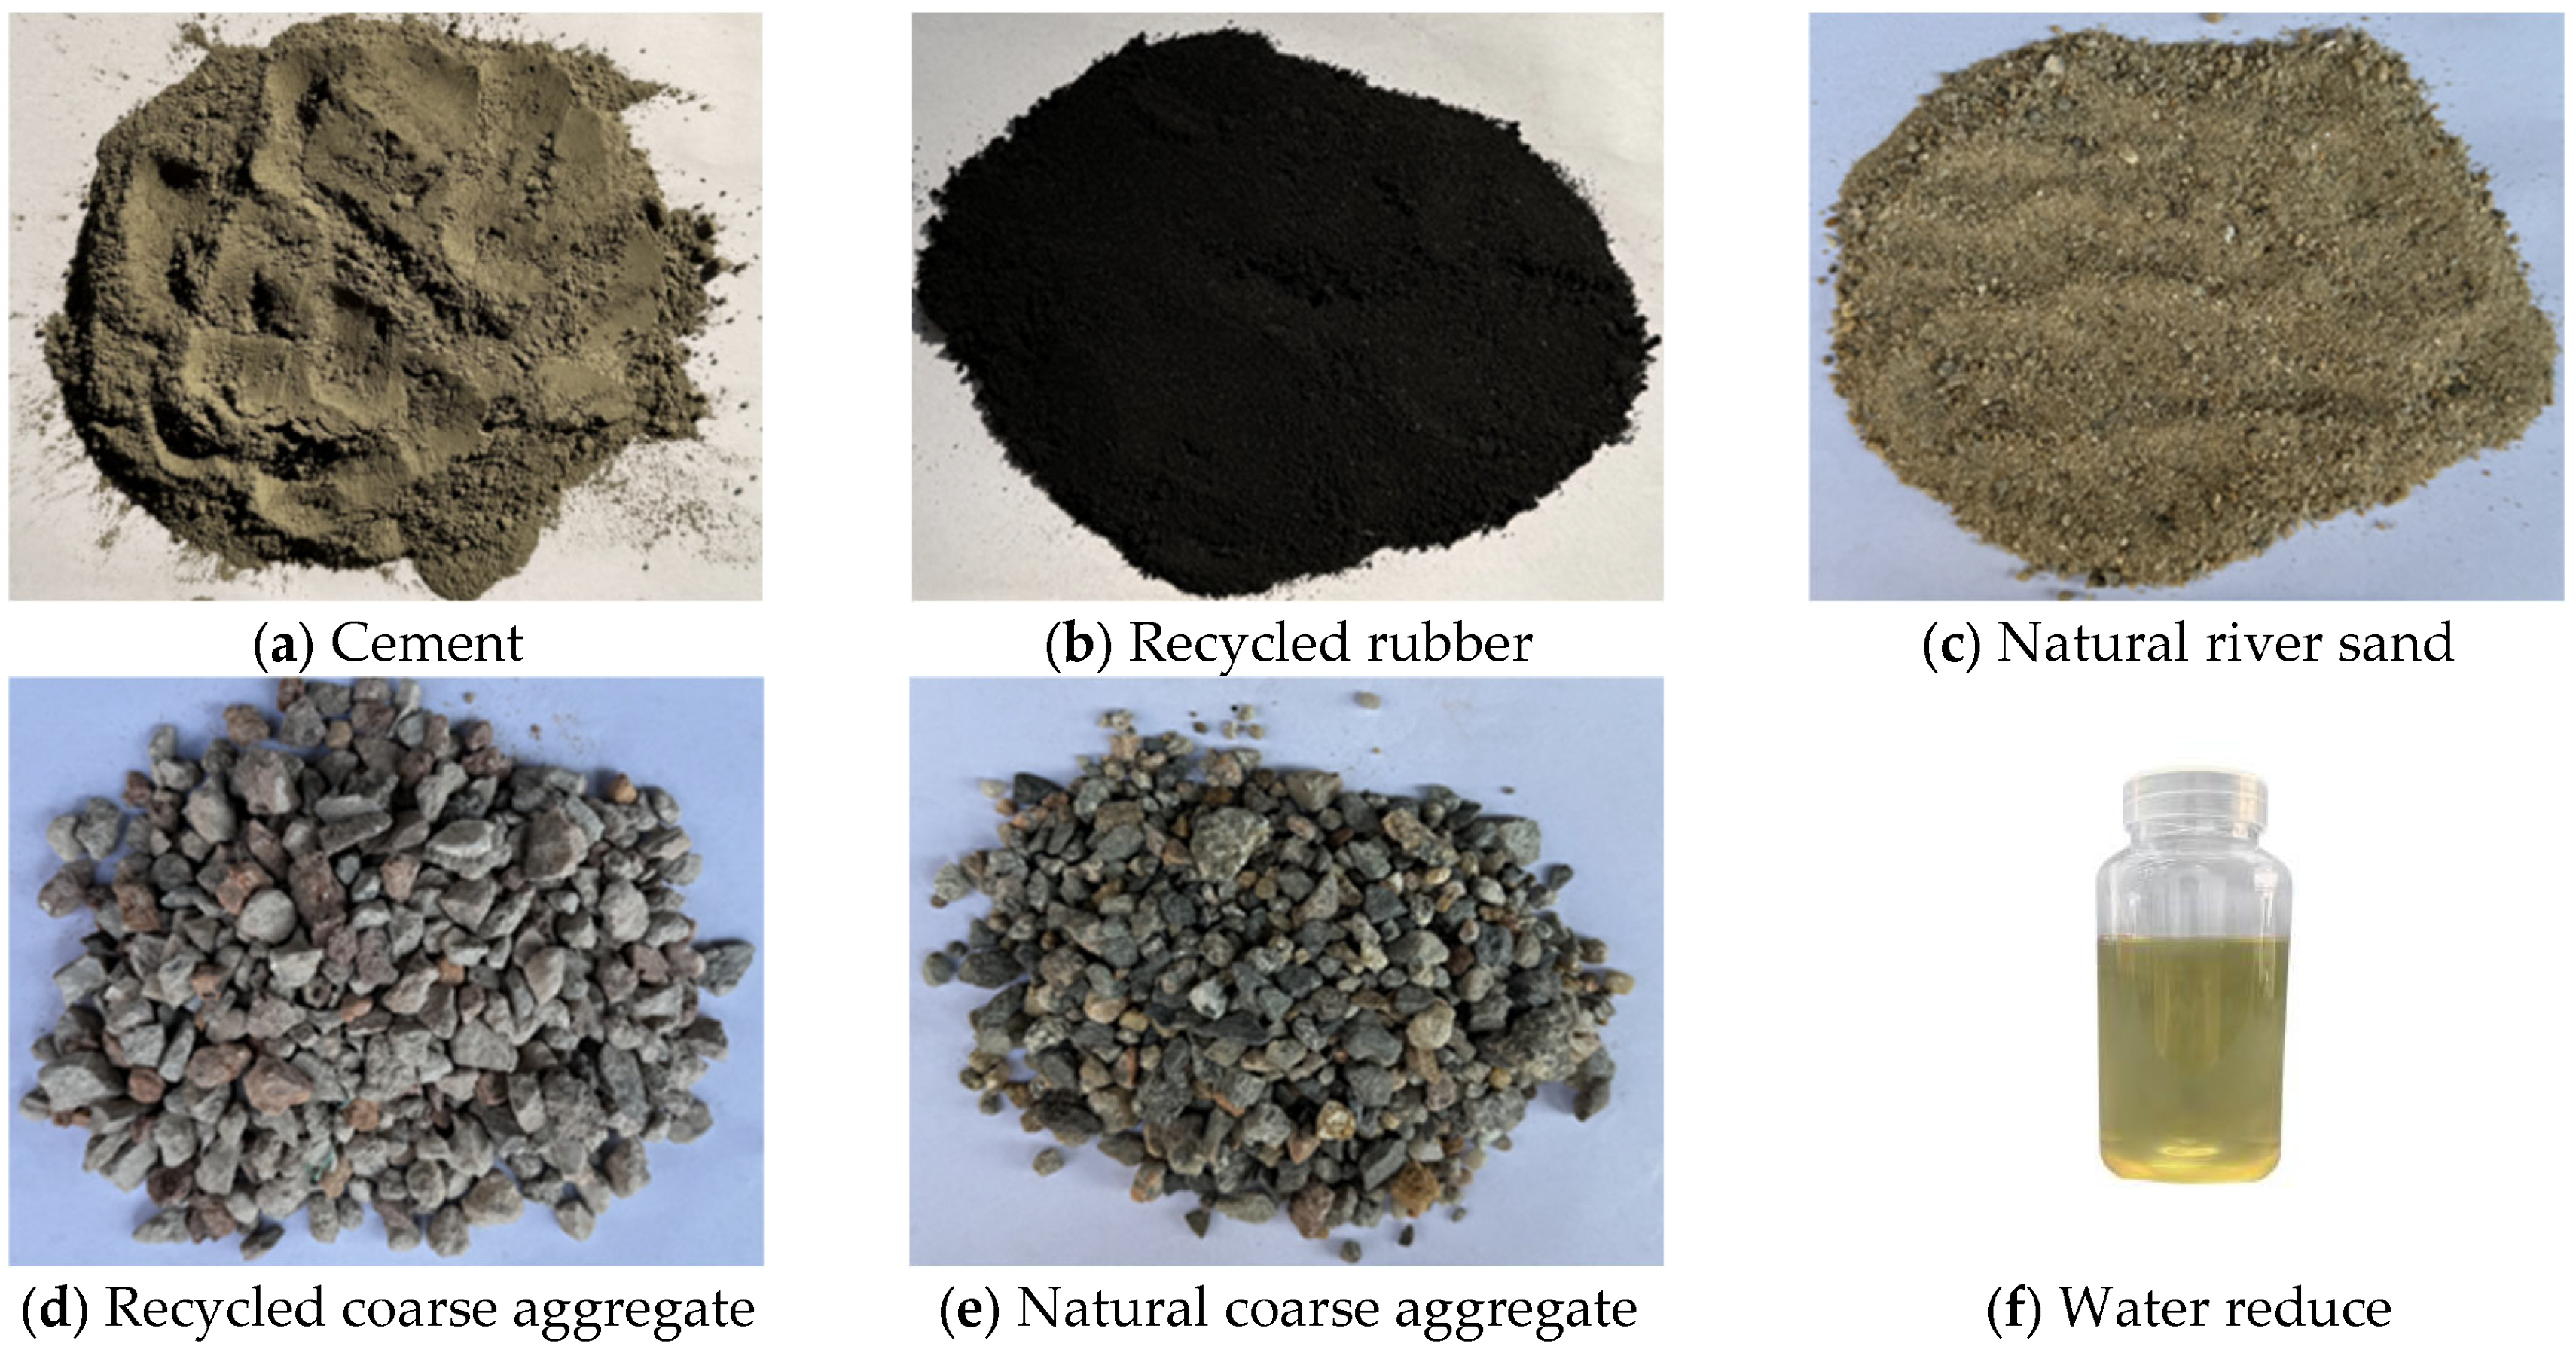
2.1. Materials
2.1.1. Concrete
2.1.2. Steel Rebars
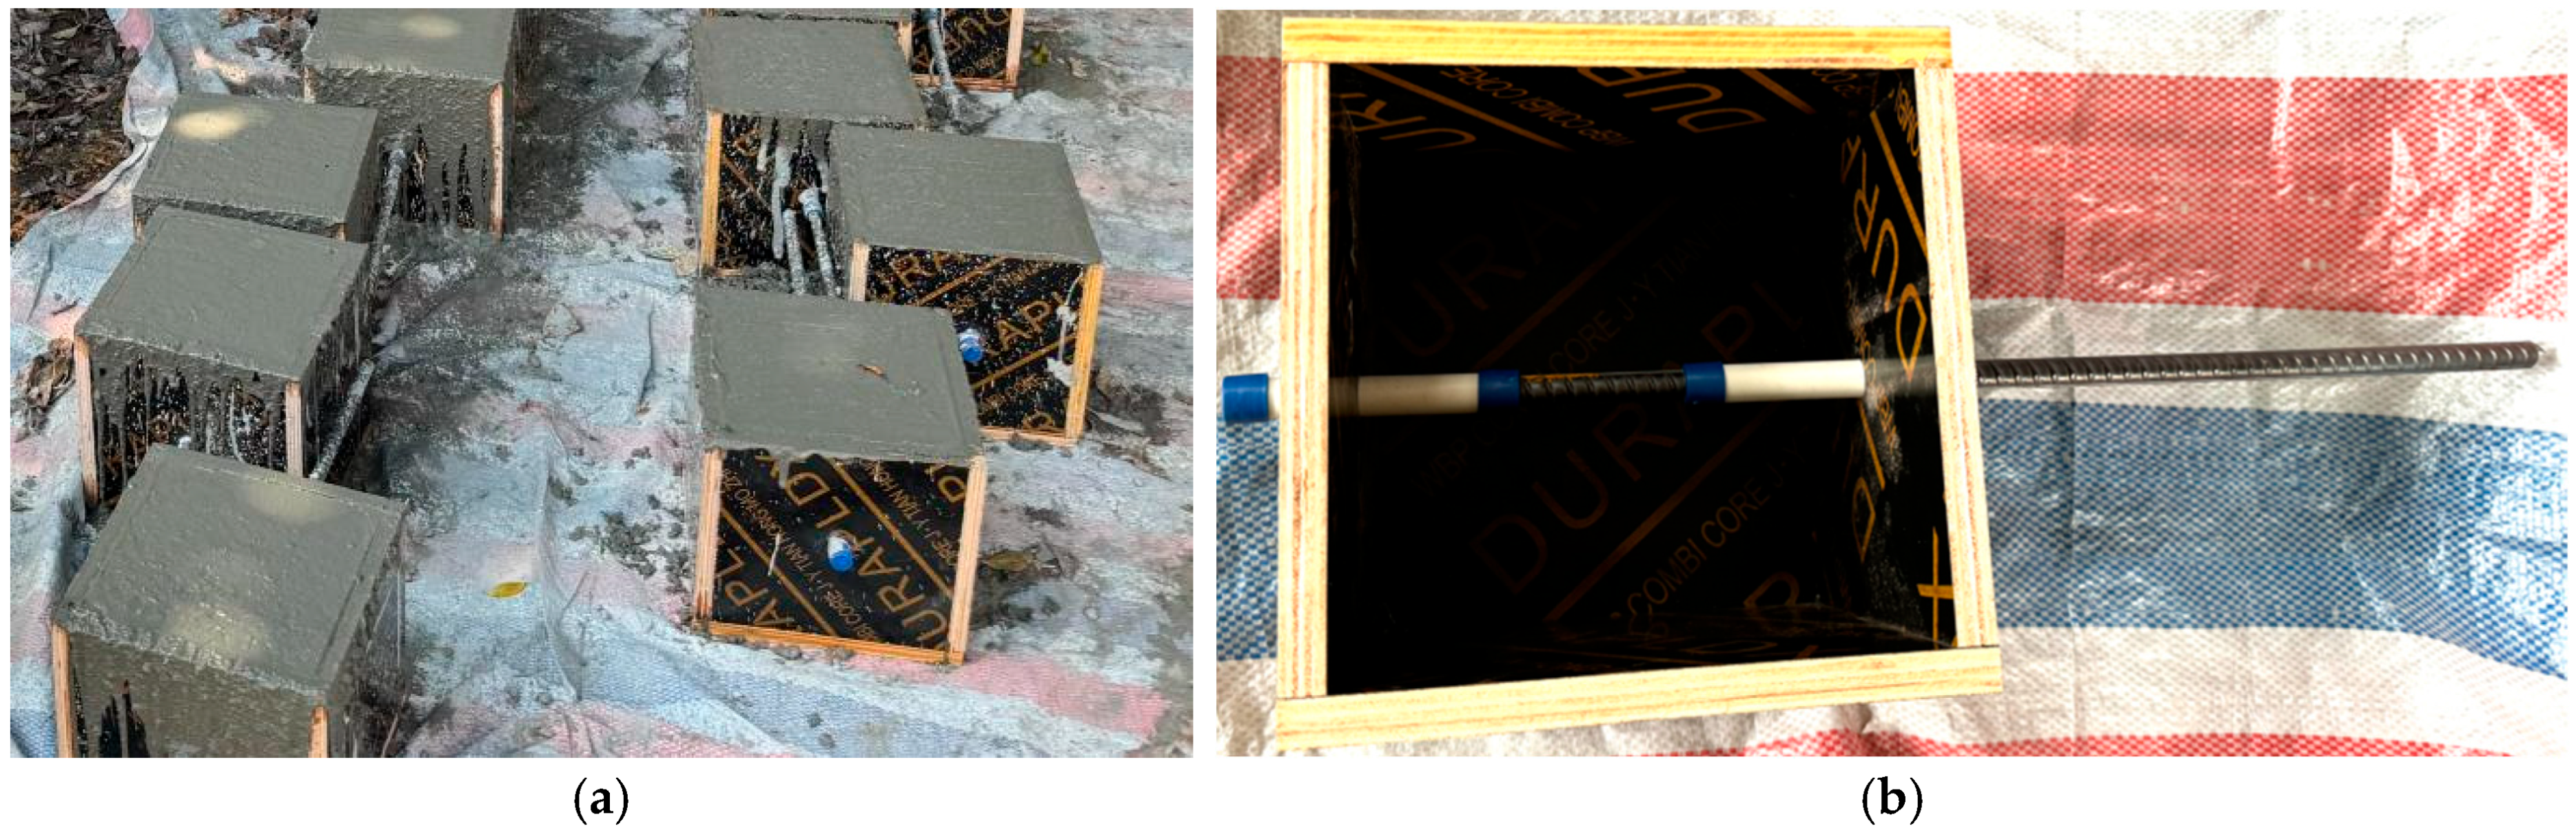
2.2. Specimens
2.3. Experimental Setup
3. Results and Discussions
3.1. Monotonic Behavior
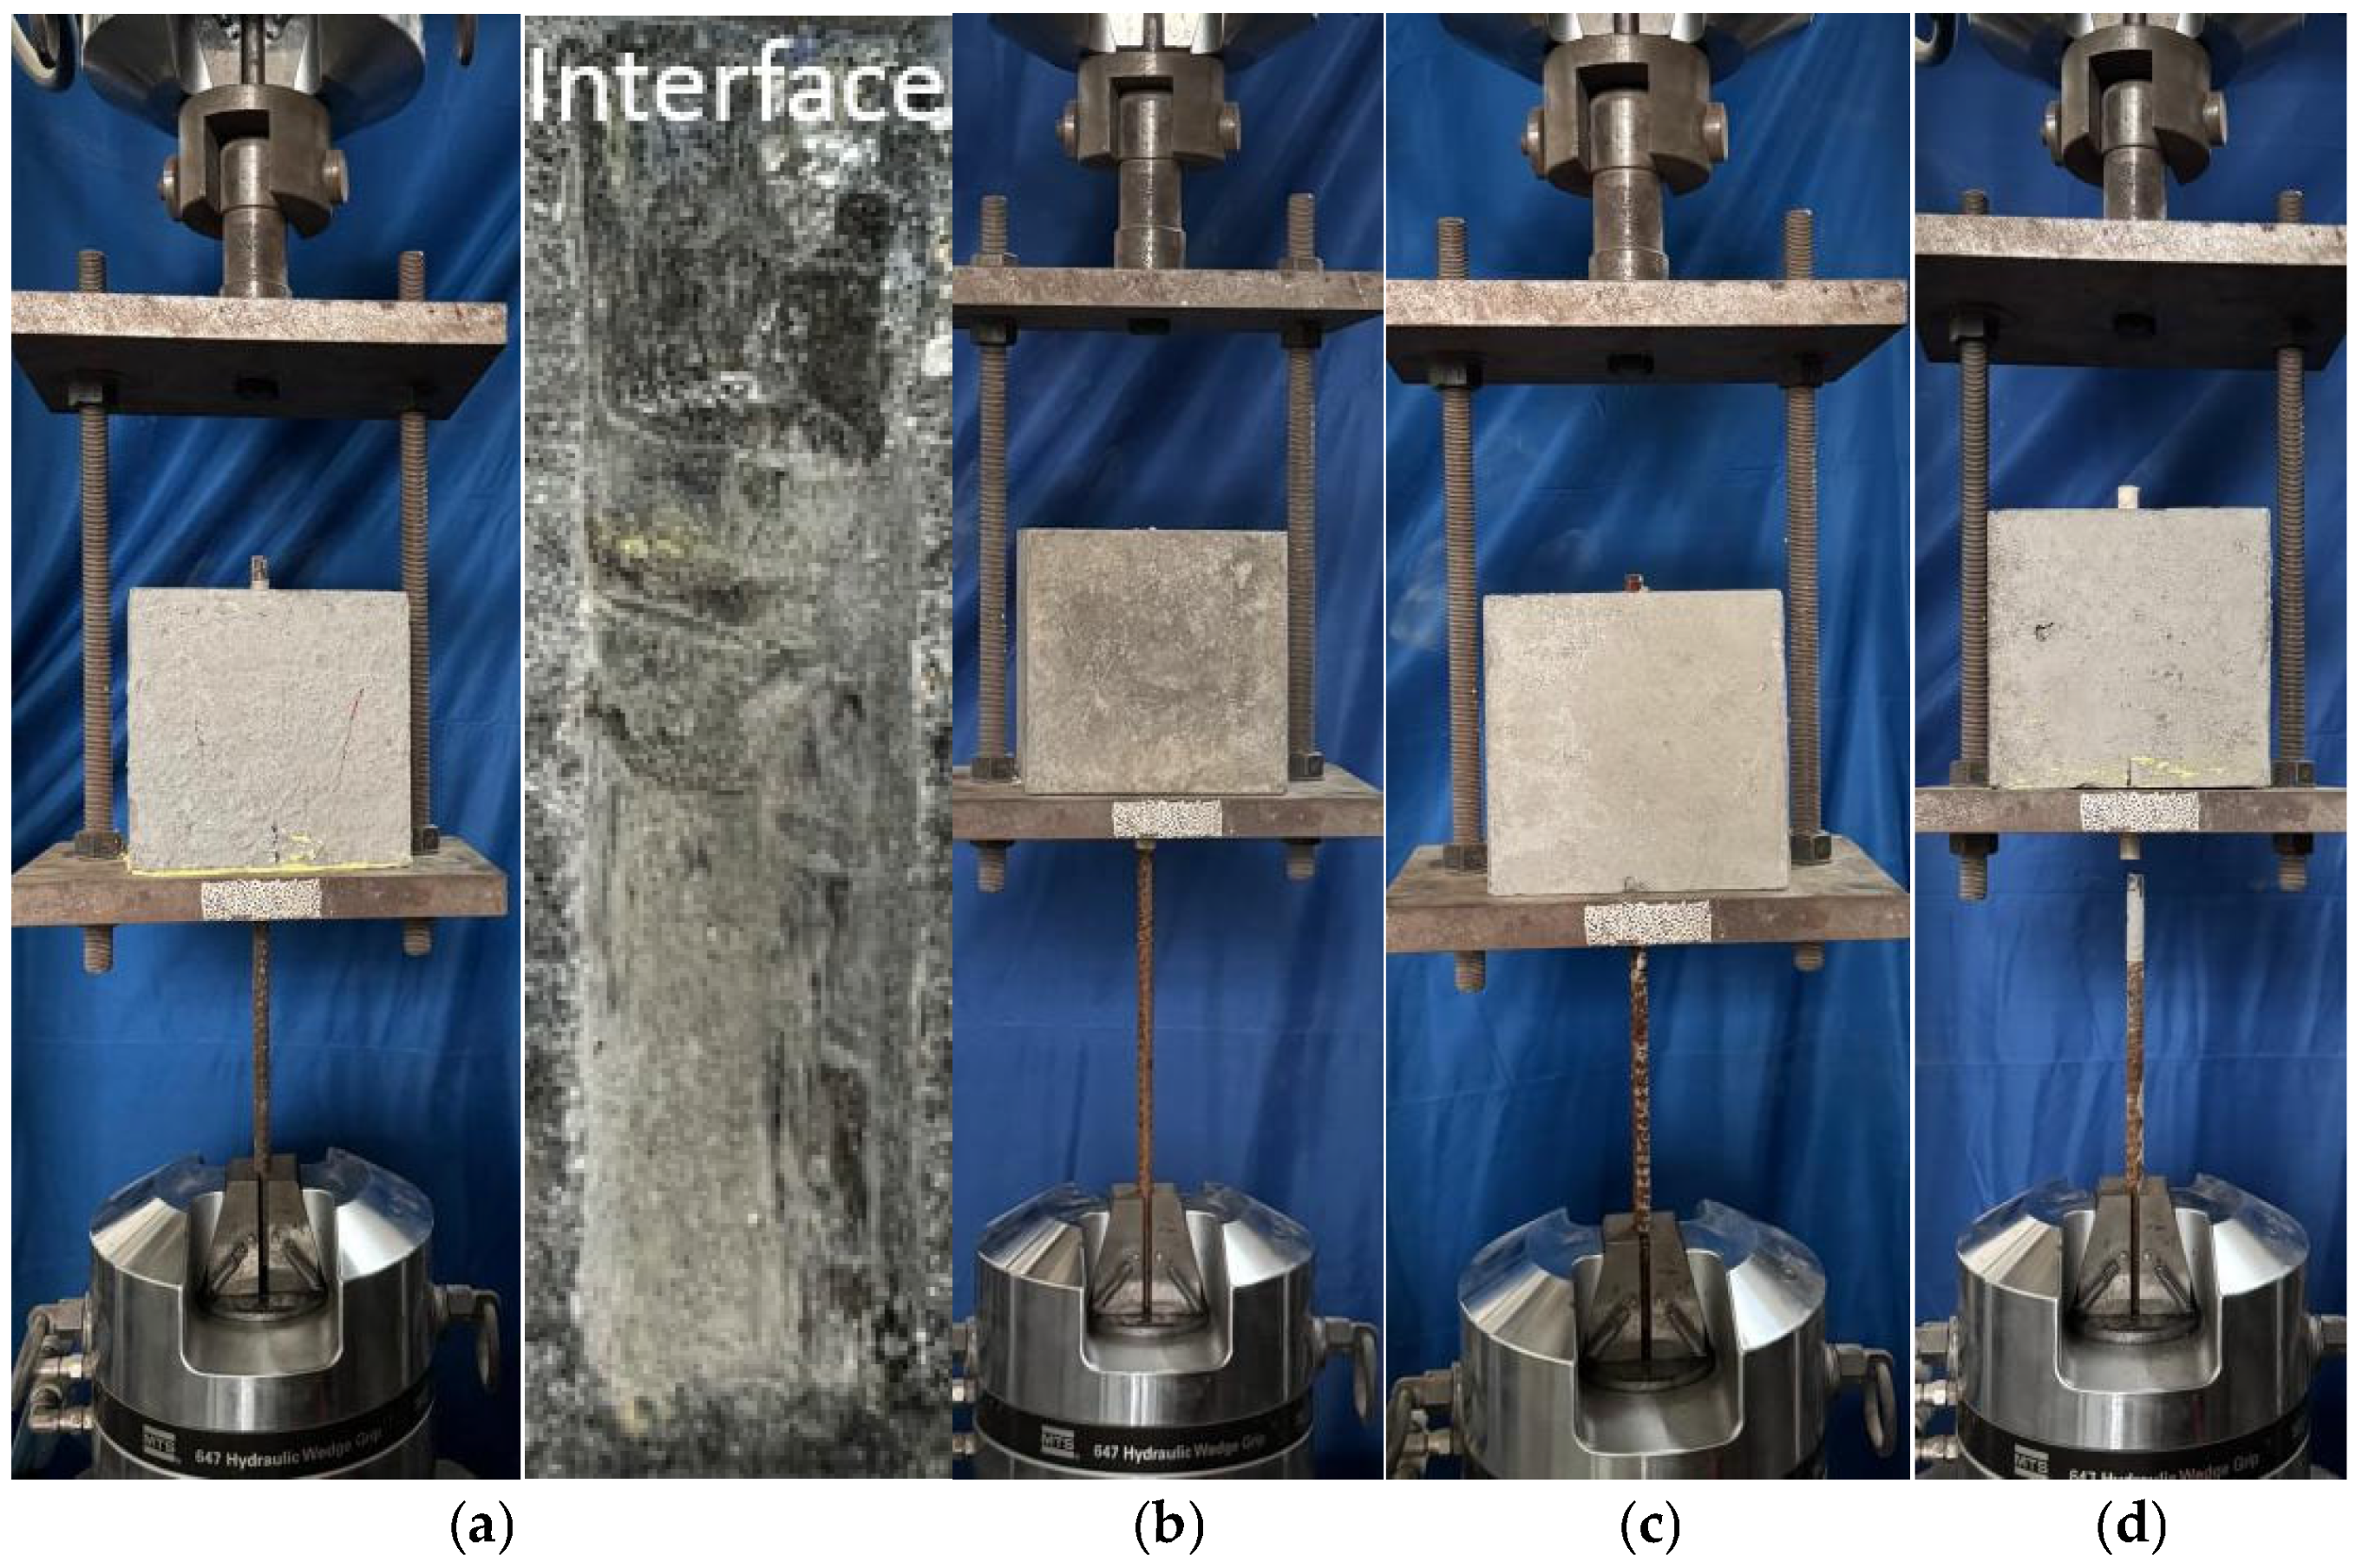
3.1.1. Bond Stress-Slip Curves and Failure Modes
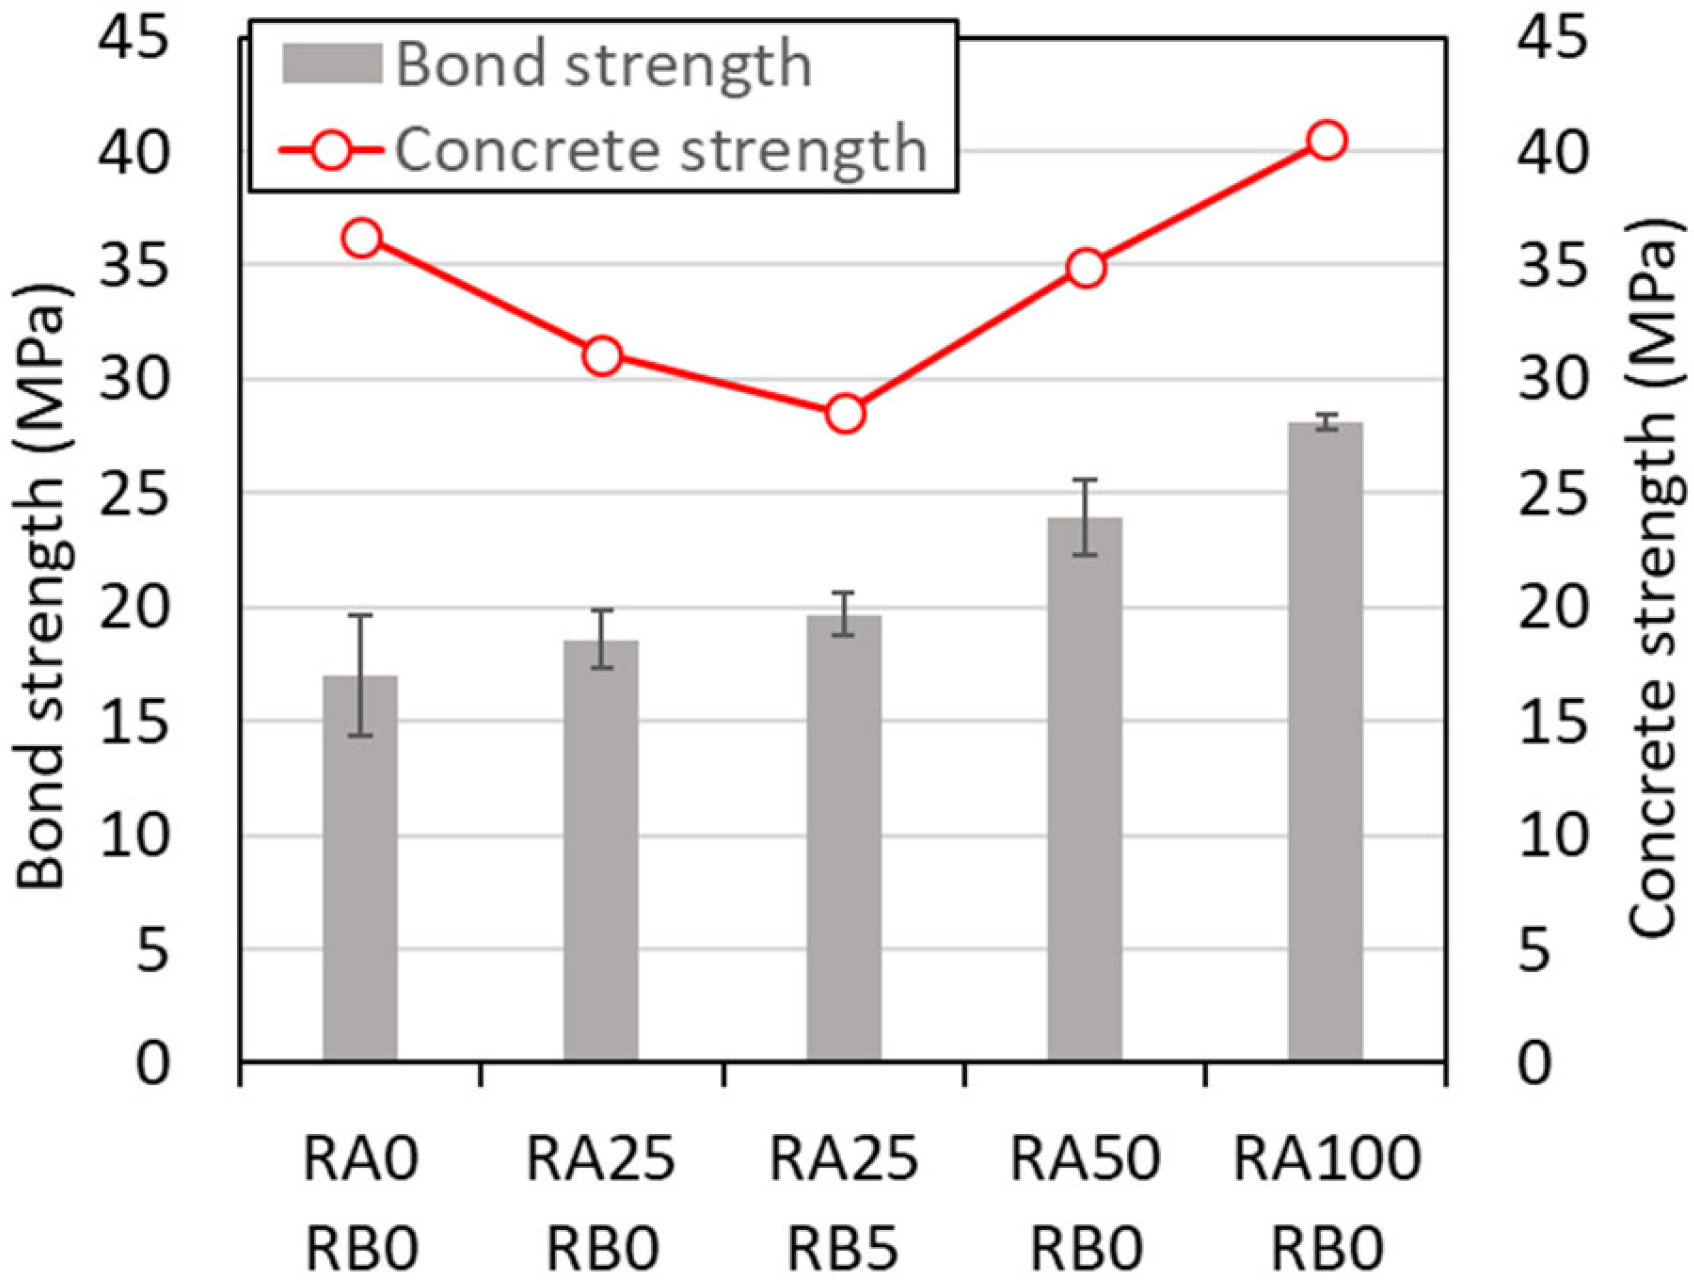
3.1.2. Bond Strength
3.2. Fatigue Behavior
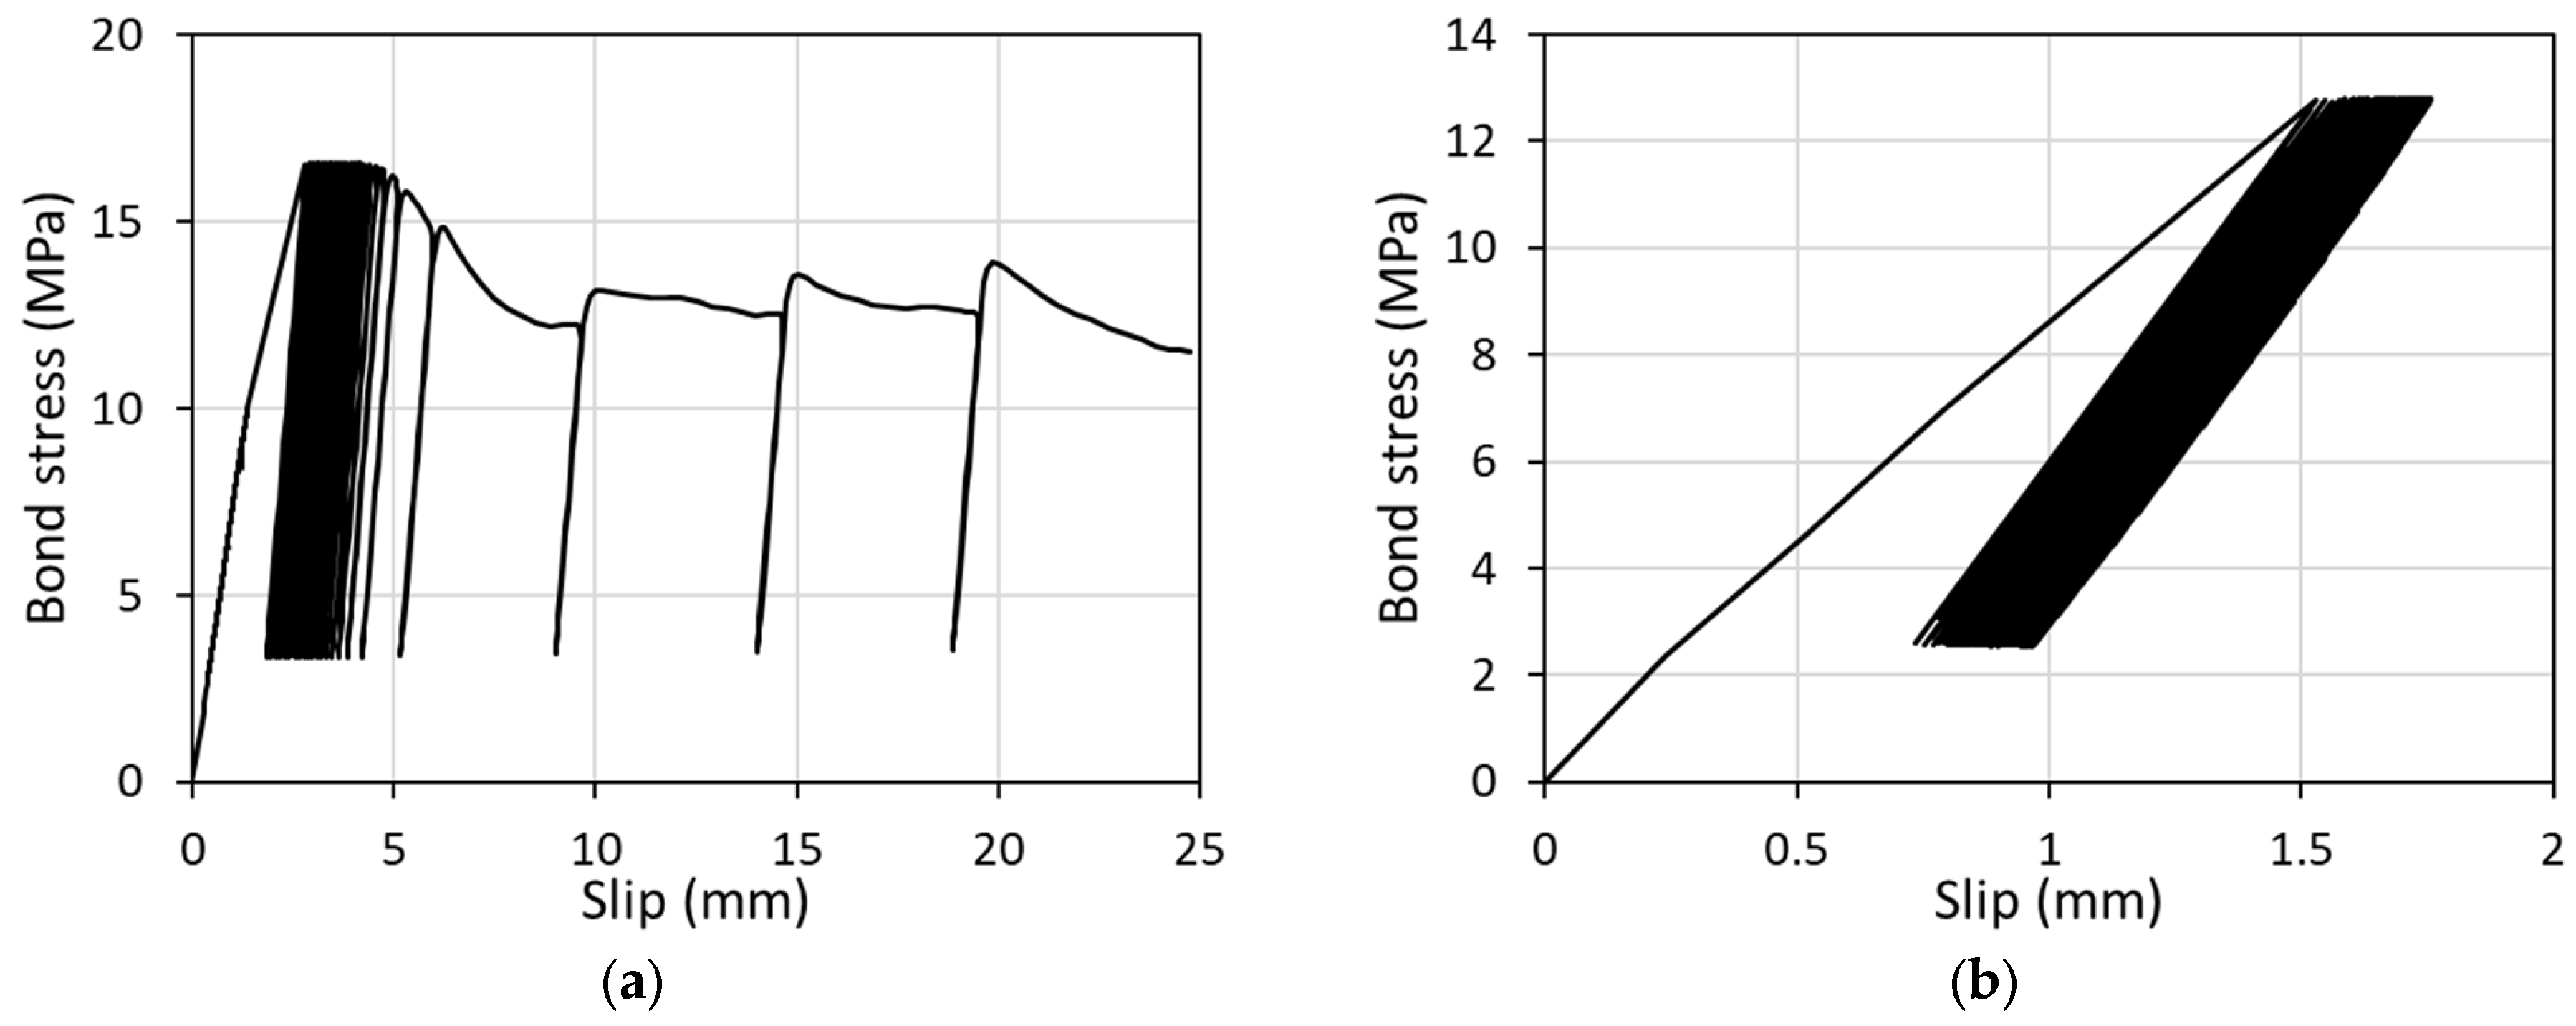
3.2.1. Bond Stress-Slip Curves and Failure Modes
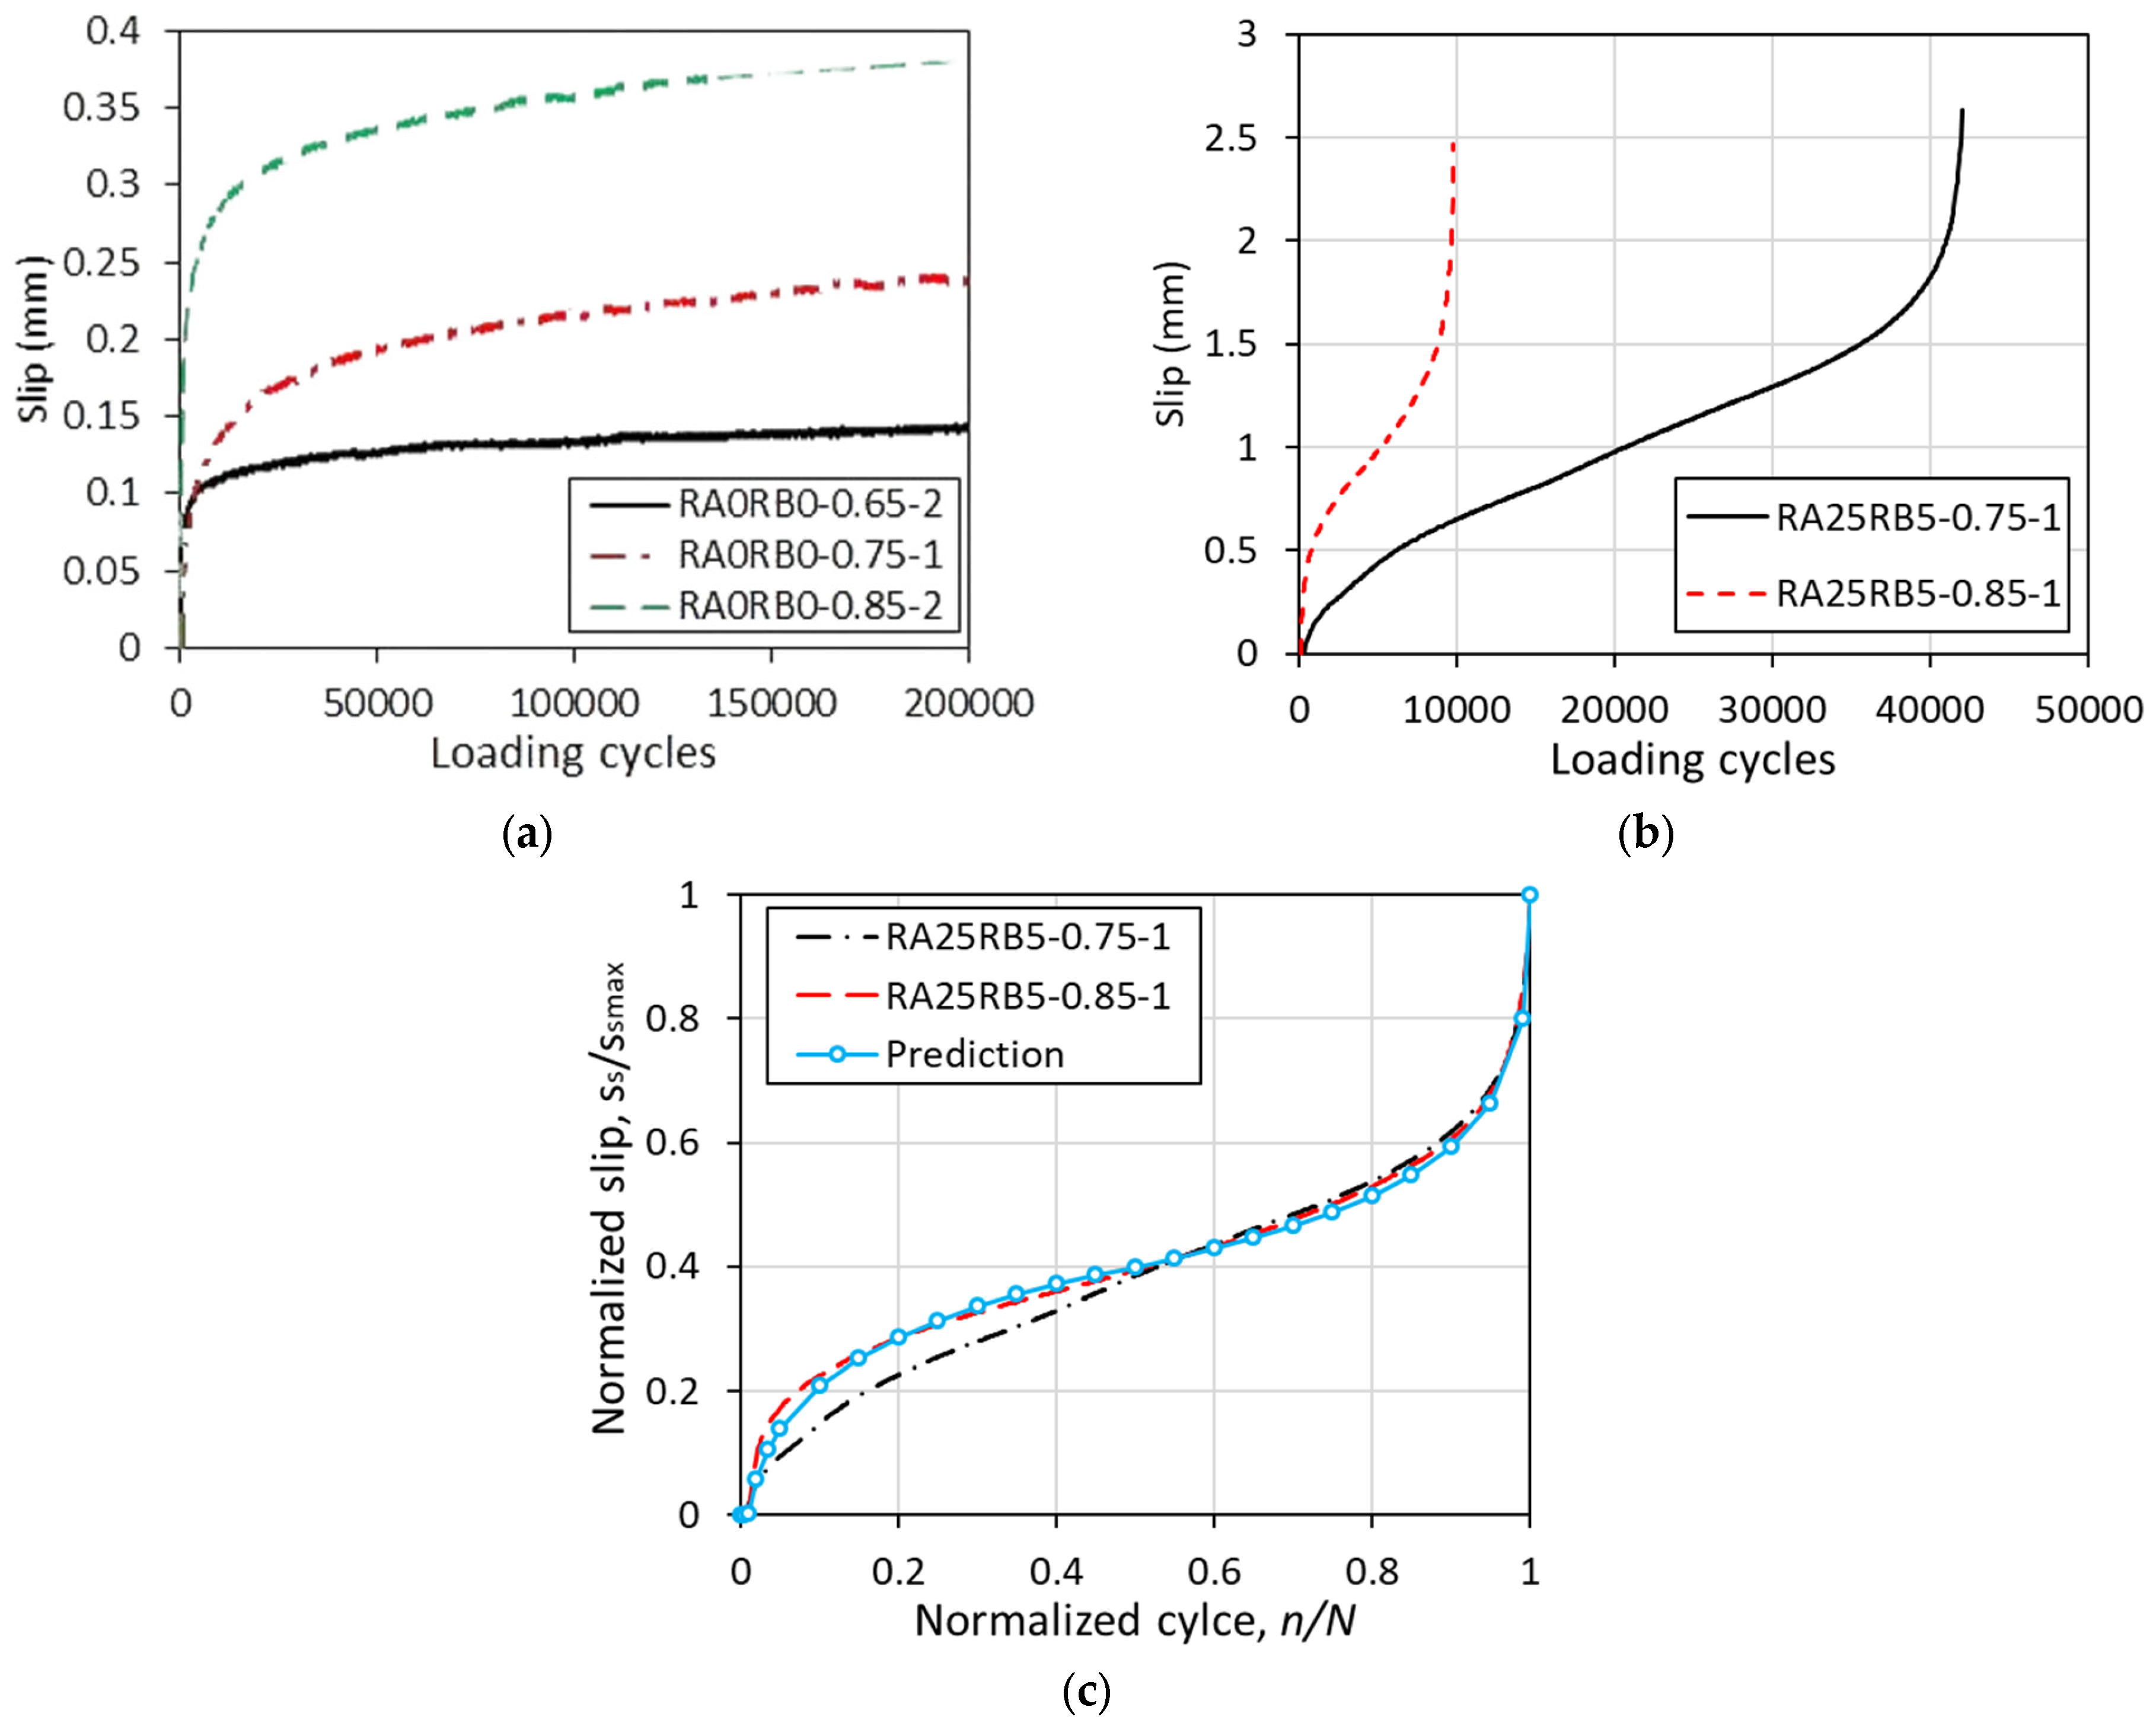
3.2.2. Slip Development
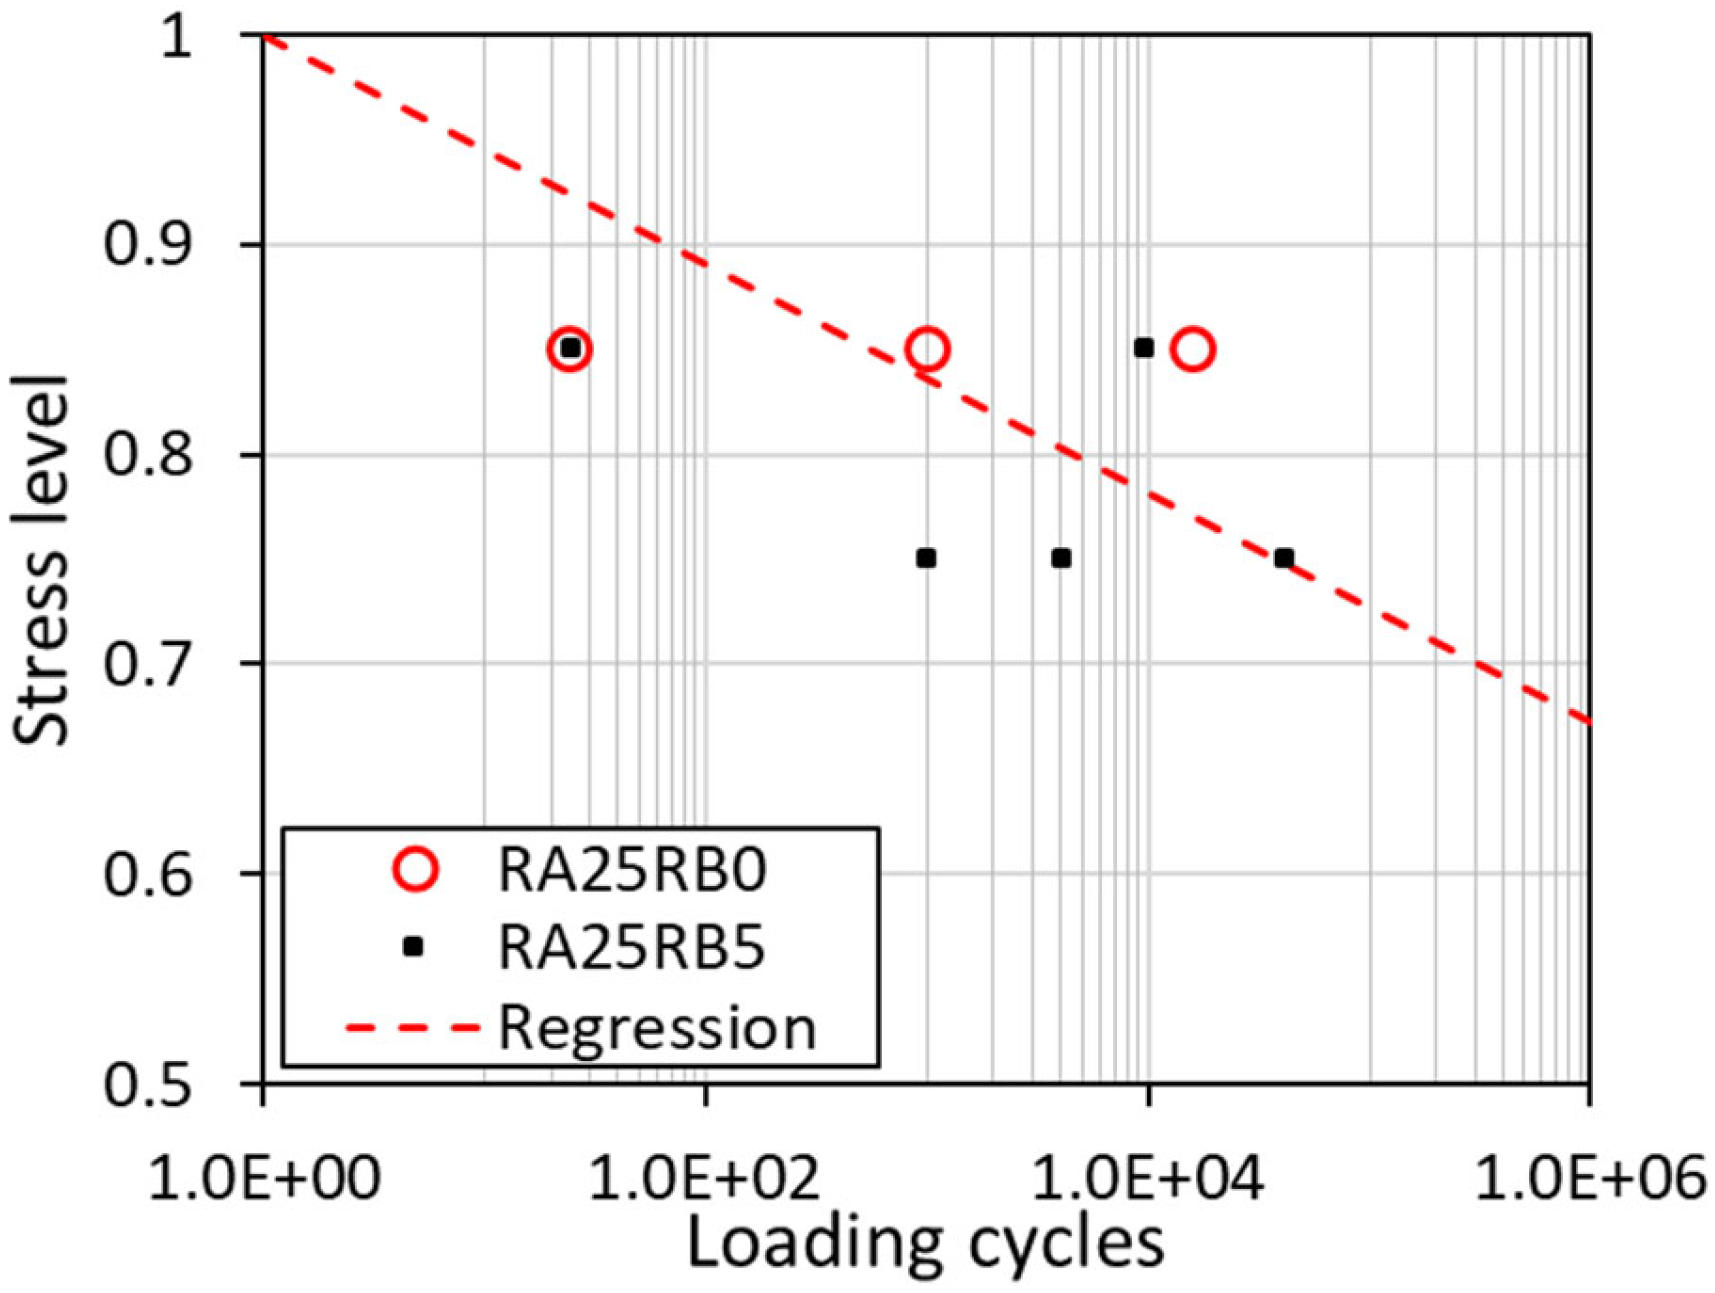
3.2.3. Fatigue Life
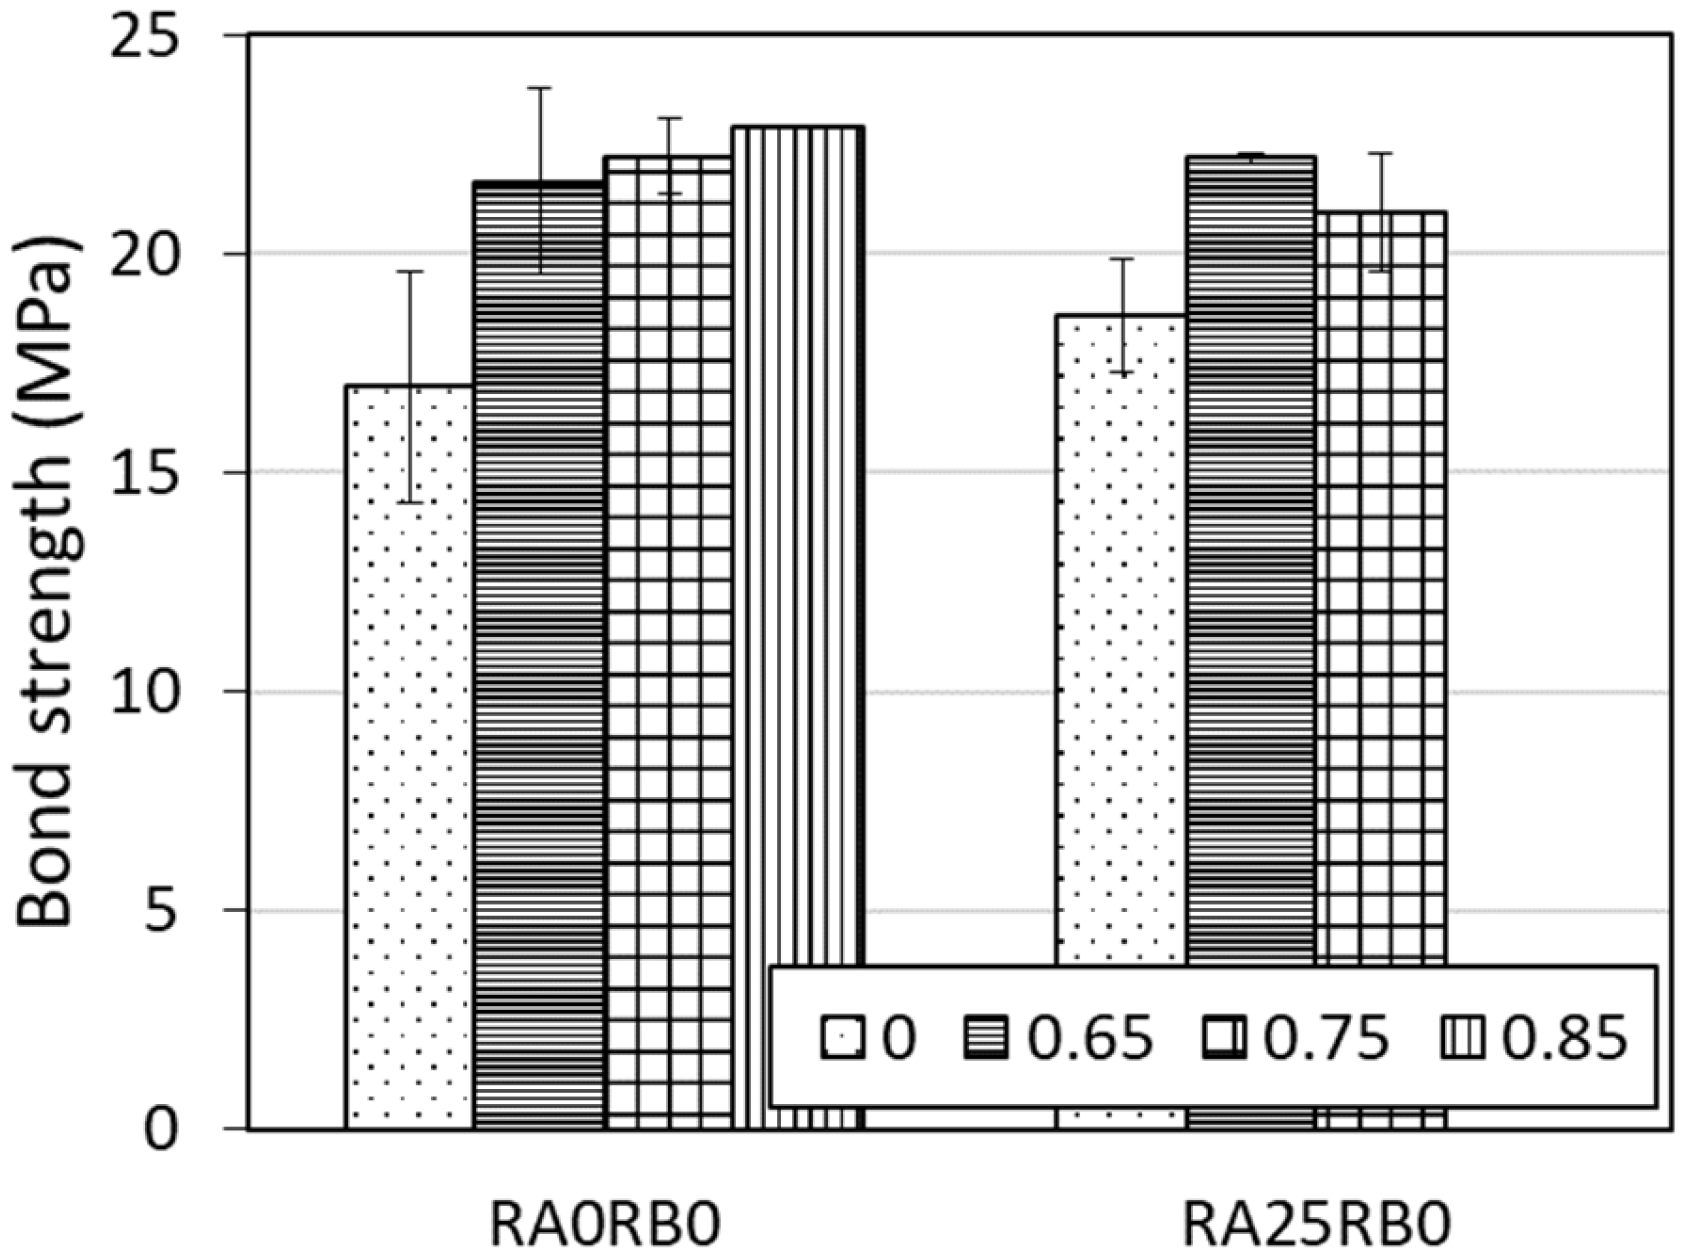
3.3. Post-Fatigue Monotonic Behavior
4. Predictive Models
4.1. Monotonic Bond Strength Model
4.2. Stress Level—Fatigue Life Model
4.3. Slip Model Under Fatigue Loading
5. Conclusions
- (1)
- Four failure modes, including bond failure, bond failure and rebar yielding, bond failure and rebar hardening, and rebar fracture, were identified for the pullout specimens.
- (2)
- With the increase in recycled aggregate content and rubber content, the monotonic bond strength of the tested specimens showed an increasing trend, which is likely due to the increase in concrete strength and the beneficial effects of rubber on bonding behavior.
- (3)
- With the addition of recycled aggregate (from 0 to 25% replacement ratio) and rubber (from 0 to 5%), the specimens became more prone to fatigue failure than the specimens with natural aggregate concrete. It is suggested to use RAC and rubber concrete in low-fatigue applications and limit the replacement ratio of rubber to 5%.
- (4)
- For specimens that failed due to fatigue debonding, the normalized slip curves of the specimens under fatigue loading are independent of the stress level.
- (5)
- Fatigue history does not deteriorate bond strength, and even an increase in bond strength is observed, which is likely caused by the development of concrete strength induced by further curing during the fatigue loading period.
- (6)
- Theoretical models were proposed to predict the monotonic bond strength, fatigue life, and slip under fatigue loading. The predictions agreed well with the experimental results, indicating the reasonability of the proposed formulas.
Author Contributions
Funding
Data Availability Statement
Conflicts of Interest
References
- Lv, H.; Xiong, Z.; Li, H.; Liu, J.; Xu, G.; Chen, H. Investigating the mechanical properties and water permeability of recycled pervious concrete using three typical gradation schemes. Buildings 2025, 15, 358. [Google Scholar] [CrossRef]
- Xiao, J.-Z.; Li, J.-B.; Zhang, C. Onrelationships between the mechanical properties of recycled aggregate concrete: An overview. Mater. Struct. 2006, 39, 655–664. [Google Scholar] [CrossRef]
- Wang, J.; Liu, F.; Luo, Z.; He, M.; Chen, G.; Xiong, Z. Behaviour of FRP-rubber concrete-steel double-skin tubular slender columns under eccentric compression: An experimental and theoretical study. J. Build. Eng. 2025, 104, 112265. [Google Scholar] [CrossRef]
- Mei, J.; Xu, G.; Ahmad, W.; Khan, K.; Amin, M.N.; Aslam, F.; Alaskar, A. Promoting sustainable materials using recycled rubber in concrete: A review. J. Clean. Prod. 2022, 373, 133927. [Google Scholar] [CrossRef]
- Roychand, R.; Gravina, R.J.; Zhuge, Y.; Ma, X.; Youssf, O.; Mills, J.E. A comprehensive review on the mechanical properties of waste tire rubber concrete. Constr. Build. Mater. 2020, 237, 117651. [Google Scholar] [CrossRef]
- Pan, D.; Liu, F.; Li, L. The Application and Research Overview of Rubber Concrete. Chn. Rub. Indus. 2007, 54, 182–185. (In Chinese) [Google Scholar] [CrossRef]
- Aghamohammadi, O.; Mostofinejad, D.; Mostafaei, H.; Abtahi, S.M. Mechanical properties and impact resistance of concrete pavement containing crumb rubber. Int. J. Geomech. 2024, 24, 04023242. [Google Scholar] [CrossRef]
- Yang, Y.; Wang, Z. Applications research in engineering of roller compacted rubcrete. Concrete 2021, 139–141. (In Chinese) [Google Scholar] [CrossRef]
- Siddika, A.; Al Mamun, M.A.; Alyousef, R.; Amran, Y.M.; Aslani, F.; Alabduljabbar, H. Properties and utilizations of waste tire rubber in concrete: A review. Constr. Build. Mater. 2019, 224, 711–731. [Google Scholar] [CrossRef]
- Karabulut, M. Nonlinear Load-Deflection Analysis of Steel Rebar-Reinforced Concrete Beams: Experimental, Theoretical and Machine Learning Analysis. Buildings 2025, 15, 432. [Google Scholar] [CrossRef]
- Karabulut, M. Machine Learning-Driven Flexural Performance Prediction and Experimental Investigation of Glass Fiber-Reinforced Polymer Bar-Reinforced Concrete Beams. Polymers 2025, 17, 713. [Google Scholar] [CrossRef] [PubMed]
- Tusher, T.H.; Ahmed, K.S.; Sarker, M.S.B.I. Bond behavior of deformed rebar in concrete containing recycled brick aggregate and waste rubber. J. Build. Eng. 2024, 92, 109729. [Google Scholar] [CrossRef]
- Su, T.; Wang, C.; Cao, F.; Zou, Z.; Wang, C.; Wang, J.; Yi, H. An overview of bond behavior of recycled coarse aggregate concrete with steel bar. Rev. Adv. Mater. Sci. 2021, 60, 127–144. [Google Scholar] [CrossRef]
- Gong, Y.; Jiang, T.; Sun, L.; Jiang, W.; Zhang, Q.; Liu, S.; Tian, L. Constitutive model of bond-slip between rubber granule–basalt fiber composite modified concrete and rebar. App. Sci. 2023, 13, 12726. [Google Scholar] [CrossRef]
- Zhang, W.; Lin, J.; Huang, Y.; Lin, B.; Liu, X. State of the art regarding interface bond behavior between FRP and concrete based on cohesive zone model. Structures 2025, 74, 108528. [Google Scholar] [CrossRef]
- Sun, L.; Wang, C.; Zhang, C.; Yang, Z.; Li, C.; Qiao, P. Experimental investigation on the bond performance of sea sand coral concrete with FRP bar reinforcement for marine environments. Adv. Struct. Eng. 2023, 26, 533–546. [Google Scholar] [CrossRef]
- Zhang, W.; Liu, X.; Huang, Y.; Tong, M.N. Reliability-based analysis of the flexural strength of concrete beams reinforced with hybrid bfrp and steel rebars. Arch. Civ. Mech. Eng. 2022, 22, 171. [Google Scholar] [CrossRef]
- Kim, S.; Yun, H. Influence of recycled coarse aggregates on the bond behavior of deformed bars in concrete. Eng. Struct. 2013, 48, 133–143. [Google Scholar] [CrossRef]
- Ajdukiewicz, A.; Kliszczewicz, A. Influence of recycled aggregates on mechanical properties of HS/HPC. Cem. Concr. Compos. 2002, 24, 269–279. [Google Scholar] [CrossRef]
- Prince, M.J.R.; Singh, B. Bond behaviour of deformed steel bars embedded in recycled aggregate concrete. Constr. Build. Mater. 2013, 49, 852–862. [Google Scholar] [CrossRef]
- Corinaldesi, V.; Moriconi, G. Influence of mineral additions on the performance of 100% recycled aggregate concrete. Constr. Build. Mater. 2009, 23, 2869–2876. [Google Scholar] [CrossRef]
- Gesoglu, M.; Güneyisi, E.; Hansu, O.; İpek, S.; Asaad, D. Influence of waste rubber utilization on the fracture and steel–concrete bond strength properties of concrete. Constr. Build. Mater. 2015, 101, 1113–1121. [Google Scholar] [CrossRef]
- Hall, M.R.; Najim, K.B. Structural behaviour and durability of steel-reinforced structural Plain/Self-Compacting Rubberised Concrete (PRC/SCRC). Constr. Build. Mater. 2014, 73, 490–497. [Google Scholar] [CrossRef]
- Gao, D.; Li, Z.; Yu, Z. Uniaxial tensile stress-strain constitutive relationship of 3D/4D/5D steel fiber-reinforced concrete. Constr. Build. Mater. 2025, 470, 140539. [Google Scholar] [CrossRef]
- Harajli, M.H. Development/splice strength of reinforcing bars embedded in plain and fiber reinforced concrete. ACI Mater. J. 1994, 91, 511–520. [Google Scholar] [CrossRef]
- Prince, M.; Singh, B. Bond behaviour of normal-and high-strength recycled aggregate concrete. Struct. Concr. 2015, 16, 56–70. [Google Scholar] [CrossRef]
- Xiao, J.; Falkner, H. Bond behaviour between recycled aggregate concrete and steel rebars. Constr. Build. Mater. 2007, 21, 395–401. [Google Scholar] [CrossRef]
- Australian Standard AS 3600; Concrete Structures. Australian Business Licence and Information Service: Canberra, Australia, 2018.
- International Federation of Structural Concrete. The Fib Model Code for Concrete Structures; International Federation of Structural Concrete: Lausanne, Switzerland, 2020. [Google Scholar]
- Luo, J.; Wu, G.; Zhao, G.; Ma, Y.; Fang, Z.; Fang, S. Experimental and numerical analysis on shear performance of single embedded nut bolted shear connectors in prefabricated steel-UHPC composite structures under cyclic loading. Structures 2025, 73, 108446. [Google Scholar] [CrossRef]
- Kachkouch, F.Z.; Noberto, C.C.; Babadopulos, L.F.d.A.L.; Melo, A.R.S.; Machado, A.M.L.; Sebaibi, N.; Boukhelf, F.; Mendili, Y.E. Fatigue behavior of concrete: A literature review on the main relevant parameters. Constr. Build. Mater. 2022, 338, 127510. [Google Scholar] [CrossRef]
- Verna, J.R.; Stelson, T.E. Failure of small reinforced concrete beams under repeated loads. ACI J. Proc. 1962, 59, 1489–1504. [Google Scholar]
- Xiong, Z.; Mai, G.; Qiao, S.; He, S.; Zhang, B.; Wang, H.; Zhou, K.; Li, L. Fatigue bond behaviour between basalt fibre-reinforced polymer bars and seawater sea-sand concrete. Ocean Coast. Manag. 2022, 218, 106038. [Google Scholar] [CrossRef]
- Shi, J.W.; Wu, Q.Q.; Li, B.; Liu, Y.; Cao, W.H.; Wang, H.T. Fatigue bond behavior of FRP-to-concrete joints with various bonding adhesives. Eng. Struct. 2024, 301, 117311. [Google Scholar] [CrossRef]
- Zou, R.; Liu, F.; Xiong, Z.; He, S.; Li, L.; Wei, W. Experimental study on fatigue bond behaviour between basalt fibre-reinforced polymer bars and recycled aggregate concrete. Constr. Build. Mater. 2021, 270, 121399. [Google Scholar] [CrossRef]
- Jiang, N.; Liu, Y.; Deng, Y.; Wang, D.; Lu, N.; Yu, F. Investigation of bond behavior between steel bar and concrete under coupled effect of fatigue loading and corrosion. J. Mater. Civ. Eng. 2023, 35, 04023366. [Google Scholar] [CrossRef]
- Tilly, G. Fatigue of steel reinforcement bars in concrete: A review. Fatigue Fract. Eng. Mater. Struct. 1979, 2, 251–268. [Google Scholar] [CrossRef]
- Zhang, W.; Zhang, Y.; Li, H.; Gu, X. Experimental investigation of fatigue bond behavior between deformed steel bar and concrete. Cem. Concr. Compos. 2020, 108, 103515. [Google Scholar] [CrossRef]
- Rezazadeh, M.; Carvelli, V. A damage model for high-cycle fatigue behavior of bond between FRP bar and concrete. Int. J. Fatigue 2018, 111, 101–111. [Google Scholar] [CrossRef]
- Lin, H.; Zhao, Y.; Ožbolt, J.; Hans-Wolf, R. The bond behavior between concrete and corroded steel bar under repeated loading. Eng. Struct. 2017, 140, 390–405. [Google Scholar] [CrossRef]
- Oh, B.; Kim, S. Realistic models for local bond stress-slip of reinforced concrete under repeated loading. J. Struct. Eng. 2007, 133, 216–224. [Google Scholar] [CrossRef]
- Lindorf, A.; Lemnitzer, L.; Curbach, M. Experimental investigations on bond behaviour of reinforced concrete under transverse tension and repeated loading. Eng. Struct. 2009, 31, 1469–1476. [Google Scholar] [CrossRef]
- Lindorf, A.; Curbach, M. S–N curves for fatigue of bond in reinforced concrete structures under transverse tension. Eng. Struct. 2010, 32, 3068–3074. [Google Scholar] [CrossRef]
- Al-Hammoud, R.; Soudki, K.; Topper, T. Bond analysis of corroded reinforced concrete beams under monotonic and fatigue loads. Cem. Concr. Compos. 2010, 32, 194–203. [Google Scholar] [CrossRef]
- Rteil, A.; Soudki, K.; Topper, T. Mechanics of bond under repeated loading. Constr. Build. Mater. 2011, 25, 2822–2827. [Google Scholar] [CrossRef]
- Arora, S.; Singh, S.P. Analysis of flexural fatigue failure of concrete made with 100% coarse recycled concrete aggregates. Constr. Build. Mater. 2016, 102, 782–791. [Google Scholar] [CrossRef]
- Xiao, J.; Li, H.; Yang, Z. Fatigue behavior of recycled aggregate concrete under compression and bending cyclic loadings. Constr. Build. Mater. 2013, 38, 681–688. [Google Scholar] [CrossRef]
- Liu, F.; Zheng, W.; Li, L.; Feng, W.; Ning, G. Mechanical and fatigue performance of rubber concrete. Constr. Build. Mater. 2013, 47, 711–719. [Google Scholar] [CrossRef]
- GB/T 14684-2011; Sand for Construction. Standardization Administration of China: Beijing, China, 2011.
- GB/T 50081-2002; Standard for Test Method of Mechanical Properties on Ordinary Concrete. Standardization Administration of China: Beijing, China, 2002.
- GB/T 50152-2012; Standard for Test Method of Concrete Structures. Standardization Administration of China: Beijing, China, 2012.
- Reis, E.; Azevedo, R.C.D.; Christoforo, A.; Poggiali, F.; Bezerra, A.C.S. Bonding of steel bars in concrete: A systematic review of the literature. Structures 2023, 49, 508–519. [Google Scholar] [CrossRef]
- Strukar, K.; Šipoš, T.K.; Miličević, I.; Bušić, R. Potential use of rubber as aggregate in structural reinforced concrete element—A review. Eng. Struct. 2019, 188, 452–468. [Google Scholar] [CrossRef]
- Li, Q.-H.; Luo, A.-M.; Huang, B.-T.; Wang, G.-Z.; Xu, S.-L. Bond behavior between steel bar and strain-hardening fiber-reinforced cementitious composites under fatigue loading. Eng. Struct. 2024, 314, 118354. [Google Scholar] [CrossRef]
- Fang, T.; Hui, Z.; Rey, W.P.; Yang, A.; Liu, B.; Xie, Z. Digital Restoration of Historical Buildings by Integrating 3D PC Reconstruction and GAN Algorithm. J. Artif. Intell. Technol. 2024, 4, 179–187. [Google Scholar] [CrossRef]
- Chattopadhyay, S. Decoding medical diagnosis with machine learning classifiers. Medinformatics 2024. [Google Scholar] [CrossRef]
- Touil, M.; Bahatti, L.; Elmagri, A. Automatic sleep quality analysis using an artificial intelligence algorithm and eeg signal processing. J. Artif. Intell. Technol. 2024, 4, 153–159. [Google Scholar] [CrossRef]
- El Aeraj, O.; Leghris, C. Intrusion Detection System Based on an Intelligent Multilayer Model Using Machine Learning. J. Artif. Intell. Technol. 2024, 4, 332–341. [Google Scholar]
- Kim, S.; Yun, H.; Park, W.; Jang, Y. Bond strength prediction for deformed steel rebar embedded in recycled coarse aggregate concrete. Mater. Des. 2015, 83, 257–269. [Google Scholar] [CrossRef]
- Seara-Paz, S.; González-Fonteboa, B.; Eiras-López, J.; Herrador, M. Bond behavior between steel reinforcement and recycled concrete. Mater. Struct. 2014, 47, 323–334. [Google Scholar] [CrossRef]
- Wardeh, G.; Ghorbel, E.; Gomart, H.; Fiorio, B. Experimental and analytical study of bond behavior between recycled aggregate concrete and steel bars using a pullout test. Struct. Concr. 2017, 18, 811–825. [Google Scholar] [CrossRef]


| Mixture | Water (kg/m3) | Water Reducer (kg/m3) | Cement (kg/m3) | Sand (kg/m3) | Rubber (kg/m3) | Natural CA (kg/m3) | Recycled CA (kg/m3) | fc’ (MPa) | Ec (GPa) |
|---|---|---|---|---|---|---|---|---|---|
| RA0RB0 | 234 | 3.8 | 425 | 762 | 0 | 1018 | 0 | 36.3 | 70.5 |
| RA25RB0 | 234 | 3.8 | 425 | 762 | 0 | 763.5 | 254.5 | 31.1 | 66.4 |
| RA25RB5 | 234 | 3.8 | 425 | 723.9 | 19.1 | 763.5 | 254.5 | 28.5 | 63.9 |
| RA50RB0 | 234 | 3.8 | 425 | 762 | 0 | 509 | 509 | 35.0 | 62.8 |
| RA100RB0 | 234 | 3.8 | 425 | 762 | 0 | 0 | 1018 | 40.5 | 58.5 |
| Group | Specimen | RA Ratio | Rubber Ratio | Bond Strength (MPa) | Failure Modes | |
|---|---|---|---|---|---|---|
| Individual | Group | |||||
| RA0RB0 | RA0RB0-1 | 0 | 0 | 15.0 | 17.0 | Bond failure |
| RA0RB0-2 | 20.4 | (2.6) a | Bond failure | |||
| RA0RB0-3 | 15.0 | Bond failure | ||||
| RA0RB0-4 | 14.5 | Bond failure | ||||
| RA0RB0-5 | 19.9 | Bond failure | ||||
| RA25RB0 | RA25RB0-1 | 25% | 0 | 17.3 | 18.6 | Bond failure |
| RA25RB0-2 | 20.1 | (1.3) | Bond failure | |||
| RA25RB0-3 | 20.0 | Bond failure | ||||
| RA25RB0-4 | 17.1 | Bond failure | ||||
| RA25RB0-5 | 18.5 | Bond failure | ||||
| RA25RB5 | RA25RB5-1 | 25% | 5% | 21.1 | 19.7 | Bond failure |
| RA25RB5-2 | 19.0 | (0.9) | Bond failure | |||
| RA25RB5-3 | 19.1 | Bond failure | ||||
| RA25RB5-4 | 20.5 | Bond failure | ||||
| RA25RB5-5 | 18.7 | Bond failure | ||||
| RA50RB0 | RA50RB0-1 | 50% | 0 | 21.7 | 23.9 | Bond failure and yielding |
| RA50RB0-2 | 24.3 | (1.7) | Bond failure and hardening | |||
| RA50RB0-3 | 25.8 | Bond failure and hardening | ||||
| RA100RB0 | RA100RB0-1 | 100% | 0 | 28.5 | 28.1 | Rebar fracture |
| RA100RB0-2 | 28.1 | (0.3) | Rebar fracture | |||
| RA100RB0-3 | 27.8 | Rebar fracture | ||||
| Group | Specimen | Stress Ratio | Fatigue Test | Post-Fatigue Pullout Test | ||
|---|---|---|---|---|---|---|
| Failure Mode | Fatigue Life | Failure Mode | Bond Strength (MPa) | |||
| RA0 RB0 | RA0RB0-0.65-1 | 0.65 | N/A | N/A | Bond failure | 19.0 |
| RA0RB0-0.65-2 | 0.65 | N/A | N/A | Yielding and bond failure | 24.2 | |
| RA0RB0-0.65-3 | 0.65 | N/A | N/A | Yielding and bond failure | 21.8 | |
| RA0RB0-0.75-1 | 0.75 | N/A | N/A | Yielding and bond failure | 22.0 | |
| RA0RB0-0.75-2 | 0.75 | N/A | N/A | Yielding and bond failure | 23.3 | |
| RA0RB0-0.75-3 | 0.75 | N/A | N/A | Yielding and bond failure | 21.2 | |
| RA0RB0-0.85-1 | 0.85 | Frame failure | N/A | N/A | N/A | |
| RA0RB0-0.85-2 | 0.85 | N/A | N/A | Yielding and bond failure | 22.9 | |
| RA0RB0-0.85-4 | 0.85 | N/A | N/A | Rebar fracture | N/A | |
| RA25 RB0 | RA25RB0-0.65-1 | 0.65 | N/A | N/A | Yielding and bond failure | 22.1 |
| RA25RB0-0.65-2 | 0.65 | N/A | N/A | Yielding and bond failure | 22.3 | |
| RA25RB0-0.65-3 | 0.65 | N/A | N/A | Rebar fracture | N/A | |
| RA25RB0-0.75-1 | 0.75 | N/A | N/A | Yielding and bond failure | 22.3 | |
| RA25RB0-0.75-2 | 0.75 | N/A | N/A | Bond failure | 19.6 | |
| RA25RB0-0.75-4 | 0.75 | N/A | N/A | Rebar fracture | N/A | |
| RA25RB0-0.85-2 | 0.85 | Bond failure | 15,920 | N/A | N/A | |
| RA25RB0-0.85-3 | 0.85 | Bond failure | 1000 | N/A | N/A | |
| RA25RB0-0.85-4 | 0.85 | Bond failure | 24 | N/A | N/A | |
| RA25 RB5 | RA25RB5-0.65-1 | 0.65 | Rebar fracture | N/A | N/A | N/A |
| RA25RB5-0.65-2 | 0.65 | N/A | N/A | Yielding and bond failure | 22.7 | |
| RA25RB5-0.75-1 | 0.75 | Bond failure | 42,150 | N/A | N/A | |
| RA25RB5-0.75-2 | 0.75 | Bond failure | 1000 | N/A | N/A | |
| RA25RB5-0.75-3 | 0.75 | Bond failure | 4119 | N/A | N/A | |
| RA25RB5-0.75-4 | 0.75 | Rebar fracture | N/A | N/A | N/A | |
| RA25RB5-0.85-1 | 0.85 | Bond failure | 9704 | N/A | N/A | |
| RA25RB5-0.85-2 | 0.85 | Bond failure | 64,648 | N/A | N/A | |
| RA25RB5-0.85-3 | 0.85 | Bond failure | 25 | N/A | N/A | |
| RA50 RB0 | RA50RB0-0.75-1 | 0.75 | N/A | N/A | Rebar fracture | N/A |
| RA50RB0-0.75-2 | 0.75 | N/A | N/A | Yielding and bond failure | 22.4 | |
| RA50RB0-0.75-3 | 0.75 | N/A | N/A | Rebar fracture | N/A | |
| Specimen | fc’ (MPa) | τmax,t (MPa) | Proposed Model | fib Model Code [29] | Seara-Paz et al. [60] | |||
|---|---|---|---|---|---|---|---|---|
| τmax,p (MPa) | τmax,p (MPa) | τmax,p (MPa) | ||||||
| This study | ||||||||
| RA0RB0-1 | 36.3 | 15.0 | 18.1 | 1.21 | 15.1 | 1.00 | 15.1 | 1.00 |
| RA0RB0-2 | 36.3 | 20.4 | 18.1 | 0.89 | 15.1 | 0.74 | 15.1 | 0.74 |
| RA0RB0-3 | 36.3 | 15.0 | 18.1 | 1.21 | 15.1 | 1.01 | 15.1 | 1.01 |
| RA0RB0-4 | 36.3 | 14.5 | 18.1 | 1.25 | 15.1 | 1.04 | 15.1 | 1.04 |
| RA0RB0-5 | 36.3 | 19.9 | 18.1 | 0.91 | 15.1 | 0.76 | 15.1 | 0.76 |
| RA25RB0-1 | 31.1 | 17.3 | 18.8 | 1.09 | 13.9 | 0.81 | 13.5 | 0.78 |
| RA25RB0-2 | 31.1 | 20.1 | 18.8 | 0.94 | 13.9 | 0.70 | 13.5 | 0.67 |
| RA25RB0-3 | 31.1 | 20.0 | 18.8 | 0.94 | 13.9 | 0.70 | 13.5 | 0.68 |
| RA25RB0-4 | 31.1 | 17.1 | 18.8 | 1.10 | 13.9 | 0.82 | 13.5 | 0.79 |
| RA25RB0-5 | 31.1 | 18.5 | 18.8 | 1.02 | 13.9 | 0.75 | 13.5 | 0.73 |
| RA25RB5-1 | 28.5 | 21.1 | 18.0 | 0.85 | 13.3 | 0.63 | 12.9 | 0.61 |
| RA25RB5-2 | 28.5 | 19.0 | 18.0 | 0.95 | 13.3 | 0.70 | 12.9 | 0.68 |
| RA25RB5-3 | 28.5 | 19.1 | 18.0 | 0.95 | 13.3 | 0.70 | 12.9 | 0.68 |
| RA25RB5-4 | 28.5 | 20.5 | 18.0 | 0.88 | 13.3 | 0.65 | 12.9 | 0.63 |
| RA25RB5-5 | 28.5 | 18.7 | 18.0 | 0.96 | 13.3 | 0.71 | 12.9 | 0.69 |
| RA50RB0-1 | 35 | 21.7 | 22.2 | 1.02 | 14.8 | 0.68 | 13.9 | 0.64 |
| RA50RB0-2 | 35 | 24.3 | 22.2 | 0.91 | 14.8 | 0.61 | 13.9 | 0.57 |
| RA50RB0-3 | 35 | 25.8 | 22.2 | 0.86 | 14.8 | 0.57 | 13.9 | 0.54 |
| RA100RB0-1 | 40.5 | 28.5 | 28.6 | 1.00 | 15.9 | 0.56 | 13.9 | 0.49 |
| RA100RB0-2 | 40.5 | 28.1 | 28.6 | 1.02 | 15.9 | 0.57 | 13.9 | 0.50 |
| RA100RB0-3 | 40.5 | 27.8 | 28.6 | 1.03 | 15.9 | 0.57 | 13.9 | 0.50 |
| Mean | 1.00 | 0.73 | 0.70 | |||||
| COV | 0.11 | 0.19 | 0.22 | |||||
| Kim et al. [59] | ||||||||
| PLA0 | 29.26 | 21.7 | 16.2 | 0.75 | 13.5 | 0.62 | 13.5 | 0.62 |
| PLA30 | 26.52 | 17.7 | 17.8 | 1.01 | 12.9 | 0.73 | 12.4 | 0.70 |
| PLA60 | 28.53 | 19.2 | 20.8 | 1.09 | 13.4 | 0.70 | 12.4 | 0.64 |
| PLA100 | 27.08 | 18.7 | 23.4 | 1.25 | 13.0 | 0.69 | 11.4 | 0.61 |
| PMA0 | 33.42 | 25.3 | 17.3 | 0.68 | 14.5 | 0.57 | 14.5 | 0.57 |
| PMA30 | 31.46 | 21.9 | 19.4 | 0.88 | 14.0 | 0.64 | 13.5 | 0.62 |
| PMA60 | 30.66 | 21.6 | 21.6 | 1.00 | 13.8 | 0.64 | 12.8 | 0.59 |
| PMA100 | 29.49 | 20.9 | 24.4 | 1.17 | 13.6 | 0.65 | 11.9 | 0.57 |
| PHA0 | 44.13 | 29.4 | 19.9 | 0.68 | 16.6 | 0.56 | 16.6 | 0.56 |
| PHA30 | 39.5 | 29.9 | 21.7 | 0.72 | 15.7 | 0.53 | 15.1 | 0.51 |
| PHA60 | 43.8 | 28.8 | 25.8 | 0.90 | 16.5 | 0.58 | 15.3 | 0.53 |
| PHA100 | 42.44 | 28.8 | 29.3 | 1.02 | 16.3 | 0.56 | 14.3 | 0.49 |
| Mean | 0.93 | 0.62 | 0.59 | |||||
| COV | 0.20 | 0.10 | 0.10 | |||||
Disclaimer/Publisher’s Note: The statements, opinions and data contained in all publications are solely those of the individual author(s) and contributor(s) and not of MDPI and/or the editor(s). MDPI and/or the editor(s) disclaim responsibility for any injury to people or property resulting from any ideas, methods, instructions or products referred to in the content. |
© 2025 by the authors. Licensee MDPI, Basel, Switzerland. This article is an open access article distributed under the terms and conditions of the Creative Commons Attribution (CC BY) license (https://creativecommons.org/licenses/by/4.0/).
Share and Cite
Wei, W.; Cai, S.; Li, Y. Fatigue Bond Behavior of Steel Rebars in Recycled Aggregate Concrete Containing Recycled Rubber. Buildings 2025, 15, 2102. https://doi.org/10.3390/buildings15122102
Wei W, Cai S, Li Y. Fatigue Bond Behavior of Steel Rebars in Recycled Aggregate Concrete Containing Recycled Rubber. Buildings. 2025; 15(12):2102. https://doi.org/10.3390/buildings15122102
Chicago/Turabian StyleWei, Wei, Shanming Cai, and Yufu Li. 2025. "Fatigue Bond Behavior of Steel Rebars in Recycled Aggregate Concrete Containing Recycled Rubber" Buildings 15, no. 12: 2102. https://doi.org/10.3390/buildings15122102
APA StyleWei, W., Cai, S., & Li, Y. (2025). Fatigue Bond Behavior of Steel Rebars in Recycled Aggregate Concrete Containing Recycled Rubber. Buildings, 15(12), 2102. https://doi.org/10.3390/buildings15122102