Article

Assessment of Price Adjustment Mechanisms in Romanian Public Construction Contracts: A Longitudinal Cost Impact Analysis (2018–2024)

by
Cornel Adrian Ciurușniuc
*,
Irina Ciurușniuc-Ichimov
and
Adrian Alexandru Șerbănoiu
Faculty of Civil Engineering and Installations, Gheorghe Asachi Technical University of Iași, 700050 Iași, Romania
*
Author to whom correspondence should be addressed.
Buildings 2025, 15(12), 2076; https://doi.org/10.3390/buildings15122076
Submission received: 21 April 2025 / Revised: 9 June 2025 / Accepted: 12 June 2025 / Published: 16 June 2025
(This article belongs to the Section Building Structures)

Abstract

:
Since the enforcement of Law 98/2016 on public procurement in Romania, the inclusion of price adjustment clauses in construction contracts has become a standard practice. This paper, which presents a comprehensive analysis of the financial implications of eight adjustment formulas applied to public construction projects executed over three durations (12, 24, and 36 months) between 2018 and 2024, is a significant contribution to the field. A comparative analysis using objective indices published by Romania’s National Institute of Statistics reveals the impact of inflation and cost variations on adjusted contract values. Three scenarios, each starting in different years (2018, 2020, and 2022), are explored to determine the sensitivity of the formulas to market fluctuations. Results show that by applying the eight adjustment formulas, only two formulas tend toward annual inflation. The indices used by the construction branch are not correlated with yearly inflation, and when no advance payments are granted, they offer a reliable basis for economic equilibrium in public contracting. The study guides the selection of appropriate adjustment models to manage financial risk in a volatile construction market, providing valuable insights for academics, researchers, and professionals in civil engineering and public procurement.

1. Introduction

Across the world, the construction industry has been hit hard by inflation. As a result, construction projects often end up costing more than initially estimated, putting pressure on the beneficiary to cover the extra expense [1,2].
After Law 98/2016 took effect, Romania’s construction industry saw a major shift. The law allowed public works contracts to include price adjustment mechanisms, which became crucial for managing inflation and the ups and downs of material costs between 2016 and 2024. As prices rose and the economy became more unstable, especially during and after the COVID-19 pandemic, these mechanisms were vital.
This study presents a detailed analysis of the evolution, structure, and performance of price adjustment formulas used in Romania’s public construction contracts. Our research focuses on the application of these formulas across various implementation periods and project durations, offering both a quantitative evaluation through case simulations, historical data, and a qualitative assessment.
The impact of inflation is a direct or indirect cost on the construction industry [3,4,5].
The impact of inflation on construction is multifaceted. According to several studies, inflation serves as both a direct and indirect cost generator [6,7,8,9]. It raises the cost of raw materials, labor, and machinery while also indirectly affecting procurement cycles, planning accuracy, and investor confidence [10,11,12,13,14,15,16,17,18,19,20]. Public construction contracts financed through national or European sources are vulnerable to such changes, as fixed budgets and strict timelines often limit these projects [3,21,22,23,24].
To address these challenges, this research aims to identify a suitable and adaptable price adjustment formula for use in Romanian public procurement. The indices used in our analysis—such as those for construction materials, labor costs, and energy prices—were obtained from the Romanian National Institute of Statistics (INS), ensuring a robust and nationally relevant data foundation [25].
By providing a thorough assessment of adjustment mechanisms, this study adds to the ongoing work to boost resilience and financial predictability in the construction industry, especially in areas where economic uncertainty is likely to continue.
Furthermore, it influences the final costs of projects financed through public or European funds. The primary objective of this research is to identify an appropriate price adjustment formula. The input data for the relevant indices were sourced from the Romanian National Institute of Statistics (INS).

2. Methodology

This study aims to evaluate and compare various price adjustment formulas used in Romanian public construction contracts and to propose an optimal structure adapted to current economic realities. The analysis is based on
-
A review of legal documents and public procurement contracts between 2016 and 2024;
-
Statistical data sourced from the Romanian National Institute of Statistics (INS), including monthly indices for construction materials, labor, and fuel;
The first step of the research was the literature review and the legislation [26,27,28,29], and so we found the eight price adjustment formulas.
The scope of the eight price adjustment formulas was analyzed. Each formula incorporates different parameters, including cost indices for materials, labor, equipment, inflation rates, and profit margins. These formulas are widely used in the industry and are applied to hypothetical public construction projects valued at RON 10,000,000 (excluding VAT), with 12-, 24-, and 36-month durations. RON is Romanian leu.
The project’s start years are 2018, 2020, and 2022, which represent distinct economic conditions. Input data for indices were sourced from the Romanian National Institute of Statistics (INS), specifically Tables 15 and 15A of the Statistical Price Bulletin. Calculations were performed for no advance payments and with standardized profit margins of 5%.
-
F1 will be assigned to the formula An = av + (1 − av) ∗ In/Io.
Where:
-
“An” is the adjustment coefficient.
-
“av” is the percentage value of the advance payment.
-
“In” is the construction cost index (total) published by the National Institute of Statistics (INS) in the Statistical Bulletin of Prices, Table 15, for month “n”.
-
“Io” is the construction cost index (total).
F1 is from Decision No. 1/2018 of 10 January 2018 for the approval of the general and specific conditions for certain categories of procurement contracts related to investment objectives financed from public funds.
-
F2 will be assigned to the formula An = av + m ∗ Mn/Mo + f ∗ Fn/Fo + e ∗ En/Eo.
Where:
-
“An” is the adjustment coefficient.
-
“av” is a fixed coefficient representing the advance payment percentage.
-
“m”, “f”, and “e” are coefficients representing the estimated share of each relevant cost element in the execution of the works. (These cost elements are resources such as materials, labor, and equipment).
-
“Fn”, “En”, “Mn” are the current price/cost indices or reference prices for materials, labor, and equipment for month “n”, expressed in the contract currency, as applicable 60 days before the last day of month “n”. These price indices or reference prices correspond to the relevant cost elements.
-
“Lo”, “Eo”, “Mo”, and the base (reference) price/cost indices for materials, labor, and equipment, respectively (at contract commencement). The following equation will be checked: av + m + f + e = 1.
F2 is from Decision No. 1/2018 of 10 January 2018 for the approval of the general and specific conditions for certain categories of procurement contracts related to investment objectives financed from public funds.
-
F3 will be assigned to the formula C = (ICCM)n/(ICCMian.2021) ∗ P + (1 − P).
Where:
-
“P” is the proportion determined by the subject of the contract.
-
“ICCMn” is the construction cost index for materials for the month before the payment request (month “n”) for which official values are available.
-
“ICCMian.2021” is the construction cost index for materials for January 2021 (the base reference index for materials).
F3 is from Emergency Ordinance No. 15 of 30 August 2021 on the regulation of some fiscal-budgetary measures for adjusting the prices of public procurement contracts.
-
F4 will be assigned to the formula Va = Vo[(1 − p − a) ∗ ICCn/ICCdata referință + (p + a)].
Where:
-
Va is the adjusted value of the payment request.
-
Vo is the value of the payment request according to the prices in the original contract offer;
-
a is the percentage of advance payment, determined as the ratio between the advance amount (unreimbursed) and the contract price;
-
p is the percentage of profit, determined as the ratio between the profit amount and the contract price;
-
ICC_n is the total construction cost index for the month of the payment request;
-
ICC_data referință is the total construction cost index for the month before the bid submission deadline (the reference index at contract baseline);
F4 is from Emergency Ordinance No. 47 of 14 April 2022 on the adjustment of the prices of public procurement contracts/sectoral contracts/concession contracts/framework agreements;
-
F5 will be assigned to the formula Valp = Vm ∗ [(%av + %p) + (1 − %av − %p) ∗ ICCmr/ICCmlr] + (Vpl − Vm) + (1 − %cpm) ∗ [(%av + %p) + (1 − %av − %p) ∗ ICCr/ICCplr] − (Vpl − Vm).
Where:
-
Vapl is the updated value of the payment requested by the contractor at the submission date of the payment request;
-
Vpl is the value of the payment requested by the contractor at the submission date of the payment request;
-
Vm is the portion of the payment value corresponding to material expenditures, as per the contractor’s payment request;
-
ICCmr is the realized construction cost index for materials, published by the National Institute of Statistics, the first Statistical Bulletin of Prices—Table 15 cost indices in constructions by categories of objects and structural elements, applicable 60 days before the last day of the month “n”.
-
ICCmlr is the realized construction cost index for materials, published by the National Institute of Statistics, in the first Statistical Bulletin of Prices, for the reference month;
-
ICCr is the realized total construction cost index, published by the National Institute of Statistics, the first Statistical Bulletin of Prices, Table 15, applicable 60 days before the last day of the month “n”.
-
ICCplr is the total construction cost index, forecasted by the National Commission for Strategy and Forecast, valid in the reference month, for the date 60 days before the last day of the month “n” (according to Annex 4 of the relevant regulation);
-
%av is the percentage of advance granted by the client to the contractor as of the payment date;
-
%p is the percentage of profit included in the payment requests; if profit is not specified or cannot be identified, a default of 3% of the payment statement value is used;
-
%cpm is the weighting coefficient of materials used in calculating the total construction cost index, published by the National Institute of Statistics, the first Statistical Bulletin of Prices, Table 15A, determined according to the type of construction;
-
month “n” refers to the month of payment request submission.
F5 is from Emergency Ordinance No. 64 of 9 May 2022 on the adjustment of prices and value of general estimates within projects financed from non-reimbursable external funds.
-
F6 will be assigned to the formula An = av + m ∗ Mn/Mo.
Where:
-
“An” is the adjustment coefficient to be applied to the value of material expenses within the work statements that will be presented for payment.
-
“av” is a fixed coefficient representing the percentage value of the advance payment according to the contract.
-
“m” represents the weight of the construction cost index for the cost of materials.
-
Mn represents the construction cost index for the cost of materials for the reference month “n”, applicable 60 days before the last day of the month “n”;
-
Mo is assimilated to the construction cost index for the cost of materials related to the month of the conclusion of the contract.
Within the equation, only the materials will be adjusted, and there will be no direct or indirect expenses; the profit will be adjusted. The adjustment will not apply to equipment, endowments, and intangible assets included in the works contract.
F6 is from Emergency Ordinance No. 15 of 30 August 2021 on the regulation of some fiscal–budgetary measures for adjusting the prices of public procurement contracts.
-
F7 will be assigned to the formula Y = [(1 + I)1/12 − 1] ∗ 100% resulting from the case study that will be published later after the completion of the analyzed data.
Where:
-
I = the annual inflation rate expressed as a decimal place of 100 (i.e., 10% = 0.10).
-
Y = monthly inflation rate expressed as a percentage.
-
F8 will be assigned to the formula Va = V0 ∗ IPC/100 resulting from the case study No. 1 resulting from the case study which will be published later after the completion of the analyzed data.
Where:
-
Va—updated price;
-
V0—initial price offered and specified at the signing of the contract;
-
IPC—monthly consumer price index.
The notation update rate, which will be used in the award of public procurement contracts, is 2017—4.40%; 2018—4.50%; 2019—4.60%; 2020—5.60%; 2021—5.50%; 2022—5.60%; 2023—9.50%; 2024—8.00%;
To determine the impact of the adjustment and formulas applied to the contracts, we will carry out the following analyses:
(a)
Cost analysis for projects with a duration of 12 months of execution
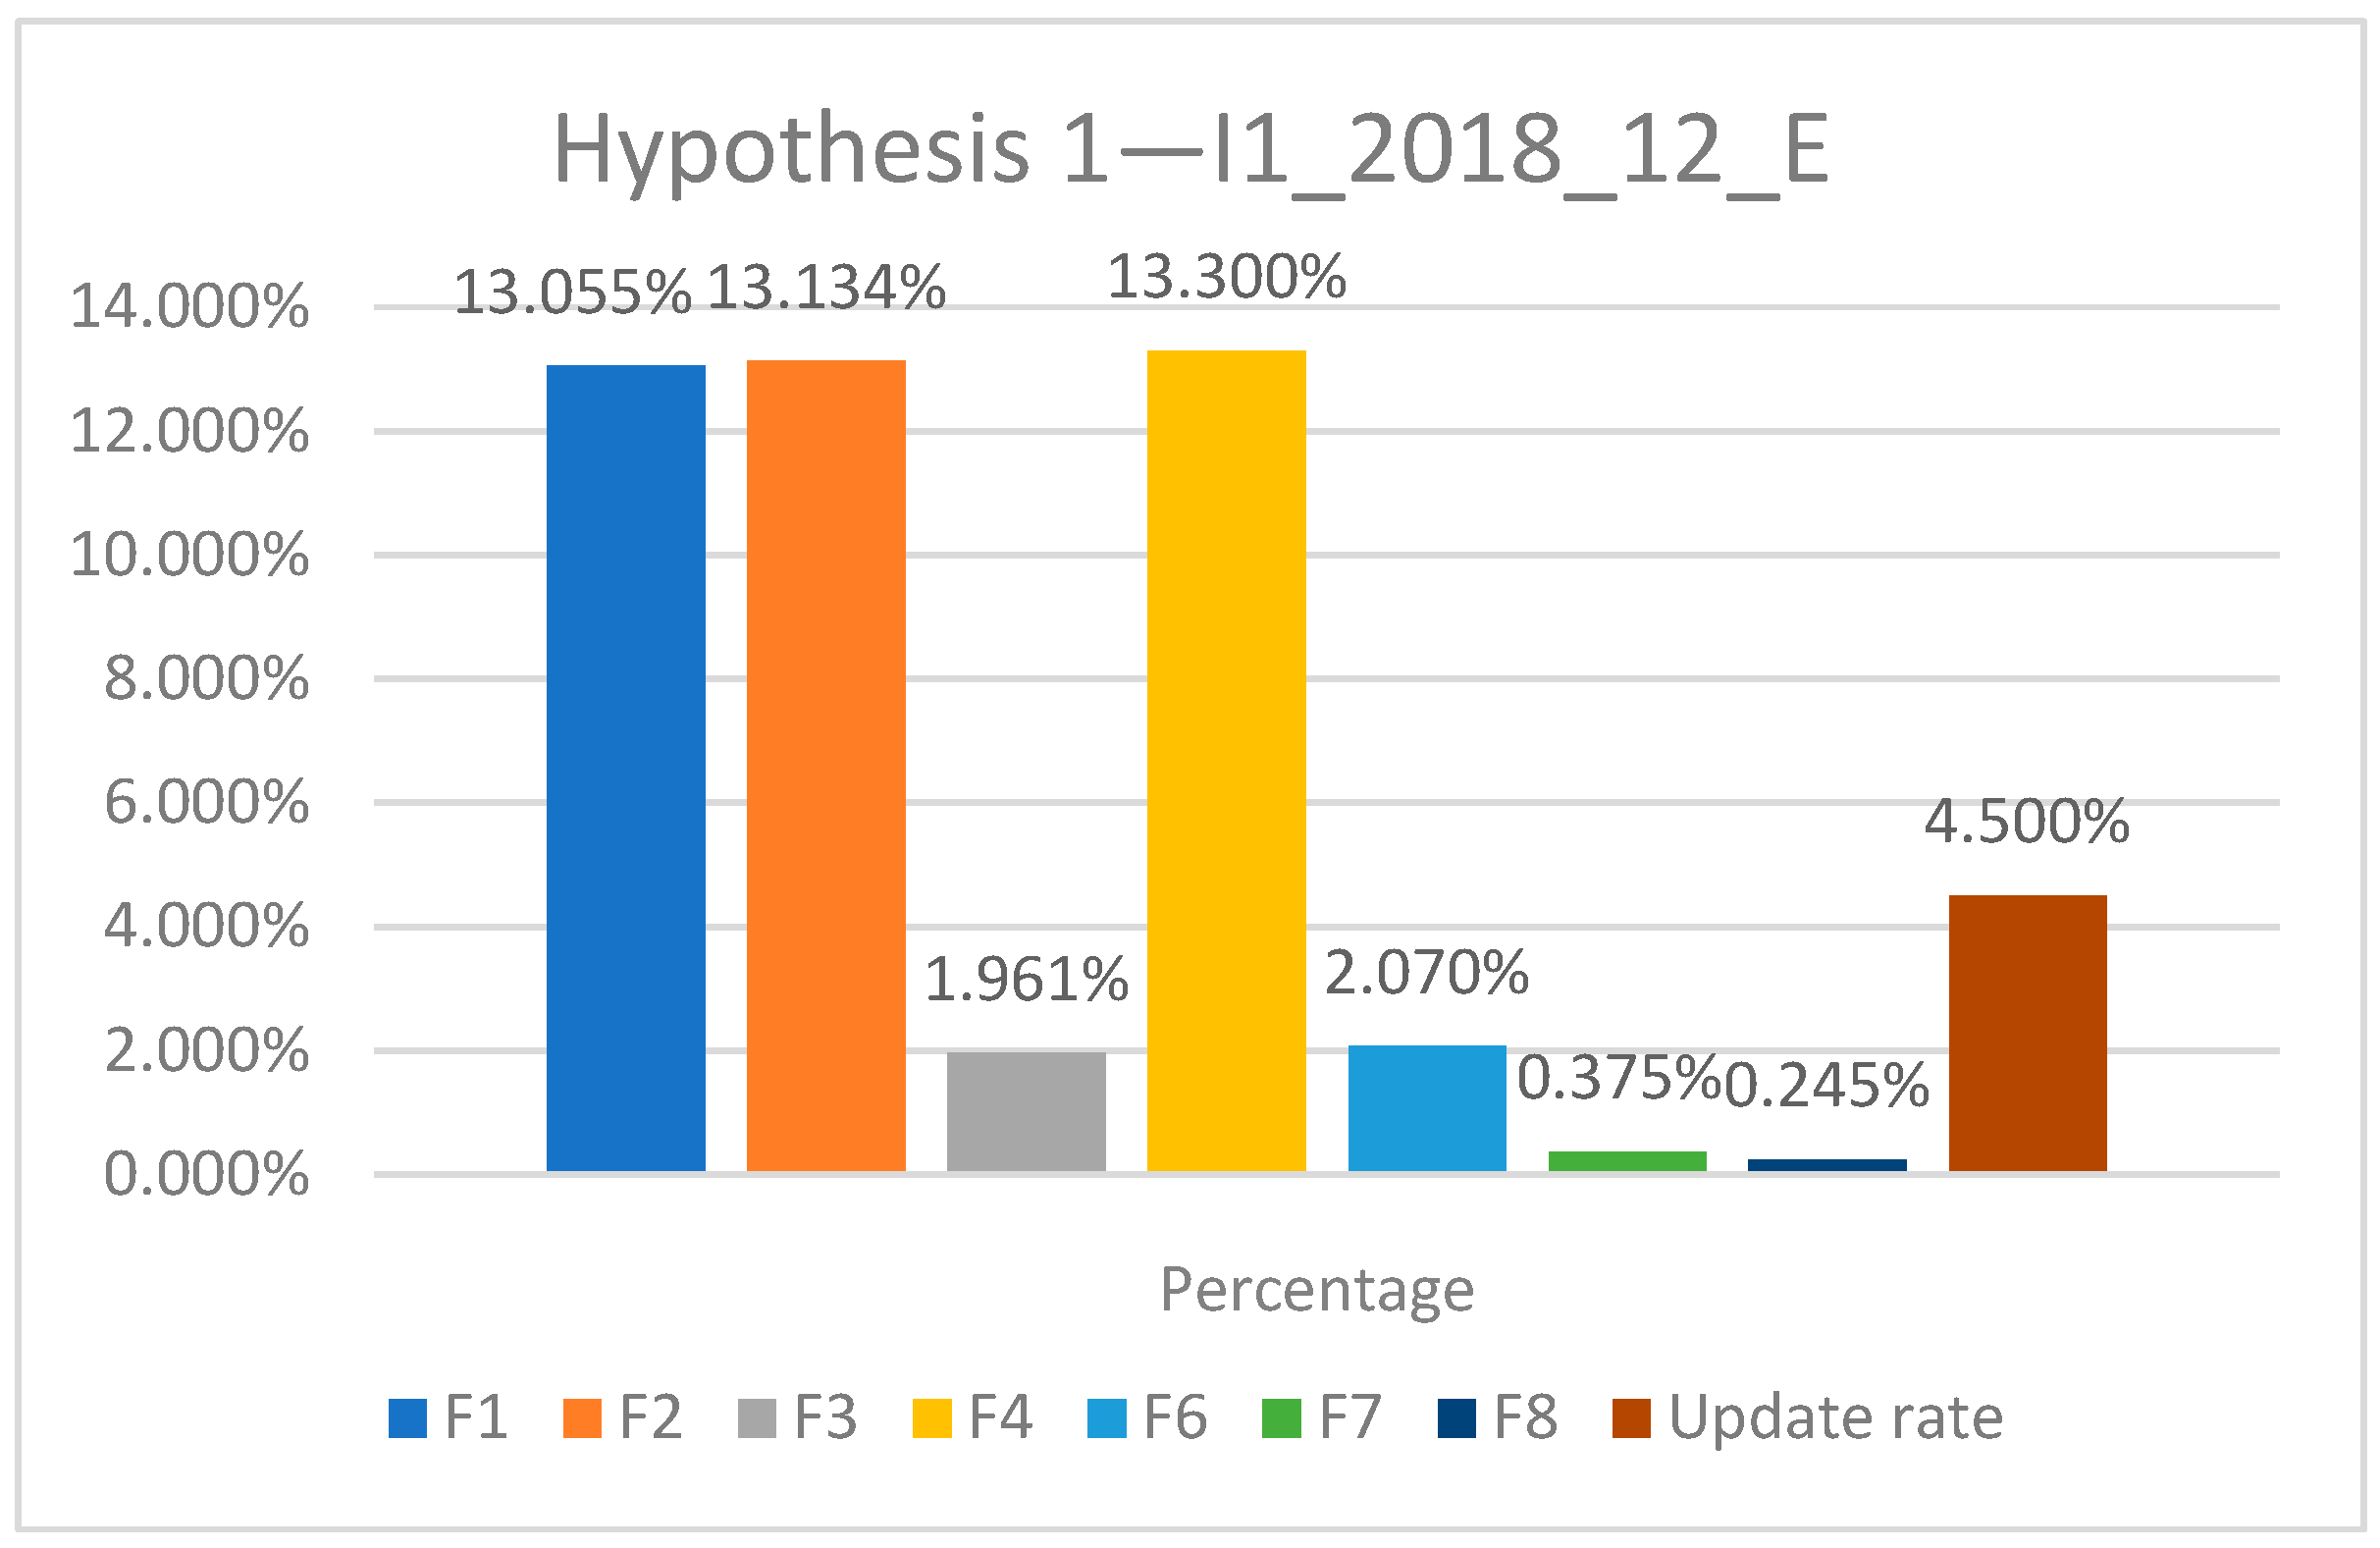
  • Hypothesis 1 for 2018 having the indicative I1_2018_12_E
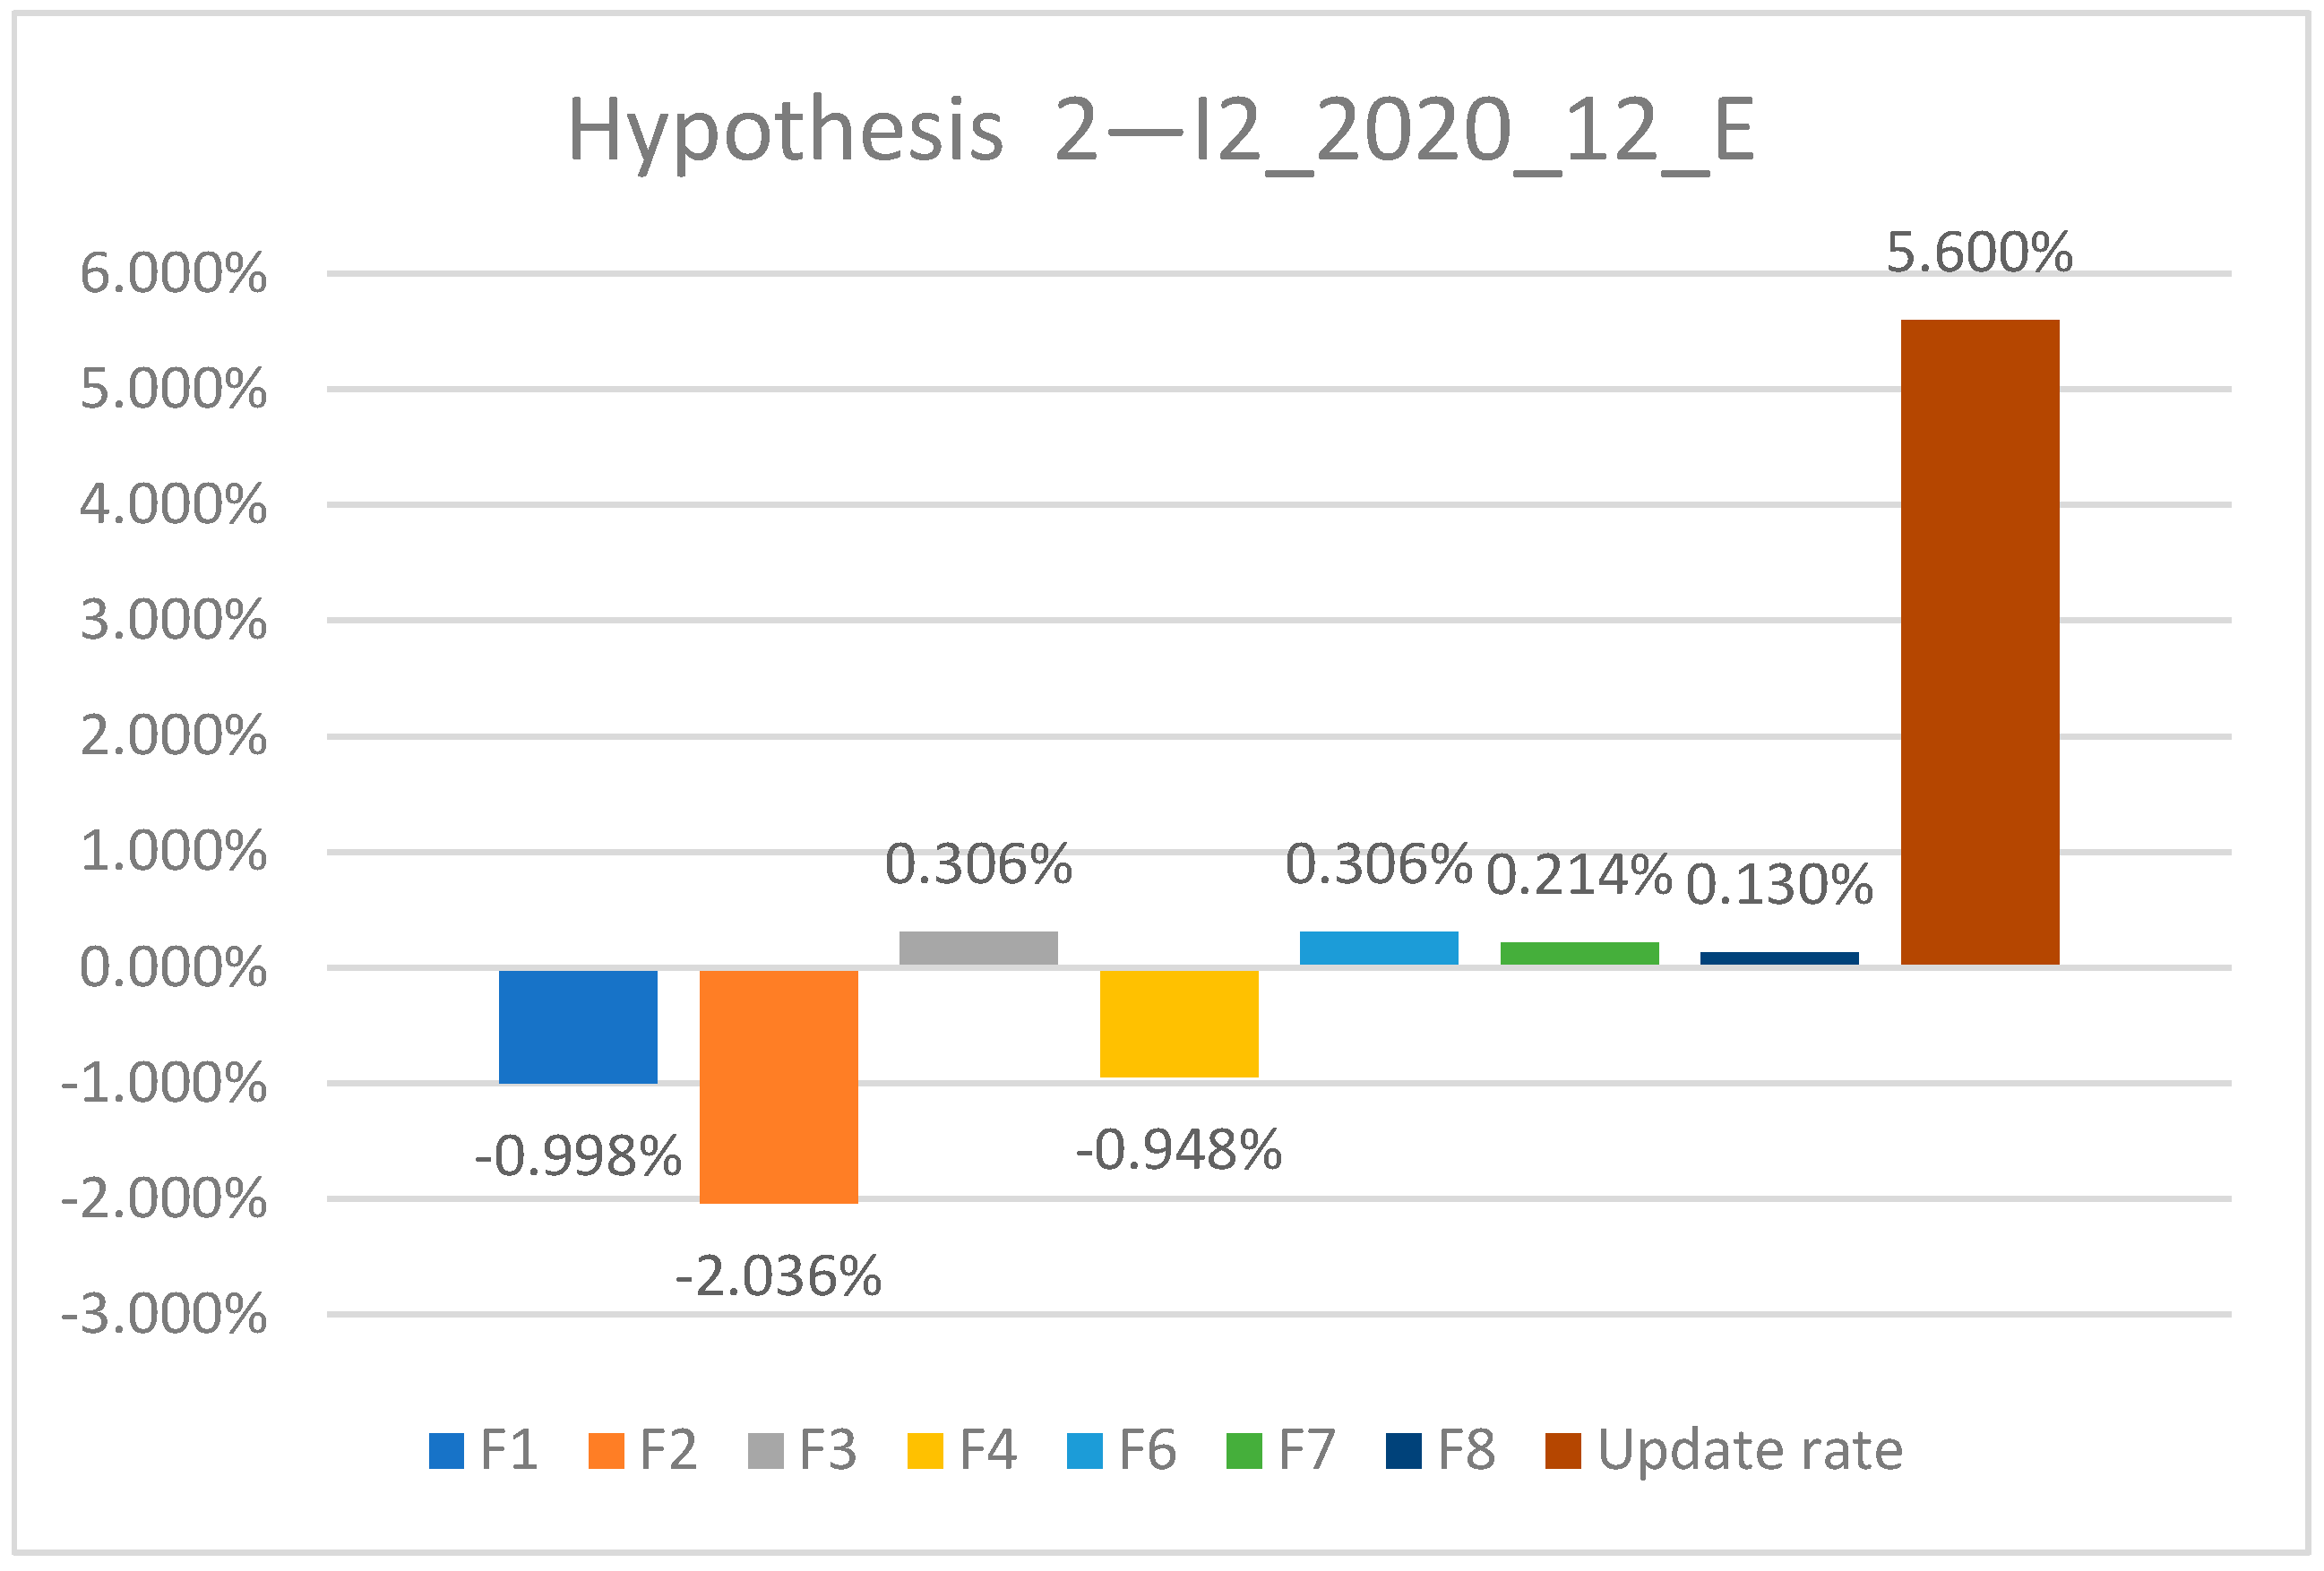
  • Hypothesis 2 for 2020 with the indicative I2_2020_12_E
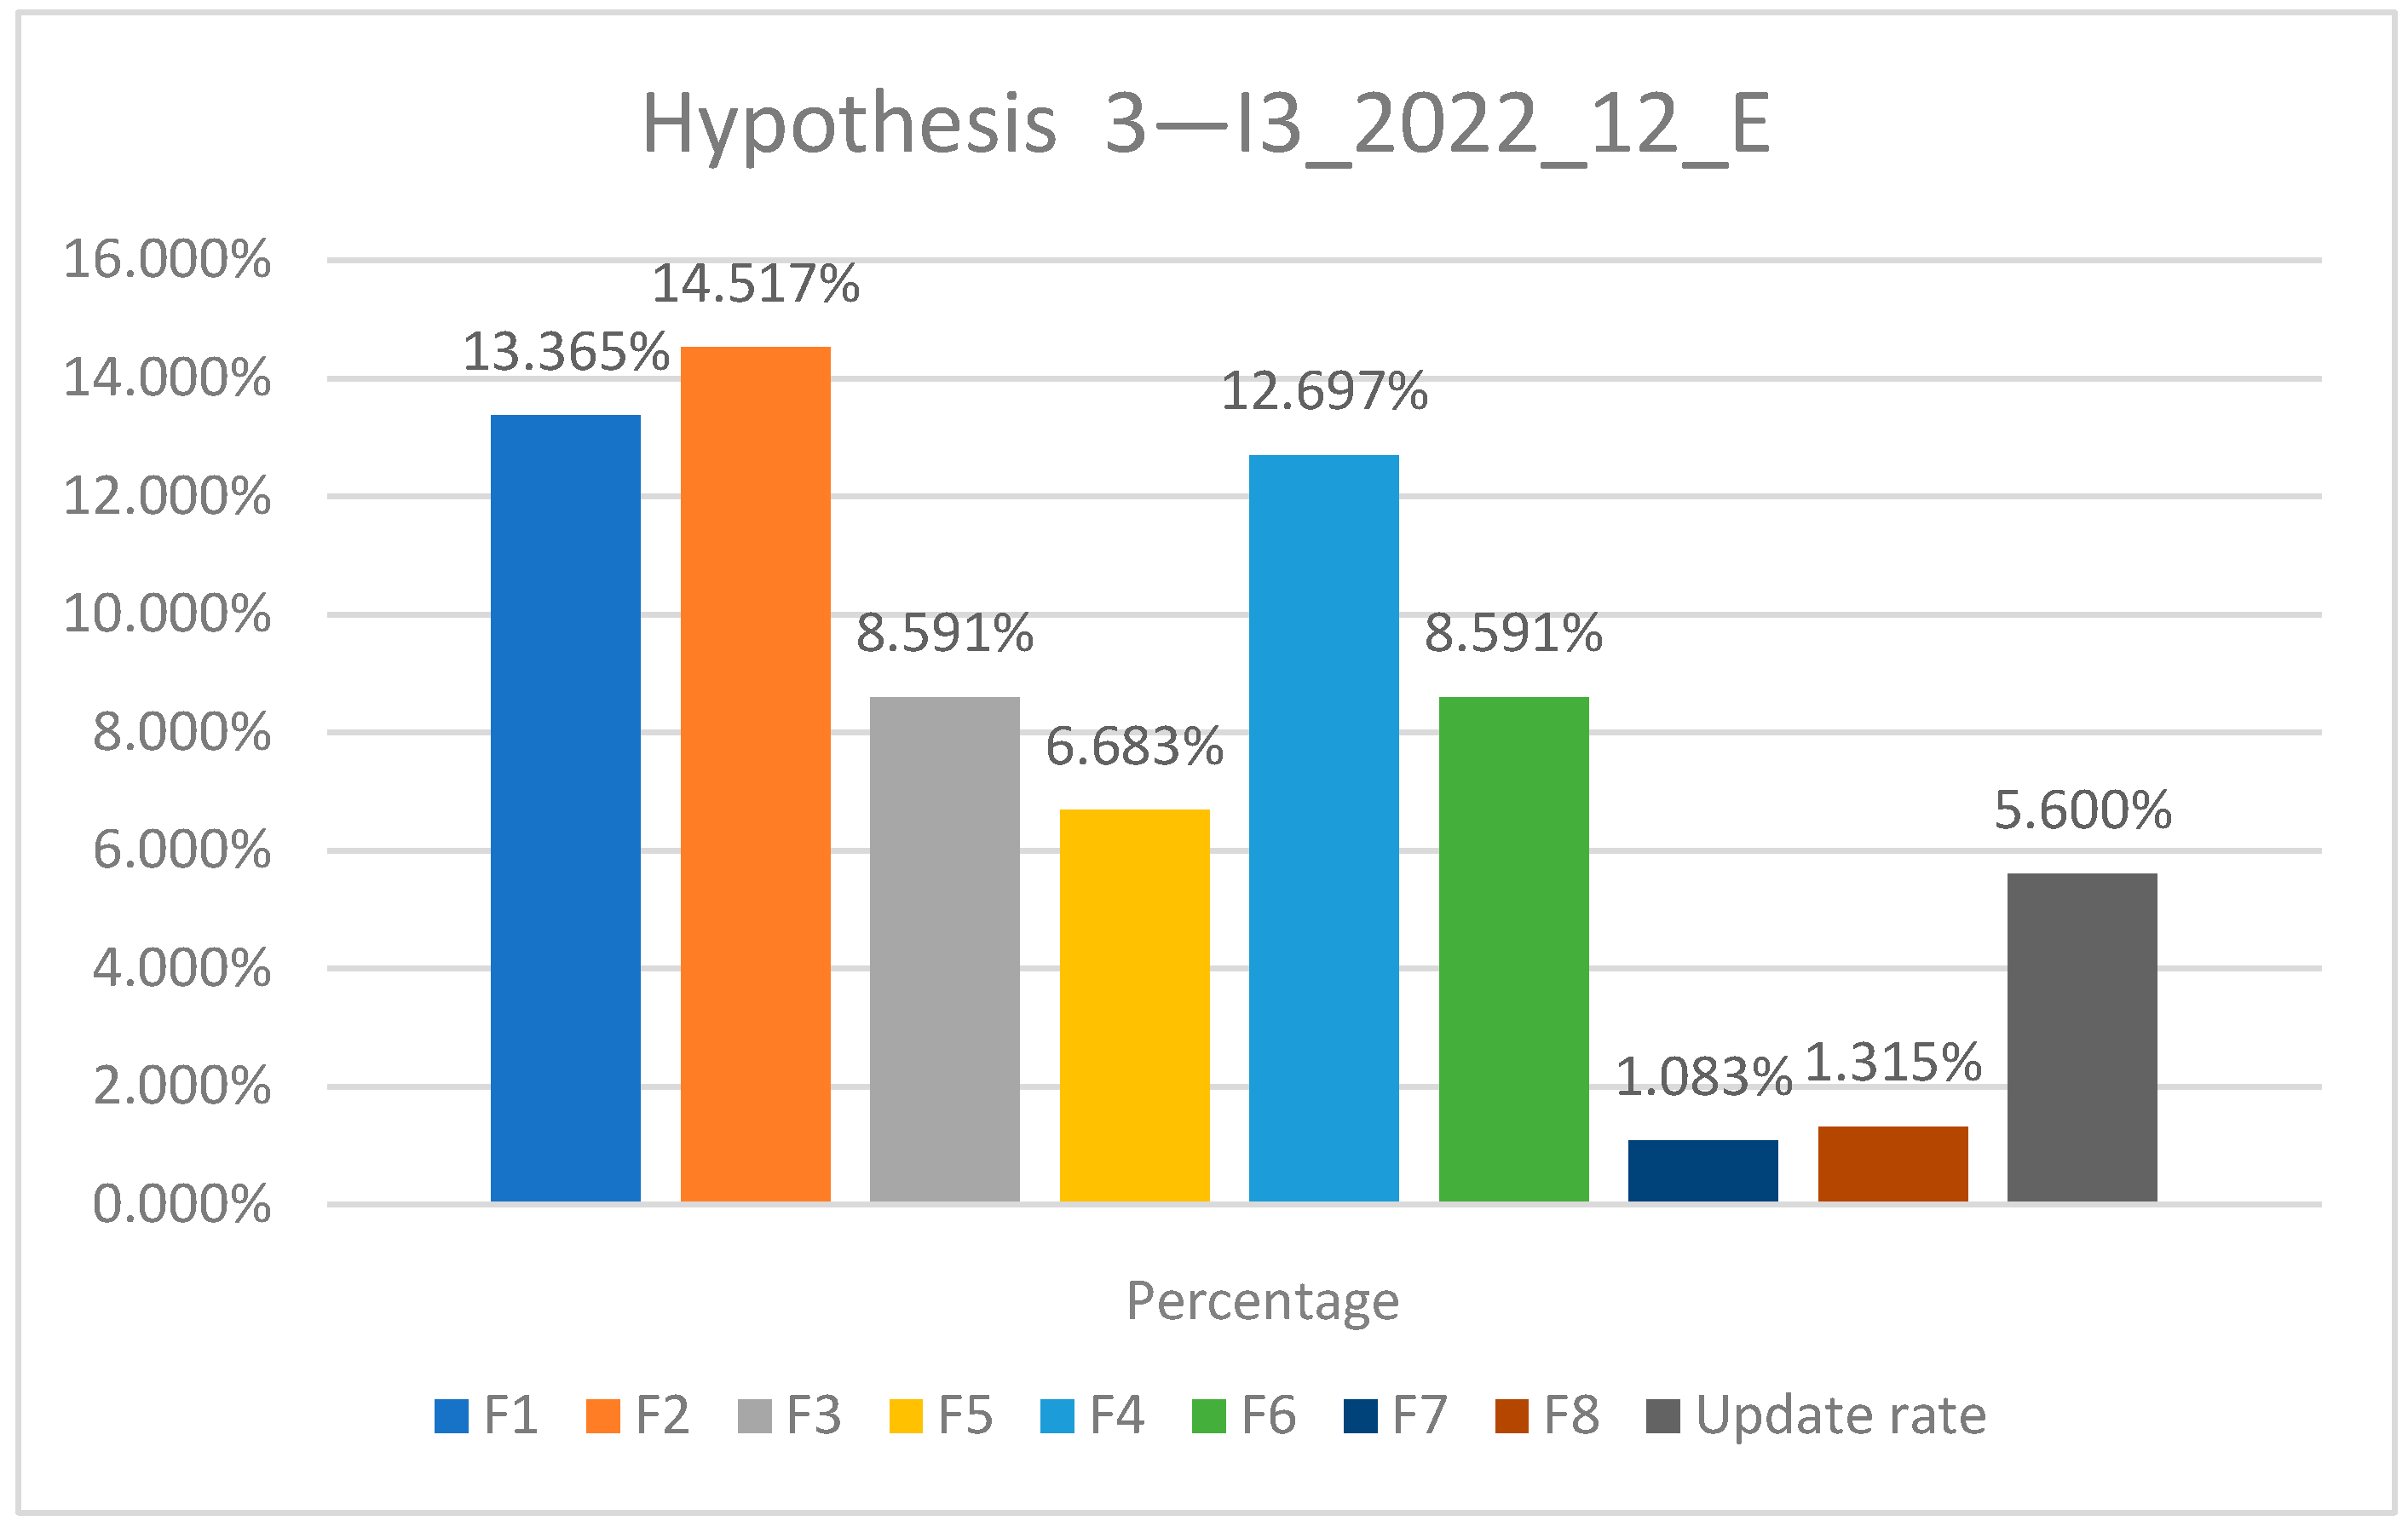
  • Hypothesis 3 for the year 2022 with the indicative I3_2022_12_E
(b)
Cost analysis for projects with a duration of 24 months of execution
  • Hypothesis 1 with the start date of 2018 and end date of 2019 with the indicative I1_2018–2019_24_E
  • Hypothesis 1 with the start date of 2020 and end date of 2021 with the indicative I2_2020–2021_24_E
  • Hypothesis 3 with the start date of the year 2022 and the end date of 2023 with the indicative I3_2022–2023_24_E
(c)
Cost analysis for projects with a duration of 36 months of execution
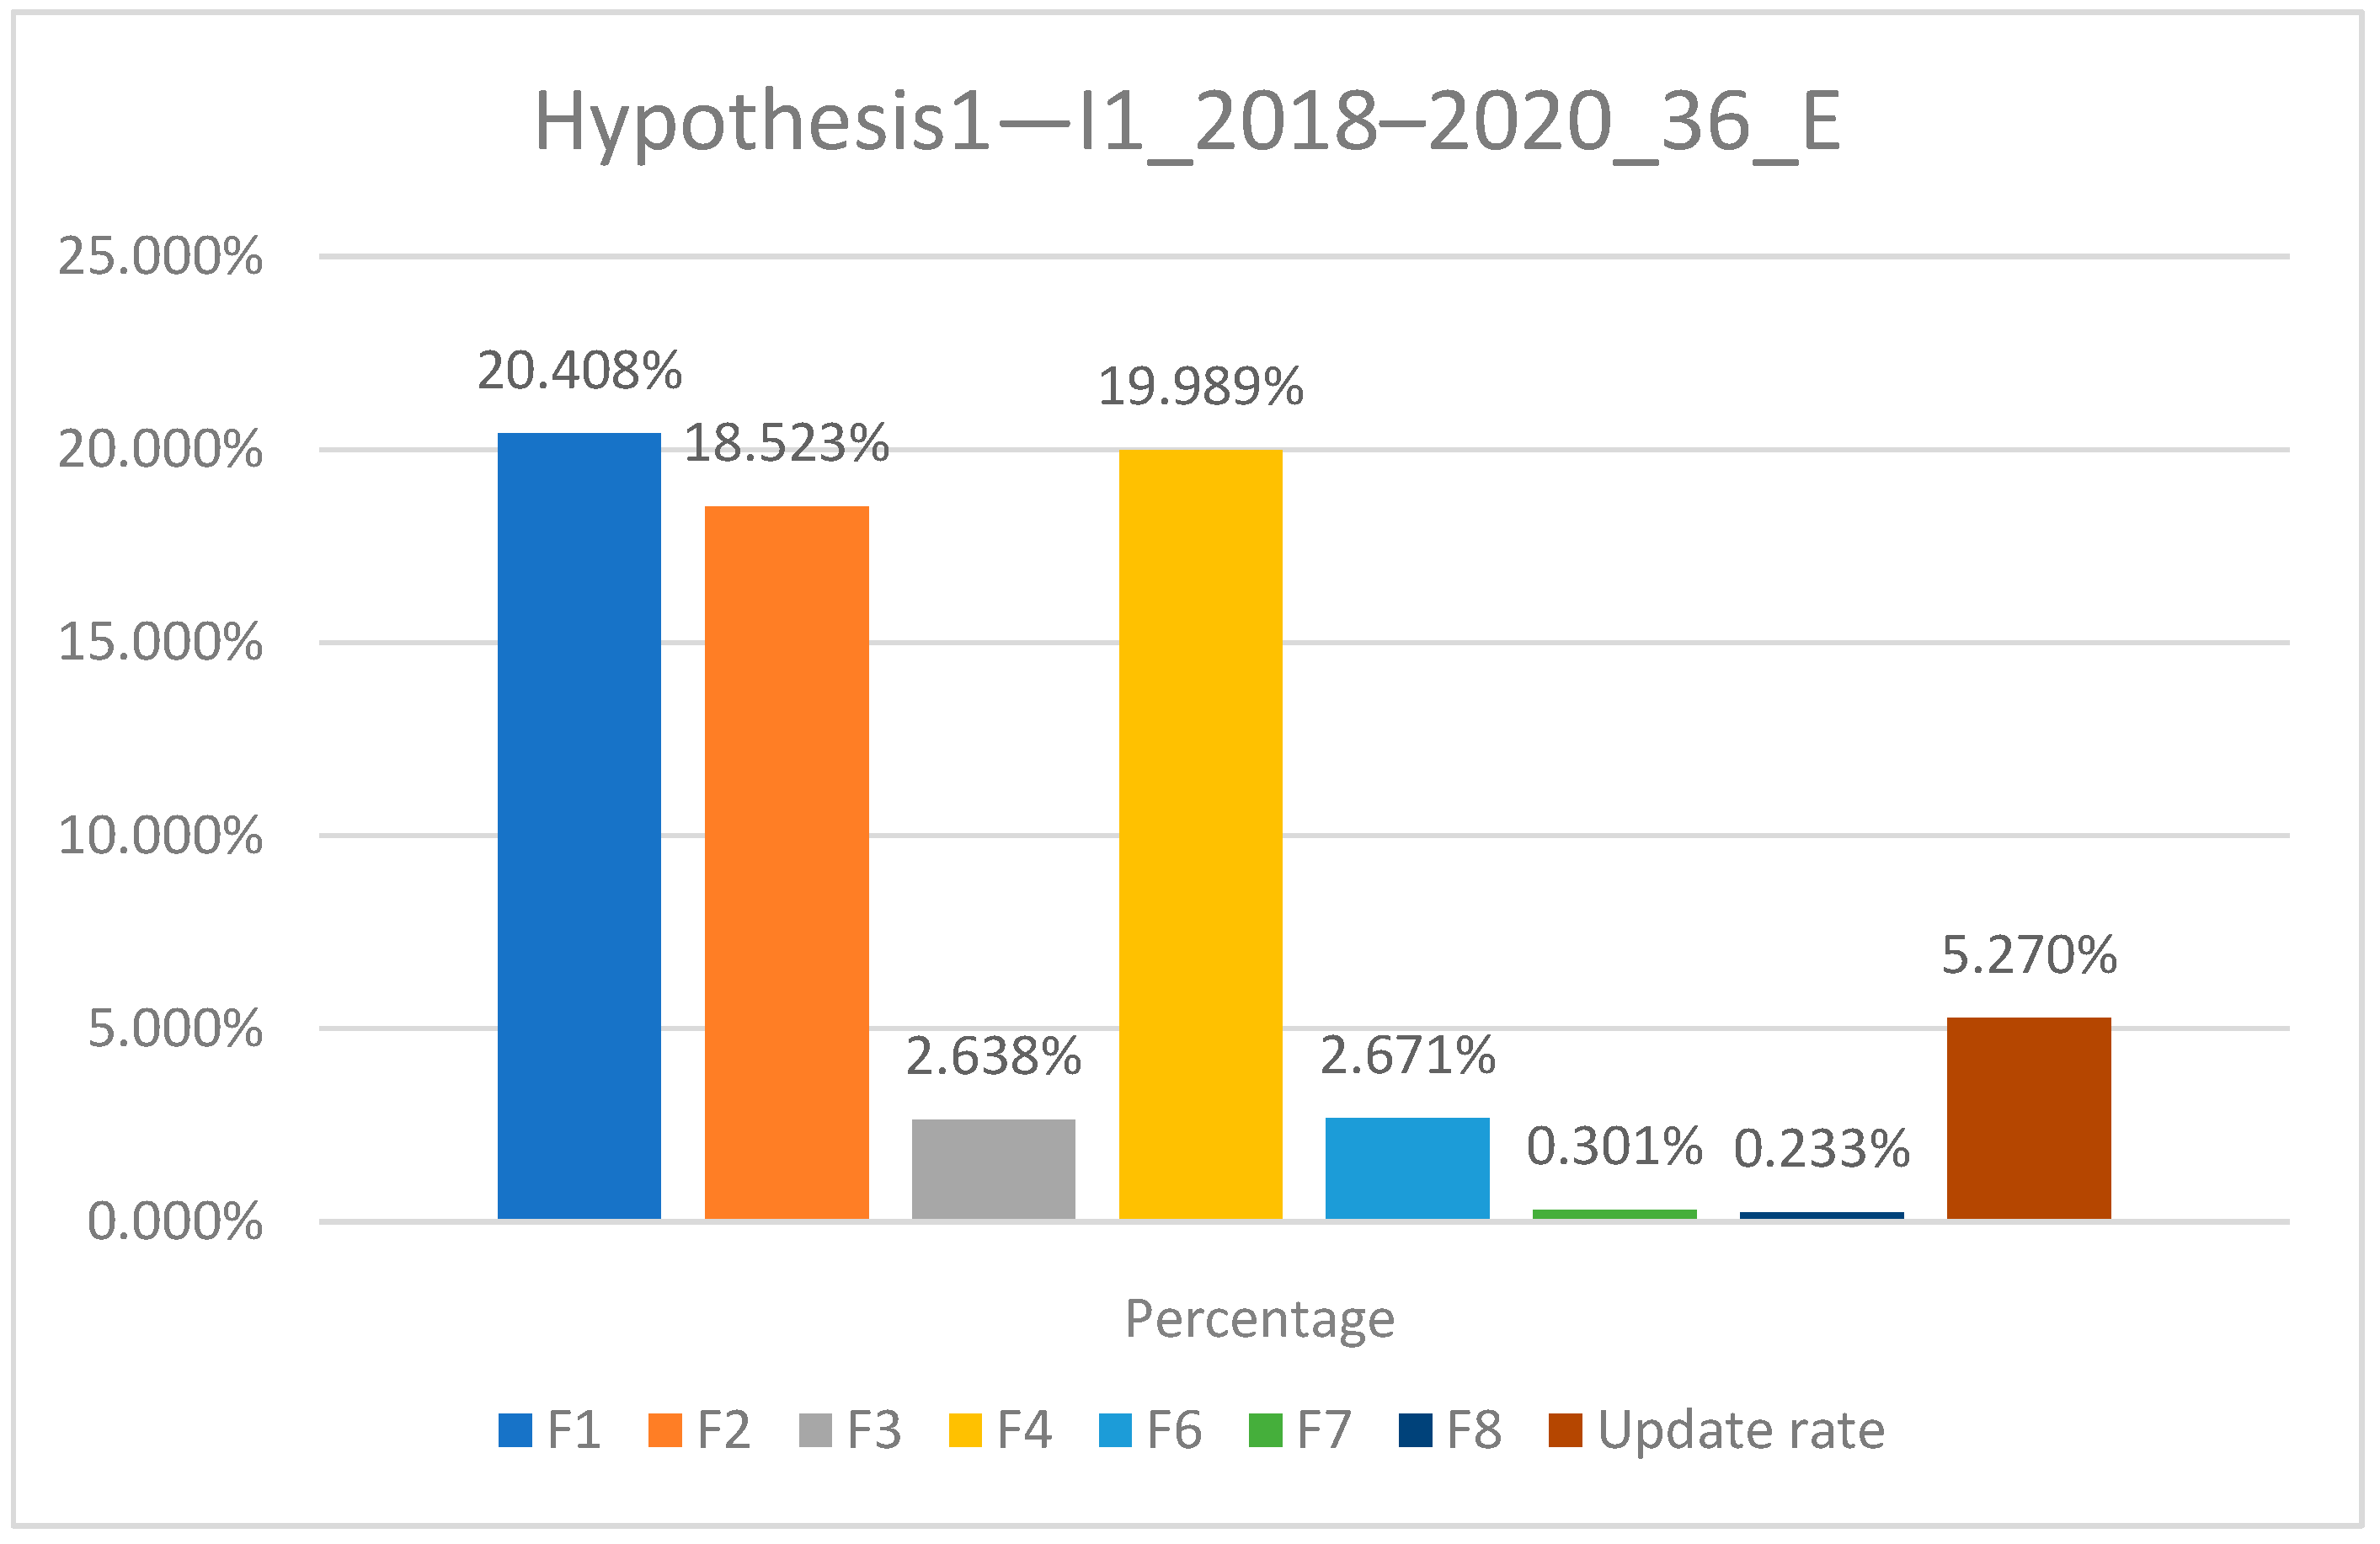
  • Hypothesis 1 with the start date of 2018 and end date of 2020 with the indicative I1_2018–2020_36_E
  • Hypothesis 2 with the start date of 2020 and end date of 2022 with the indicative I2_2020–2022_36_E
  • Hypothesis 3 with the start date of the year 2022 and the end date of 2024 with the indicative I3_2022–2024_36_E

3. Cost Analysis for Projects That Have the Execution Component

3.1. Hypothesis 1

For the performance of the analyses, we will consider the following data:
-
New construction works—Non-residential buildings, according to Table 15A of the INSS bulletin; the share of material represents 45.82%
-
Bid submission date
-
Execution time 12 months/24 months/36 months
-
Contract signing date: January 2018
-
Date of submission of the offer (simplified procedure duration 3 months)—September 2017
-
Contract value: RON 10,000,000.00 without VAT
-
Monthly work situations will be issued
-
“av” is the percentage value of the advance payment compared to the Contract Price: 0.00
-
Profit: 5%
For Hypothesis 1 with the indicative I1_2018_12_E, the formulas with the notation F1, F2, F3, F4, F6, F7, and F8 and the update rate will be used.
Figure 1 shows that F4 (13.30%), F2 (13.13%), and F1 (13.06%) have the highest adjustment rates, indicating a strong sensitivity to price changes. These formulas probably rely on weightings or indices that are heavily influenced by material or quickly reflect market fluctuations. F3 (1.96%) and F6 (2.07%) demonstrate much lower responsiveness, suggesting either fixed coefficients or low index volatility. F7 (0.375%) and F8 (0.245%) provide minimal adjustments, rendering them unsuitable in high-inflation scenarios.
For Hypothesis 1 with the indicative I1_2018–2019_24_E, the formulas with the notation F1, F2, F3, F4, F6, F7, and F8 and the update rate will be used.
Figure 2 shows that F1 (18.09%), F2 (17.30%), and F4 (17.94%) once again achieve the highest adjustment rates. This indicates they adapt well to prolonged inflationary trends, possibly overestimating the adjustment relative to the actual update rate. F7 (0.34%) and F8 (0.25%) exhibit very low sensitivity, making them less appropriate for multi-annual projects exposed to significant inflation. F3 (2.66%) and F6 (2.80%) provide moderate adjustments, remaining considerably below the benchmark and potentially undercompensating contractors.
For Hypothesis 1 with the indicative I1_2018–2020_36_E, the formulas with the notation F1, F2, F3, F4, F6, F7, and F8 and the update rate will be used.
As expected, lengthening the execution period (from 12 to 24 to 36 months) results in a higher total price adjustment. The longer the project lasts, the more adjustment coefficients accumulate, leading to a larger overall cost adjustment for Hypothesis 1.
Figure 3 shows that F1 (20.41%), F2 (18.52%), and F4 (19.99%) continue to lead in terms of adjustment magnitude. These formulas seem to significantly overestimate the impact of inflation, especially in long-term contracts. F3 (2.64%) and F6 (2.67%) remain below the update rate threshold, providing limited cost correction. F7 (0.30%) and F8 (0.23%) produce very small adjustments, suggesting poor performance for multi-year durations.

3.2. Hypothesis 2

For the performance of the analyses, we will consider the same date from Hypothesis 1, with the modification on the signing date: January 2020.
For Hypothesis 2 with the indicative I2_2020_12_E, the formulas with the notation F1, F2, F3, F4, F6, F7, and F8 and the update rate will be used.
Figure 4 illustrates that for the 12-month scenario (I2_2020_12_E), formulas F1, F2, F3, F4, F6, F7, and F8, and the update rate were applied (Figure 4 shows the results for Hypothesis 2, 12-month duration). The results from this scenario reveal that the update rate results in the highest adjustment, while formulas F1, F2, and F4 lead to a negative adjustment (a negative percentage change). This suggests that for a similar project in 2020, one contractor could benefit from utilizing the price adjustment (if applying a formula such as the update rate), while another contractor could potentially lose part of the value of the works (if using formulas F1, F2, or F4, which indicated a reduction in this case). The inflation rate for the year 2020 was 2.6%, creating a discrepancy between the actual inflation and the adjustment percentages provided by these formulas (some formula outcomes were below 0% or only slightly above 0%, compared to the +2.6% actual inflation).
For Hypothesis 2 with the indicative I2_2020_2021_24_E, the formulas with the notation F1, F2, F3, F4, F6, F7, and F8 and the update rate will be used.
For the 24-month scenario (I2_2020–2021_24_E), formulas F1, F2, F3, F4, F6, F7, and F8, and the update rate were applied (Figure 5 shows results for Hypothesis 2, 24-month duration). In this two-year scenario, most formulas result in an adjustment of around 5% over the 24-month period, indicating that the price increases captured by these formulas are modest (on the order of a few percent) for the 2020–2021 timeframe.
For Hypothesis 2 with the indicative I2_2020_2022_36_E, the formulas with the notation F1, F2, F3, F4, F6, F7, and F8 and the update rate will be used.
The same set of formulas was applied for the 36-month scenario (I2_2020–2022_36_E) (Figure 6 shows results for Hypothesis 2, 36-month duration). From the results, it is found that F2 produces the highest adjustment percentage for the three-year period. In this scenario (2020–2022), F2’s outcome reached the maximum adjustment among all formulas, reflecting the significant rise in costs toward 2022.

3.3. Hypothesis 3

For the performance of the analyses, we will consider the same date from Hypothesis 1, with the modification on the signing date: January 2022.
For Hypothesis 3 with the indicative I3_2022_12_E, the formulas with the notation F1, F2, F3, F4, F4, F6, F7, and F8 and the update rate will be used.
Figure 7 illustrates that F2 (14.52%), F1 (13.37%), and F6 (12.70%) achieved the highest adjustment rates, approximately 2.5 times greater than the observed update rate. This may be due to overcompensation during short-term inflation spikes, especially if caused by monthly index volatility. F3 (8.59%) and F7 (8.59%) showed moderate performance, indicating some alignment with real market conditions, although they still exceeded the benchmark.
For Hypothesis 3 with the indicative I3_2022–2023_24_E, the formulas with the notation F1, F2, F3, F4, F4, F6, F7, and F8 and the update rate will be used.
Figure 8 shows that F1 (17.62%), F2 (15.02%), and F6 (16.74%) still significantly overestimate price increases—more than two times the update rate—suggesting they are highly sensitive or have inflated coefficients, which may make them unsuitable for medium-duration contracts without recalibration. In contrast, F3 (7.82%), F5 (7.45%), and F7 (7.82%) demonstrate high consistency, closely aligning with the update rate and indicating reliable behavior in this post-pandemic setting.
The analysis of the data indicates that with the extension of the execution period, the proportion of the adjustment coefficients changes and results in a larger adjustment, as shown in Figure 9, Hypothesis 3.

3.4. Comparison of the Hypotheses 1, 2 and 3

To evaluate the appropriateness of each formula, we compare the adjustments derived from the formulas against actual inflation rates for the corresponding periods. Below, Table 1, Table 2 and Table 3 summarize the total percentage adjustments produced by formulas F1–F8 (and the update rate) for each Hypothesis, alongside the actual annual inflation rates.
Hypothesis 1 (2018–2020).
During this moderate inflation period, the formulas generally overshot the actual inflation. The total adjustments for the 2018–2020 project scenarios exceeded the realized annual inflation rates, as shown in Table 1.
In Table 1, we see that for a project starting in 2018 and ending in 2020 (36 months), formulas F1, F2, and F4 predicted total cost increases on the order of ~18–20%, whereas the cumulative actual inflation over 2018–2020 was about 11%. Even the simpler index-based F1 gave a 20.41% adjustment for the 36-month case, almost double the actual inflation. For the shorter durations (12 and 24 months), F1, F2, and F4 still overshot the single-year inflation rates of 4.6% (2018) and 3.8% (2019). Formulas focusing only on materials (F3, F6) or using consumer inflation (F7, F8) yielded much lower adjustments, well below actual inflation for 2018. The “update rate” (a generic cost update factor) resulted in adjustments closer to inflation (4.50% vs 4.60% for 2018), indicating a more moderate update.
Hypothesis 2 (2020–2022).
During this high-inflation period (particularly with a spike in 2022), the formulas underperformed compared to actual inflation. The adjustments did not reach the actual inflation levels, as shown in Table 2.
Table 2 reveals that for a project spanning from 2020 to 2022 (36 months), none of the formulas adequately captured the significant inflation experienced in 2022, which was 13.8% for that year alone and approximately 21.5% cumulatively over the three-year period. The highest adjustment based on the formulas for the 36-month duration was around 16.74% (F2), falling short of the 21.5% cumulative inflation rate. In the 12-month scenario for 2020, certain formulas generated negative adjustments (F1: −0.85%, F2: −2.04%, F4: −0.95%), likely due to slight declines in specific indices or an overestimation of fixed components, considering that 2020 experienced relatively low inflation and possibly price dips in certain materials. The update rate approach yielded an adjustment of approximately 5.6% for each scenario in Hypothesis 2, which exceeded the actual inflation rate for 2020 (2.6%) but remained below the inflation rate of 2022. For the 24-month scenario, most formulas ranged between 4.6% and 5.7%, aligning closely with the 5.1% inflation observed in 2021, with the exception of F2, which was slightly higher at 4.92%. Overall, during this period of volatility, the contractual formulas lagged behind actual inflation, resulting in an underestimation of price growth when inflation accelerated.
Hypothesis 3 (2022–2024).
This period includes very high inflation in 2022 and 2023. The formula-based adjustments remained below the actual inflation rates, as shown in Table 3, though some formulas came closer than others.
In Table 3, the 36-month scenario (2022–2024) illustrates that formulas F1 and F4 yielded adjustments of 22% and 21%, respectively, both of which fall short of the approximately 29% total inflation experienced during that period. F2, which previously provided the highest adjustment, is lower in this scenario at 17.25% for the 36 months. This is primarily due to F2’s heavy reliance on material and labor indices, which, in this case, may not have kept pace with overall inflation. Meanwhile, formulas F3 and F6, both of which emphasize the materials index, produced total adjustments of around 8% over the same 36 months—significantly inadequate given actual inflation—demonstrating that relying solely on material indexing (with a January 2021 baseline for F3) undercompensates in a high-inflation environment where other cost components have also risen sharply. F5, introduced by authorities in late 2021, provided slightly higher adjustments than F3 and F6 (approximately 9% for 36 months) but still remained well below the actual inflation rate. In contrast, F7 and F8, which utilize general consumer inflation in varying manners, achieved minimal adjustments of under 1% to 1.3%, clearly failing to reflect the genuine cost escalations in construction.
The update rate in Hypothesis 3 showed adjustments ranging from approximately 5.6% to 7.9%, again falling below the actual inflation, particularly in 2022. This indicates that a generic update factor—potentially based on average inflation expectations—would only cover a fraction of the actual inflation experienced over the 36-month period.
From this comparative analysis, we can conclude that among the formulas evaluated, F1 produces adjustments that closely align with the real price evolution (i.e., accurately tracking actual inflation), provided that no advance payment is included. F1 effectively adjusts the contract price in proportion to changes in a comprehensive construction cost index and, within our scenarios, tends to align more closely with inflation trends than the other formulas examined.

3.5. Comparative Analysis Using Mean Absolute Deviation

The variance and the Mean Absolute Deviation (MAD) provide measures of the expected deviation of a random variable from its mean value [30]. It is a measure of dispersion or spread, showing how much variation exists from the average (mean)
The Mean Absolute Deviation (MAD) for Hypothesis 1 over a duration of 36 months is approximately 6.52%, indicating that, on average, the values deviate from the mean by about 6.52 percentage points. This suggests moderate variability in update rates and formula values, with some formulas (like F1 and F5) significantly exceeding the average.
The Mean Absolute Deviation (MAD) for Hypothesis 2 over a duration of 36 months is approximately 5.20 percentage points, suggesting a moderate spread among the values, with some very low (F6, F7) and one very high (F2) contributing strongly to variability.
The Mean Absolute Deviation (MAD) for Hypothesis 3 over a duration of 36 months is approximately 8.16 percentage points, indicating a high level of variability among the values, primarily due to large differences between high values (F1, F2, and F4) and low values (F6 and F7).
The analysis of the MAD values across the three hypotheses reveals varying levels of deviation from the mean. Hypothesis 1 shows the highest mean absolute deviation (8.16%), indicating significant dispersion, while Hypotheses 2 (5.20%) and 3 (6.52%) reflect moderate variability. These differences highlight the extent of alignment between the formula values and the update rate, which may have a substantial impact on the practical applicability of the formulas in long-term price adjustment scenarios.

4. Conclusions

This study has analyzed eight different price adjustment formulas (F1–F8) in the context of Romanian construction contracts over various time periods and inflation scenarios (2018–2024). The findings can be summarized as follows:
  • In periods of moderate inflation (e.g., 2018–2020), some formulas (especially F1, F2, F4) tend to over-compensate for price changes, yielding adjustment rates higher than actual inflation. In contrast, formulas focusing only on specific cost components (F3, F6 for materials) or general consumer prices (F7, F8) may under-compensate relative to construction inflation.
  • In periods of high or rapidly rising inflation (e.g., 2020–2022 and 2022–2024), all formulas struggled to fully match the actual inflation experienced. In our case studies, no formula produced an adjustment that exceeded the cumulative inflation of the period, and most fell well short. This indicates that extraordinary market conditions (sharp inflation spikes) can outpace the adjustment clauses unless those clauses are frequently updated or very responsive.
  • Overall, F1—which adjusts the contract based on a broad construction cost index without fixed components (aside from an advance, if any)—provided results closest to actual inflation trends across different scenarios. This suggests F1 is generally the most robust formula for capturing market price evolution, especially if no advance payment is involved. When an advance payment is included, F1’s effectiveness diminishes, underscoring that large advance payments will reduce the contractor’s protection against inflation.
  • Formulas that break down the price into multiple components (like F2, F4, F5) can be useful for fine-tuned adjustments, but their performance depends on the accuracy of the weight estimates and the behavior of each cost index. In our analysis, F2 (a weighted index formula) performed well in some cases (e.g., giving the highest adjustment in a high-inflation 36-month scenario), but in other cases, it either over or under-shot the inflation due to differential movements in labor, material, and equipment costs. F4 and F5, introduced by specific legislation in 2021–2022, provided intermediate results; they did not overshoot inflation as in earlier years but also did not fully catch up with the highest inflation spikes.
  • Simpler formulas using generic inflation rates, such as F7 (monthly inflation derived from annual) and F8 (consumer price index adjustment), consistently gave the lowest adjustments. These may be too conservative for construction costs, which often rise faster than general consumer prices. Thus, such formulas might be more appropriate for contracts where price stability is expected, but they are not sufficient in a volatile market.

4.1. Discussion

The study provides new perspectives that can lead to adjustment formulas based on statistical indices and will pave the way for legislative acts. Additionally, there are numerous formulas that yield specific values that are not correlated with the GDP inflation rate.

4.2. Recommendations

The choice of price adjustment formula should consider the expected market conditions and project duration. For shorter projects in stable periods, either broad or component-based formulas can be adequate. However, for longer projects or in times of volatile inflation, a formula like F1 (using a comprehensive construction cost index) is advisable as it closely tracks overall cost movements. Contracting authorities and contractors should be aware that including large advance payments or fixed-price components will reduce the effectiveness of price adjustment clauses. To manage financial risk in construction projects, especially under unpredictable economic conditions, it may be prudent to adopt adjustment formulas that remain as responsive as possible to actual cost indices (as opposed to static or overly averaged rates). Regularly reviewing and, if necessary, updating the formula parameters (such as cost component weights or reference indices) is also important to ensure fair compensation for cost escalations over the project’s life-cycle.

Author Contributions

Methodology, C.A.C.; Investigation, C.A.C.; Supervision, I.C.-I. and A.A.Ș. All authors have read and agreed to the published version of the manuscript.

Funding

This research received no external funding.

Data Availability Statement

The original contributions presented in this study are included in the article. Further inquiries can be directed to the corresponding author.

Conflicts of Interest

The authors declare no conflict of interest.

References

  1. Ciurușniuc, C.A.; Ciurusniuc-Ichimov, I.; Șerbănoiu, A.A. Methods of Adjustments the Cost in Constructions. Bull. Politeh. Iași—Constr. Arhit. 2022, 68, 29–38. [Google Scholar] [CrossRef]
  2. Ciurușniuc, C.A.; Ciurusniuc-Ichimov, I.; Șerbănoiu, A.A. The Impact of Inflation on Construction Materials—An Overview. J. Eng. Res. 2024, 4, 2–6. [Google Scholar] [CrossRef]
  3. Babalola, A.J.; Aderogba, A.M.; Adetunji, O.O. Inflation and Cost Overrun in Public Sector Construction Projects in Nigeria. ECS Trans. 2022, 107, 16137–16147. [Google Scholar] [CrossRef]
  4. Pandey, R.K.; Khan, A.; Scholar, P. Impact of inflation rate on construction project: A review. Int. J. Sci. Res. Civ. Eng. 2023, 7, 23–29. [Google Scholar]
  5. Dabara, D.; Chiwuzie, A.; Omotehinshe, O.; Soladoye, J.O. Impact of inflation on indirect real estate investments in Nigeria. In Proceedings of the European Real Estate Society (ERES) Conference, Cergy-Pontoise, France, 3 July 2019. [Google Scholar]
  6. Akal, A.Y. Inflation and Reinforced Concrete Materials: An Investigation of Economic and Environmental Effects. Sustainability 2023, 15, 7687. [Google Scholar] [CrossRef]
  7. Romanian Government. Decision No. Law No. 907 of 29 November 2016 on the Stages of Elaboration and the Framework Content of the Technical-Economic Documentation Related to the Investment Objectives/Projects Financed from Public Funds; Romanian Government: Bucharest, Romania, 2016.
  8. Akalya, K.; Rex, L.K.; Kamalnataraj, D. Minimizing the Cost of Construction Materials through Optimization Techniques. IOSR J. Eng. (IOSRJEN) 2018, 1, 29–33. [Google Scholar]
  9. Rajguru, A.; Mahatme, P. Effective Techniques in Cost Optimization of Construction Project. Int. J. Res. Eng. Technol. 2015, 4, 464–469. [Google Scholar]
  10. Nițu, M.C.; Gasparotti, C. Evolution of the Construction Industry Based on the GDP Indicator in the Period 2008–2018 in Romania. J. Manag. Econ. Eng. 2020, 19, 426–431. [Google Scholar] [CrossRef]
  11. Meng, J.; Yan, J.; Xue, B.; Fu, J.; He, N. Reducing construction material cost by optimizing buy-in decision that accounts the flexibility of non-critical activities. Eng. Constr. Archit. Manag. 2018, 25, 1092–1108. [Google Scholar] [CrossRef]
  12. Alsugair, A.M.; Alsanabani, N.M.; Al-Gahtani, K.S. Forecasting the Final Contract Cost on the Basis of the Owner’s Cost Estimation Using an Artificial Neural Network. Buildings 2023, 13, 786. [Google Scholar] [CrossRef]
  13. Al-Hazim, N.; Salem, Z.A.; Ahmad, H. Delay and Cost Overrun in Infrastructure Projects in Jordan. Procedia Eng. 2017, 182, 18–24. [Google Scholar] [CrossRef]
  14. Mohamed, E.B.; Mahmoud, S.Y. An Assessment of the Impact of Inflation on the Prices of Selected Construction Materials in Sudan. Int. J. Multidiscip. Res. Publ. 2020, 2, 41–44. [Google Scholar]
  15. Halpin, D.W. Financial and Cost Concepts for Construction Management; John Wiley & Sons: New York, NY, USA, 1985. [Google Scholar]
  16. Holm, L.; Schaufelberger, J.E. Construction Cost Estimating; Routledge: Abingdon, UK, 2021. [Google Scholar]
  17. Peurifoy, R.L.; Oberlender, G.D. Estimating Construction Costs, 6th ed.; McGraw-Hill: New York, NY, USA, 2014. [Google Scholar]
  18. Humphreys, K.K. Project and Cost Engineers’ Handbook, 4th ed.; Editura Marcel Dekker: New York, NY, USA, 2005. [Google Scholar]
  19. Lam, W.S.; Lam, W.H.; Jaaman, S.H. Portfolio Optimization with a Mean–Absolute Deviation–Entropy Multi-Objective Model. Entropy 2021, 23, 1266. [Google Scholar] [CrossRef] [PubMed]
  20. World Bank. Managing Public Procurement in Times of Crisis; Policy Note; World Bank: Washington, DC, USA, 2021. [Google Scholar]
  21. Albtoush, A.F.; Doh, S. A Review on causes of cost overrun in the construction projects. Int. J. N. Innov. Eng. Technol. 2019, 12, 15–22. [Google Scholar]
  22. Smith, J. The Economics of Inflation in Construction Projects. J. Constr. Econ. 2020, 45, 123–138. [Google Scholar]
  23. Ionescu, M.; Popescu, D. Post-pandemic Trends in Romanian Infrastructure. Procedia Eng. 2022, 198, 305–312. [Google Scholar]
  24. European Construction Sector Observatory (ECSO). Construction Cost Trends in the EU; European Construction Sector Observatory (ECSO): Brussels, Belgium, 2023. [Google Scholar]
  25. National Institute of Statistics. Available online: https://insse.ro/cms/ (accessed on 10 December 2023).
  26. Romanian Government. Decision No. 1/2018 of 10 January 2018 for the Approval of the General and Specific Conditions for Certain Categories of Procurement Contracts Related to Investment Objectives Financed from Public Funds; Romanian Government: Bucharest, Romania, 2018.
  27. Romanian Government. Emergency Ordinance No. 15 of 30 August 2021 on the Regulation of Some Fiscal-Budgetary Measures for Adjusting the Prices of Public Procurement Contracts; Romanian Government: Bucharest, Romania, 2021.
  28. Romanian Government. Emergency Ordinance No. 47 of 14 April 2022 on the Adjustment of the Prices of Public Procurement Contracts/Sectoral Contracts/Concession Contracts/Framework Agreements; Romanian Government: Bucharest, Romania, 2022.
  29. Romanian Government. Emergency Ordinance No. 64 of 9 May 2022 on the Adjustment of Prices and Value of General Estimates Within Projects Financed from Non-Reimbursable External Funds; Romanian Government: Bucharest, Romania, 2022.
  30. Yager, R.R.; Alajlan, N. A note on mean absolute deviation. Inf. Sci. 2014, 279, 632–641. [Google Scholar] [CrossRef]
Figure 1. Hypothesis 1—I1_2018_12_E (Source: Authors).
Buildings 15 02076 g001
Figure 2. Hypothesis 1—I1_2018–2019_24_E (Source: Authors).
Buildings 15 02076 g002
Figure 3. Hypothesis 1—I1_2018–2020_36_E (Source: Authors).
Buildings 15 02076 g003
Figure 4. Hypothesis 2-I2_2020_12_E (Source: Authors).
Buildings 15 02076 g004
Figure 5. Hypothesis 2—I2_2020–2021_24_E (Source: Authors).
Buildings 15 02076 g005
Figure 6. Hypothesis 2—I2_2020–2022_36_E (Source: Authors).
Buildings 15 02076 g006
Figure 7. Hypothesis 3—I3_2022_12 (Source: Authors).
Buildings 15 02076 g007
Figure 8. Hypothesis 3—I3_2022–2023_24 (Source: Authors).
Buildings 15 02076 g008
Figure 9. Hypothesis 3—I3_2022–2024_36 (Source: Authors).
Buildings 15 02076 g009
Table 1. Comparison of formula adjustments with annual inflation for Hypothesis 1 (2018 start, 12/24/36-month durations).
FormulaHypothesis 1—I1_2018_12_EHypothesis 1—I1_2018–2019_24_EHypothesis 1—I1_2018–2020_36_E
F113.06%18.09%20.41%
F213.13%17.30%18.52%
F31.96%2.66%2.64%
F413.30%17.94%19.99%
F62.07%2.80%2.67%
F70.38%0.34%0.30%
F80.25%0.25%0.23%
Update rate4.50%4.91%5.27%
Annual inflation rate4.60%3.80%2.60%
11.00% (cumulative 2018–2020)
Table 2. Comparative adjustment with annual inflation for Hypothesis 2 (2020 start, 12/24/36-month durations).
FormulaHypothesis 2—I2_2020_12_EHypothesis 2—I2_2020–2021_24_EHypothesis 3—I2_2020–2022_36_E
F1−1.00%4.86%12.83%
F2−2.04%4.92%16.74%
F30.31%5.75%12.54%
F4−0.95%4.62%12.19%
F60.31%5.75%12.54%
F70.21%0.31%0.56%
F80.13%0.39%0.68%
Update rate5.60%5.55%5.56%
Annual inflation rate2.60%5.10%13.80%
21.50% (cumulative 2020–2022)
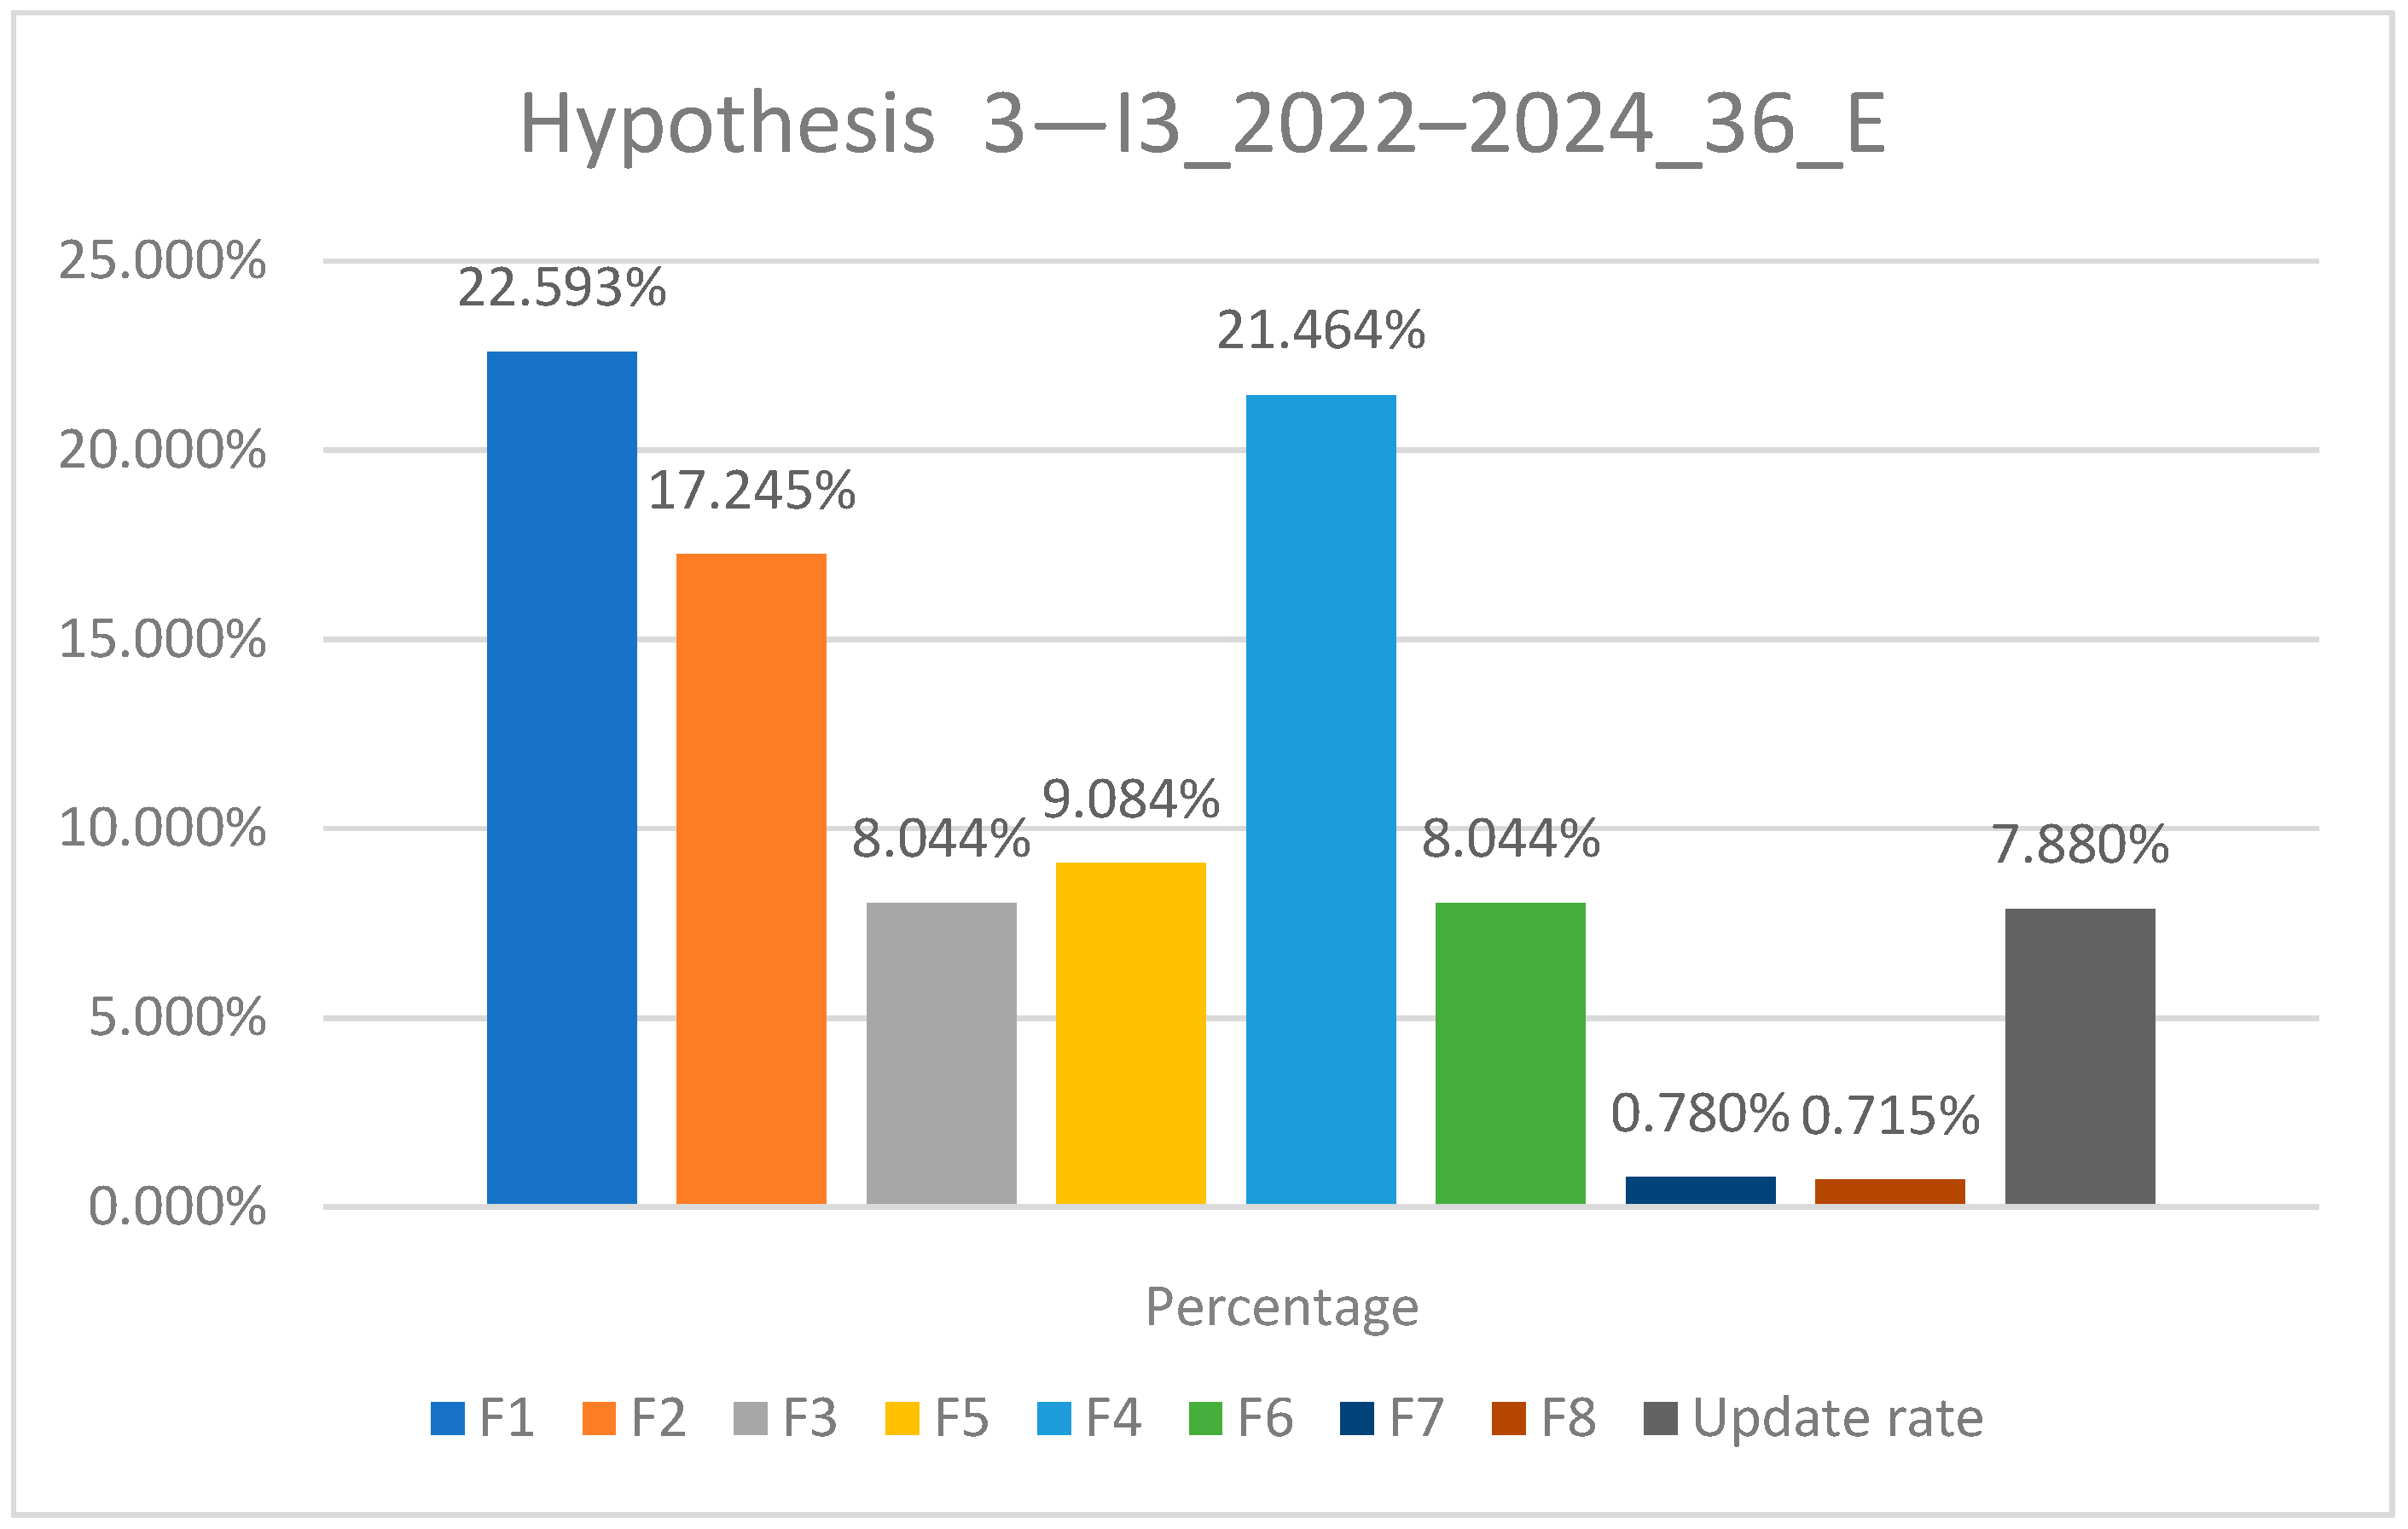
Table 3. Comparative adjustment with annual inflation for Hypothesis 3 (2022 start, 12/24/36-month durations).
FormulaHypothesis 3—I3_2022_12_EHypothesis 3—I3_2022–2023_24_EHypothesis 3—I3_2022–2024_36_E
F113.365%17.62%22.59%
F214.517%15.02%17.25%
F38.591%7.82%8.04%
F56.683%7.45%9.08%
F412.697%16.74%21.46%
F68.591%7.82%8.04%
F71.083%0.96%0.78%
F81.315%0.91%0.71%
Update rate5.600%7.55%7.88%
Annual inflation rate13.800%10.40%5.10%
29.30% (cumulative 2023–2024)
Disclaimer/Publisher’s Note: The statements, opinions and data contained in all publications are solely those of the individual author(s) and contributor(s) and not of MDPI and/or the editor(s). MDPI and/or the editor(s) disclaim responsibility for any injury to people or property resulting from any ideas, methods, instructions or products referred to in the content.

