
Renovation Methods for Atrium-Style Educational Buildings Based on Thermal Environment Testing in Cold Regions of China


Abstract
1. Introduction
2. Study Method
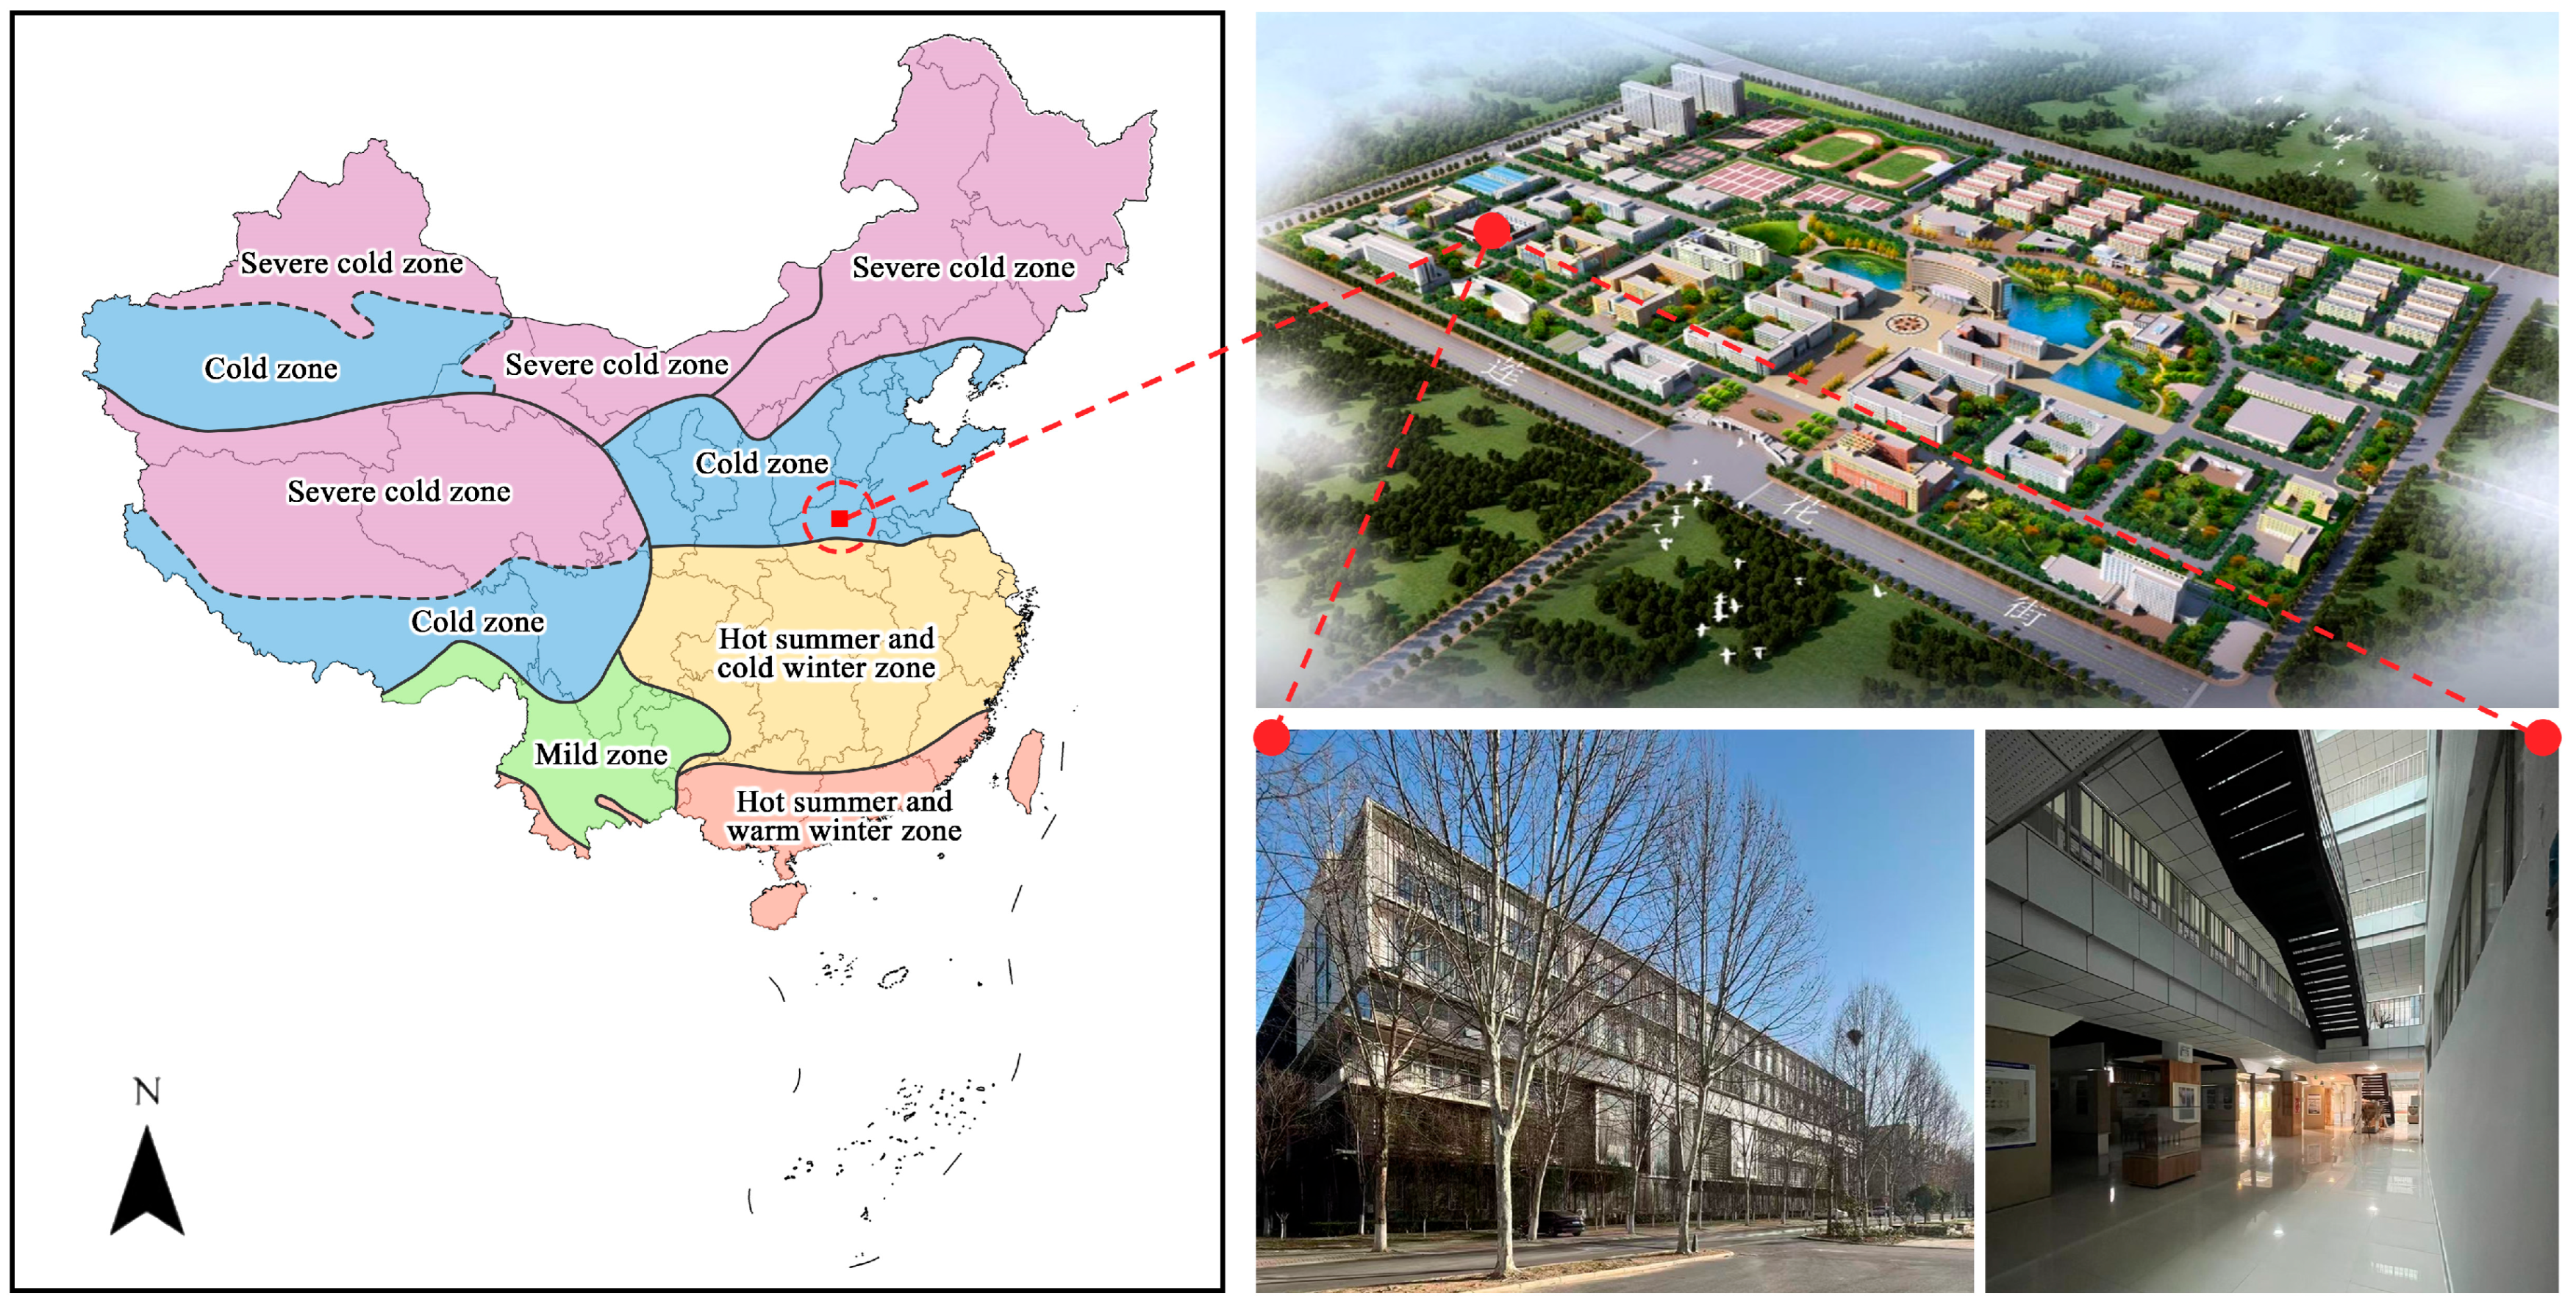
2.1. Study Location
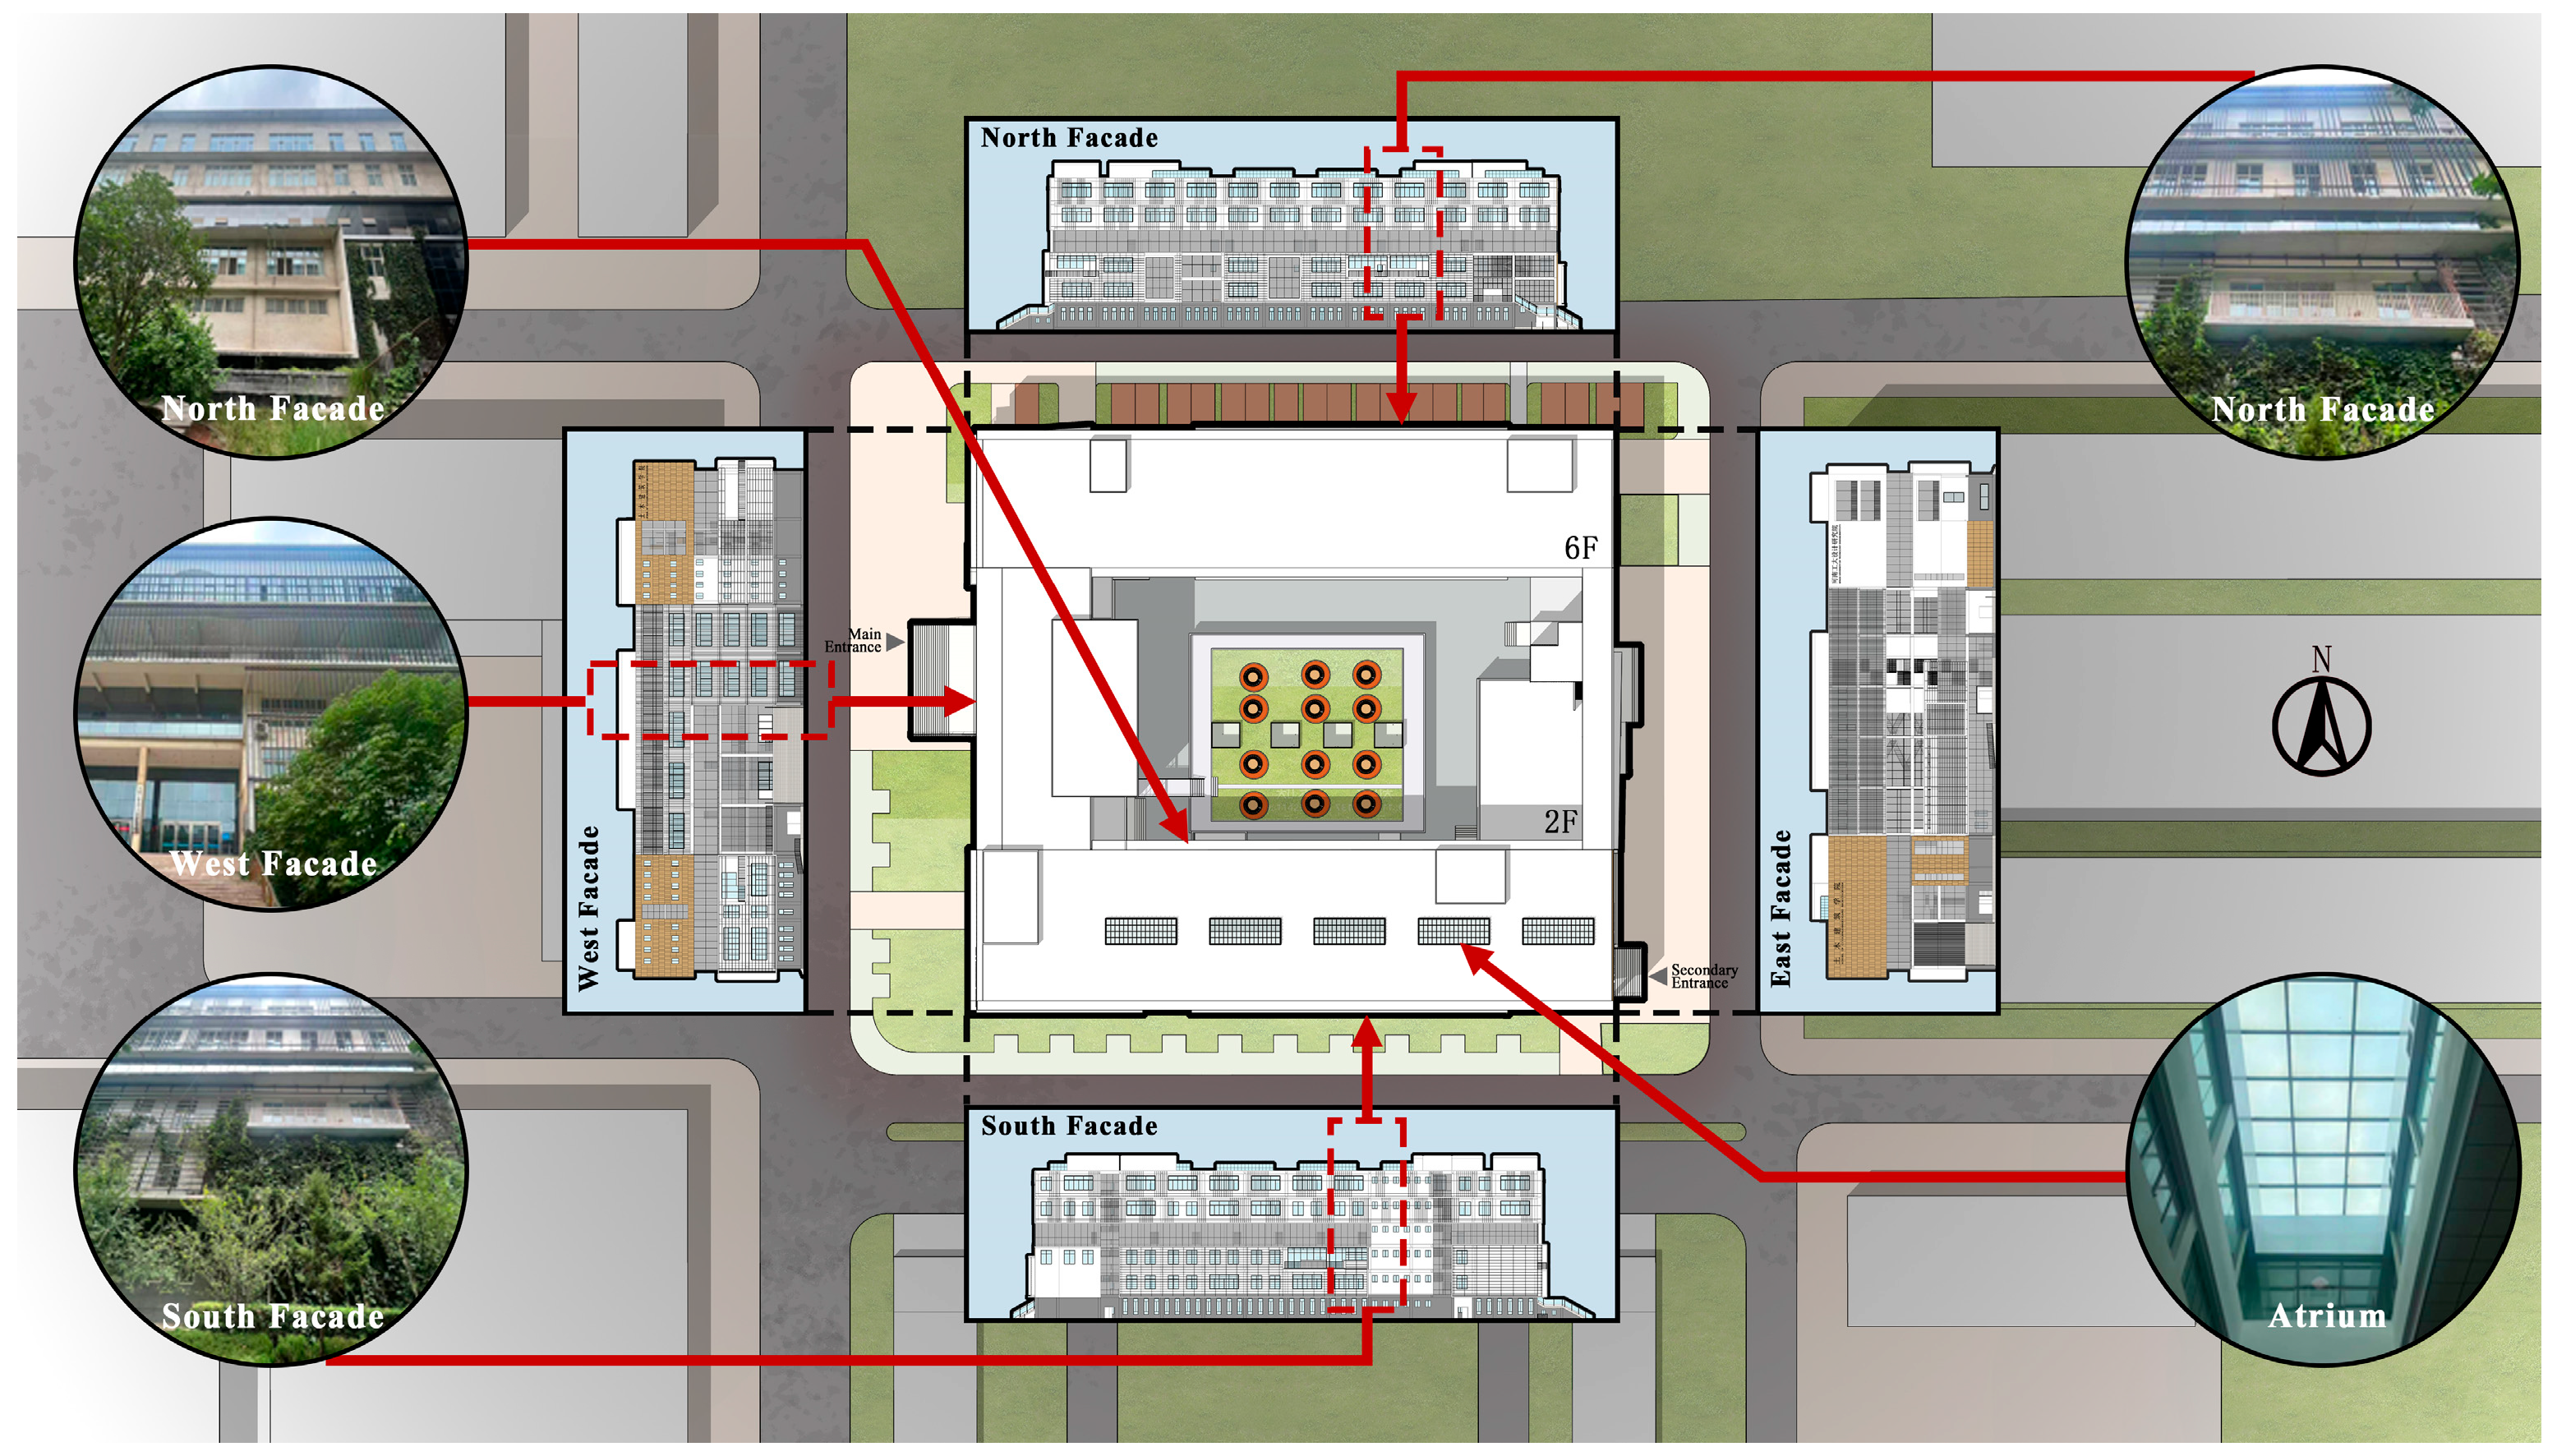
2.2. Study Object
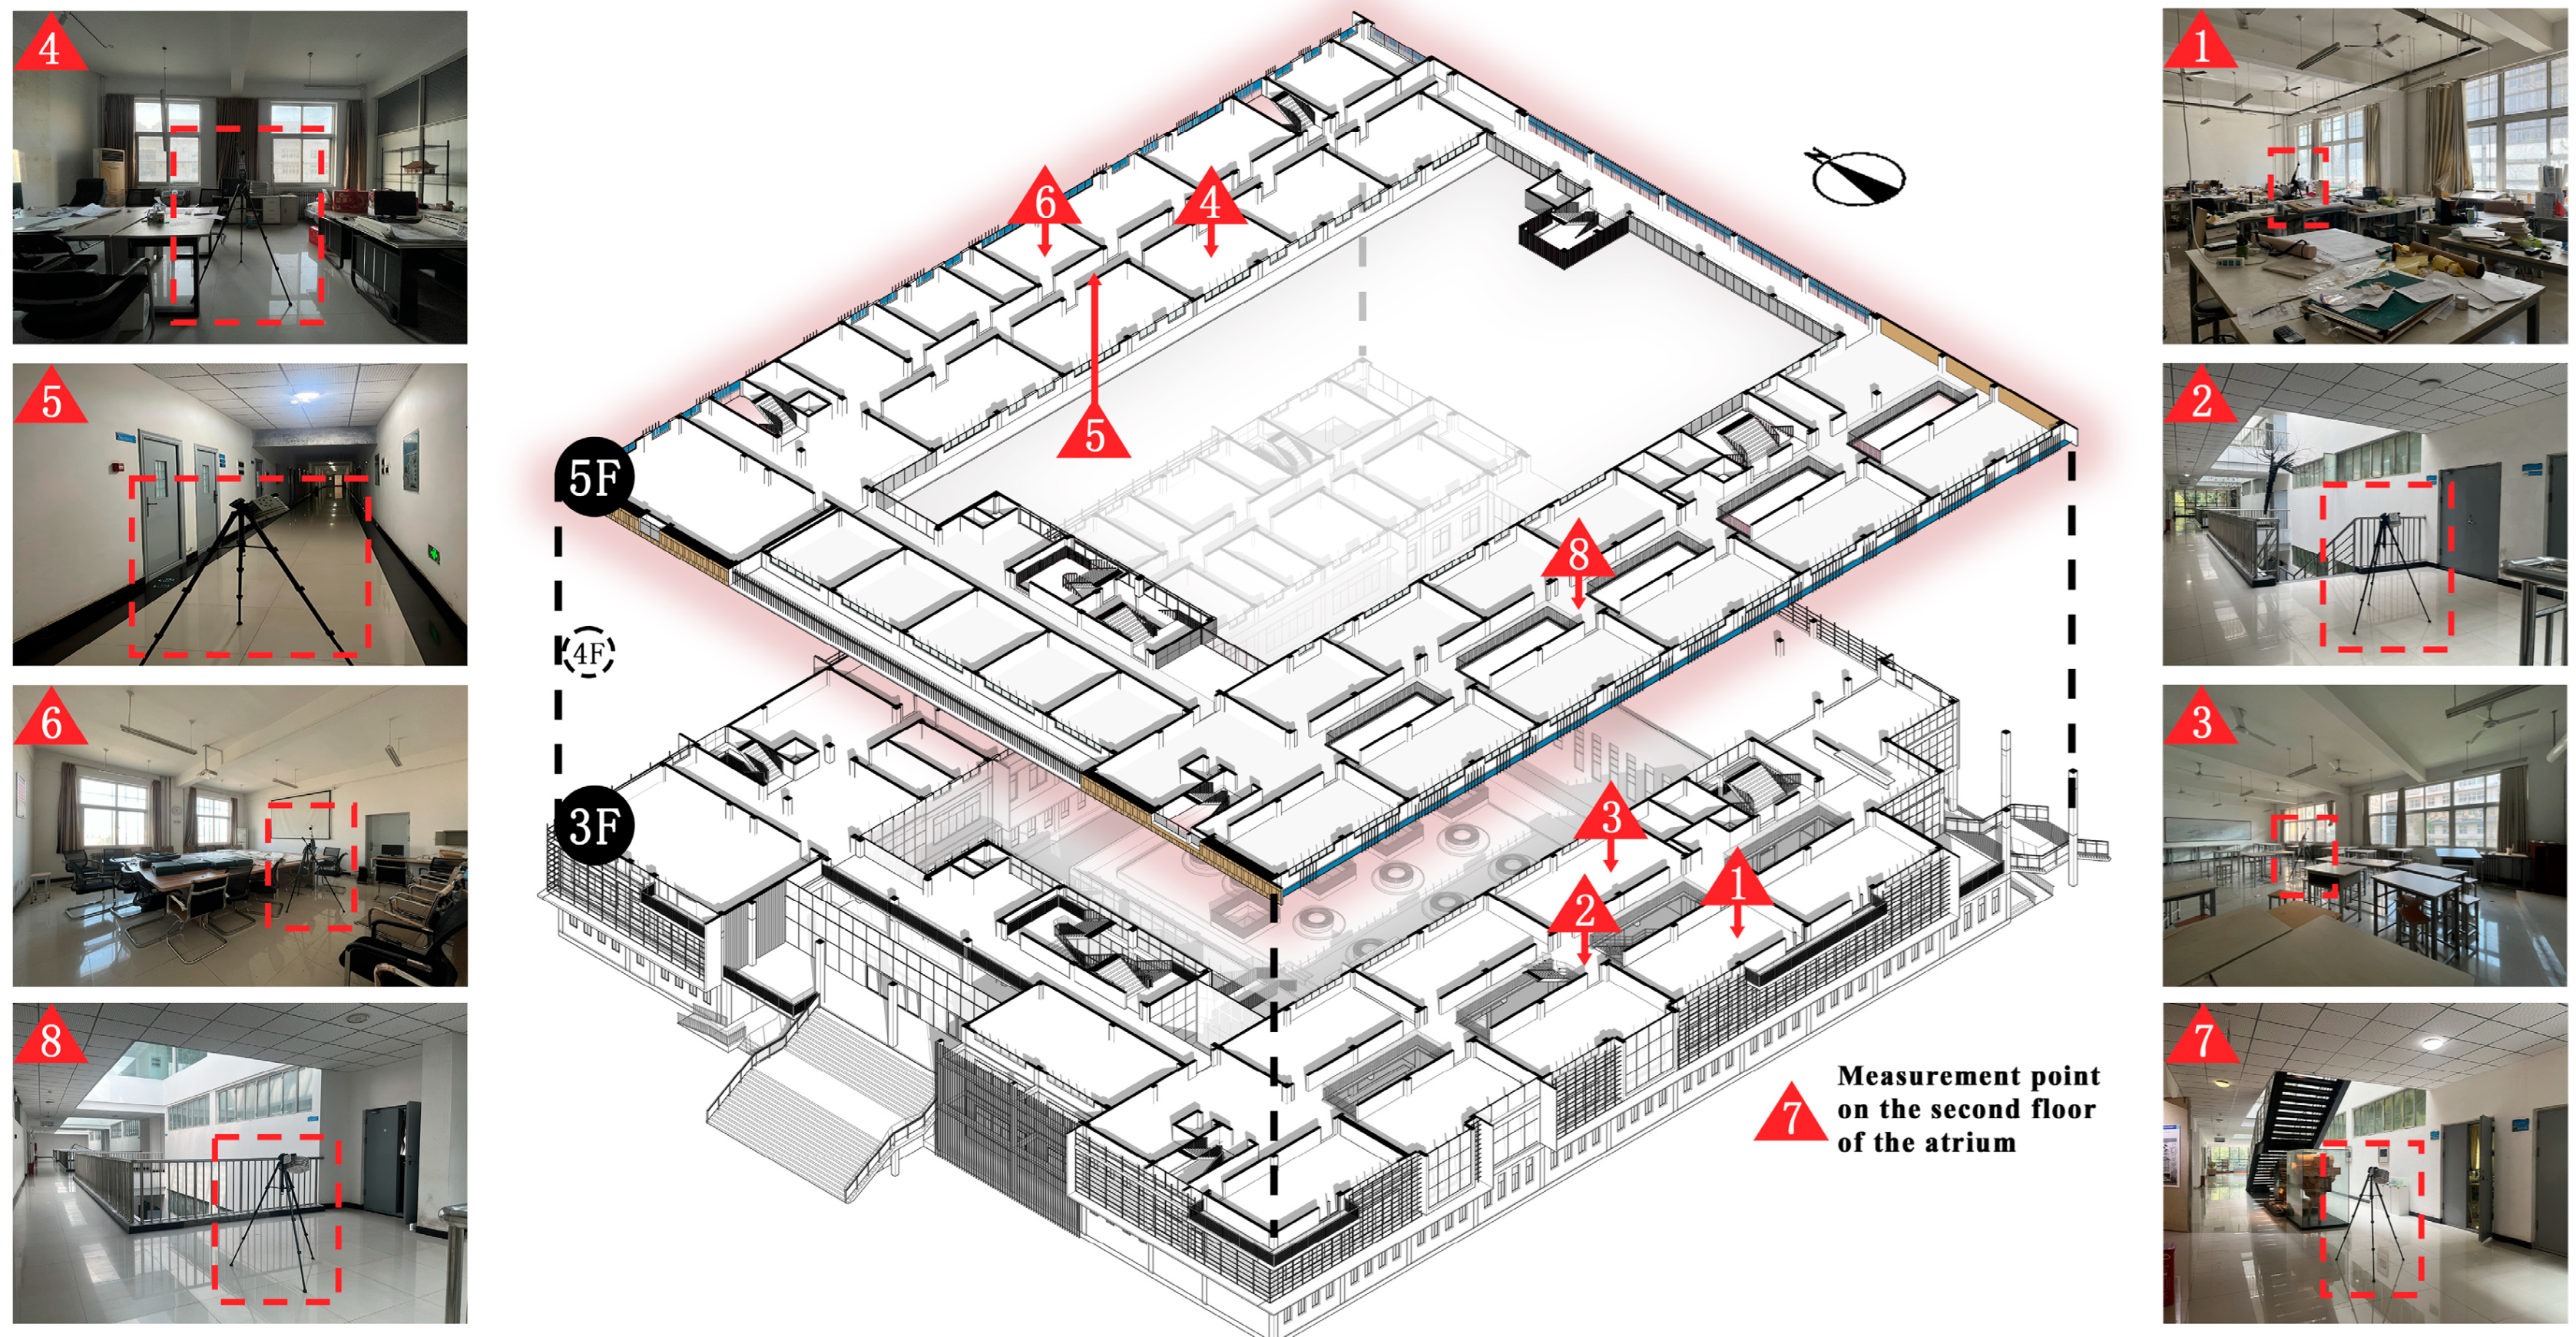
2.3. Thermal Environment Test
3. Test Results
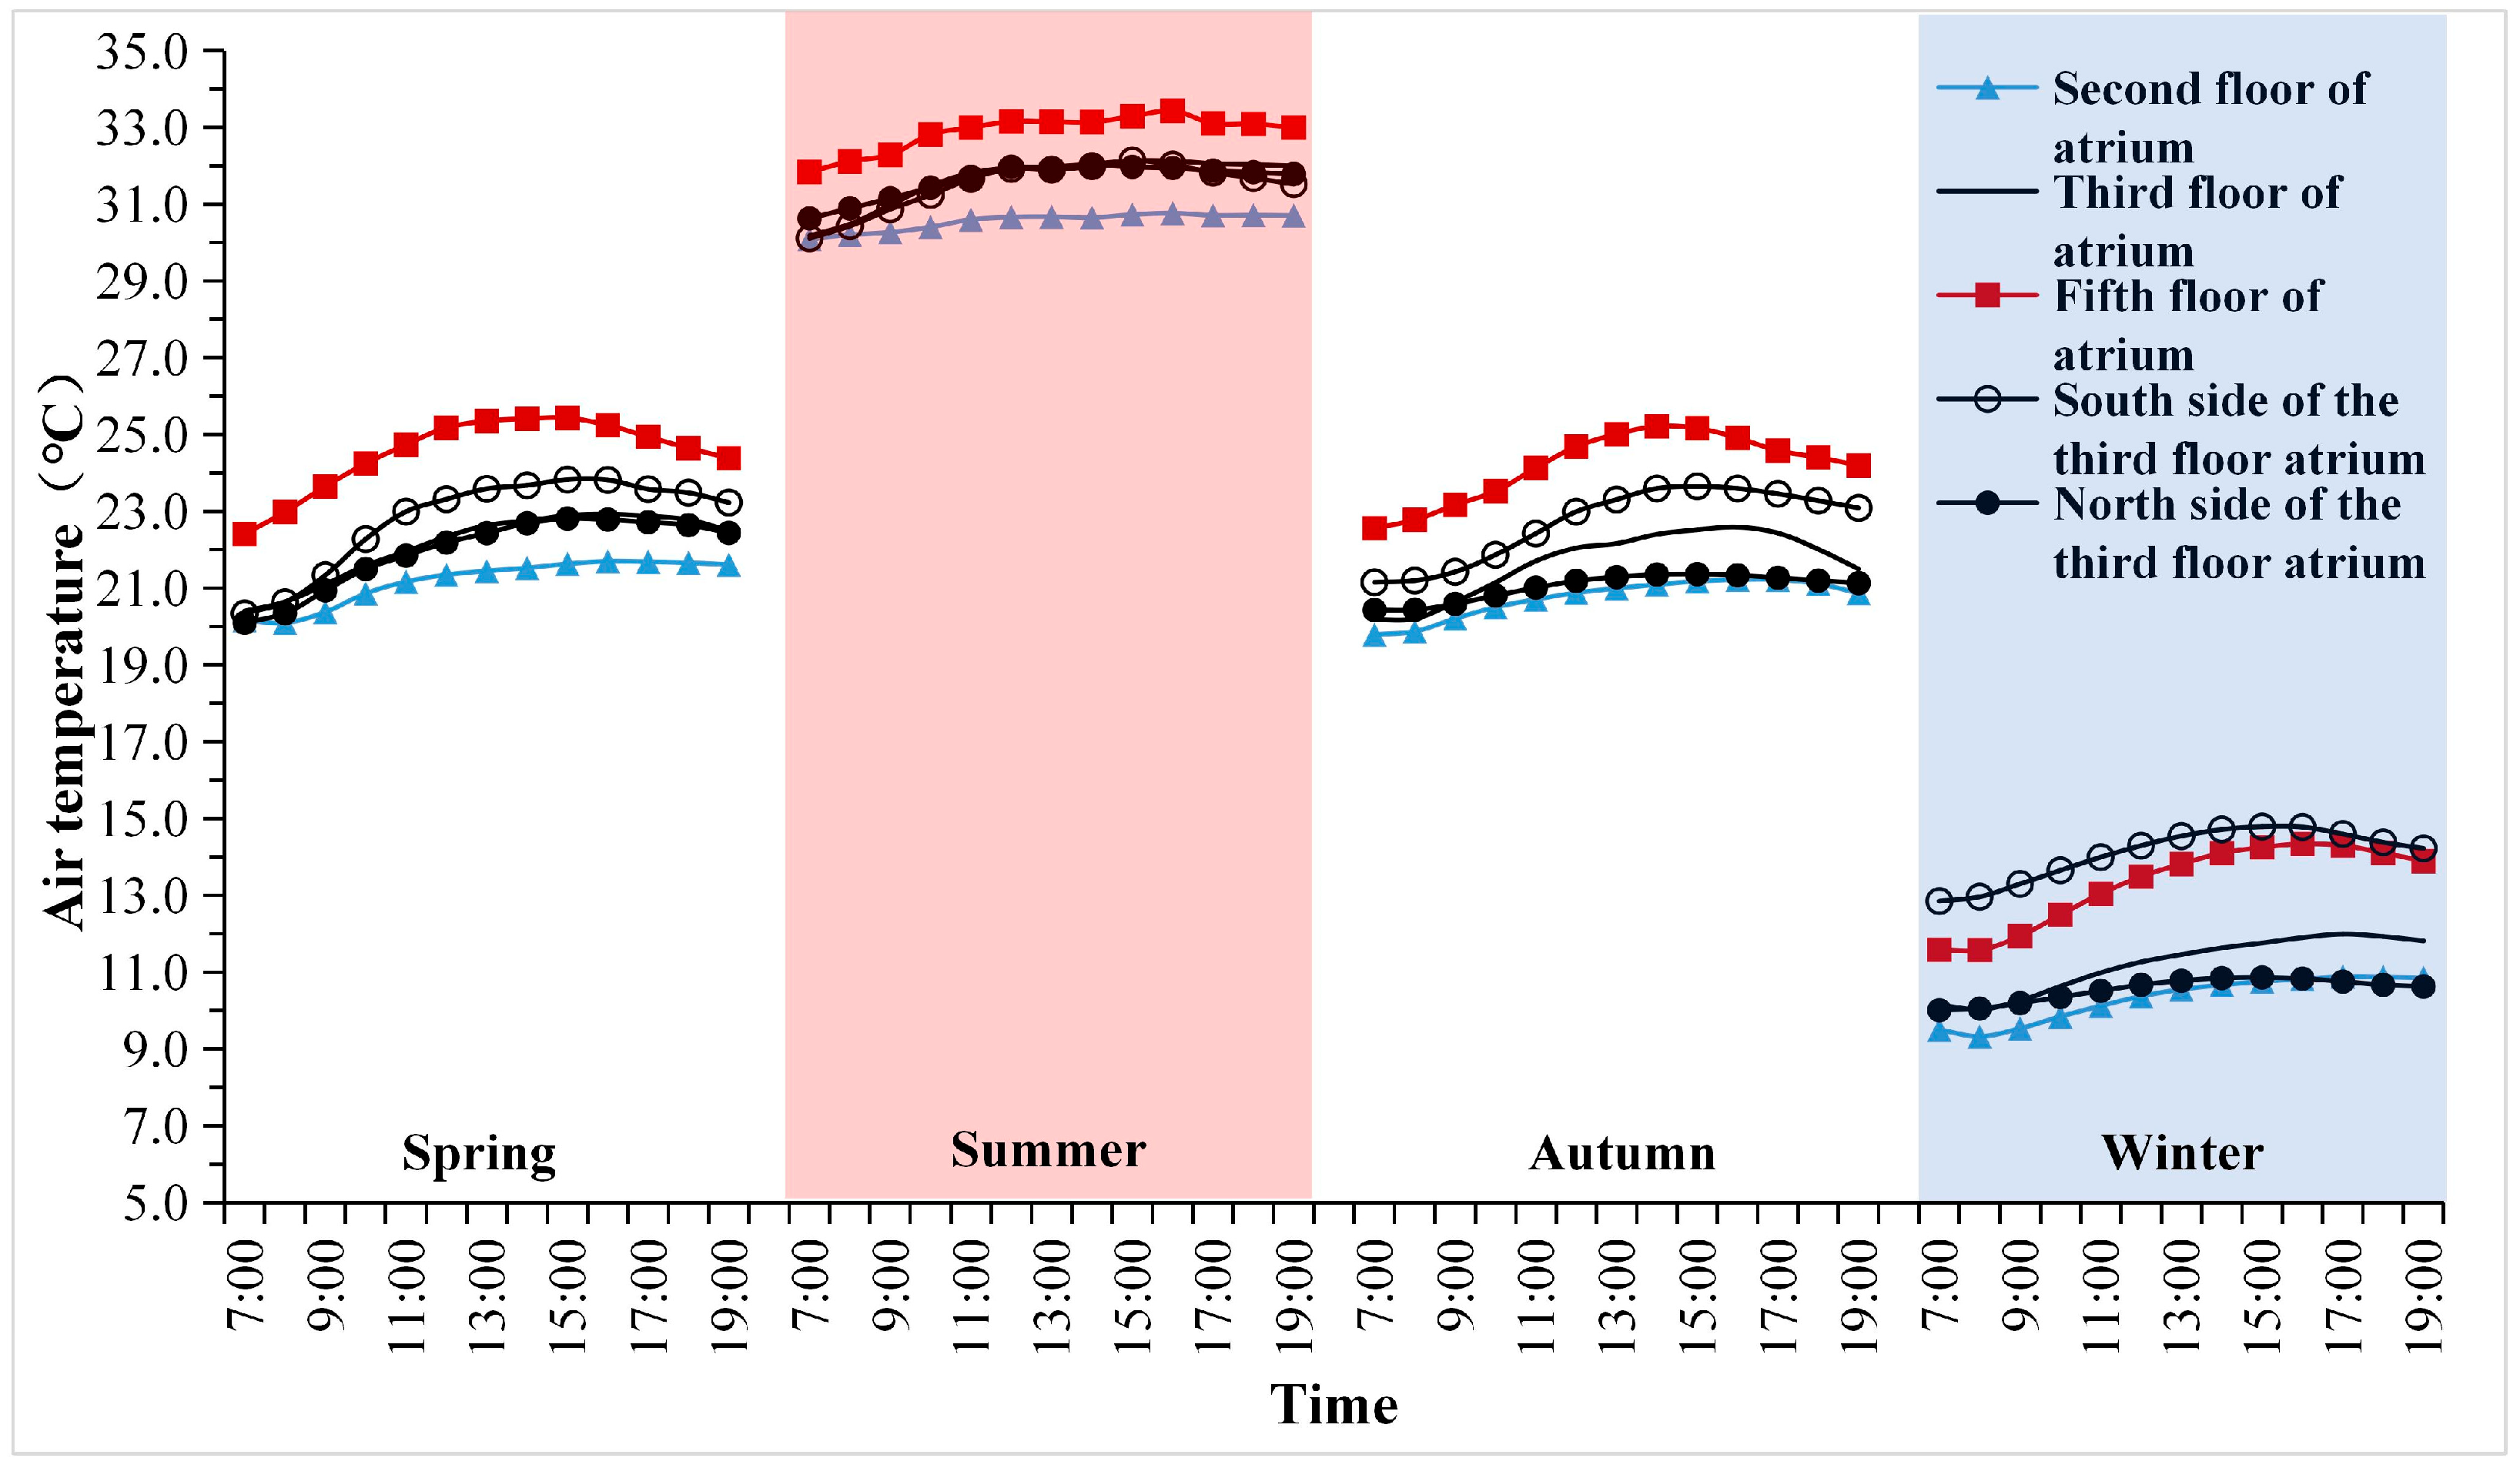
3.1. Temperature Distribution in Vertical Spaces of the Atrium in Four Seasons
3.2. Temperature Distribution in Horizontal Spaces of the Atrium in Four Seasons
3.3. Comparison of Temperature in the Atrium and the Corridor Spaces in Four Seasons
4. Analysis of Renovation Strategy Based on Thermal Environment Testing
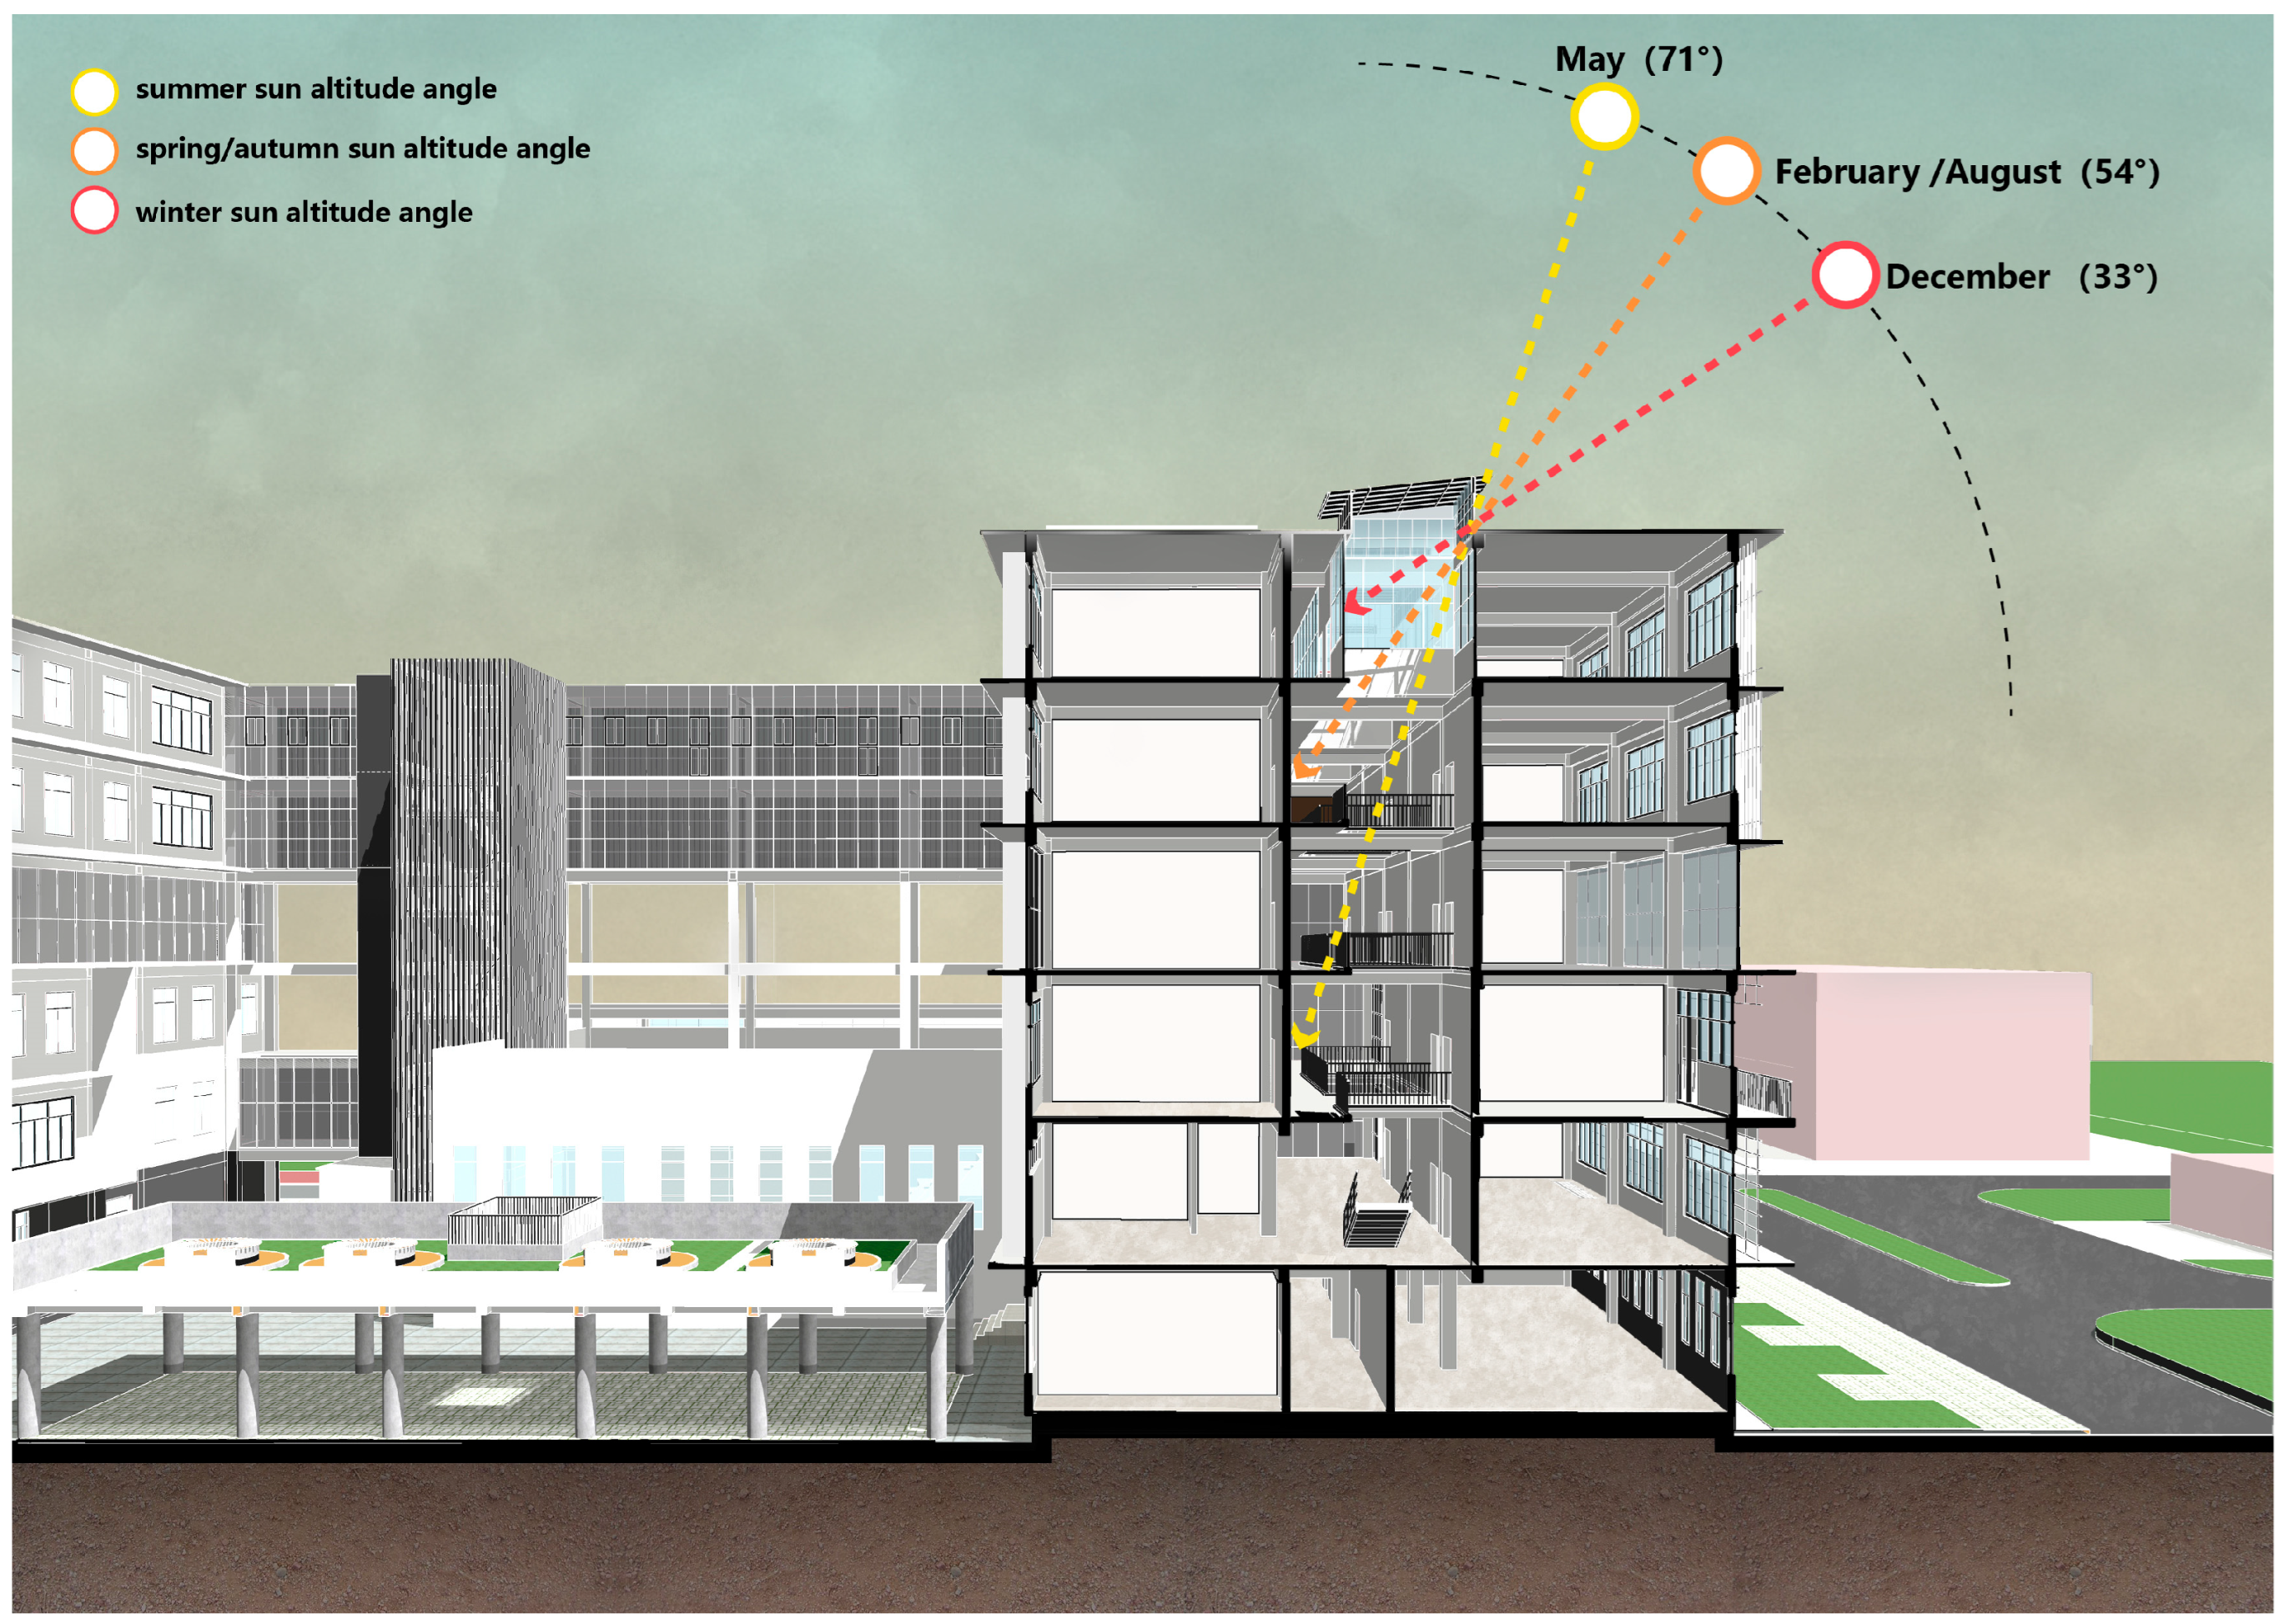
4.1. Renovation Strategy
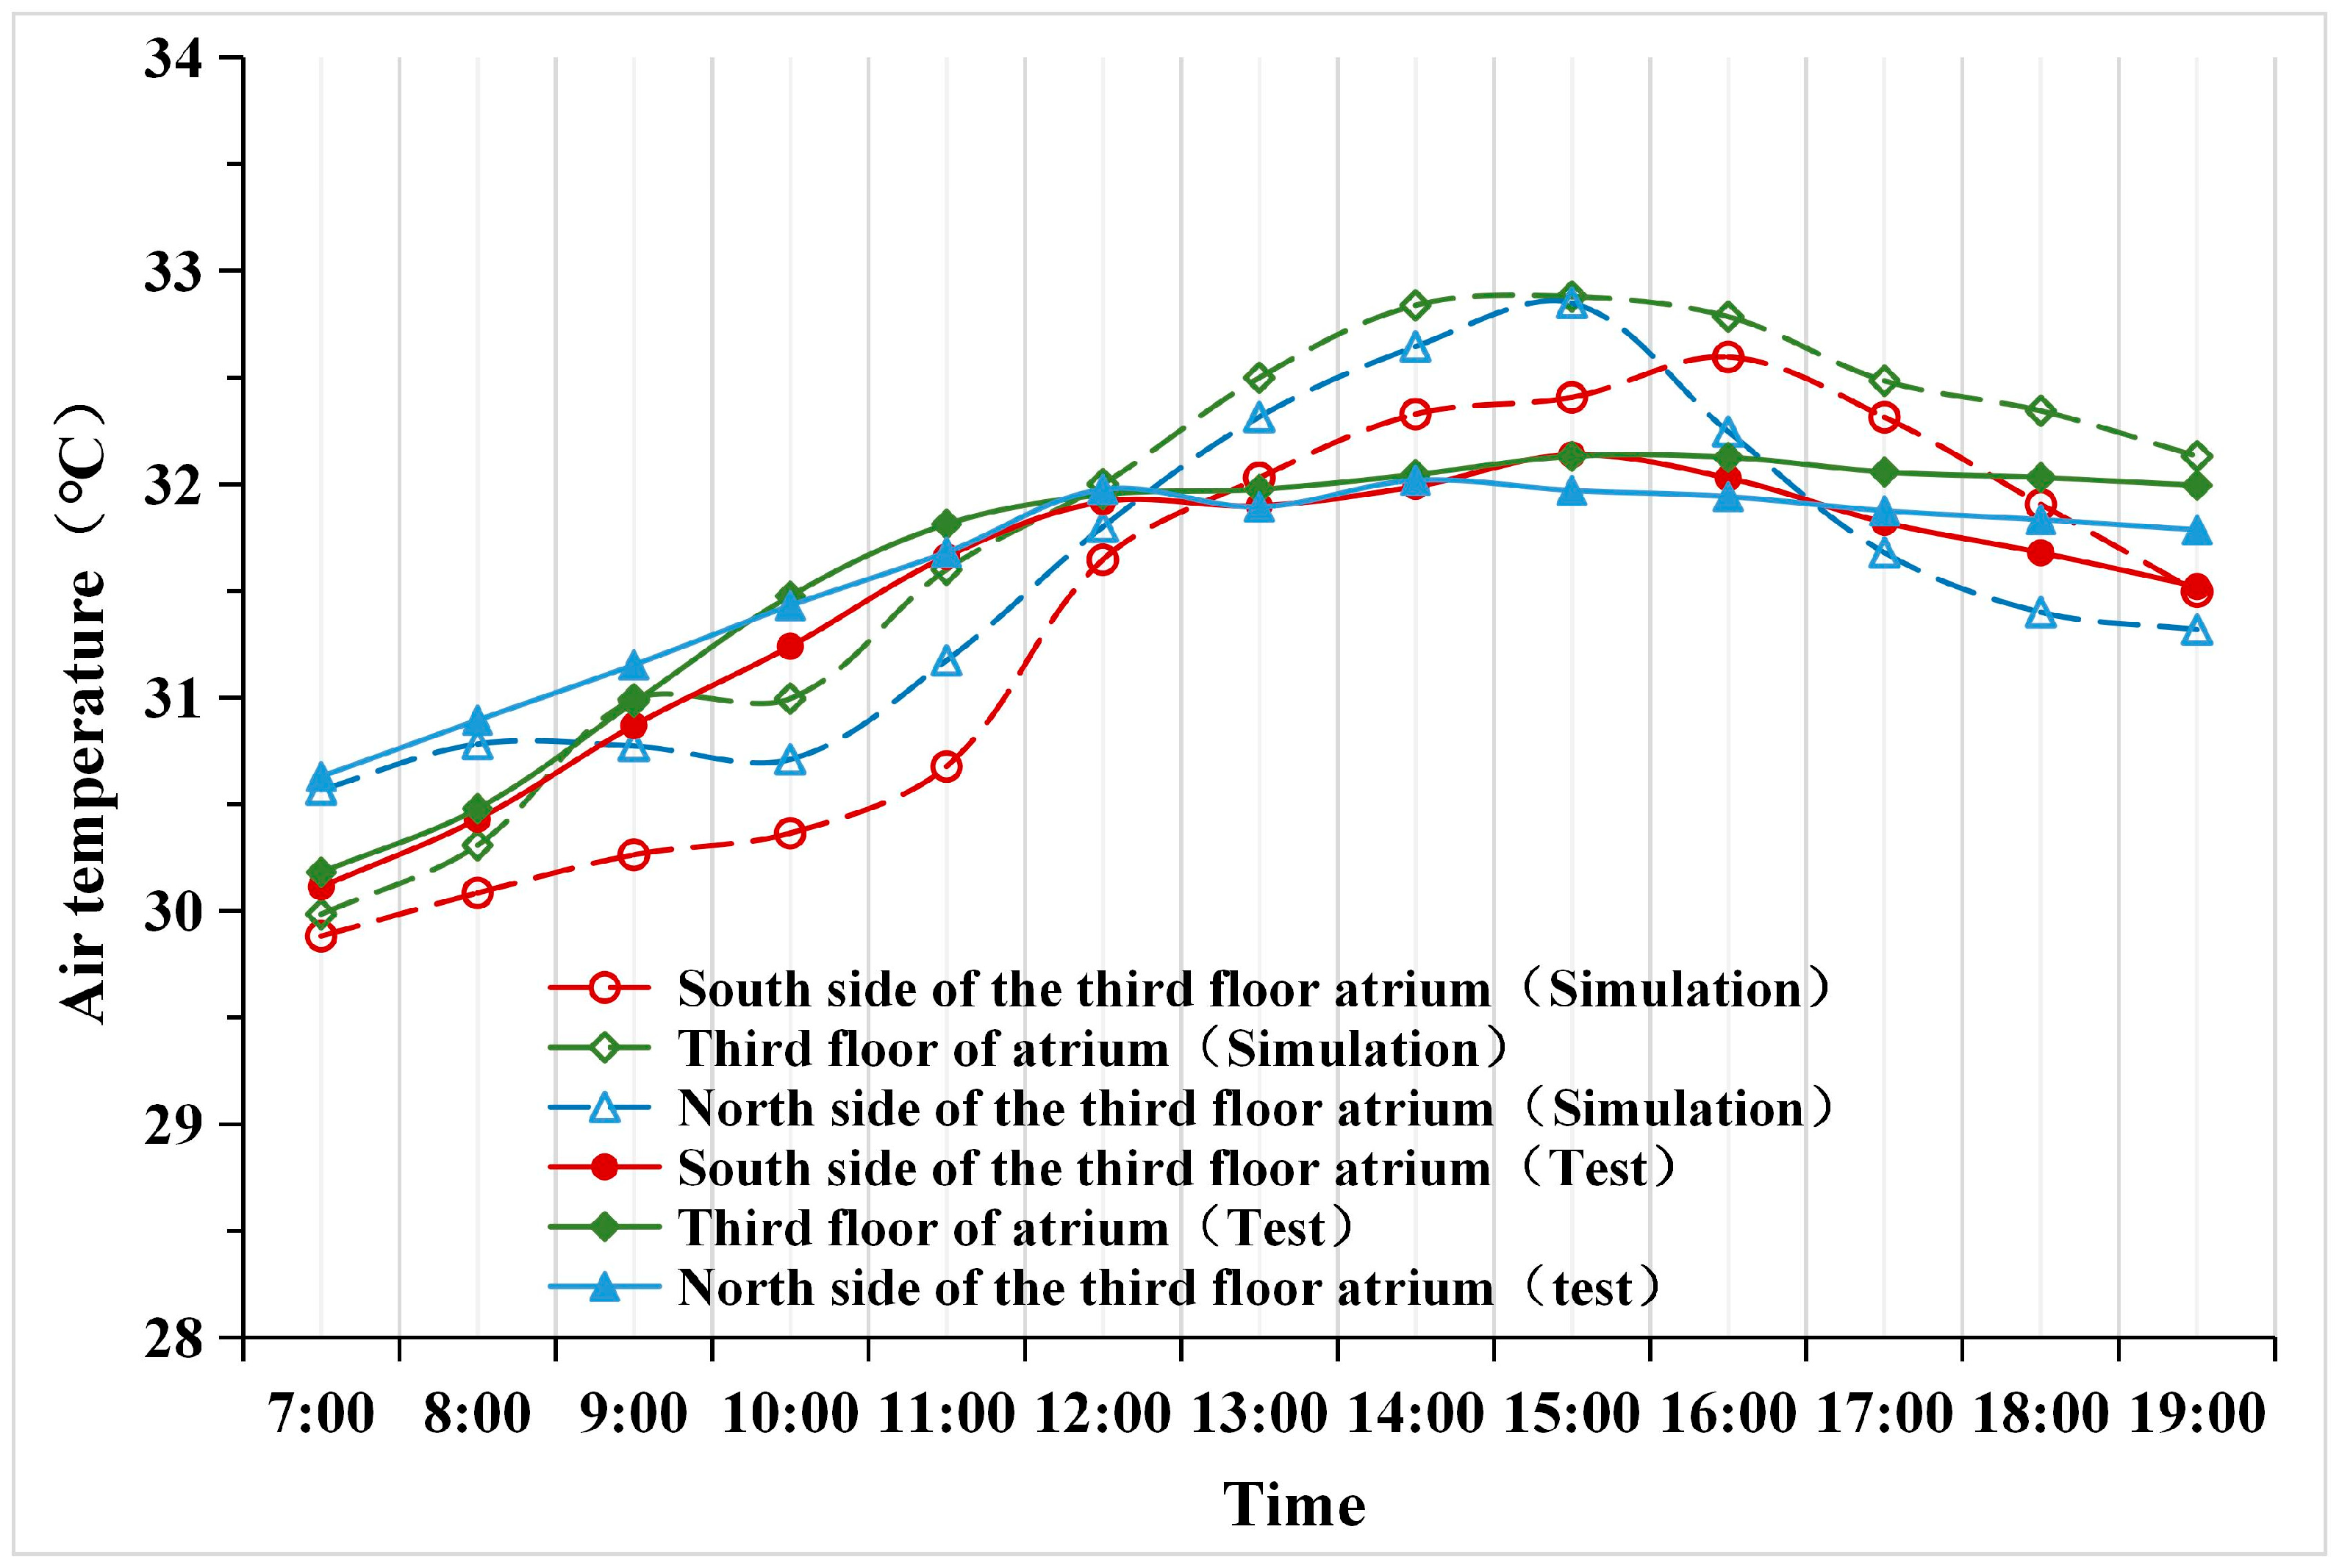
4.2. Model Verification and Quantitative Analysis of the Renovation Design for Thermal Environment Improvement in Summer
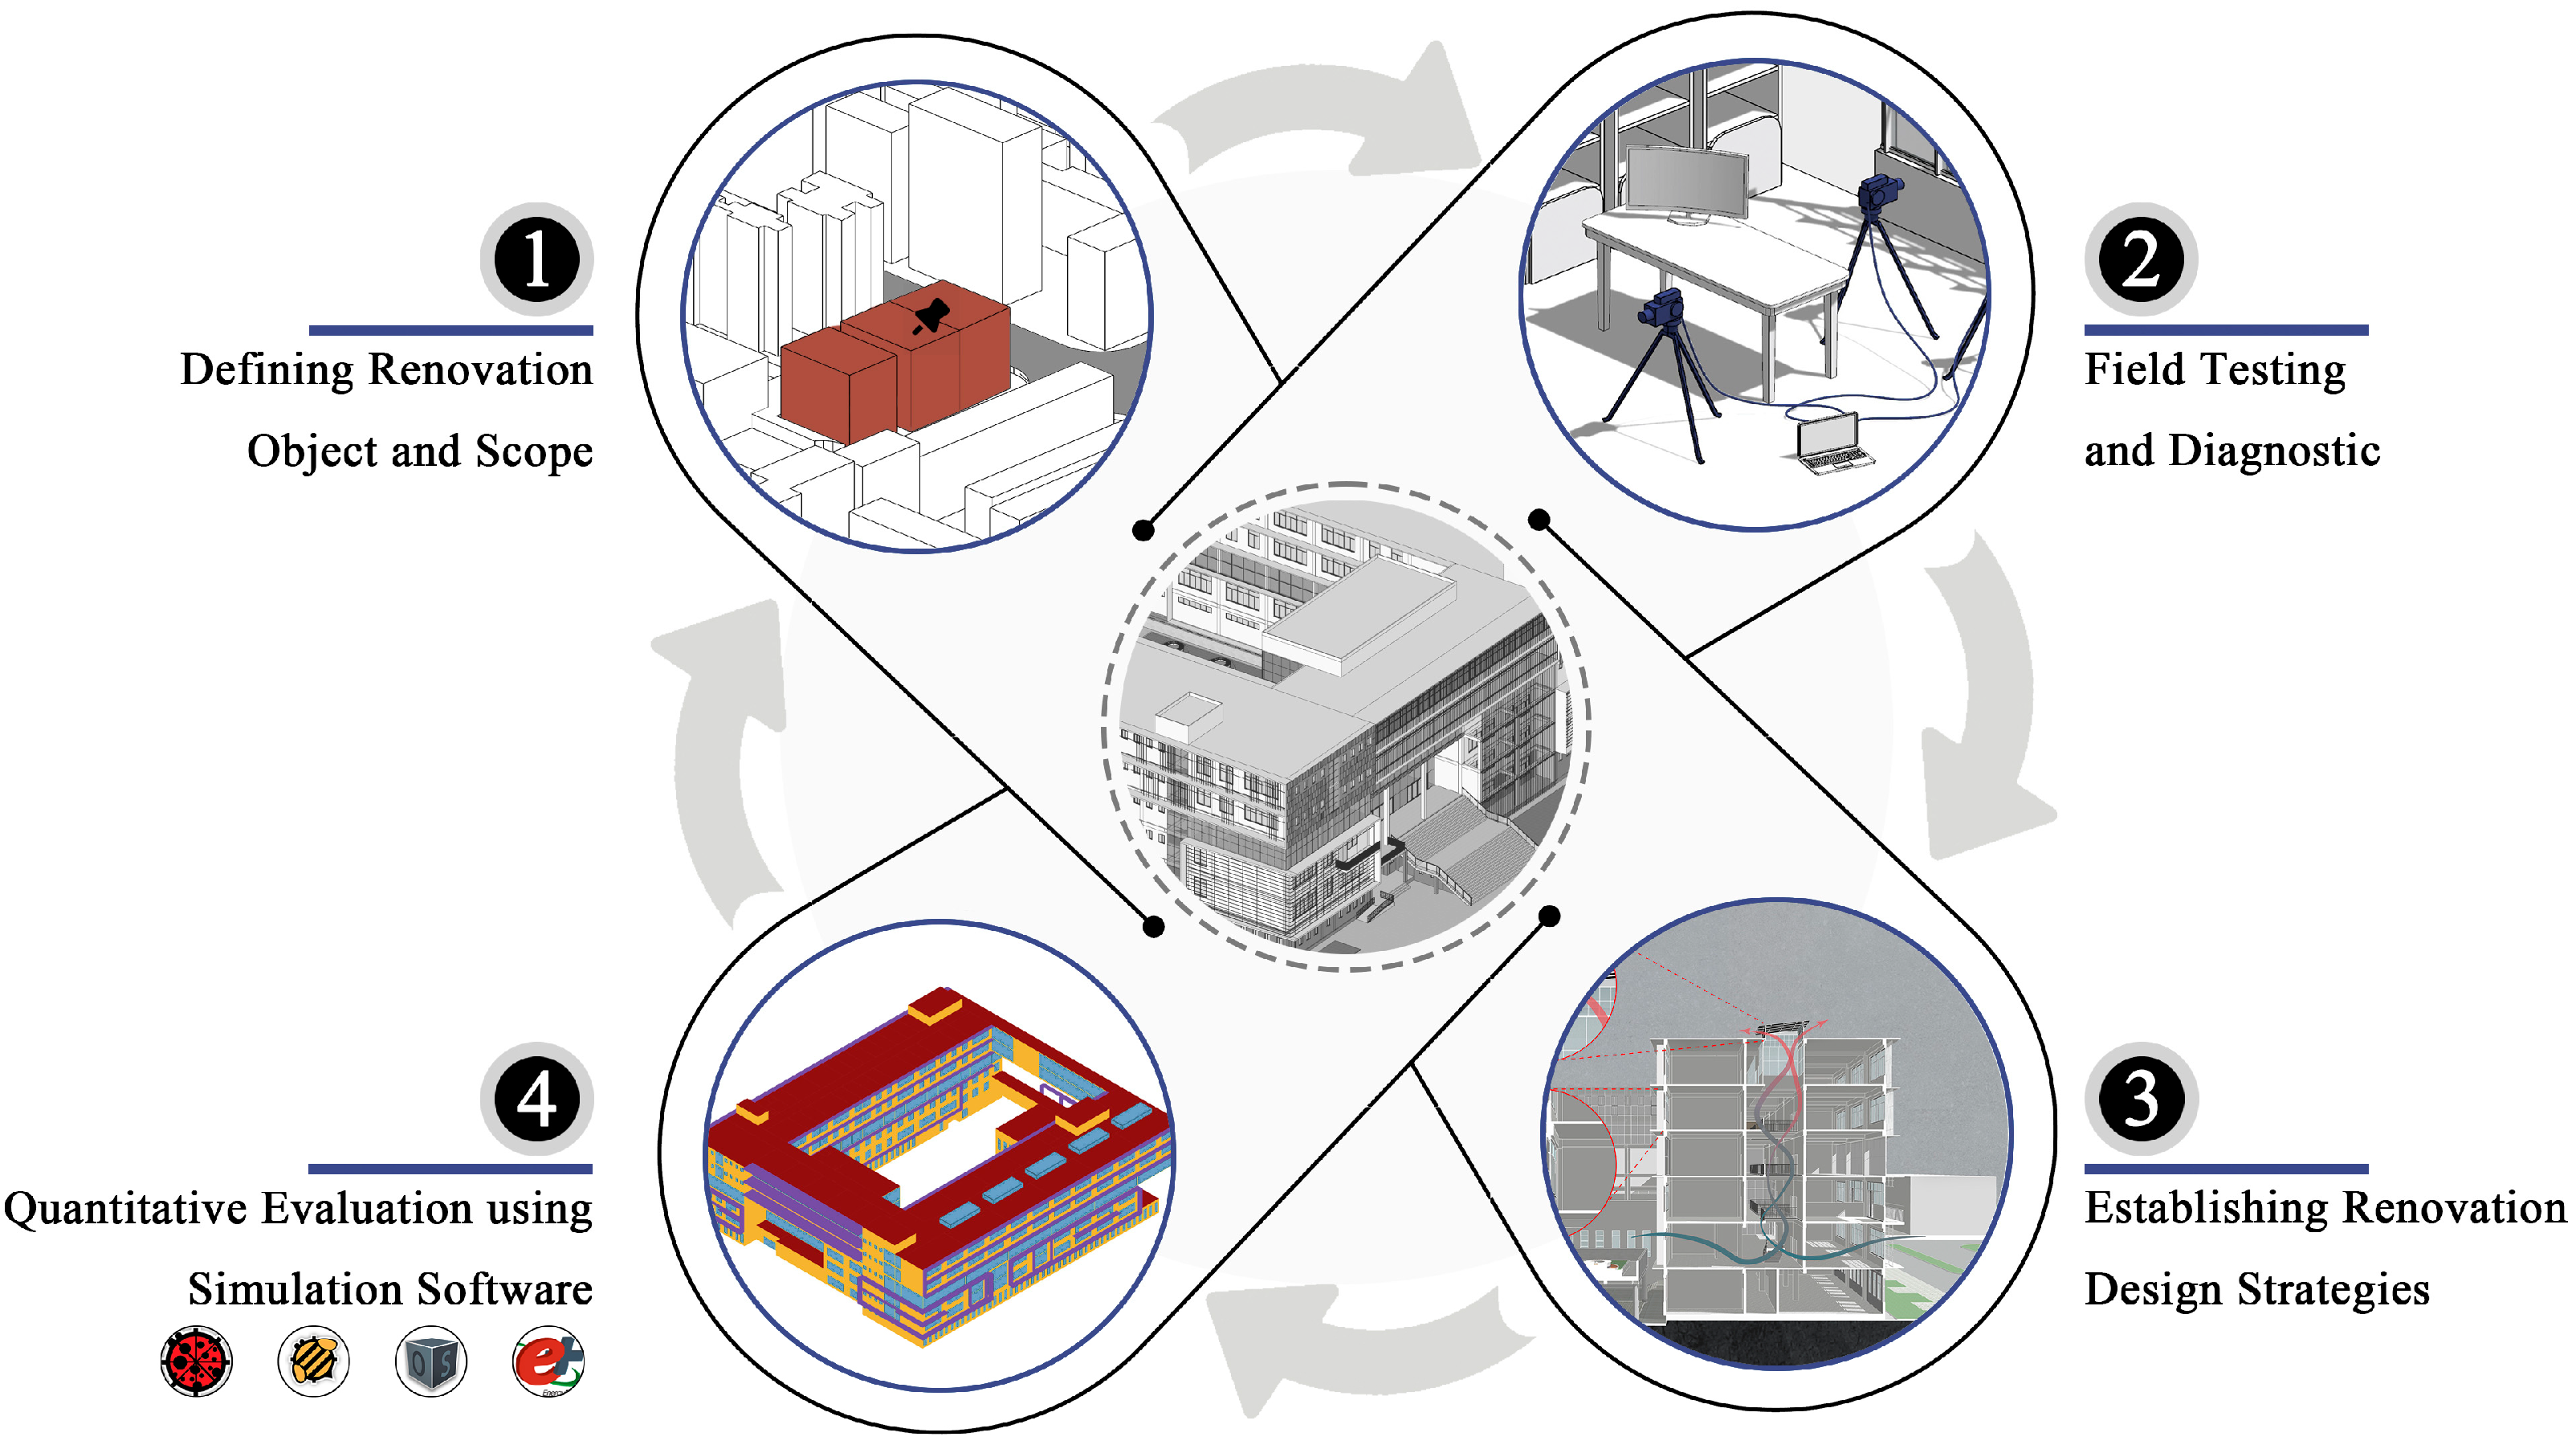
4.3. Renovation Design and Application Process for Existing Buildings Based on Thermal Environment Testing
5. Analysis and Discussion
5.1. Temperature Distribution in the Vertical Atrium Spaces in Four Seasons
5.2. Comparison of Temperature Between Horizontal Atrium and Corridor Spaces in Four Seasons
6. Conclusions
- The temperature values in vertical spaces of an enclosed atrium increase with the rise in floor height and exhibit distinctive stratification on typical days in different seasons. The temperature difference between the fifth and the second floors is 3.5 °C in autumn, which is the greatest, followed by 3.3 °C in spring, 2.6 °C in winter, and 2.2 °C in summer. The temperature difference between the third and the second floors remains constant at about 1 °C on typical days throughout the year.
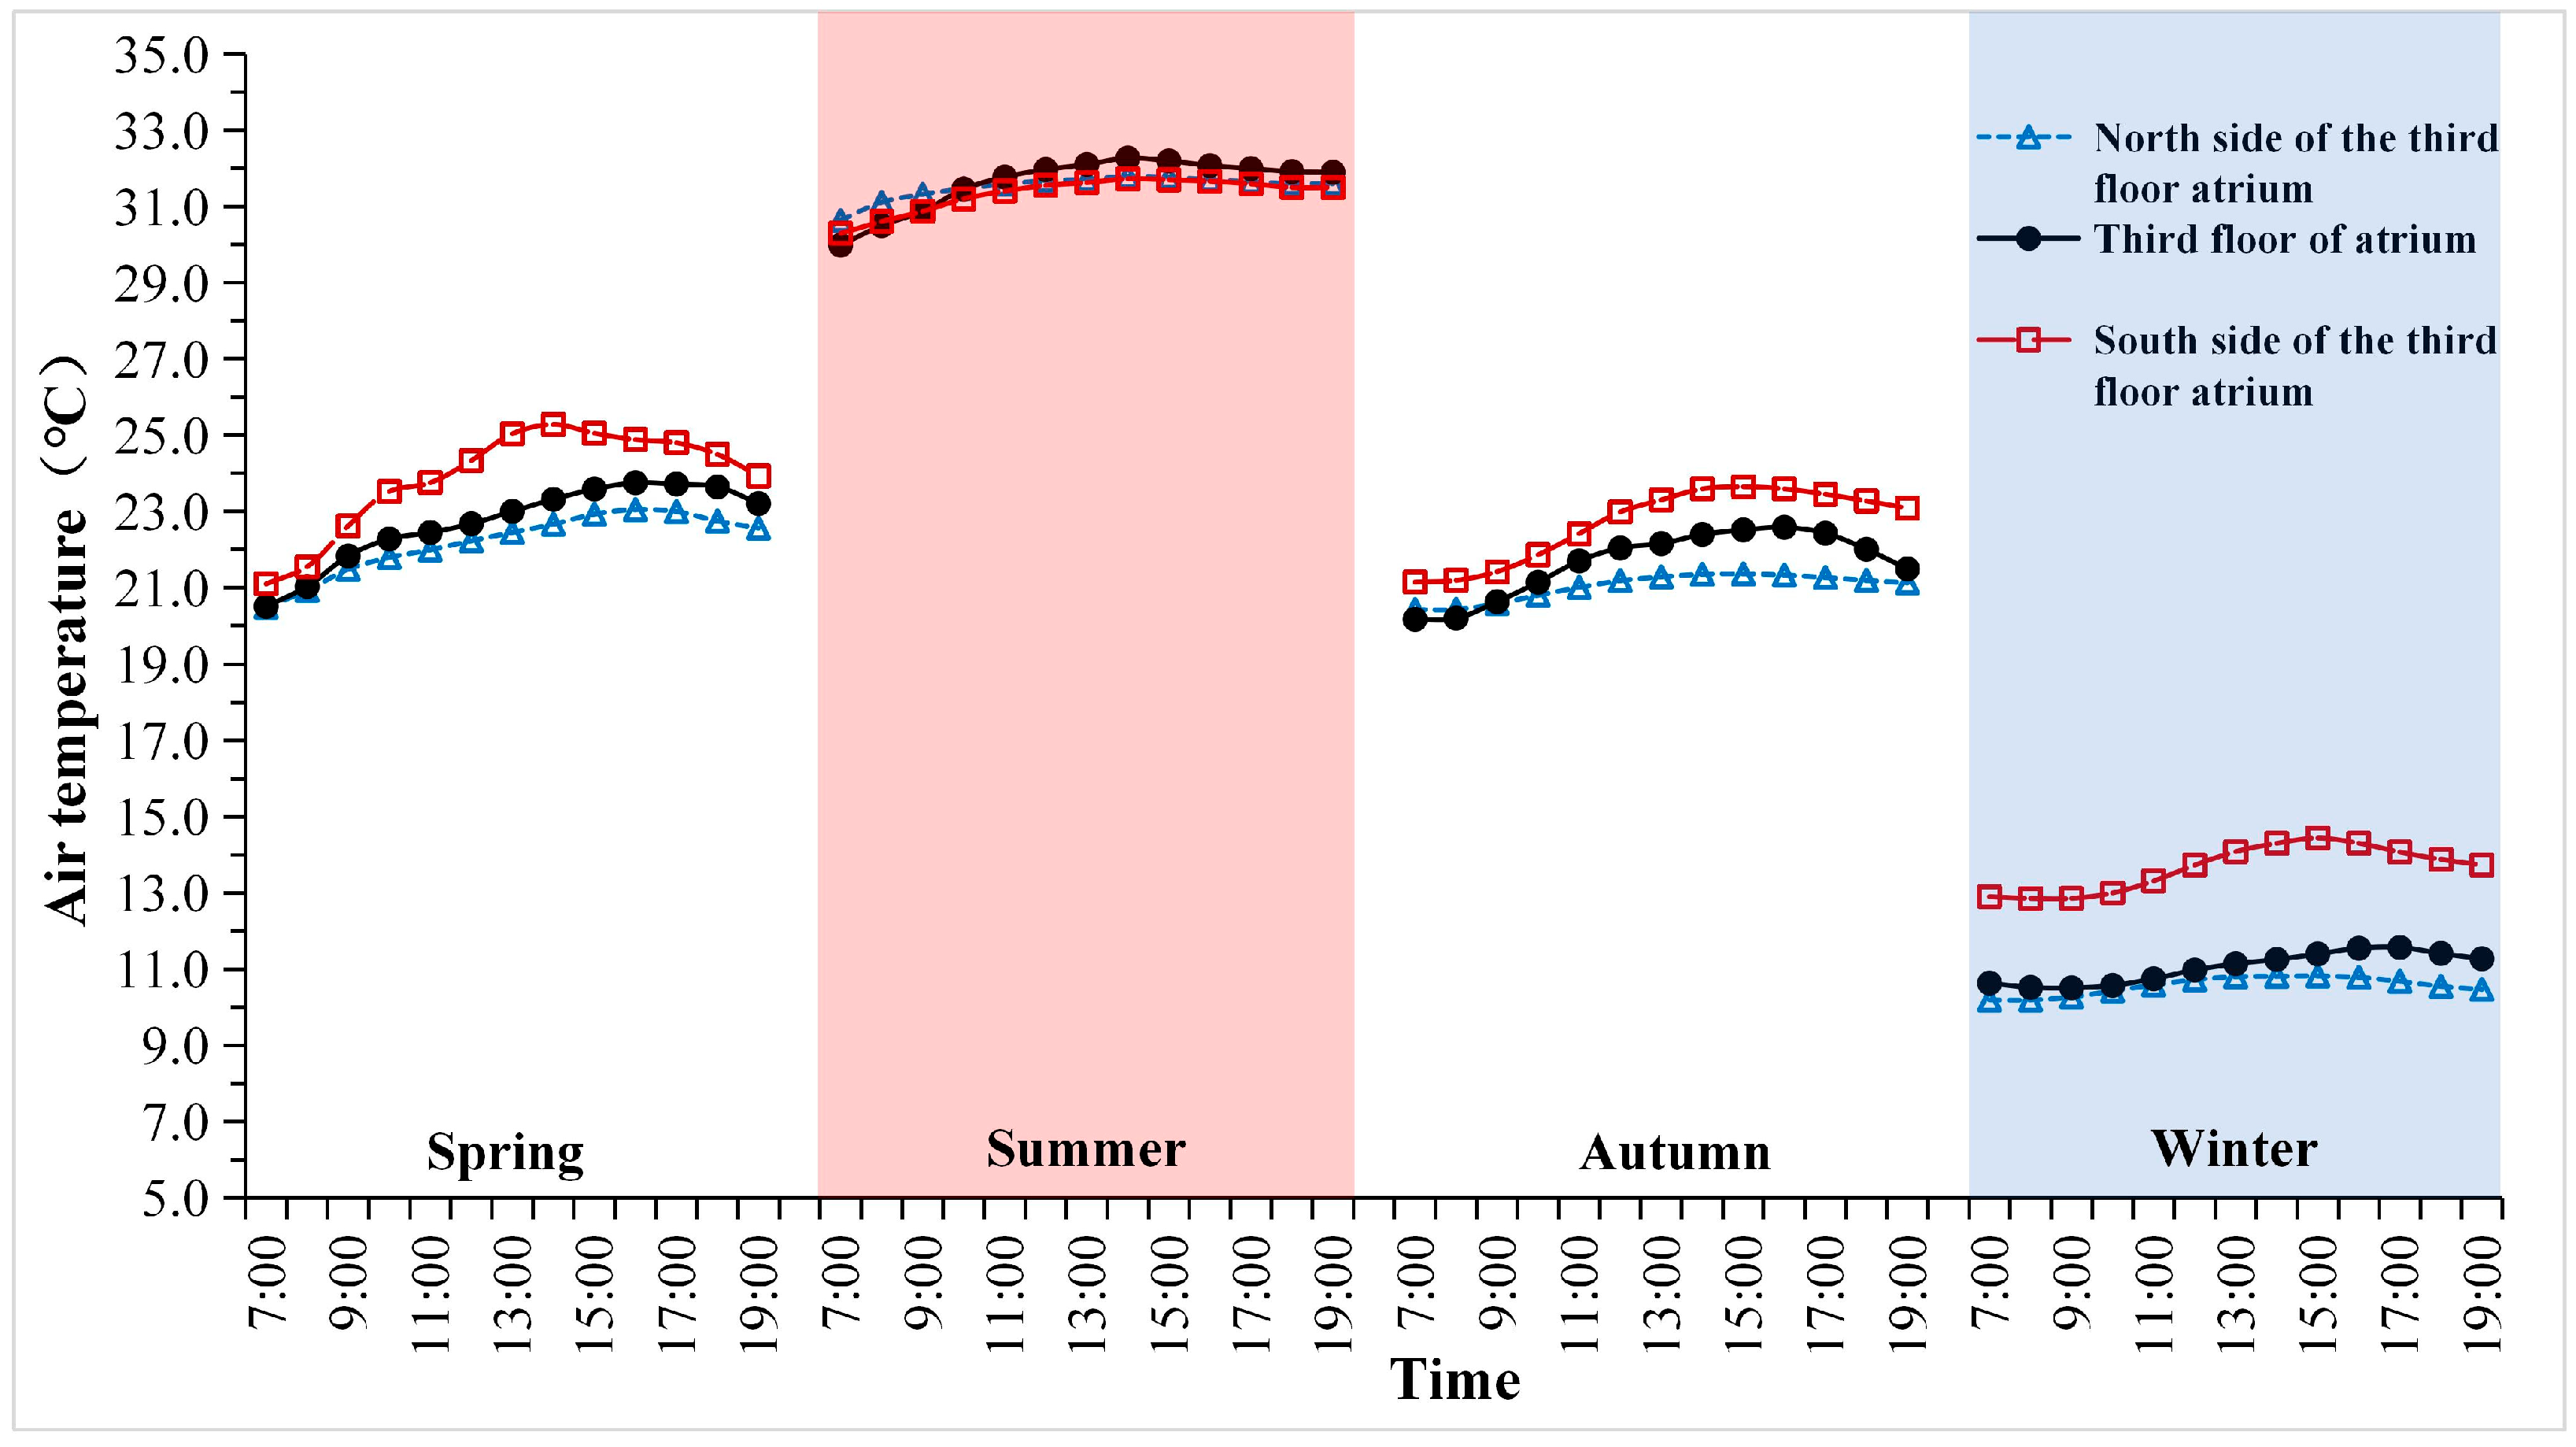
- The thermal environment in horizontal spaces of an enclosed atrium exhibits a stepped pattern. In spring, autumn, and winter, the daytime air temperature in the atrium area at the horizontal level is highest on the south side of the third floor, followed by the third floor itself, and lowest on the north side of the third floor. However, the trend reverses in summer: from 7:00 to 11:00 in the morning, the temperature on the north side of the third floor is the highest, followed by the third floor itself, and lowest on the south side of the third floor. At other times, the temperature is highest on the third floor of the atrium, while it remains similar on its north and south sides.
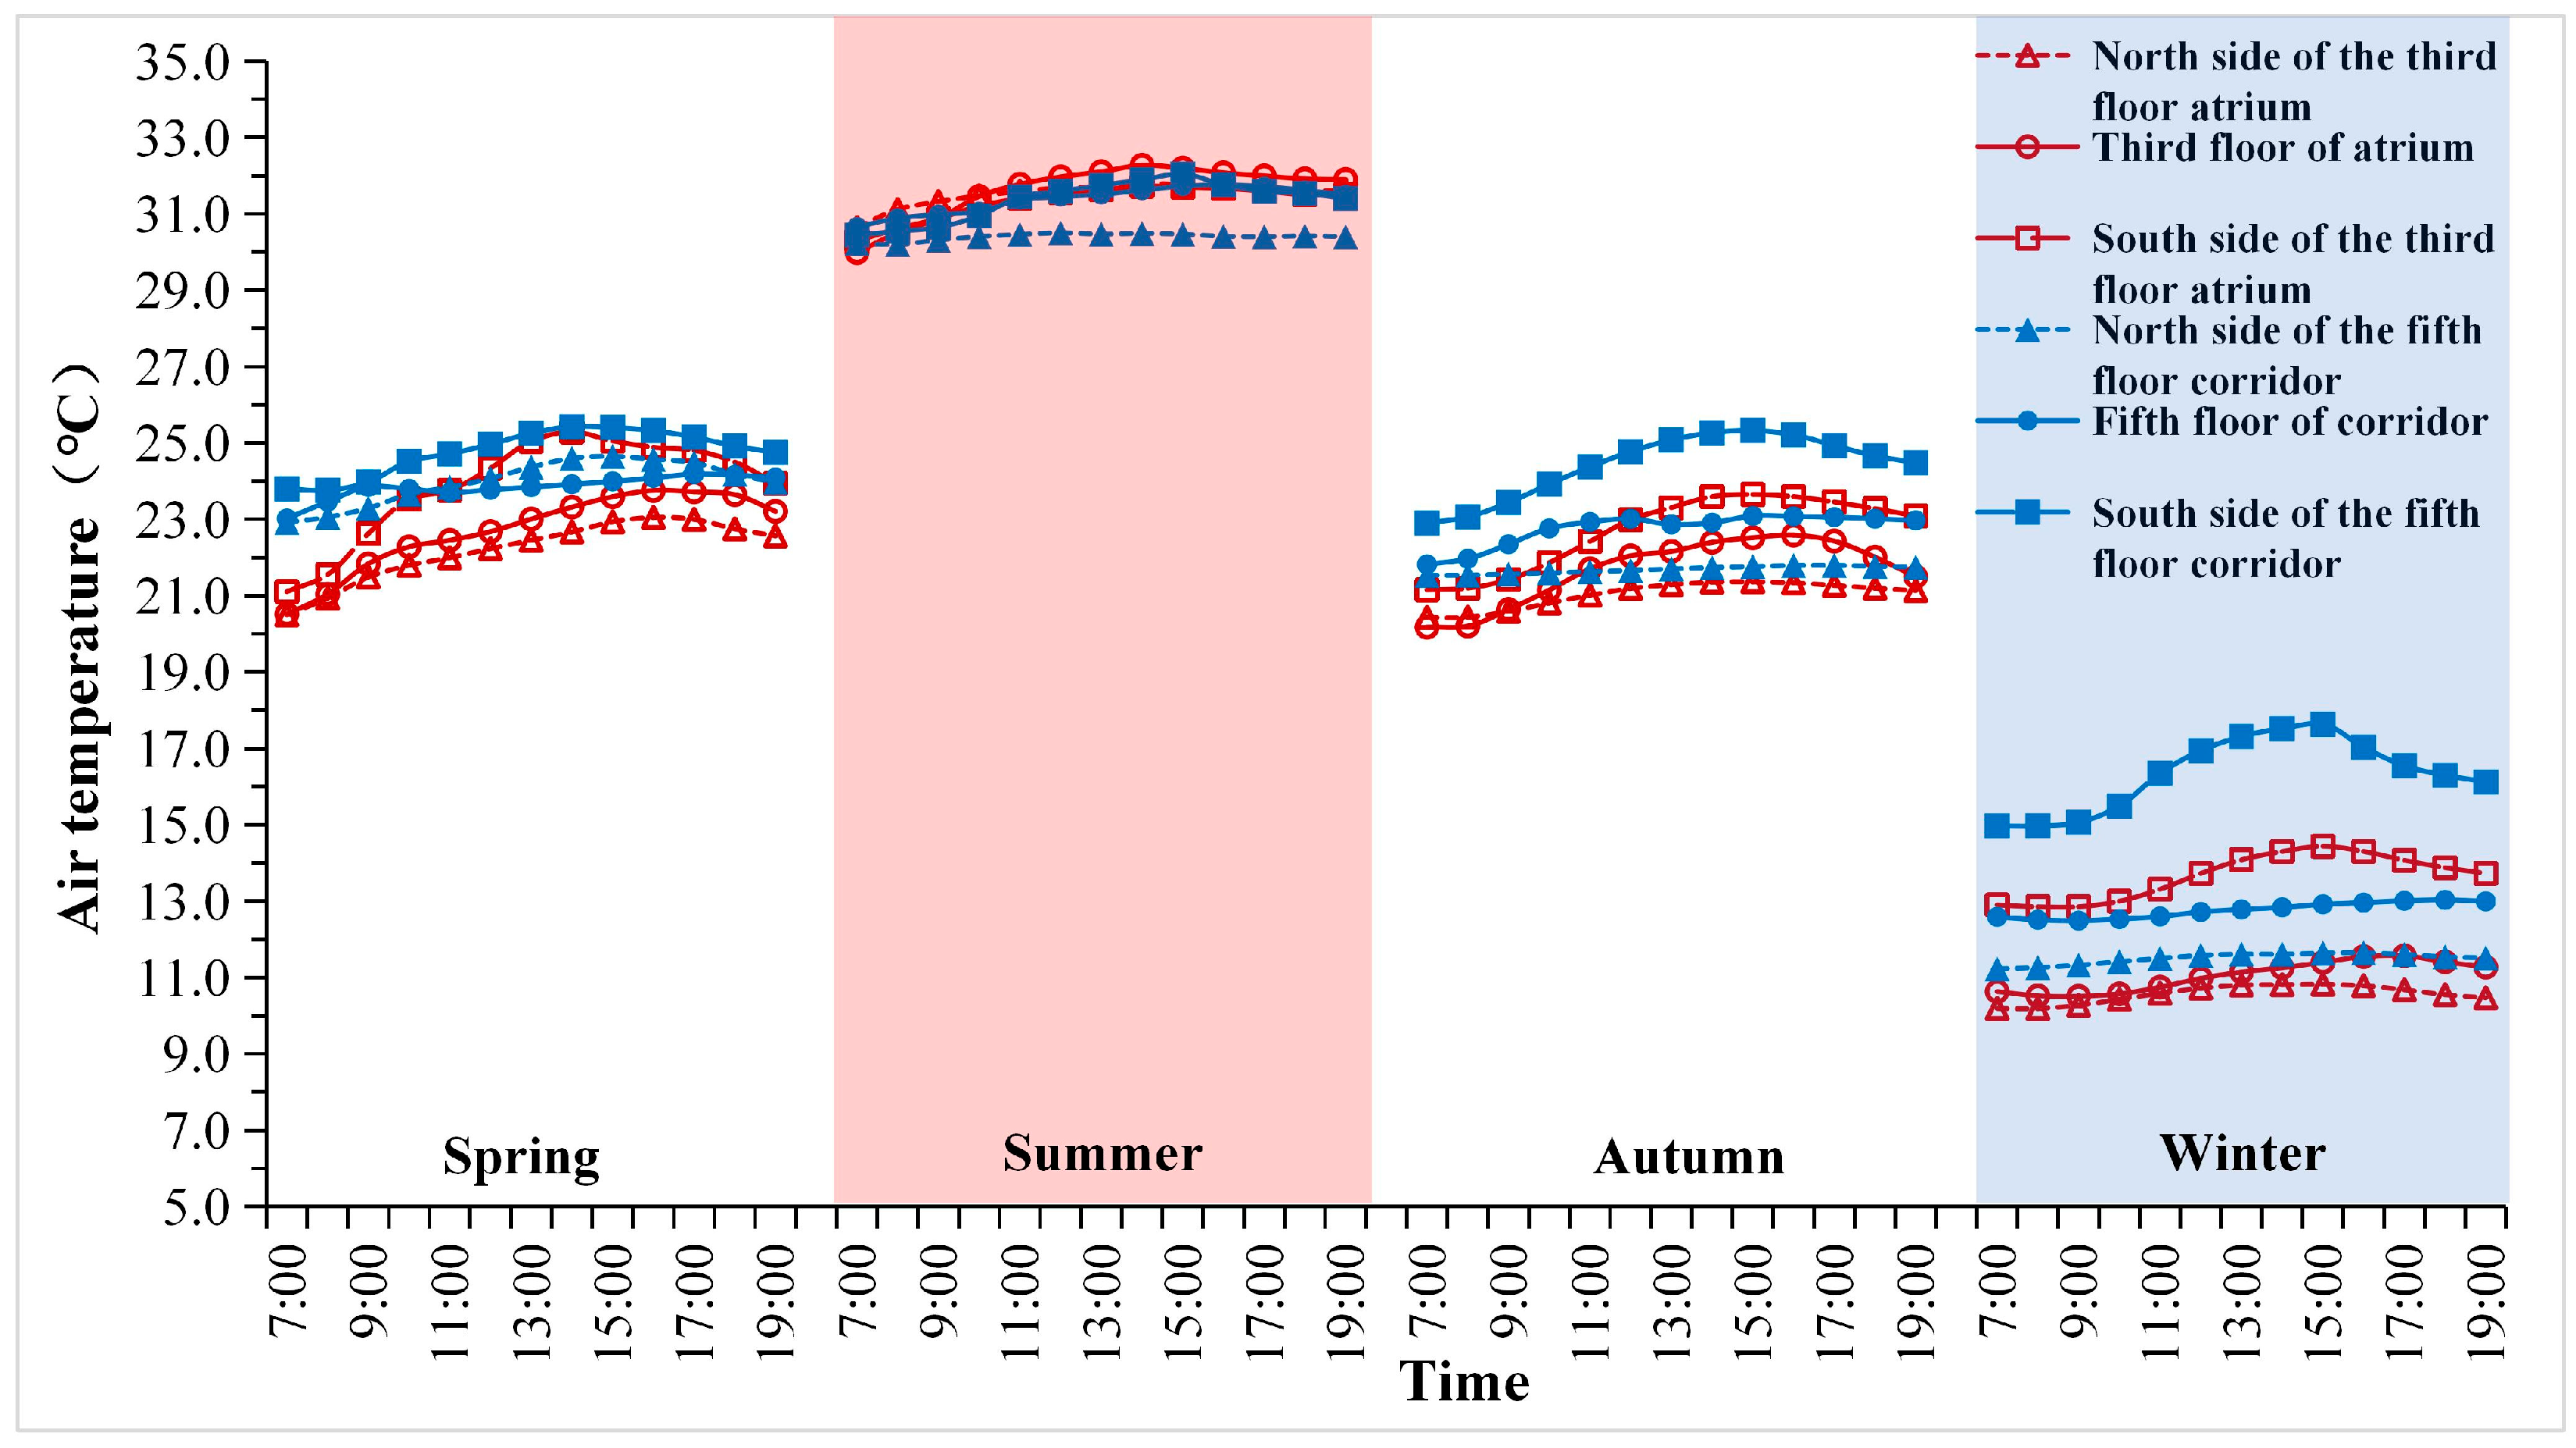
- The non-ventilated atrium with a glass roof receives more solar radiation in summer and has a higher overall temperature rise than the inner corridor space. On typical days in summer, the temperature in the atrium area is 0.6 °C higher than in the inner corridor area; in spring, autumn, and winter, the temperature in the atrium space is lower than in the corridor space by 1.7 °C, 1.1 °C, and 1.7 °C, respectively.
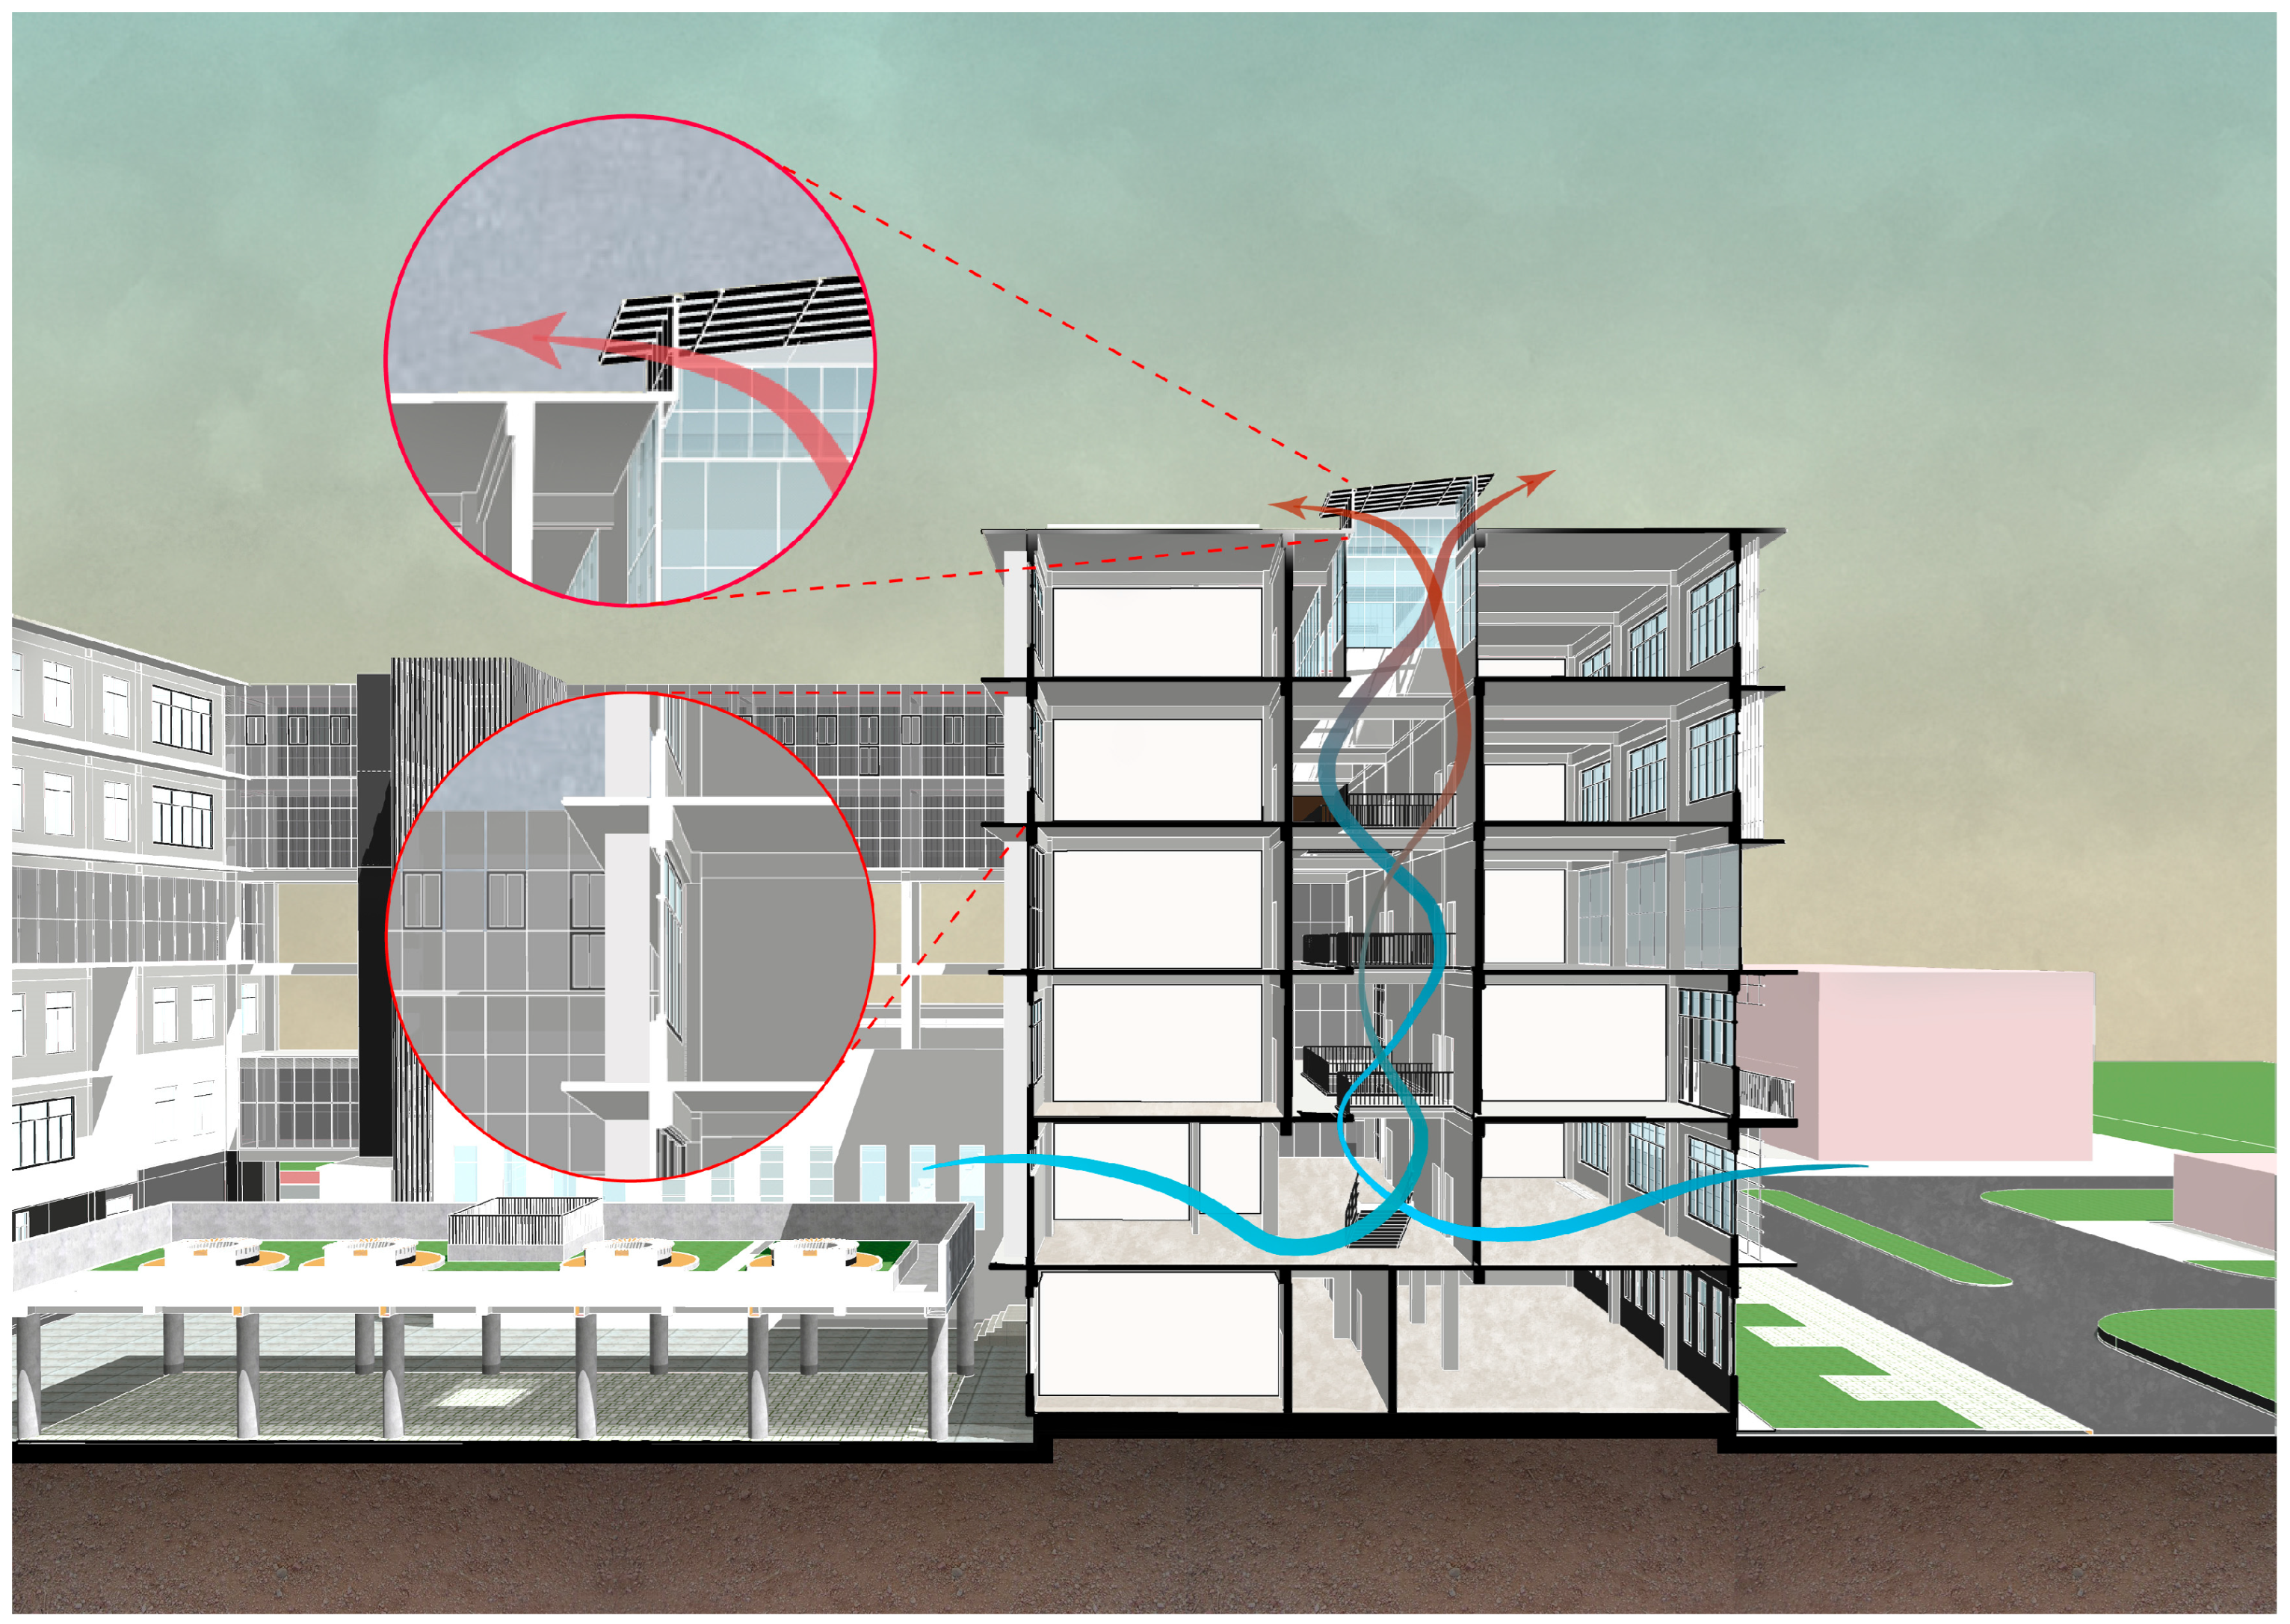
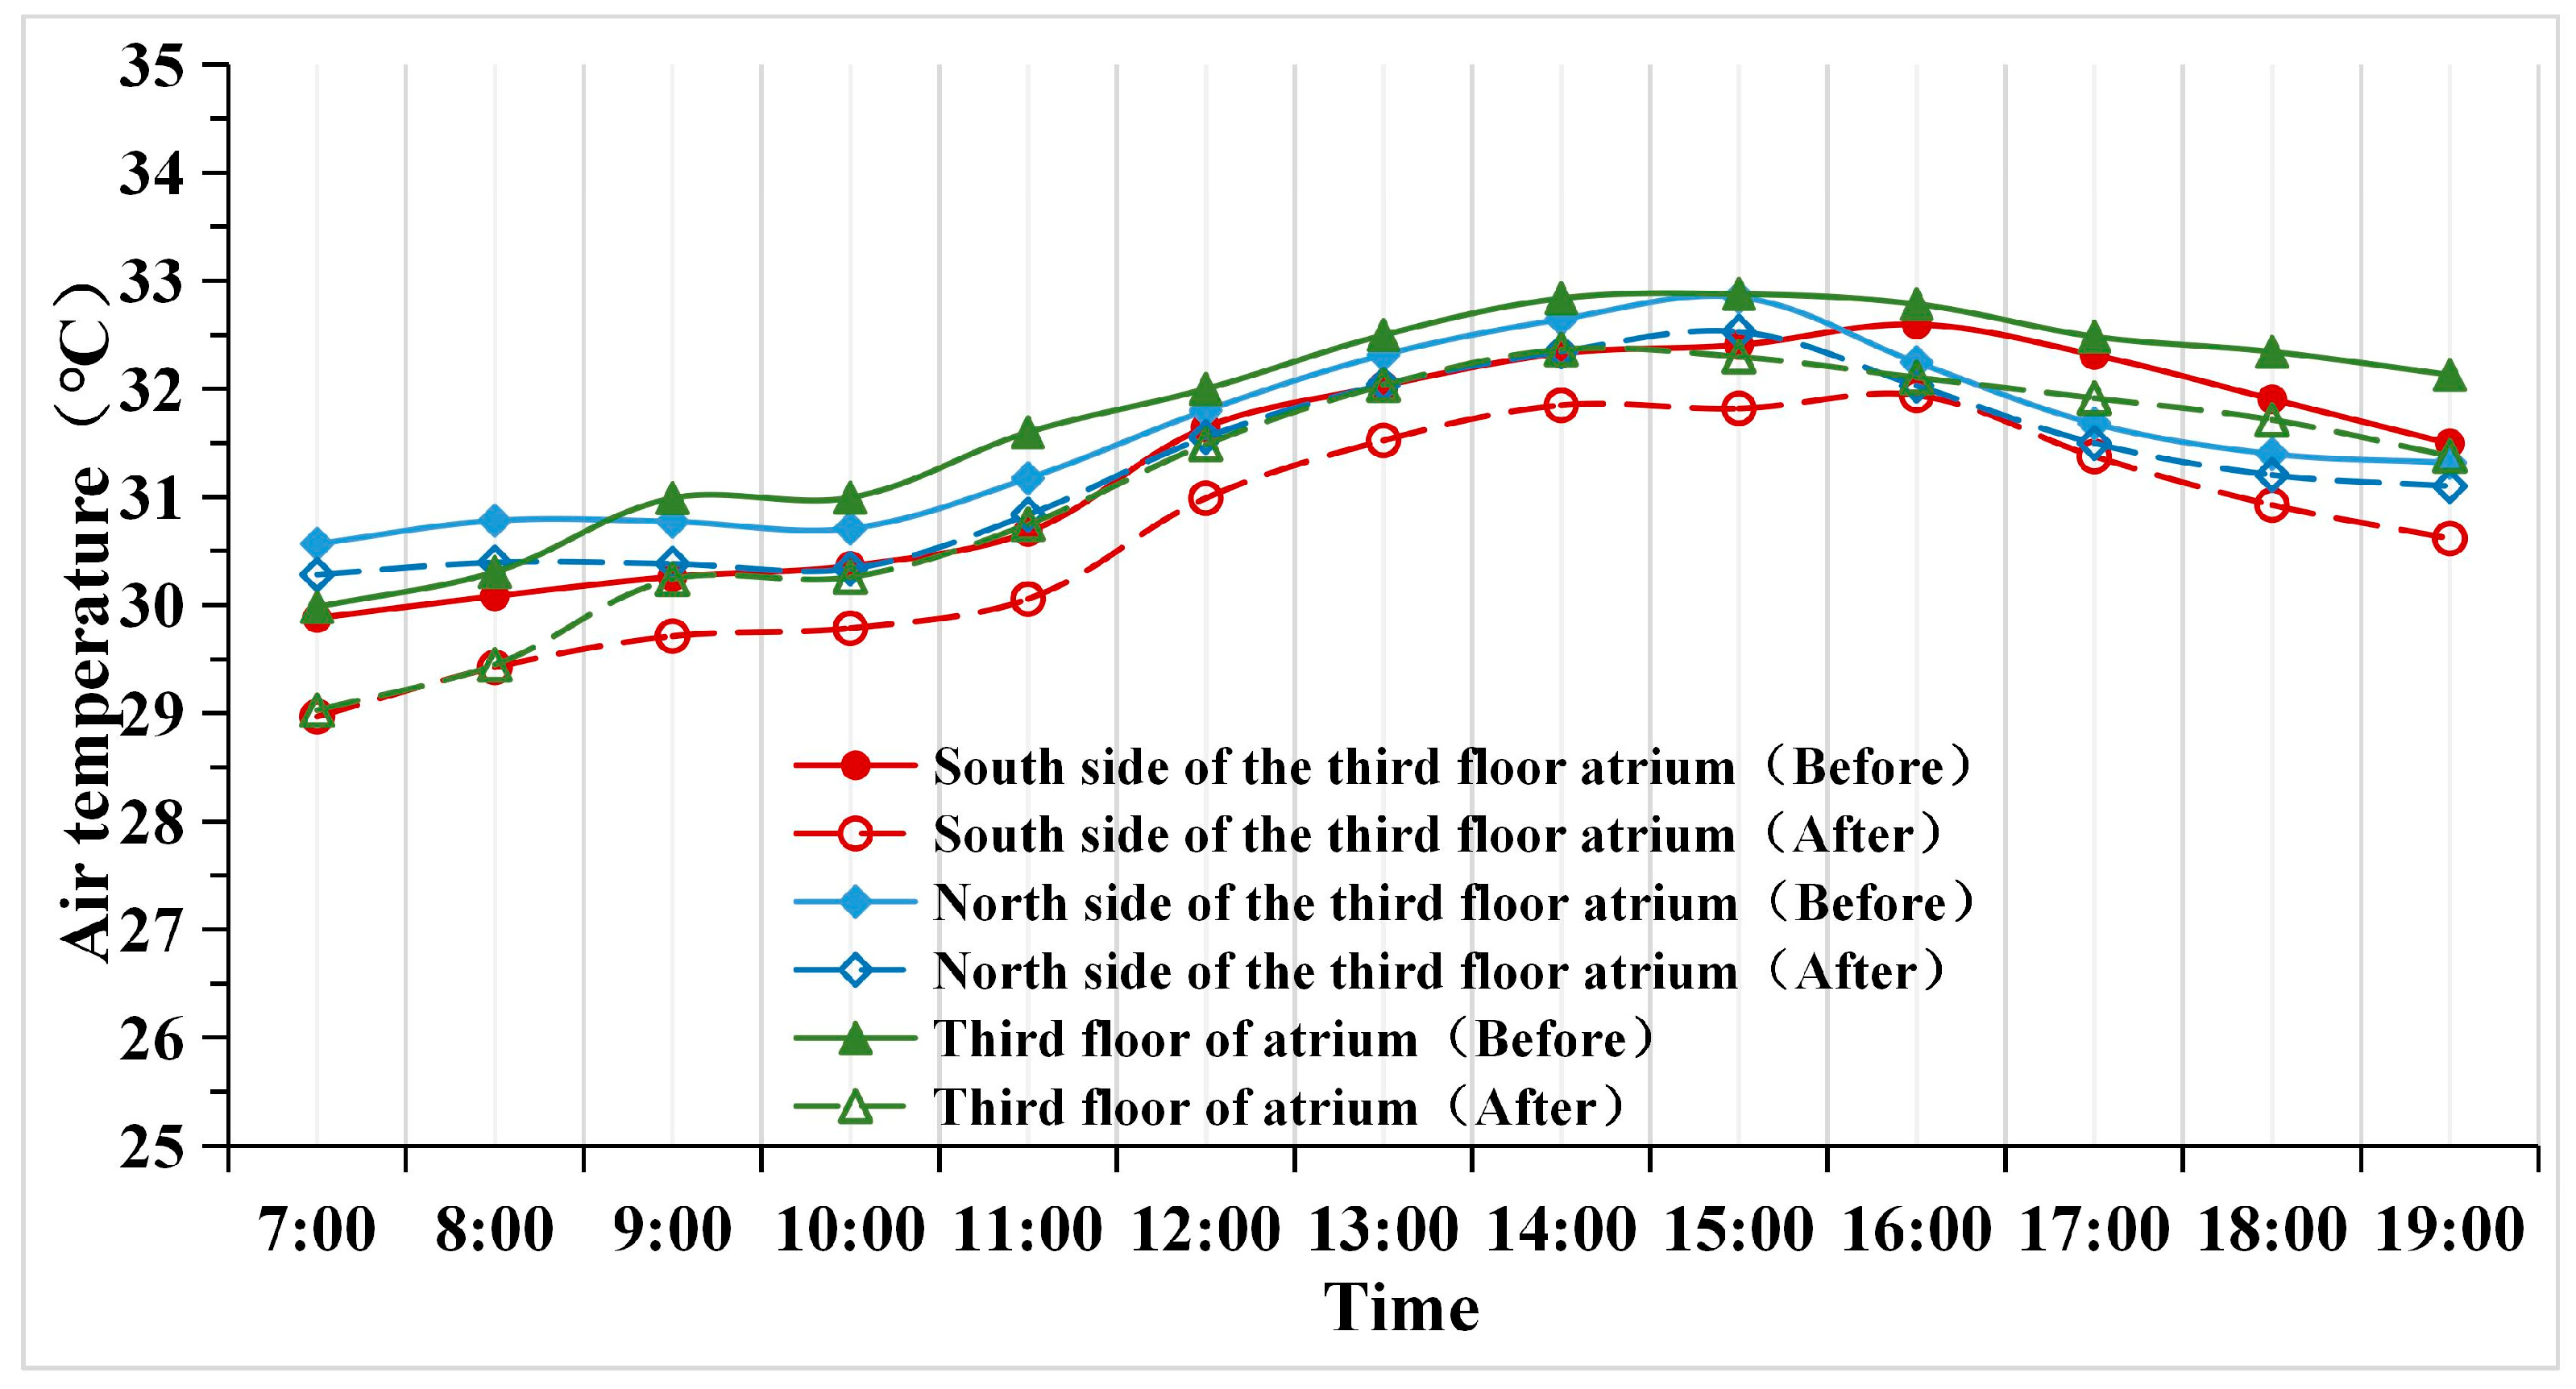
- Based on the problems found in the thermal environment test, a design proposal for ventilation and shading renovation of the atrium and vertical shading renovation of the north facade was provided. After renovation, the temperature of the third floor of the atrium area in summer drops by 0.7 °C, and the energy consumption of the atrium building is cut by 9.4%.
Author Contributions
Funding
Data Availability Statement
Conflicts of Interest
References
- Hung, W.Y.; Chow, W.K. A Review on Architectural Aspects of Atrium Buildings. Archit. Sci. Rev. 2001, 44, 285–295. [Google Scholar] [CrossRef]
- Aldawoud, A.; Clark, R. Comparative analysis of energy performance between courtyard and atrium in buildings. Energy Build. 2008, 40, 209–214. [Google Scholar] [CrossRef]
- Lu, Y.; Xiang, Y.; Chen, G.; Wu, Y.; Sun, C.; Liu, J. Summer dynamic thermal environment for isolated atrium in the severe cold region: On-site measurement and numerical simulation. Appl. Therm. Eng. 2019, 160, 114108. [Google Scholar] [CrossRef]
- Ge, J.; Zhao, Y.; Zhao, K. Impact of a non-enclosed atrium on the surrounding thermal environment in shopping malls. J. Build. Eng. 2021, 35, 101981. [Google Scholar] [CrossRef]
- Shi, K.; Ren, J.; Cao, X.; Kong, X. Optimizing thermal comfort in an atrium-structure library: On-site measurement and TRNSYS-CONTAM co-simulation. Build. Environ. 2024, 266, 112041. [Google Scholar] [CrossRef]
- Su, M.; Jie, P.; Zhu, S.; Li, P.; Gao, N.; Causone, F.; Wu, X.; Yang, X.; Shi, X. Evaluating the thermal environment of a large atrium in an office building using computational fluid dynamics. J. Build. Eng. 2024, 100, 111754. [Google Scholar] [CrossRef]
- Hu, Z. The Improvement Strategy of Thermal Environment of the Atrium in Architectural Department Hall. Master’s Thesis, Anhui Jianzhu University, Hefei, China, 2018. (In Chinese). [Google Scholar]
- Abdullah, A.; Meng, Q.; Zhao, L.; Wang, F. Field study on indoor thermal environment in an atrium in tropical climates. Build. Environ. 2009, 44, 431–436. [Google Scholar] [CrossRef]
- Sokkar, R.; Alibaba, H.Z. Thermal Comfort Improvement for Atrium Building with Double-Skin Skylight in the Mediterranean Climate. Sustainability 2020, 12, 2253. [Google Scholar] [CrossRef]
- Moosavi, L.; Mahyuddin, N.; Ghafar, N. Atrium cooling performance in a low energy office building in the Tropics, a field study. Build. Environ. 2015, 94, 384–394. [Google Scholar] [CrossRef]
- Walker, C.; Tan, G.; Glicksman, L. Reduced-scale building model and numerical investigations to buoyancy-driven natural ventilation. Energy Build. 2011, 43, 2404–2413. [Google Scholar] [CrossRef]
- Lu, Y.; Dong, J.; Wang, Z.; Wang, Y.; Wu, Q.; Wang, L.; Liu, J. Evaluation of stack ventilation in a large space using zonal simulation and a reduced-scale model experiment with particle image velocimetry. J. Build. Eng. 2021, 34, 101958. [Google Scholar] [CrossRef]
- Liu, P.-C.; Lin, H.-T.; Chou, J.-H. Evaluation of buoyancy-driven ventilation in atrium buildings using computational fluid dynamics and reduced-scale air model. Build. Environ. 2009, 44, 1970–1979. [Google Scholar] [CrossRef]
- Lu, Y.; Dong, J.; Liu, J. Zonal modelling for thermal and energy performance of large space buildings: A review. Renew. Sustain. Energy Rev. 2020, 133, 110241. [Google Scholar] [CrossRef]
- Wen, H.; Lin, H.; Liu, X.; Guo, W.; Yao, J.; He, B.-J. An Assessment of the Psychologically Restorative Effects of the Environmental Characteristics of University Common Spaces. Environ. Impact Assess. Rev. 2025, 110, 107645. [Google Scholar] [CrossRef]
- Holford, J.M.; Hunt, G.R. Fundamental atrium design for natural ventilation. Build. Environ. 2003, 38, 409–426. [Google Scholar] [CrossRef]
- Ding, W.; Hasemi, Y.; Yamada, T. Natural ventilation performance of a double-skin façade with a solar chimney. Energy Build. 2005, 37, 411–418. [Google Scholar] [CrossRef]
- Ji, Y.; Cook, M. Numerical studies of displacement natural ventilation in multi-storey buildings connected to an atrium. Build. Serv. Eng. Res. Technol. 2007, 28, 207–222. [Google Scholar] [CrossRef]
- Acred, A.; Hunt, G.R. Stack ventilation in multi-storey atrium buildings: A dimensionless design approach. Build. Environ. 2014, 72, 44–52. [Google Scholar] [CrossRef]
- Assadi, M.K.; Dalir, F.; Hamidi, A.A. Analytical model of atrium for heating and ventilating an institutional building naturally. Energy Build. 2011, 43, 2595–2601. [Google Scholar] [CrossRef]
- Aldawoud, A. The influence of the atrium geometry on the building energy performance. Energy Build. 2013, 57, 1–5. [Google Scholar] [CrossRef]
- Wang, F.; Abdullah, A.H. Investigating thermal conditions in a tropic atrium employing CFD and DTM techniques. Int. J. Low-Carbon Technol. 2011, 6, 171–186. [Google Scholar] [CrossRef]
- Lin, Y.J.P.; Linden, P.F. Buoyancy-driven ventilation between two chambers. J. Fluid Mech. 2002, 463, 293–312. [Google Scholar] [CrossRef]
- Wang, X.; Huang, C.; Cao, W. Mathematical modeling and experimental study on vertical temperature distribution of hybrid ventilation in an atrium building. Energy Build. 2009, 41, 907–914. [Google Scholar] [CrossRef]
- Hussain, S.; Oosthuizen, P.H. Numerical investigations of buoyancy-driven natural ventilation in a simple atrium building and its effect on the thermal comfort conditions. Appl. Therm. Eng. 2012, 40, 358–372. [Google Scholar] [CrossRef]
- Yasa, E. Building Typology Comparison Between Courtyard and Atrium Buildings: A Study of Thermal Comfort and Energy Performance Factors in Different Climate Zones. In Energy Efficient Buildings; Yap, E.H., Ed.; INTECH: London, UK, 2017; pp. 61–91. [Google Scholar]
- Mouriki, E. Solar-Assisted Hybrid Ventilation in an Institutional Building. Ph.D. Dissertation, Concordia University, Montreal, QC, Canada, 2009. [Google Scholar] [CrossRef]
- Lynch, P.; Hunt, G. The night purging of a two-storey atrium building. Build. Environ. 2011, 46, 144–155. [Google Scholar] [CrossRef]
- Gan, G. Simulation of buoyancy-driven natural ventilation of buildings—Impact of computational domain. Energy Build. 2010, 42, 1290–1300. [Google Scholar] [CrossRef]
- Mouriki, E.; Karava, P.; Athienitis, A.; Park, K.W.; Stathopoulos, T. Full-scale study of an atrium integrated with a hybrid ventilation system. In Proceedings of the 3rd Canadian Solar Buildings Conference, Fredericton, NB, Canada, 20–22 August 2008. [Google Scholar]
- Horan, J.M.; Finn, D.P. Sensitivity of air change rates in a naturally ventilated atrium space subject to variations in external wind speed and direction. Energy Build. 2008, 40, 1577–1585. [Google Scholar] [CrossRef]
- Chu, G.; Liu, X.; Gao, Q.; Guo, X.; Shen, W. Influence of Air Supply Parameters of Building Atrium on Air Conditioning Effect in winter. Procedia Eng. 2017, 205, 1913–1919. [Google Scholar] [CrossRef]
- Zhong, W.; Pan, Y.; Xiao, W.; Zhang, T. Identifying bioclimatic techniques for sustainable low-rise high-density residential units: Comparative analysis on the ventilation performance of vernacular dwellings in China. J. Build. Eng. 2023, 80, 108008. [Google Scholar] [CrossRef]
- Zhong, W.; Xiao, W.; Zhang, T. Numerical Investigations on Natural Ventilation in Atria of China’s Southern Yangtze Vernacular Dwellings. Sustain. Cities Soc. 2022, 89, 104341. [Google Scholar] [CrossRef]
- Xu, C.; Wang, Y.; Hui, J.; Wang, L.; Yao, W.; Sun, L. Study on winter thermal environmental characteristics of the atrium space of teaching building in China’s cold region. J. Build. Eng. 2023, 67, 105978. [Google Scholar] [CrossRef]
- ISO 7726; Ergonomics of the Thermal Environment—Instruments for Measuring Physical Quantities. International Organization for Standardization: Geneva, Switzerland, 1998.
- GB 50189-2005; Ministry of Housing and Urban-Rural Development of the People’s Republic of China. Design Standard for Energy Efficiency of Public Buildings. China Architecture & Building: Beijing, China, 2005. (In Chinese)
- The Ernest Orlando Lawrence Berkeley National Laboratory. Getting Started with EnergyPlus: Basic Concepts Manual—Essential Information. You Need About Running EnergyPlus; EnergyPlus: Golden, CO, USA, 2009. [Google Scholar]
- Available online: https://energyplus.net/assets/nrel_custom/pdfs/pdfs_v25.1.0/GettingStarted.pdf (accessed on 2 April 2025).
- Wen, C.; Wang, C. Thermal amenity analysis of different space shape of atrium in summer. J. Shandong Jianzhu Univ. 2006, 21, 36–41+49. (In Chinese) [Google Scholar]
- Huang, C.; Zou, Z.; Li, M.; Wang, X.; Li, W.; Huang, W.; Yang, J.; Xiao, X. Measurements of indoor thermal environment and energy analysis in a large space building in typical seasons. Build. Environ. 2007, 42, 1869–1877. [Google Scholar] [CrossRef]
- Laouadi, A.; Atif, M.R. Comparison between computed and field measured thermal parameters in an atrium building. Build. Environ. 1998, 34, 129–138. [Google Scholar] [CrossRef]
- Dai, B.; Tong, Y.; Hu, Q.; Chen, Z. Characteristics of thermal stratification and its effects on HVAC energy consumption for an atrium building in south China. Energy 2022, 249, 123425. [Google Scholar] [CrossRef]
- He, J.; He, C.; Wang, G. Research on Summer Thermal Environment Testing of Urumqi University Classrooms. Build. Technol. Dev. 2018, 45, 106–107. (In Chinese) [Google Scholar]
- Liu, X.; He, J.; Xiong, K.; Liu, S.; He, B.-J. Identification of factors affecting public willingness to pay for heat mitigation and adaptation: Evidence from Guangzhou, China. Urban Clim. 2023, 48, 101405. [Google Scholar] [CrossRef]
- Liu, S.; Wang, Y.; Liu, X.; Yang, L.; Zhang, Y.; He, J. How does future climatic uncertainty affect multi-objective building energy retrofit decisions? Evidence from residential buildings in subtropical Hong Kong. Sustain. Cities Soc. 2023, 92, 104482. [Google Scholar] [CrossRef]

| Year | Season | Dates of Typical Day Tests | Time of Typical Day Tests |
|---|---|---|---|
| 2023 | Spring | 15 April and 16 April | 7:00–20:00 |
| Summer | 16 July, 17 July, and 18 July | ||
| Autumn | 15 October and 16 October | ||
| 2024 | Winter | 14 February and 15 February |
| Spring (°C) | Summer (°C) | Autumn (°C) | Winter (°C) | |
|---|---|---|---|---|
| 5F | 24.5 | 32.8 | 24.2 | 12.9 |
| 3F | 22.1 | 31.6 | 21.7 | 11.0 |
| 2F | 21.2 | 30.6 | 20.7 | 10.3 |
| Difference between 5F and 2F | 3.3 | 2.2 | 3.5 | 2.6 |
| Difference between 5F and 3F | 2.4 | 1.2 | 2.5 | 1.9 |
| Difference between 3F and 2F | 0.9 | 1.0 | 1.0 | 0.7 |
| Spring (°C) | Summer (°C) | Autumn (°C) | Winter (°C) | |
|---|---|---|---|---|
| North side of 3F | 22.2 | 31.5 | 21.0 | 10.6 |
| 3F | 22.7 | 31.6 | 21.7 | 11.0 |
| South side of 3F | 23.9 | 31.3 | 22.7 | 13.6 |
| Difference between the south and north sides | 1.7 | −0.2 | 1.7 | 3.0 |
| Difference between the atrium and its south side | −1.2 | 0.3 | −1.0 | −2.6 |
| Difference between the atrium and its north side | 0.5 | 0.1 | 0.7 | 0.4 |
| Spring (°C) | Summer (°C) | Autumn (°C) | Winter (°C) | |
|---|---|---|---|---|
| North side of 3F of the atrium | 22.2 | 31.5 | 21.0 | 10.6 |
| 3F of the atrium | 22.7 | 31.6 | 21.7 | 11.0 |
| South side of 3F of the atrium | 23.9 | 31.3 | 22.7 | 13.6 |
| North side of 5F of the corridor | 23.9 | 30.4 | 21.7 | 11.5 |
| 5F of the corridor | 24.2 | 31.4 | 22.8 | 12.8 |
| South side of 5F of the corridor | 24.8 | 30.8 | 24.4 | 16.3 |
| Difference between south and north wings | −1.7 | 0.6 | −1.1 | −1.7 |
| Attributes | Construction/Materials | U-Value (W/(m2K)) |
|---|---|---|
| Exterior wall | 20 mm cement mortar + 50 mm insulation layer + 200 mm concrete + 20 mm cement mortar | 0.61 |
| Interior wall | 20 mm cement mortar + 200 mm concrete block + 20 mm cement mortar | 1.30 |
| Floor | 20 mm acoustic tile + 100 mm concrete + 20 mm cement mortar | 1.74 |
| Exterior floor | 50 mm insulation layer + 200 mm concrete | 0.65 |
| Roof | 60 mm insulation layer + 100 mm concrete + 20 mm cement mortar | 0.49 |
| Glazing | Skylight: (SHGC:0.74) | 3.5 |
| Window: (SHGC:0.78) | 6.0 |
| Parameters | Numerical Value | Unite (of Measure) |
|---|---|---|
| Occupant activity level | 120 | W |
| Floor space per capita | 6 | m2 |
| Cooling setpoint | 26 | °C |
| Heating setpoint | 18 | °C |
| Window opening threshold | 18–26 | °C |
| Location | Atrium Height (m) | Vertical Temperature Gradient Results (°C/m) | Refs. |
|---|---|---|---|
| Harbin, China (Dwa) | 22.85 | Summer: 0.2 | Lu et al., 2019 [3] |
| Tianjin, China (Dwa) | 18.3 | Winter: 0.45 | Xu et al., 2023 [35] |
| Nanjing, China (Cfa) | 10 | Summer: 0.15–1.2 Winter: 0.03–0.08 | Dai et al., 2022 [43] |
| Shanghai, China (Cfa) | 31.3 | Summen: 0.62 Winter: 0.77 Transition season: 0.1 | Huang et al., 2006 [41] |
| Ottawa, Canada (Dfb) | 21 | Vertical temperature gradient in winter < Vertical temperature gradient in summer | A. Laouadi and M.R. Atif, 1998 [42] |
| Xi’an, China (between the BSk and Cwa) | 49.3 | Summen: 0.095 Winter: 0.046 | Su et al., 2025 [6] |
| Zhengzhou (between the BSk and Cwa) | 16.8 | Summen: 0.19 Winter: 0.23 Transition season: 0.29–0.31 | This study |
Disclaimer/Publisher’s Note: The statements, opinions and data contained in all publications are solely those of the individual author(s) and contributor(s) and not of MDPI and/or the editor(s). MDPI and/or the editor(s) disclaim responsibility for any injury to people or property resulting from any ideas, methods, instructions or products referred to in the content. |
© 2025 by the authors. Licensee MDPI, Basel, Switzerland. This article is an open access article distributed under the terms and conditions of the Creative Commons Attribution (CC BY) license (https://creativecommons.org/licenses/by/4.0/).
Share and Cite
Li, K.; Liu, X.; Ma, J.; Li, Z.; Zhang, H. Renovation Methods for Atrium-Style Educational Buildings Based on Thermal Environment Testing in Cold Regions of China. Buildings 2025, 15, 2077. https://doi.org/10.3390/buildings15122077
Li K, Liu X, Ma J, Li Z, Zhang H. Renovation Methods for Atrium-Style Educational Buildings Based on Thermal Environment Testing in Cold Regions of China. Buildings. 2025; 15(12):2077. https://doi.org/10.3390/buildings15122077
Chicago/Turabian StyleLi, Kunming, Xiao Liu, Jian Ma, Zhongxun Li, and Hua Zhang. 2025. "Renovation Methods for Atrium-Style Educational Buildings Based on Thermal Environment Testing in Cold Regions of China" Buildings 15, no. 12: 2077. https://doi.org/10.3390/buildings15122077
APA StyleLi, K., Liu, X., Ma, J., Li, Z., & Zhang, H. (2025). Renovation Methods for Atrium-Style Educational Buildings Based on Thermal Environment Testing in Cold Regions of China. Buildings, 15(12), 2077. https://doi.org/10.3390/buildings15122077