Article

Sustainable Mitigation Strategies for Enhancing Student Thermal Comfort in the Educational Buildings of Sohag University

by
Amr Sayed Hassan Abdallah
1,* and
Randa Mohamed Ahmed Mahmoud
2
1
Department of Architectural Engineering, College of Engineering, Imam Mohammad Ibn Saud Islamic University (IMSIU), Riyadh 11432, Saudi Arabia
2
Department of Architecture, Faculty of Engineering, Assiut University, Assiut 71516, Egypt
*
Author to whom correspondence should be addressed.
Buildings 2025, 15(12), 2048; https://doi.org/10.3390/buildings15122048
Submission received: 20 May 2025 / Revised: 1 June 2025 / Accepted: 12 June 2025 / Published: 14 June 2025
(This article belongs to the Special Issue Research on Indoor Air Environment and Energy Conservation)

Abstract

Improving students’ thermal comfort in university courtyards and indoor spaces promotes walkability, enhances livability, and fosters social interaction among students. This study aims to improve students’ outdoor thermal comfort in university courtyards, to reduce heat transfer to classrooms, and to accordingly reduce energy consumption in university buildings in hot arid climates. Thus, the proposed coupled methodology for the case study, the Faculty of Agriculture, New Sohag University, Egypt, consists of three stages. First, monitoring and questionnaire surveys were conducted in the open courtyard and the classroom to obtain air temperature, wind speed, thermal image, and CO2 and thermal comfort analysis. Secondly, the Envi-met model was used to investigate the impact of six improvement solutions on improving thermal comfort in the courtyard. Third, retrofitting strategies in the building envelope were evaluated to decrease heat transfer and energy consumption by DesignBuilder software. Consequently, the findings revealed a high outdoor air temperature, which causes discomfort for students. Hence, the simulation results concluded that the significant reduction of physiological equivalent temperature (PET), which ranged between 11.1 °C and 13.9 °C, occurred after applying the hybrid improvement solutions (vegetation area and semi-shading or pergola-shading). Moreover, integrating a combination of retrofitting strategies into the faculty buildings contributed to a 30% reduction in energy consumption. Ultimately, the proposed methodology aims to assist architects and urban designers in the early design stages by providing the appropriate environmental solutions for the universities’ courtyards and buildings in hot arid climates.

1. Introduction

In recent years, educational buildings have gained increasing attention for their environmental design, encompassing both indoor environments and outdoor spaces. On the one hand, improving thermal comfort in the main courtyard encourages students to practice social activities. At the same time, reducing energy consumption in university buildings is a critical step toward sustainable campus development. Hence, improving outdoor and indoor thermal comfort for students in university courtyards is essential for enhancing well-being and promoting the use of open spaces, especially in hot arid climates. Accordingly, the relevant literature is categorized into the following two main areas: (a) improving outdoor thermal comfort in educational buildings and (b) energy conservation methods inside educational buildings. Several studies utilized different survey methods and simulation software to investigate the impact of their proposed mitigation solutions. For example, the author of [1] used Envi-met to study the effect of shading devices on outdoor thermal comfort and indoor illuminance. The research was conducted at a university campus in Guangzhou, China. They concluded that shading could reduce the Universal Thermal Climate Index (UTCI), physiological equivalent temperature (PET), and radiant temperature by 5.9 °C, 12.0 °C, and 24.8 °C, respectively. In addition, the authors of [2] studied the impact of a courtyard’s different dimensions and ratios at the Faculties of Agriculture and Education, New Sohag University, Egypt. It was found that the Faculty of Agriculture and Education, with a H/W ratio equal to 1.2, achieved acceptable thermal comfort for students. On the other hand, several studies addressed the indoor thermal comfort inside educational buildings’ spaces. For instance, the authors of [3] surveyed university students to assess the indoor thermal comfort of naturally ventilated classrooms in Bangladesh. Results revealed that the mean values of air temperature, wind speed, and relative humidity were 31 °C, 0.8 m/s, and 78%, respectively.

1.1. Background and Literature

1.1.1. Improving Outdoor Thermal Comfort in Educational Buildings

Furthermore, studies have proposed novel strategies for improving the thermal comfort of outdoor spaces in educational buildings. For example, the authors of [4] studied the campus of George Institute of Technology, USA. They concluded that a highly dense tree canopy has the potential to reduce air temperature by 3.77 °C. Further, the authors of [5] proposed nine passive strategies to improve the outdoor thermal comfort at a public school with an E-shaped style in New Assiut City. The results revealed that the PET value was reduced by 18.6 °C by applying the strategy of hybrid diagonal staggered shading with trees. The authors of [6] studied the effect of vegetation in courtyards of educational buildings on outdoor thermal comfort and energy performance. It was found that the tree configuration could decrease the total cooling energy demand by 7.52 kWh/m2 and discomfort hours by 12.5%. The authors of [7] used Envi-met to evaluate microclimate parameters on the university campus in Kuala Lumpur, Malaysia. It was found that, because of shading and vegetation, the outdoor space can improve the comfort level. Furthermore, the importance of urban geometry and shading in outdoor spaces has been investigated using Envi-met and Rayman for calculating PET by the authors of [8]. The results demonstrated that urban shading could reduce mean radian temperature (MRT) and PET by 34 °C and 17.6 °C, respectively.
Nevertheless, the authors of [9] proposed eight vegetation scenarios to improve outdoor thermal comfort at a public elementary school in Riyadh, Saudi Arabia. Results revealed that applying 10 m high trees could reduce air temperature (Ta), mean radiant temperature (Tmrt), and Universal Thermal Climate Index (UTCI) by 3.2 °C, 7.13 °C, and 17.95 °C, respectively. In addition, the authors of [10] investigated the impact of well-defined boundary spaces on the outdoor thermal comfort of university campuses in Eastern China. The result was a set of design guidelines for variables that impact spatial thermal comfort. The authors of [11] monitored a university campus to find the relationship between PET, the Predicted Mean Vote (PMV) index, and the real thermal sensation in Birjand, Iran. They concluded that PET is significantly correlated with the real thermal sensation, with a comfortable range between 16.4 °C and 25.3 °C. Meanwhile, the authors of [12] conducted a questionnaire and assessed the UTCI. The aim was to evaluate the outdoor thermal comfort at an elementary school campus in Guangzhou, China. They concluded that tree planting is the most efficient strategy for improving outdoor thermal comfort.

1.1.2. Energy Conservation Methods Inside Educational Buildings

Moreover, many studies have addressed passive retrofitting strategies to improve energy efficiency and reduce energy demand inside educational buildings. The authors of [13] proposed energy efficiency strategies for building envelope thermal performance and sun shading to reduce energy consumption at universities in China after field measurements, simulation processes, and questionnaires. It was revealed that, while using insulating sun shading systems, the annual cooling and heating load would decline by 45.1% and 38.6%, respectively. Additionally, the authors of [14] evaluated the energy consumption in three buildings at the Federal University of Itajubá, Brazil, to study the effect of building materials, activities, and weather conditions. It was found that the reduction of annual energy consumption and CO2 was 3.6–17.7 MWh and 0.5 tCO2eq. In addition, the authors of [15] assessed the thermal comfort and energy performance inside the educational building with the shading system with phase change material (PCM). The results revealed that the annual cooling energy consumption declined by 44%. Moreover, the authors of [16] conducted field measurements and surveyed students’ views regarding the thermal comfort inside university classrooms. They concluded that the acceptable range of temperature was 21.3–25.4 °C and 29.6 °C in winter and summer, respectively, and the CO2 concentration level was 2500 ppm.
Additionally, the influence of energy rationalization on optimizing the building envelope was investigated in the Mechanical Engineering Department building at Ain Shams University, Egypt, by [17]. It was found that the retrofitting strategy contributed to a decline in the annual energy consumption by 20%. The authors of [18] studied the impact of shading and glazing configuration on indoor thermal comfort and CO2 concentration in educational schools in New Zealand. The results show that using dynamic shading and glazing could decrease Ta by 1.6–3.0 °C and CO2 by 50%. The authors of [19] studied two courtyards as a passive strategy for improving indoor thermal comfort and energy consumption in the school building in Argentina. The results show that energy consumption was reduced by 21%. Furthermore, the authors of [20] proposed a set of façade retrofitting strategies to enhance energy efficiency in Saudi school buildings. The results revealed that the retrofitting strategies could reduce the cooling energy, lighting energy, and annual energy costs by ratios of 17%, 49%, and 18%, respectively. Additionally, the authors of [21] measured the indoor air temperature, relative humidity, CO2, PM10, and PM2.5 inside the classes of the Technical University, India, to investigate the indoor air quality (IAQ). Consequently, the range of PM10 was between 1.8 μg/m3 and 159.7 μg/m3, and the range of PM2.5 was between 18.2 μg/m3 and 108 μg/m3.

1.2. Research Objectives

However, the critical role played by the university buildings involves shaping students’ personalities and providing a comfortable social climate. There is a research gap in investigating and providing methodologies for improving outdoor and indoor thermal comfort together at the university buildings in Egypt. Nevertheless, the discomfort issues, such as high air temperature and high incidence of solar radiation inside the courtyard and high indoor temperatures of educational spaces, have been determined by conducting field measurements and questionnaire surveys inside the Faculty of Agriculture at New Sohag University, Sohag, Egypt. Therefore, this study aims to improve students’ outdoor thermal comfort in university courtyards, in addition to reducing energy consumption in university buildings in hot arid climates. This helps to encourage students to practice social activities in outdoor spaces. Hence, there is a need for using Envi-met and DesignBuilder to simulate and investigate the effect of a set of outdoor mitigation solutions and indoor retrofitting strategies. Consequently, a coupled simulation methodology was proposed by using Envi-met and DesignBuilder software programs, which contributed the following:
(a)
Improving students’ thermal comfort in open courtyards;
(b)
Increasing social interaction in open courtyards;
(c)
Conserving energy in an educational university building.
Moreover, the novelty of this study lies in integrating field monitoring and conducting a questionnaire with coupled simulation methodology to improve outdoor thermal comfort by applying six different improvement solutions and to reduce indoor energy consumption by applying five retrofitting strategies. Consequently, the optimal improvement solution and the retrofitting strategy could be obtained to achieve the study’s main aim. Based on the previous study, there is a need for using Envi-met and DesignBuilder to implement a coupled simulation methodology to simulate and investigate the effect of a set of outdoor mitigation solutions and indoor retrofitting strategies in a university building in a hot arid region. Thus, this study is integrated with some of the previous studies, such as [2,4,7,10,11,13], in studying several mitigation solutions, but this study distinguishes from them by applying new hybrid mitigation solutions, such as a hybrid between the vegetation area and pergola-shading and a hybrid greenery shading (metal mesh shading panels covered with ivy plants). Ultimately, this proposed methodology aims to support the architects and urban designers during the early design stages in providing the appropriate environmental solutions for the university courtyards and buildings in hot arid climates. This paper is structured below, starting with the methodology in the next Section 2 (case study and the proposed methodology), then the results and discussion in Section 3, and finally the conclusion section.

2. Methodology

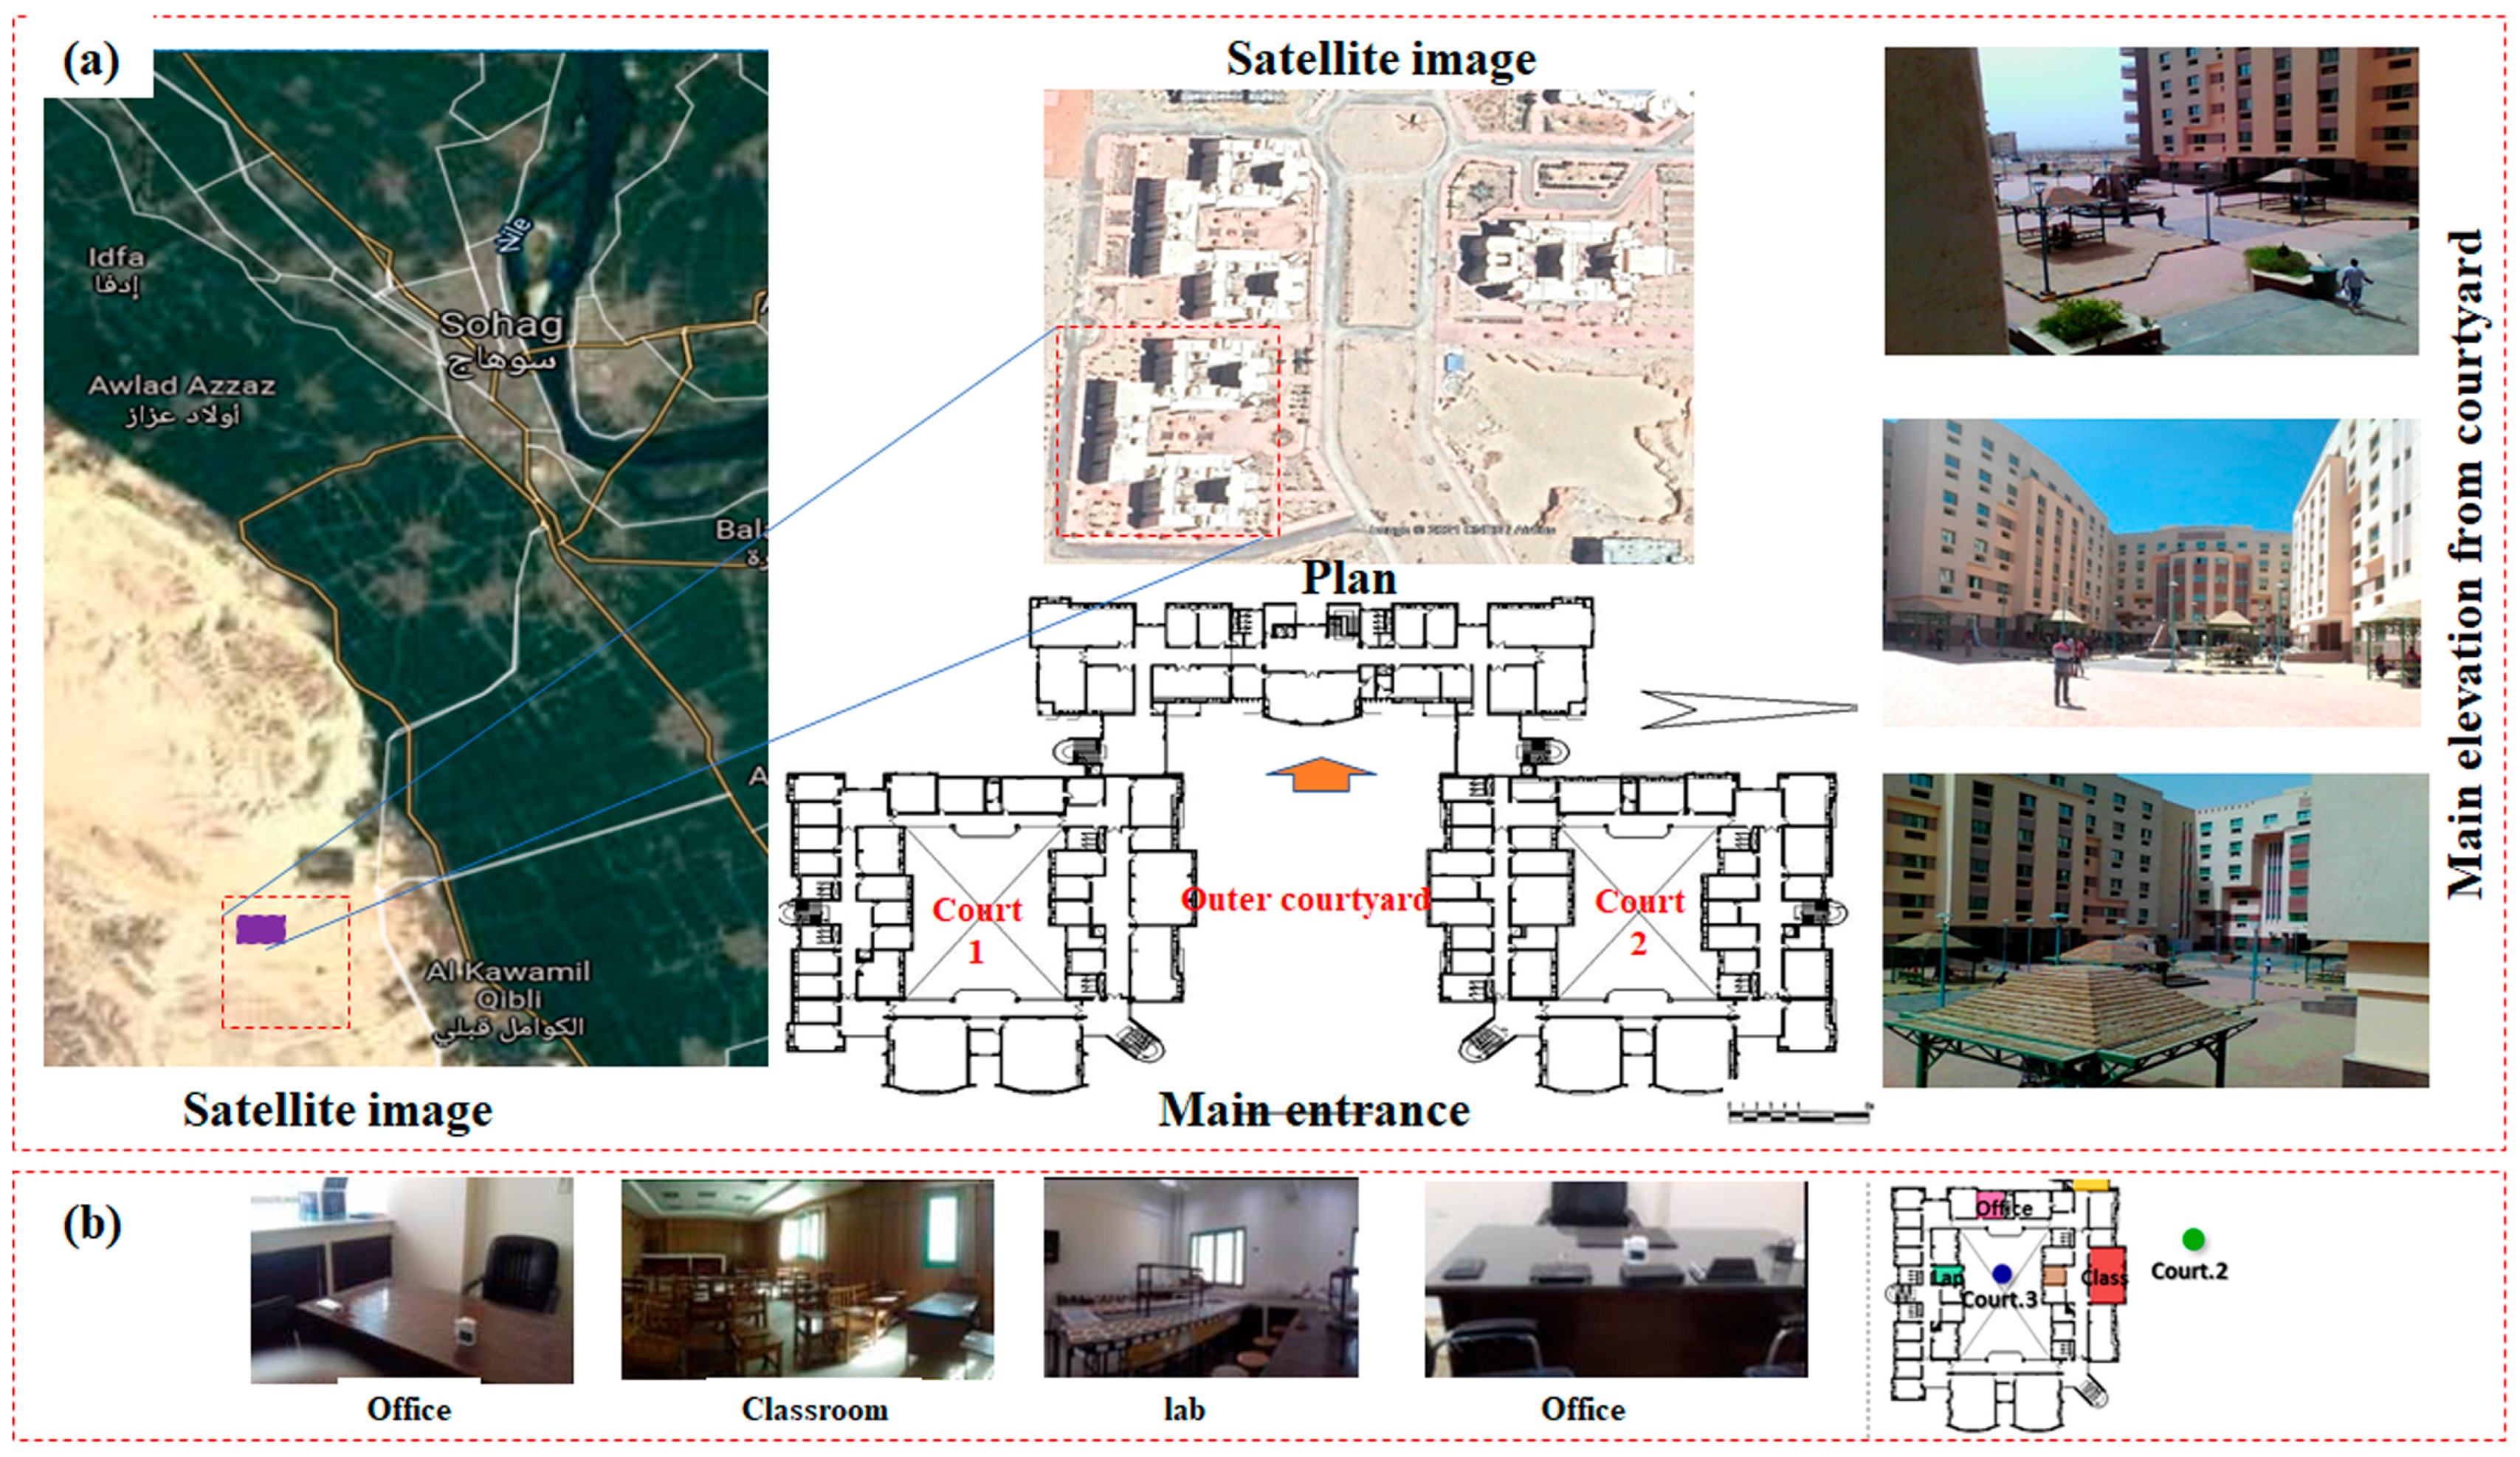
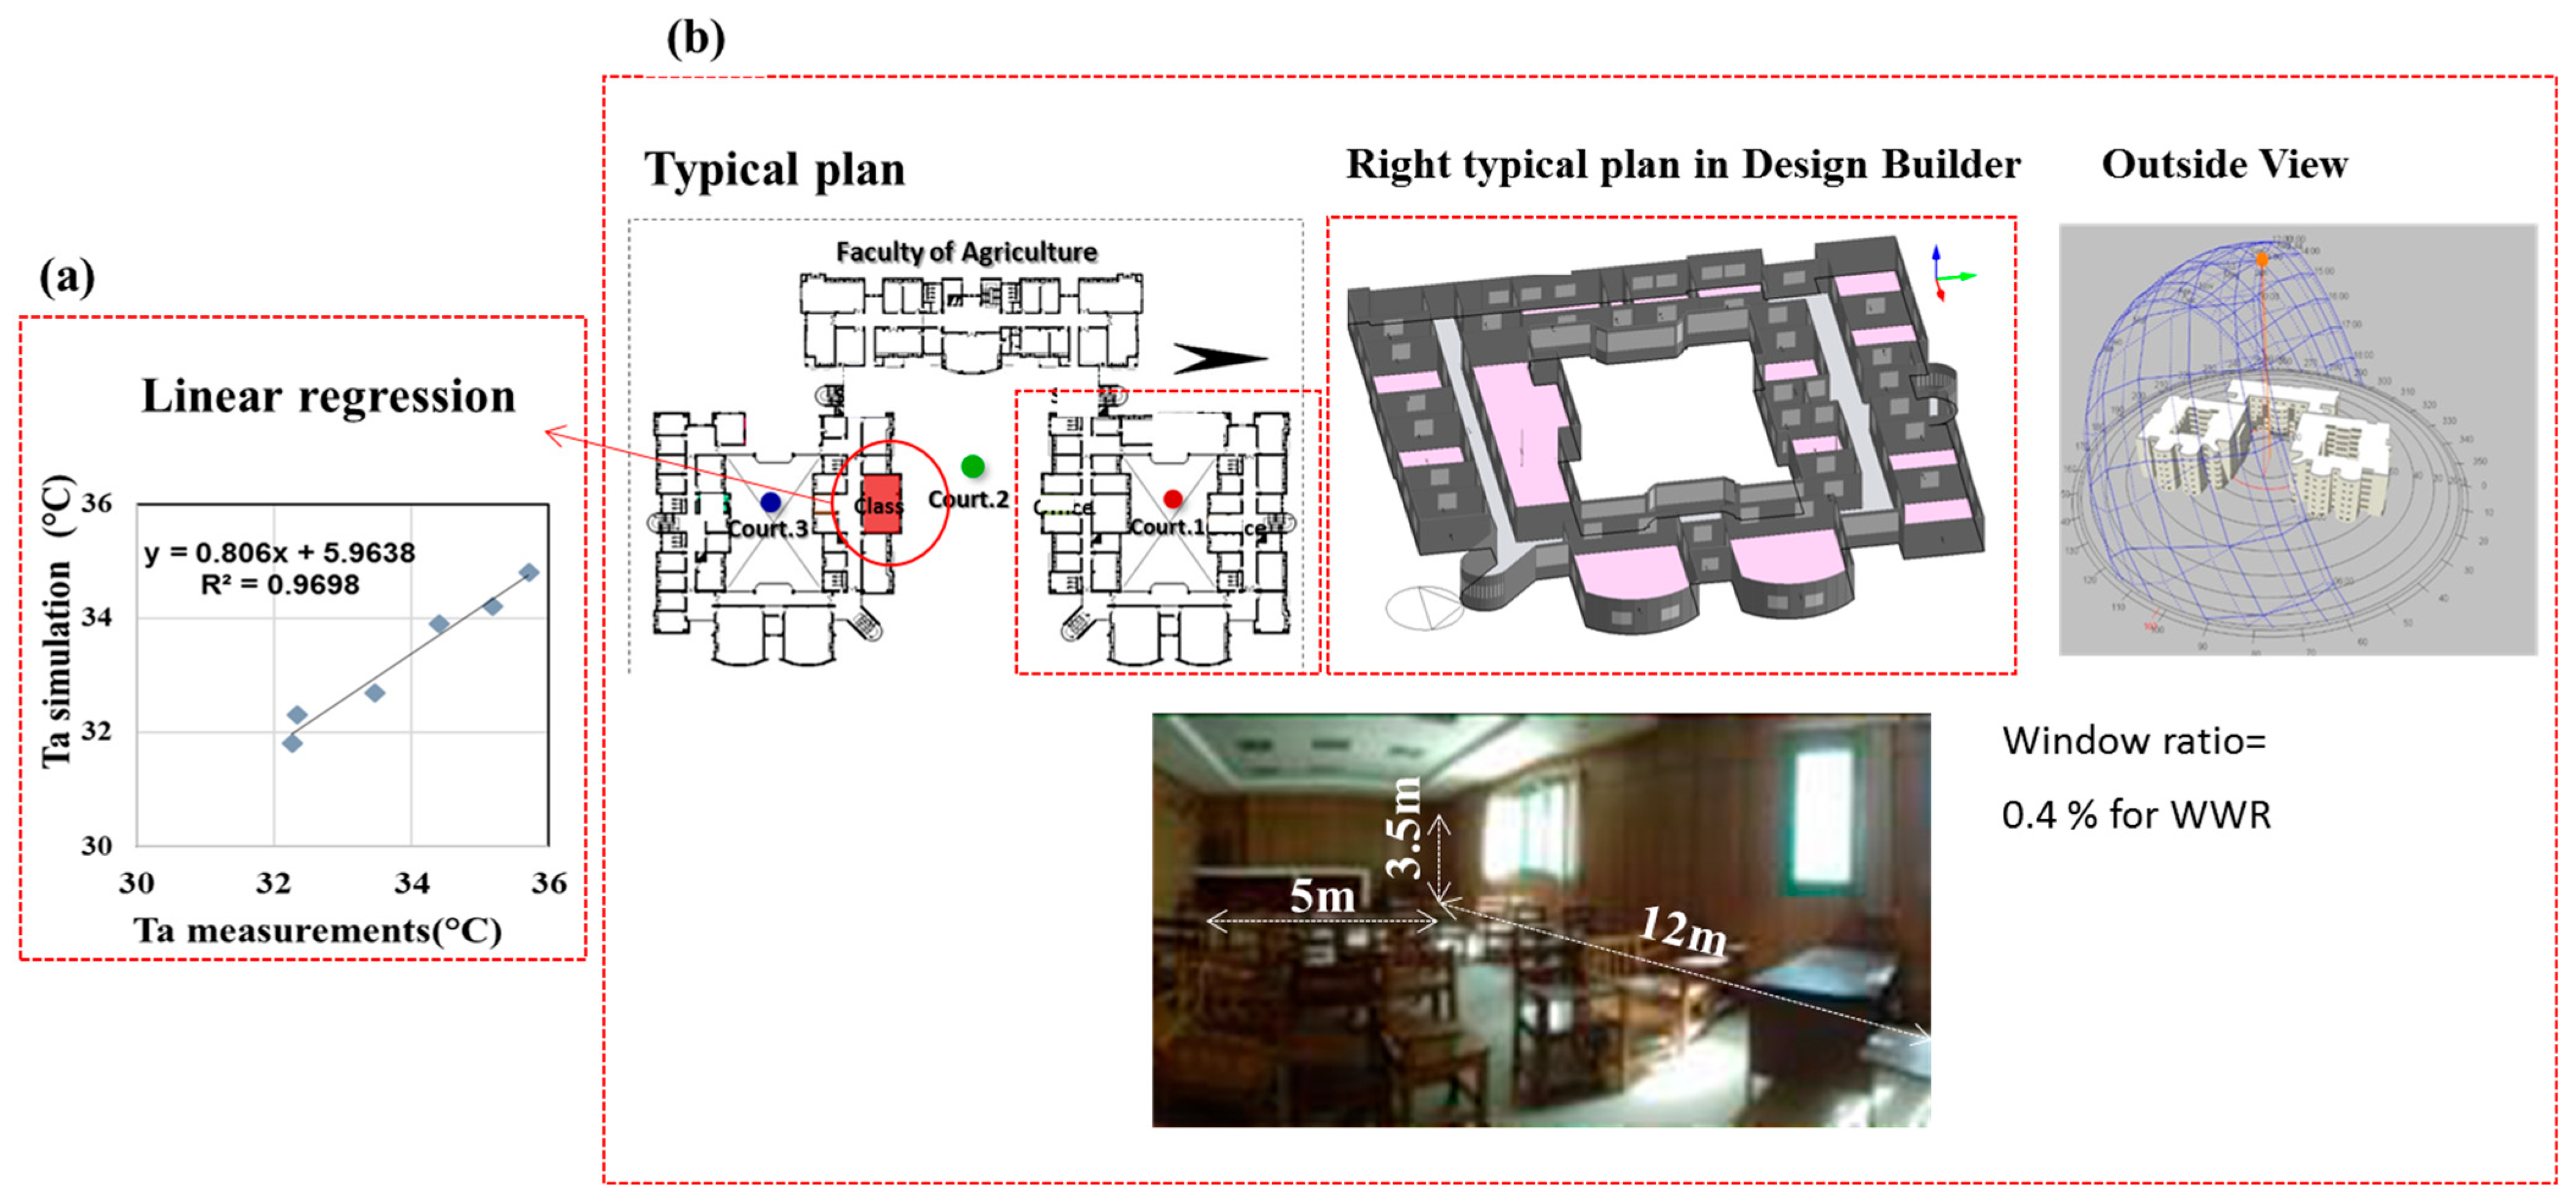
2.1. Case Study Description

Sohag City is located in southern Egypt with a longitude of 26.5591° N, 31.6957° E. Sohag City is characterized by a clear sky throughout the year, with direct strong solar radiation [22]. Therefore, the case study of the Faculty of Agriculture at New Sohag University was chosen as a model for university buildings established in hot arid climates. It consists of five floors, with a floor area of 3147 m2 and a ground floor consisting of three courtyards, two closed courtyards and an open middle courtyard. A set of classes, labs, and staff offices overlook these courtyards. Figure 1 shows the location of the study area concerning Sohag City, New Sohag University, and its plan, elevation, and different outside photos. The courtyard ratio (H/W) is 0.7 for two closed courtyards, and the H/W is 1.2 for the open middle courtyard, which is the study area. Spaces with different functions (classes, labs, offices) were used for monitoring. The average dimensions for most of the classes, labs, and offices are 60 m2, 24 m2, and 24 m2 respectively. These spaces have different orientations with 0.4% for WWR for outside windows. The materials used inside the middle courtyards are tile interlook and sand in some places under the sitting area. The dimensions of the sitting area are 3 × 3, and it is made from wood with a steel frame. Very few vegetations with short herbaceous plants are used inside the courtyard.

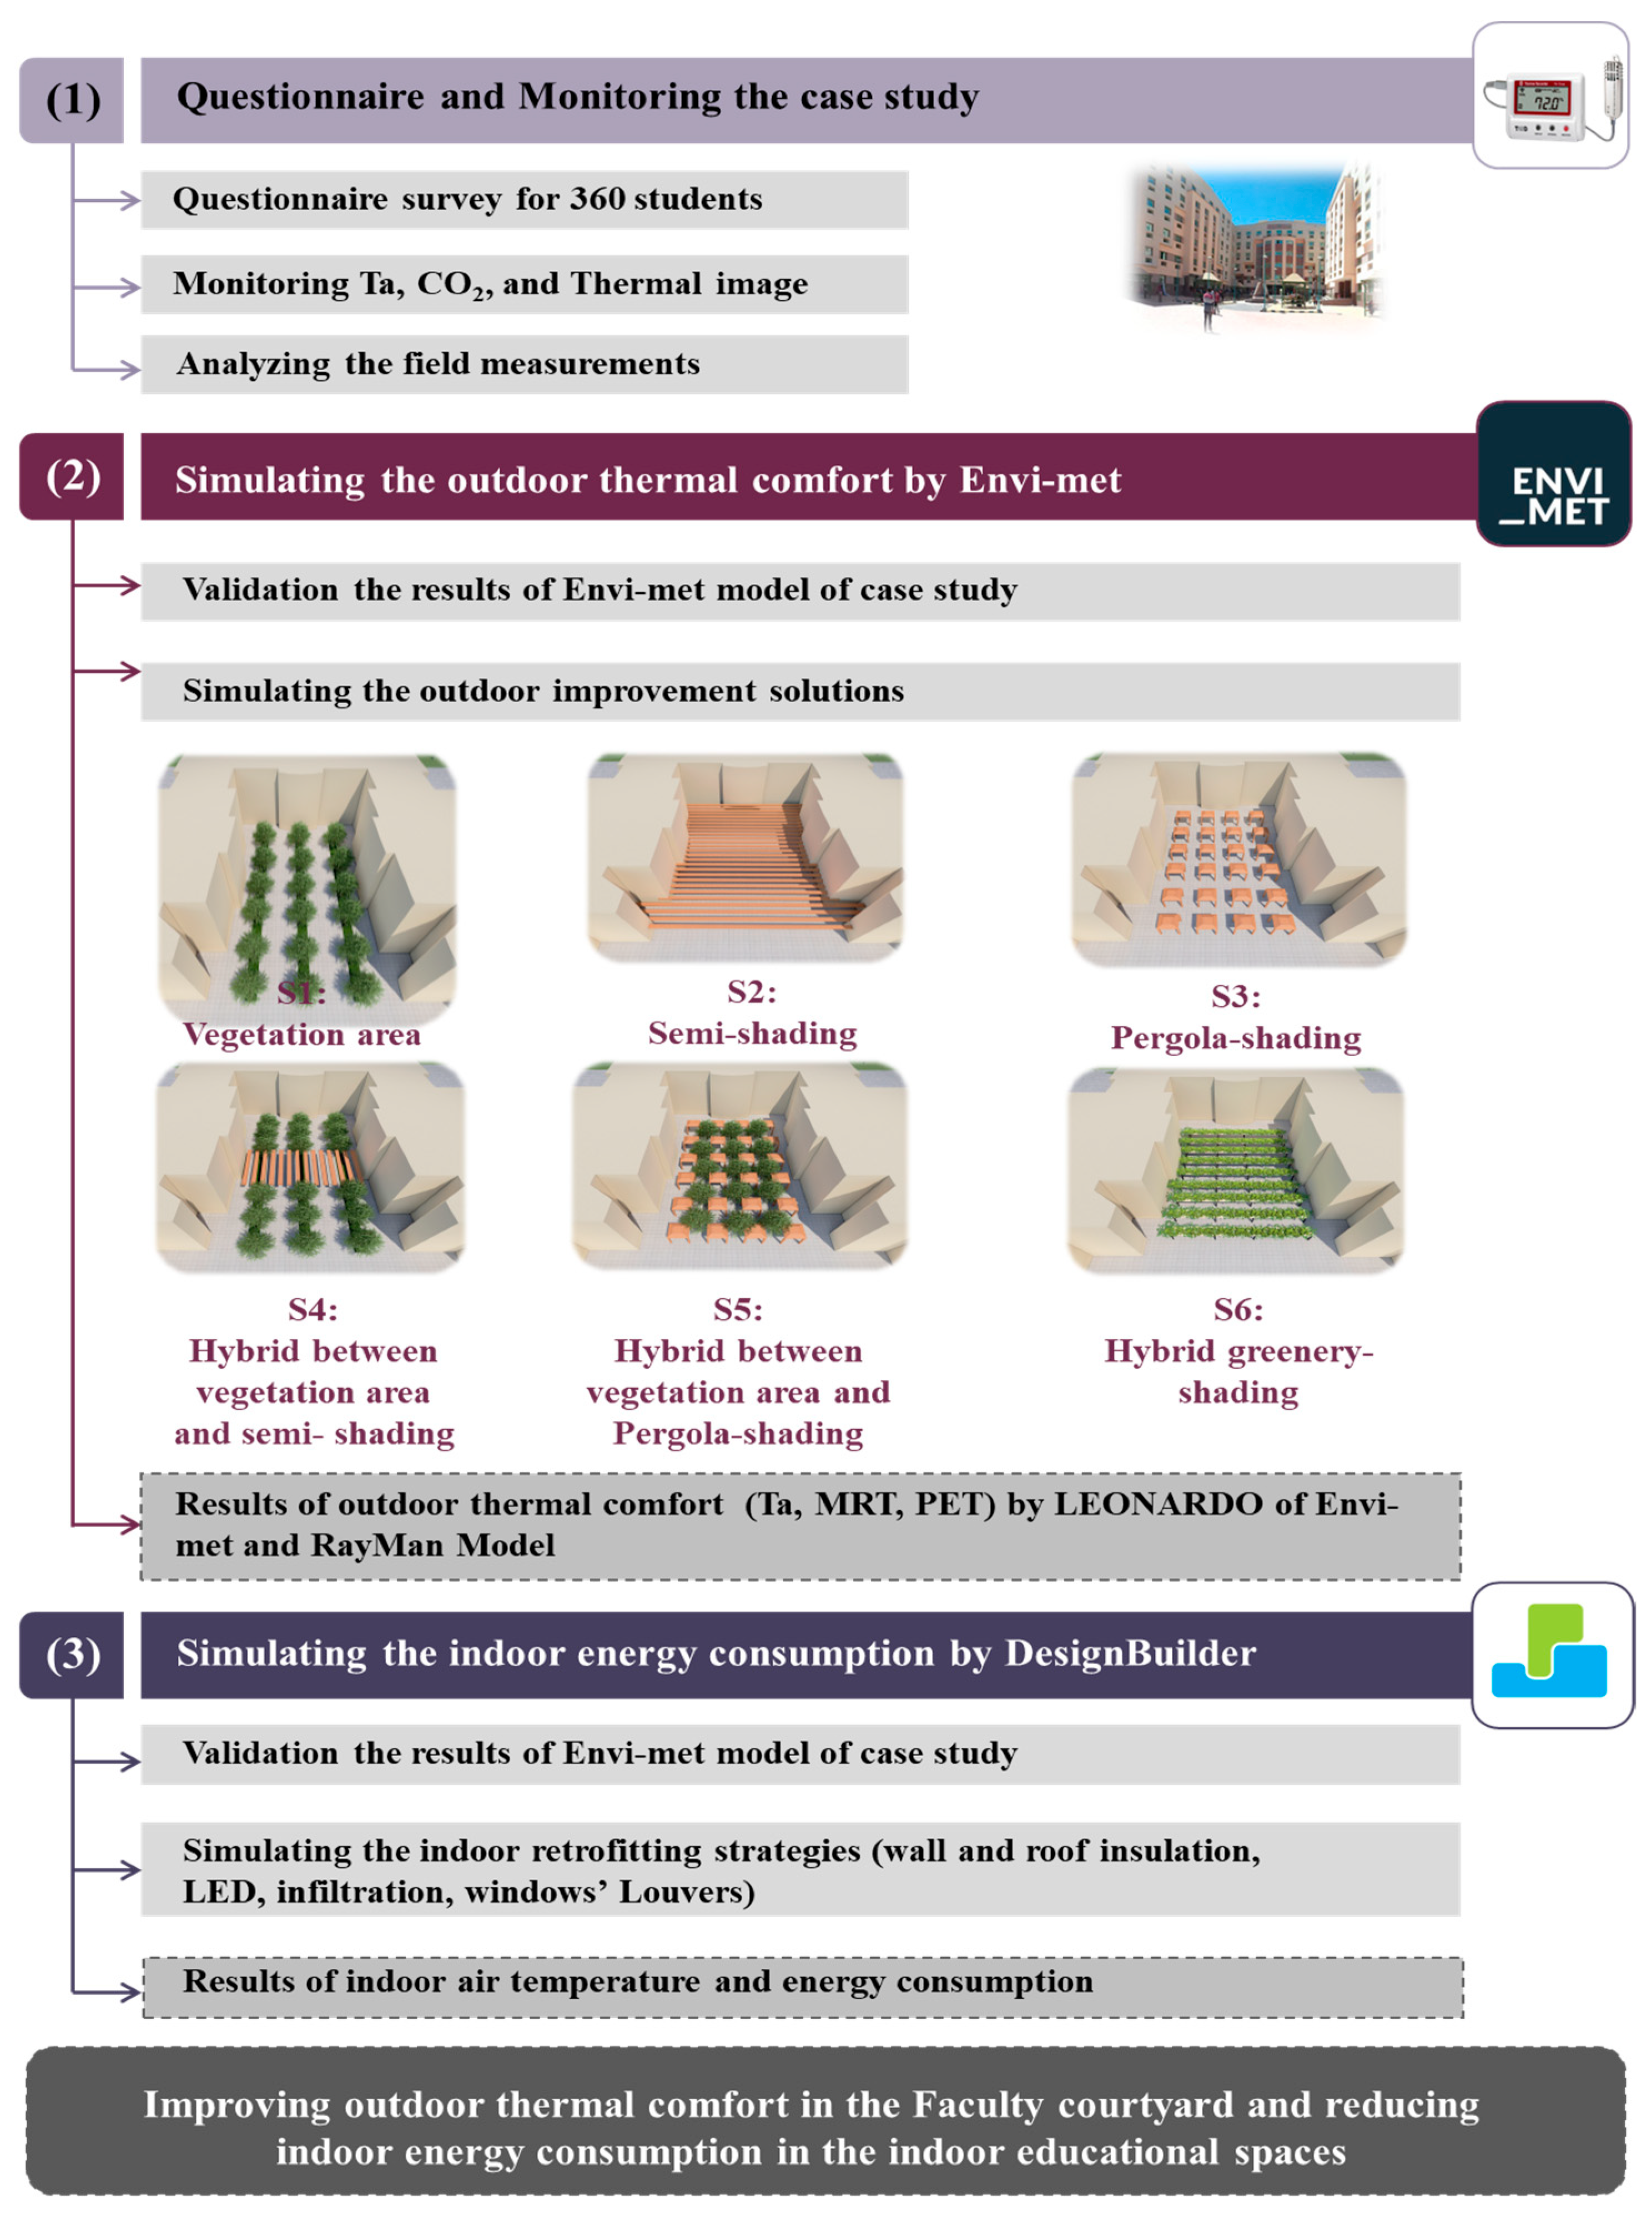
2.2. The Proposed Improvement Methodology

Consequently, this study proposed a coupled simulation methodology to improve the outdoor thermal comfort in the middle open courtyard of the case study and to reduce indoor energy consumption. As shown in Figure 2, the proposed methodology consists of three stages, which are detailed and illustrated in the following sections:
(a)
Monitoring the case study;
(b)
Simulation the outdoor thermal comfort by ENVI-met Version 5.1, (ENVI-met GmbH, Essen, NW, Germany).
(c)
Simulating the indoor energy consumption by DesignBuilder software version (V.5.0.3.007), (DesignBuilder Software Ltd., Stroud, UK).

2.2.1. Stage 1: In Situ Measurements of the Case Study

In the first stage, monitoring was conducted during the hot days at the end of the second semester (May 2018) from 9:00 to 14:00 inside classes in different orientations and outdoors inside the middle open courtyards with existing students. This period was selected due to the increase of the outdoor temperature, before the end of semester and final exam, and as an extension of past research for one year evaluation and monitoring [2]. Measurements from the timespan from 9:00 to 14:00 inside classes were chosen because most lectures are during that period. Measurement locations: A number of spaces overlooking courtyards with different orientations were selected, representing spaces with different functions (classes, labs, offices) to analyze the effect of different orientation on indoor environment. These spaces used natural ventilation and mechanical fans for ventilation. The detailed evaluations for indoors and outdoors were analyzed for one year with a questionnaire survey using 360 effective questionnaires that were randomly distributed to students staying in university courtyards doing a different activity while measurements were conducted [2]. The structure of the questionnaire was based on ASHRAE Standard 55, 2019. The first part contains demographic and student characteristic information. The second section asks about the thermal sensation and their sensation of air humidity and wind speed. The thermal sensation vote (TSV) scale was the traditional ASHRAE 7-point scale (−3 very cold, −2 cold, −1 slightly cold, 0 neutral, 1 slightly hot, 2 hot, 3 very hot). For air humidity, estimation was based on a 7-point scale humidity sensation vote (HSV) (−3 very dry, −2 dry, −1 slightly dry, 0 just right, 1 slightly humid, 2 humid, 3 very humid). For the wind speed, estimation was based on a 5-point scale air velocity vote (AV) (−2 very low, −1 low, 0 enough, 1 high, 2 very high). The third part addresses the source of feeling uncomfortable, such as the reason for discomfort inside the courtyard according to temperature. Questionnaires were distributed for subjective assessment between 1:00 and 2:00 p.m. during the hot period, aligning with the time when most students take their break in the courtyard. Measurements were conducted for different outdoor parameters using the measurement devices to calculate the index of physiological equivalent temperature (PET) that could define the thermal acceptability ranges of students inside the courtyards, taking into account the effect of shading and radiation flux [23]. Additionally, the effects of courtyard design and ratio (H/W) on airspeed and carbon dioxide concentration (CO2) were taken into consideration. Thermal monitoring for the outer environment using thermal images was conducted, and a calculation for the sky view factor was obtained based on the Rayman software 1.2. Thermal image evaluation was conducted to focus on the main problem for student thermal comfort inside the courtyards concerning the material used in the courtyard grounds and the material used for the building façade with heat transfer.

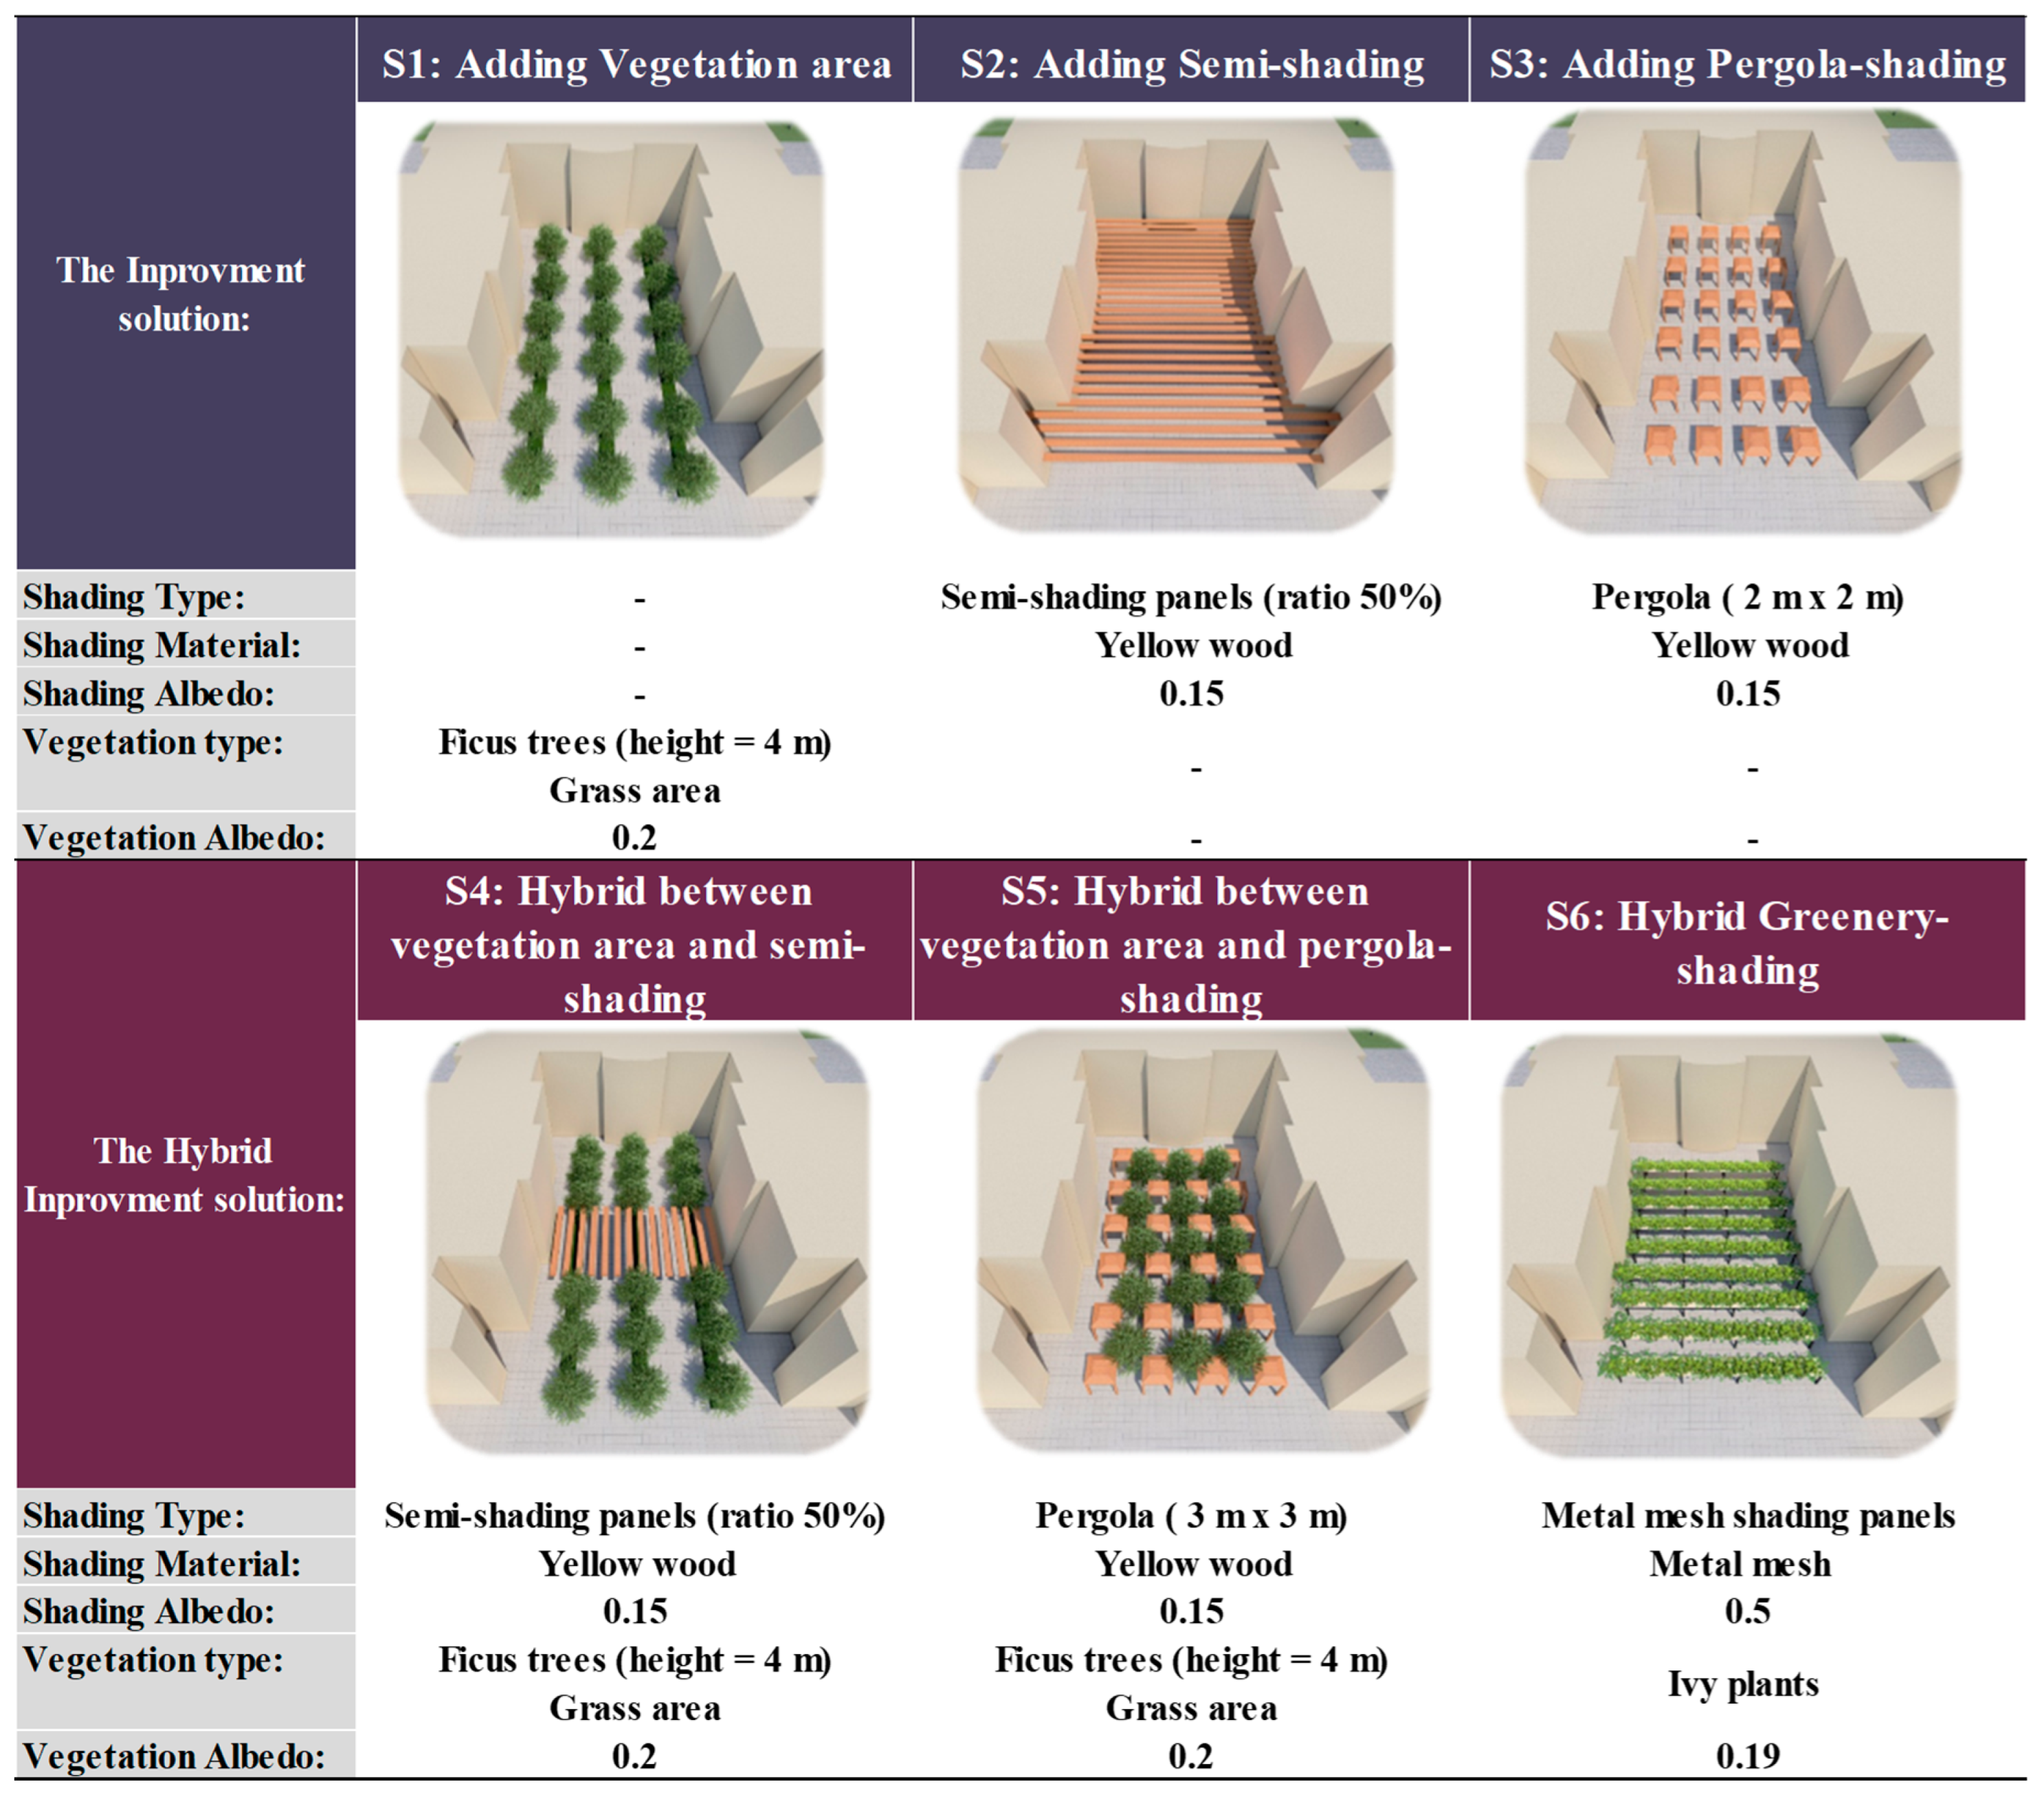
2.2.2. Stage 2: Simulating the Outdoor Thermal Comfort by ENVI-met

In the second stage, Envi-met software version 5.0.3 was used to build a model of the case study and to conduct the simulation process for the middle open courtyard. The validation point was selected in the middle of the courtyard to be exposed to all ambient conditions from the building shade, courtyard components such as shading units, and prevailing wind direction in the courtyard. Thus, the results of the Envi-met model were compared with the field measurements to validate the simulation model during 7 h of the usual study day from 9:00 to 15:00 on 28 May 2018. Therefore, Figure 3 illustrates the coefficient of determination (R2) as equal to 0.93 for air temperature, which indicates successful validation of the model with a strong correlation close to the real conditions based on the past [24]. Based on the questionnaire and field survey, the middle open courtyard includes small shrubs, four small shaded places, and a dark-colored floor, which caused students thermal discomfort. Hence, the middle open courtyard was selected for studying rather than the closed courtyards because of its superior ability to facilitate natural ventilation and, thus, to improve outdoor thermal comfort. Consequently, a set of six improvement solutions was proposed to apply to the middle open courtyard. Additionally, their impact on improving the students’ thermal comfort in the middle open courtyard was investigated by Envi-met. The simulation process was conducted on 1 May 2024 (from 9:00 to 15:00) to be as close as possible to the measurement date in May 2018. Figure 4 elaborates on the characteristics of the six improvement solutions to increase the shading area in the middle open courtyard. There are the following three improvement solutions: adding a vegetation area, adding semi-shading, and adding pergola shading. In addition, the three hybrid improvement solutions are the following: a hybrid between the vegetation area and semi-shading, a hybrid between the vegetation area and pergola shading, and a hybrid greenery shading (metal mesh shading panels covered with ivy plants).

2.2.3. Stage 3: Simulating the Indoor Energy Consumption by DesignBuilder

In the third stage, the model of the Faculty of Agriculture was built using DesignBuilder software version (V.5.0.3.007) based on the material described in Table 1. The study used the specification of material from the real field model, and the U-value was calculated in DesignBuilder simulation based on the real model and material specification. Figure 5a shows the external view of the building in the DesignBuilder software. The model was validated based on the measurement of air temperature in one class on the second floor for one day measurement overlooking the middle courtyards, as shown in Figure 5b. This classroom was taken in the north direction, as most of the classrooms take the north orientation in Sohag University. The calibrated model results in a strong coefficient of determination (R2) equal to 0.96, which has been accepted in the past literature [24]. This produced an actual environment of the educational building to investigate different retrofitting strategies for improving energy consumption. The building model was calibrated using indoor measurements from 9:00 to 14:00 inside classes overlooking courtyards with different orientations, representing spaces with different functions (classes, labs, offices). The five retrofitting strategies were proposed for the DesignBuilder model to reduce building annual energy consumption and heat transfer to the indoor environment. The five strategies are the following: (a) adding wall insulation, (b) adding wall and roof insulation, (c) adding window louvers for different orientations, (d) adding air infiltration, and (e) replacing the existing lighting system with LED units, besides combining all strategies.

3. Results and Discussion

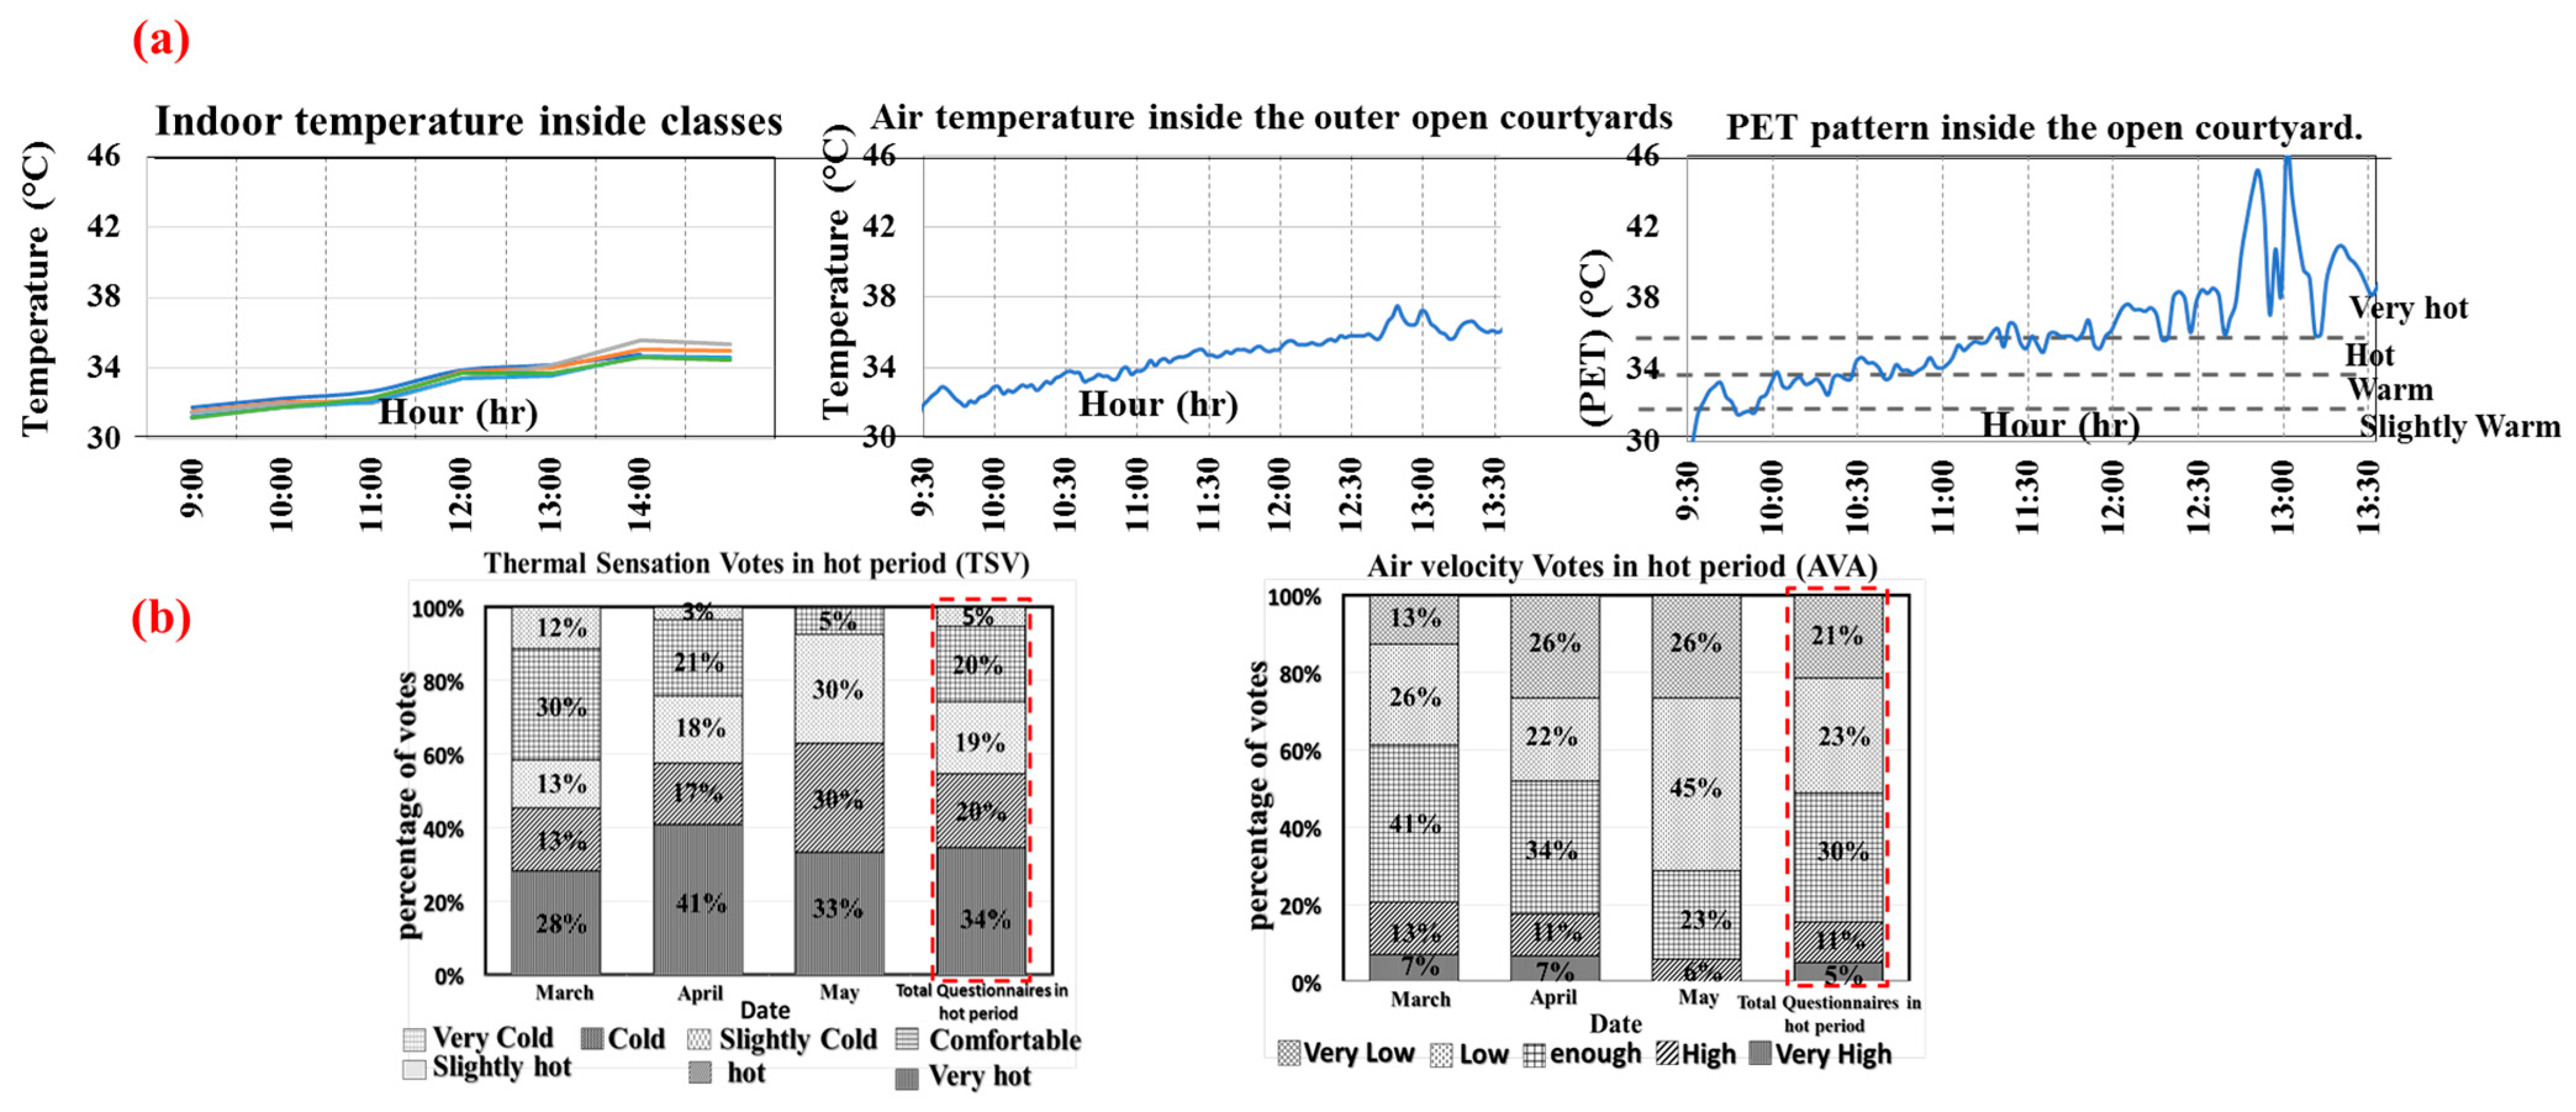
3.1. Evaluation of In Situ Measurements of Air Temperature, Questionnaire, and PET Thermal Comfort Index

Figure 6 shows the following temperature and questionnaire survey results of the agriculture building: (a) the indoor temperature inside classes, the air temperature inside the outer open courtyards, and the PET pattern inside the open courtyard, (b) the results of the thermal sensation vote and air velocity vote inside the courtyards of buildings. It was concluded that air temperature inside different classes of the second floor has nearly the same pattern, and most indoor temperatures are high and away from the 90% acceptability limits of the Adaptive Comfort Standard (ACS) of [25] using natural ventilation. Additionally, the thermal performance inside the middle courtyard shows warm and strong heat stress, especially after 12:00 pm, due to less shading and trees in the outer open courtyards. High outdoor air temperature strongly affects students’ outdoor thermal comfort while practicing different social activities inside the courtyards. Additionally, during the hot period, thermal satisfaction in the Faculty of Agriculture courtyard was not achieved for the majority of students. Only 20% reported feeling “neutral” regarding the temperature, while 73% perceived it as “slightly to very hot.” This dissatisfaction is primarily attributed to the courtyard’s H/W ratio of 0.7, leading to a low sky view factor (SVF) and a confined layout. These factors contribute to increased solar radiation, lack of vegetation, and limited air movement, which are exacerbated by the closure of shared courtyard doors. Consequently, 30% of students perceived the air speed as “low,” while just 23% found it “appropriate,” indicating insufficient natural ventilation. To investigate the urban morphology and outdoor thermal comfort, SVF was used as an indicator based on the calculation of Rayman. The high value of Sky View Factor (SVF) equal to 0.84 maximizes the solar radiation coming into the open courtyard, which affects the increase of air temperature and heat stress for students.

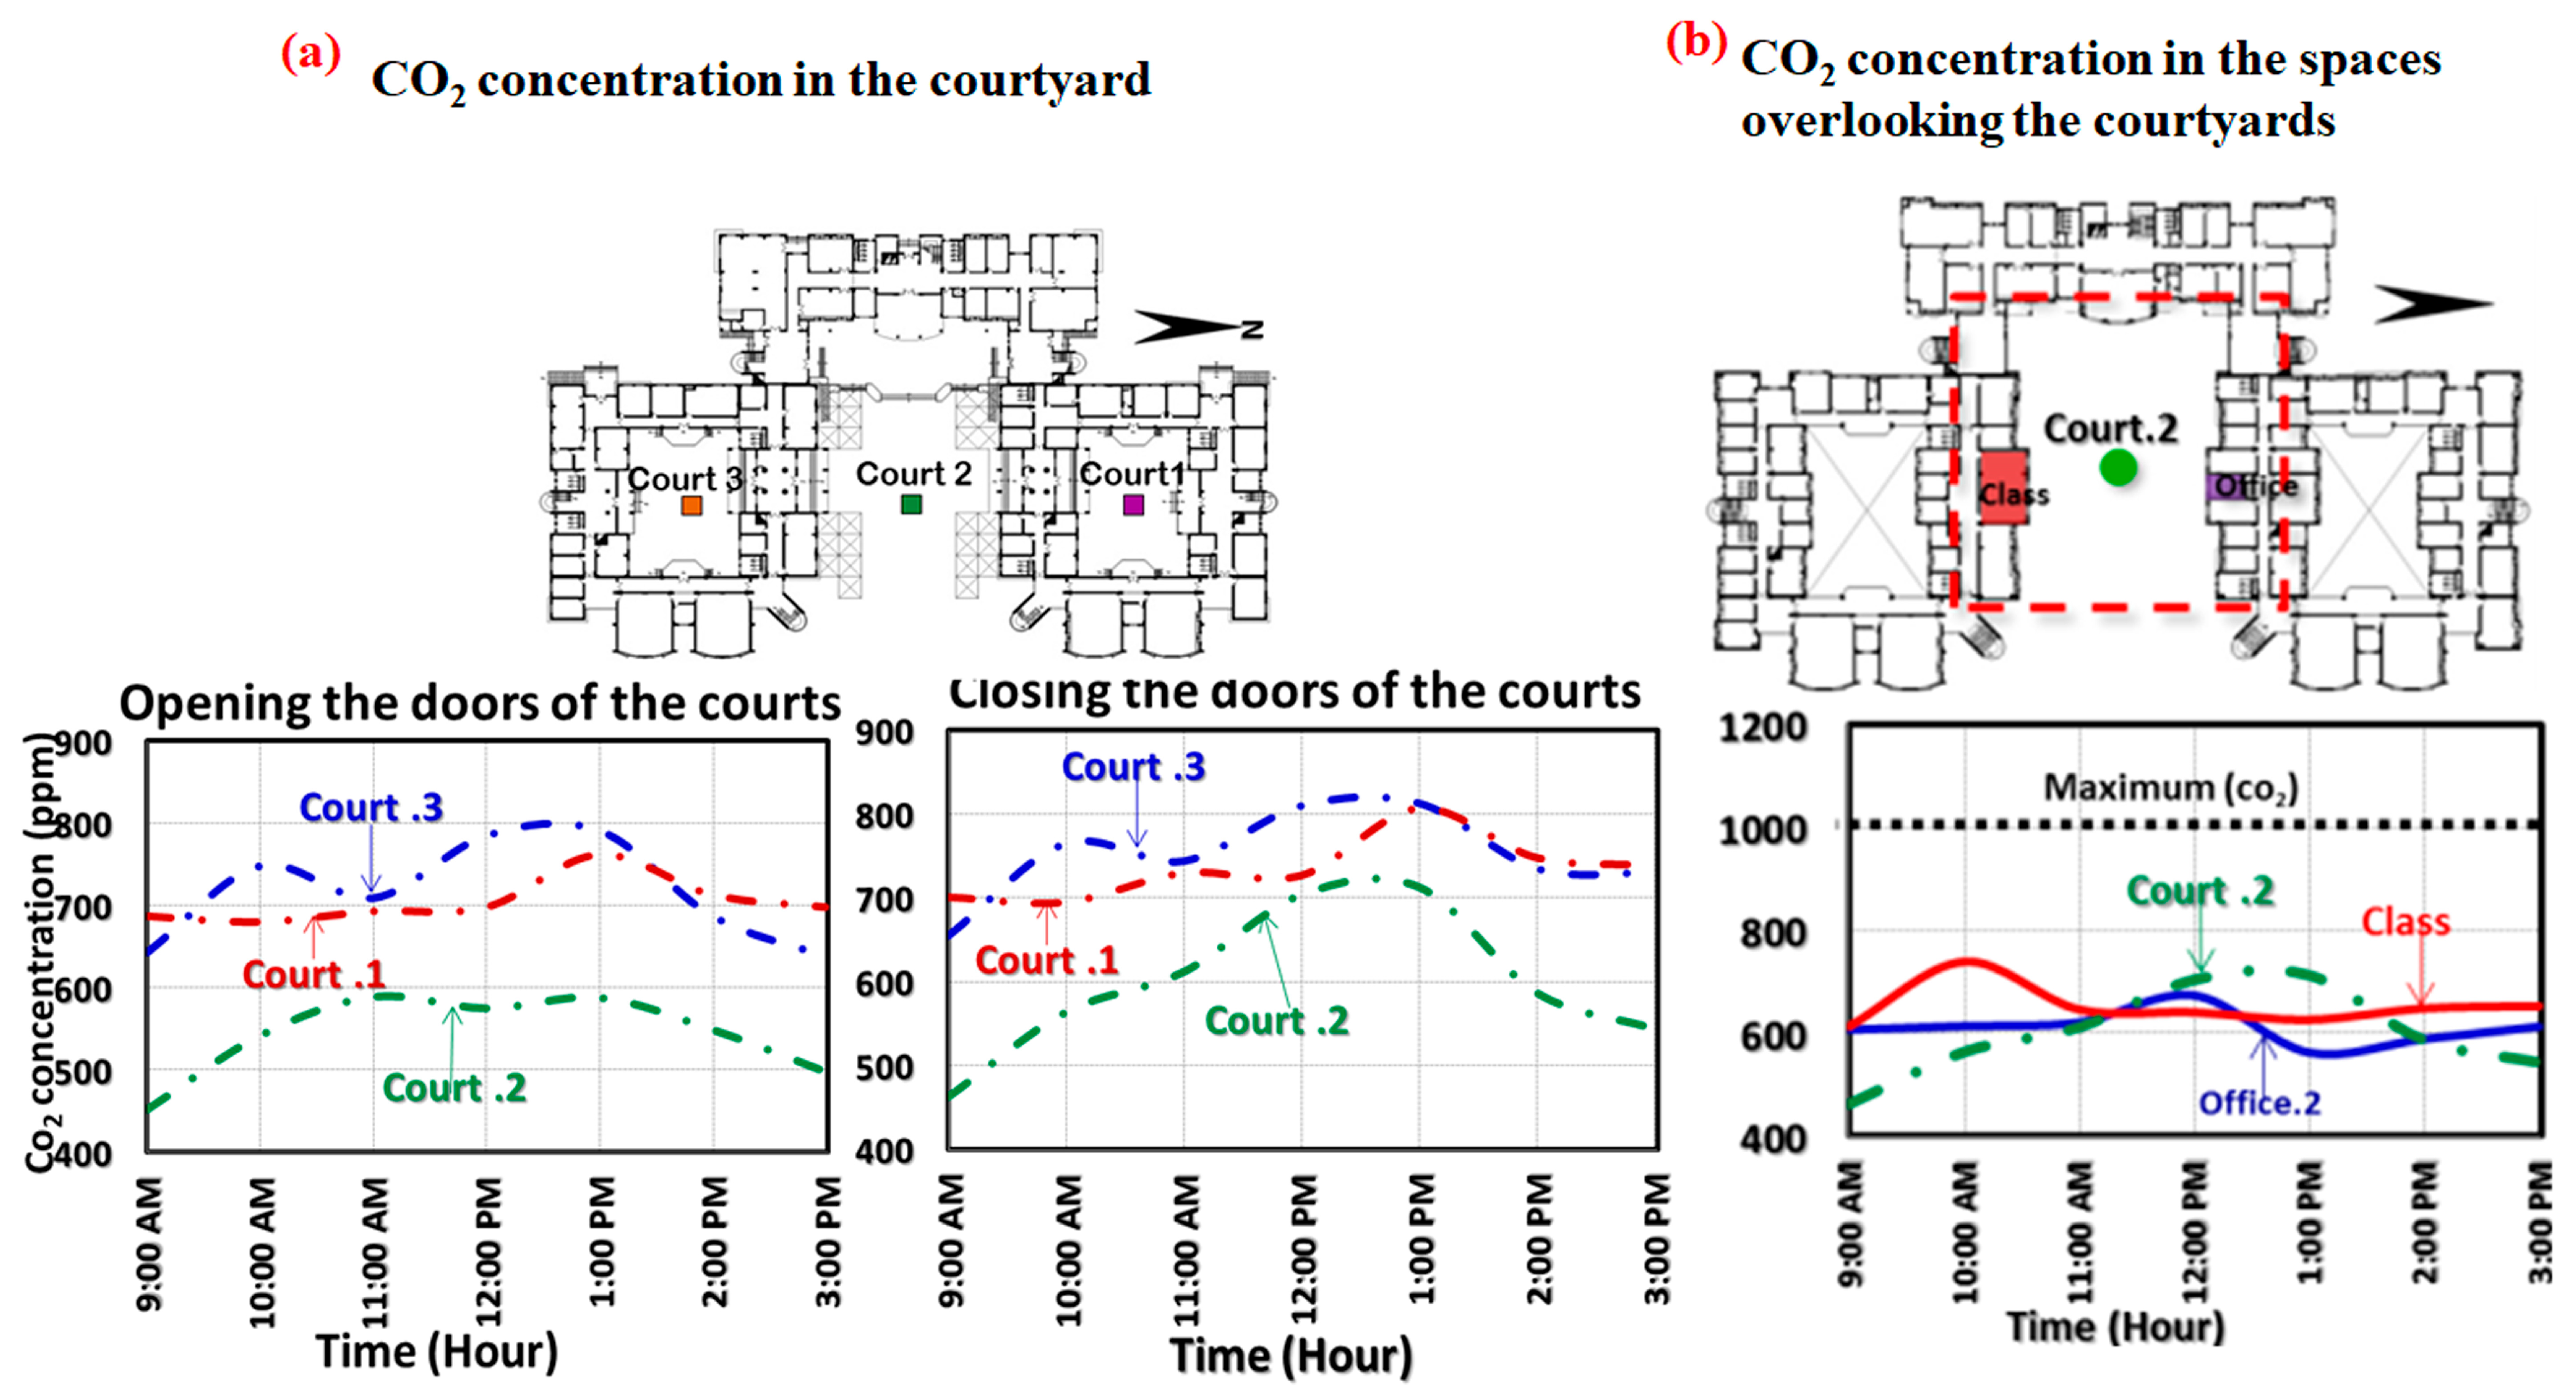
3.2. Analysis of In Situ Measurements of Airspeed and CO2 Concentration

The air speed inside the courtyard was measured concerning its carbon dioxide concentration and its effect on student thermal comfort. Figure 7 shows the values of CO2 concentration (a) inside three courtyards with different aspect ratios, and (b) two classes overlooking the middle courtyard of the Faculty of Agriculture. It was concluded that the level of CO2 concentration decreases in different courtyards when opening the entrance doors with cross ventilation, and this is equivalent to an air speed equal to 3.0 m/s. It was observed that the courtyard with an aspect ratio equal to 1.2 achieved high air speed with low CO2 concentration, as shown in Figure 7a. The middle courtyard achieved the lowest average CO2 concentration, with an average of 550 ppm and 600 ppm during the opening and closing of the connection with other courtyards, respectively, and this is higher than the standard according to [26]. According to ASHRAE Standard 62.2-2019 [26], the baseline outdoor CO2 concentration is assumed to be 1000 ppm, which is typically used as a reference value for outdoor air in ventilation calculations. This causes the rise of CO2 concentration (960 ppm) in the class overlooking the middle courtyard with a H/W ratio equal to 0.7 due to not opening windows in the presence of students.

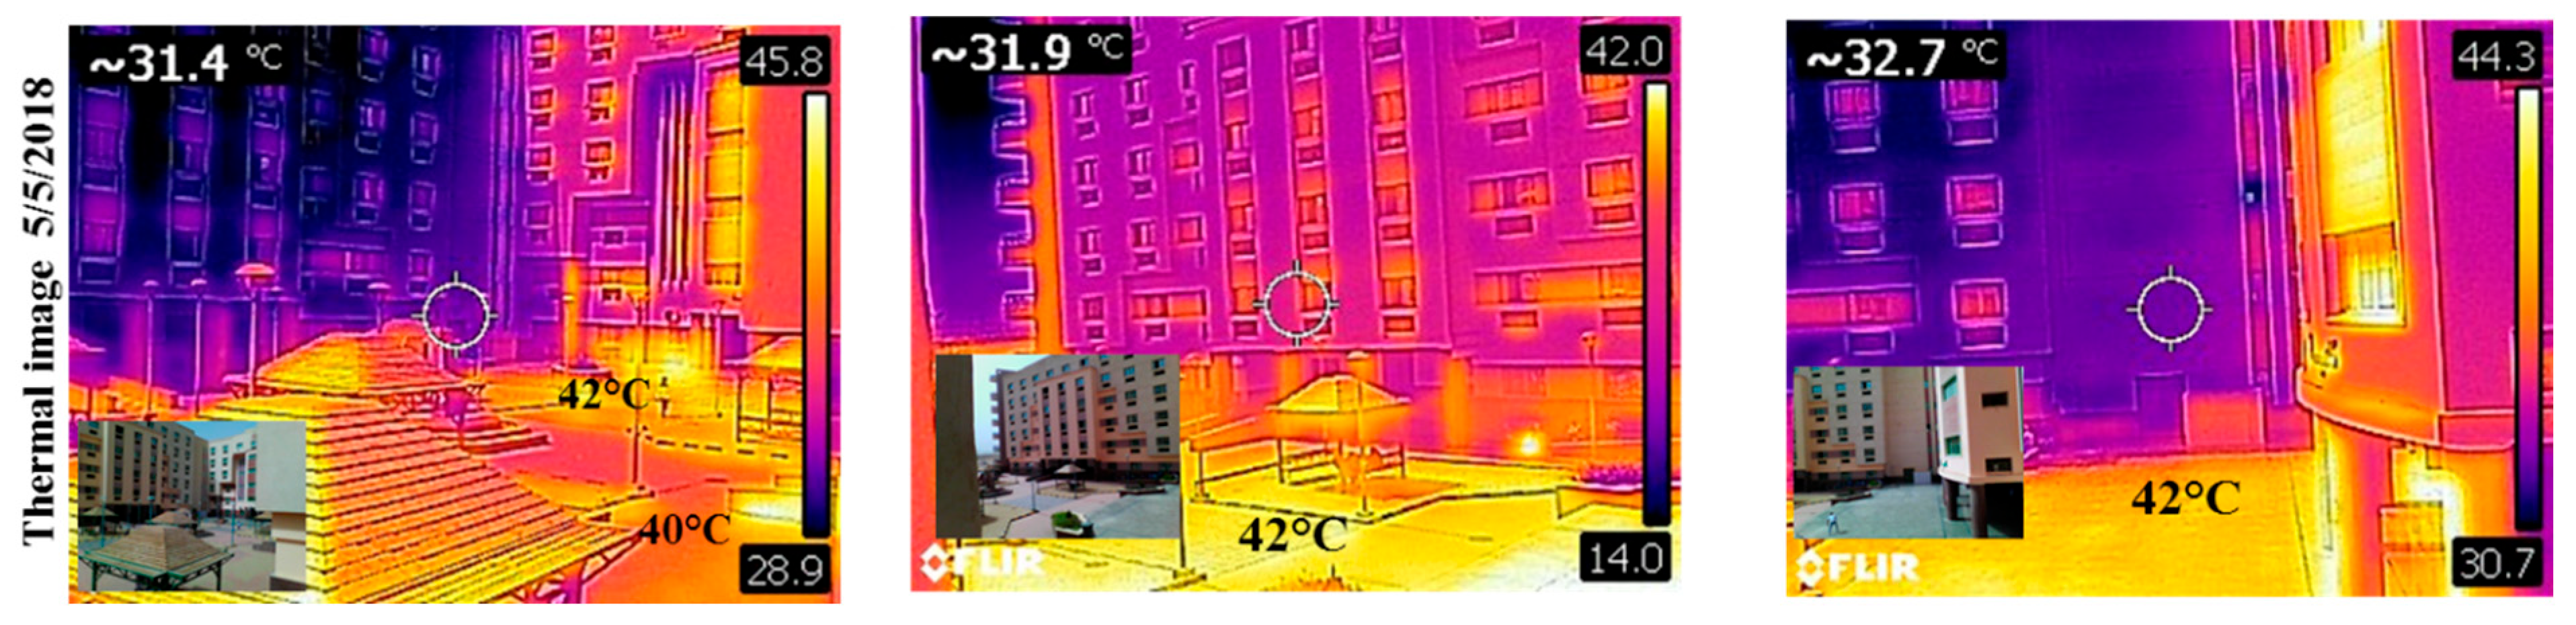
3.3. Evaluation of In Situ Measurements of Thermal Images in the Courtyard

The thermal image was used to analyze the surface temperature for different materials in the building and urban canyons, including the ground with different materials and vegetation. Additionally, it was used for the diagnosis of the current situation concerning the material used and the effect of heat transfer from material used inside the courtyards and the material used for the building façade inside the courtyards. The evaluation was conducted using thermal imaging to improve the weak point using simulation software. Figure 8 shows a thermal image inside the middle courtyard. The ground surface temperature of the outer courtyards was very high, with an average temperature of 41 °C, while the surface temperature under the shaded area (pergola) decreased to 27 °C. High surface temperature for the courtyard ground increases air temperature and reflects heat to students causing students’ discomfort. This is due to the use of dark tiles in most ground areas that absorb and release heat to the surroundings. Additionally, low air speed in the courtyard, while closing the connection with other courtyards, causes more heat release to the air temperature inside the courtyard and adds to student discomfort. High outdoor surface temperature causes high heat release and transfer to the indoor environment and discomfort to students. Based on a questionnaire survey for students staying inside the middle courtyard, more than 73% felt discomfort, “slightly too hot”. This caused students’ dissatisfaction, for most of the students, regarding high solar radiation and no shading for the courtyard. SVF in the middle courtyard is equal to 0.84. This increases the solar radiation received in the courtyard, which increases outdoor air temperature. The dark tile inside the courtyard emits heat to the students inside the courtyard, as does the absence of trees. Based on the monitoring, questionnaire survey, and thermal analysis of the courtyard and classrooms, the increase of outdoors with low tree density and shading was correlated with student thermal comfort. Additionally, high indoor air temperature correlated with student thermal comfort and high heat transfer. The simulation sections help to solve the problem that appears in the evaluation of the thermal image. Therefore, two numerical simulations were used. First numerical simulation using the Envi-met tool was used to improve student outdoor thermal comfort to increase social interaction based on three strategies inside the middle courtyards. Second, the DesignBuilder model was used to simulate retrofitting strategies to reduce heat transfer inside the classroom and achieve a low-energy building.

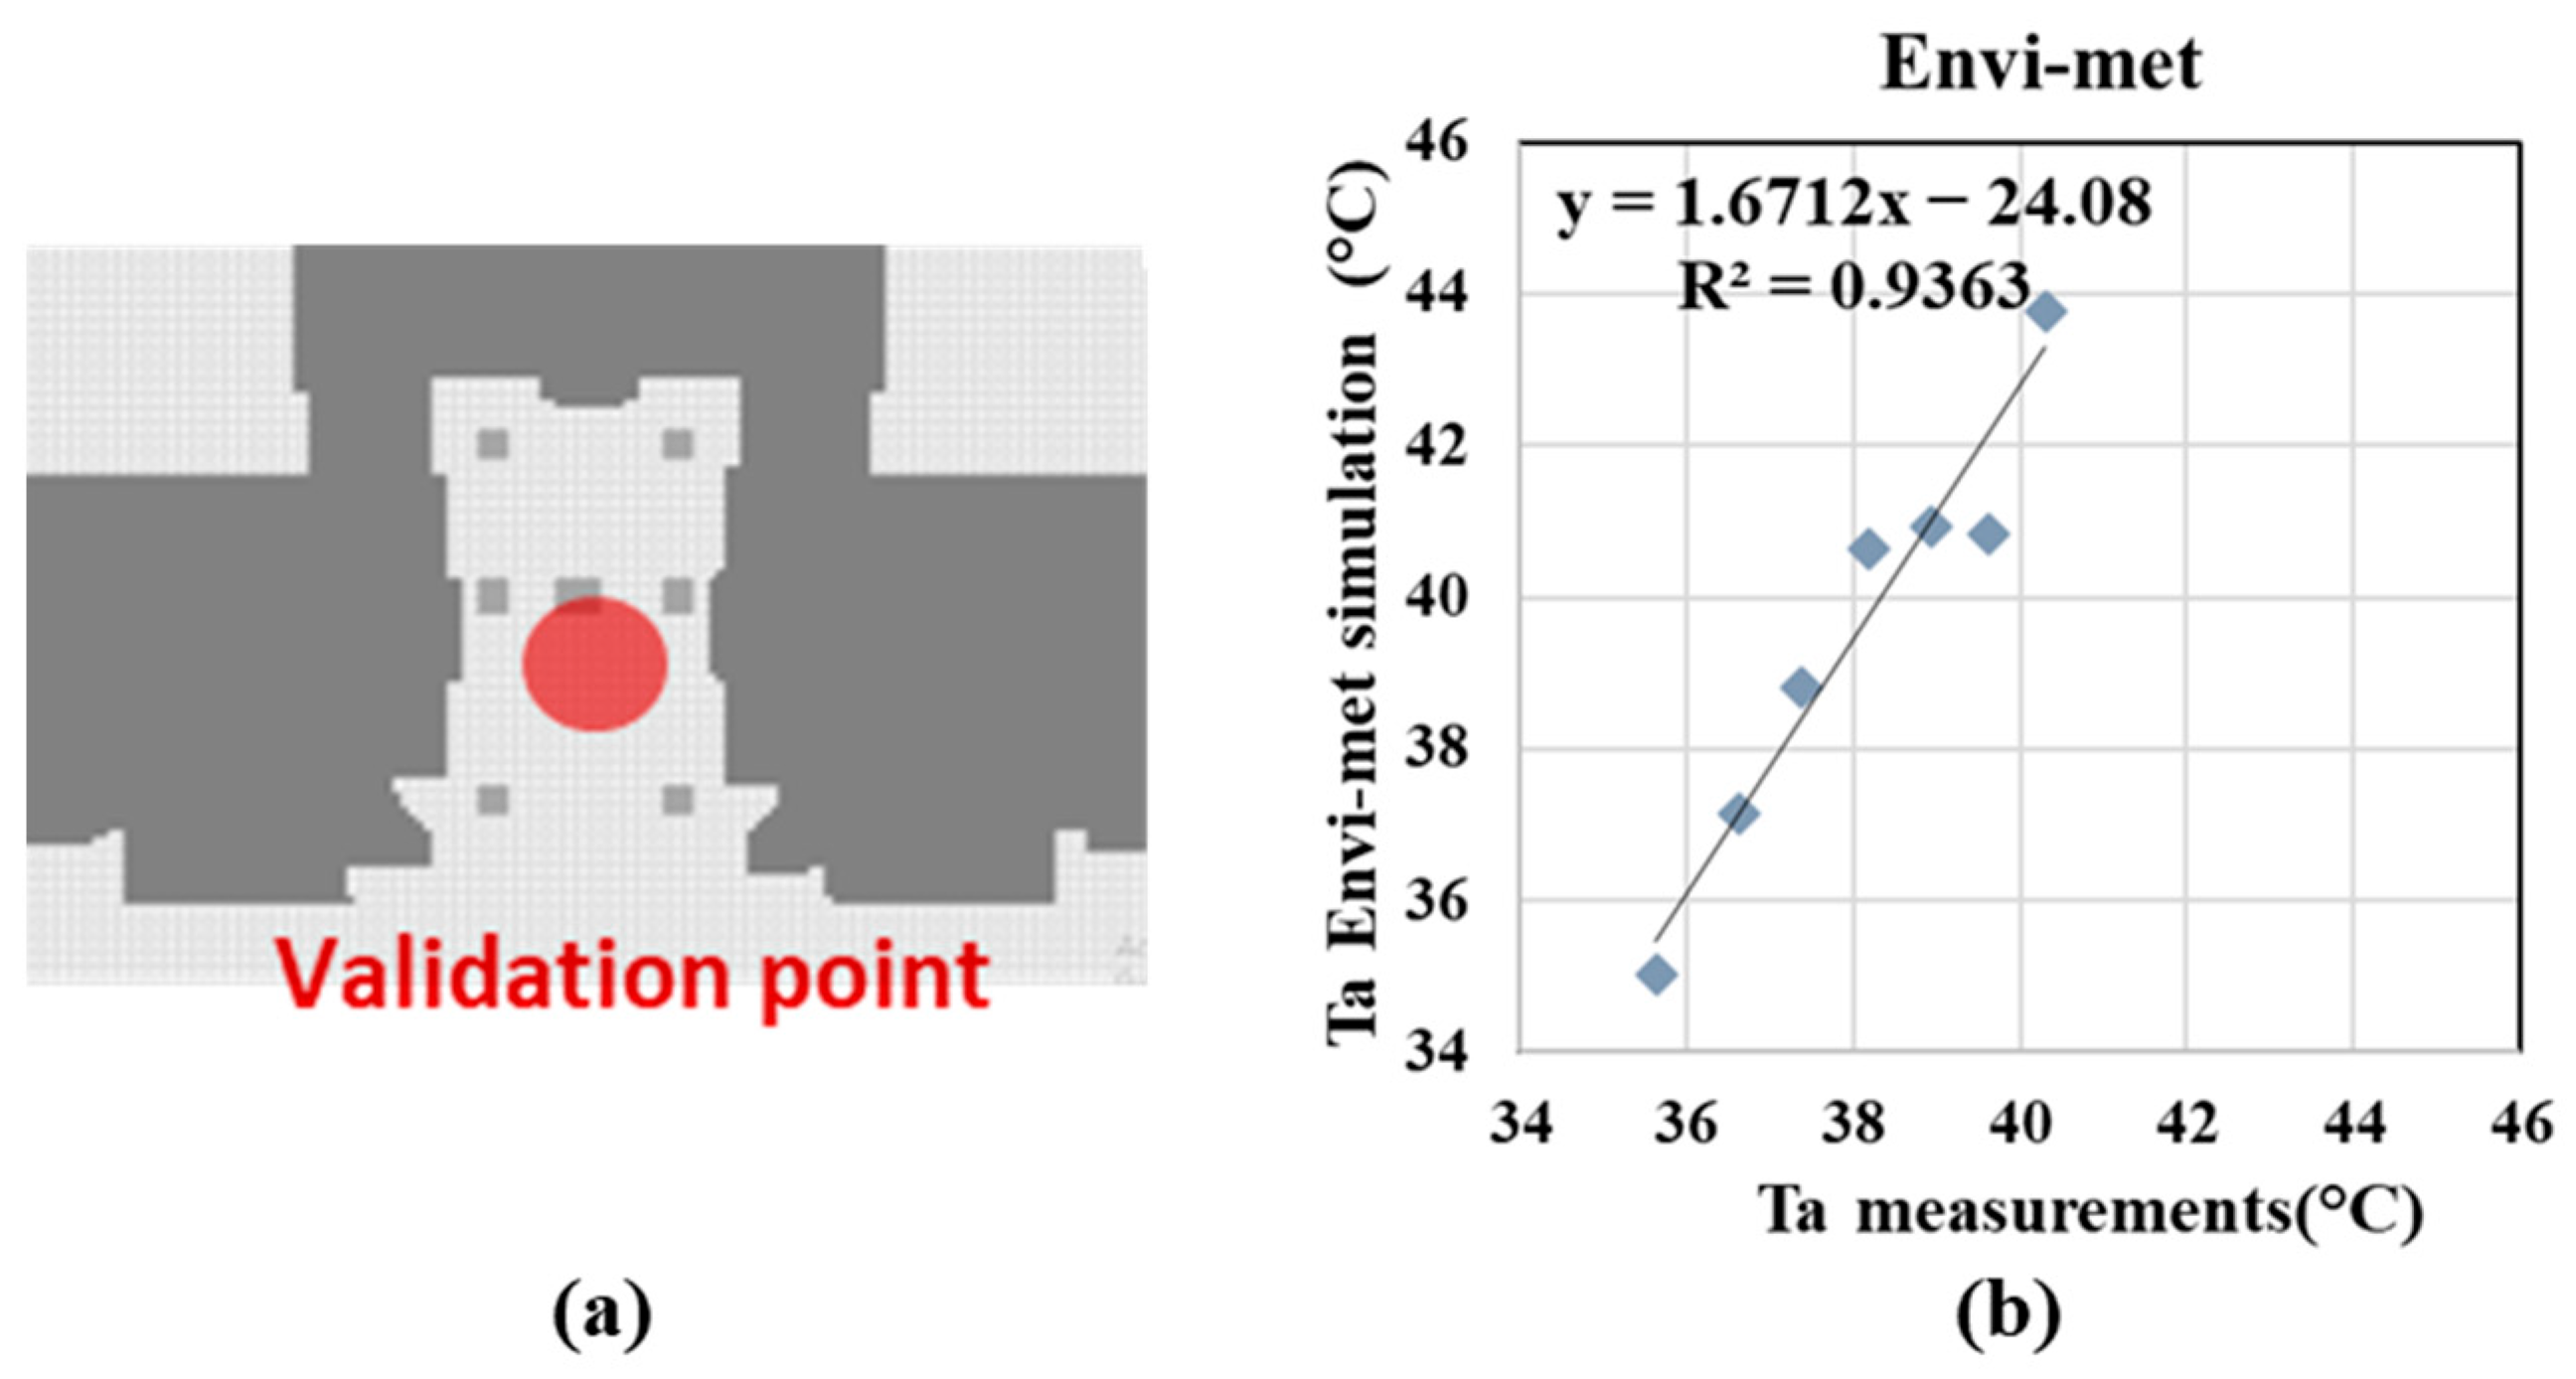
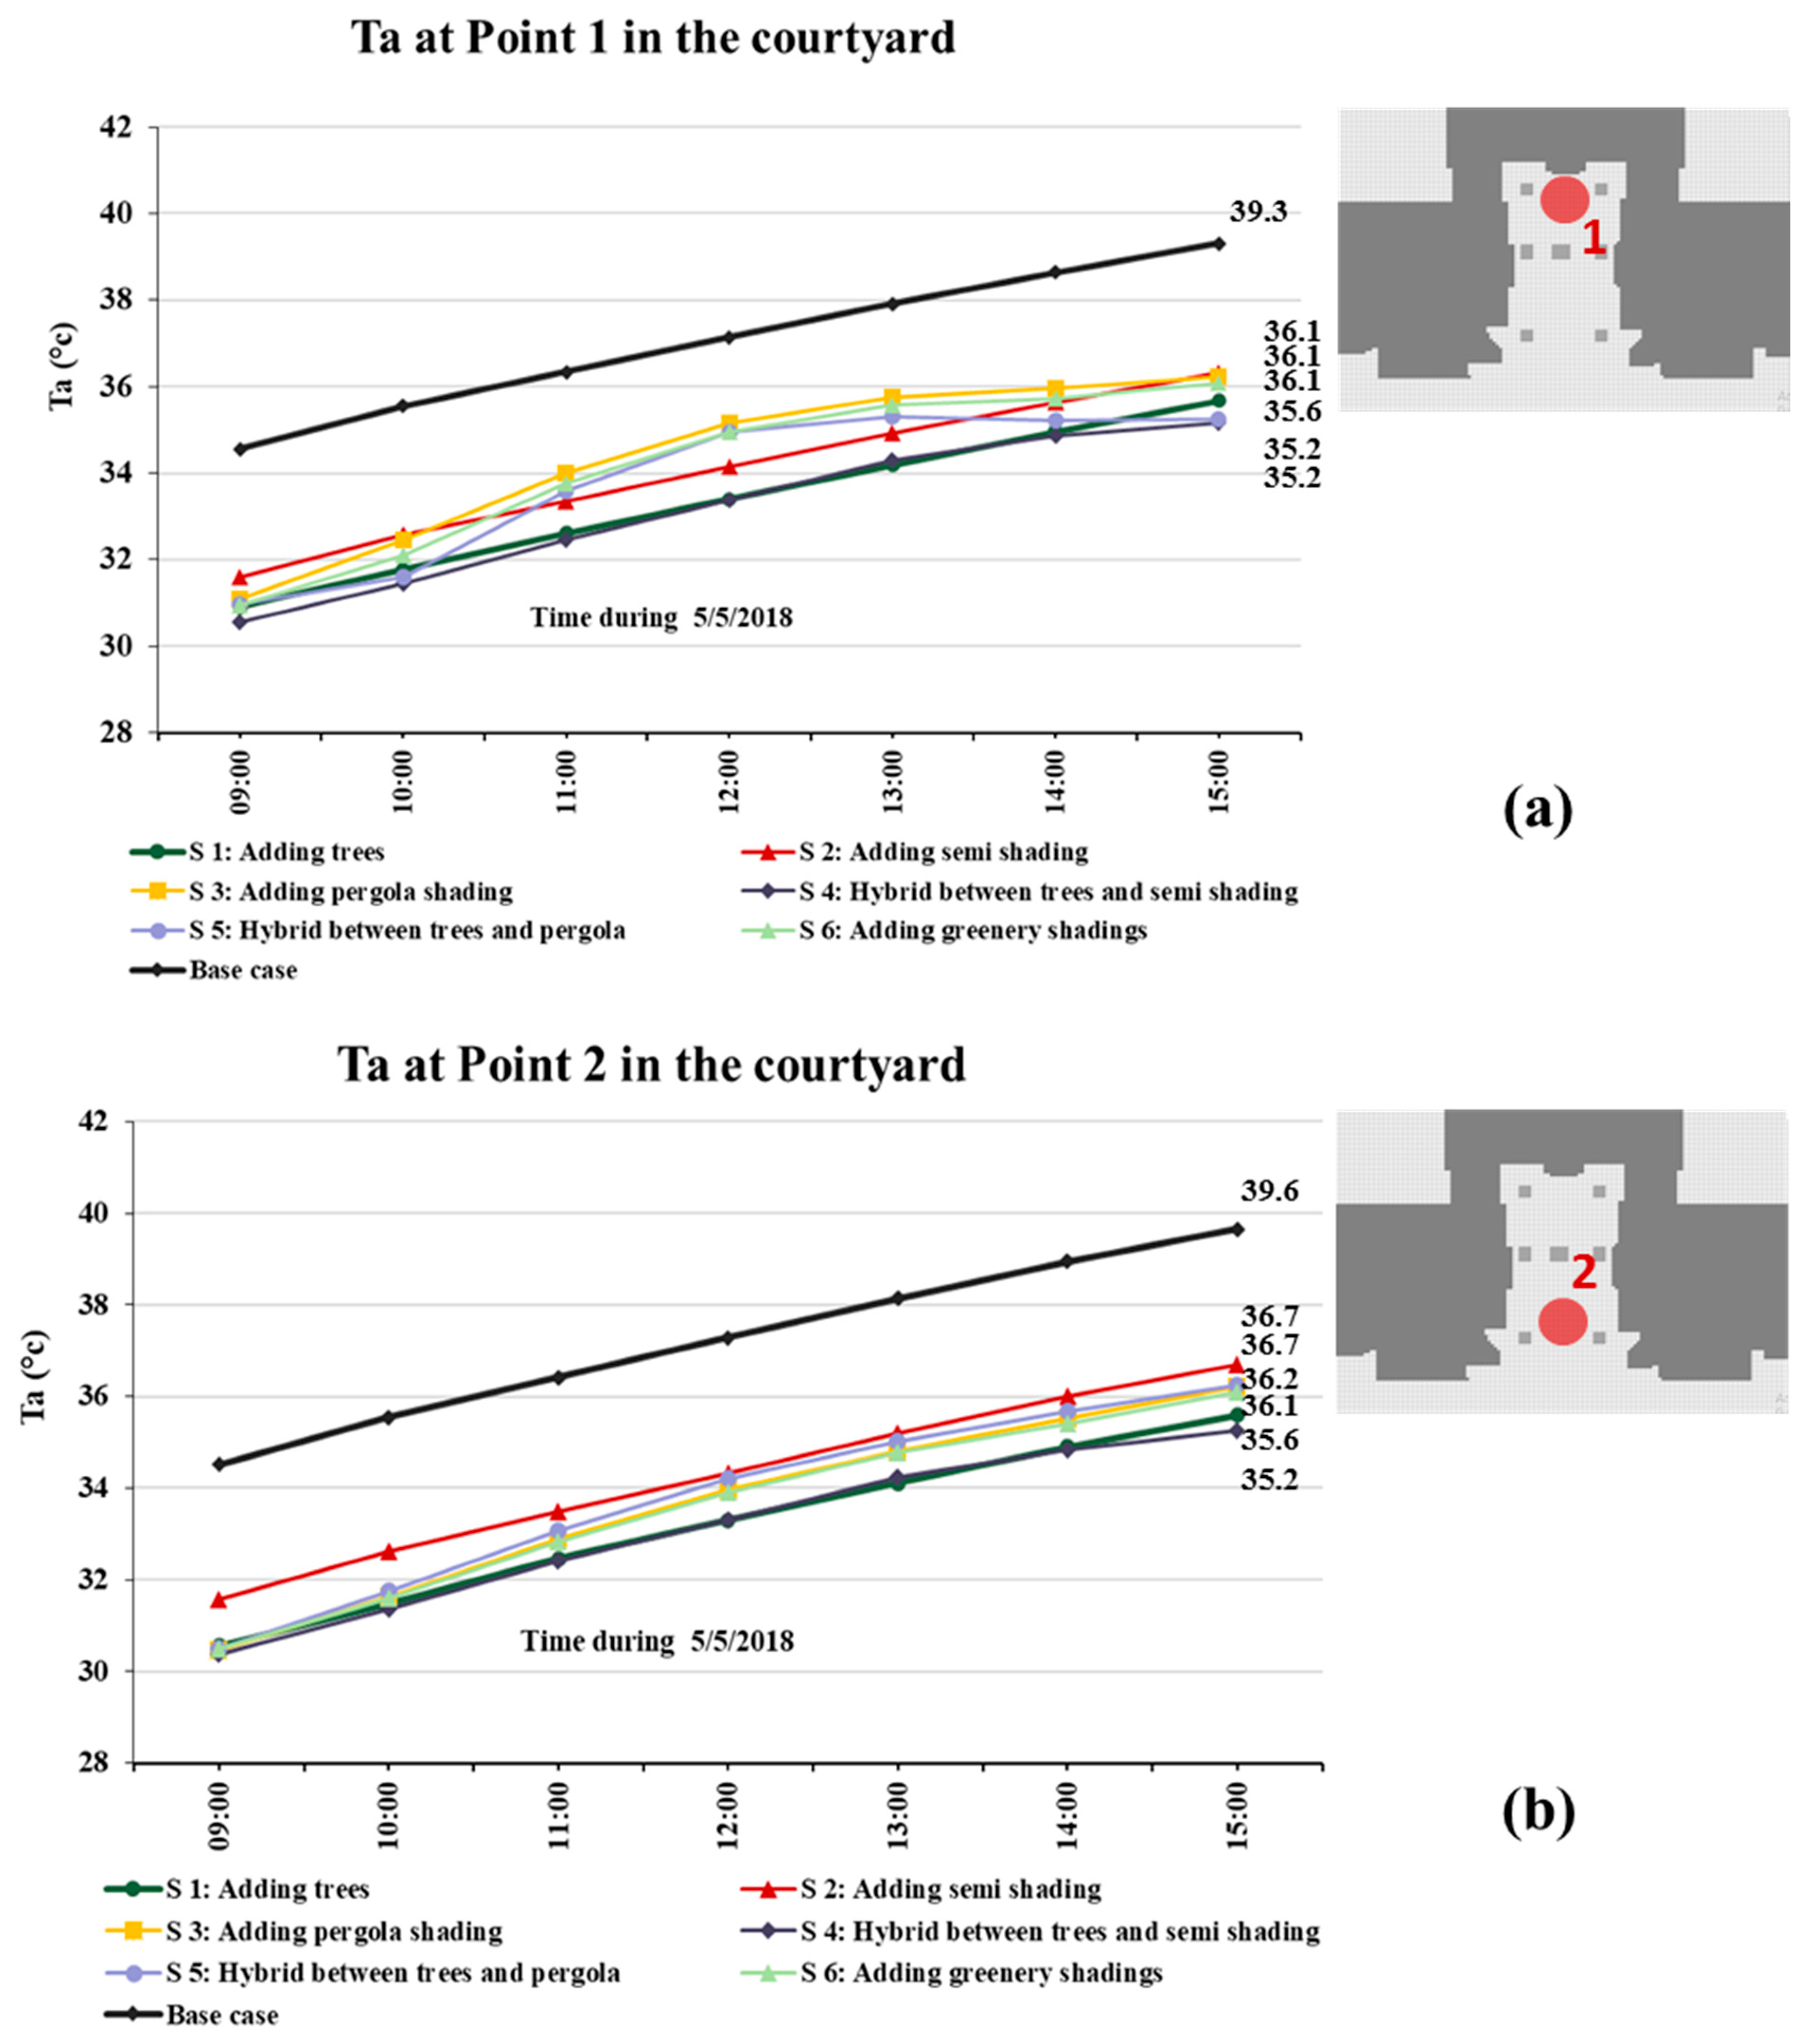
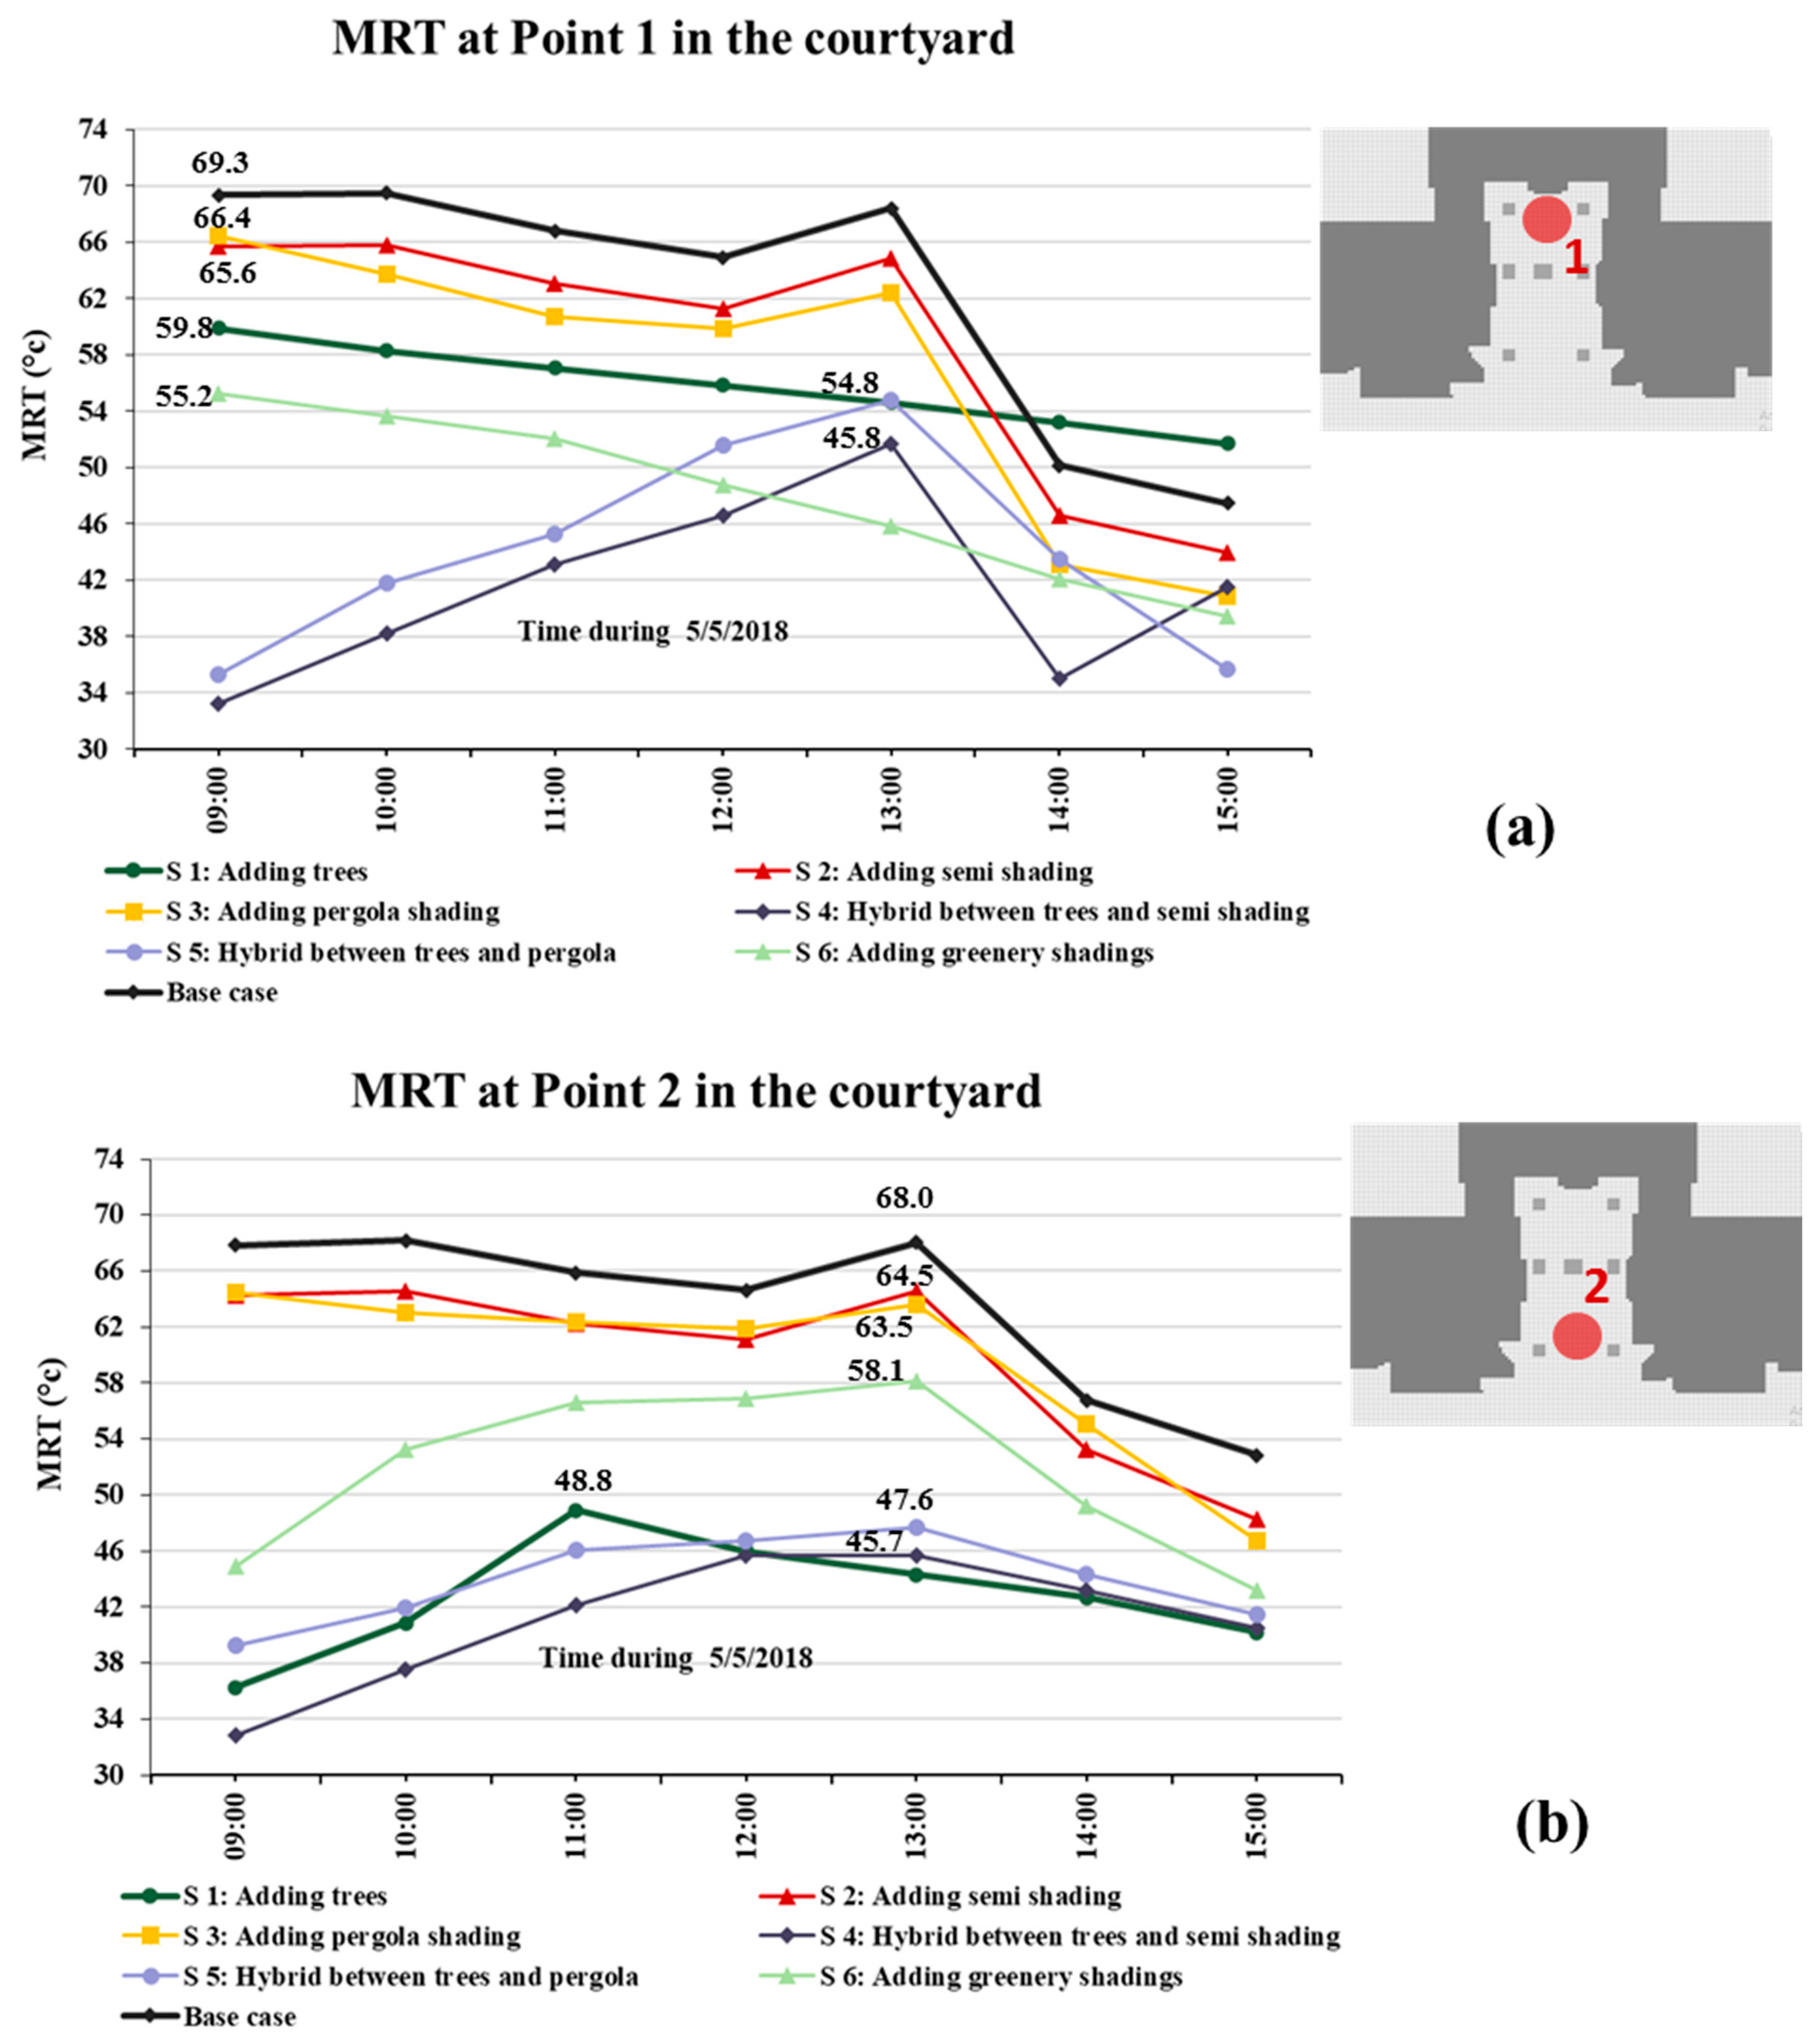
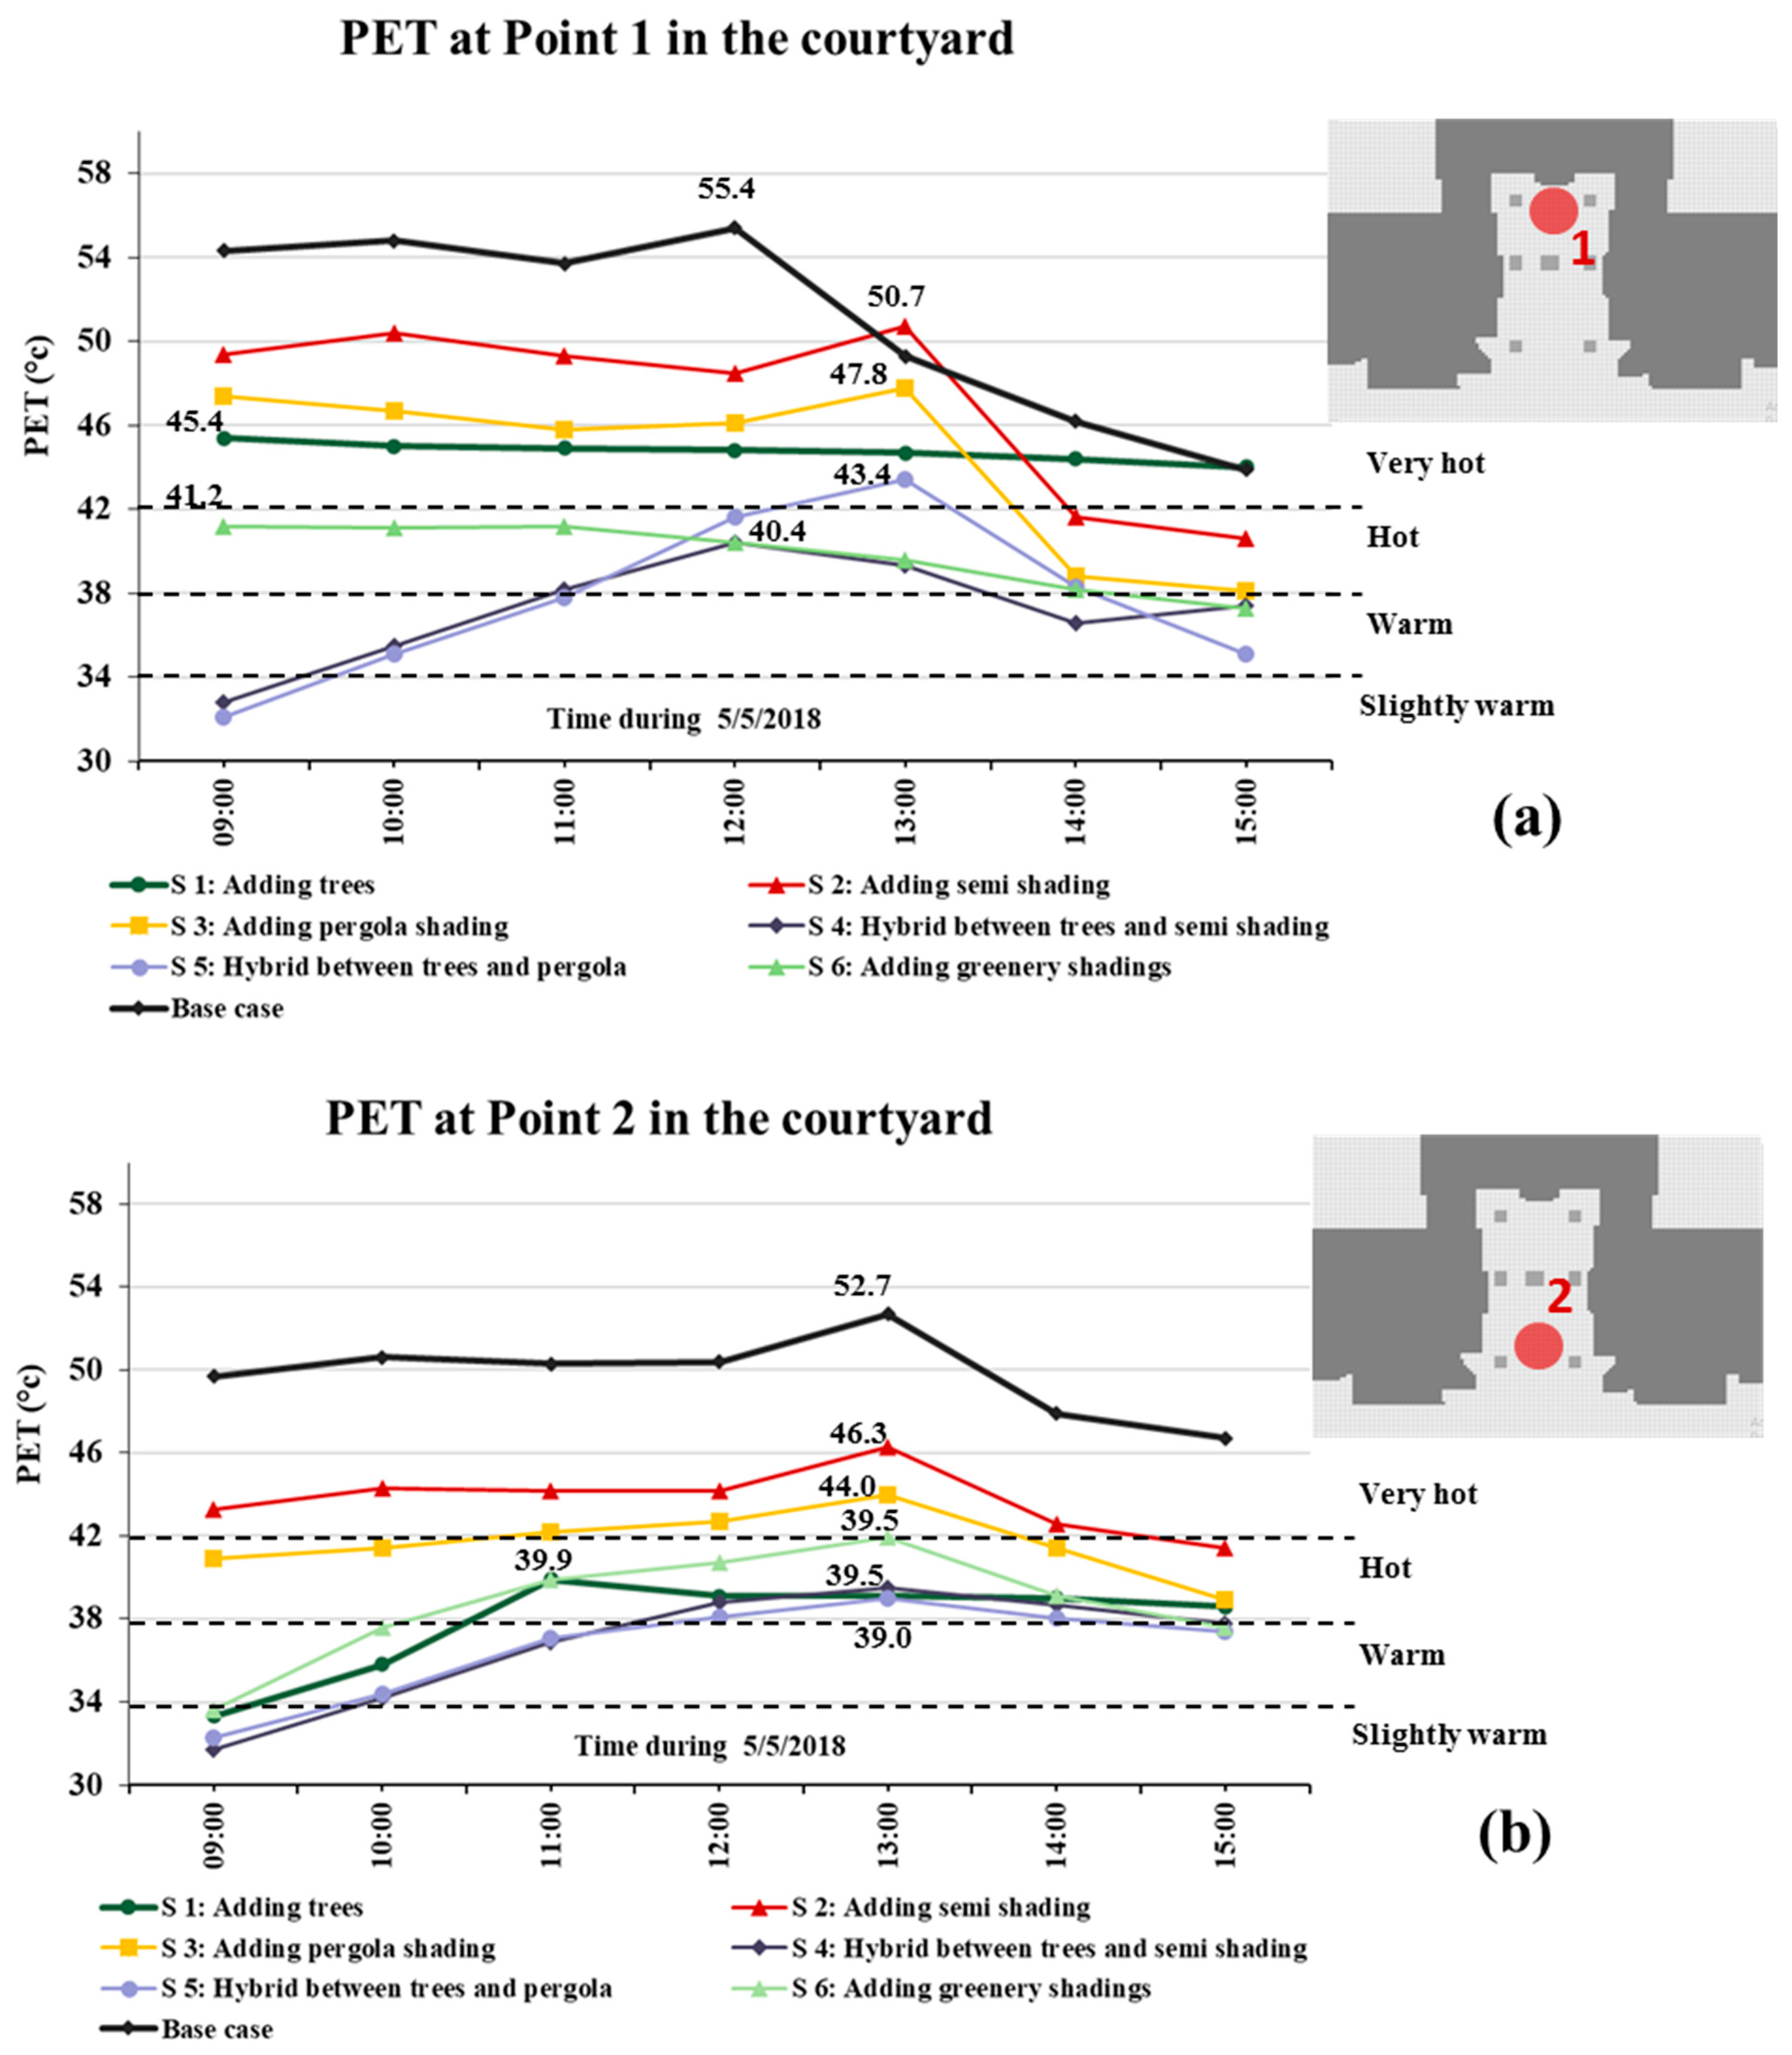
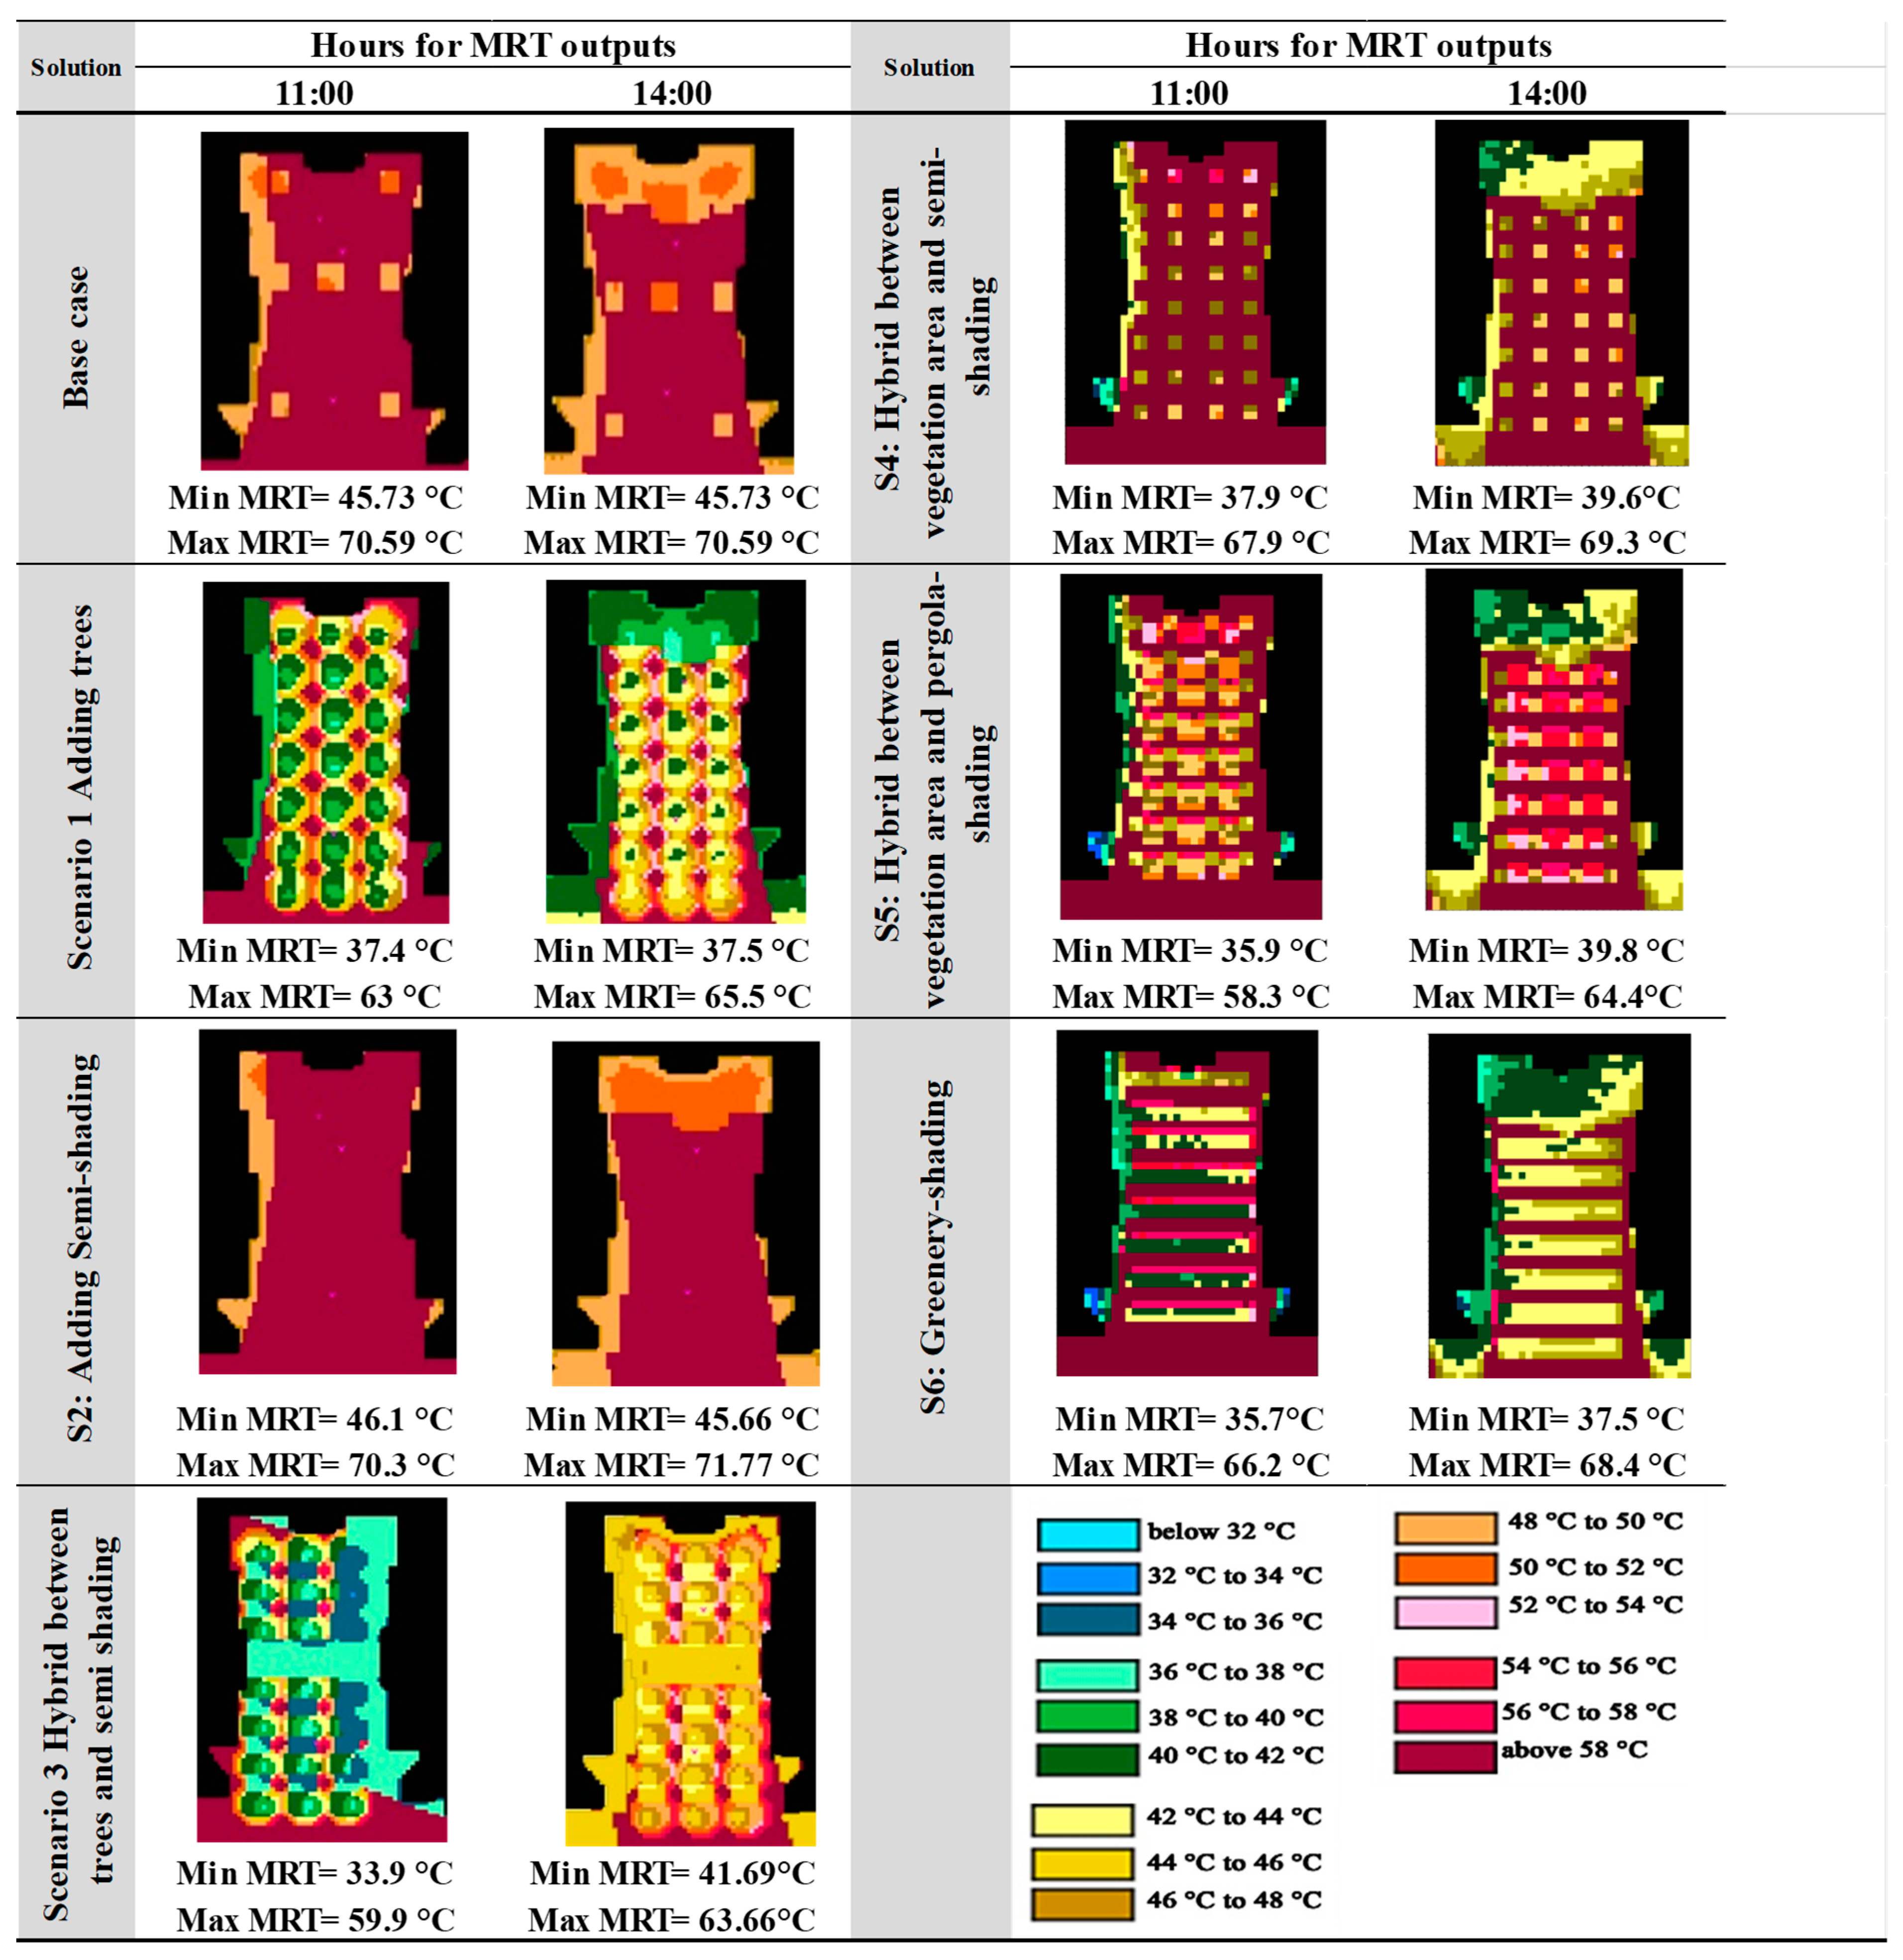
3.4. Envi-met Simulation Results

The results of the six improvement solutions were obtained using Envi-met software. Figure 9 shows the air temperature pattern during the workday from 9 a.m. to 3 p.m. in two points, with point 1 in the deep of the middle open courtyards and point 2 in the opening side. In point 1, the average of Ta in the base case was 37.07 °C based on the simulation results in Envi-met, but its reduction, as a result of applying the improvement solutions, ranged between 2.69 °C and 3.91 °C. Thus, the highest reduction of the average of Ta was obtained by applying the improvement solution S4 of a hybrid between the vegetation area and semi-shading, while the average of Ta was 33.16 °C. Additionally, the solution of S5 of a hybrid between the vegetation area and pergola shading contributed to the reduction of the Ta average by 3.23 °C. Conversely, the lowest reduction was obtained by applying S3, which was adding pergola shading, whereas the average of Ta reached 34.48 °C, which is still a beneficial improvement.
On the other hand, in point 2, the average of Ta in the base case was 37.2 °C, but its reduction as a result of applying the improvement solutions ranged between 3.44 °C and 4.10 °C. Hence, the highest reduction of the average of Ta was obtained by applying the improvement solution S4 of a hybrid between the vegetation area and semi-shading, while the average of Ta was 33.11 °C. Additionally, the solutions of S1 (adding vegetation area) and S2 (adding semi-shading) assisted in the reduction of the Ta average by 4.01 °C. However, the lowest reduction was obtained by applying S5 of a hybrid between the vegetation area and pergola shading, whereas the average of Ta reached 33.78 °C, which is still a beneficial improvement. Moreover, these results are compatible with the results of [27], who found that adding trees in the educational building courtyard reduces the air temperature by 4.9 °C. Additionally, the results of a reduction of Ta using hybrid solutions (from 2.9 °C to 4.10 °C) agree with the results of [5,28], who reduced Ta by 2.1 °C and 5.8 °C by using hybrid solutions. It is concluded that a significant reduction of Ta occurred by applying the hybrid improvement solutions at the two points, which ranged between 3.23 °C and 4.1 °C.
Figure 10 shows the hourly mean radiant temperature for the six improvement solutions compared to the base case. MRT is very sensitive to different urban strategies. In point 1, the average of MRT in the base case was very high and reached 62.3 °C, although its reduction as a result of applying the improvement solutions ranged between 5.61 °C and 21.02 °C. Hence, the highest reduction of the average of MRT was obtained by applying the improvement solution S4 of a hybrid between the vegetation area and semi-shading, while the average of MRT reaching only 41.3 °C. Additionally the solution of S5 (a hybrid between the vegetation area and pergola shading) and S6 (a hybrid of greenery shading) achieved reductions of the average of MRT by 18.37 °C and 14.22 °C, respectively. The other three improvement solutions, S1, S2, and S3, lightly reduced the average of MRT. This is due to the strong impact of hybrid solutions in providing a large shaded area and moderate air temperature as a result of increasing the vegetation and shading area together.
On the other side, in point 2, the average of MRT in the base case was 63.4 °C, but its reduction as a result of applying the improvement solutions ranged between 3.88 °C and 22.3 °C. Moreover, the highest reduction of the average of MRT was obtained by applying the improvement solution S5 of a hybrid between the vegetation area and pergola shading, while the average of MRT was 41.08 °C. Although, adding pergola shading only, as in solution S3, achieved the lowest reduction of the average of MRT. Therefore, it confirmed the necessity of hybridizing the improvement solutions between shading units and vegetation elements. These results are consistent with the previous researcher [29], who clarified the impact of the hybrid solution in reducing the MRT value by 9.2 °C. Additionally, the results of [30] indicated that the hybrid solution contributed to the reduction of MRT by a range from 12 °C to 15.3 °C, which agrees with our results (11.7 °C to 22.3 °C). In addition, the results are consistent with the results of [5,28]. It is concluded that a significant reduction of MRT occurred by applying the hybrid improvement solutions at the two points, which ranged between 14.2 °C and 22.3 °C.
Eventually, PET values were obtained using LEONARDO outputs and RayMan outputs. LEONARDO is a data visualization and analysis tool within Envi-met that allows users to analyze the simulation results, such as Ta, MRT, etc. Figure 11 shows the hourly PET values for the six improvement solutions at two points inside the courtyards. In point 1, the average of PET in the base case was very high and reached 51.09 °C (very hot grade), which caused thermal discomfort and difficulty in doing activities for students. Nevertheless, the average PET reduction as a result of applying the improvement solutions ranged between 6.34 °C and 13.9 °C. Hence, the highest reduction of the average of PET was obtained by applying the improvement solution S4 of a hybrid between the vegetation area and semi-shading, while the average of PET reached only 37.1 °C. Additionally, the solution of S5 (a hybrid between the vegetation area and pergola shading) and S6 (hybrid greenery-shading) achieved reductions of the average of PET by 13.46 °C and 11.23 °C, respectively. Accordingly, the grade of outdoor thermal comfort based on PET improved from a very hot grade (above 42 °C) in the base case to a warm grade (38.1–42 °C) by applying S4 and S5, which is a significant improvement [5].
Conversely, in point 2, the average of PET in the base case was 49.7 °C, but its reduction as a result of applying the improvement solutions ranged between 8.1 °C and 13.1 °C. Moreover, the highest reduction of the average PET was obtained by applying the improvement solution S5 of a hybrid between the vegetation area and pergola shading, while the average PET was 36.6 °C. However, adding pergola shading only, as in solution S3, achieved the lowest reduction of the average of PET (8.1 °C). Indeed, almost all the improvement solutions achieved a high reduction in PET in point 2 because of its location at the opening side of the courtyard and the availability of higher wind speeds than at point 1. Thus, these results are compatible with the results of [5], which indicated that the reduction of PET reached 15.9 °C by applying hybrid solutions in the school courtyard. Additionally, the reduction of PET based on adding vegetation area (reached 11.9 °C) agrees with the results of [6], which indicated the reduction of PET reached 14.4 °C by adding trees in the courtyard. Although the Ta, MRT, and PET reduction resulting from applying a single type of shading, such as semi-shading (S2) and pergola shading (S3), was the least due to the small shading area provided. The solution of adding trees (S1) assisted in the reduction of Ta, MRT, and PET, which reduced due to the trees’ properties of providing shade and air humidity, which cool the outdoor air. However, the hybrid improvement solutions were the most efficient in reducing Ta, MRT, and PET. It was concluded that a significant reduction of PET occurred by applying the hybrid improvement solutions at point 1 and by applying almost all the improvement solutions at point 2. In addition, using greenery shading panels covered with ivy plants is more effective than using regular wooden shading (semi-shading panels and pergola units) in reducing Ta, MRT, and PET because of the hanging plants’ effect, but still, other hybrid solutions (S4, S5) are the most efficient solutions due to the large trees effect, wide vegetation, and wide shading area. These reduce the heat transfer from shaded ground to the surrounding area, with significant thermal comfort for students.
Figure 12 shows the contour map of TMRT of different improvement solutions at two periods of time (11:00 a.m. and 2:00 p.m.). The results of the contour map emphasize the significant achievement of hybrid solutions compared to other solutions.

3.5. DesignBuilder Simulation Results

The DesignBuilder simulation model was used to reduce heat transfer to an indoor environment that strongly affects student thermal behavior and thermal comfort. Thus, four retrofitting strategies were adopted for the building envelope to achieve student comfort. Additionally, replacing LED units was used to increase energy consumption compared to another strategy that aimed to achieve thermal comfort and a low-energy building. Figure 13 shows the average indoor temperature difference between the different retrofitting strategies in one of the classrooms where measurement was conducted. It was concluded that using a passive design strategy and other mechanical ventilation achieved the lowest indoor temperature of 33.22 °C. Then, by integrating the window louver, the indoor air temperature was reduced by 0.04 °C, while the average indoor temperature for the wall insulation was nearly the same as the base case due to the existing case study using a wall with a thickness of 25 cm and a double wall in the same part of the façade of the classroom. This causes low heat transfer to the indoor environment.
Nevertheless, the impact of different retrofitting strategies on total annual energy consumption was studied and is shown in Figure 14. It was observed that the impact of wall and roof insulation, air infiltration (enhanced natural ventilation), and using LED lighting systems was the most significant on the annual energy consumption, while the percentage of energy consumption reduction reached 4%, 5%, and 25%, respectively. Additionally, combining all the significant strategies achieved a reduction in energy consumption of 30%. Hence, these results are compatible with the results of [31], which indicated that the energy saving of using wall insulation in residential buildings was about 2.2%. Additionally, the results agree with the previous research that concluded the reduction of energy consumption based on combining retrofitting strategies was 31.1%. However, using the LED lighting retrofitting strategy in this study achieved only 25% energy savings compared to 30% in the previous work, due to the shorter time of using artificial lighting at universities than in residential buildings in [31].

3.6. Abilities and Limitations

The proposed methodology has been discussed, and its abilities are listed as follows:
(a)
Relying on a coupled simulation methodology to improve the outdoor thermal comfort in the middle open courtyard of the case study and to reduce indoor energy consumption;
(b)
Providing results of outdoor and indoor thermal comfort;
(c)
Studying six improvement solutions for outdoor spaces and five retrofitting strategies for indoor spaces at the same time;
(d)
Investigating the impact of three different types of shading: semi-shading panels, pergola shading, and greenery shading (metal mesh shading panels covered with ivy plants);
(e)
Investigating the impact of two hybrid improvement solutions (between the vegetation area and semi-shading, and between the vegetation area and pergola shading);
(f)
Ability to apply the proposed methodology in several universities’ courtyards in hot climate cities;
(g)
The credibility of the proposed methodology is due to the agreement between the field measurements and the model results;
(h)
The flexibility of upgrading the proposed methodology to include new improvement solutions to contribute to solving global warming issues and confronting climate change issues.
On the other side, the limitations of the proposed methodology are listed as follows:
(a)
The limitation of shading types and ignoring other types, such as tent shading and arcades;
(b)
The limitation of the building height is equal to 20 m, and the courtyard ratio (H/W) is 1.2;
(c)
The limitation of ignoring other improvement solutions, such as ground material, surface albedo, shading ratio, and shading height;
(d)
The limitation of ignoring the impact of the geometric building parameters on outdoor thermal comfort, such as self-shading, H/W, and the opening side of the courtyard.

4. Conclusions and Recommendations

Improving the courtyard condition strengthens social relations for students and reduces energy consumption for classes overlooking the courtyard. Thus, this study aims to improve the outdoor students’ thermal comfort in university courtyards, in addition to reducing energy consumption in university buildings in hot arid climates, especially at Sohag University. Moreover, this study integrated field monitoring and a questionnaire with coupled simulation methodology to improve outdoor thermal comfort by applying six different improvement solutions (using the Envi-met model) and to reduce indoor energy consumption by applying five retrofitting strategies (using DesignBuilder). The results from the monitoring, questionnaire, thermal image analysis, and simulation can be summarized as follows:
  • Through monitoring, the high outdoor air temperature inside the middle courtyard, with a high value of SVF equal to 0.84, causes discomfort for students and high heat stress due to the lack of shading and low tree density. The PET values exceed 38 °C, from 10:00 to 13:00 only.
  • Based on thermal image analysis, the ground surface temperature of the black tiles reaches 41 °C in most areas of the open courtyard with no trees and shade. This causes high heat reflection on a student staying in the outdoor area, making them uncomfortable. The surface temperature decreases to 27 °C under the shaded area.
  • Closing the connection between different courtyards, the effect strongly affects CO2 concentration. The middle courtyard achieves the lowest average CO2 concentration, with an average of 550 ppm and 600 ppm during the opening and closing of the connection with other courtyards, respectively, compared to the closed courtyard. This causes the rise of CO2 concentration (960 ppm) in the class overlooking the middle courtyard with a H/W ratio equal to 0.7 due to not opening windows in the presence of students.
  • To achieve student comfort in the courtyard between buildings, a significant reduction of PET ranges between 11.1 °C and 13.9 °C, which occurs by applying the hybrid improvement solutions (vegetation area and semi-shading or pergola shading). Accordingly, the grade of outdoor thermal comfort based on PET improves to become located in the warm grade, which ranges from 34.1 °C to 38 °C during almost all day hours.
  • The reduction of the average of Ta ranges between 2.69 °C and 4.10 °C, and the reduction of the average of MRT ranges between 3.88 °C and 22.3 °C, as a result of applying the improvement solutions.
  • In addition, using greenery shading panels covered with ivy plants is more effective than using regular wooden shading (semi-shading panels and pergola units) in reducing Ta, MRT, and PET because of the hanging plants’ effect, but still other hybrid solutions (S4, S5) are the most efficient solutions due to the large trees effect, wide vegetation, and wide shading area.
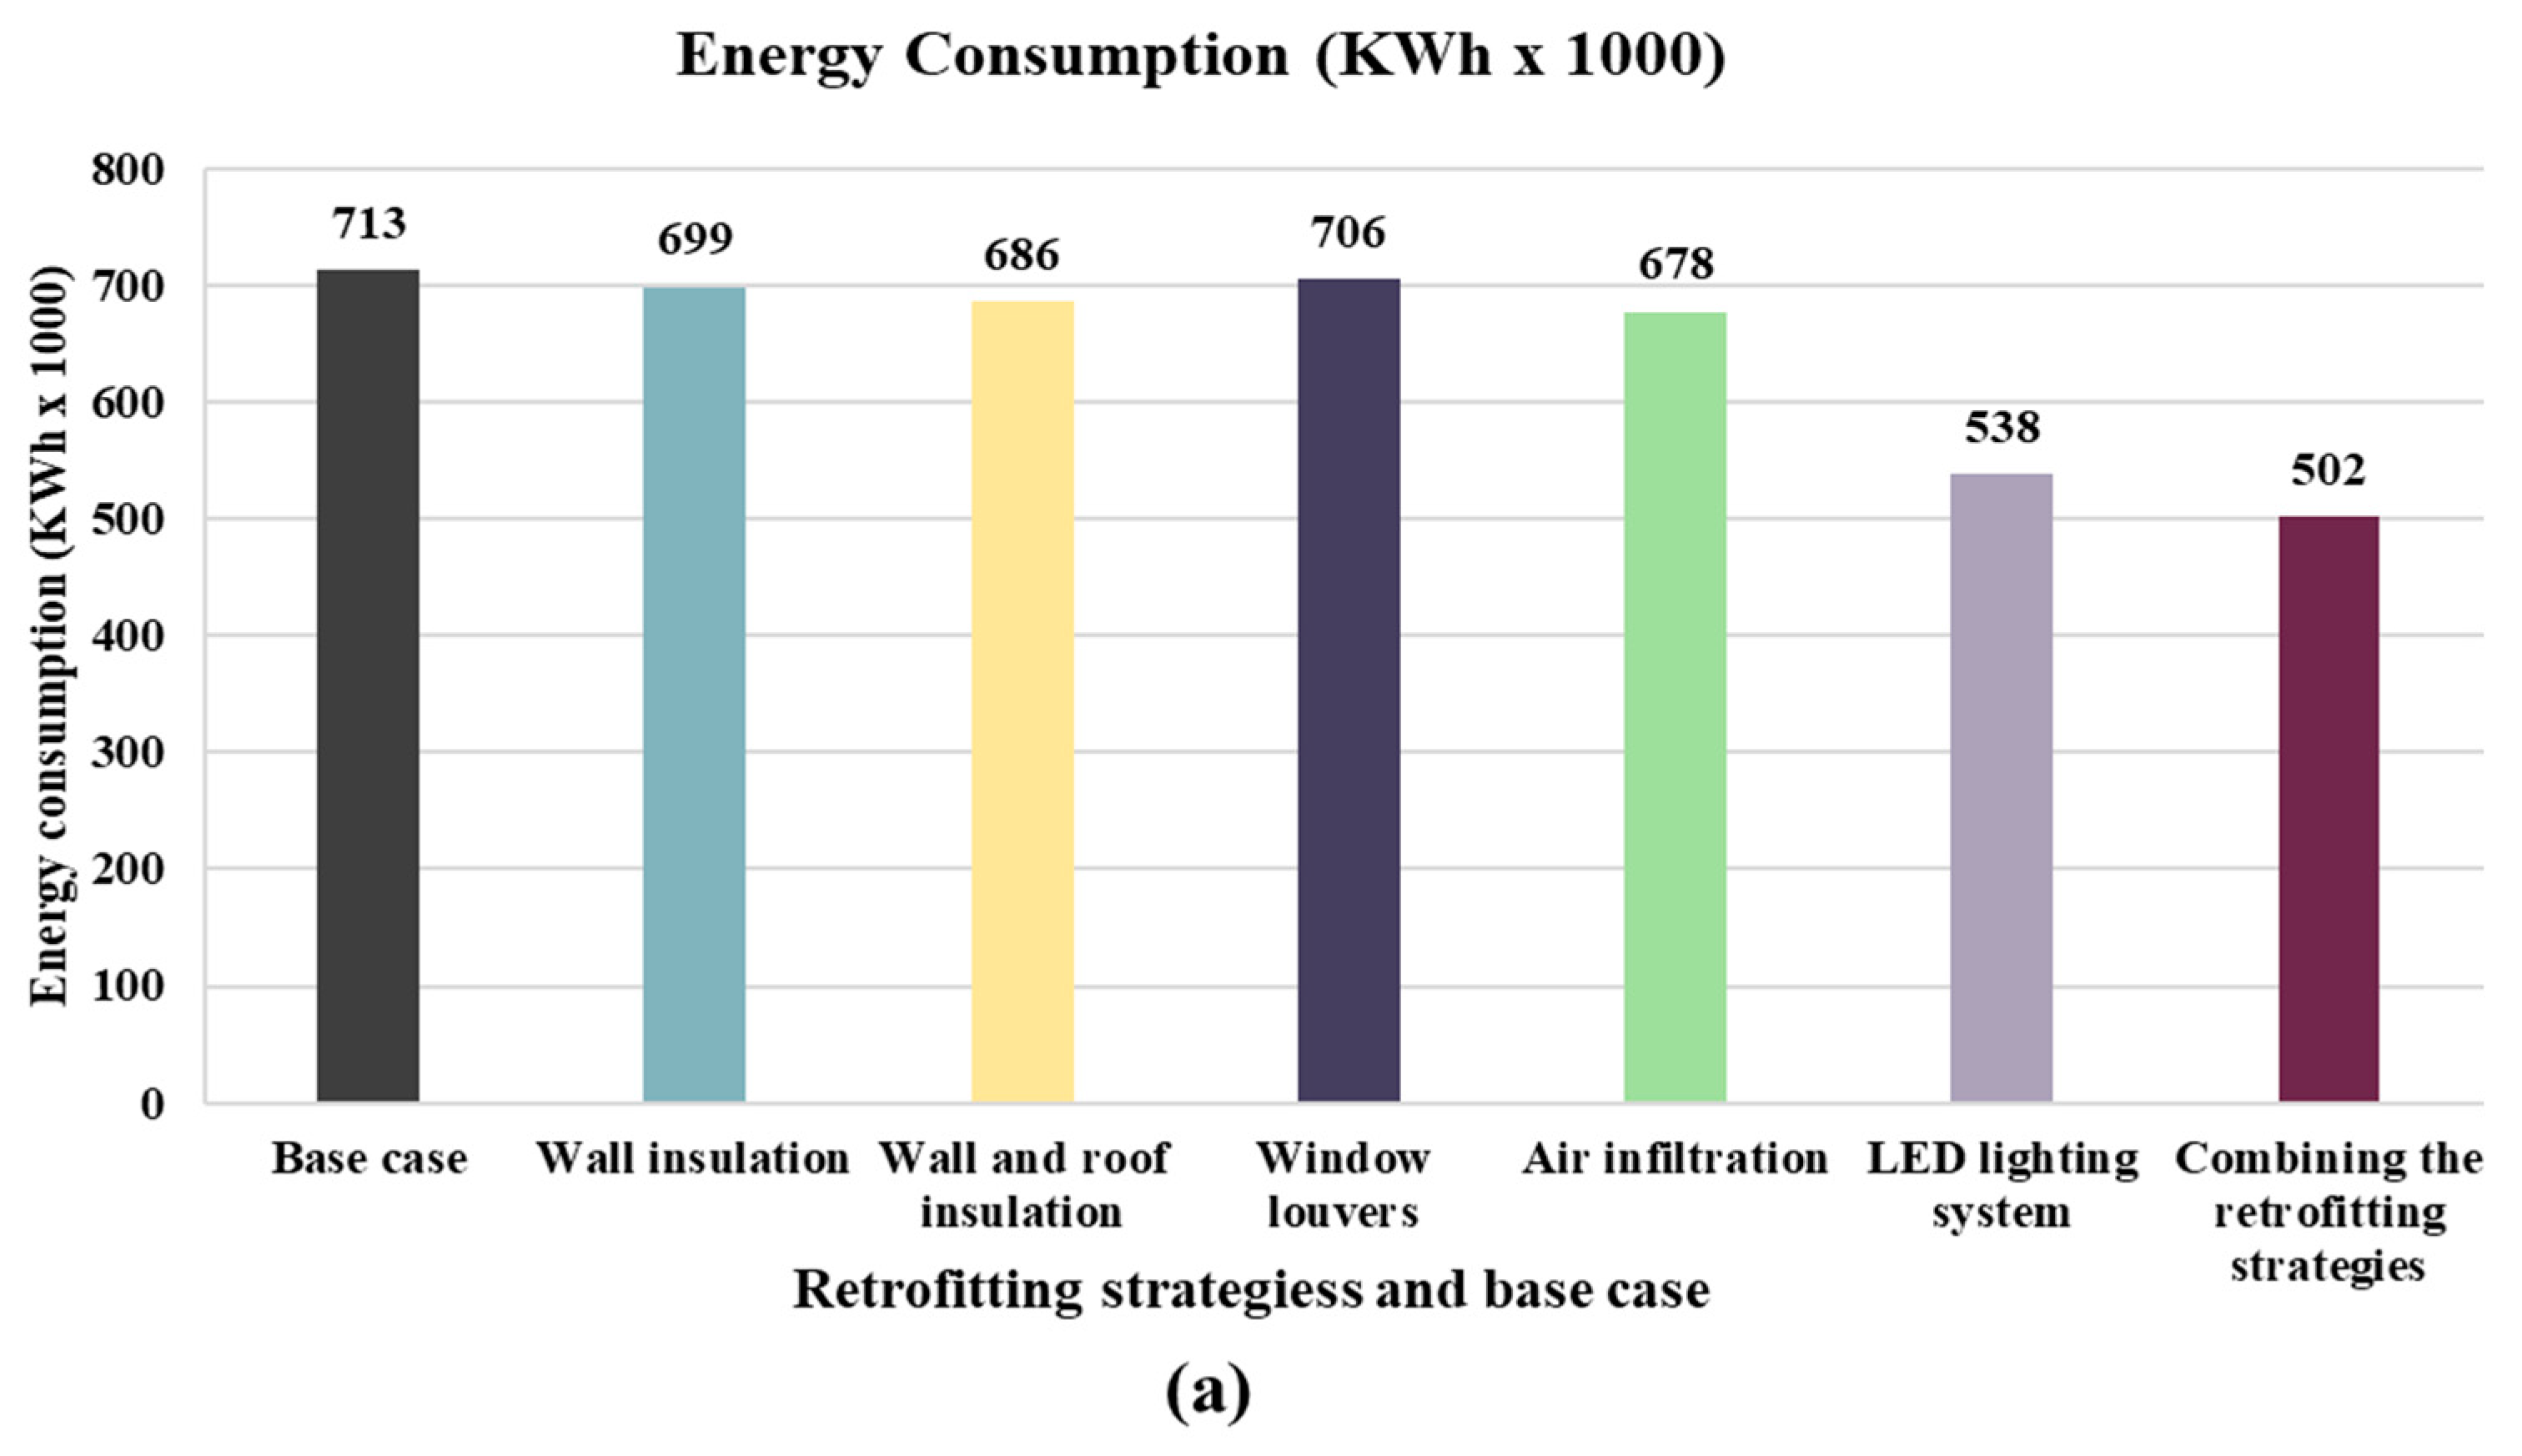
  • The integration of louvers, air infiltration, and wall and roof insulation, using an LED lighting system, achieves a significant percentage reduction in annual energy consumption equal to 30% with low heat transfer using DesignBuilder.
Therefore, it is recommended to apply hybrid improvement solutions (vegetation area and semi-shading or pergola shading), especially for shallow canyons and courtyards with an aspect ratio (H/W) equal to 1.2 in the existing university building of a hot arid climate or a new building. This achieves student thermal comfort in open spaces more than using shading only or increasing tree density only. The results help designers to integrate the optimum solutions in the current university buildings and the early design of new education buildings. Moreover, it is proposed that the future work of this methodology should be expanded to include different shapes of open and closed courtyards and to apply diverse mitigation solutions such as phase change material.

Author Contributions

Conceptualization, A.S.H.A. and R.M.A.M.; methodology, A.S.H.A. and R.M.A.M.; software, R.M.A.M.; validation, R.M.A.M. formal analysis, A.S.H.A. and R.M.A.M.; investigation, A.S.H.A. and R.M.A.M.; resources, A.S.H.A. and R.M.A.M.; data curation, A.S.H.A. and R.M.A.M.; writing—original draft preparation, A.S.H.A. and R.M.A.M.; writing—review and editing, A.S.H.A. and R.M.A.M.; visualization, R.M.A.M.; supervision, A.S.H.A.; project administration; funding acquisition. All authors have read and agreed to the published version of the manuscript.

Funding

This work was supported and funded by the Deanship of Scientific Research at Imam Mohammad Ibn Saud Islamic University (IMSIU) (grant number IMSIU-DDRSP2502).

Data Availability Statement

Data are contained within the article.

Conflicts of Interest

The authors declare that they have no known competing financial interests or personal relationships that could have appeared to influence the work reported in this paper.

References

  1. Lam, C.K.C.; Weng, J.; Liu, K.; Hang, J. The effects of shading devices on outdoor thermal and visual comfort in Southern China during summer. Build. Environ. 2023, 228, 109743. [Google Scholar] [CrossRef]
  2. Abdallah, A.S.H.; Mohammad, D.A.; Ali, A.-M.M. The influence of different courtyard ratios in university buildings on their thermal performance during the hot period: (Faculties of Agriculture and Education, New Sohag University, Egypt as a case study), Simulation for a Sustainable Built Environment. In IOP Conference Series Earth and Environmental Science 397; IOP Publishing Ltd.: Bristol, UK, 2019. [Google Scholar] [CrossRef]
  3. Talukdar, M.S.J.; Talukdar, T.H.; Singh, M.K.; Abdul Baten, M.; Hossen, M.S. Status of thermal comfort in naturally ventilated university classrooms of Bangladesh in hot and humid summer season. J. Build. Eng. 2020, 32, 101700. [Google Scholar] [CrossRef]
  4. Mallen, E.; Bakin, J.; Stone, B.; Sivakumar, R.; Lanza, K. Thermal impacts of built and vegetated environments on local microclimates in an Urban University campus. Urban Clim. 2020, 32, 100640. [Google Scholar] [CrossRef]
  5. Mahmoud, R.M.A.; Abdallah, A.S.H. Assessment of outdoor shading strategies to improve outdoor thermal comfort in school courtyards in hot and arid climates. Sustain. Cities Soc. 2022, 86, 104147. [Google Scholar] [CrossRef]
  6. Darvish, A.; Eghbali, G.; Eghbali, S.R. Tree-configuration and species effects on the indoor and outdoor thermal condition and energy performance of courtyard buildings. Urban Clim. 2021, 37, 100861. [Google Scholar] [CrossRef]
  7. Ghaffarianhoseini, A.; Berardi, U.; Al-Obaidi, K. Analyzing the thermal comfort conditions of outdoor spaces in a university campus in Kuala Lumpur, Malaysia. Sci. Total Environ. 2019, 666, 1327–1345. [Google Scholar] [CrossRef]
  8. Nasrollahi, N.; Namazi, Y.; Taleghani, M. The effect of urban shading and canyon geometry on outdoor thermal comfort in hot climates: A case study of Ahvaz, Iran. Sustain. Cities Soc. 2021, 65, 102638. [Google Scholar] [CrossRef]
  9. Binabid, J.; Anteet, Q. Numerical study of vegetation effects on thermal comfort for outdoor spaces at a public school in hot and arid climate. Environ. Adv. 2024, 15, 100482. [Google Scholar] [CrossRef]
  10. Qi, Y.; Chen, L.; Xu, J.; Liu, C.; Gao, W.; Miao, S. Influence of university campus spatial morphology on outdoor thermal environment: A case study from Eastern China. Energy Built Environ. 2025, 6, 43–56. [Google Scholar] [CrossRef]
  11. Khalili, S.; Fayaz, R.; Zolfaghari, S.A. Analyzing outdoor thermal comfort conditions in a university campus in hot-arid climate: A case study in Birjand, Iran. Urban Clim. 2022, 43, 101128. [Google Scholar] [CrossRef]
  12. Guo, T.; Lin, Z.; Zhao, Y.; Fang, Z.; Fan, Y.; Zhang, X.; Yang, J.; Li, Y. Investigation and optimization of outdoor thermal comfort in elementary school campuses: Example from a humid-hot area in China. Build. Environ. 2024, 248, 111055. [Google Scholar] [CrossRef]
  13. Ge, J.; Wu, J.; Chen, S.; Wu, J. Energy efficiency optimization strategies for university research buildings with hot summer and cold winter climate of China based on the adaptive thermal comfort. J. Build. Eng. 2018, 18, 321–330. [Google Scholar] [CrossRef]
  14. Batlle, E.A.O.; Palacio, J.C.E.; Lora, E.E.S.; Reyes, A.M.M.; Moreno, M.M.; Morejón, M.B. A methodology to estimate baseline energy use and quantify savings in electrical energy consumption in higher education institution buildings: Case study, Federal University of Itajubá (UNIFEI). J. Clean. Prod. 2020, 244, 118551. [Google Scholar] [CrossRef]
  15. Park, J.H.; Yun, B.Y.; Chang, S.J.; Wi, S.; Jeon, J.; Kim, S. Impact of a passive retrofit shading system on educational building to improve thermal comfort and energy consumption. Energy Build. 2020, 216, 109930. [Google Scholar] [CrossRef]
  16. Wang, X.; Yang, L.; Gao, S.; Zhao, S.; Zhai, Y. Thermal comfort in naturally ventilated university classrooms: A seasonal field study in Xi’an, China. Energy Build. 2021, 247, 111126. [Google Scholar] [CrossRef]
  17. Emil, F.; Diab, A. Energy rationalization for an educational building in Egypt: Towards a zero energy building. J. Build. Eng. 2021, 44, 103247. [Google Scholar] [CrossRef]
  18. Amini, R.; Ghaffarianhoseini, A.; Ghaffarianhoseini, A.; Berardi, U. Numerical investigation of indoor thermal comfort and air quality for a multi-purpose hall with various shading and glazing ratios. Therm. Sci. Eng. Prog. 2021, 22, 100812. [Google Scholar] [CrossRef]
  19. Cantón, M.A.; Ganem, C.; Barea, G.; Llano, J.F. Courtyards as a passive strategy in semi dry areas. Assessment of summer energy and thermal conditions in a refurbished school building. Renew. Energy 2014, 69, 437–446. [Google Scholar] [CrossRef]
  20. Aloshan, M.; Aldali, K. Empirical study of facade retrofits for optimizing energy efficiency and cooling in school buildings in Saudi Arabia. Energy Rep. 2024, 12, 4105–4128. [Google Scholar] [CrossRef]
  21. Sahu, V.; Gurjar, B.R. Spatial and seasonal variation of air quality in different microenvironments of a technical university in India. Build. Environ. 2020, 185, 107310. [Google Scholar] [CrossRef]
  22. Meteoblue. 2018. Available online: https://www.meteoblue.com (accessed on 1 December 2019).
  23. Ali-Toudert, F.; Djenane, M.; Bensalem, R.; Mayer, H. Outdoor thermal comfort in the old desert city of Beni-Isguen, Algeria. Clim. Res. 2005, 28, 243–256. [Google Scholar] [CrossRef]
  24. Nasrollahi, N.; Hatami, Z.; Taleghani, M. Development of outdoor thermal comfort model for tourists in urban historical areas; A case study in Isfahan. Build. Environ. 2017, 125, 356–372. [Google Scholar] [CrossRef]
  25. ASHRAE Standard 55; Thermal Environmental Conditions for Human Occupancy. America Society of Heating Refrigerating and Air-Conditioning Engineers, Inc.: Atlanta, GA, USA, 2017.
  26. ASHRAE Standard 62-2; Ventilation and Acceptable Indoor Air Quality in Residential Buildings. America Society of Heating Refrigerating and Air-Conditioning Engineers, Inc.: Atlanta, GA, USA, 2019.
  27. Zolch, T.; Mohammad, A.R.; Pfleiderer, E.; Wagner, G.; Pauleit, S. Designing public squares with green infrastructure to optimize human thermal comfort. Build. Environ. 2019, 149, 640–654. [Google Scholar] [CrossRef]
  28. Mahmoud, H.; Ragab, A. Urban Geometry Optimization to Mitigate Climate Change: Towards Energy-Efficient Buildings. Sustainability 2021, 13, 27. [Google Scholar] [CrossRef]
  29. Chen, C.; Zhang, Y.; Han, J.; Li, X. An investigation of the influence of ground surface properties and shading on outdoor thermal comfort in a high-altitude residential area. Front. Arch. Res. 2021, 10, 432–446. [Google Scholar] [CrossRef]
  30. Abdallah, A.S.H.; Mahmoud, R.M.A.; Aloshan, M.A. Optimizing Urban Spaces: A Parametric Approach to Enhancing Outdoor Recreation Between Residential Areas in Riyadh, Saudi Arabia. Buildings 2025, 15, 1527. [Google Scholar] [CrossRef]
  31. Abdallah, A.S.H.; Mahmoud, R.M.A. Investigation of Greening Façade and Retrofitting strategies on Outdoor Thermal Comfort and Indoor Energy Consumption in New Assiut City, Egypt. Mansoura Eng. J. 2023, 48, 9. [Google Scholar] [CrossRef]
Figure 1. The overview of the Faculty of Agriculture building: (a) the outside view (main elevation, plan, and satellite image), (b) the inner picture (author).
Buildings 15 02048 g001
Figure 2. The proposed improvement methodology of the Faculty of Agriculture.
Buildings 15 02048 g002
Figure 3. The validation process in Envi-met: (a) location of the validation point in the courtyard, and (b) linear regression of air temperature in Envi-met with relation to the measurement.
Buildings 15 02048 g003
Figure 4. The six proposed improvement solutions.
Buildings 15 02048 g004
Figure 5. The validation process in DesignBuilder: (a) linear regression of indoor air temperature in DesignBuilder with relation to measurement, (b) the model of the case study (plan, outside view) and classroom dimension in the Faculty of Agriculture.
Buildings 15 02048 g005
Figure 6. Temperature and questionnaire survey results of the agriculture building: (a) indoor temperature inside classes, air temperature inside the outer open courtyards, and PET pattern inside the open courtyard, and (b) results of the thermal sensation vote and air velocity vote inside the courtyards of buildings.
Buildings 15 02048 g006
Figure 7. CO2 concentration for the Faculty of Agriculture building: (a) CO2 concentration in the three courtyards, and (b) CO2 concentration for two classes overlooking the middle courtyard.
Buildings 15 02048 g007
Figure 8. Thermal image of the outer surface temperature of the outer courtyards at 1 pm.
Buildings 15 02048 g008
Figure 9. Air temperature simulation results of the base case and six improvement solutions at (a) point 1 in the deep of the courtyard and (b) point 2 in the opening side of the courtyard.
Buildings 15 02048 g009
Figure 10. The mean radiant temperature simulation results of the base case and six improvement solutions at (a) point 1 in the deep of the courtyard and (b) point 2 in the opening side of the courtyard.
Buildings 15 02048 g010
Figure 11. The PET hourly values of the base case and six improvement solutions at (a) point 1 in the deep of the courtyard and (b) point 2 on the opening side of the courtyard.
Buildings 15 02048 g011
Figure 12. Contour map for MRT distribution with max and min temperatures inside the open courtyards for the base case and improvement solution.
Buildings 15 02048 g012
Figure 13. Indoor air temperature for the validated classroom based on different retrofitting strategies.
Buildings 15 02048 g013
Figure 14. The indoor energy after applying the retrofitting strategies for the whole building: (a) energy consumption and (b) the percentage of energy reduction.
Buildings 15 02048 g014aBuildings 15 02048 g014b
Table 1. Description of building materials of the Faculty of Agriculture.
Building PartMaterialU-Value (W/m2K)R-Value (W/m2K)Thickness (m)Properties
Glass windowsSingle glass5.7 0.006Total solar transmission (SHGC)
Direct solar transmission
Light transmission
0.623
0.487
0.749
External and internal wallsRed brick (with 2 cm cement plaster on every side) with a thickness of 25 cm without thermal insulation0.9441.0590.29Inner surface
Convective heat transfer coefficient (W/m2-K)2.152
Radiative heat transfer oefficient (W/m2-K)5.540
Surface resistance (m2-K/W)0.130
Outer surface
Convective heat transfer coefficient (W/m2-K)19.8
Radiative heat transfer oefficient (W/m2-K)5.130
Surface resistance (m2-K/W)0.040
Ceiling tile
Cement mortar
0.3532.8810.43Inner surface
Convective heat transfer coefficient (W/m2-K)4.46
Radiative heat transfer oefficient (W/m2-K)5.540
Surface resistance (m2-K/W)0.100
RoofSand
Concrete (lightweight)
Heat insulation (polyurethane)
Water insulation (rubber)
Concrete
Cement plaster
Outer surface
Convective heat transfer coefficient (W/m2-K)19.8
Radiative heat transfer oefficient (W/m2-K)5.130
Surface resistance (m2-K/W)0.040
Disclaimer/Publisher’s Note: The statements, opinions and data contained in all publications are solely those of the individual author(s) and contributor(s) and not of MDPI and/or the editor(s). MDPI and/or the editor(s) disclaim responsibility for any injury to people or property resulting from any ideas, methods, instructions or products referred to in the content.

