
Feasibility Study of Waste Rock Wool Fiber as Asphalt Mixture Additive: Performance Test and Environmental Effect Analysis


Abstract
1. Introduction
2. Experimental Scheme and Research Method
2.1. Materials Preparation
2.1.1. Raw Materials
2.1.2. Preparation of Asphalt Mortar
2.1.3. Preparation of Asphalt Mixtures
2.2. Test Methods
2.2.1. Aging Test of Rock Wool
2.2.2. Characteristic Test of Rock Wool Fiber
2.2.3. Performances Test of Modified Asphalt Mortar with RWP and RWF
2.2.4. Performance Tests of RWF-Modified Asphalt Mixture
2.3. Evaluation Methods of Environmental Benefits
2.3.1. Life Cycle Assessment (LCA) Method
2.3.2. Economic Analysis
2.3.3. Carbon Performance Ratio (CPR)
3. Results and Discussion
3.1. The Characteristic of Rock Wool Fiber
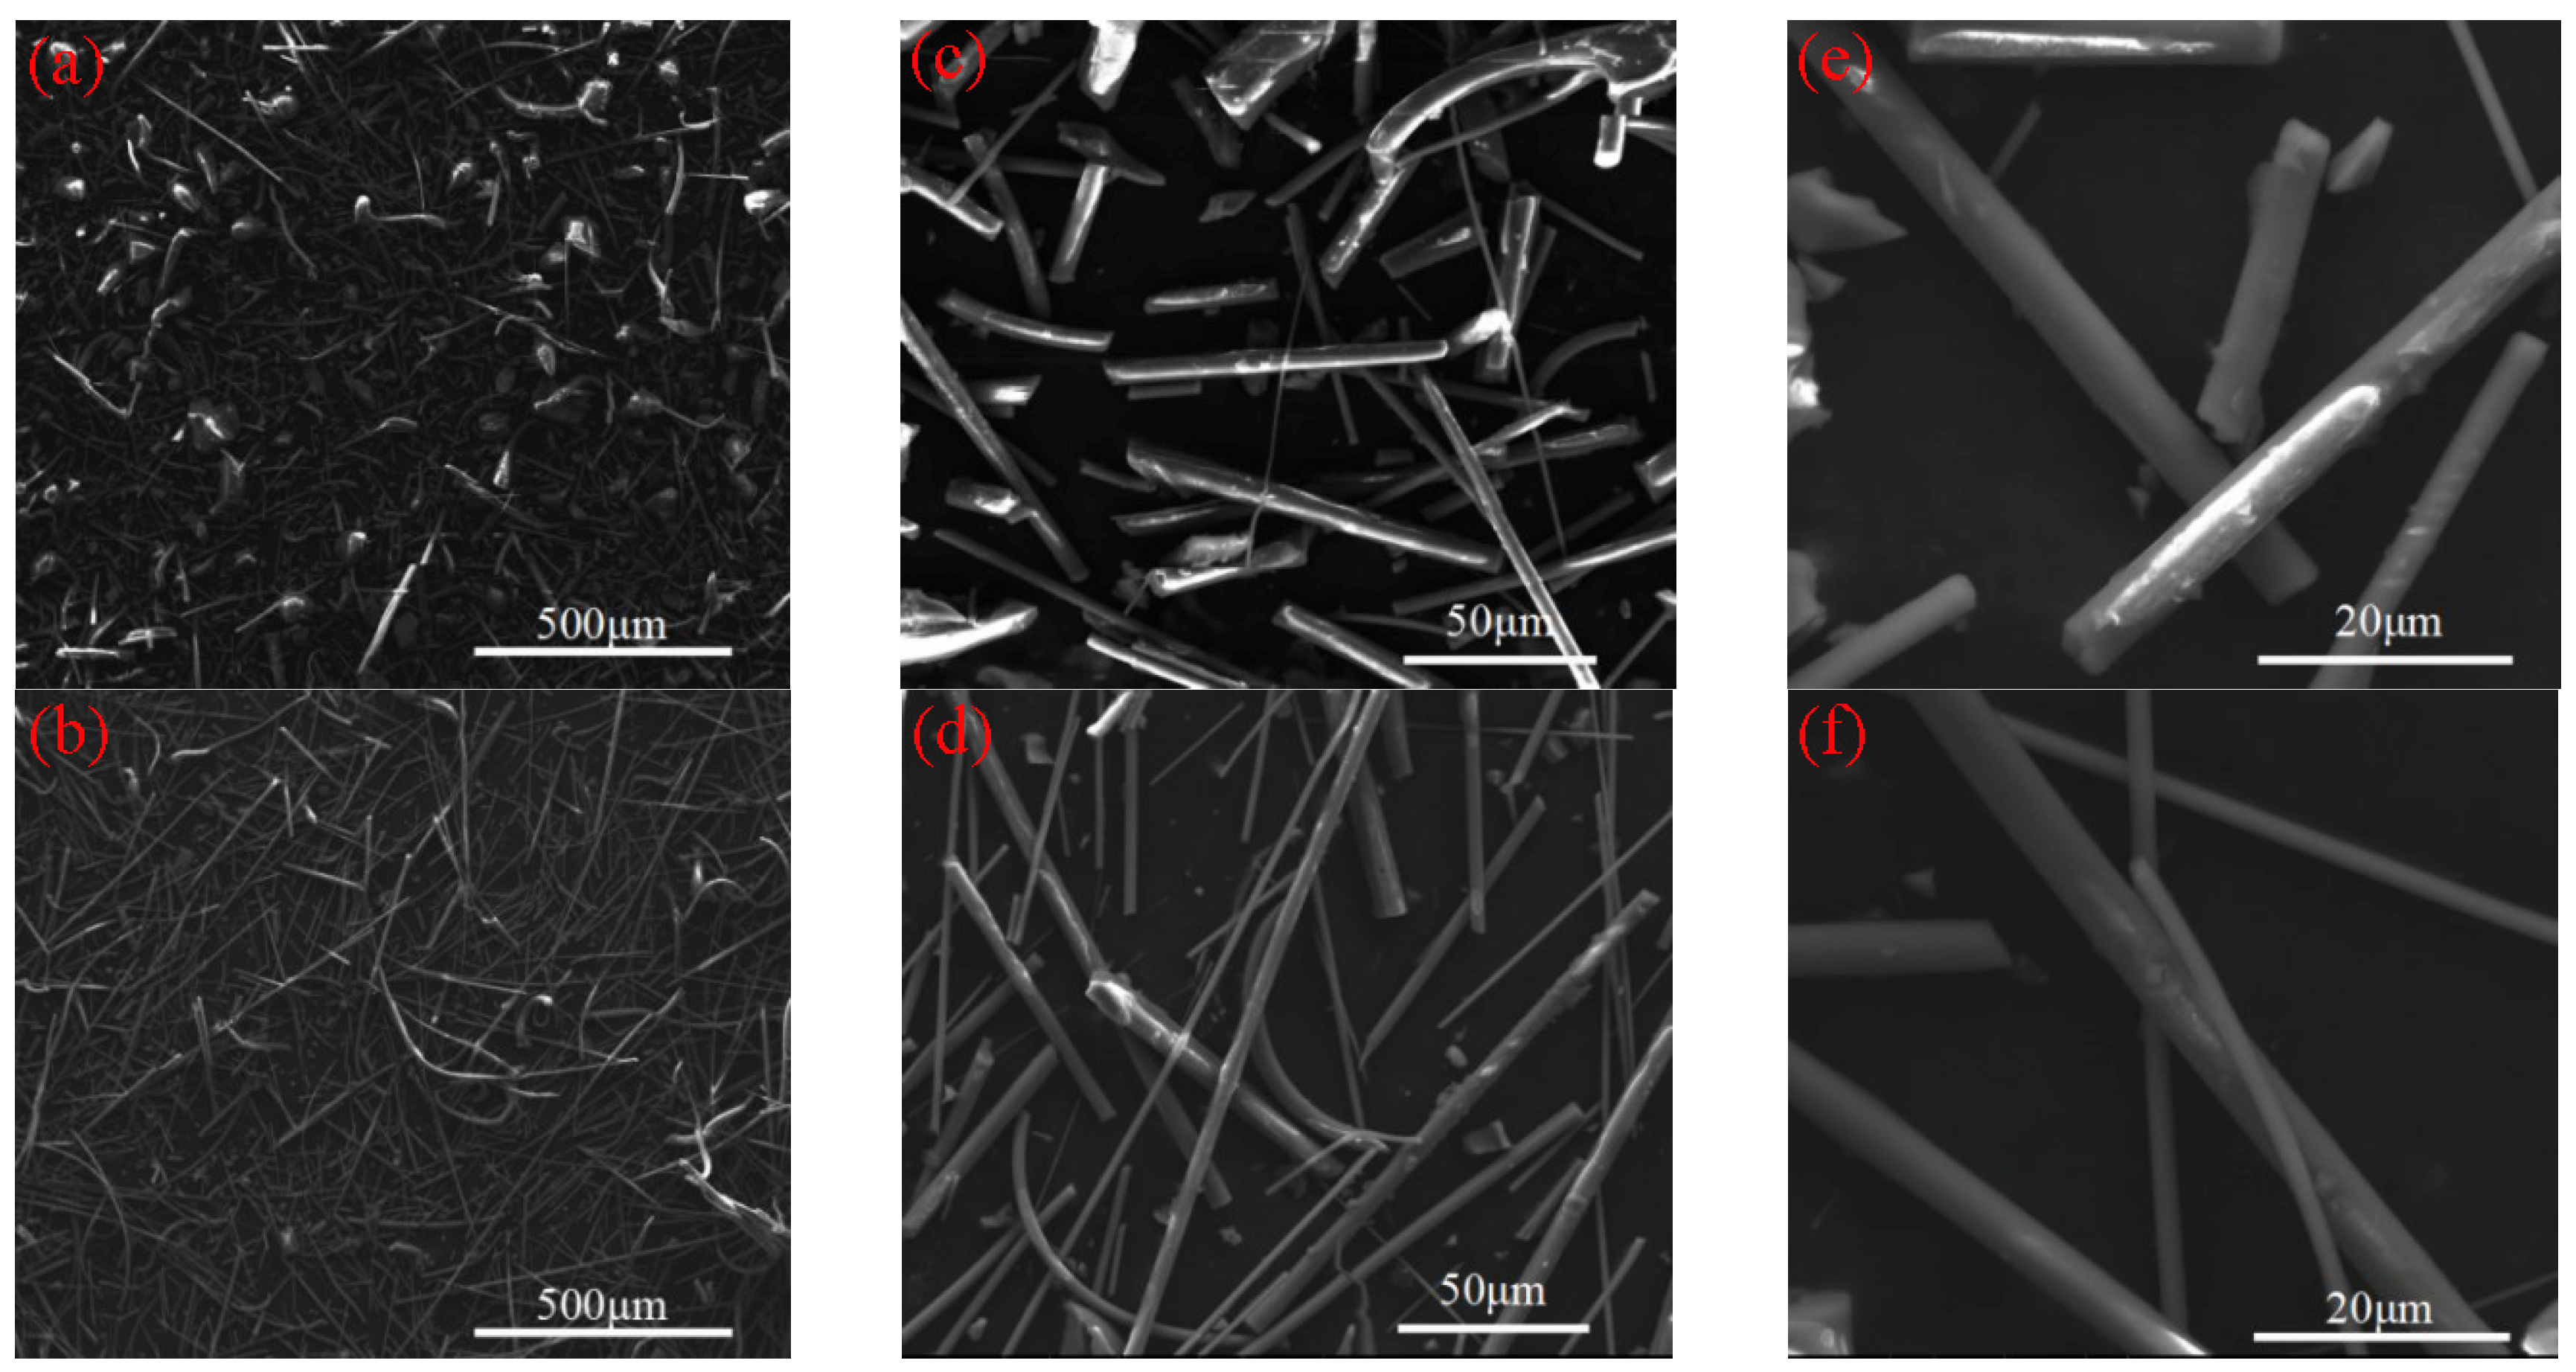
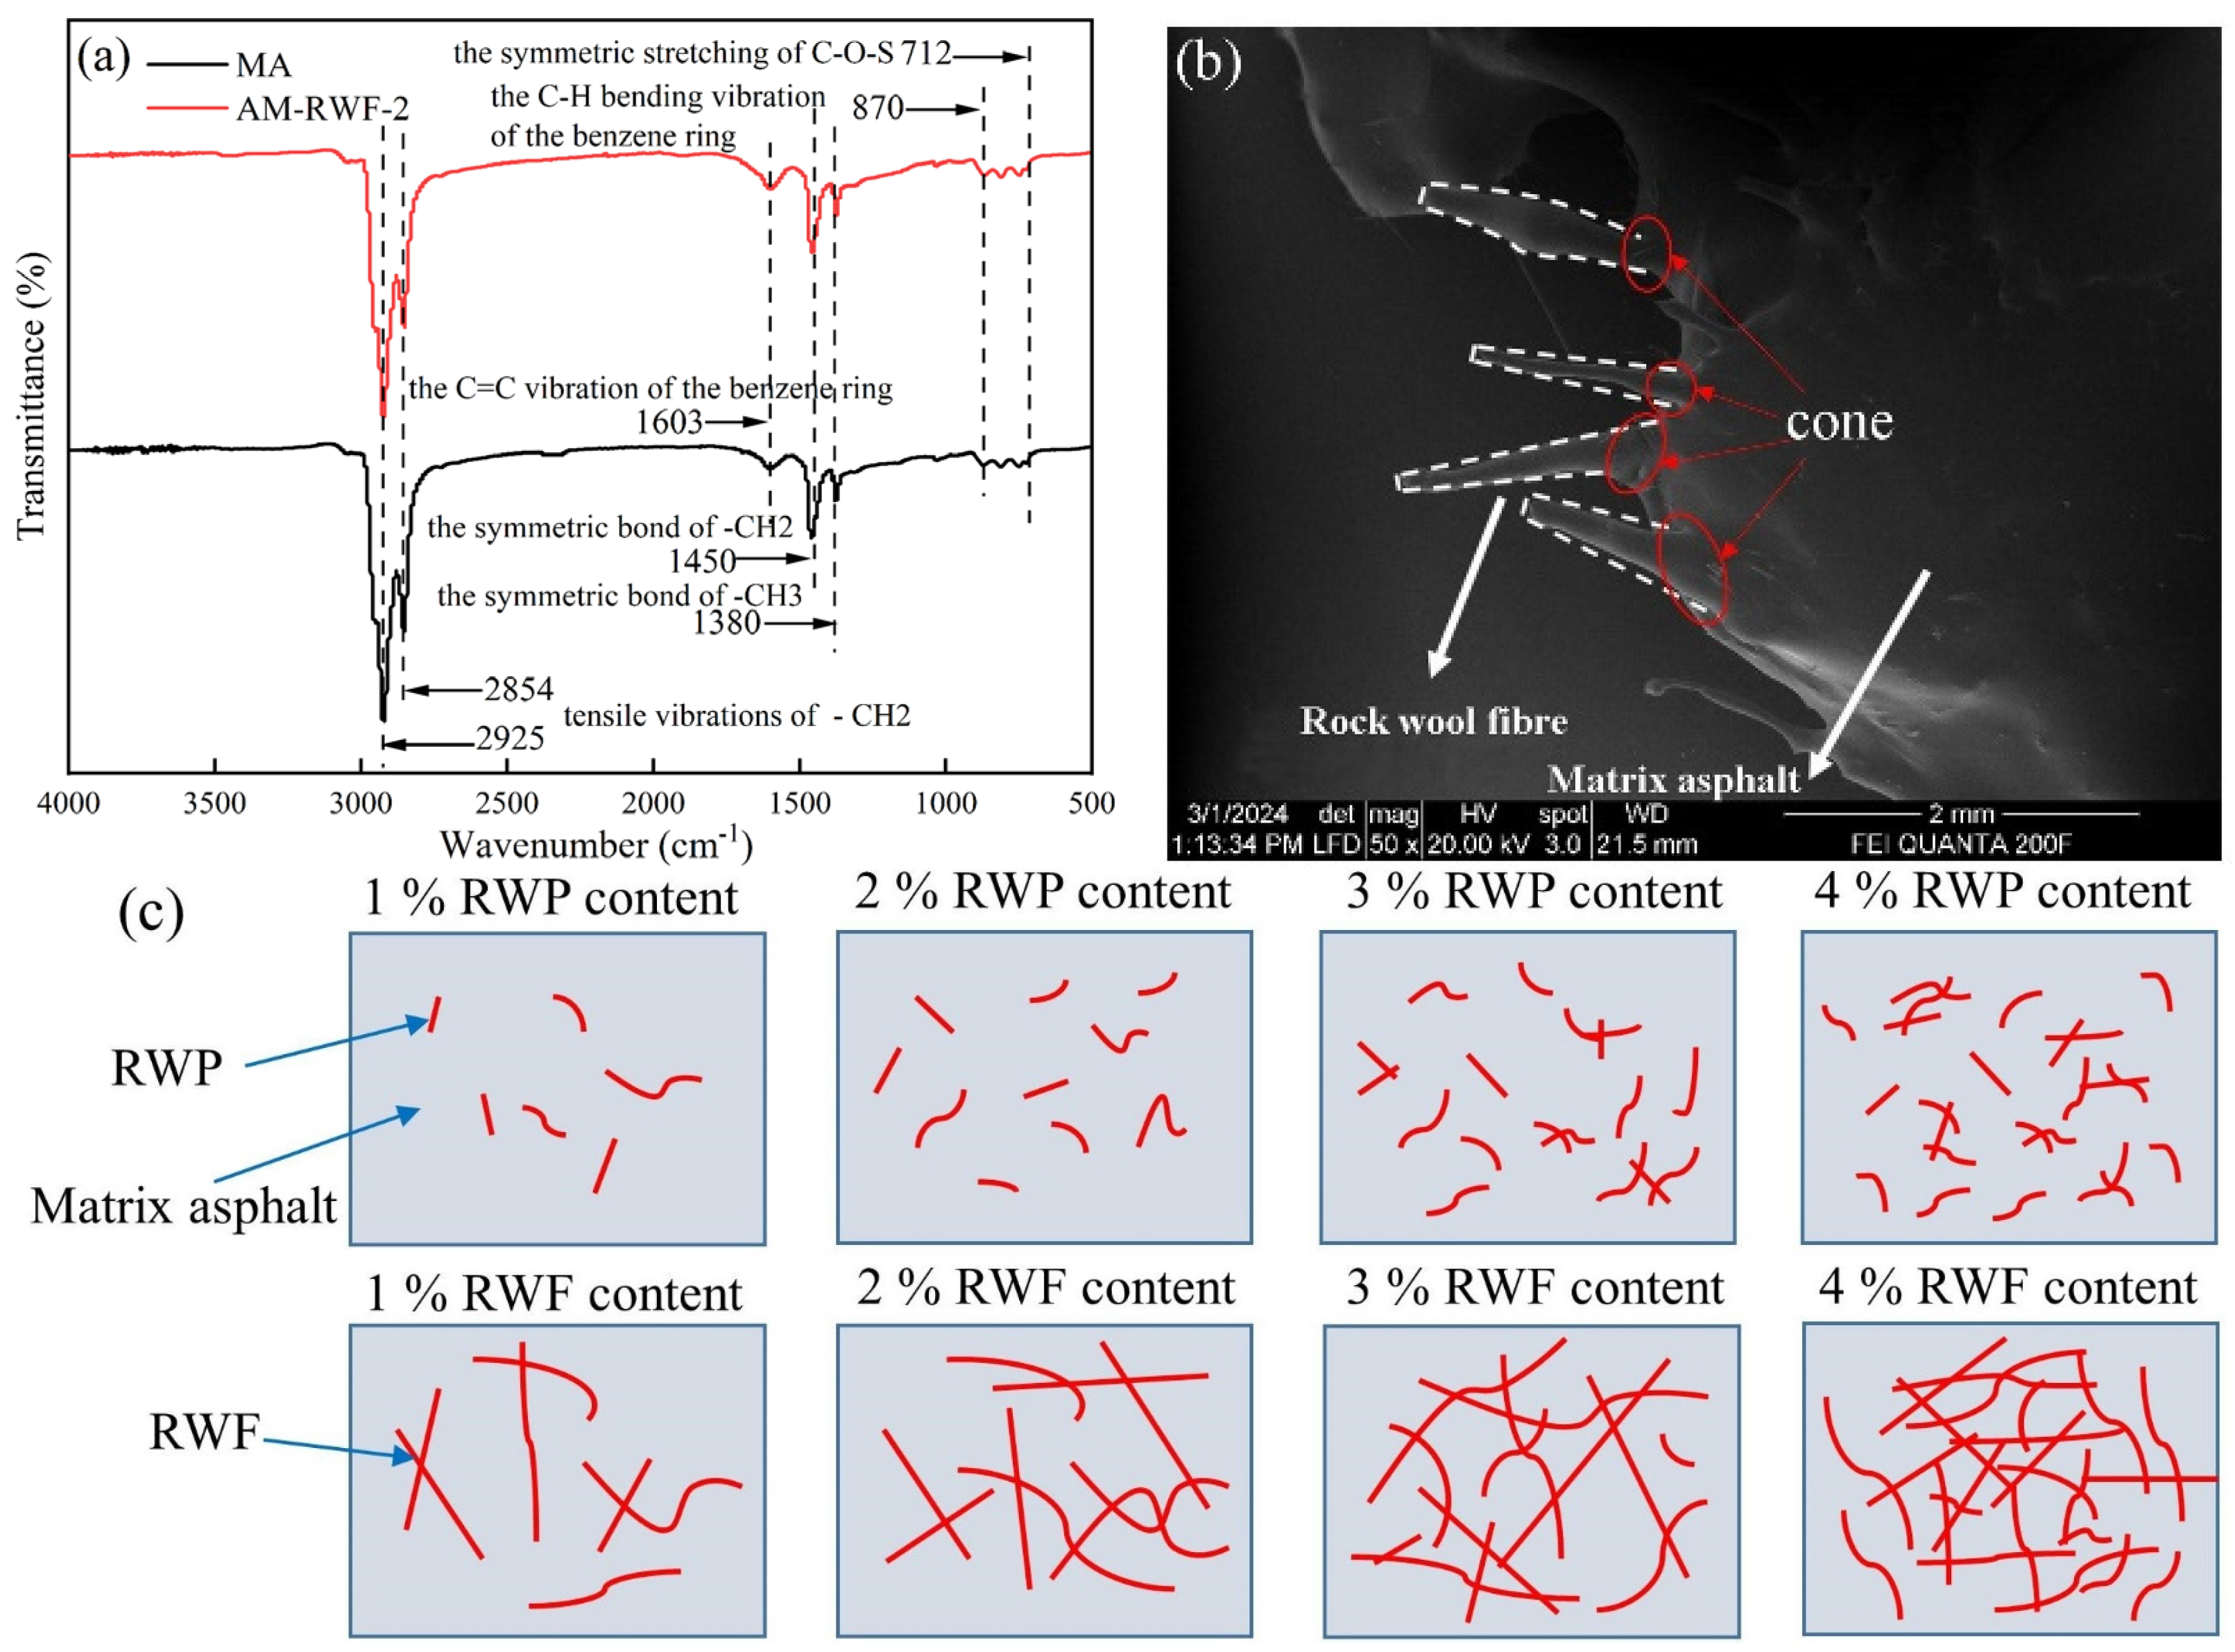
3.1.1. Micromorphology of Rock Wool Fiber
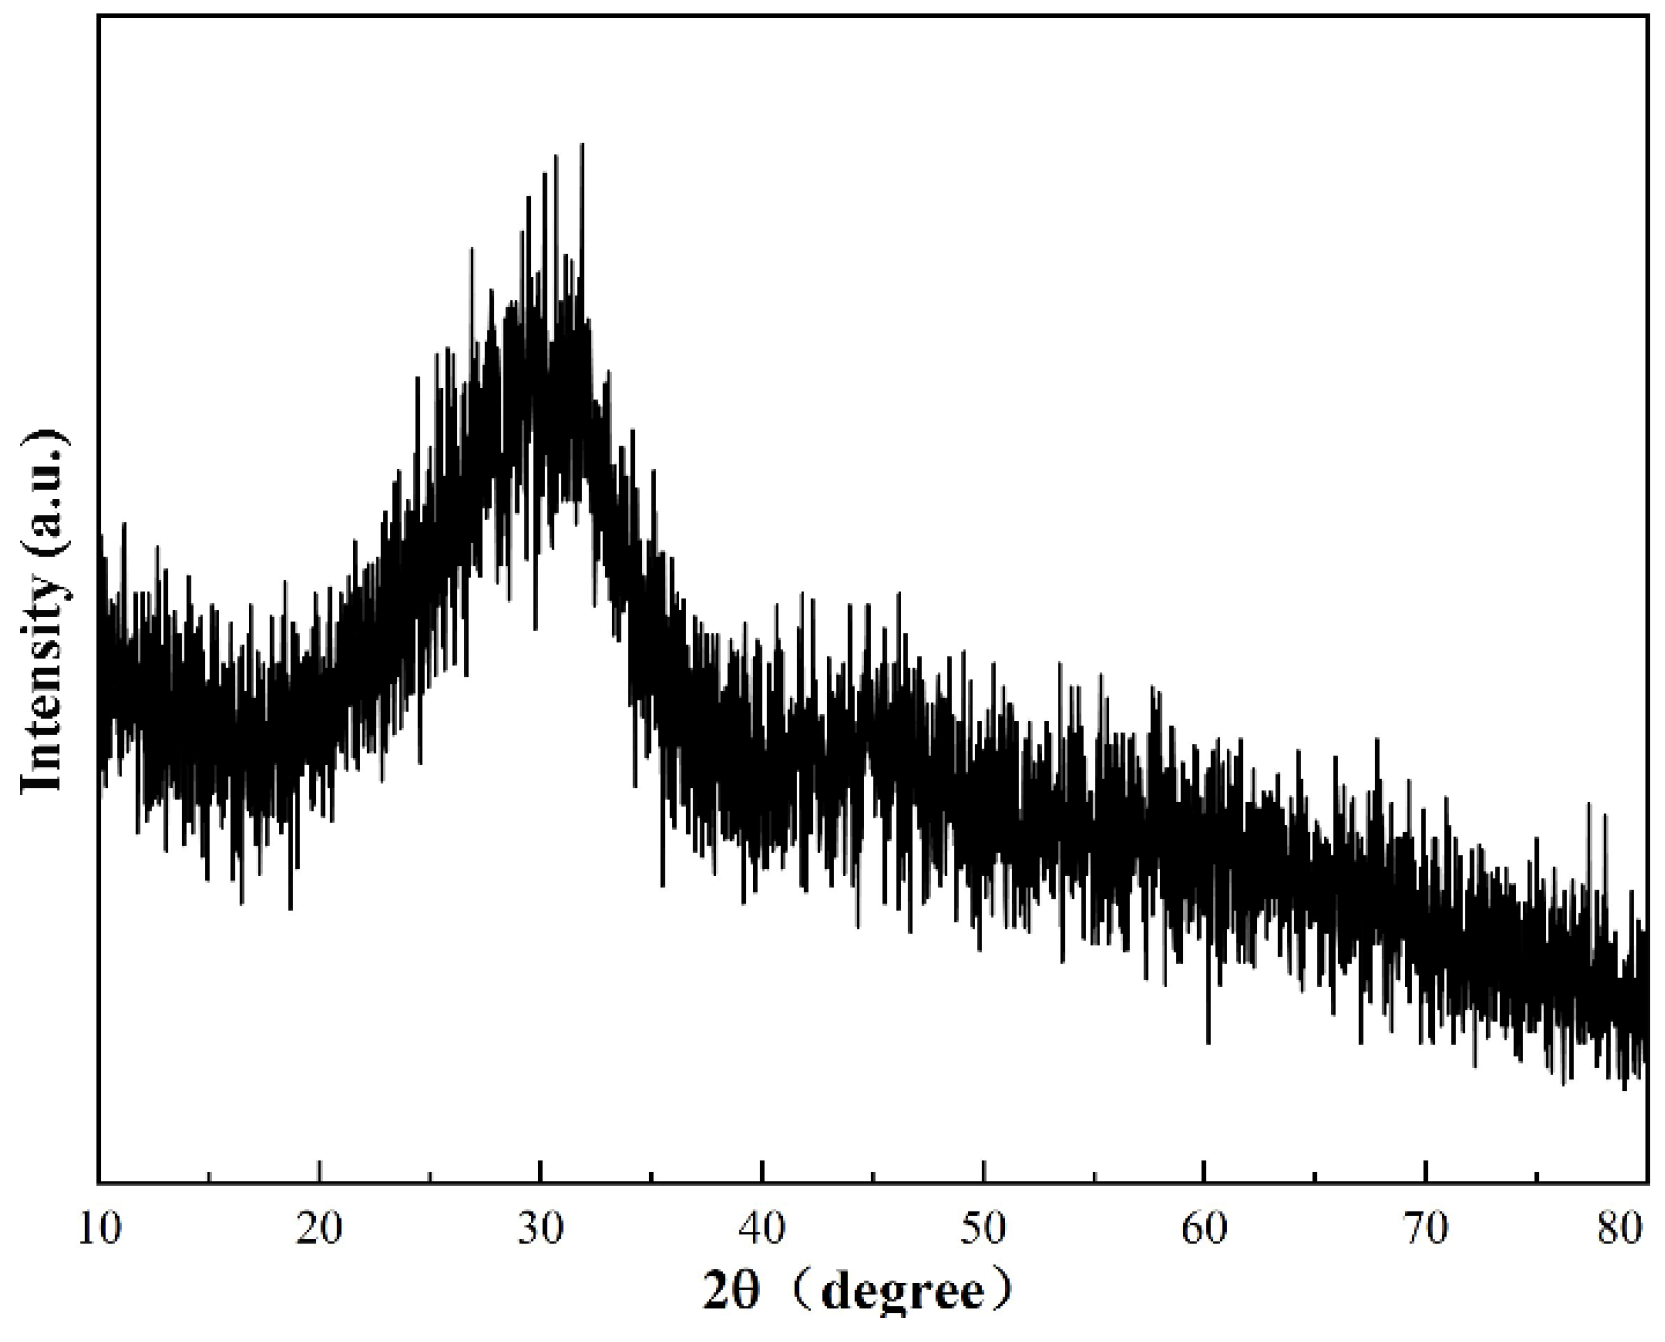
3.1.2. Chemical Compositions and Mineral Compositions of Rock Wool Fiber
3.1.3. Aging Properties of Rock Wool Fiber
3.2. Performances and Mechanism of Modified Asphalt Mortar with RWP and RWF
3.2.1. Temperature Susceptibility
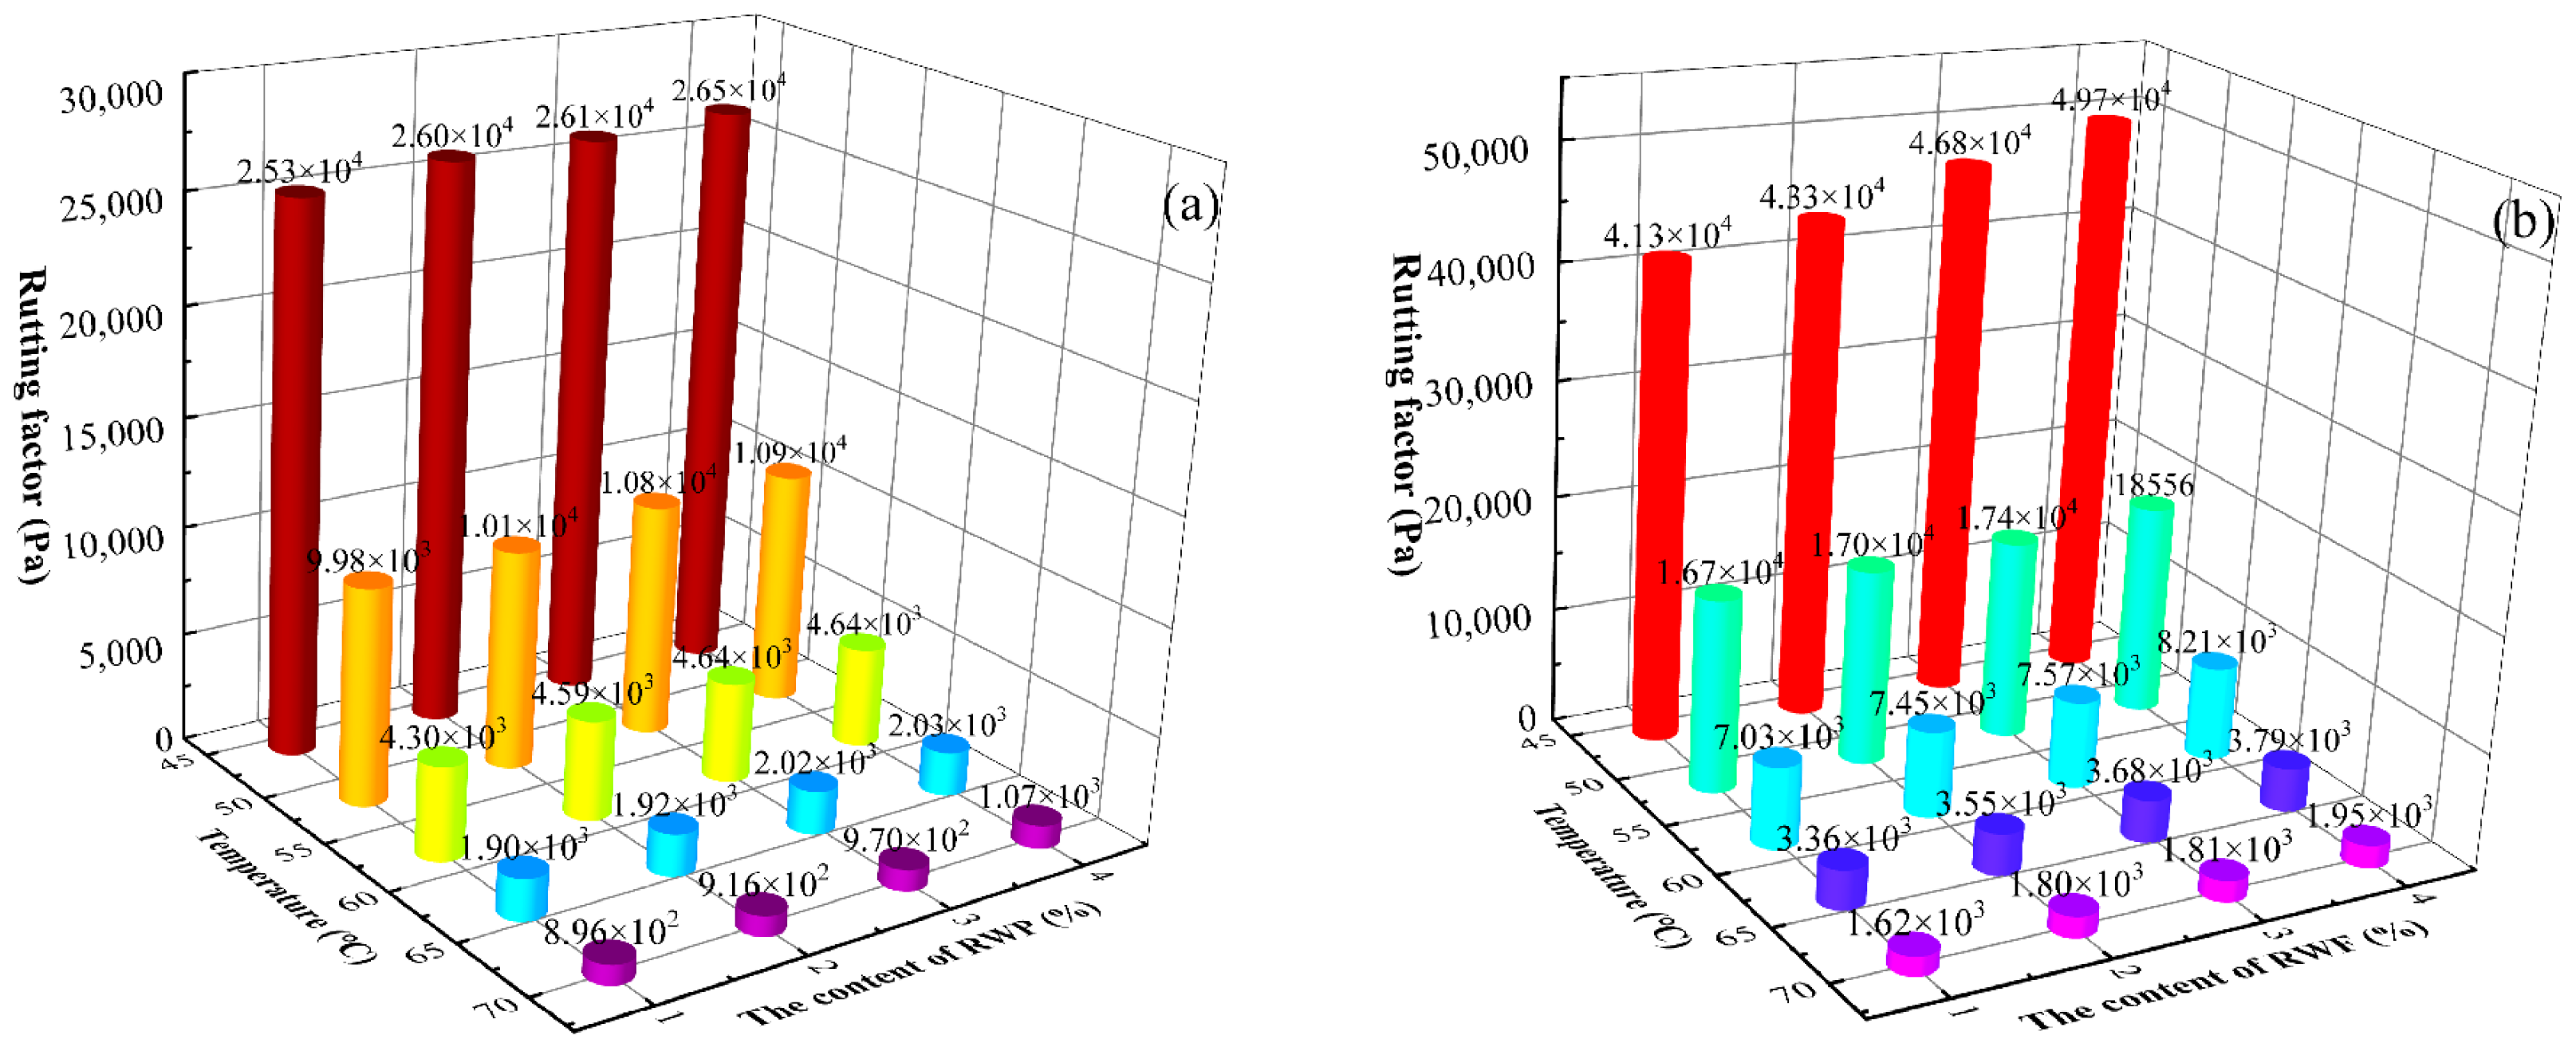
3.2.2. High Temperature Performance
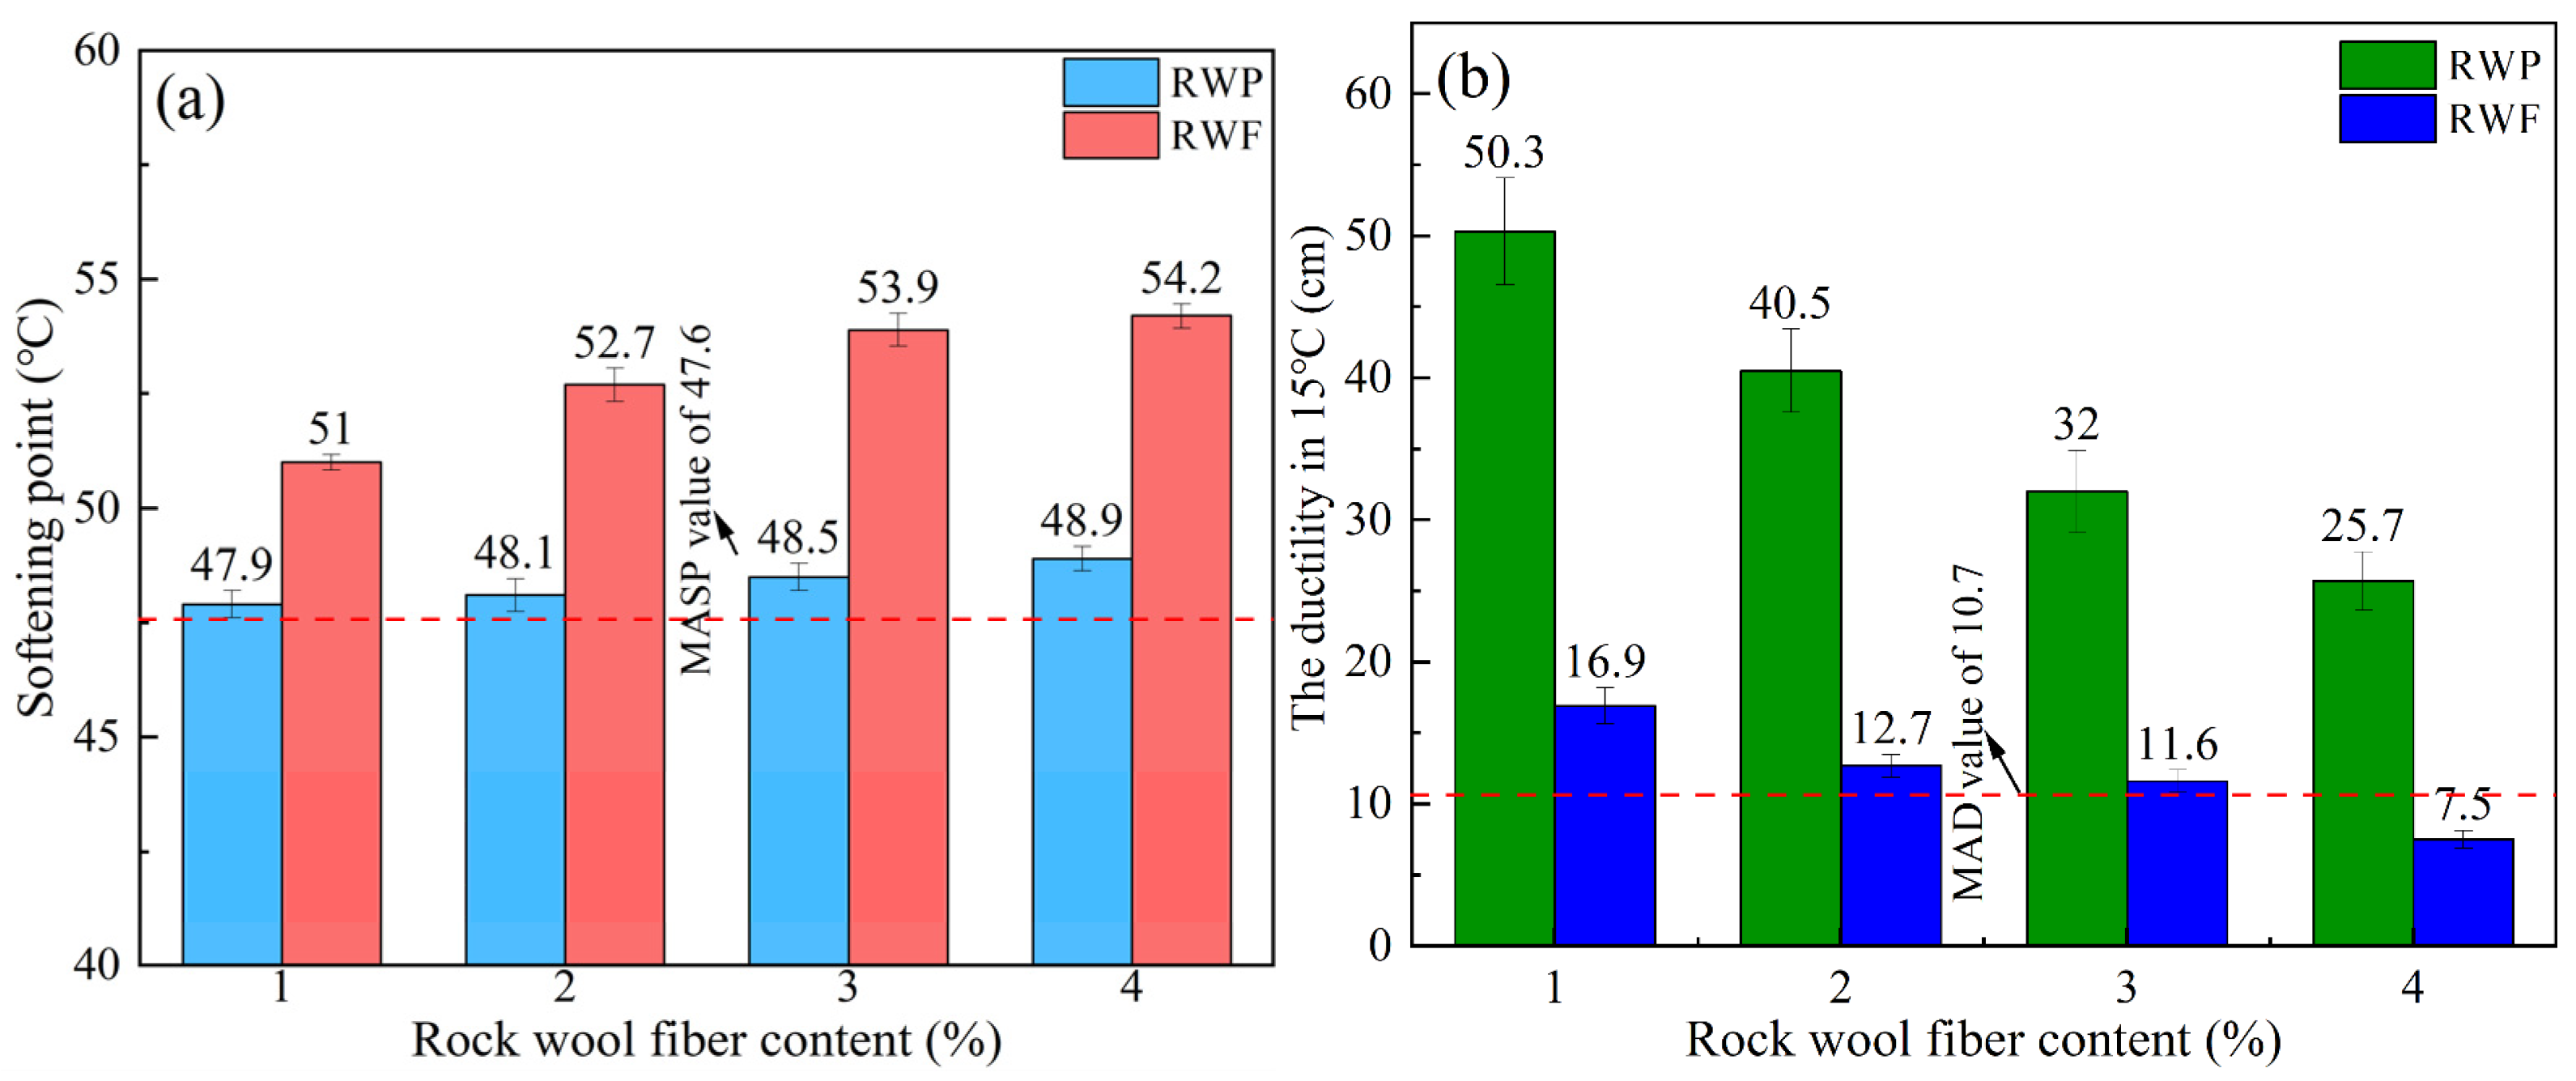
3.2.3. Low-Temperature Performance
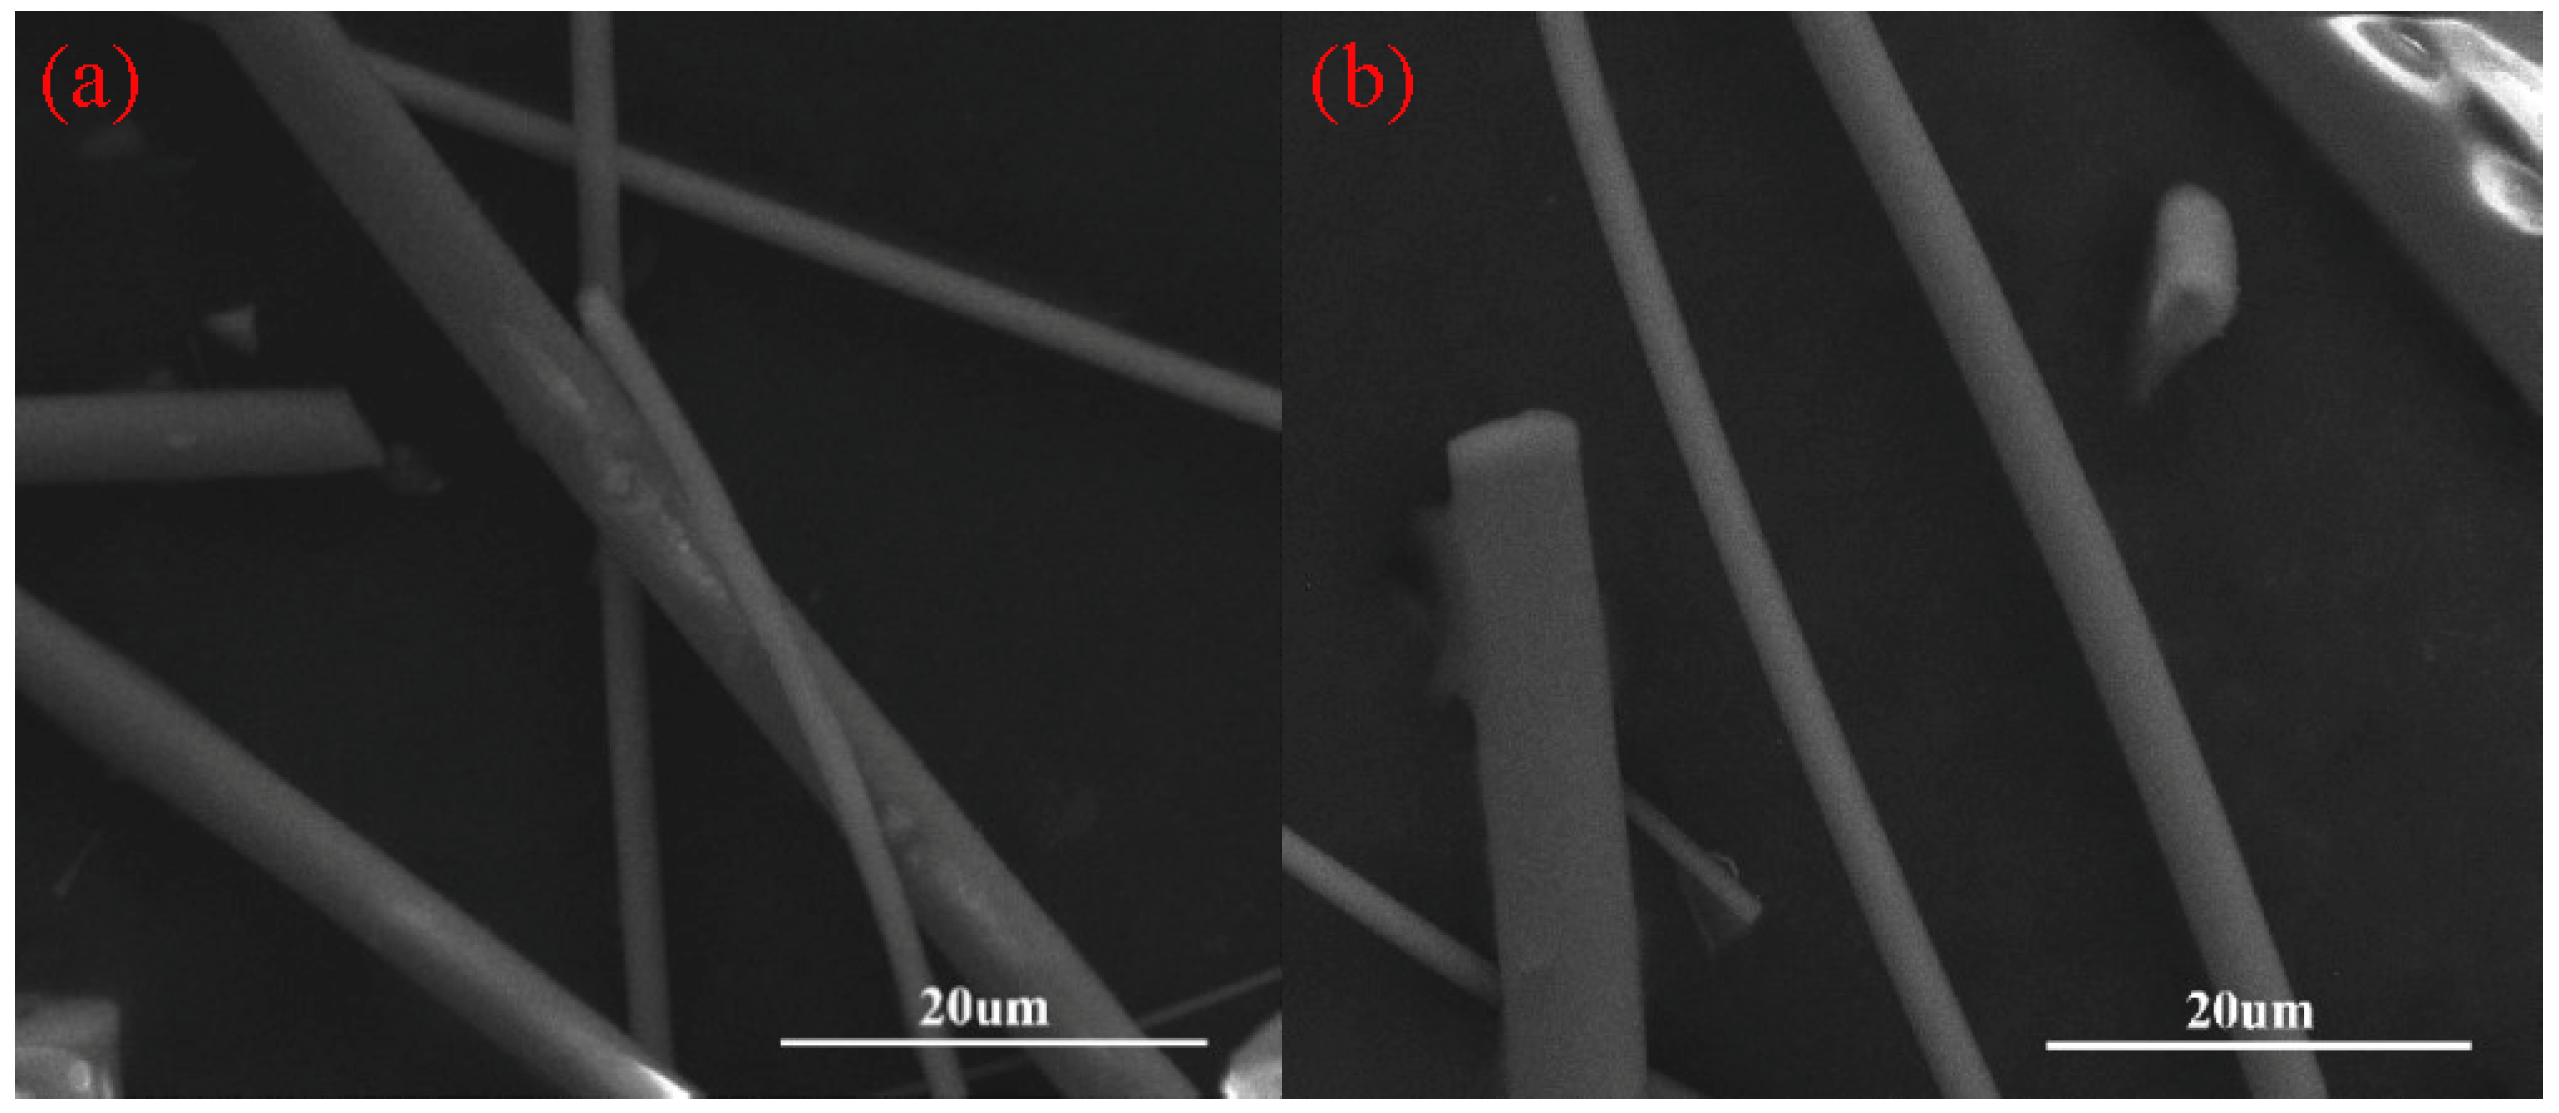
3.2.4. Mechanism of RWF-Modified Asphalt Mortar
3.3. RWF-Modified Asphalt Mixture Performances
3.3.1. Marshall Test Results
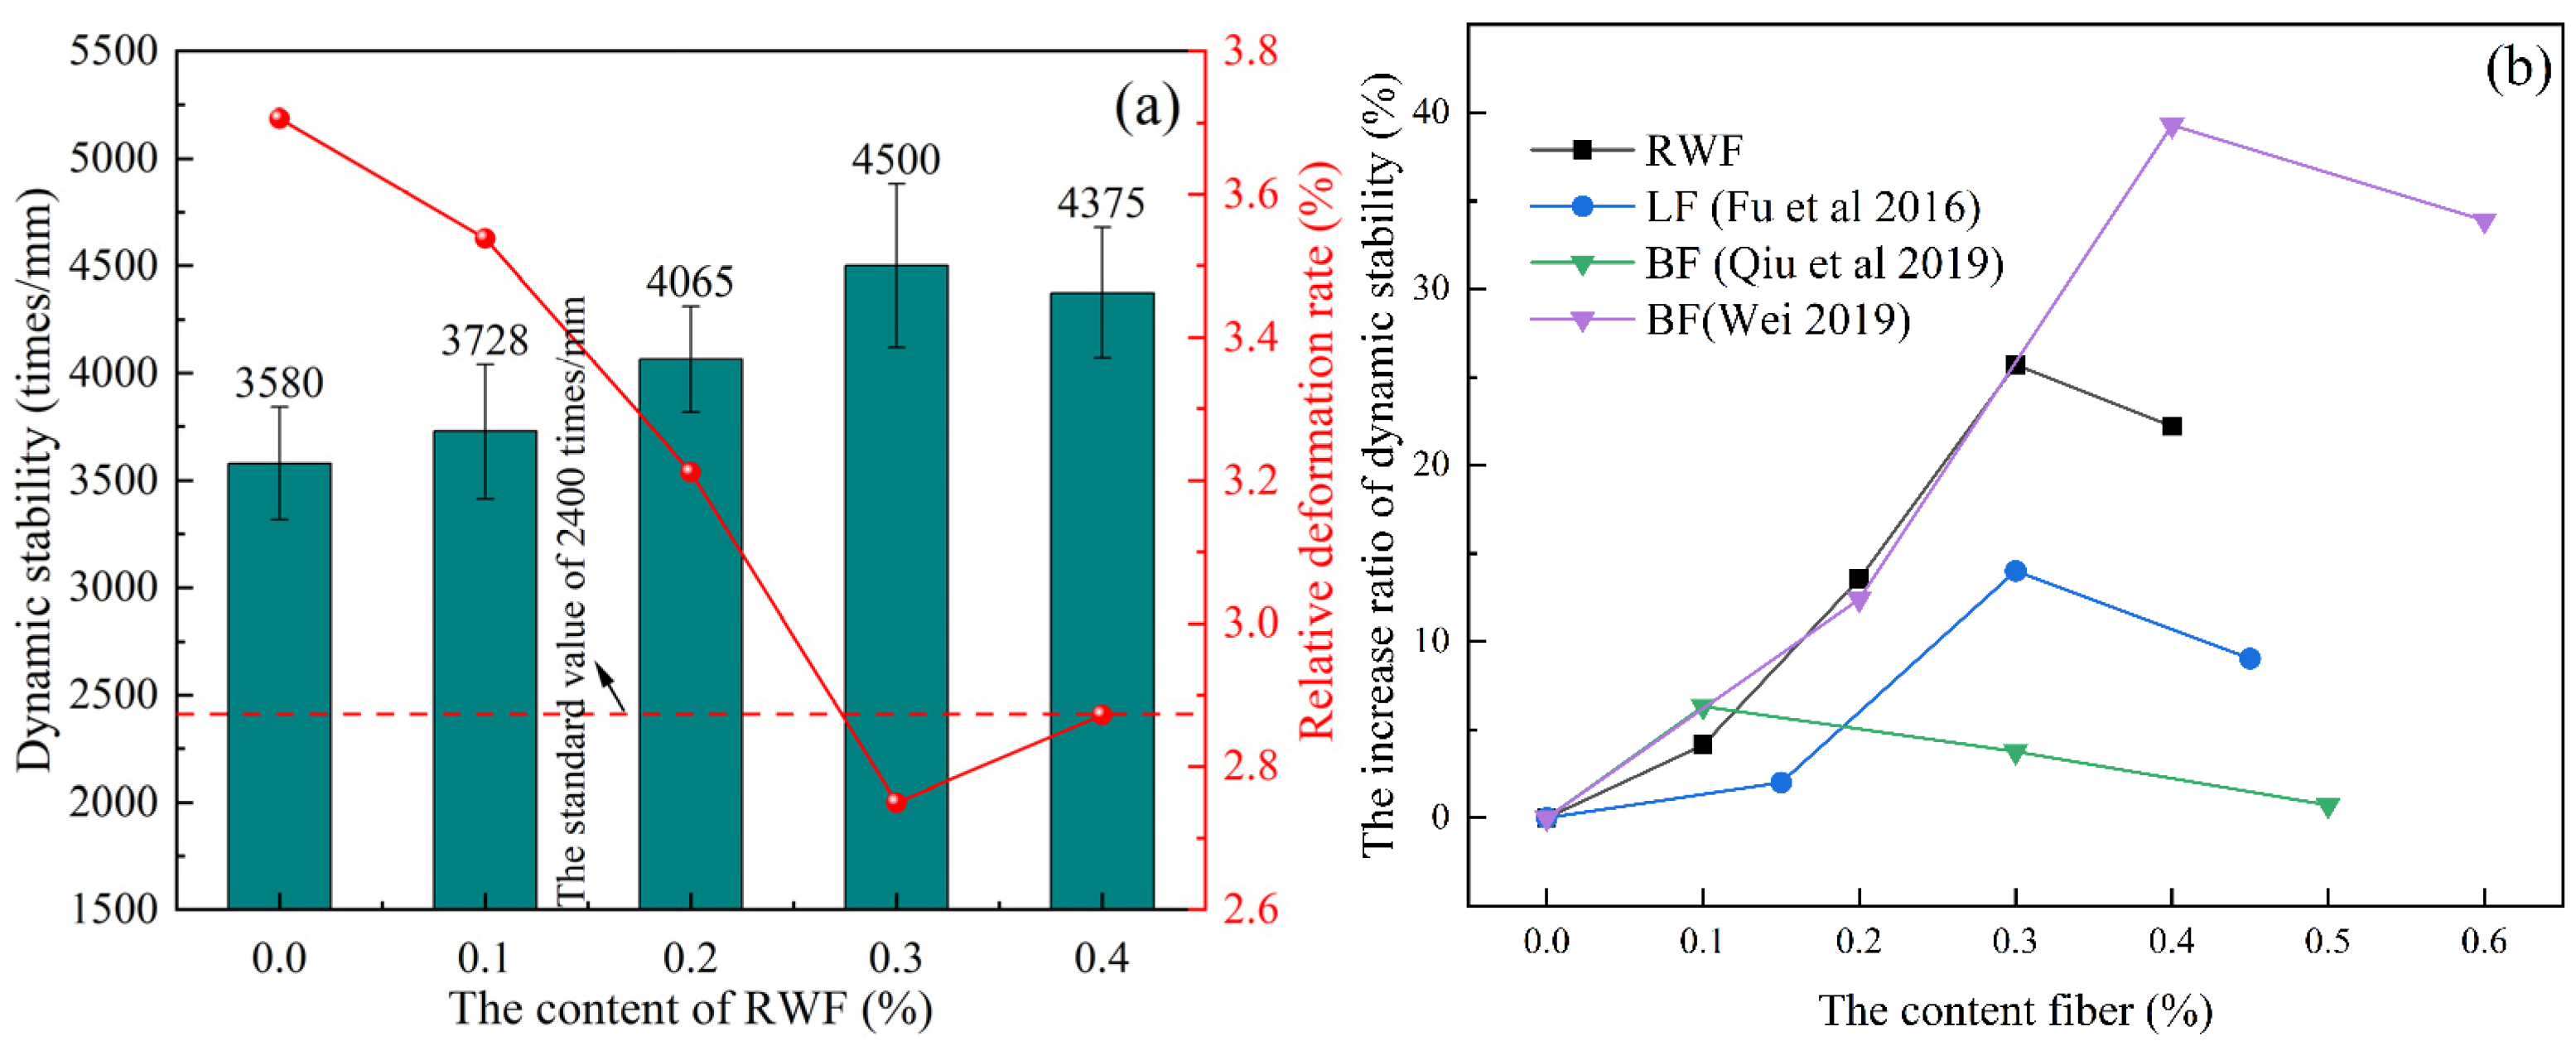
3.3.2. High Temperature Stability
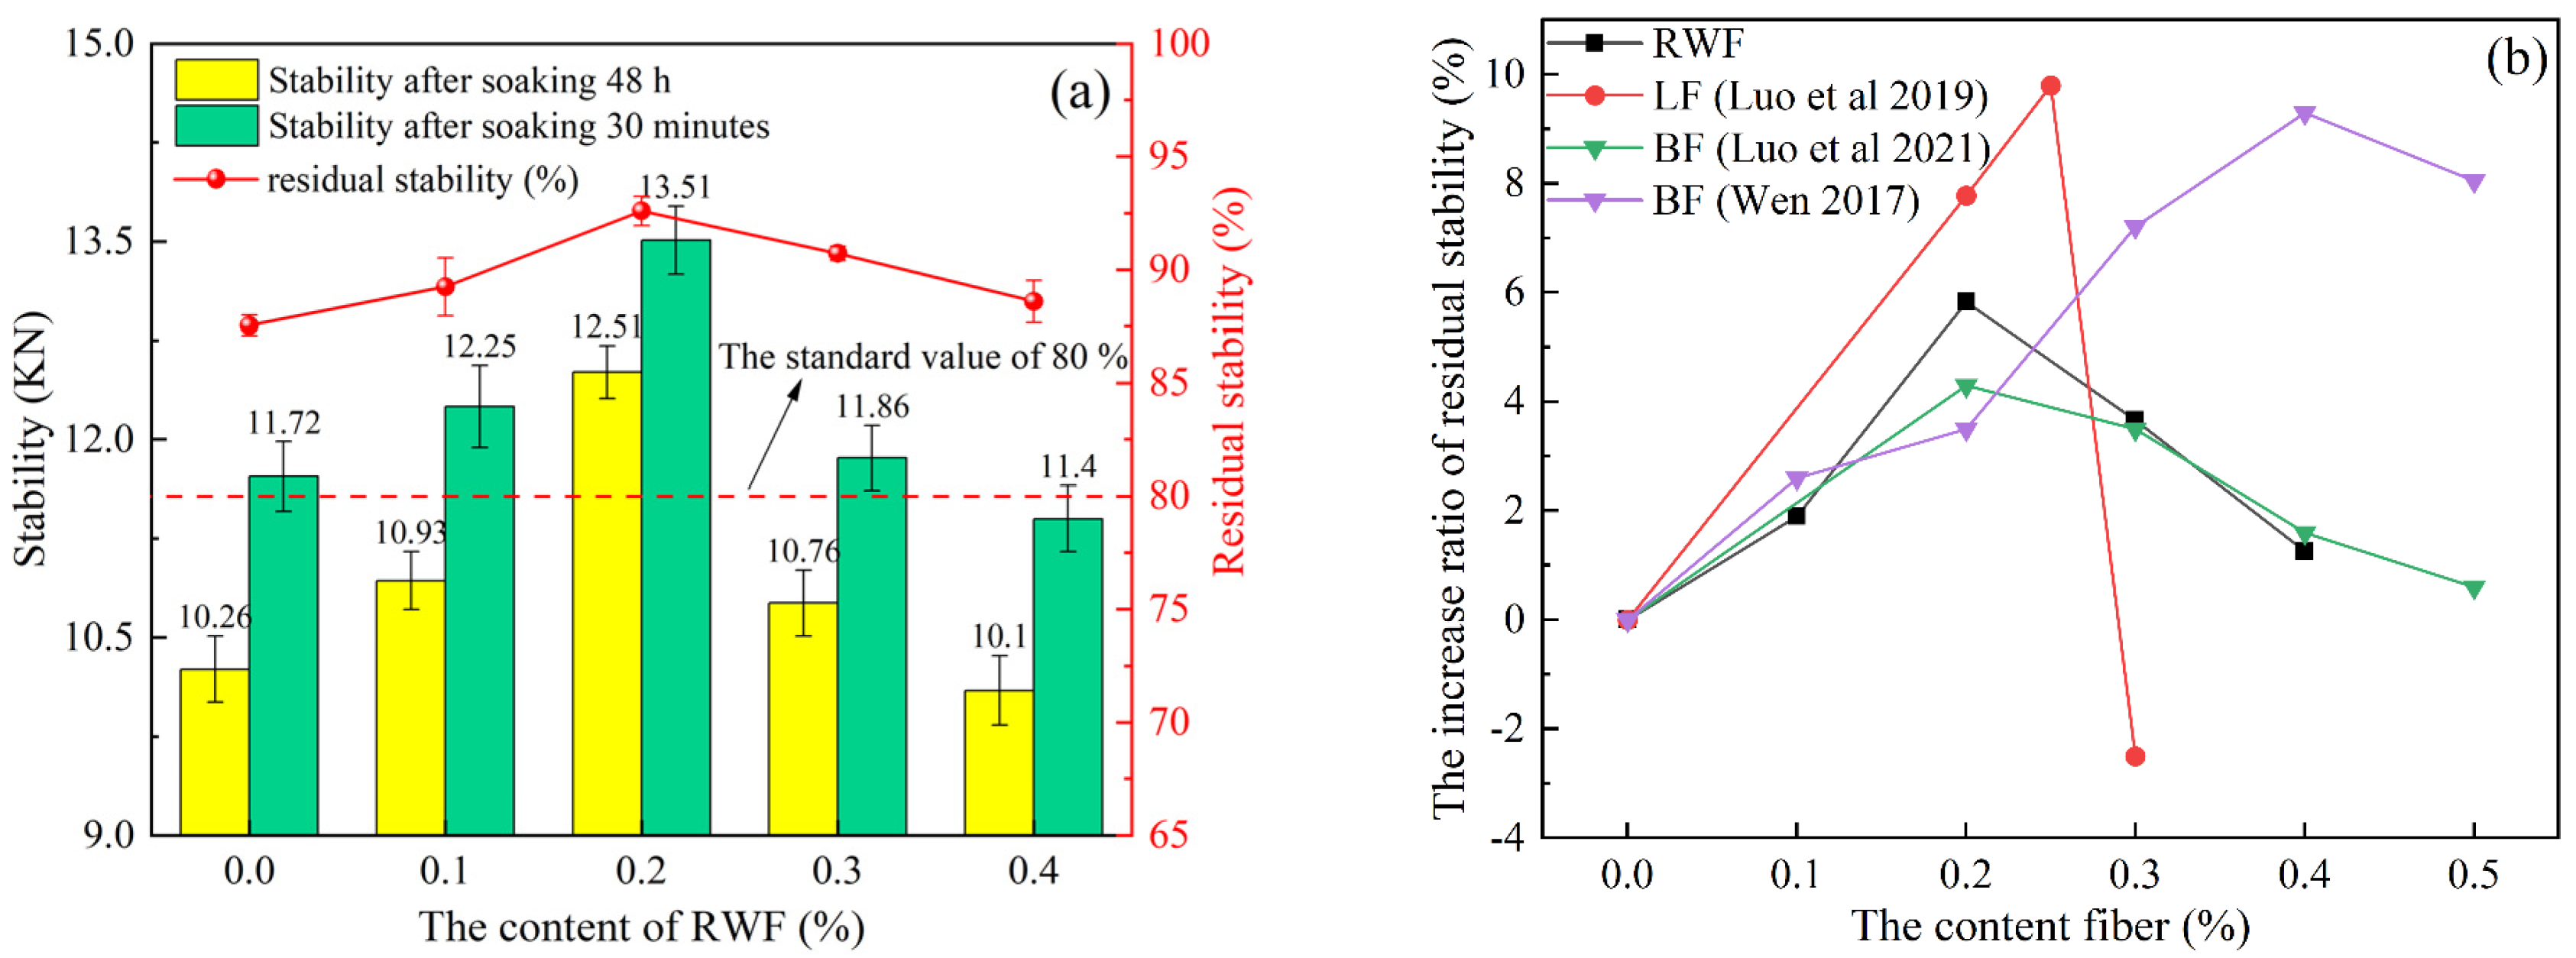
3.3.3. Water Stability
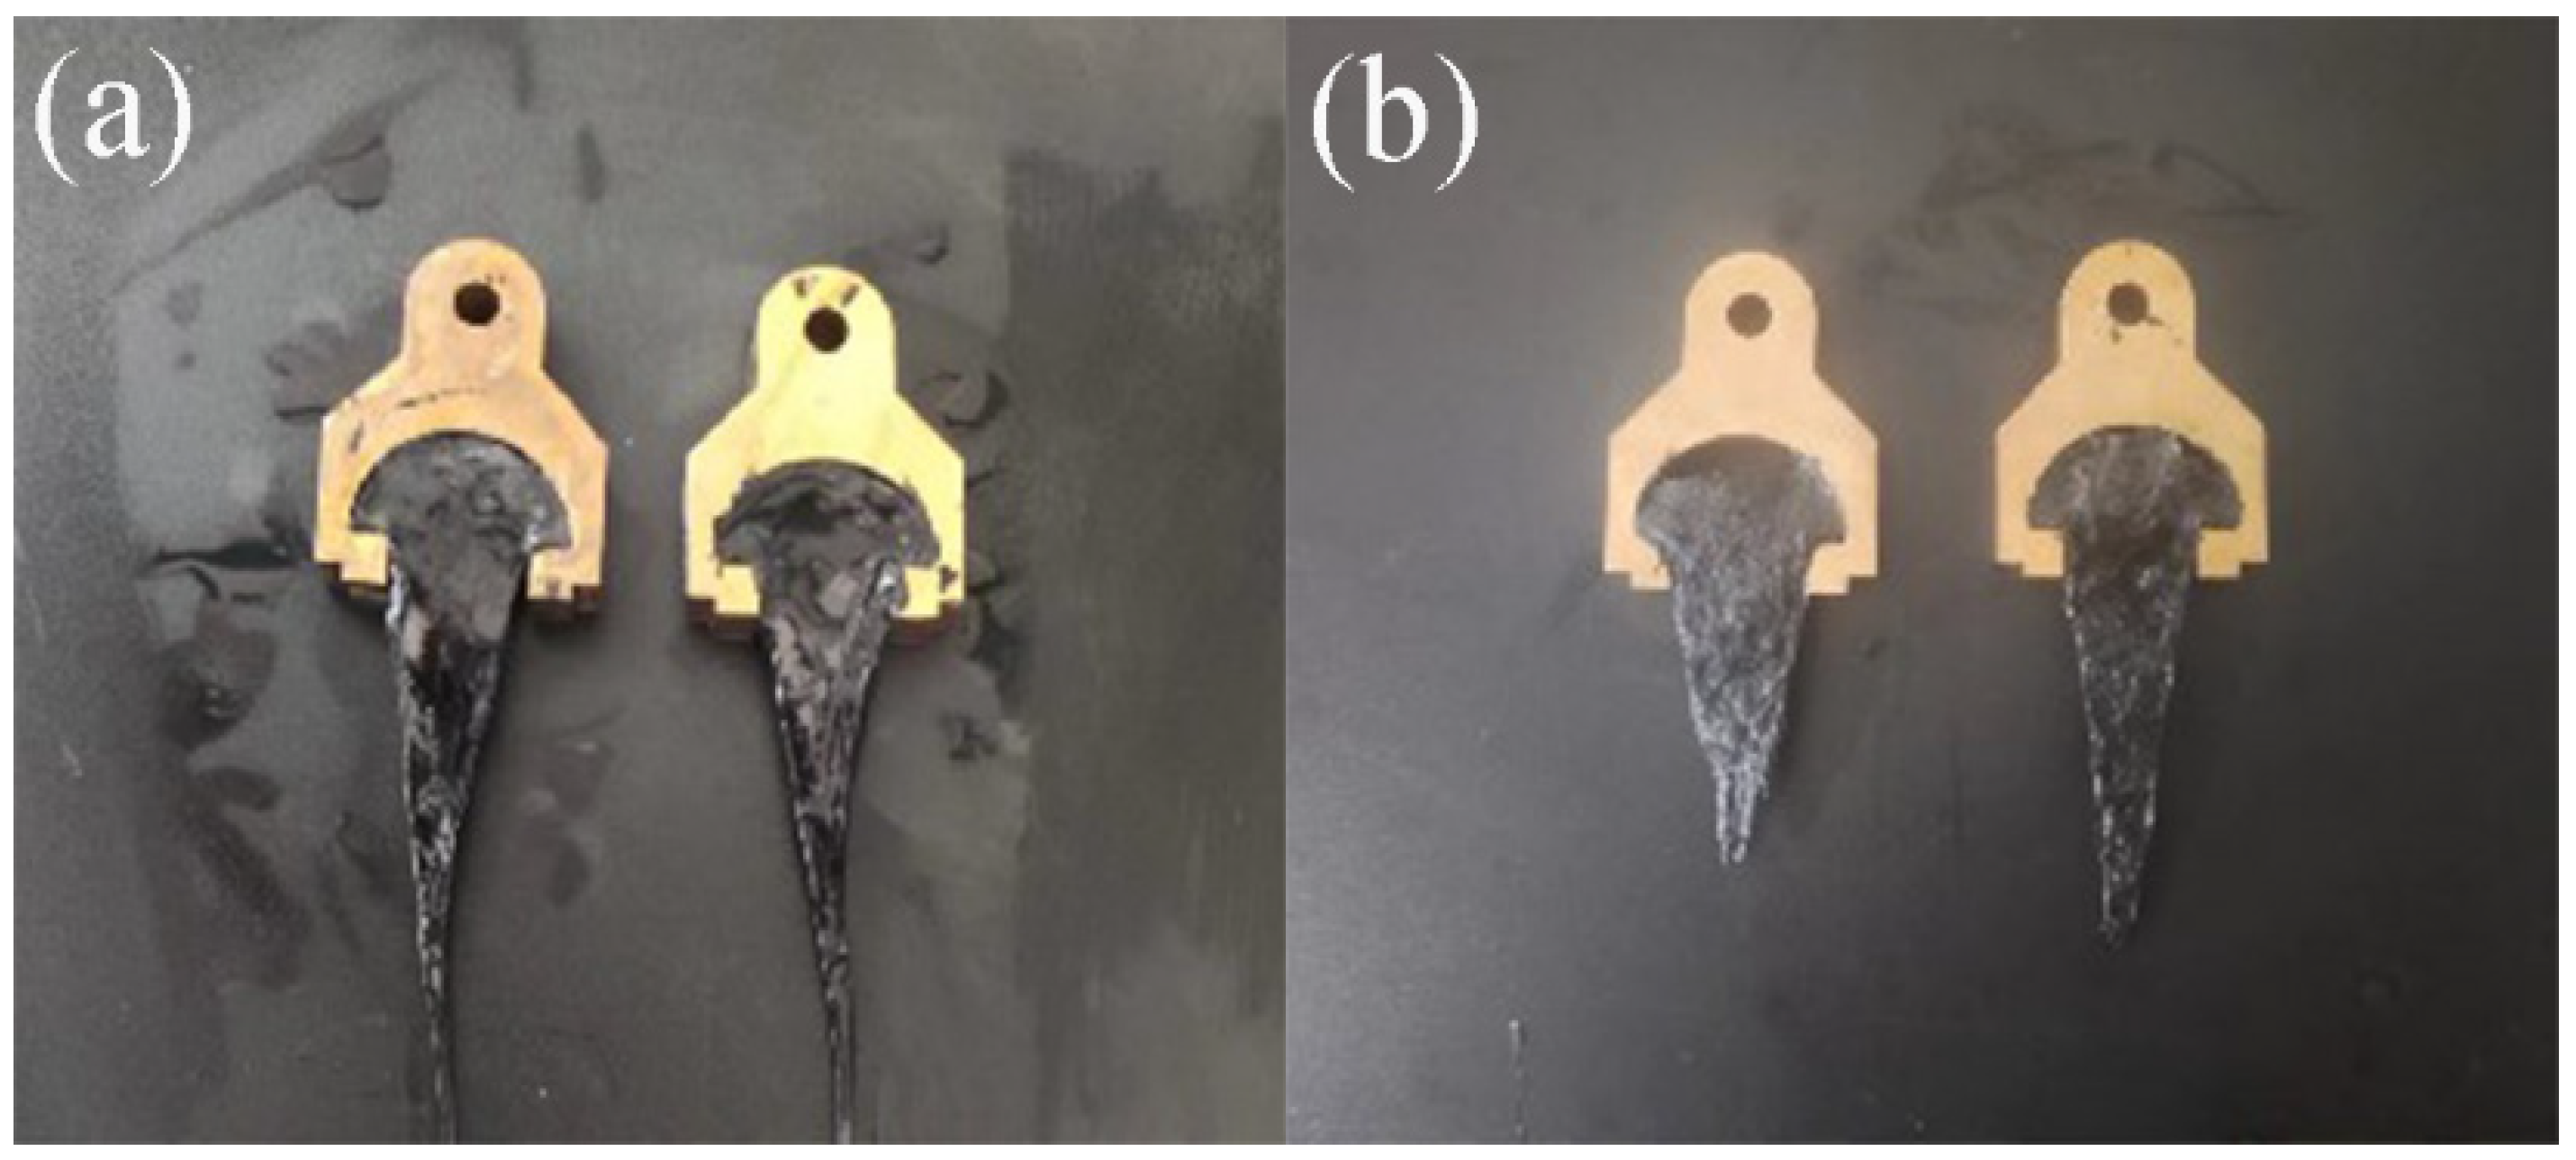
3.3.4. Low-Temperature Crack Resistance Performance
- (1)
- Analysis of low-temperature trabecular bending test
- (2)
- Analysis of low-temperature splitting test
3.4. Environmental Benefit Analysis
3.4.1. Analysis of EC and CEs During Construction Period
3.4.2. Economic Benefit Analysis
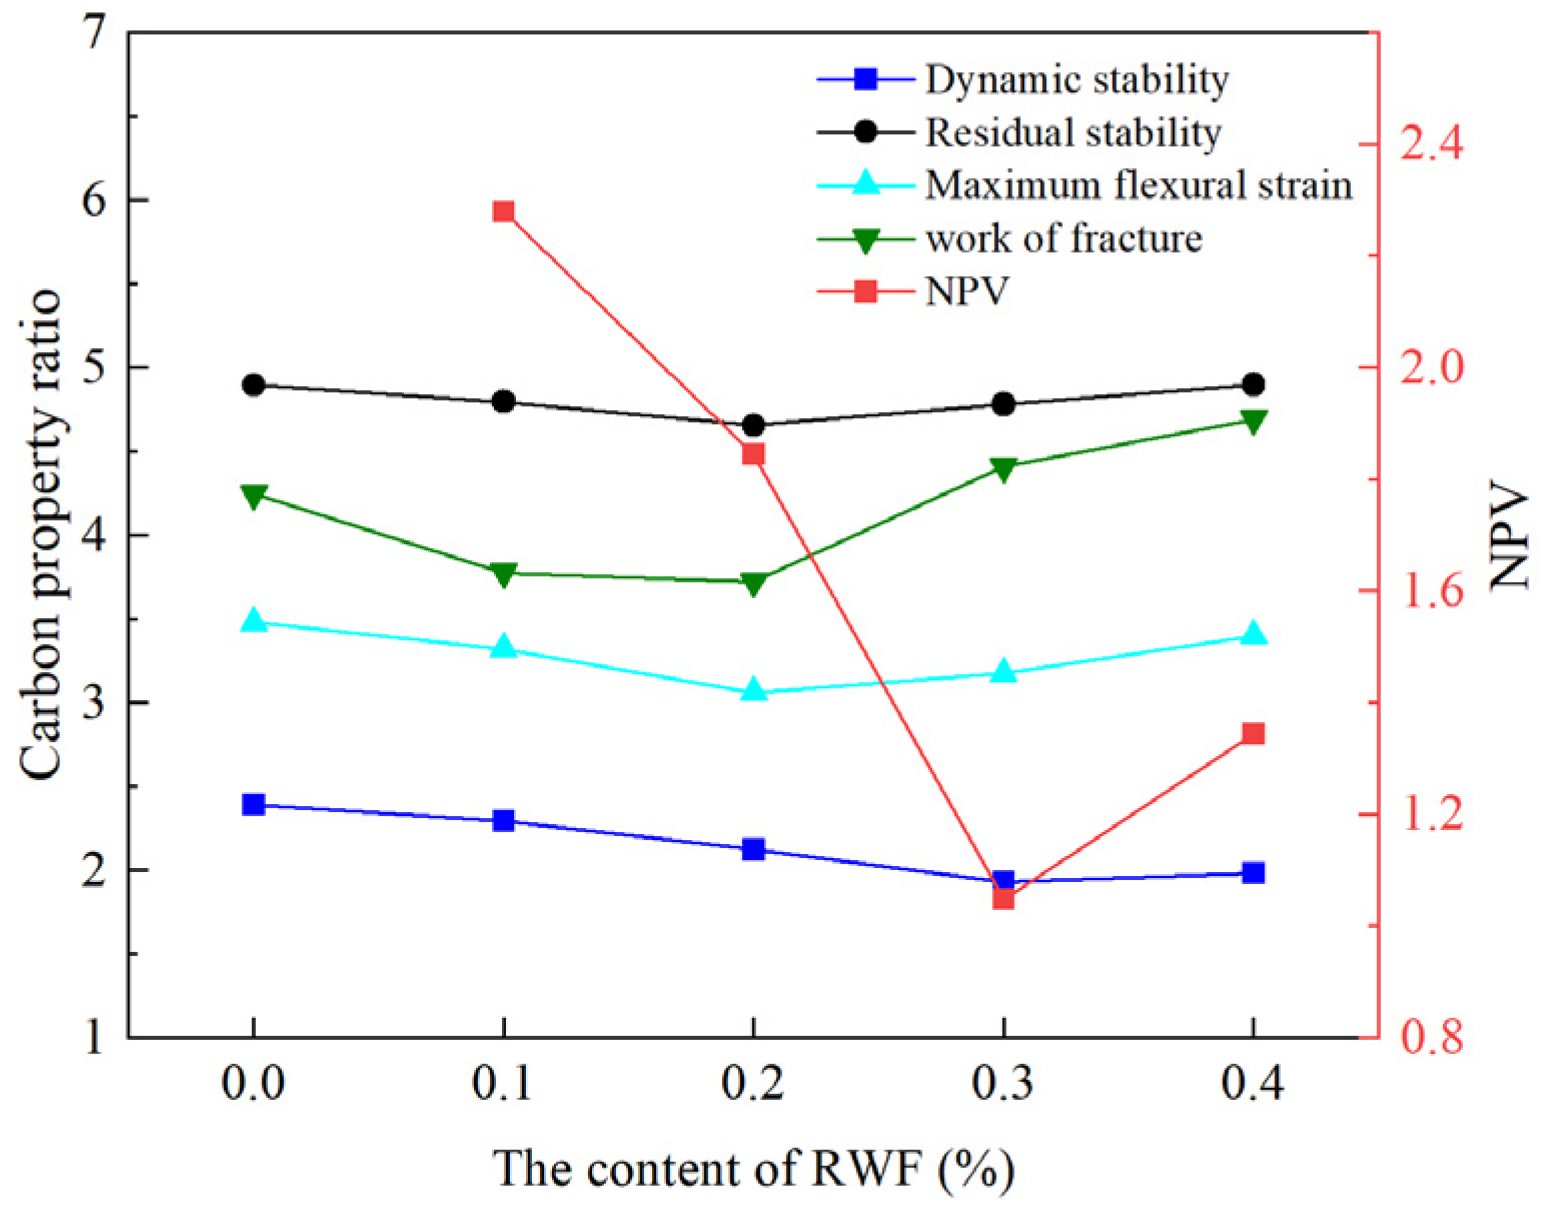
3.4.3. CPR Assessment
4. Conclusions
- (1)
- Rock wool fiber functions as an inert fiber stabilizer to physically reinforce asphalt. RWP primarily serves as a filler to enhance the strength of asphalt mortar. RWF forms a three-dimensional network structure that plays a stiffening and bridging role, thereby improving the adhesion and toughness of the mixture. Additionally, adhesive failure occurs in RWP-modified asphalt mortar. In contrast, when the RWF content exceeds 3%, the failure mode shifts to brittle failure in RWF-modified asphalt mortar.
- (2)
- The performances of RWP and RWF-modified asphalt is superior to that of matrix asphalt. RWF demonstrates greater superiority in terms of temperature susceptibility and high temperature performance. Among these, RWF-modified asphalt with a 4% content exhibits the best performance. The optimal penetration values at 15 °C, 25 °C, and 30 °C are 18.3 0.1 mm, 46 0.1 mm, and 67 0.1 mm, respectively. The corresponding optimal PI and softening point are 0.36 and 54.2 °C, respectively. The optimal G*/sinδ value at 46 °C is 49,669 Pa. In comparison, RWP exhibits more excellent low-temperature performance. The optimal ductility for RWP-modified asphalt with a 1% RWP content is 50.3 cm.
- (3)
- RWF can improve the high temperature performance, water stability and low-temperature crack resistance of asphalt mixtures. It has the best high temperature performance at 0.3% RWF, and its dynamic stability is 4500 times/mm. The best water stability and low-temperature crack resistance is at 0.2% RWF. The residual stability, maximum flexural strain, and fracture energy are 92.6%, 2816 με, and 3588.26 J/m2, respectively.
- (4)
- The EC and CEs during the construction period of pavement asphalt mixtures are primarily attributed to raw material production, rock wool recovery, and asphalt mixture mixing, accounting for an average of 75.1% and 76.7%, respectively. Moreover, the total EC and CEs first decrease and then increase with the increase in RWF content. The increase range is not exceeding 1.5% and 1.3%, respectively. The trend is consistent with the contribution from the increased asphalt content. The NPV reaches its maximum at an RWF content of 0.3%, with a value of USD 8277.51. Meanwhile, the BCR exhibits a decreasing trend but remains greater than one, with the highest value of 2.02 observed at an RWF content of 0.1%. Overall, the application of RWF demonstrates a positive economic effect.
- (5)
- The CPR of pavement performance and economic benefit for asphalt mixtures first decreases and then increases with the increasing RWF content. The CPR values for residual stability, maximum flexural strain, and fracture work are lowest at an RWF content of 0.2%, with respective values of 4.65, 3.06, and 3.72. Additionally, the CPR values for dynamic stability and NPV are smallest at an RWF content of 0.3%, with respective values of 1.92 and 1.04. The comprehensive environmental benefits between pavement performance or economic benefit and CEs can be quantified using the CPR index.
- (6)
- The feasibility of RWF as an asphalt mixture additive has been preliminarily verified. However, further research is required on fiber mixing methods, multi-size effects, and complex interfacial adhesion between aggregates, fibers, and asphalts, as well as the long-term performance of asphalt mixtures. Additionally, in future studies, long-term data such as EC for maintenance frequency and CEs during traffic operations in the operation and maintenance phases should be collected to assess the environmental impact during these phases. Moreover, the environmental impact over the full life cycle could be evaluated by integrating the EC and CEs during the construction phase.
Author Contributions
Funding
Data Availability Statement
Conflicts of Interest
References
- Oluwasola, E.A.; Hainin, M.R.; Aziz, M.M.A. Evaluation of asphalt mixtures incorporating electric arc furnace steel slag and copper mine tailings for road construction. Transp. Geotech. 2015, 2, 47–55. [Google Scholar] [CrossRef]
- Zhang, H.; Gong, M.; Gao, D.; Yang, T.; Huang, Y. Comparative analysis of mechanical behavior of composite modified asphalt mixture based on PG technology. Constr. Build. Mater. 2020, 259, 119771. [Google Scholar] [CrossRef]
- Guo, M.; Liang, M.; Jiao, Y.; Zhao, W.; Duan, Y.; Liu, H. A review of phase change materials in asphalt binder and asphalt mixture. Constr. Build. Mater. 2020, 258, 119565. [Google Scholar] [CrossRef]
- Wei, Z.; Jia, Y.; Wang, S.; Li, Z.; Li, Y.; Wang, X.; Gao, Y. Utilization of iron ore tailing as an alternative mineral filler in asphalt mastic: High-temperature performance and environmental aspects. J. Clean. Prod. 2022, 335, 130318. [Google Scholar] [CrossRef]
- Niu, D.; Xie, X.; Zhang, Z.; Niu, Y.; Yang, Z. Influence of binary waste mixtures on road performance of asphalt and asphalt mixture. J. Clean. Prod. 2021, 298, 126842. [Google Scholar] [CrossRef]
- Abreu, L.P.F.; Oliveira, J.R.M.; Silva, H.M.R.D.; Fonseca, P.V. Recycled asphalt mixtures produced with high percentage of different waste materials. Constr. Build. Mater. 2015, 84, 230–238. [Google Scholar] [CrossRef]
- Li, H.; Zhang, F.; Feng, Z.; Li, W.; Zou, X. Study on waste engine oil and waste cooking oil on performance improvement of aged asphalt and application in reclaimed asphalt mixture. Constr. Build. Mater. 2021, 276, 122138. [Google Scholar] [CrossRef]
- Cheng, A.; Lin, W.-T.; Huang, R. Application of rock wool waste in cement-based composites. Mater. Des. 2011, 32, 636–642. [Google Scholar] [CrossRef]
- Yap, Z.S.; Khalid, N.H.A.; Haron, Z.; Mohamed, A.; Tahir, M.M.; Hasyim, S.; Saggaff, A. Waste Mineral Wool and Its Opportunities-A Review. Mater. 2021, 14, 5777. [Google Scholar] [CrossRef]
- Väntsi, O.; Kärki, T. Mineral wool waste in Europe: A review of mineral wool waste quantity, quality, and current recycling methods. J. Mater. Cycles Waste Manag. 2014, 16, 62–72. [Google Scholar] [CrossRef]
- Qaryouti, M.; Osman, M.; Alharbi, A.; Voogt, W.; Abdelaziz, M.E. Using Date Palm Waste as an Alternative for Rockwool: Sweet Pepper Performance under Both Soilless Culture Substrates. Plants 2024, 13, 44. [Google Scholar] [CrossRef] [PubMed]
- Zhou, L.; Li, R.; Zhang, G.; Wang, D.; Cai, D.; Wu, Z. Zero-valent iron nanoparticles supported by functionalized waste rock wool for efficient removal of hexavalent chromium. Chem. Eng. J. 2018, 339, 85–96. [Google Scholar] [CrossRef]
- Hao, W.; Xu, J.; Li, R.; Zhao, X.; Qiu, L.; Yang, W. Developing superhydrophobic rock wool for high-viscosity oil/water separation. Chem. Eng. J. 2019, 368, 837–846. [Google Scholar] [CrossRef]
- Özel, G.; Açıkkalp, E.; Görgün, B.; Yamık, H.; Caner, N. Optimum insulation thickness determination using the environmental and life cycle cost analyses based entransy approach. Sustain. Energy Technol. Assess. 2015, 11, 87–91. [Google Scholar] [CrossRef]
- Klinsky, L.M.G.; Kaloush, K.E.; Faria, V.C.; Bardini, V.S.S. Performance characteristics of fiber modified hot mix asphalt. Constr. Build. Mater. 2018, 176, 747–752. [Google Scholar] [CrossRef]
- Guo, Y.; Tataranni, P.; Sangiorgi, C. The use of fibres in asphalt mixtures: A state of the art review. Constr. Build. Mater. 2023, 390, 131754. [Google Scholar] [CrossRef]
- Wu, B.; Pei, Z.; Xiao, P.; Lou, K.; Wu, X. Influence of fiber-asphalt interface property on crack resistance of asphalt mixture. Case Stud. Constr. Mater. 2022, 17, e01703. [Google Scholar] [CrossRef]
- Wang, G.; Li, J.; Massarra, C.; Buckhalter, C.; Rahat, H.H.; Farrington, J.; Collins, T.; Johnson, J. Use of COVID-19 single-use face masks to improve the rutting resistance of asphalt pavement. Sci. Total Environ. 2022, 826, 154118. [Google Scholar] [CrossRef]
- Li, Z.; Li, K.; Chen, W.; Liu, W.; Yin, Y.; Cong, P. Investigation on the characteristics and effect of plant fibers on the properties of asphalt binders. Constr. Build. Mater. 2022, 338, 127652. [Google Scholar] [CrossRef]
- Phan, T.M.; Nguyen, S.N.; Seo, C.-B.; Park, D.-W. Effect of treated fibers on performance of asphalt mixture. Constr. Build. Mater. 2021, 274, 122051. [Google Scholar] [CrossRef]
- Sun, Y.; Wu, S.; Liu, Q.; Zeng, W.; Chen, Z.; Ye, Q.; Pan, P. Self-healing performance of asphalt mixtures through heating fibers or aggregate. Constr. Build. Mater. 2017, 150, 673–680. [Google Scholar] [CrossRef]
- Lou, K.; Xiao, P.; Wu, B.; Kang, A.; Wu, X.; Shen, Q. Effects of fiber length and content on the performance of ultra-thin wearing course modified by basalt fibers. Constr. Build. Mater. 2021, 313, 125439. [Google Scholar] [CrossRef]
- Slebi-Acevedo, C.J.; Lastra-Gonzalez, P.; Pascual-Munoz, P.; Castro-Fresno, D. Mechanical performance of fibers in hot mix asphalt: A review. Constr. Build. Mater. 2019, 200, 756–769. [Google Scholar] [CrossRef]
- Behbahani, H.; Gilani, V.N.M.; Salehfard, R.; Safari, D. Evaluation of Fatigue and Rutting Behaviour of Hot Mix Asphalt Containing Rock Wool. Int. J. Civ. Eng. 2020, 18, 1293–1300. [Google Scholar] [CrossRef]
- Hussein, F.K.; Ismael, M.Q.; Huseien, G.F. Rock Wool Fiber-Reinforced and Recycled Concrete Aggregate-Imbued Hot Asphalt Mixtures: Design and Moisture Susceptibility Evaluation. J. Compos. Sci. 2023, 7, 428. [Google Scholar] [CrossRef]
- Guo, F.; Li, R.; Lu, S.; Bi, Y.; He, H. Evaluation of the Effect of Fiber Type, Length, and Content on Asphalt Properties and Asphalt Mixture Performance. Mater. 2020, 13, 1556. [Google Scholar] [CrossRef]
- Wang, S.; Kang, A.; Xiao, P.; Li, B.; Fu, W. Investigating the Effects of Chopped Basalt Fiber on the Performance of Porous Asphalt Mixture. Adv. Mater. Sci. Eng. 2019, 2019, 1–12. [Google Scholar] [CrossRef]
- Xing, X.; Liu, T.; Pei, J.; Huang, J.; Li, R.; Zhang, J.; Tian, Y. Effect of fiber length and surface treatment on the performance of fiber-modified binder. Constr. Build. Mater. 2020, 248, 118702. [Google Scholar] [CrossRef]
- Yue, Y.; Abdelsalam, M.; Khater, A.; Ghazy, M. A comparative life cycle assessment of asphalt mixtures modified with a novel composite of diatomite powder and lignin fiber. Constr. Build. Mater. 2022, 323, 126608. [Google Scholar] [CrossRef]
- Khater, A.; Luo, D.; Abdelsalam, M.; Ma, J.; Ghazy, M. Comparative Life Cycle Assessment of Asphalt Mixtures Using Composite Admixtures of Lignin and Glass Fibers. Mater. 2021, 14, 6589. [Google Scholar] [CrossRef]
- Martinez-Soto, A.; Valdes-Vidal, G.; Calabi-Floody, A.; Avendaño-Vera, C.; Martínez-Toledo, C. Comparison of Environmental Loads of Fibers Used in the Manufacture of Hot Mix Asphalt (HMA) and Stone Mastic Asphalt (SMA) Mixes Using a Life Cycle Assessment (LCA). Sustainability 2022, 14, 14246. [Google Scholar] [CrossRef]
- Daniele, L.; Marco, M.; Edoardo, B.; Michele, G. Comparative life cycle assessment of standard, cellulose-reinforced and end of life tires fiber-reinforced hot mix asphalt mixtures. J. Clean. Prod. 2020, 248, 119295. [Google Scholar]
- JTG E20-2011; Standard Test Methods of Bitumen and Bituminous Mixtures for Highway Engineering. Ministry of Transport of the People’s Republic of China: Beijing, China, 2011.
- JTG E40-2004; Technical Specification for Construction of Highway Asphalt Pavements. Ministry of Transport of the People’s Republic of China: Beijing, China, 2004.
- Guo, R.; Zhou, F.; Nian, T. Analysis of primary influencing factors and indices distribution law of rutting performance of asphalt mixtures. Case Stud. Constr. Mater. 2022, 16, e01053. [Google Scholar] [CrossRef]
- Taher, M.N.M.; Aman, M.Y.; Abdullah, N.F.A.; Noranai, Z. Utilization of Synthetic Reinforced Fiber in Asphalt Concrete—A Review. J. Civ. Eng. Technol. 2019, 10, 678–694. [Google Scholar]
- Chen, L.; Yang, C.; Zhang, J.; Cui, J. Studying on the water resistance and durability of rock wool products for exterior insulation. New Build. Mater. 2015, 42, 78–80. [Google Scholar]
- Cheng, Y.; Tao, J.; Jiao, Y.; Tan, G.; Guo, Q.; Wang, S.; Ni, P. Influence of the properties of filler on high and medium temperature performances of asphalt mastic. Constr. Build. Mater. 2016, 118, 268–275. [Google Scholar] [CrossRef]
- Li, Z.; Zhang, X.; Fa, C.; Zhang, Y.; Xiong, J.; Chen, H. Investigation on characteristics and properties of bagasse fibers: Performances of asphalt mixtures with bagasse fibers. Constr. Build. Mater. 2020, 248, 118648. [Google Scholar] [CrossRef]
- Leng, Z.; Padhan, R.K.; Sreeram, A. Production of a sustainable paving material through chemical recycling of waste PET into crumb rubber modified asphalt. J. Clean. Prod. 2018, 180, 682–688. [Google Scholar] [CrossRef]
- Lei, B.; Li, X.; Guo, Y.; Qu, F.; Zhao, C.; Tam, V.W.; Wu, V.; Li, W. Recycling of copper tailing as filler material in asphalt paving mastic: A sustainable solution for mining waste recovery. Case Stud. Constr. Mater. 2024, 20, e03237. [Google Scholar] [CrossRef]
- Liu, F.; Pan, B.; Bian, J.; Zhou, C. Experimental investigation on the performance of the asphalt mixture with ceramic fiber. J. Clean. Prod. 2023, 384, 135585. [Google Scholar] [CrossRef]
- Miliutenko, S.; Björklund, A.; Carlsson, A. Opportunities for environmentally improved asphalt recycling: The example of Sweden. J. Clean. Prod. 2013, 43, 156–165. [Google Scholar] [CrossRef]
- Huang, Y.; Qiao, Z.; Zhang, H. Evaluation of an economy-technology-green development system for asphalt pavement construction in China based on synergetics. J. Clean. Prod. 2021, 289, 125132. [Google Scholar] [CrossRef]
- Li, J.; Xiao, F.; Zhang, L.; Amirkhanian, S.N. Life cycle assessment and life cycle cost analysis of recycled solid waste materials in highway pavement: A review. J. Clean. Prod. 2019, 233, 1182–1206. [Google Scholar] [CrossRef]
- Ma, F.; Dong, W.; Fu, Z.; Wang, R.; Huang, Y.; Liu, J. Life cycle assessment of greenhouse gas emissions from asphalt pavement maintenance: A case study in China. J. Clean. Prod. 2021, 288, 125595. [Google Scholar] [CrossRef]
- JT/T 719-2016; Limits and Measurement Methods of Fuel Consumption for Commercial Vehicle for Cargos Transportation. Ministry of Transport of the People’s Republic of China: Beijing, China, 2016.
- Chen, C. Study on Character of Rock Wool Waste Cement-based Cementious Materials. Master’s Thesis, Chang’an University, Xi’an, China, 2016. [Google Scholar]
- Xing, X.; Chen, S.; Li, Y.; Pei, J.; Zhang, J.; Wen, Y.; Li, R.; Cui, S. Effect of different fibers on the properties of asphalt mastics. Constr. Build. Mater. 2020, 262, 120005. [Google Scholar] [CrossRef]
- Zhang, X.; Zhao, H.; Li, C.; Wang, T.; Peng, L.; Li, Y.; Xiao, Y. In-situ micro-characteristics of fiber at the mortar transition zone in asphalt mixtures. Constr. Build. Mater. 2023, 398, 132529. [Google Scholar] [CrossRef]
- Liu, X.; Wu, S. Study on the graphite and carbon fiber modified asphalt concrete. Constr. Build. Mater. 2011, 25, 1807–1811. [Google Scholar] [CrossRef]
- Choudhary, J.; Kumar, B.; Gupta, A. Utilization of solid waste materials as alternative fillers in asphalt mixes: A review. Constr. Build. Mater. 2020, 234, 117271. [Google Scholar] [CrossRef]
- Li, Z.; Shen, A.; Wang, H.; Guo, Y.; Wu, H. Effect of basalt fiber on the low-temperature performance of an asphalt mixture in a heavily frozen area. Constr. Build. Mater. 2020, 253, 119080. [Google Scholar] [CrossRef]
- Fu, Z.; Dang, Y.; Guo, B.; Huang, Y. Laboratory investigation on the properties of asphalt mixtures modified with double-adding admixtures and sensitivity analysis. J. Traffic Transp. Eng. (Engl. Ed.) 2016, 3, 412–426. [Google Scholar] [CrossRef]
- Qiu, G.; Fang, J.; Xu, A.; Wang, Q.; Jiang, S.; Li, H. Research on High-Temperature Performance of Basalt Fiber Asphalt Concrete. Bull. Chin. Ceram. Soc. 2019, 38, 3890–3896. [Google Scholar]
- Wei, Z. Study on road performance of basalt fiber reinforced asphalt mixture. J. Wuhan Univ. Technol. 2019, 43, 1074–1078. [Google Scholar]
- Luo, D.; Khater, A.; Yue, Y.; Abdelsalam, M.; Zhang, Z.; Li, Y.; Li, J.; Iseley, D.T. The performance of asphalt mixtures modified with lignin fiber and glass fiber: A review. Constr. Build. Mater. 2019, 209, 377–387. [Google Scholar] [CrossRef]
- Wen, Y. Research on the Mechanicm and Performance of Basalt Fiber Reiforced Asphalt Mixture. Master’s Thesis, Jilin University, Changchun, China, 2017. [Google Scholar]
- Ma, F.; Pan, J.; Fu, Z.; Han, W.; Zhang, C. Determination of optimum fiber content in fiber asphalt mixture. J. HenNan Polytechinic Univ. 2019, 38, 138–145. [Google Scholar]
- Li, Z.; Shen, A.; Guo, Y.; Wu, H. Low temperature performance correlation of basalt fiber asphalt mortar and mixture. J. Build. Mater. 2021, 24, 124–128+152. [Google Scholar]
- Wang, D.; Wang, L.; Gu, X.; Zhou, G. Effect of Basalt Fiber on the Asphalt Binder and Mastic at Low Temperature. J. Mater. Civ. Eng. 2013, 25, 355–364. [Google Scholar] [CrossRef]
- Aurangzeb, Q.; Al-Qadi, I.L.; Ozer, H.; Yang, R. Hybrid life cycle assessment for asphalt mixtures with high RAP content. Resour. Conserv. Recycl. 2014, 83, 77–86. [Google Scholar] [CrossRef]
- Praticò, F.G.; Giunta, M.; Mistretta, M.; Gulotta, T.M. Energy and Environmental Life Cycle Assessment of Sustainable Pavement Materials and Technologies for Urban Roads. Sustainability 2020, 12, 704. [Google Scholar] [CrossRef]


| Indexes | Experimental Values | Standard Requirement (JTG F40-2004) [34] |
|---|---|---|
| Performance density (g·cm−3) | 2.710 | ≥2.500 |
| Shape | Powder | - |
| Grain size (mm) | <0.075 mm | <0.075 mm |
| Water content (%) | 0.29 | <0.5 |
| Fineness (<0.075 mm/%) | 90.3 | ≥85.0 |
| Hydrophilic coefficient | 0.85 | <1.00 |
| Shape | Length (mm) | Diameter (μm) | Tensile Strength (MPa) | Elasticity Modulus (GPa) | Elongation at Break (%) | Oil Absorption | Thermal Conductivity (W/(m·K)) |
|---|---|---|---|---|---|---|---|
| Fluffy and fine fibers | 1.5~5 | 3~13 | 800 | 10~60 | 1~3 | 5.91 times fiber quality | 0.037 |
| Test Items | Results | Technical Requirements (JTG E20-2011) | Test Methods |
|---|---|---|---|
| Penetration (25 °C, 100 g, 5 s) (0.1 mm) | 66 | 60~80 | T 0604-2000 |
| Softening point (°C) | 47.6 | ≥46 | T 0606-2000 |
| Penetration index (PI) | −0.76 | −1.5~+1 | T 0604-2000 |
| Dynamic viscosity (60 °C) (Pa·s) | 236 | ≥180 | T 0615-2000 |
| Solubility (%) | 99.62 | ≥99.5 | T 0607-1993 |
| Flashing point (°C) | 286 | ≥260 | T 0611-1993 |
| Ductility (5 cm/min, 15 °C) (cm) | 107 | ≥100 | T 0605-1993 |
| Ductility (5 cm/min, 10 °C) (cm) | 66.0 | ≥15 | T 0605-1993 |
| Asphalt Mortar Number | Shapes | Content of RWP (%) | Asphalt Mortar Number | Shapes | Content of RWF (%) |
|---|---|---|---|---|---|
| AM | - | 0 | AM | - | 0 |
| AM-RWP-1 | Powder | 1 | AM-RWF-1 | Fiber | 1 |
| AM-RWP-2 | Powder | 2 | AM-RWF-2 | Fiber | 2 |
| AM-RWP-3 | Powder | 3 | AM-RWF-3 | Fiber | 3 |
| AM-RWP-4 | Powder | 4 | AM-RWF-4 | Fiber | 4 |
| Screen size (mm) | 16.0 | 13.2 | 9.5 | 4.75 | 2.36 | 1.18 | 0.6 | 0.3 | 0.15 | 0.075 |
| Upper limit of grading (%) | 100 | 100 | 85 | 68 | 50 | 38 | 28 | 20 | 15 | 8 |
| Lower limit of grading (%) | 100 | 90 | 68 | 38 | 24 | 15 | 10 | 7 | 5 | 4 |
| The median of grading (%) | 100 | 95 | 77 | 53 | 37 | 27 | 19 | 14 | 10 | 6 |
| Synthetic grading (%) | 100 | 96.2 | 75.3 | 53.1 | 33.3 | 26.8 | 20.8 | 14.8 | 11.6 | 5.2 |
| Energy Types | Calorific Value | CE | Raw Material Production | EC (MJ/t) | CE (kg CO2e/t) |
|---|---|---|---|---|---|
| Crude oil | 44.82 MJ/kg | 3.42 kg CO2e/kg | Asphalt | 4461.96 | 357.21 |
| Diesel oil | 42.65 MJ/kg | 3.31 kg CO2e/kg | Coarse aggregate | 31.82 | 2.43 |
| Gasoline | 43.07 MJ/KWh | 3.15 kg CO2e/KWh | Fine aggregate | 58.56 | 8.69 |
| Electricity | 3.6 MJ/kg | 0.93 kg CO2e/kg | Mineral powder | 207.36 | 47.21 |
| RWF Landfill Disposal (USD/t) | Aggregate (USD/t) | Mineral Powder (USD/t) | Asphalt (USD/t) | Transportation Cost (USD/t) |
|---|---|---|---|---|
| 536 | 6.9 | 43 | 491 | 12 |
| Chemical Compositions | SiO2 | Al2O3 | Fe2O3 | CaO | MgO | K2O + Na2O | Others |
|---|---|---|---|---|---|---|---|
| Rock wool fiber (%) | 43.1 | 12.9 | 5.4 | 20.0 | 9.9 | 2.6 | 6.1 |
| Sample Number | Sample 1 | Sample 2 | Sample 3 | Sample 4 | Sample 5 | Mean Value |
|---|---|---|---|---|---|---|
| Initial tensile strength (kPa) | 40.12 | 38.91 | 42.92 | 41.29 | 41.91 | 41.03 |
| Tensile strength after aging for 28 days (kPa) | 33.39 | 32.78 | 33.59 | 34.79 | 33.73 | 33.66 |
| Tensile strength retention after aging for 28 days (%) | 83.2 | 84.2 | 78.3 | 84.3 | 80.5 | 82.1 |
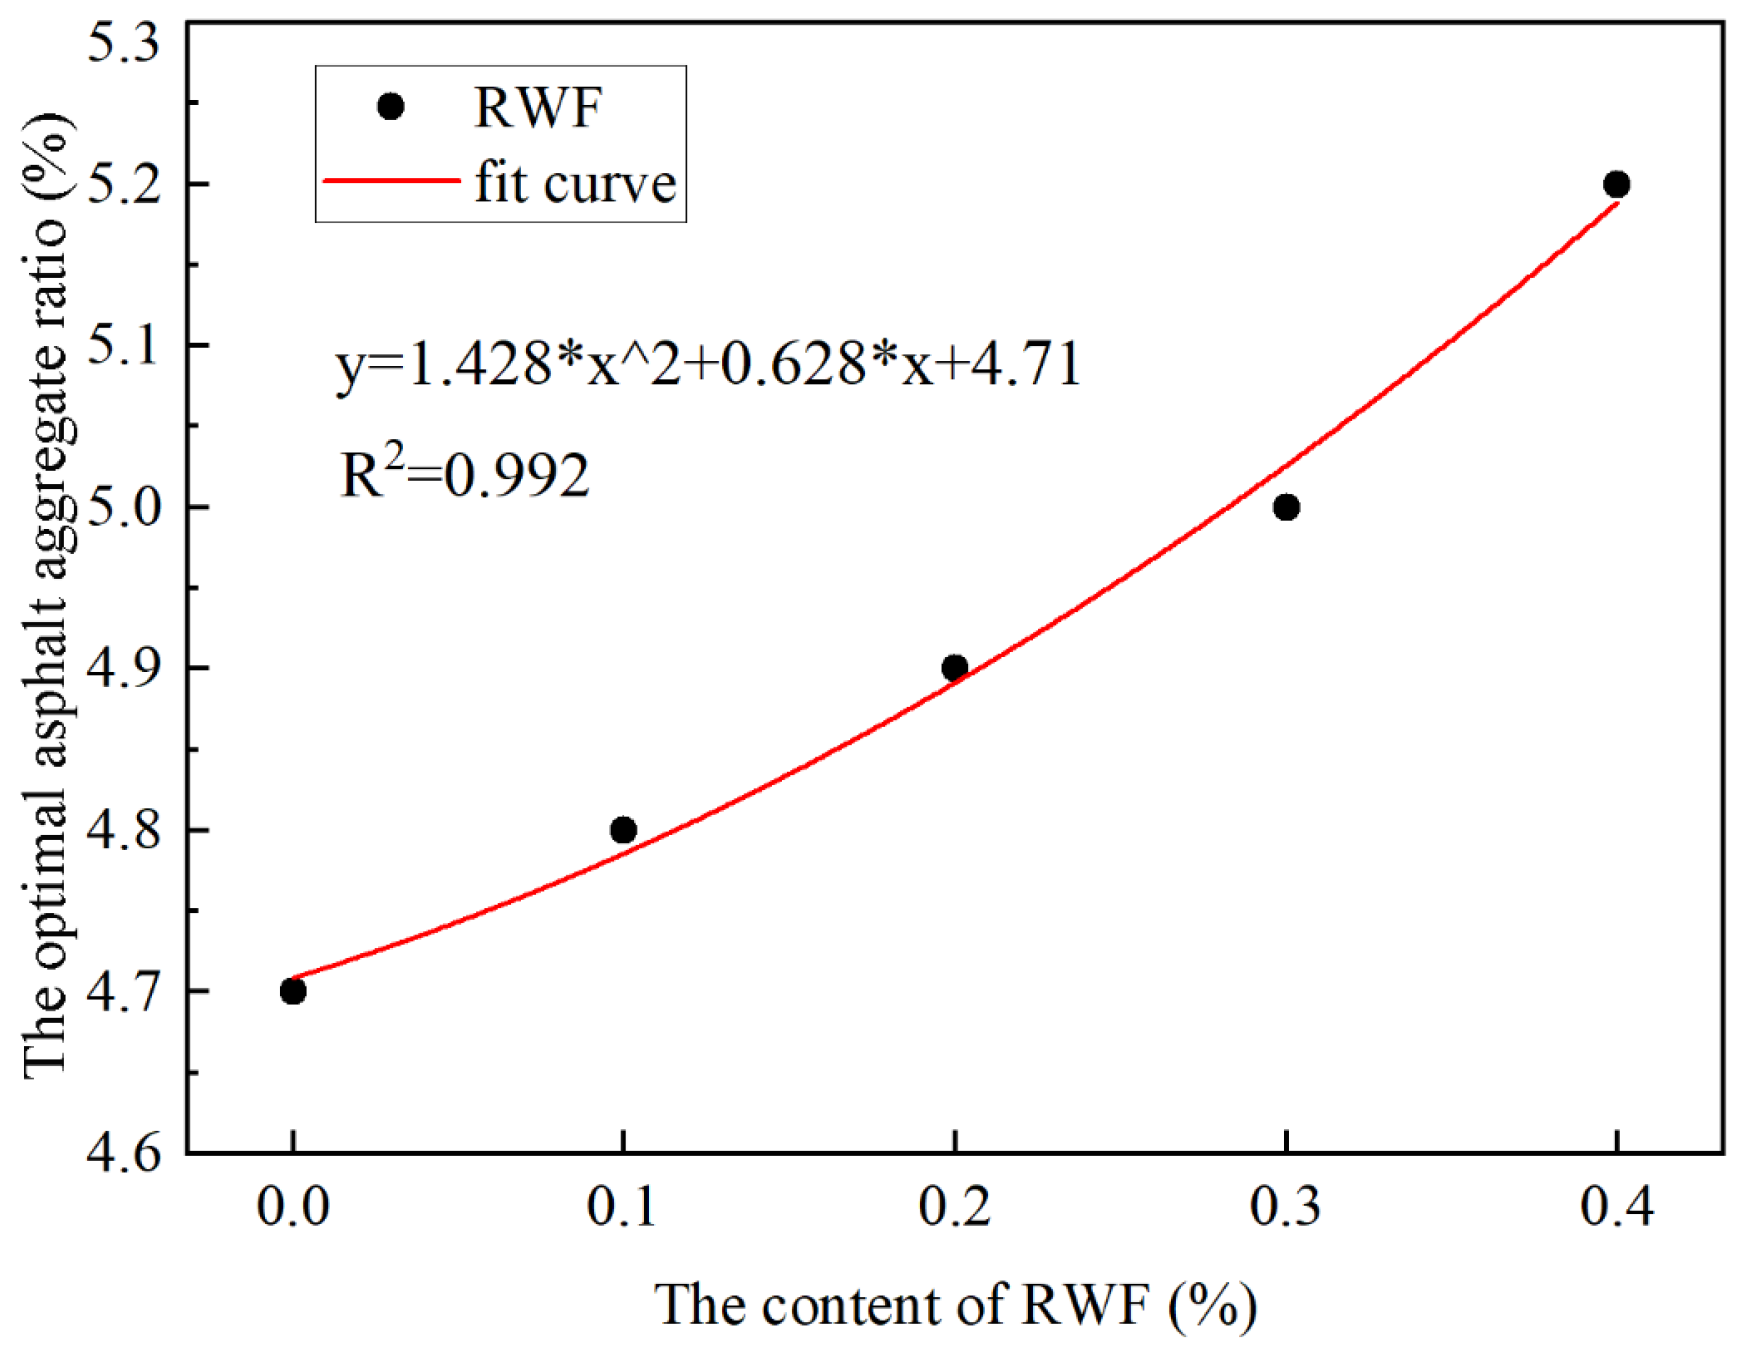
| RWF Content (%) | Optimal Asphalt Aggregate Ratio (%) | Density (g/cm3) | Stability (KN) | Flow Value (0.1 mm) | VV (%) | VMA (%) | VFA (%) |
|---|---|---|---|---|---|---|---|
| 0 | 4.7 | 2.485 | 11.72 | 37.08 | 4.2 | 14.0 | 69.7 |
| 0.1 | 4.8 | 2.469 | 12.25 | 37.8 | 4.5 | 14.6 | 69.0 |
| 0.2 | 4.9 | 2.473 | 13.51 | 36.72 | 4.1 | 14.6 | 72.0 |
| 0.3 | 5.0 | 2.458 | 11.86 | 35.61 | 4.4 | 15.2 | 71.0 |
| 0.4 | 5.2 | 2.446 | 11.40 | 35.60 | 4.5 | 15.7 | 71.2 |
| RWF Content (%) | 45 min Displacement (mm) | 60 min Displacement (mm) | Dynamic Stability (times/mm) | Relative Deformation Rate (%) | Standard Requirement (times/mm) |
|---|---|---|---|---|---|
| 0 | 1.677 | 1.853 | 3580 | 3.7 | dynamic stability >2400 |
| 0.1 | 1.600 | 1.769 | 3728 | 3.5 | |
| 0.2 | 1.451 | 1.606 | 4065 | 3.2 | |
| 0.3 | 1.235 | 1.375 | 4500 | 2.7 | |
| 0.4 | 1.292 | 1.436 | 4375 | 2.9 |
| Fiber Content (%) | The Stability Soaking 30 min (kN) | The Stability Soaking 48 h (kN) | Residual Stability (%) | Technical Standard (%) |
|---|---|---|---|---|
| 0 | 11.72 | 10.26 | 87.5 | residual stability >80 |
| 0.1 | 12.25 | 10.93 | 89.2 | |
| 0.2 | 13.51 | 12.51 | 92.6 | |
| 0.3 | 11.86 | 10.76 | 90.7 | |
| 0.4 | 11.40 | 10.10 | 88.6 |
| RWF Content (%) | Raw Material Production and Rock Wool Recovery | Asphalt Mixture Mixing | Transportation | Spreading and Rolling | Total EC | ||||
|---|---|---|---|---|---|---|---|---|---|
| EC | Proportion | EC | Proportion | EC | Proportion | EC | Proportion | ||
| 0 | 343.76 | 31.8 | 463.80 | 42.9 | 253.65 | 23.5 | 19.79 | 1.8 | 1081 |
| 0.1 | 346.27 | 32.1 | 462.31 | 42.8 | 252.01 | 23.3 | 19.66 | 1.8 | 1080.25 |
| 0.2 | 352.17 | 32.3 | 464.55 | 42.7 | 252.42 | 23.2 | 19.70 | 1.8 | 1088.84 |
| 0.3 | 355.33 | 32.6 | 463.22 | 42.5 | 250.89 | 23.1 | 19.58 | 1.8 | 1089.02 |
| 0.4 | 364.33 | 33.2 | 463.90 | 42.3 | 249.66 | 22.7 | 19.48 | 1.8 | 1097.37 |
| RWF Content (%) | Raw Material Production and Rock Wool Recovery | Asphalt Mixture Mixing | Transportation | Spreading and Rolling | Total CEs | ||||
|---|---|---|---|---|---|---|---|---|---|
| CEs | Proportion | CEs | Proportion | CEs | Proportion | CEs | Proportion | ||
| 0 | 31.02 | 36.3 | 34.36 | 40.1 | 18.79 | 21.9 | 1.46 | 1.7 | 85.63 |
| 0.1 | 31.16 | 36.4 | 34.25 | 40.1 | 18.67 | 21.8 | 1.45 | 1.7 | 85.53 |
| 0.2 | 31.59 | 36.7 | 34.42 | 39.9 | 18.70 | 21.7 | 1.46 | 1.7 | 86.17 |
| 0.3 | 32.32 | 37.3 | 34.32 | 39.6 | 18.59 | 21.4 | 1.45 | 1.7 | 86.68 |
| 0.4 | 32.44 | 37.4 | 34.37 | 39.6 | 18.50 | 21.3 | 1.44 | 1.7 | 86.75 |
| RWF Content (%) | Asphalt Mixtures | Asphalt | RWF | Aggregate | Mineral Powder |
|---|---|---|---|---|---|
| 0 | 1391.6 | 62.47 | 0 | 1260.01 | 69.12 |
| 0.1 | 1382.64 | 63.33 | 1.38 | 1250.71 | 67.22 |
| 0.2 | 1384.88 | 64.69 | 2.77 | 1251.54 | 65.88 |
| 0.3 | 1376.48 | 65.545 | 4.13 | 1242.76 | 64.04 |
| 0.4 | 1369.76 | 67.71 | 5.48 | 1234.34 | 62.23 |
Disclaimer/Publisher’s Note: The statements, opinions and data contained in all publications are solely those of the individual author(s) and contributor(s) and not of MDPI and/or the editor(s). MDPI and/or the editor(s) disclaim responsibility for any injury to people or property resulting from any ideas, methods, instructions or products referred to in the content. |
© 2025 by the authors. Licensee MDPI, Basel, Switzerland. This article is an open access article distributed under the terms and conditions of the Creative Commons Attribution (CC BY) license (https://creativecommons.org/licenses/by/4.0/).
Share and Cite
Zeng, B.; Wan, N.; Zhang, S.; Yu, X.; Zhang, Z.; Chen, J.; Lei, B. Feasibility Study of Waste Rock Wool Fiber as Asphalt Mixture Additive: Performance Test and Environmental Effect Analysis. Buildings 2025, 15, 2022. https://doi.org/10.3390/buildings15122022
Zeng B, Wan N, Zhang S, Yu X, Zhang Z, Chen J, Lei B. Feasibility Study of Waste Rock Wool Fiber as Asphalt Mixture Additive: Performance Test and Environmental Effect Analysis. Buildings. 2025; 15(12):2022. https://doi.org/10.3390/buildings15122022
Chicago/Turabian StyleZeng, Bingjian, Ni Wan, Sipeng Zhang, Xiaohua Yu, Zhen Zhang, Jiawu Chen, and Bin Lei. 2025. "Feasibility Study of Waste Rock Wool Fiber as Asphalt Mixture Additive: Performance Test and Environmental Effect Analysis" Buildings 15, no. 12: 2022. https://doi.org/10.3390/buildings15122022
APA StyleZeng, B., Wan, N., Zhang, S., Yu, X., Zhang, Z., Chen, J., & Lei, B. (2025). Feasibility Study of Waste Rock Wool Fiber as Asphalt Mixture Additive: Performance Test and Environmental Effect Analysis. Buildings, 15(12), 2022. https://doi.org/10.3390/buildings15122022