Article

A Study on the Thermal Conductivity of Graphite Composite Insulation Material for Building Insulation

by
Ruhua Wang
1,
Qianbin Yuan
1,
Ze Zhang
1,
Fei Zhang
1,
Kecheng Zhao
1,
Jian Xu
1 and
Tengfei Zhao
2,3,*
1
Zhejiang Provincial Erjian Construction Group Ltd., 519 Minhe Road, Ningbo 315200, China
2
School of Mechanics and Civil Engineering, China University of Mining and Technology, 1 Daxue Road, Xuzhou 221116, China
3
College of City Construction, Jiangxi Normal University, 99 Ziyang Avenue, Nanchang 330022, China
*
Author to whom correspondence should be addressed.
Buildings 2025, 15(5), 752; https://doi.org/10.3390/buildings15050752
Submission received: 23 January 2025 / Revised: 9 February 2025 / Accepted: 24 February 2025 / Published: 25 February 2025
(This article belongs to the Special Issue Advance in Eco-Friendly Building Materials and Innovative Structures)

Abstract

Global climate change has placed a heavy burden on the environment, with building energy consumption gradually emerging as a major environmental stressor. Therefore, energy conservation and emission reduction in buildings have increasingly become key issues of great concern. In regions with hot summers and cold winters, building envelope structures often use insulation materials to facilitate energy efficiency in buildings. Graphite composite insulation material (GCIM), a high-performance building insulation composite material, is composed primarily of graphite polystyrene particles (GPPs), glass microspheres (GMs), cement, and silica fume (SF). The thermal conductivity (TC) is an important parameter that affects its insulation performance. The volume ratios (VRs) of the material components will have a significant impact on its TC. However, there is currently a relative lack of theoretical research on the influencing factors of its TC, and its TC mechanism is not very clear. Therefore, a novel series-parallel alternate heat conduction theoretical model (SPAM) was established in this paper. The theoretical calculation expression for the TC of GCIM was derived using Fourier’s law of heat conduction. Through numerical simulation, three models comprising a total of 60 finite element (FE) models were constructed. The results of the numerical simulation were compared with theoretical calculations to further determine the influence of material component VRs on the TC of GCIM. The research results indicate that in the three established conventional models, the TC of GCIM decreases rapidly in the early stages and then stabilizes later, with a critical point at Ψ 1 Ψ 2 = Ψ 1 Ψ 4 = 5 . Within the specified range of VR variations, the value of Ψ 1 Ψ 2 has the greatest impact on the TC performance of GCIM, followed by Ψ 1 Ψ 4 , while Ψ 1 Ψ 3 has the smallest impact. The research findings will guide the material composition of the GCIM, reduce their TC, enhance their insulation performance, decrease building energy consumption, and hold high theoretical and practical value. This research will provide a theoretical reference basis for the widespread application of the GCIM in the field of building insulation.

1. Introduction

Energy utilization and its structural layout are not only key factors and indicators of human development but also represent important aspects of human civilization and scientific and technological progress. They are crucial parameters determining the progress of human activities and key elements of economic and social development in various countries [1,2,3]. Energy consumption has gradually become one of the increasingly focused global issues. Global energy and resource consumption are rapidly increasing at an average annual rate of 2.2%. With the rapid growth of the global economy, the pressure on energy resources is increasing [4,5,6,7]. Energy consumption from buildings accounts for approximately 40% of the total global energy consumption. As the global economy continues to grow rapidly, the total energy consumption of buildings will continue to rise. Therefore, research on improving the energy efficiency of buildings has gradually become a hot topic of study [8,9]. In addition, the emissions of greenhouse gases from buildings account for one-third of global energy-related greenhouse gas emissions, making it one of the main causes of climate change [10,11]. From another perspective, climate change has further intensified the increase in energy demand for building insulation and other related purposes. Existing scholars believe that the energy demand of buildings and the associated greenhouse gas emissions are significantly influenced by the characteristics of buildings and local climatic conditions. In the future, the annual energy demand of all types of buildings shows a net increase, with the highest increase in heating energy demand [12,13]. Energy consumption and greenhouse gas emissions have a significant impact on the global environment. Therefore, improving the energy utilization efficiency of buildings can help in the efficient use of energy, reduce greenhouse gas emissions, and alleviate the pressure on energy and the environment. In this context, this paper focuses on the GCIM, innovatively proposing a novel research approach and method. In the past, modeling of thermal conductivity (TC) for insulation materials has mostly revolved around common materials or traditional methods. However, the GCIM has unique structural characteristics, with complex interactions among its internal components. The key challenge currently faced is how to accurately construct a theoretical calculation model for its TC based on these characteristics.
In recent years, research in the construction industry has mainly focused on developing sustainable, environmentally friendly, and energy-efficient building materials, advocating for energy-efficient, environmentally friendly, health-appropriate, and highly practical building materials. Numerous scholars have also devoted a great deal of effort to developing energy-efficient and environmentally friendly green building materials. The research and development of building insulation materials with good TC and green environmental protection is very necessary. On the one hand, this can greatly improve the thermal insulation performance of buildings, significantly increase the energy efficiency of buildings, and reduce building energy consumption. On the other hand, the application of green and environmentally friendly insulation materials can greatly reduce the emission of harmful gases and greenhouse gases, helping to alleviate the trend of global temperature rise. Insulation materials are mainly divided into organic insulation materials and inorganic insulation materials [14]. Both domestic and international research has focused on the thermal conduction theory, experimental studies, and formulation processes of insulation materials, yielding many research achievements. Shrestha et al. [15] established a model to calculate the solid and gas TC coefficients of porous materials. They validated the model by combining literature data and experiments, discussing the contributions of solids and gases. Wang et al. [16] explored the temperature and humidity variations of 8 common insulation materials through experimental methods and provided principles for selecting insulation materials, laying the groundwork for accurately determining the TC coefficients of insulation materials. Tariku et al. [17] discussed the effects of temperature, moisture, and aging on the performance of commonly used insulation materials. They presented theoretical calculations for the TC coefficient variations with temperature and moisture content, investigating the patterns of these variations. Pan et al. [18] conducted in-depth research on the mechanical and thermal properties of low-density foam concrete and explored its manufacturing process. Tan et al. [19] prepared a new type of organic-inorganic composite insulation material (EPS-AEA) and found that adding Al2O3 to EPS can reduce the TC of the composite material and enhance its mechanical properties. Ajabli et al. [20] studied eco-friendly insulation solutions and compared the TC performance with traditional insulation materials, laying the groundwork for the research and development of new eco-friendly insulation materials. Özçelikci et al. [21] utilized construction waste to prepare ultra-lightweight recycled building insulation materials, further investigating the factors influencing their thermal and mechanical properties. Cosentino et al. [22] explored the various properties of natural insulation materials, emphasizing the importance of thermal capacity, lifespan, and environmental impact of insulation materials, providing directions for insulation material research. Zhou et al. [23] prepared bio-based insulation materials using rice straw and natural binders, investigating the influence of fiber dimensions and binder properties on their hygrothermal performance. Majumder et al. [24] utilized jute, wool fibers, and loofah fibers as raw materials to manufacture building insulation materials, conducting comparative analyses on their insulation, soundproofing, and insulating properties. Hasanzadeh et al. [25] carried out a comparative analysis of common insulation materials using decision-making methods, establishing a theoretical predictive model for overall TC and validating it through experimental results. Liu et al. [26] provided a reference for predicting the TC of polymer composites for directional fillers by training a convolutional neural network model, contributing to the prediction of the TC properties of composite materials. Zha et al. [27] reviewed the thermal conduction theory of composite materials and conducted an in-depth analysis of the impact of interfacial thermal resistance on heat transfer. Lou et al. [28] discussed the heat transfer mechanisms and TC testing methods of nanoporous insulation materials, summarizing and prospecting their theoretical research and applications. Wang et al. [29] developed a novel bio-based insulation material primarily using corn cob as the main raw material, proposing a preparation method for bio-based insulation materials, offering new methods and ideas for the development of multifunctional insulation materials. Dong et al. [30] studied the advantages and disadvantages of various external wall insulation technologies, providing recommendations for different forms of external wall insulation. Numerous studies indicate that insulation materials play a crucial role in improving building energy efficiency. However, there is still significant research space in the efficiency and methods of calculating the TC of insulation materials. Improving predictive methods for TC significantly enhances the efficiency of calculating insulation materials’ TC. This is of great importance for the optimization design, improvement, and development of new products in insulation materials.
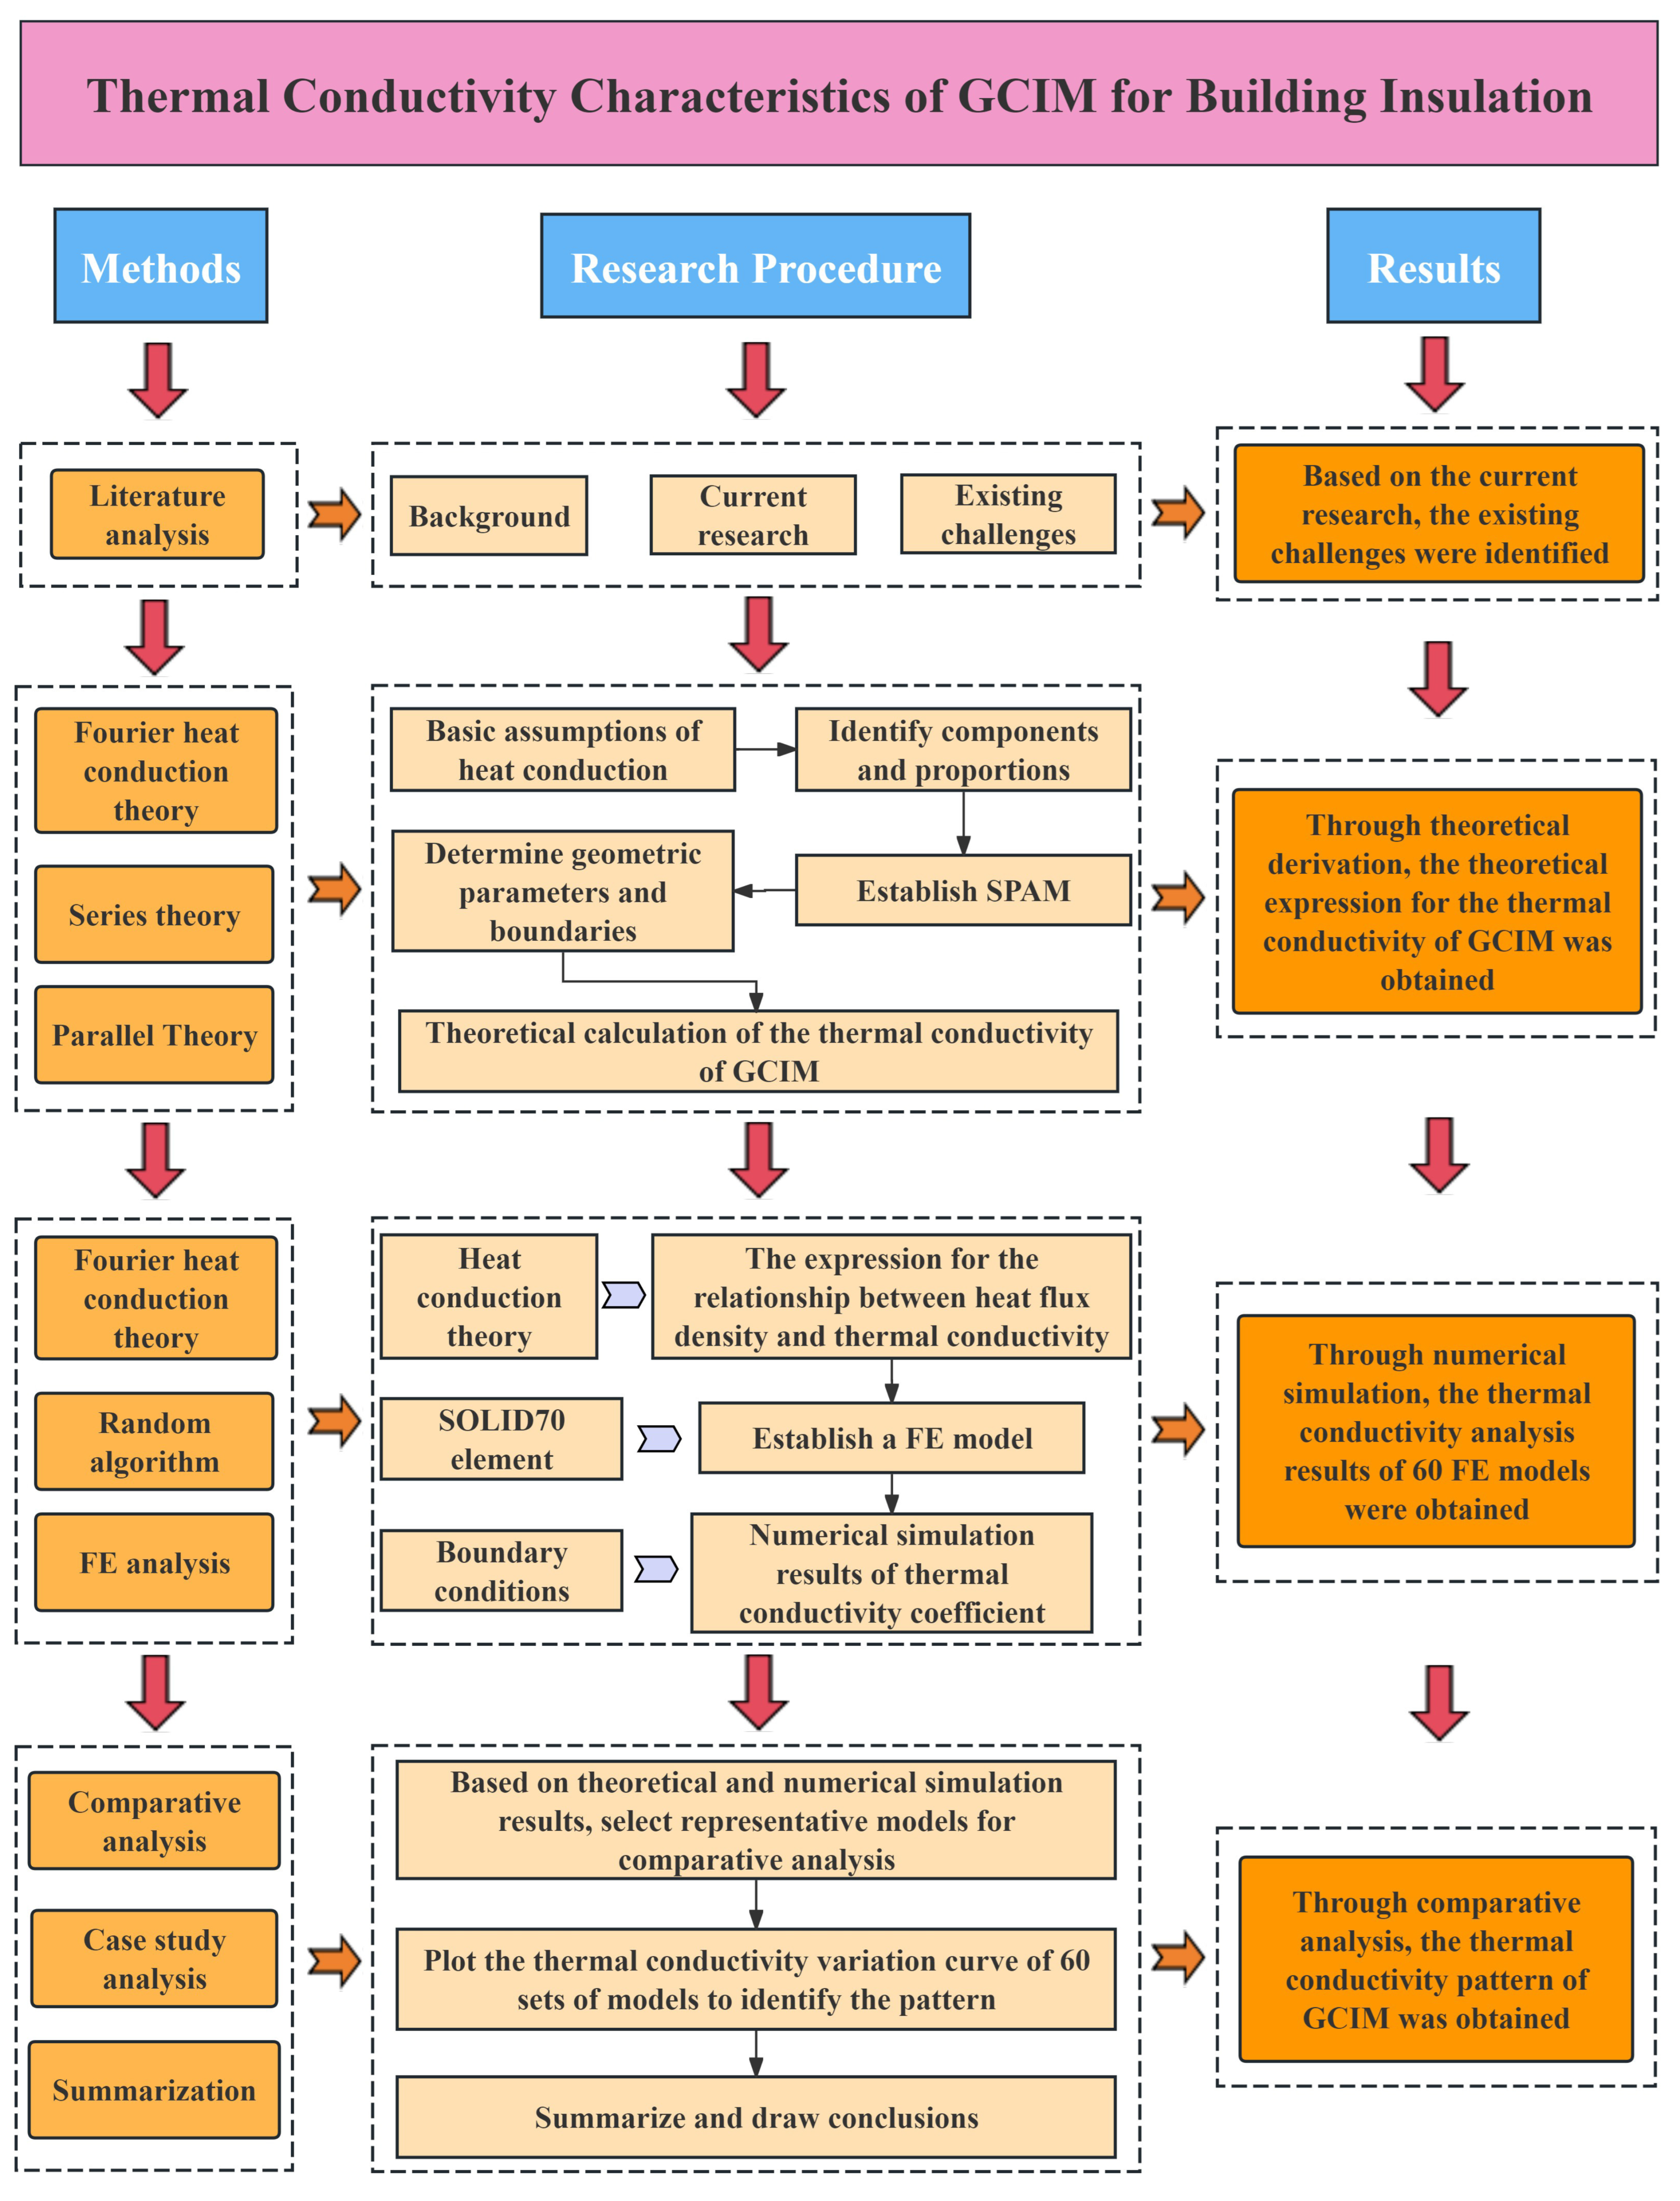
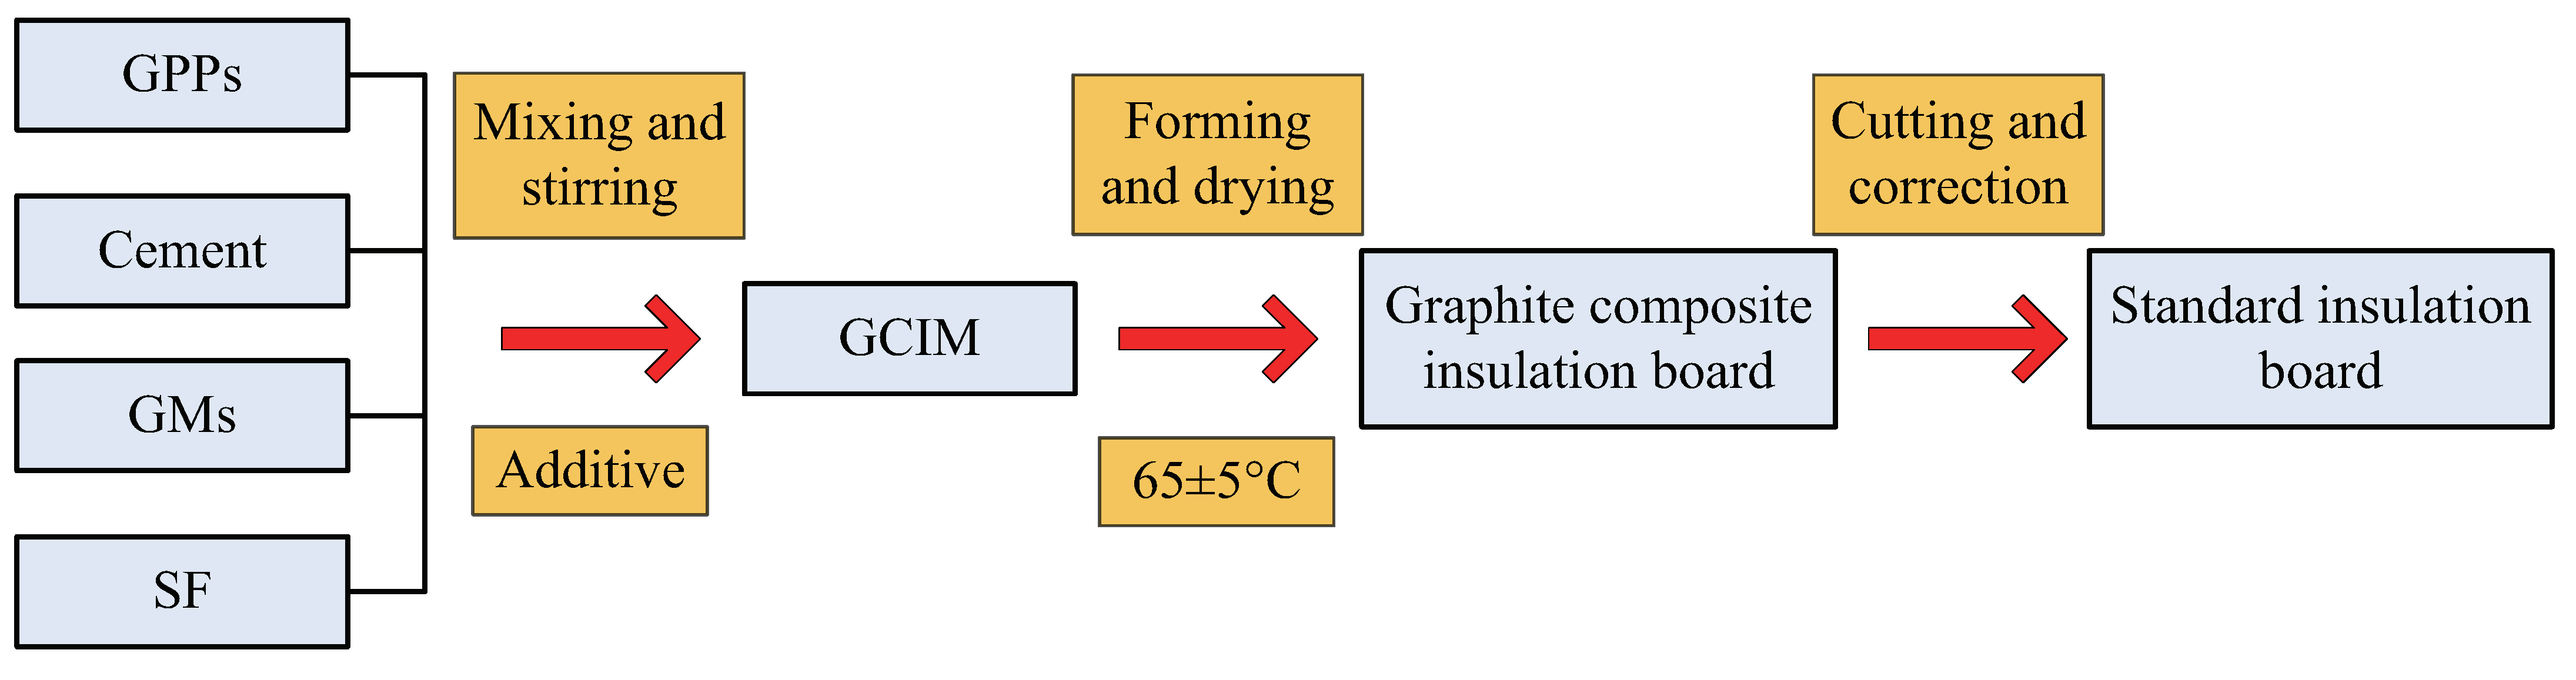
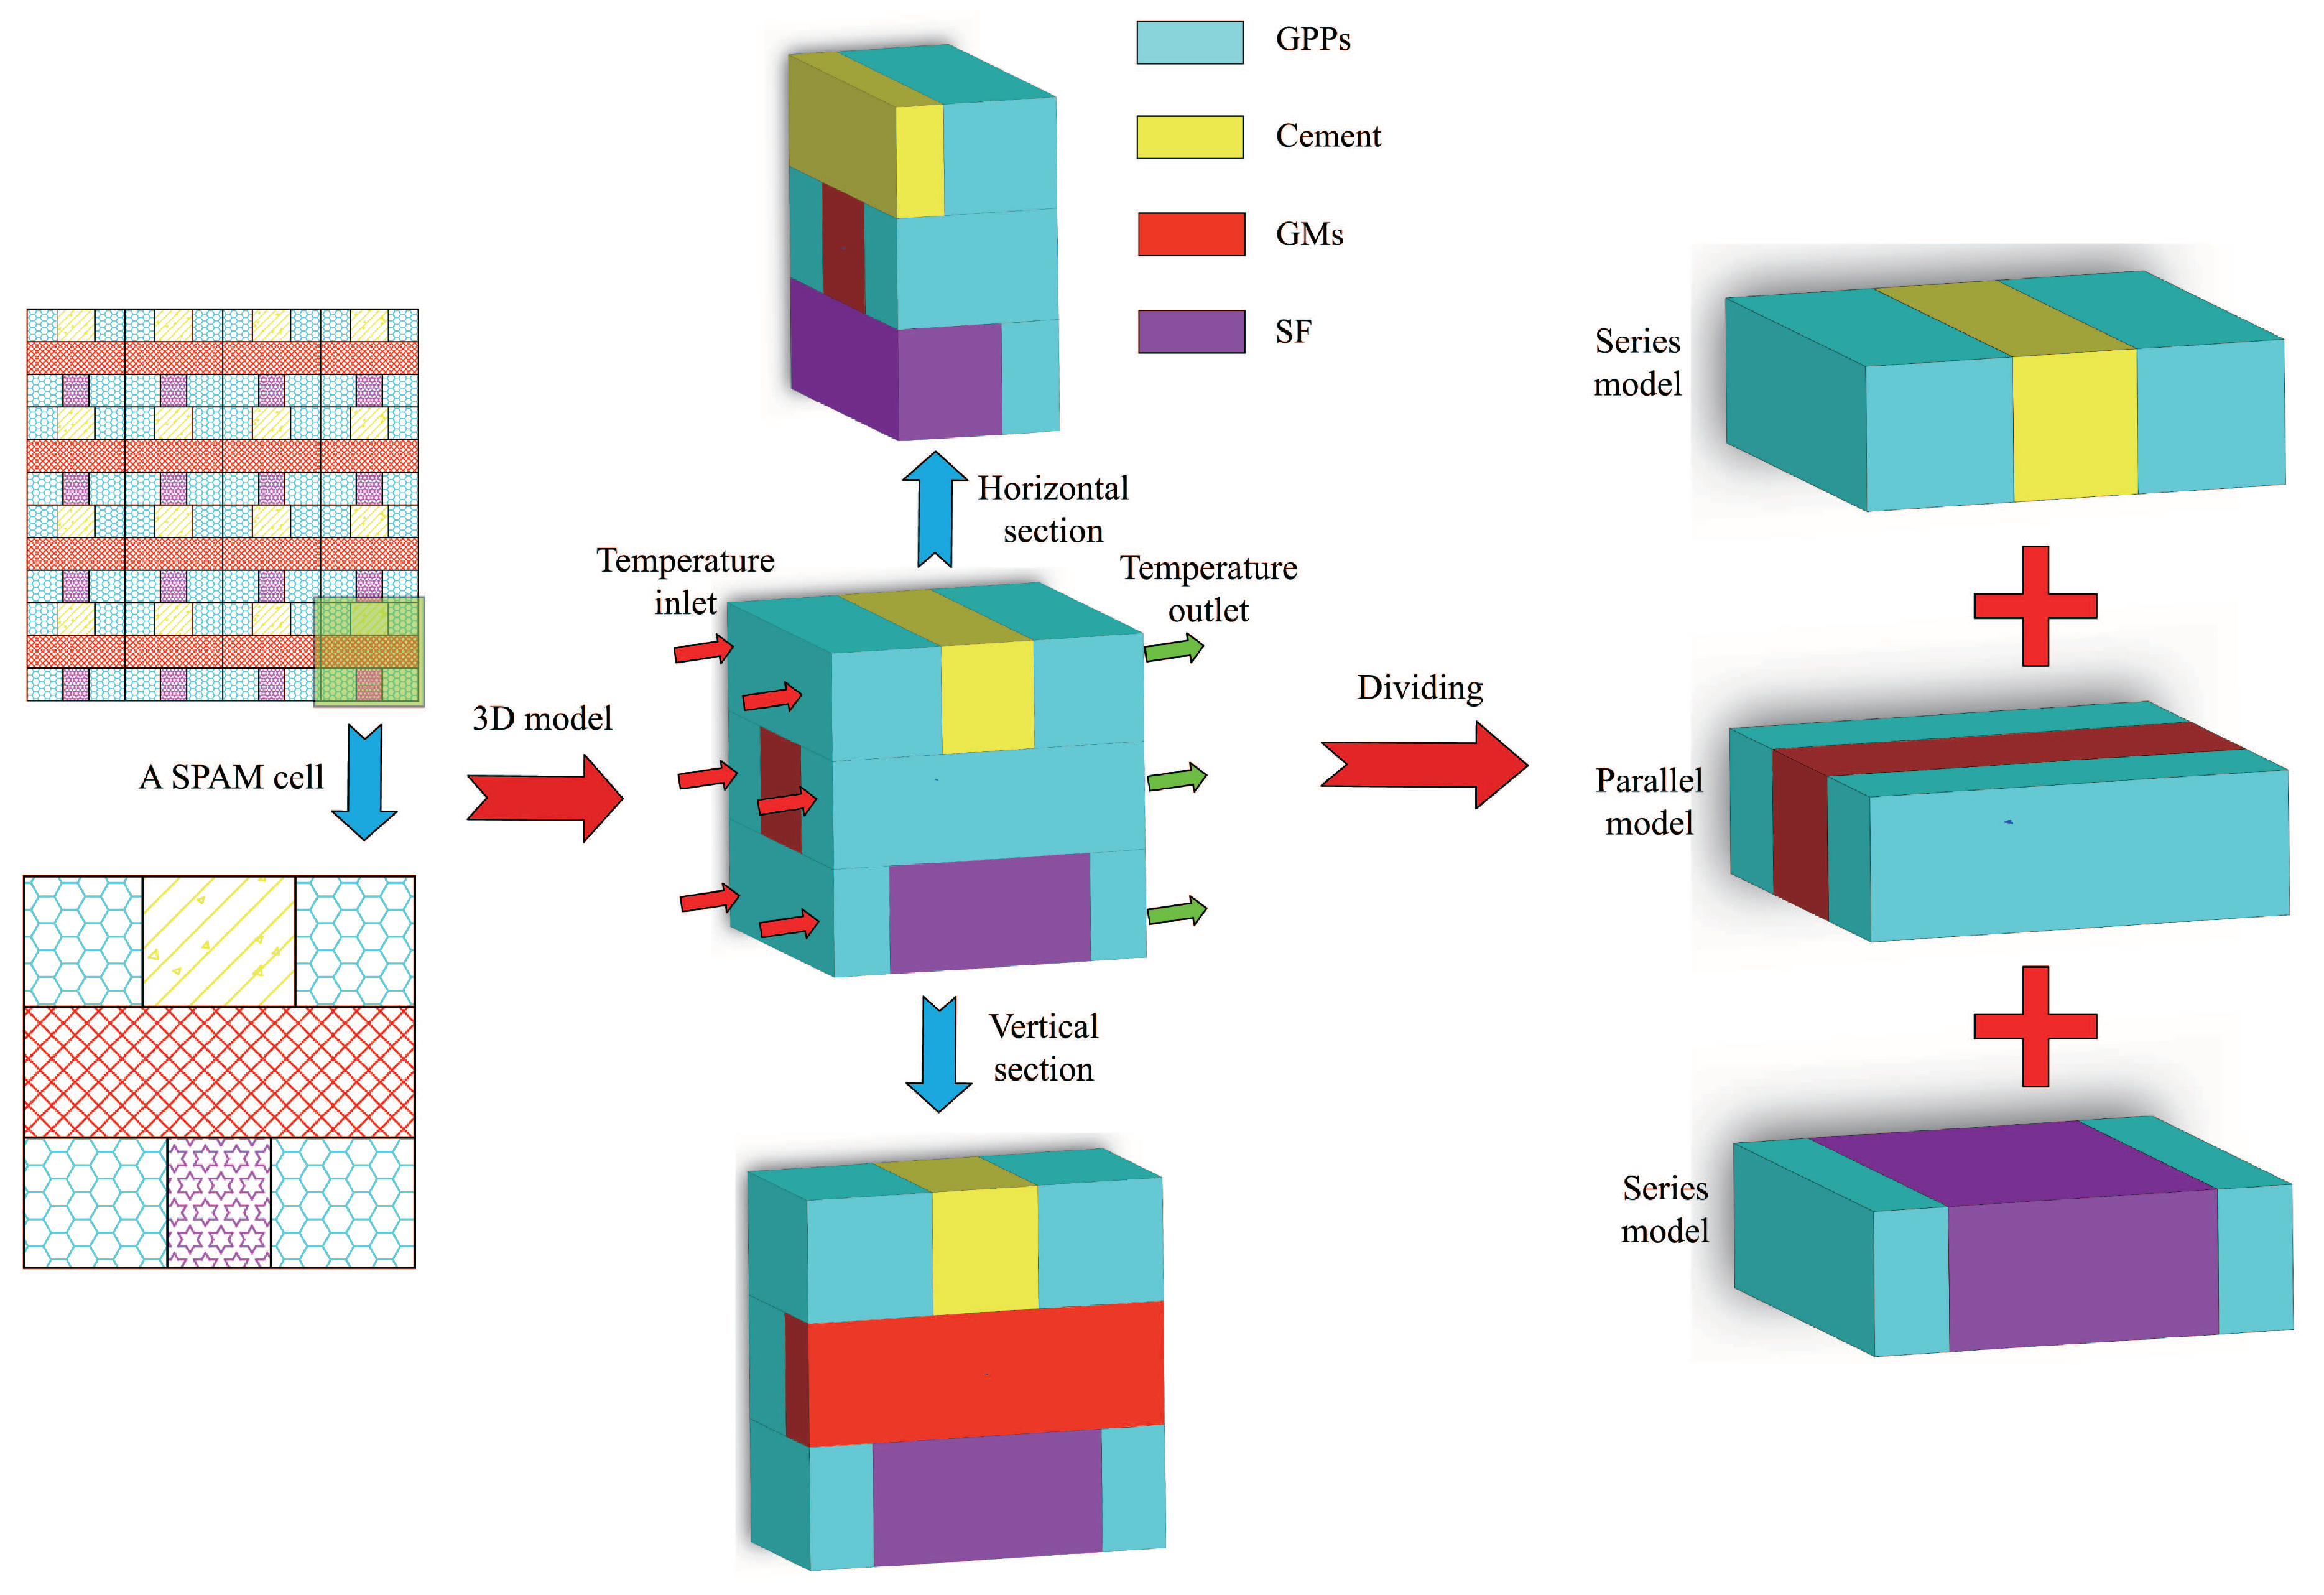
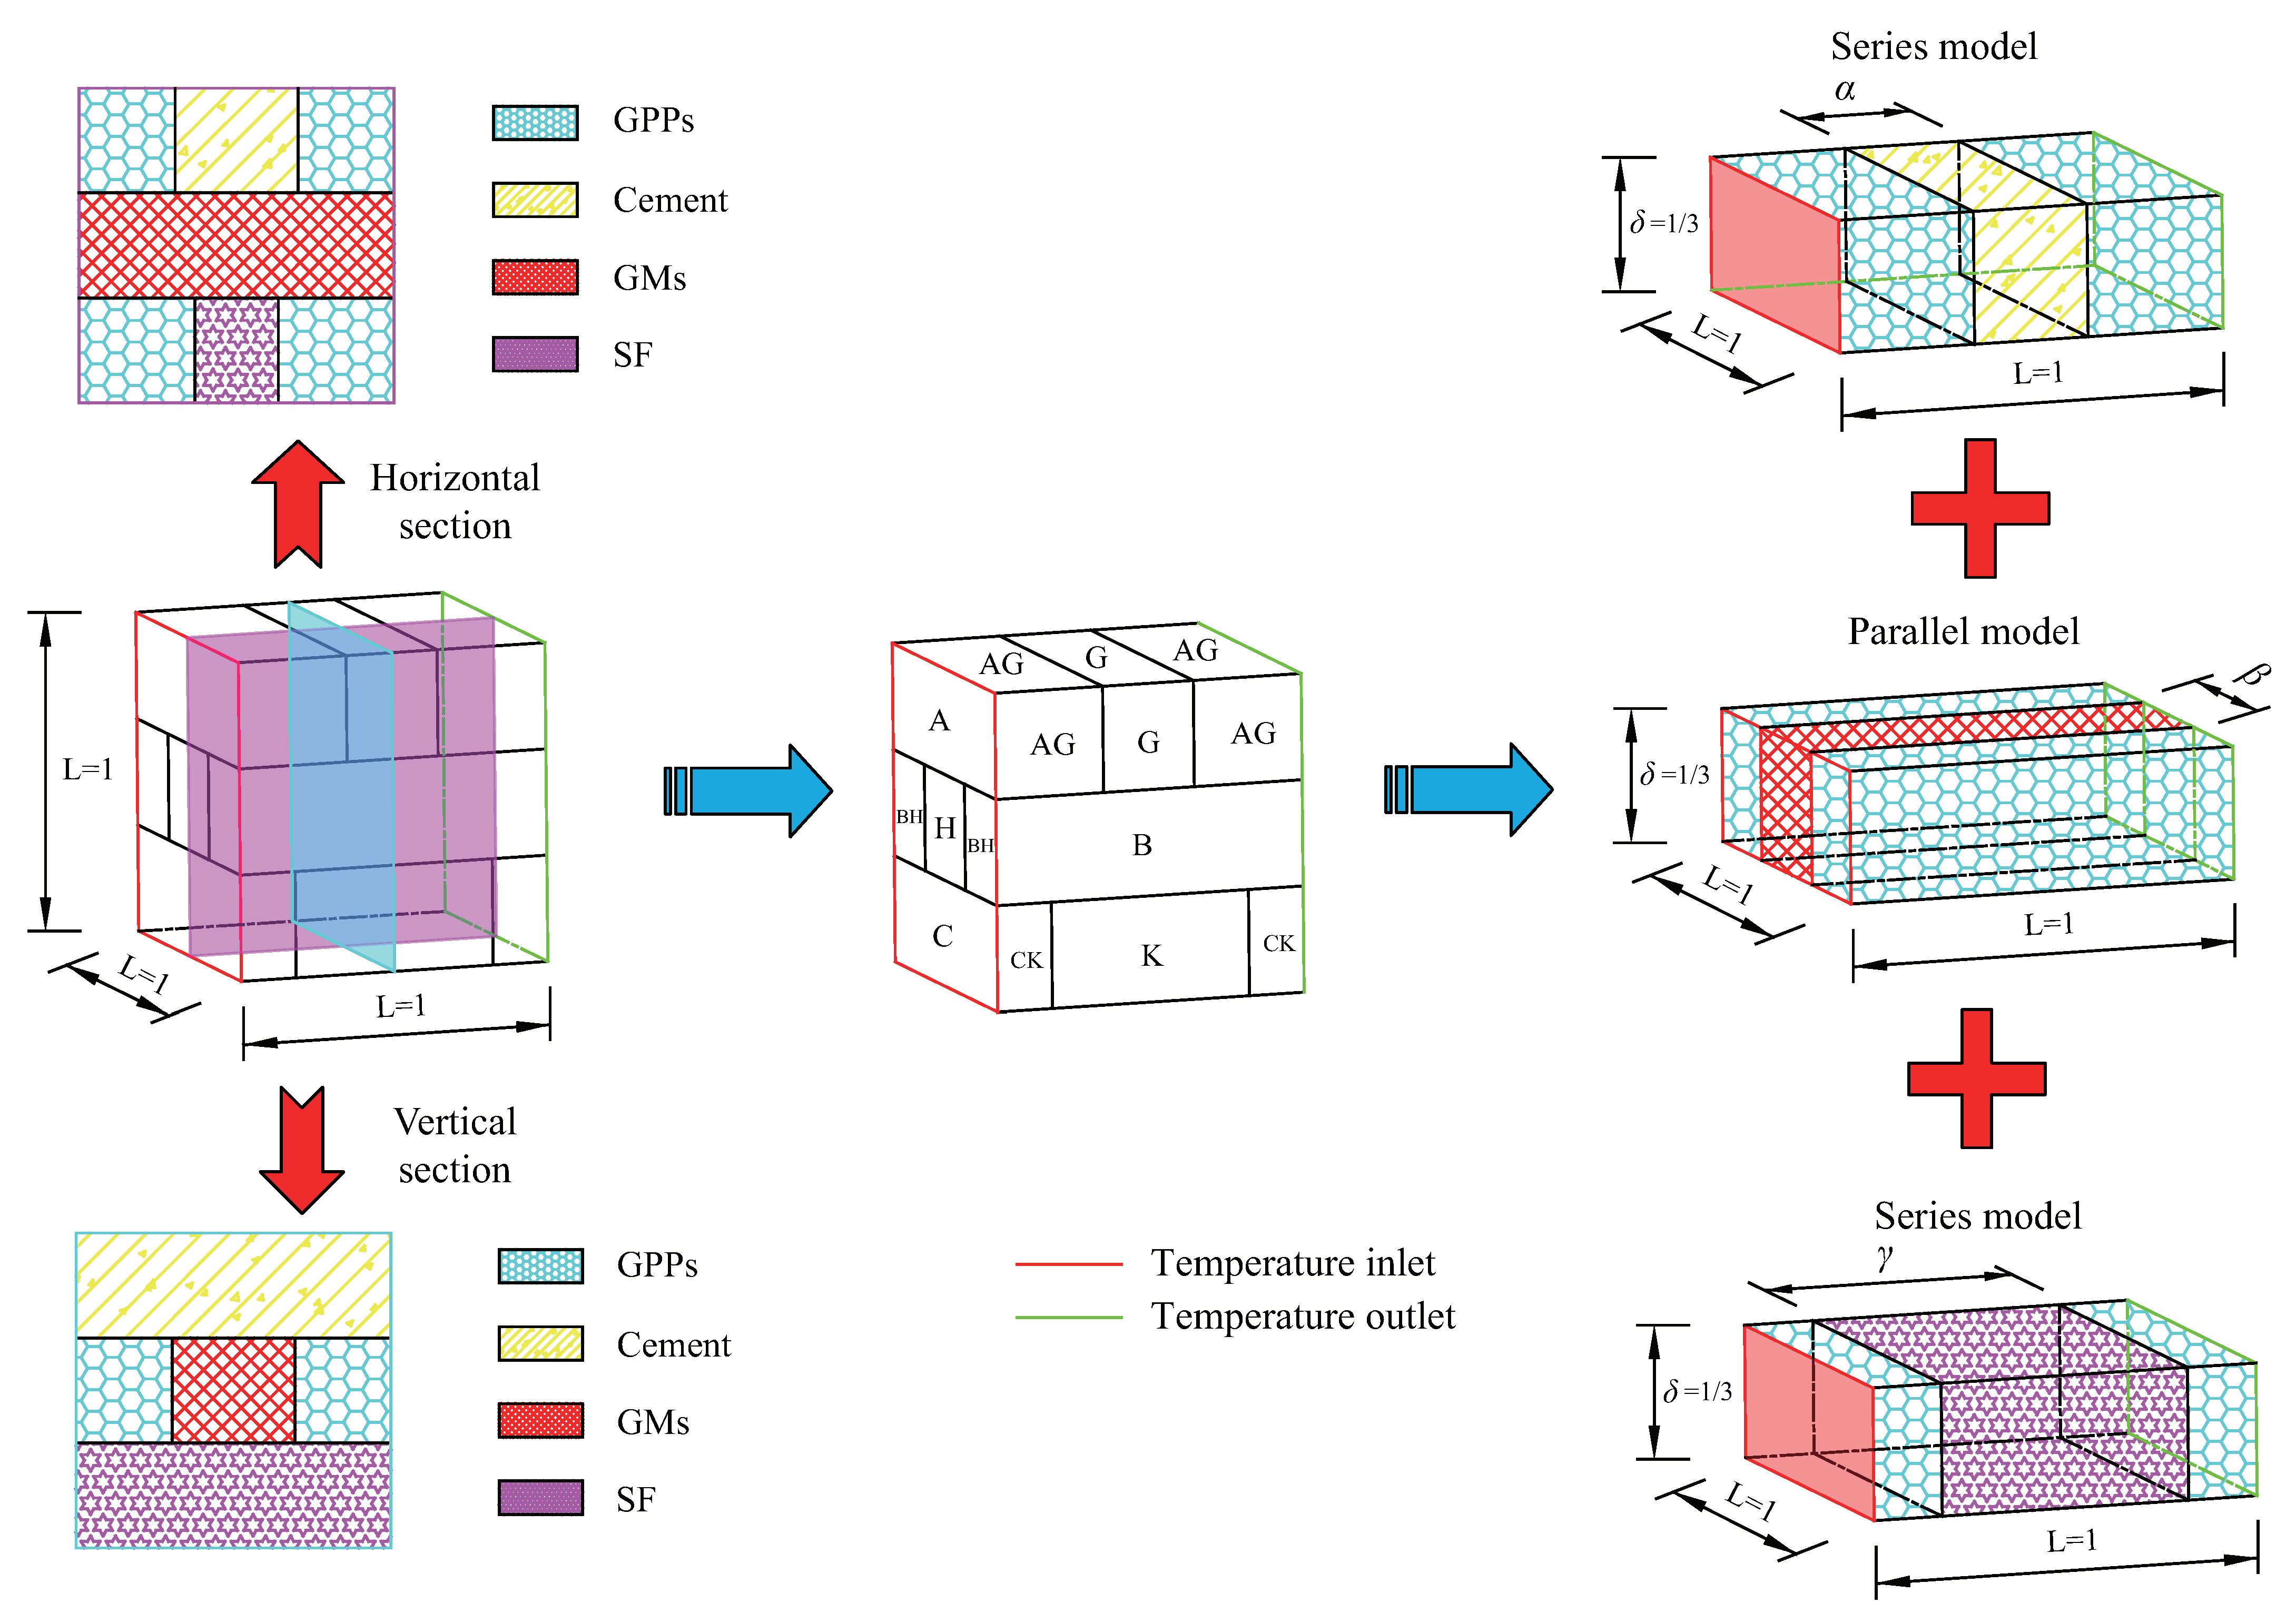
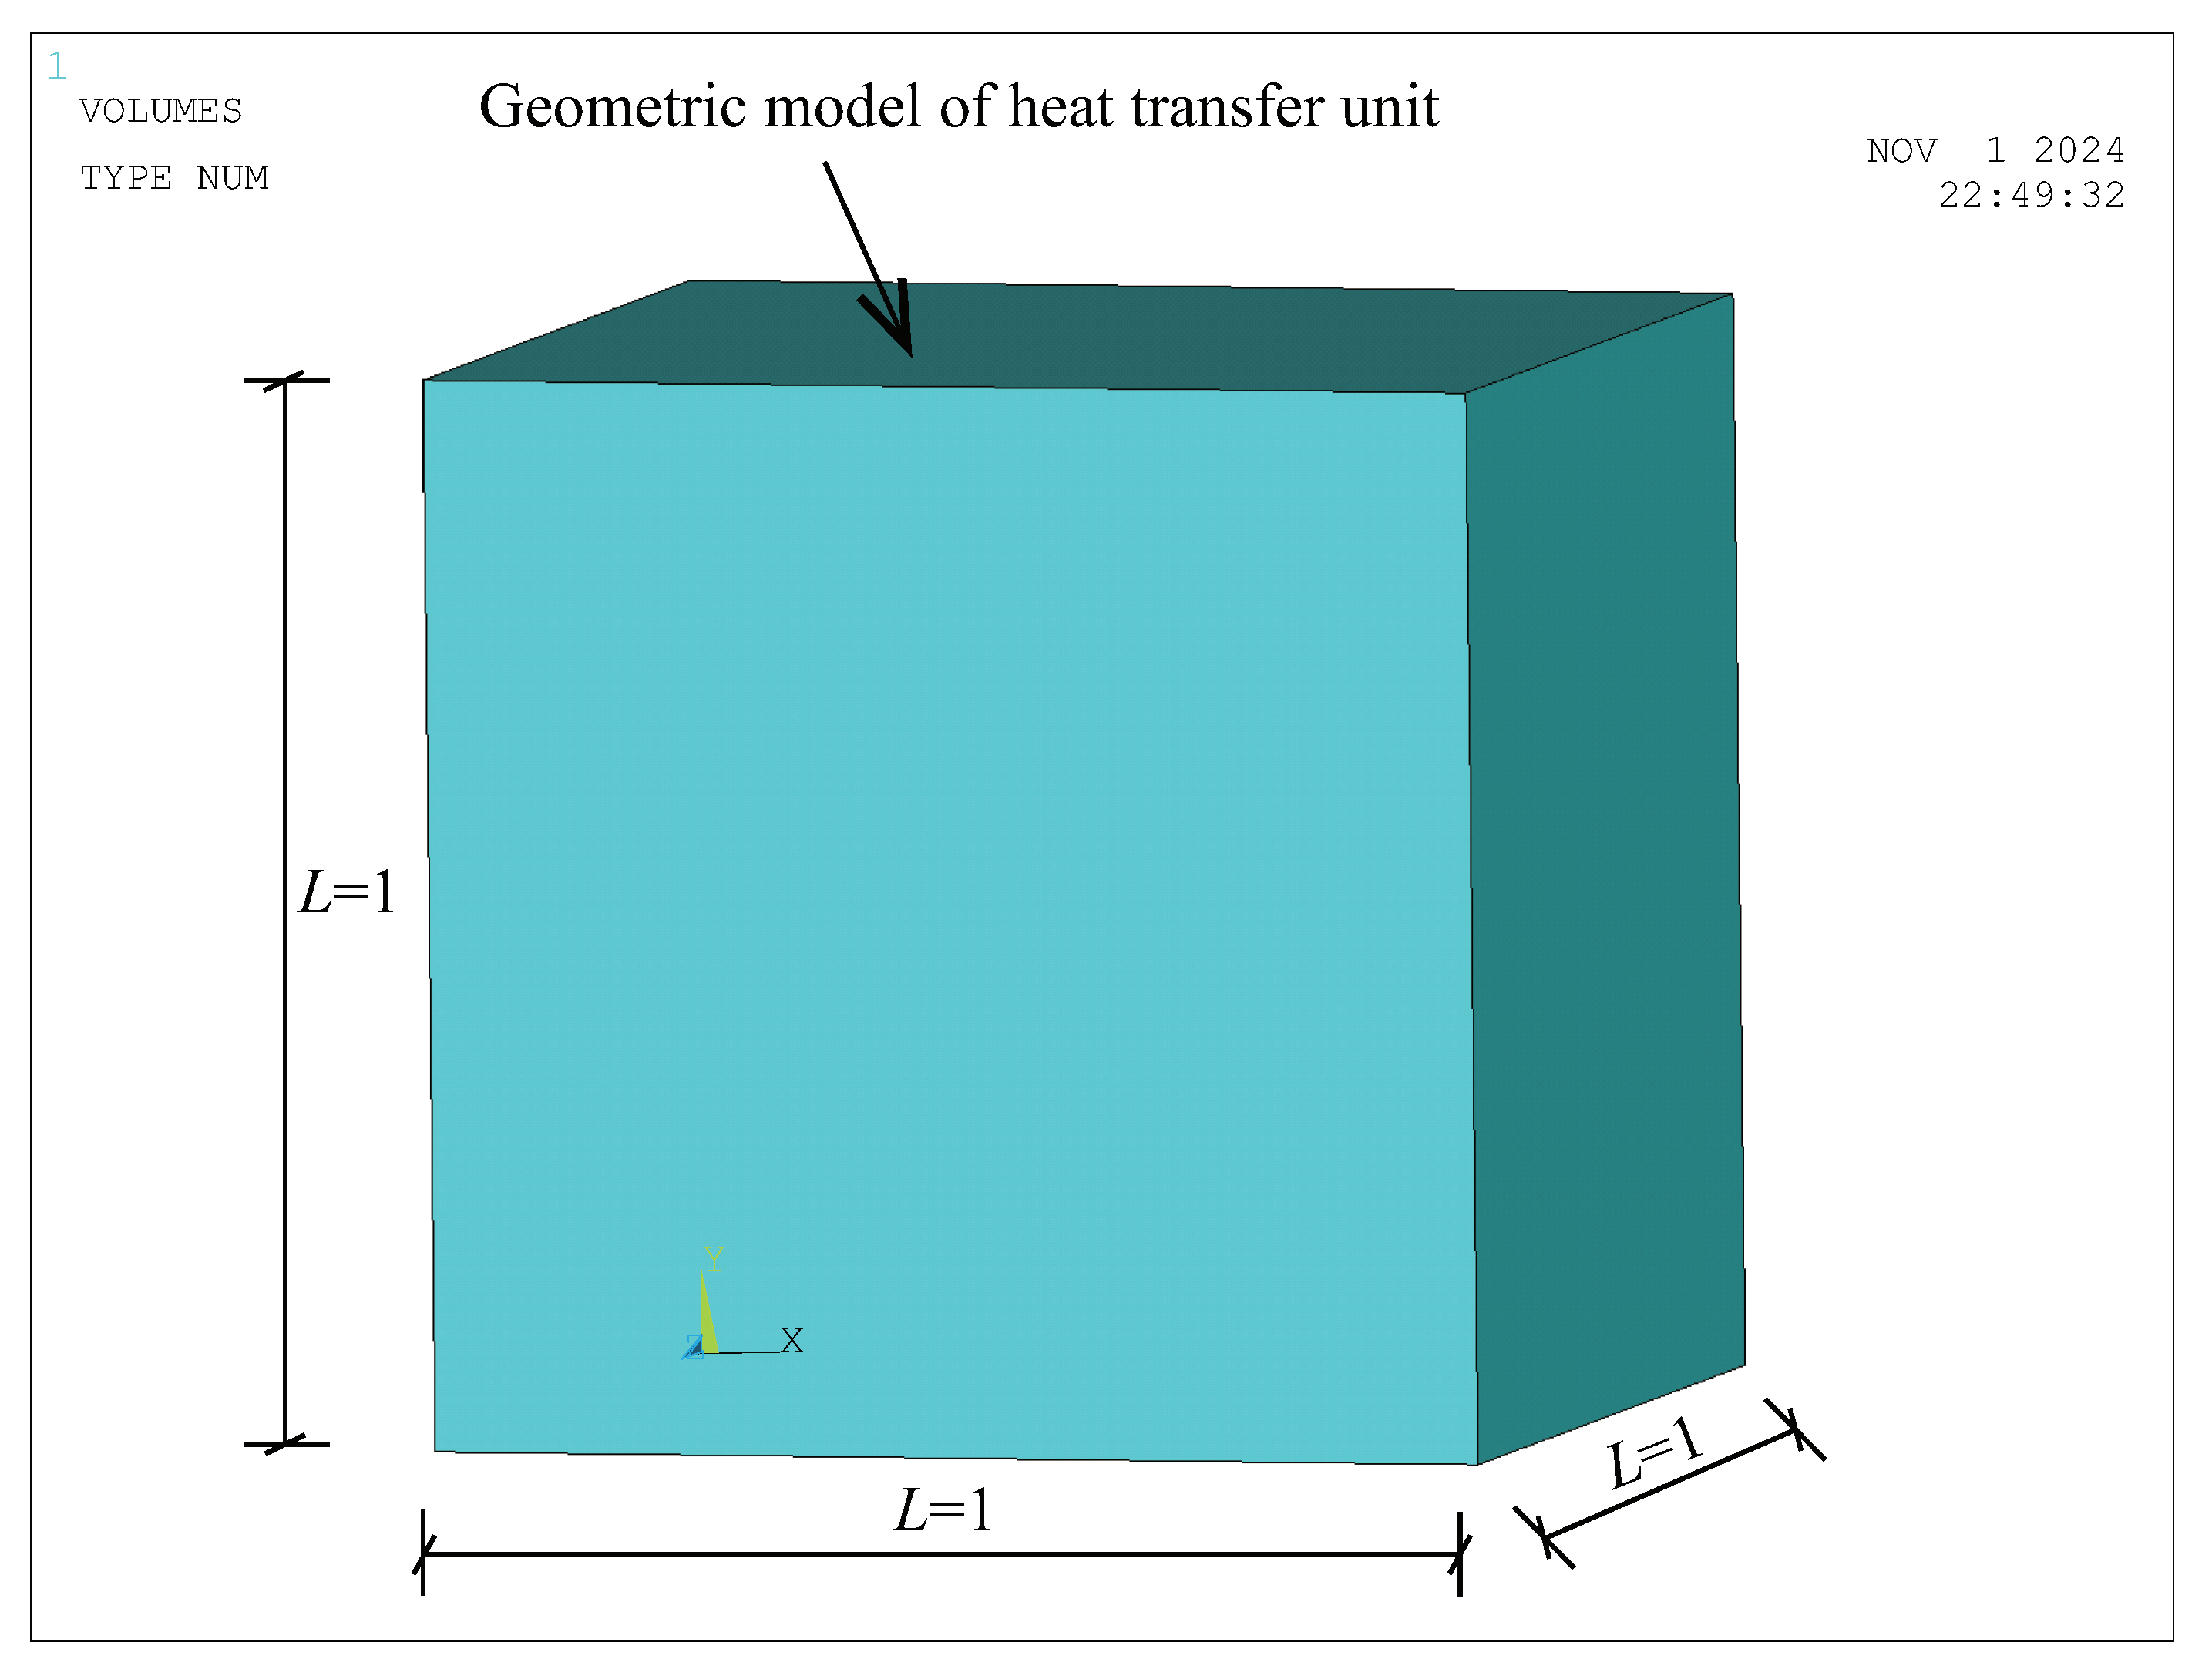
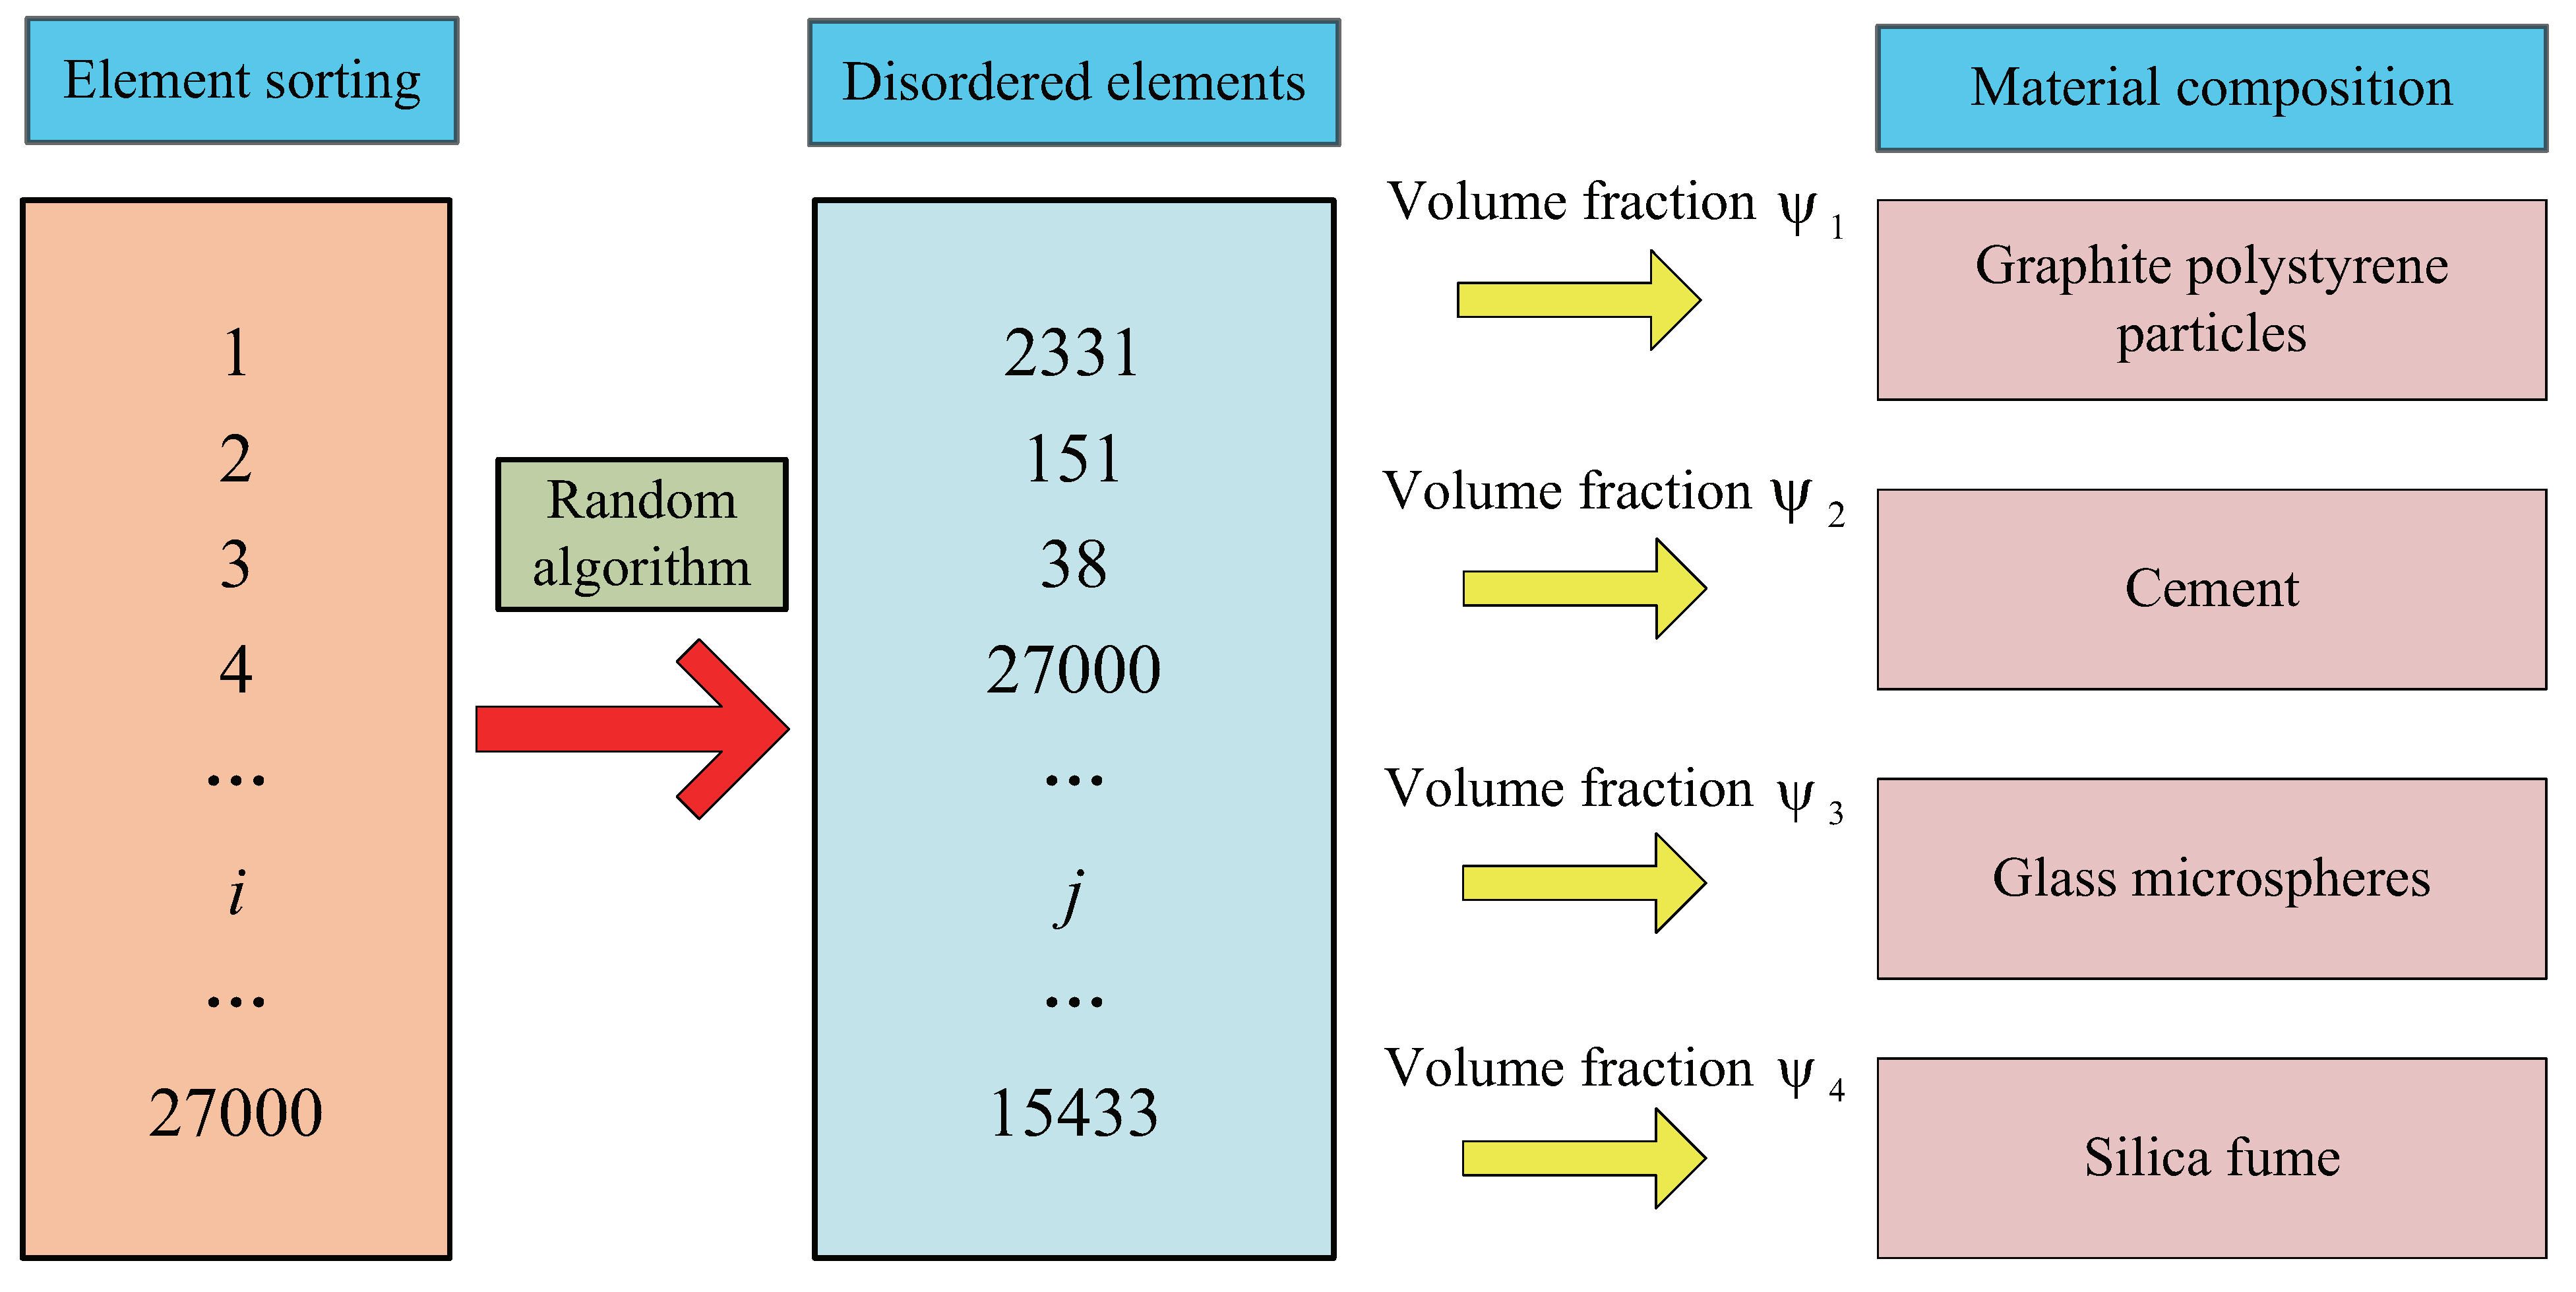
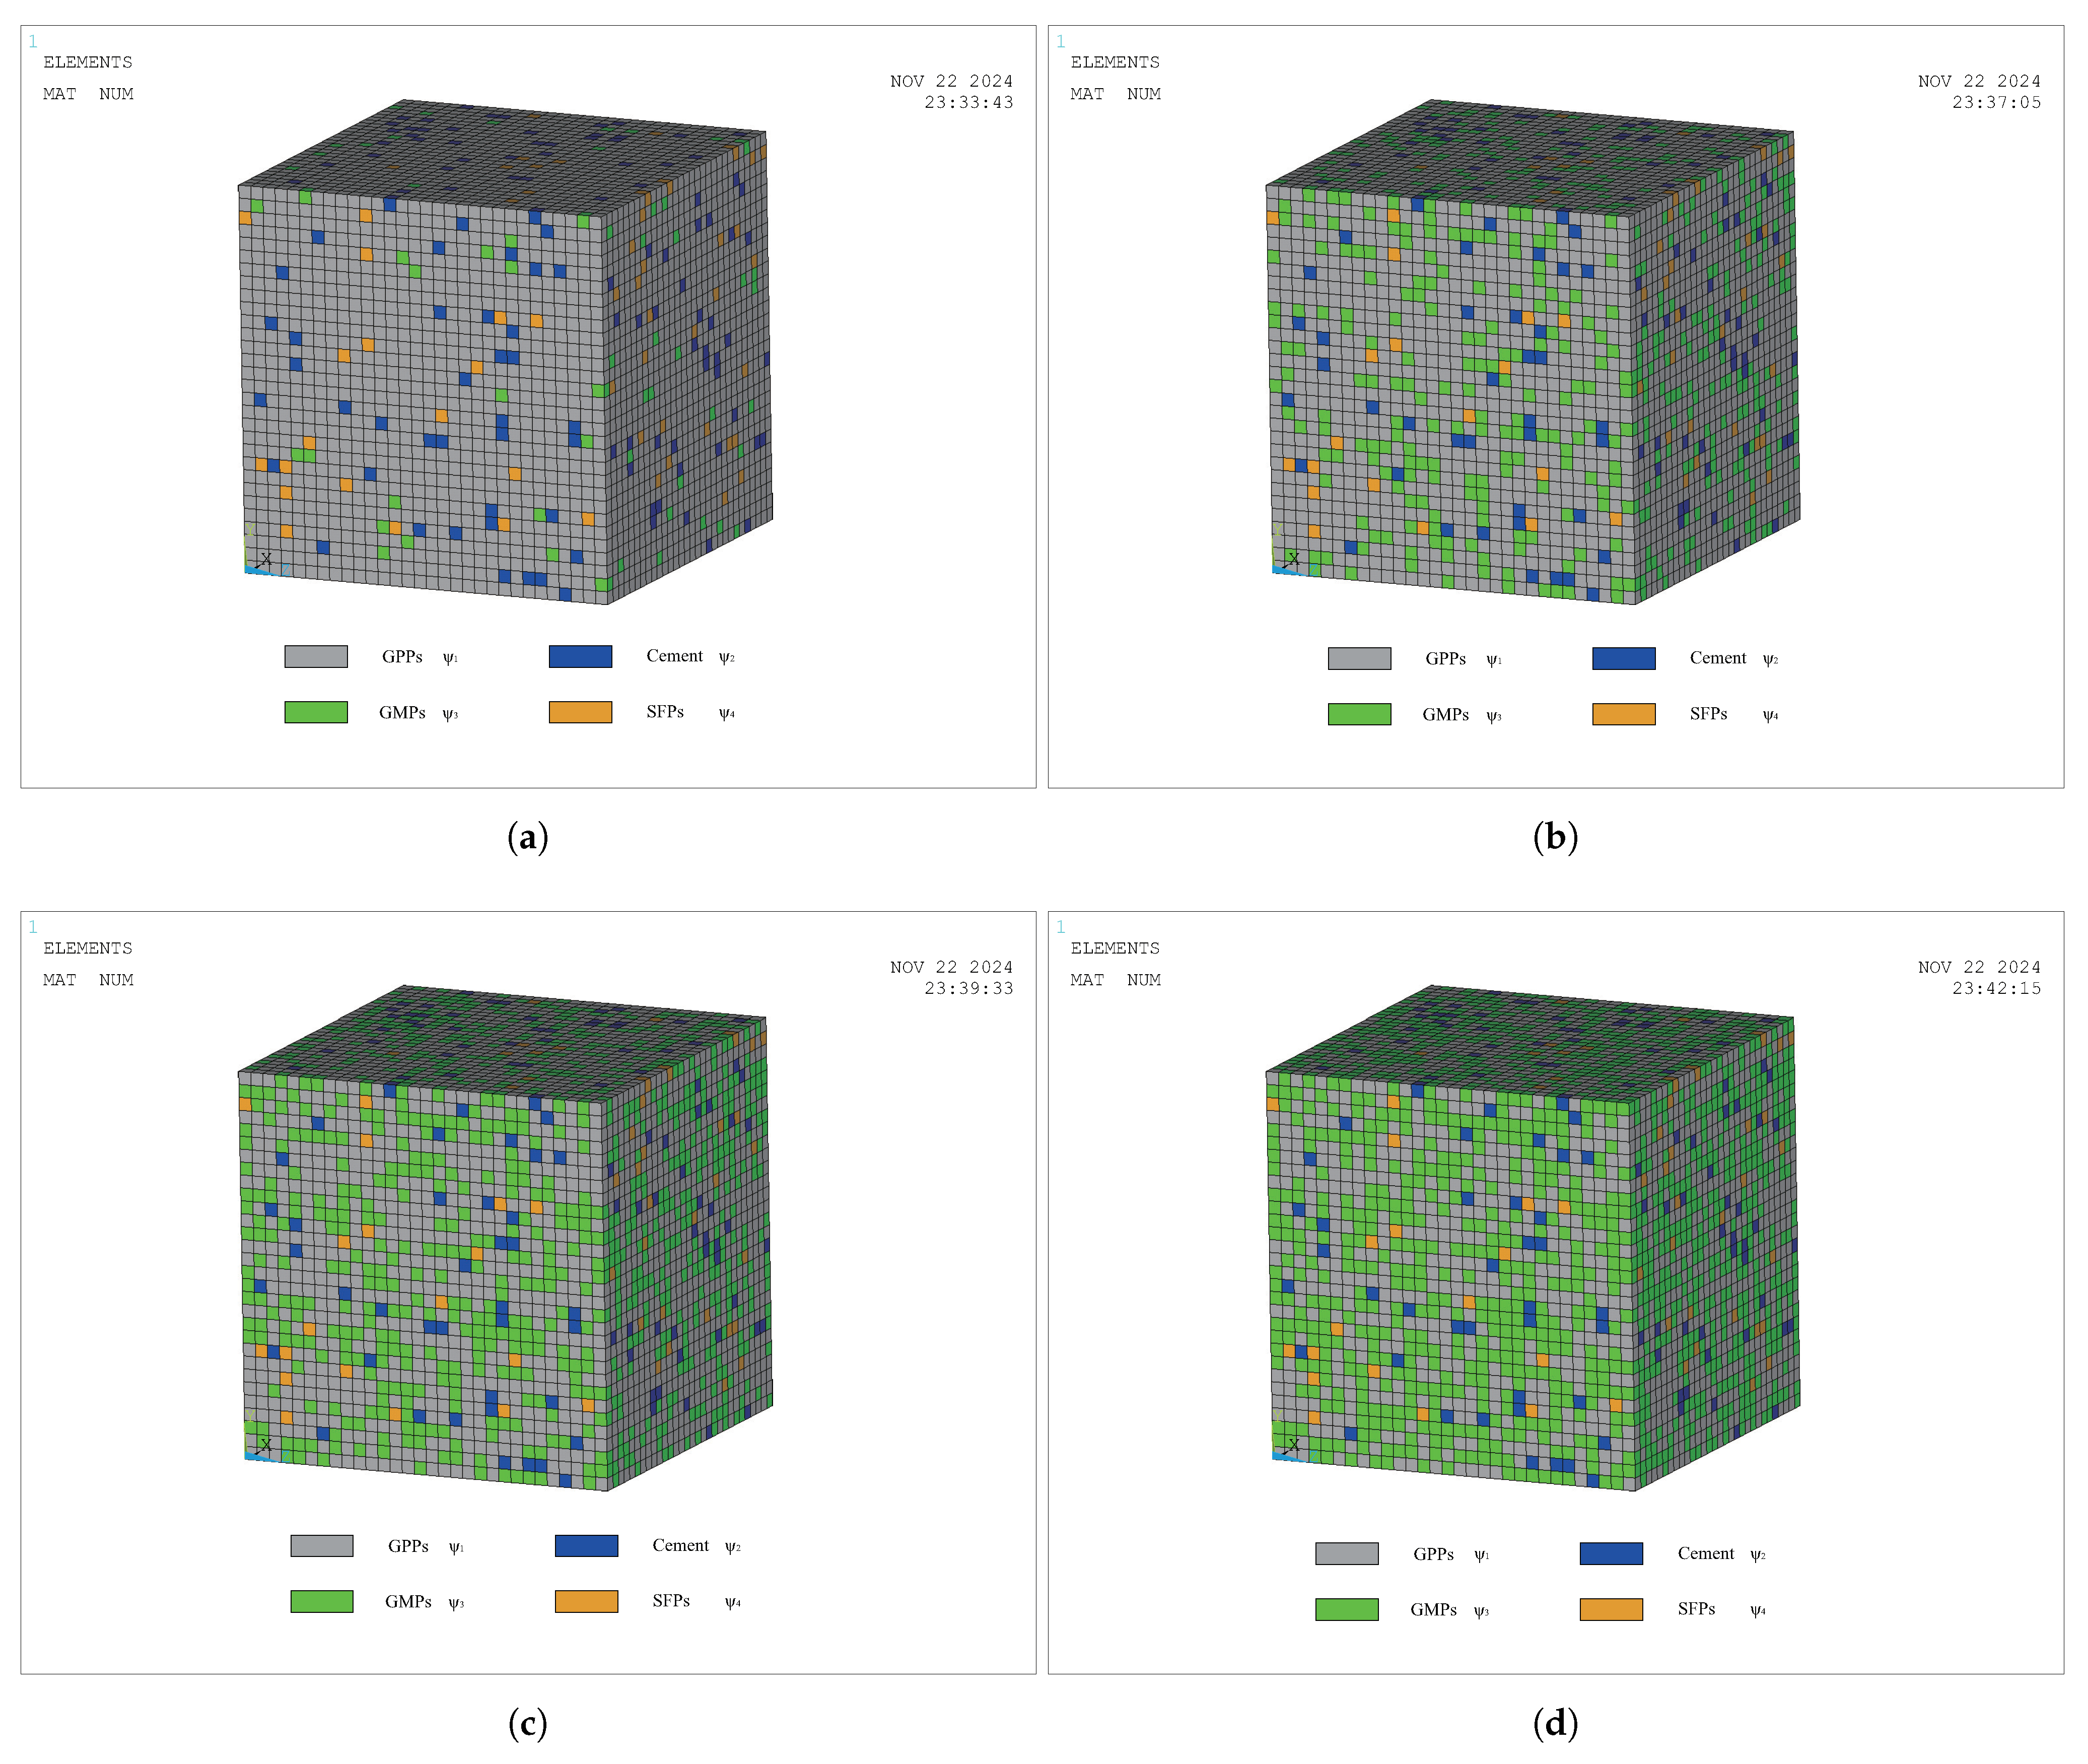
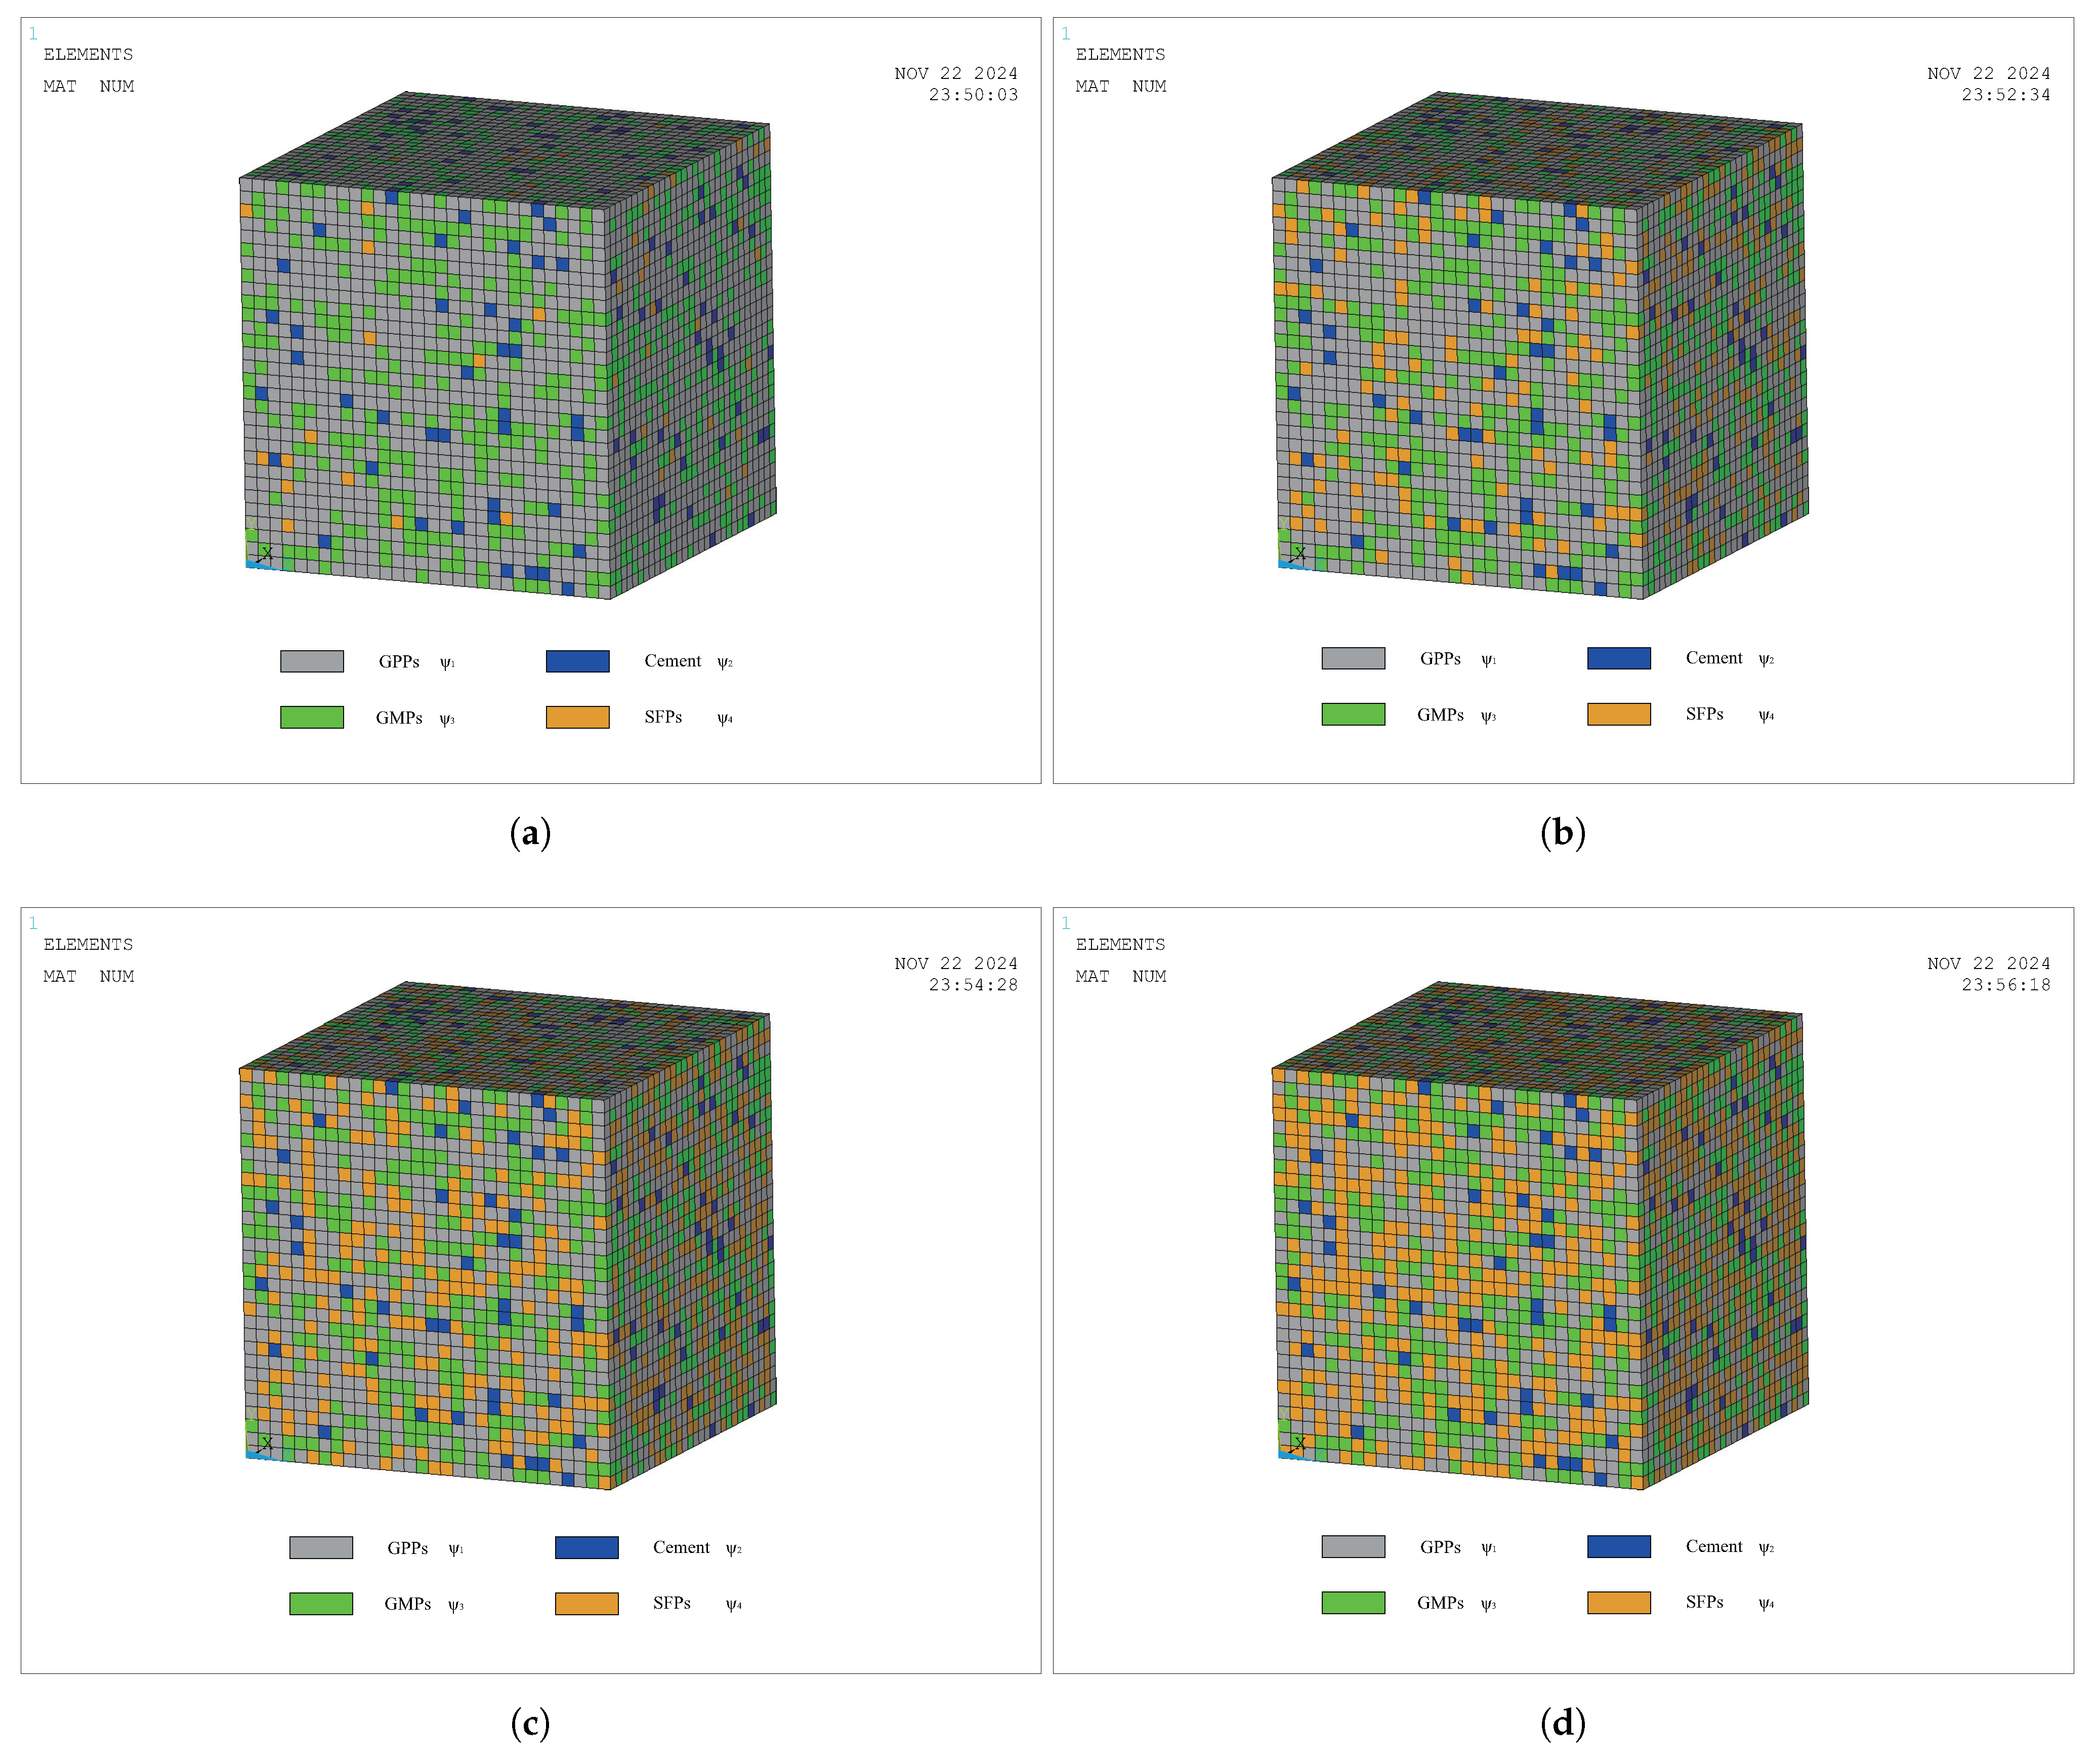
Previous studies have mainly focused on the theoretical and experimental research of thermal insulation materials, formulation processes, exploration of different material properties, as well as discussions on the advantages and disadvantages of specific insulation techniques. However, there are still shortcomings in the efficiency and methods of calculating the thermal conductivity of insulation materials. The lack of an efficient and accurate method for calculating the thermal conductivity of insulation materials restricts the further optimization, improvement, and efficient development of new products in insulation material design. Based on this, in order to improve the efficiency of calculating the TC of insulation materials and to make up for the shortcomings of existing research, this paper takes the graphite composite insulation material (GCIM) as the research object and establishes a theoretical calculation model of the TC of composite materials based on its structural characteristics. By utilizing theoretical calculations to quickly predict the TC of the GCIM, the efficiency of TC calculations is enhanced. Furthermore, a numerical model of the GCIM is established. Through the calculation analysis of the theoretical model and numerical model, the influence of changes in material composition on the TC of the GCIM is further explored. Compared to the majority of previous studies that focused on a single perspective or conducted shallow analyses of material performance, a more systematic and in-depth approach can provide a more comprehensive and valuable reference basis for the development of new insulation materials.
This study aims to focus on graphite composite insulation materials as the core research object, addressing key issues in the thermal conductivity research of insulation materials. By utilizing a numerical model of graphite composite insulation boards and combining it with the aforementioned theoretical calculation models, this research intends to provide a comprehensive and highly valuable reference basis for the development of new insulation materials. This, in turn, will drive further advancements in the field of insulation materials in terms of thermal conductivity calculations and material development applications, contributing to alleviating building energy consumption pressures, addressing climate change, and tackling other real-world challenges. The research results have important theoretical significance for improving the efficiency of calculating the TC of composite materials and the development of new insulation materials.

2. Materials and Methods

Given the existing challenges in the current research, a new theoretical calculation model for the TC of GCIM is proposed based on traditional series and parallel models. The theoretical expression is derived, and combined with numerical simulation, further exploration of the variation characteristics of the TC of GCIM is conducted. The specific research approach is shown in Figure 1.

2.1. Composition of the GCIM

The GCIM is mainly composed of four primary materials: graphite polystyrene particles (GPPs), glass microspheres (GMs), cement, and silica fume (SF) [31,32,33]. It has excellent insulation performance and can meet Class A fire protection requirements, making it widely used in the field of external wall insulation in buildings. GPPs are the main insulating aggregate in the GCIM. As shown in Figure 2, the GPPs are spherical after foaming treatment, with a size ranging from 1 to 5 mm, gray in color, and characterized by low TC and good fire resistance. GMs, as an additive material, primarily enhance the compressive strength of the material. Additionally, they have a low TC, ranging in size from a few micrometers to several hundred micrometers. The inclusion of cement and SF serves a dual purpose: acting as a binder and improving the overall mechanical performance and durability of the insulation material.
GPPs are the primary insulating and fireproof material, derived from improvements made to polystyrene particles by coating them with graphite powder to enhance their fire resistance. According to literature research, the TC of the four components of the GCIM is shown in Table 1.
The GCIM is composed of four main components. These four raw materials are mixed with water at room temperature, and additives are added to form insulation aggregates. The mixture is then shaped using molds and placed in a drying machine until it reaches the required strength, after which it is cut to the desired dimensions. The specific processing workflow is illustrated in Figure 3.

2.2. Basic Theory of Heat Conduction

As an insulation material for exterior walls in buildings, heat transfer mainly occurs vertically to the wall, that is, perpendicular to the insulation board. Therefore, in order to calculate the TC of the GCIM, heat transfer calculations are considered as one-dimensional heat transfer, with the heat transfer direction perpendicular to the plane of the insulation board. Firstly, the basic assumptions for heat transfer calculations are presented as follows.
  • The overall heat transfer path of insulation materials is one-dimensional conduction, with the conduction direction perpendicular to the plane of the insulation board. Additionally, the temperature distribution within the system and the rate of heat transfer remain constant. After a certain period of time, the system reaches a steady state where there are no further temperature variations.
  • The GCIM is a composite material, with the composition of its four internal component materials being continuous, and the transfer of heat is also continuous.
  • The basic assumptions of traditional series and parallel models are satisfied in the GCIM. In other words, the theoretical calculations of the GCIM are based on series and parallel models.
Based on this, the Fourier heat conduction theory is valid in calculations. In the state of one-dimensional heat conduction, the Fourier heat conduction can be expressed as:
T t = α 2 T 2 x ,
where T is temperature, t is time, x is the spatial coordinate, and α is the thermal diffusivity.
In the one-dimensional heat conduction state, the heat flux q can be used to express the rate of heat transfer and can be represented as:
q = λ d T d x .
Thermal resistance R represents the degree of hindrance to heat transfer in a system, and it has the following relationship with the TC.
R = Δ λ A ,
where Δ represents the TC thickness of the material, and A represents the TC cross-sectional area of the material.

2.3. The Series-Parallel Alternate Heat Conduction Theoretical Model (SPAM)

2.3.1. Establishment of the Model

The temperature difference exists on the surface of an object, and heat transfer will occur [34]. According to the thermal conduction theory, the equivalent TC of composite materials is not affected by the unit volume [31]. Consequently, the theoretical model can be based on a single unit cell for computation. The theoretical heat conduction model of the GCIM can be considered as a combination of four component materials. Based on the traditional heat conduction model, the SPAM is established, as shown in Figure 4.

2.3.2. Theoretical Calculation

According to the model shown in Figure 4, the SPAM is obtained as shown in Figure 5. In the basic unit cell shown in Figure 5, the four component materials are combined into a heat conduction calculation model through a series-parallel alternating combination. The theoretical model is formed by the parallel connection of heat conduction subunits in series and parallel alternation.
To obtain the TC of the SPAM, the basic dimensions of the four constituent parts are as shown in Figure 6.
In the heat conduction model in Figure 6, the thermal theoretical calculation unit is a cube with a side length of L = 1 . This cube is composed of three primary sub-heat conduction units, A, B, and C, each with a thickness of δ = 1 / 3 . The primary heat conduction sub-units A, B, and C are comprised of secondary matrix material sub-units and secondary inclusion material sub-units. GPPs serve as the matrix material, with a volume fraction of Ψ 1 . Cement, GMs, and SF act as inclusion materials, with volume fractions of Ψ 2 , Ψ 3 , and Ψ 4 , respectively. The key dimensions of the secondary inclusion material sub-units are α , β , and γ ; according to geometric relationships, it can be obtained that
α = L 2 Ψ 2 δ ,
β = L 2 Ψ 3 δ ,
γ = L 2 Ψ 4 δ ,
where L is the side length of the cubic heat conduction unit, and δ represents the thickness of the primary heat conduction sub-units A, B, and C.
The cubic thermal calculation theoretical unit is composed of three primary sub-units (A, B, and C) in parallel. According to the parallel heat conduction model, the inverse of the total thermal resistance in parallel is equal to the sum of the inverses of the thermal resistances of each layer component unit, i.e.,
1 R E SPAM = 1 R AE + 1 R BE + 1 R CE ,
where R E SPAM represents the equivalent thermal resistance of the heat conduction calculation unit (unit: K / W ), R AE , R BE , and R CE represent the equivalent thermal resistances of the primary sub-units A, B, and C (unit: K / W ).
According to Fourier’s heat conduction theory, the thermal resistance of the cubic thermal theoretical calculation model can be expressed as
R E SPAM = 1 L λ E SPAM ,
where λ E SPAM represents the equivalent TC of the cubic heat conduction unit (unit: W/m·K).
Similarly, the equivalent thermal resistances of the primary heat conduction sub-units A, B, and C can be expressed as
R AE = 1 δ λ AE ,
R BE = 1 δ λ BE ,
R CE = 1 δ λ CE ,
where λ AE , λ BE , and λ CE represent the equivalent thermal conductivities of the primary heat conduction sub-units A, B, and C (unit: W/m·K).
In this case, the primary heat conduction sub-unit A is composed of the secondary base material sub-unit AG and the secondary inclusion material sub-unit G connected in series. The heat transfer area of the secondary base material unit AG is rectangular, with an area of A AG = L · δ and a heat transfer length of L α . The heat transfer area of the secondary inclusion material unit G is also rectangular, with an area of A G = L · δ and a heat transfer length of α . According to Fourier’s heat conduction theory, the thermal resistance calculation expressions for the secondary base material unit AG and the secondary inclusion material unit G are given by
R AG = δ L Ψ 2 δ 2 λ 1 ,
R G = L Ψ 2 δ 2 λ 2 .
The secondary base material sub-unit AG and the secondary inclusion material sub-unit G are connected in series to form the primary heat conduction sub-unit A. Based on the relationship of series thermal resistances, it can be derived that
R AE = R AG + R G .
According to Equations (9) and (12)–(14), the theoretical calculation expression for the equivalent TC of the primary heat conduction sub-unit A can be obtained through calculations.
λ AE = δ λ 1 λ 2 δ λ 2 + L Ψ 2 λ 1 λ 2 .
The primary heat conduction sub-unit B is formed by the parallel connection of the secondary base material sub-unit BH and the secondary inclusion material sub-unit H. The heat transfer area of the secondary base material unit BH is rectangular, with an area of A BH = L β · δ and a heat transfer length of L. The heat transfer area of the secondary inclusion material unit H is also rectangular, with an area of A H = β · δ and a heat transfer length of L. According to Fourier’s heat conduction theory, the thermal resistance calculation expressions for the secondary base material unit BH and the secondary inclusion material unit H are
R BH = 1 δ L Ψ 3 λ 1 ,
R H = 1 L Ψ 3 λ 3 .
The secondary base material sub-unit BH and the secondary inclusion material sub-unit H are connected in parallel to form the primary heat conduction sub-unit B. Based on the relationship of parallel thermal resistances, it can be derived that
1 R BE = 1 R BH + 1 R H .
According to Equations (10) and (16)–(18), the theoretical calculation expression for the equivalent TC of the primary heat conduction sub-unit B can be obtained through calculations.
λ BE = δ λ 1 L Ψ 3 λ 1 λ 3 δ .
The primary heat conduction sub-unit C is formed by the series connection of the secondary base material sub-unit CK and the secondary inclusion material sub-unit K. The heat transfer area of the secondary base material unit CK is rectangular, with an area of A CK = L · δ and a heat transfer length of L γ . The heat transfer area of the secondary inclusion material unit K is also rectangular, with an area of A K = L · δ and a heat transfer length of γ . According to Fourier’s heat conduction theory, the thermal resistance calculation expressions for the secondary base material unit CK and the secondary inclusion material unit K are
R CK = δ L Ψ 4 δ 2 λ 1 ,
R K = L Ψ 4 δ 2 λ 4 .
The secondary base material sub-unit CK and the secondary inclusion material sub-unit K are connected in series to form the primary heat conduction sub-unit C. According to the relationship of series thermal resistances, it can be derived that
R CE = R CK + R K .
According to Equations (11) and (20)–(22), the theoretical calculation expression for the equivalent TC of the primary heat conduction sub-unit C can be obtained through calculations.
λ CE = δ λ 1 λ 4 δ λ 4 + L Ψ 4 λ 1 λ 4 .
Through theoretical calculations, the equivalent TC calculation expressions for the primary heat conduction sub-units A, B, and C are obtained. By substituting the calculation expressions for the thermal conductivities (15), (19), and (23) into Equations (9)–(11), the equivalent thermal resistances for A, B, and C can be determined. Substituting these results into Equation (7), we can obtain the equivalent TC of the cubic heat conduction unit.
λ E SPAM = λ 1 SPAM + λ 2 SPAM + λ 3 SPAM λ 4 SPAM · λ 5 SPAM .
Equation (24) represents the final equivalent TC of the cubic heat conduction unit, which consists of five thermal conduction parameters. The calculation expression for the first thermal conduction parameter is
λ 1 SPAM = λ 11 SPAM Ψ 4 + λ 12 SPAM Ψ 3 + λ 13 SPAM Ψ 4 + λ 14 SPAM Ψ 2 ,
where
λ A 11 SPAM = L 3 λ 1 λ 2 λ 1 λ 3 λ 1 λ 4 ,
λ 12 SPAM = δ L 2 λ 1 λ 2 λ 1 λ 3 λ 4 ,
λ 13 SPAM = δ L 2 λ 1 λ 1 λ 2 λ 1 λ 4 ,
λ 14 SPAM = 2 δ 2 L λ 1 λ 1 λ 2 λ 4 .
The calculation expression for the second thermal conduction parameter is
λ 2 SPAM = λ 21 SPAM Ψ 4 + λ 22 SPAM Ψ 3 ,
where
λ 21 SPAM = δ L 2 λ 1 λ 3 λ 2 λ 1 λ 4 ,
λ 22 SPAM = δ 2 L λ 1 λ 3 λ 2 λ 4 .
The calculation expression for the third thermal conduction parameter is
λ 3 SPAM = λ 31 SPAM Ψ 4 + λ 32 SPAM ,
where
λ 31 SPAM = 2 δ 2 L λ 1 λ 1 λ 4 λ 2 ,
λ 32 SPAM = 3 δ 3 λ 1 λ 2 λ 4 .
The calculation expression for the fourth TC parameter is
λ 4 SPAM = λ 41 SPAM Ψ 2 + λ 42 SPAM ,
where
λ A 41 SPAM = L λ 1 λ 2 ,
λ 42 SPAM = δ λ 2 .
The calculation expression for the fifth TC parameter is
λ 5 SPAM = λ 51 SPAM Ψ 4 + λ 52 SPAM ,
where
λ 51 SPAM = L 2 λ 1 λ 4 ,
λ 52 SPAM = δ L λ 4 .

2.4. Numerical Simulation

2.4.1. Finite Element (FE) Heat Conduction Theory

According to the basic assumptions, the four component materials in the GCIM are uniformly and randomly distributed. The heat conduction is a steady-state heat transfer problem; therefore, the temperature at each point in the heat conduction model does not vary with time (i.e., T t = 0 ). According to Fourier’s law of heat conduction, the calculation expression for the steady-state temperature field heat conduction is
x λ x T x + y λ y T y + z λ z T z + ρ Q = 0 ,
where ρ is the density of the material. λ x , λ y , and λ z are the TC coefficients of the material in the x, y, z directions, respectively. Q is the heat source density inside the material.
According to Equation (42), in the steady-state heat conduction analysis process, the heat conduction model system does not consider the losses caused by thermal radiation [35], resulting in the expression of the relationship between heat flux density and TC.
q x = λ x T x , q y = λ y T y , q z = λ z T z ,
where T is temperature, q is the heat flux density vector, and λ is the TC.
According to Equation (43), the TC of the heat conduction element can be expressed as
λ = q a v g L Δ T ,
where λ is the equivalent TC of the heat conduction element, Δ T is the temperature difference between the two boundaries of the heat conduction element (i.e., T h T c ), and q a v g is the average heat flux density of the heat conduction element.

2.4.2. Establishment of a 3D Numerical Model

SOLID70 is an 8-node three-dimensional heat conduction element that can simulate heat conduction in the x, y, and z directions, achieve uniform heat transfer, and is applicable for steady-state heat conduction analysis of the GCIM. The accurate establishment of the FE model directly determines the correctness of the numerical simulation results. Based on fundamental assumptions, a cubic unit cell three-dimensional geometric model of the GCIM is established for FE simulation calculations, as shown in Figure 7.
In the cubic geometric model of Figure 7, with a side length L = 1 , the solid cube is divided into a mesh using SOLID70 elements, with each edge segmented into 30 sections. The cubic geometric element is subdivided into 27,000 elements and numbered sequentially. Based on the VRs of the four materials in Table 1, the number of elements for each material is determined. A Python random model algorithm is used to assign material properties to mesh elements in sequence for the four materials, following the specific material assignment process shown in Figure 8.
According to the material assignment algorithm in Figure 8, material VR models for three modes have been established, i.e., the GPP-cement VR model ( Ψ 1 Ψ 2 ), the GPP-GM VR model ( Ψ 1 Ψ 3 ), and the GPP-SF VR model ( Ψ 1 Ψ 4 ). For the three mode models, based on different material VRs, 20 sets of FE models with different material VRs are established for each mode. The typical representative models for each mode are shown in Figure 9, Figure 10, and Figure 11, respectively.
The boundary conditions of the thermal FE model are set as shown in Figure 12, with heat being transferred in the x-direction. The temperature at the inlet boundary is T i , and at the outlet boundary, it is T o . The remaining four faces are adiabatic boundaries. In order to facilitate the calculation of the material’s TC, the temperatures at the inlet and outlet are set such that T i = T o . The FE analysis adopts a steady-state analysis, using a direct sparse solver. During the calculation, the convergence of the analysis is automatically checked based on temperature and heat flux density, ultimately obtaining the steady-state results. Through FE analysis, the heat flux density at each node in the computational model is obtained. Subsequently, the average heat flux density of the model is calculated, and by utilizing Equation (44), the TC of the model can be determined. Furthermore, the FE results were compared with theoretical and test results.

3. Results and Discussion

3.1. Thermal Calculation Results and Analysis

Figure 13, Figure 14 and Figure 15 show the numerical analysis results of the heat flux density contour maps in the x-direction for three typical model modes. The numerical simulations analyzed the thermal performance of the heat-conducting units within a range of VRs from 39.00 to 1.00. The typical models reflect the variation of heat flux density values of insulating materials with the VR of GPPs.
Figure 13 shows the thermal analysis results of the model with GPP-cement VRs. The results indicate that within the specified range of VRs, the VR significantly affects thermal performance, with the average heat flux density rapidly increasing as the VR decreases.
Figure 14 presents the thermal analysis results of the model with GPP-GM VRs. Within the specified range of VRs, the VR has a minor impact on thermal performance.
Figure 15 displays the thermal analysis results of the model with GPP-SF VRs. Within the specified range of VRs, the VR affects the TC, with the impact being smaller than that of the previous VR.
Through numerical simulation of the randomly distributed GCIM, the results of the thermal analysis were obtained. By extracting the thermal flux density values of 27,000 units, the average heat flux density of the heat conduction units was obtained. Furthermore, based on Equation (44), the average TC of the heat conduction units could be calculated. The thermal analysis results of the typical FE models for the three modes are shown in Table 2, Table 3 and Table 4.
The results from Table 2, Table 3 and Table 4 demonstrate that in the three models, the VR of GPPs exhibits a consistent trend in its impact on the TC of the GCIM. With an increase in the VR of GPPs, the average heat flux density of the thermal units gradually decreases, leading to a gradual reduction in the TC of the GCIM, resulting in an enhancement of the insulation performance. Within the specified range of VR variations, the VR has the greatest influence on the GPP-cement VR model and the least influence on the GPP-GM VR model.
The variation in VR tends to stabilize in the later stage. Therefore, typical models with four later-stage VRs are selected. The FE results of the typical models in the three modes are compared with the theoretical calculations, as shown in Table 5, Table 6 and Table 7.
The results in Table 5, Table 6 and Table 7 indicate that the SPAM has higher computational accuracy compared to the traditional series model. Furthermore, the error of the theoretical calculation model is obtained by comparing it with the FE results, as shown in Table 8, Table 9 and Table 10. The results demonstrate that the error of SPAM is significantly reduced compared to the series model.

3.2. Variation Pattern of TC

The VRs of the four material components in the GCIM directly affect their TC calculation results. A total of 60 theoretical analyses and numerical simulations were conducted on three models. The calculation results of SPAM are compared with the results of the traditional series model, FE model, and sample test [31,32,33]. The influence of material VR on the TC of the three models is obtained, as shown in Figure 16, Figure 17 and Figure 18.
The results of Figure 16, Figure 17 and Figure 18 indicate that theoretical analysis and numerical simulation exhibit similar trends. With the increase in the VR of GPPs, the TC of the GCIM gradually decreases, thereby improving the insulating performance of the GCIM. This is because, in the GCIM, GPPs act as fillers and can adjust the TC coefficient. As the VR of GPPs continues to increase, the TC coefficient of the GCIM will be significantly affected, leading to a decrease in TC. The TC variation pattern in Figure 16 demonstrates that within a certain range of VR changes, the TC of the GCIM is more sensitive to the VR Ψ 1 Ψ 2 . As Ψ 1 Ψ 2 increases, the TC of the GCIM decreases rapidly in the initial stage and then stabilizes, with a critical point at Ψ 1 Ψ 2 = 5 . The TC trend in Figure 17 shows that within a certain range of VR changes, the impact of Ψ 1 Ψ 3 on the TC of the GCIM is relatively small, with the TC stabilizing between 0.04∼0.05 W/m·K. The TC pattern in Figure 18 reveals that within a certain range of VR changes, the influence of the VR of GPPs on the TC of the GPP-SF VR model and the GPP-cement VR model is similar. However, the sensitivity of the TC of the GCIM to the VR Ψ 1 Ψ 4 is lower than that of Ψ 1 Ψ 2 . The reason for this phenomenon is primarily attributed to the larger volume change range of Ψ 1 Ψ 2 , which directly leads to an increase in the GPPs. Therefore, the impact range of the VR change of Ψ 1 Ψ 2 is more extensive.

4. Conclusions

In this paper, a SPAM of the GCIM was established, and its theoretical calculation expression was derived. By establishing a FE model of the GCIM, the feasibility of predicting the TC using the theoretical calculation model was verified through numerical analysis. The main achievements are
  • Based on series and parallel models, a SPAM of the GCIM was established. The theoretical calculation expression of its TC was derived, and verification analysis was conducted through numerical simulation.
  • A 3D FE model of the GCIM was established, and through numerical simulation, the variation pattern of the TC of insulation materials with the VR of GPPs in the three models was obtained. The results of the numerical simulation indicate that within the specified range of VR variations, the value of Ψ 1 Ψ 2 has the greatest impact on the thermal performance of the insulation material, followed by the impact of Ψ 1 Ψ 4 , while the impact of Ψ 1 Ψ 3 is the smallest.
  • Through a comparative analysis of theoretical and numerical simulation results, the impact pattern of the VR of GPPs on the thermal performance of the GCIM was obtained. For both the GPP-cement VR model and the GPP-SF VR model, the TC of the GCIM decreases rapidly in the initial stage and stabilizes later, with a critical point at Ψ 1 Ψ 2 = Ψ 1 Ψ 4 = 5 .
This paper proposes a SPAM that can be used to predict the TC of the GCIM. Via numerical simulations, the TC patterns of the GCIM were investigated. The research findings carry significant theoretical and practical value. However, there are certain limitations in the basic model assumptions, including the one-dimensional heat transfer model and the material random distribution algorithm. These limitations can lead to errors due to the neglect of the effects of thermal radiation and convective heat transfer, as well as the incompleteness of randomness. Subsequent research can further refine the data and methods by considering the introduction of more influencing factors and more complex models for analysis.

Author Contributions

Conceptualization, T.Z. and R.W.; methodology, R.W. and Z.Z.; software, Q.Y. and F.Z.; validation, R.W., Q.Y. and Z.Z.; formal analysis, Z.Z. and F.Z.; investigation, K.Z., J.X. and Z.Z.; resources, T.Z. and R.W.; data curation, K.Z. and J.X.; writing—original draft preparation, T.Z. and R.W.; writing—review and editing, Z.Z. and T.Z.; visualization, K.Z.; supervision, J.X.; project administration, T.Z.; funding acquisition, R.W. and T.Z. All authors have read and agreed to the published version of the manuscript.

Funding

This research was supported by the Zhejiang Provincial Department of Housing and Urban Rural Development Science and Technology Project—Weitang Subdistrict Shanhe Garden Phase IV (Awards No. 2023K038) and the Jiangxi Provincial Natural Science Foundation (Awards No. 20224BAB214072).

Data Availability Statement

The data of this study are available from the corresponding author upon request.

Conflicts of Interest

Authors Ruhua Wang, Qianbin Yuan, Ze Zhang, Fei Zhang, Kecheng Zhao and Jian Xu were employed by the company Zhejiang Provincial Erjian Construction Group Ltd. The remaining author declares that the research was conducted in the absence of any commercial or financial relationships that could be construed as a potential conflict of interest.

References

  1. Li, F.; Song, Z.; Liu, W. China’s energy consumption under the global economic crisis: Decomposition and sectoral analysis. Energy Policy 2014, 64, 193–202. [Google Scholar] [CrossRef]
  2. Bilgen, S. Structure and environmental impact of global energy consumption. Renew. Sustain. Energy Rev. 2014, 38, 890–902. [Google Scholar] [CrossRef]
  3. Zhao, T.; Ahmad, S.F.; Agrawal, M.K.; Ahmad, A.Y.A.B.; Ghfar, A.A.; Valsalan, P.; Shah, N.A.; Gao, X. Design and thermo-enviro-economic analyses of a novel thermal design process for a CCHP-desalination application using LNG regasification integrated with a gas turbine power plant. Energy 2024, 295, 131003. [Google Scholar] [CrossRef]
  4. Lee, W.J.; Joung, B.G.; Sutherland, J.W. Environmental and economic performance of different maintenance strategies for a product subject to efficiency erosion. J. Clean. Prod. 2023, 389, 135340. [Google Scholar] [CrossRef]
  5. Soliman, M.N.; Guen, F.Z.; Ahmed, S.A.; Saleem, H.; Khalil, M.J.; Zaidi, S.J. Energy consumption and environmental impact assessment of desalination plants and brine disposal strategies. Process. Saf. Environ. Prot. 2021, 147, 589–608. [Google Scholar] [CrossRef]
  6. Chen, J.; Feng, S. Evaluating a large geothermal absorber’s energy extraction and storage performance in a common geological condition. Appl. Energy 2020, 279, 115793. [Google Scholar] [CrossRef]
  7. Salam, R.A.; Amber, K.P.; Ratyal, N.I.; Alam, M.; Akram, N.; Gomez Munoz, C.Q.; Garcia Marquez, F.P. An overview on energy and development of energy integration in major South Asian countries: The building sector. Energies 2020, 13, 5776. [Google Scholar] [CrossRef]
  8. Ibn-Mohammed, T.; Greenough, R.; Taylor, S.; Ozawa-Meida, L.; Acquaye, A. Operational vs. embodied emissions in buildings—A review of current trends. Energy Build. 2013, 66, 232–245. [Google Scholar] [CrossRef]
  9. Nejat, P.; Jomehzadeh, F.; Taheri, M.M.; Gohari, M.; Majid, M.Z.A. A global review of energy consumption, CO2 emissions and policy in the residential sector (with an overview of the top ten CO2 emitting countries). Renew. Sustain. Energy Rev. 2015, 43, 843–862. [Google Scholar] [CrossRef]
  10. Robert, A.; Kummert, M. Designing net-zero energy buildings for the future climate, not for the past. Build. Environ. 2012, 55, 150–158. [Google Scholar] [CrossRef]
  11. Huaman, R.N.E.; Jun, T.X. Energy related CO2 emissions and the progress on CCS projects: A review. Renew. Sustain. Energy Rev. 2014, 31, 368–385. [Google Scholar] [CrossRef]
  12. De Cristo, E.; Evangelisti, L.; Guattari, C.; De Lieto Vollaro, R. An Experimental Direct Model for the Sky Temperature Evaluation in the Mediterranean Area: A Preliminary Investigation. Energies 2024, 17, 2228. [Google Scholar] [CrossRef]
  13. Chen, L.; Zheng, Y.; Yu, J.; Peng, Y.; Li, R.; Han, S. A GIS-Based Approach for Urban Building Energy Modeling Under Climate Change with High Spatial and Temporal Resolution. Energies 2024, 17, 4313. [Google Scholar] [CrossRef]
  14. Koivula, M.; Kymäläinen, H.R.; Virta, J.; Hakkarainen, H.; Hussein, T.; Komulainen, J.; Koponen, H.; Hautala, M.; Hämeri, K.; Kanerva, P.; et al. Emissions from thermal insulations—Part 2: Evaluation of emissions from organic and inorganic insulations. Build. Environ. 2005, 40, 803–814. [Google Scholar] [CrossRef]
  15. Shrestha, S.S.; Tiwari, J.; Rai, A.; Hun, D.E.; Howard, D.; Desjarlais, A.O.; Francoeur, M.; Feng, T. Solid and gas thermal conductivity models improvement and validation in various porous insulation materials. Int. J. Therm. Sci. 2023, 187, 108164. [Google Scholar] [CrossRef]
  16. Wang, Y.; Zhang, S.; Wang, D.; Liu, Y. Experimental study on the influence of temperature and humidity on the thermal conductivity of building insulation materials. Energy Built Environ. 2023, 4, 386–398. [Google Scholar] [CrossRef]
  17. Tariku, F.; Shang, Y.; Molleti, S. Thermal performance of flat roof insulation materials: A review of temperature, moisture and aging effects. J. Build. Eng. 2023, 76, 107142. [Google Scholar] [CrossRef]
  18. Pan, D.; Yan, S.; Liu, X.; Sun, X.; Wu, Y.; Wang, X.; Dan, J.; Yang, X.; Wang, J. Development of solid waste-based self-insulating material with high strength and low thermal conductivity. Ceram. Int. 2023, 49, 5239–5248. [Google Scholar] [CrossRef]
  19. Tan, Y.; Chen, W.; Fang, Y.; Cheng, M.; Wang, S. Investigation of novel expandable polystyrene/alumina aerogel composite thermal insulation material. Energy 2023, 284, 129238. [Google Scholar] [CrossRef]
  20. Ajabli, H.; Zoubir, A.; Elotmani, R.; Louzazni, M.; Kandoussi, K.; Daya, A. Review on Eco-friendly insulation material used for indoor comfort in building. Renew. Sustain. Energy Rev. 2023, 185, 113609. [Google Scholar] [CrossRef]
  21. Özçelikci, E.; Oskay, A.; Bayer, İ.R.; Şahmaran, M. Eco-hybrid cement-based building insulation materials as a circular economy solution to construction and demolition waste. Cem. Concr. Compos. 2023, 141, 105149. [Google Scholar] [CrossRef]
  22. Cosentino, L.; Fernandes, J.; Mateus, R. A review of natural bio-based insulation materials. Energies 2023, 16, 4676. [Google Scholar] [CrossRef]
  23. Zhou, Y.; Trabelsi, A.; El Mankibi, M. Hygrothermal properties of insulation materials from rice straw and natural binders for buildings. Constr. Build. Mater. 2023, 372, 130770. [Google Scholar] [CrossRef]
  24. Majumder, A.; Achenza, M.; Mastino, C.C.; Baccoli, R.; Frattolillo, A. Thermo-acoustic building insulation materials fabricated with recycled fibers—Jute, Wool and Loofah. Energy Build. 2023, 293, 113211. [Google Scholar] [CrossRef]
  25. Hasanzadeh, R.; Azdast, T.; Lee, P.C.; Park, C.B. A review of the state-of-the-art on thermal insulation performance of polymeric foams. Therm. Sci. Eng. Prog. 2023, 41, 101808. [Google Scholar] [CrossRef]
  26. Liu, Y.; Zheng, W.; Ai, H.; Cheng, L.; Guo, R.; Song, X. Predicting the thermal conductivity of polymer composites with one-dimensional oriented fillers using the combination of deep learning and ensemble learning. Energy AI 2024, 18, 100445. [Google Scholar] [CrossRef]
  27. Zha, J.W.; Wang, F.; Wan, B. Polymer composites with high thermal conductivity: Theory, simulation, structure and interfacial regulation. Prog. Mater. Sci. 2024, 148, 101362. [Google Scholar] [CrossRef]
  28. Lou, F.; Dong, S.; Zhu, K.; Chen, X.; Ma, Y. Thermal insulation performance of aerogel nano-porous materials: Characterization and test methods. Gels 2023, 9, 220. [Google Scholar] [CrossRef]
  29. Wang, S.; Li, H.; Liu, L. Development of a multifunctional bio-based insulation material with corncob and silica aerogel. Energy Build. 2024, 323, 114817. [Google Scholar] [CrossRef]
  30. Dong, Y.; Kong, J.; Mousavi, S.; Rismanchi, B.; Yap, P.S. Wall insulation materials in different climate zones: A review on challenges and opportunities of available alternatives. Thermo 2023, 3, 38–65. [Google Scholar] [CrossRef]
  31. Zhao, T.; Wang, X.; Liu, G.; Zhu, J.; Yin, S. The thermal conductivity of graphite composite insulation boards: A theoretical and experimental study. Compos. Sci. Technol. 2024, 256, 110760. [Google Scholar] [CrossRef]
  32. Zhao, T.; Wang, X.; Yin, S. Comprehensive average model for determining the effective thermal conductivity of graphite composite insulation boards: Experimental validation and numerical simulation verification. J. Build. Eng. 2024, 95, 110217. [Google Scholar] [CrossRef]
  33. Liu, G.; Guo, Y.; Jian, Z.; Huang, M.; Zhao, T. Experimental Study on the Thermal Conductivity of Improved Graphite Composite Insulation Boards. Crystals 2023, 13, 102. [Google Scholar] [CrossRef]
  34. Bergman, T.L. Fundamentals of Heat and Mass Transfer; John Wiley & Sons: Hoboken, NJ, USA, 2011. [Google Scholar]
  35. Annapragada, S.R.; Sun, D.; Garimella, S.V. Prediction of effective thermo-mechanical properties of particulate composites. Comput. Mater. Sci. 2007, 40, 255–266. [Google Scholar] [CrossRef]
Figure 1. The research framework.
Buildings 15 00752 g001
Figure 2. The GPPs.
Figure 2. The GPPs.
Buildings 15 00752 g002
Figure 3. The processing workflow of GCIM.
Buildings 15 00752 g003
Figure 4. The combination of SPAM.
Buildings 15 00752 g004
Figure 5. The SPAM.
Figure 5. The SPAM.
Buildings 15 00752 g005
Figure 6. Basic dimensions of the SPAM.
Buildings 15 00752 g006
Figure 7. Geometric model of the GCIM.
Buildings 15 00752 g007
Figure 8. The material assignment algorithm.
Buildings 15 00752 g008
Figure 9. Mode 1 (GPP-cement VR model): (a) Ψ 1 / Ψ 2 = 39.00 ; (b) Ψ 1 / Ψ 2 = 4.00 ; (c) Ψ 1 / Ψ 2 = 1.86 ; (d) Ψ 1 / Ψ 2 = 1.00 .
Buildings 15 00752 g009
Figure 10. Mode 2 (GPP-GM VR model): (a) Ψ 1 / Ψ 2 = 39.00 ; (b) Ψ 1 / Ψ 2 = 4.00 ; (c) Ψ 1 / Ψ 2 = 1.86 ; (d) Ψ 1 / Ψ 2 = 1.00 .
Buildings 15 00752 g010
Figure 11. Mode 3 (GPP-SF VR model): (a) Ψ 1 / Ψ 2 = 39.00 ; (b) Ψ 1 / Ψ 2 = 4.00 ; (c) Ψ 1 / Ψ 2 = 1.86 ; (d) Ψ 1 / Ψ 2 = 1.00 .
Buildings 15 00752 g011
Figure 12. Boundary conditions of the thermal FE model.
Buildings 15 00752 g012
Figure 13. The thermal flux density contourmap ofMode 1 (GPP-cement VRmodel): (a) Ψ 1 / Ψ 2 = 39.00 ; (b) Ψ 1 / Ψ 2 = 4.00 ; (c) Ψ 1 / Ψ 2 = 1.86 ; (d) Ψ 1 / Ψ 2 = 1.00 .
Buildings 15 00752 g013
Figure 14. The thermal flux density contour map of Mode 2 (GPP-GM VR model): (a) Ψ 1 / Ψ 2 = 39.00 ; (b) Ψ 1 / Ψ 2 = 4.00 ; (c) Ψ 1 / Ψ 2 = 1.86 ; (d) Ψ 1 / Ψ 2 = 1.00 .
Buildings 15 00752 g014
Figure 15. The thermal flux density contour map of Mode 3 (GPP-SF VR model): (a) Ψ 1 / Ψ 2 = 39.00 ; (b) Ψ 1 / Ψ 2 = 4.00 ; (c) Ψ 1 / Ψ 2 = 1.86 ; (d) Ψ 1 / Ψ 2 = 1.00 .
Buildings 15 00752 g015
Figure 16. The variation pattern of TC in the GPP-cement VR model.
Buildings 15 00752 g016
Figure 17. The variation pattern of TC in the GPP-GM VR model.
Buildings 15 00752 g017
Figure 18. The variation pattern of TC in the GPP-SF VR model.
Buildings 15 00752 g018
Table 1. TC of the component materials.
ComponentsGPPsCementGMsSF
TC (W/m·K)0.03760.4530.0460.151
VRs Ψ 1 Ψ 2 Ψ 3 Ψ 4
Note: Ψ 1 , Ψ 2 , Ψ 3 and Ψ 4 respectively represent the volume ratios (VRs) of the four component materials.
Table 2. The average heat flux density value and average TC of the GPP-cement VR model.
Group1234
VRs Ψ 1 / Ψ 2 = 39.00 Ψ 1 / Ψ 2 = 4.00 Ψ 1 / Ψ 2 = 1.86 Ψ 1 / Ψ 2 = 1.00
Average heat flux density (W/m2)3.98086.42269.516613.2477
Average TC (W/m·K)0.03980.06420.09520.1325
Table 3. The average heat flux density value and average TC of the GPP-GM VR model.
Group1234
VRs Ψ 1 / Ψ 2 = 39.00 Ψ 1 / Ψ 2 = 4.00 Ψ 1 / Ψ 2 = 1.86 Ψ 1 / Ψ 2 = 1.00
Average heat flux density (W/m2)4.31084.45394.57794.7026
Average TC (W/m·K)0.04310.04450.04580.0470
Table 4. The average heat flux density value and average TC of the GPP-SF VR model.
Group1234
VRs Ψ 1 / Ψ 2 = 39.00 Ψ 1 / Ψ 2 = 4.00 Ψ 1 / Ψ 2 = 1.86 Ψ 1 / Ψ 2 = 1.00
Average heat flux density (W/m2)4.49005.60206.66767.8092
Average TC (W/m·K)0.04490.05600.06670.0781
Table 5. The TC of the GPP-cement VR model (Unit: W/m·K).
Group1234
VRs Ψ 1 / Ψ 2 = 39.00 Ψ 1 / Ψ 2 = 19.00 Ψ 1 / Ψ 2 = 12.33 Ψ 1 / Ψ 2 = 9.00
SPAM0.040930.041630.042410.04332
FE0.039810.042550.045570.04875
Series model0.049240.056510.063780.07105
Table 6. The TC of the GPP-GM VR model (Unit: W/m·K).
Group1234
VRs Ψ 1 / Ψ 2 = 39.00 Ψ 1 / Ψ 2 = 19.00 Ψ 1 / Ψ 2 = 12.33 Ψ 1 / Ψ 2 = 9.00
SPAM0.040410.040570.040780.04098
FE0.043110.043310.043510.04372
Series model0.060830.061030.061220.06142
Table 7. The TC of the GPP-SF VR model (Unit: W/m·K).
Group1234
VRs Ψ 1 / Ψ 2 = 39.00 Ψ 1 / Ψ 2 = 19.00 Ψ 1 / Ψ 2 = 12.33 Ψ 1 / Ψ 2 = 9.00
SPAM0.042170.042810.043370.04408
FE0.044900.046420.047930.04948
Series model0.062450.064440.066420.06841
Table 8. The error of SPAM results relative to FE results in the GPP-cement VR model.
Group1234
VRs Ψ 1 / Ψ 2 = 39.00 Ψ 1 / Ψ 2 = 19.00 Ψ 1 / Ψ 2 = 12.33 Ψ 1 / Ψ 2 = 9.00
SPAM2.8%2.2%6.9%11.1%
Series model23.7%32.8%40.0%45.7%
Table 9. The error of SPAM results relative to FE results in the GPP-GM VR model.
Group1234
VRs Ψ 1 / Ψ 2 = 39.00 Ψ 1 / Ψ 2 = 19.00 Ψ 1 / Ψ 2 = 12.33 Ψ 1 / Ψ 2 = 9.00
SPAM6.3%6.3%6.3%6.3%
Series model41.1%40.9%40.7%40.5%
Table 10. The error of SPAM results relative to FE results in the GPP-SF VR model.
Group1234
VRs Ψ 1 / Ψ 2 = 39.00 Ψ 1 / Ψ 2 = 19.00 Ψ 1 / Ψ 2 = 12.33 Ψ 1 / Ψ 2 = 9.00
SPAM6.1%7.8%9.5%10.9%
Series model39.1%38.8%38.6%38.3%
Disclaimer/Publisher’s Note: The statements, opinions and data contained in all publications are solely those of the individual author(s) and contributor(s) and not of MDPI and/or the editor(s). MDPI and/or the editor(s) disclaim responsibility for any injury to people or property resulting from any ideas, methods, instructions or products referred to in the content.

