Article

Dynamic Behavior and Damage Mechanisms of Concrete Subjected to Freeze–Thaw Cycles

1
School of Civil Engineering and Architecture, Anhui University of Science and Technology, Huainan 232001, China
2
Joint National-Local Engineering Research Centre for Safe and Precise Coal Mining, Anhui University of Science and Technology, Huainan 232001, China
3
School of Architecture and Arts, Huainan Union University, Huainan 232001, China
*
Authors to whom correspondence should be addressed.
Buildings 2025, 15(12), 2009; https://doi.org/10.3390/buildings15122009
Submission received: 29 April 2025 / Revised: 1 June 2025 / Accepted: 9 June 2025 / Published: 11 June 2025
(This article belongs to the Special Issue Advanced Research on Cementitious Composites for Construction)

Abstract

:
To explore how the water–cement ratio affects the mechanical behavior of concrete subjected to freeze–thaw cycles, four sets of concrete samples with water–cement ratios of 0.41, 0.44, 0.47, and 0.50 were prepared for laboratory analysis. These samples underwent varying numbers of freeze–thaw cycles (0, 10, 20, and 30) before being tested using the split Hopkinson pressure bar (SHPB) system for dynamic compression. The experimental data show that the mass of the concrete specimens follows a non-monotonic trend during freeze–thaw cycling, initially rising and then gradually declining. Simultaneously, key dynamic mechanical properties, such as compressive strength and elastic modulus, markedly deteriorate, as evidenced by rightward shifts in the stress–strain curves. Importantly, the extent of degradation differs notably depending on the water–cement ratio. Additional analysis highlights a strong association between the fractal nature of the fracture patterns and the effects of freeze–thaw cycles: under consistent freeze–thaw conditions not only does the fractal dimension consistently increase with the number of cycles, but it also positively correlates with the water–cement ratio.

1. Introduction

In recent years, benefiting from the government’s emphasis on infrastructure, the construction of fundamental transportation facilities such as highways, railways, tunnels, and bridges in China has developed rapidly. These projects require extensive use of concrete structures, including beams and columns. Under normal conditions, these structures exhibit excellent mechanical properties [1,2,3,4]. However, in northern China’s cold regions, concrete structures face prolonged exposure to freeze–thaw cycling environments. The repeated temperature fluctuations between positive and negative ranges significantly degrade the material’s performance and service life. Research indicates that freeze–thaw damage has emerged as a principal cause of premature aging and structural issues in concrete constructions within these cold regions [5,6]. This highlights the significance of investigating the effects of freeze–thaw cycling on the mechanical performance of concrete, as such studies provide critical insights for optimizing the design of durable concrete structures in cold regions.
A substantial body of research has examined the degradation of concrete’s mechanical performance under freeze–thaw cycling [7,8,9,10]. Han et al. [11] systematically evaluated the dynamic mechanical response, observing a strain-rate-dependent reduction in strength with an increasing number of freeze–thaw cycles; Li et al. [12] employed split Hopkinson pressure bar (SHPB) testing to elucidate the damage evolution process in concrete affected by freeze–thaw conditions. Additionally, Shang et al. [13] developed a biaxial compression failure criterion through comprehensive triaxial testing; Zhang et al. [14] quantified the strain-rate sensitivity of freeze–thaw concrete, documenting progressive decreases in the dynamic modulus, compressive strength, and tensile properties with repeated cycling.
Conventional mechanical parameters (e.g., strength, elastic modulus) capture the macroscopic degradation of concrete subjected to freeze–thaw cycles but do not quantify the geometric evolution of its internal damage [15,16,17]. In contrast, the fractal dimension, a robust descriptor of microstructural complexity, offers novel insights into the multiscale damage evolution of concrete under combined freeze–thaw cycles and impact loading. Originally proposed by Mandelbrot [18] in the 1970s, fractal theory addresses disordered, self-similar structures commonly observed in natural systems. Since its inception, the theory has been extensively applied to characterize irregular structures across various disciplines, particularly within materials science, where significant advancements have been made [19,20,21]. Gan et al. [22] investigated the effects of freeze–thaw cycling and cyclic loading on the pore structure of concrete, revealing relationships among the fractal dimension of concrete pores, compressive strength, and elastic modulus; Jin et al. [23] developed a mathematical model linking the fractal dimension to concrete properties. These studies collectively indicate that the fractal dimension is a promising metric for evaluating freeze–thaw damage in concrete.
Given the above background, most current research on concrete’s mechanical performance under freeze–thaw cycles has predominantly focused on a single water–cement ratio. Therefore, this study designed four different concrete mix ratios, taking the freeze–thaw cycle count and water–cement ratio as test parameters. Through dynamic uniaxial compression testing, this study quantitatively evaluated the coupled influence of these factors on concrete’s mechanical performance. The resulting data and analysis provide valuable engineering references for optimizing concrete structure design in cold regions, particularly regarding material selection and durability considerations under freeze–thaw conditions.

2. Materials and Methods

2.1. Materials

The experimental materials consisted of Grade 42.5 ordinary Portland cement, river sand with a maximum silt content of 2%, and crushed stone with particles up to 15 mm. Pure water was utilized in the mixture. Four distinct concrete specimens were prepared, with their mix proportions presented in Table 1, and the relevant test parameters are shown in Table 2.
The cylindrical concrete specimens with a dimension of ∅50 mm × 25 mm (length-to-diameter ratio of 0.5) were prepared for SHPB testing. The specimens were initially cast in cylindrical molds (∅50 mm × 100 mm). To ensure optimal compaction, a layered casting and vibration method was employed, followed by a 24 h curing period at ambient temperature before demolding. Subsequently, the demolded specimens were transferred to a standard curing chamber (20 °C, relative humidity ≥ 95%) for 28 days of moisture curing. Following the curing process, the specimens were precision-cut to the required height of 25 mm using a diamond cutting machine. To meet the stringent flatness specifications, both end surfaces were carefully ground using a precision grinding machine. The surface quality was verified through vernier caliper measurements, confirming that the parallelism and perpendicularity errors were maintained within the acceptable tolerance of 0.05 mm, as illustrated in Figure 1.
The sample numbers was designated in the format of A-a, where A denotes the water–cement ratio parameter, and a indicates the number of freeze–thaw cycles.

2.2. Procedures and Methodologies for Experimental Research

Prior to the freeze–thaw cycling tests, all specimens were immersed in a water tank for 48 h to achieve complete saturation. Following saturation treatment, the specimens were transferred to the freeze–thaw testing apparatus for cyclic experimentation (as illustrated in Figure 2). The testing procedure employed a thermal cycling range between −20 °C and 20 °C, with four predefined freeze–thaw cycle gradients: zero, ten, twenty, and thirty times. Each complete freeze–thaw cycle consisted of a 12 h freezing phase, followed by a 12 h thawing phase, totaling 24 h per cycle. Dynamic impact testing was conducted immediately after specimens reached their designated cycle counts. For specimens subjected to 30 freeze–thaw cycles, mass measurements were systematically recorded at four critical intervals: zero, ten, twenty, and thirty cycles to quantify moisture variation patterns.
The specimens subjected to 0, 10, 20, and 30 freeze–thaw cycles were dynamically compressed using a ∅50 mm split Hopkinson pressure bar (SHPB) apparatus. The experimental setup comprised three main components: a loading transmission unit, an elastic bar assembly, and a strain signal recording system, as illustrated in Figure 3.
The theory of the split Hopkinson pressure bar (SHPB) test is founded on two essential assumptions: (1) the one-dimensional stress wave assumption, which posits that the stress wave propagates through the pressure bar as an ideal one-dimensional elastic wave; (2) the stress uniformity assumption, requiring homogeneous stress–strain distribution across the specimen during loading. Based on the incident strain ε i ( t ) and transmission strain ε r ( t ) measured by the strain gauge on the incident rod, as well as the transmission strain ε t ( t ) measured by the strain gauge on the projection rod, the stress σ ( t ) , strain ε ( t ) and strain rate ε ˙ ( t ) of the concrete specimen during the impact process can be determined. The corresponding calculation formulas are presented as follows [24]:
σ ( t ) = E A A 0 ε t ( t ) ε ( t ) = 2 C l 0 0 t ε r ( t ) d t ε ˙ ( t ) = 2 C l 0 ε r ( t )
where A is the cross-sectional area of the elastic compression bar (mm2); E is the modulus of elasticity (GPa); C is the lunar wave velocity (m/s); A 0 is the cross-sectional area of the concrete specimen (mm2); l 0 is the original length of the concrete specimen (mm).
To satisfy these assumptions, this study implemented several technical measures: a rubber wave shaper was affixed to the end of the incident bar to ensure dynamic stress equilibrium, and Vaseline was uniformly applied to both ends of the concrete specimen to minimize friction effects at its surfaces. As demonstrated in Figure 4, the dynamic stress equilibrium condition was quantitatively verified through waveform analysis. The close agreement between the combined incident-reflected wave profile and the transmitted wave curve provided compelling evidence for the achievement of stress equilibrium across the specimen, thereby confirming the validity of the experimental data. To enhance data reliability and mitigate variability, three parallel impact tests were conducted on specimens under each specified working condition.

3. Experimental Results and Discussion

3.1. Mass Change in Freeze–Thaw Concrete

The mass loss rate is a key indicator for evaluating the freeze–thaw resistance of concrete. A lower mass loss rate signifies superior frost resistance of the material. The formula for calculating the rate of loss of concrete mass is given in Equation (2):
Δ W n = W 0 W n W 0 × 100 %
where Δ W n is the mass loss rate of the specimen following n freeze–thaw cycles; W n represents the mass of the specimen after n freeze–thaw cycles; W 0 indicates the mass of the specimen prior to any freeze–thaw cycles.
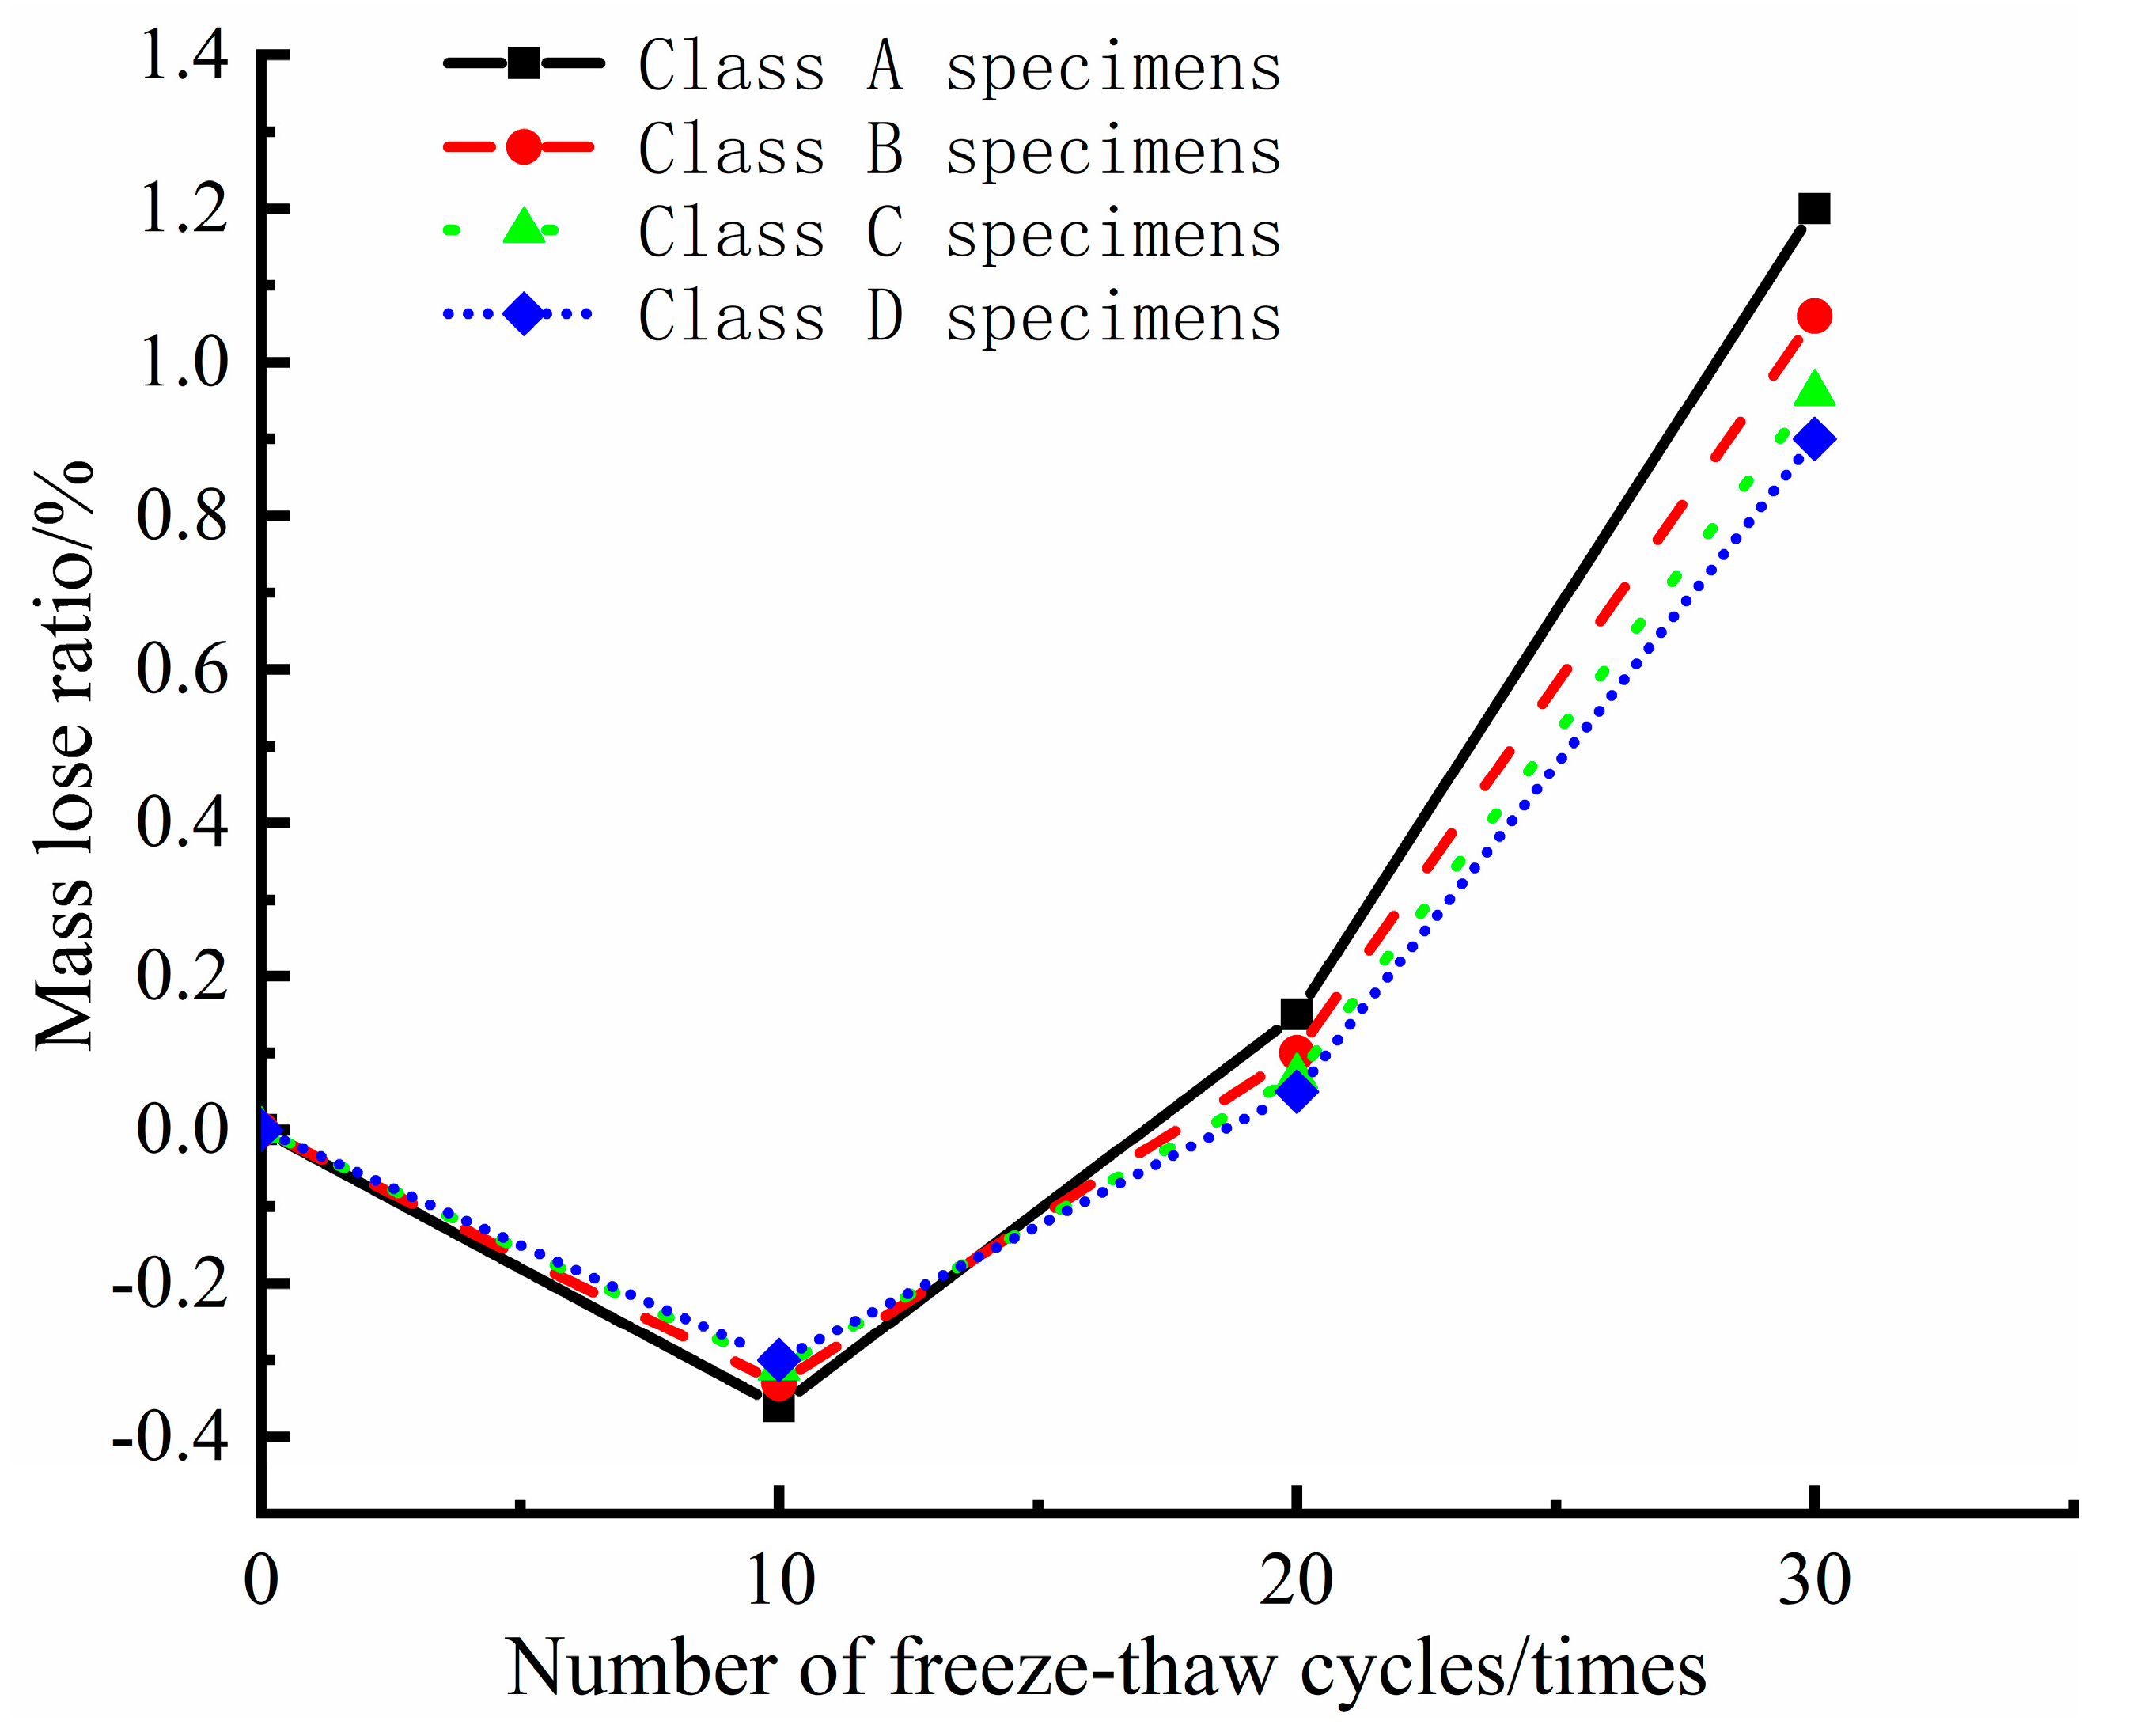
Table 3 systematically presents the mass loss ratios of the specimens subjected to varying freeze–thaw cycles (0, 10, 20 and 30 cycles). Based on the experimental data, Figure 5 reveals the variation in the mass loss rate with the increase in the number of freeze–thaw cycles, and visually presents the cumulative effect of freeze–thaw damage through quantitative curves.
As illustrated in Figure 5, the change in the mass of the concrete specimens exhibits a clear nonlinear relationship with the number of freeze–thaw cycles. In the initial phase (fewer than 10 cycles), Type A specimens experienced an unusual mass gain, resulting in a negative mass loss rate of −0.36%. This effect was primarily attributed to the phase transition of pore water during freezing, which generated expansive stresses that both extended existing microcracks and created new fractures. Upon thawing, external water infiltrated these newly formed cracks, thereby increasing the specimen’s mass. However, after 10 cycles, the detachment of material from the surface outweighed the water absorption effect, leading to an overall mass loss and an accelerated increase in the mass loss rate [25].
Under similar freeze–thaw conditions, the rate of mass loss progressively increased with higher water–cement ratios. After 10 cycles, specimens A, B, C, and D recorded mass loss rates of −0.36%, −0.33%, −0.31%, and −0.30%, respectively. This trend continued through 30 cycles, with the rates climbing to 1.2%, 1.06%, 0.96%, and 0.90%, respectively. This behavior can be attributed to the direct correlation between the water–cement ratio and the initial saturation level; a higher moisture content intensifies crystallization pressures during freezing, thereby amplifying internal damage and resulting in a more significant overall mass reduction over consecutive freeze–thaw cycles.

3.2. Dynamic Stress–Strain Behavior of Concrete After Freeze–Thaw Cycles

Figure 6 illustrates the dynamic uniaxial compressive stress–strain behavior of the concrete specimens subjected to freeze–thaw cycles, as determined through impact testing. The results of this analysis indicate that the stress–strain curves across all freeze–thaw cycles exhibit a characteristic three-stage evolution pattern, which is detailed as follows:
Elastic stage: In this stage, the concrete demonstrates linear elastic behavior characterized by a proportional correlation between stress and strain. In the early stages of the freeze–thaw cycle, the material’s internal architecture remains relatively intact, with the cementitious matrix, aggregate particles, and their interfacial transition zones maintaining effective load-bearing capacity and synergistic interaction.
Elastoplastic stage: As the stress continues to escalate, the concrete begins to enter the elastoplastic stage, during which the stress–strain behavior demonstrates significant nonlinearity. This phenomenon occurs due to the formation of internal micro-fractures and the structural deterioration caused by repeated freeze–thaw cycles. Under applied stress, these microscopic defects progressively propagate, inducing irreversible deformations that combine both elastic and plastic components. Consequently, the material experiences a gradual deterioration in its mechanical properties, particularly manifested through a reduction in structural rigidity.
Failure stage: When the stress approaches the material’s ultimate strength, the concrete undergoes structural failure characterized by a dramatic strain increase accompanied by rapid stress deterioration. This critical behavior results from the synergistic action of cyclic freeze–thaw damage and mechanical loading, which lead to the continuous propagation and coalescence of microcracks within the concrete, ultimately resulting in the formation of macrocracks. Ultimately, the concrete fails and can no longer withstand external forces.

3.3. Degradation Law of Dynamic Compressive Performance of Concrete Under Freeze–Thaw Cycles

The experimental results presented in Figure 6 and Table 4 demonstrate significant freeze–thaw-induced deterioration in the concrete’s dynamic compressive performance. As the number of cycles increases, the material’s dynamic strength steadily declines while its peak strain rises. This trend is evident from the stress–strain curves, which progressively shift downward and to the right, indicating a transition toward a more brittle behavior under cyclic freezing and thawing. The quantitative analysis showed that after 30 freeze–thaw cycles, Type A specimens experienced a 23% drop in dynamic compressive strength, decreasing from 34.75 MPa to 26.74 MPa. This deterioration is mainly attributed to the cyclic phase transitions of the pore water, which impose repeated expansion and contraction stresses on the cementitious matrix. These stresses not only worsen existing microcracks but also trigger the formation of new fracture networks, ultimately undermining the structural integrity and load-bearing capacity of the concrete.
Moreover, Table 4 provides additional details: After 30 cycles, Type A specimens lost 23% of their strength, while Type B specimens decreased from 33.55 MPa to 26.43 MPa (a 21.2% reduction). Similarly, Type C specimens dropped from 33.34 MPa to 26.57 MPa (a 20.3% loss), and Type D specimens fell from 33.87 MPa to 27.23 MPa (a 19.6% loss). These variations were linked to the water–cement ratio; samples with higher ratios experienced greater crystallization pressure and deeper penetration of freezing water, which in turn inflicted more extensive damage during the freeze–thaw process. In summary, the increased water–cement ratio exacerbates strength loss in concrete under repeated freeze–thaw cycles.

3.4. Effect of Freeze–Thaw Cycles on Dynamic Elastic Modulus of Concrete

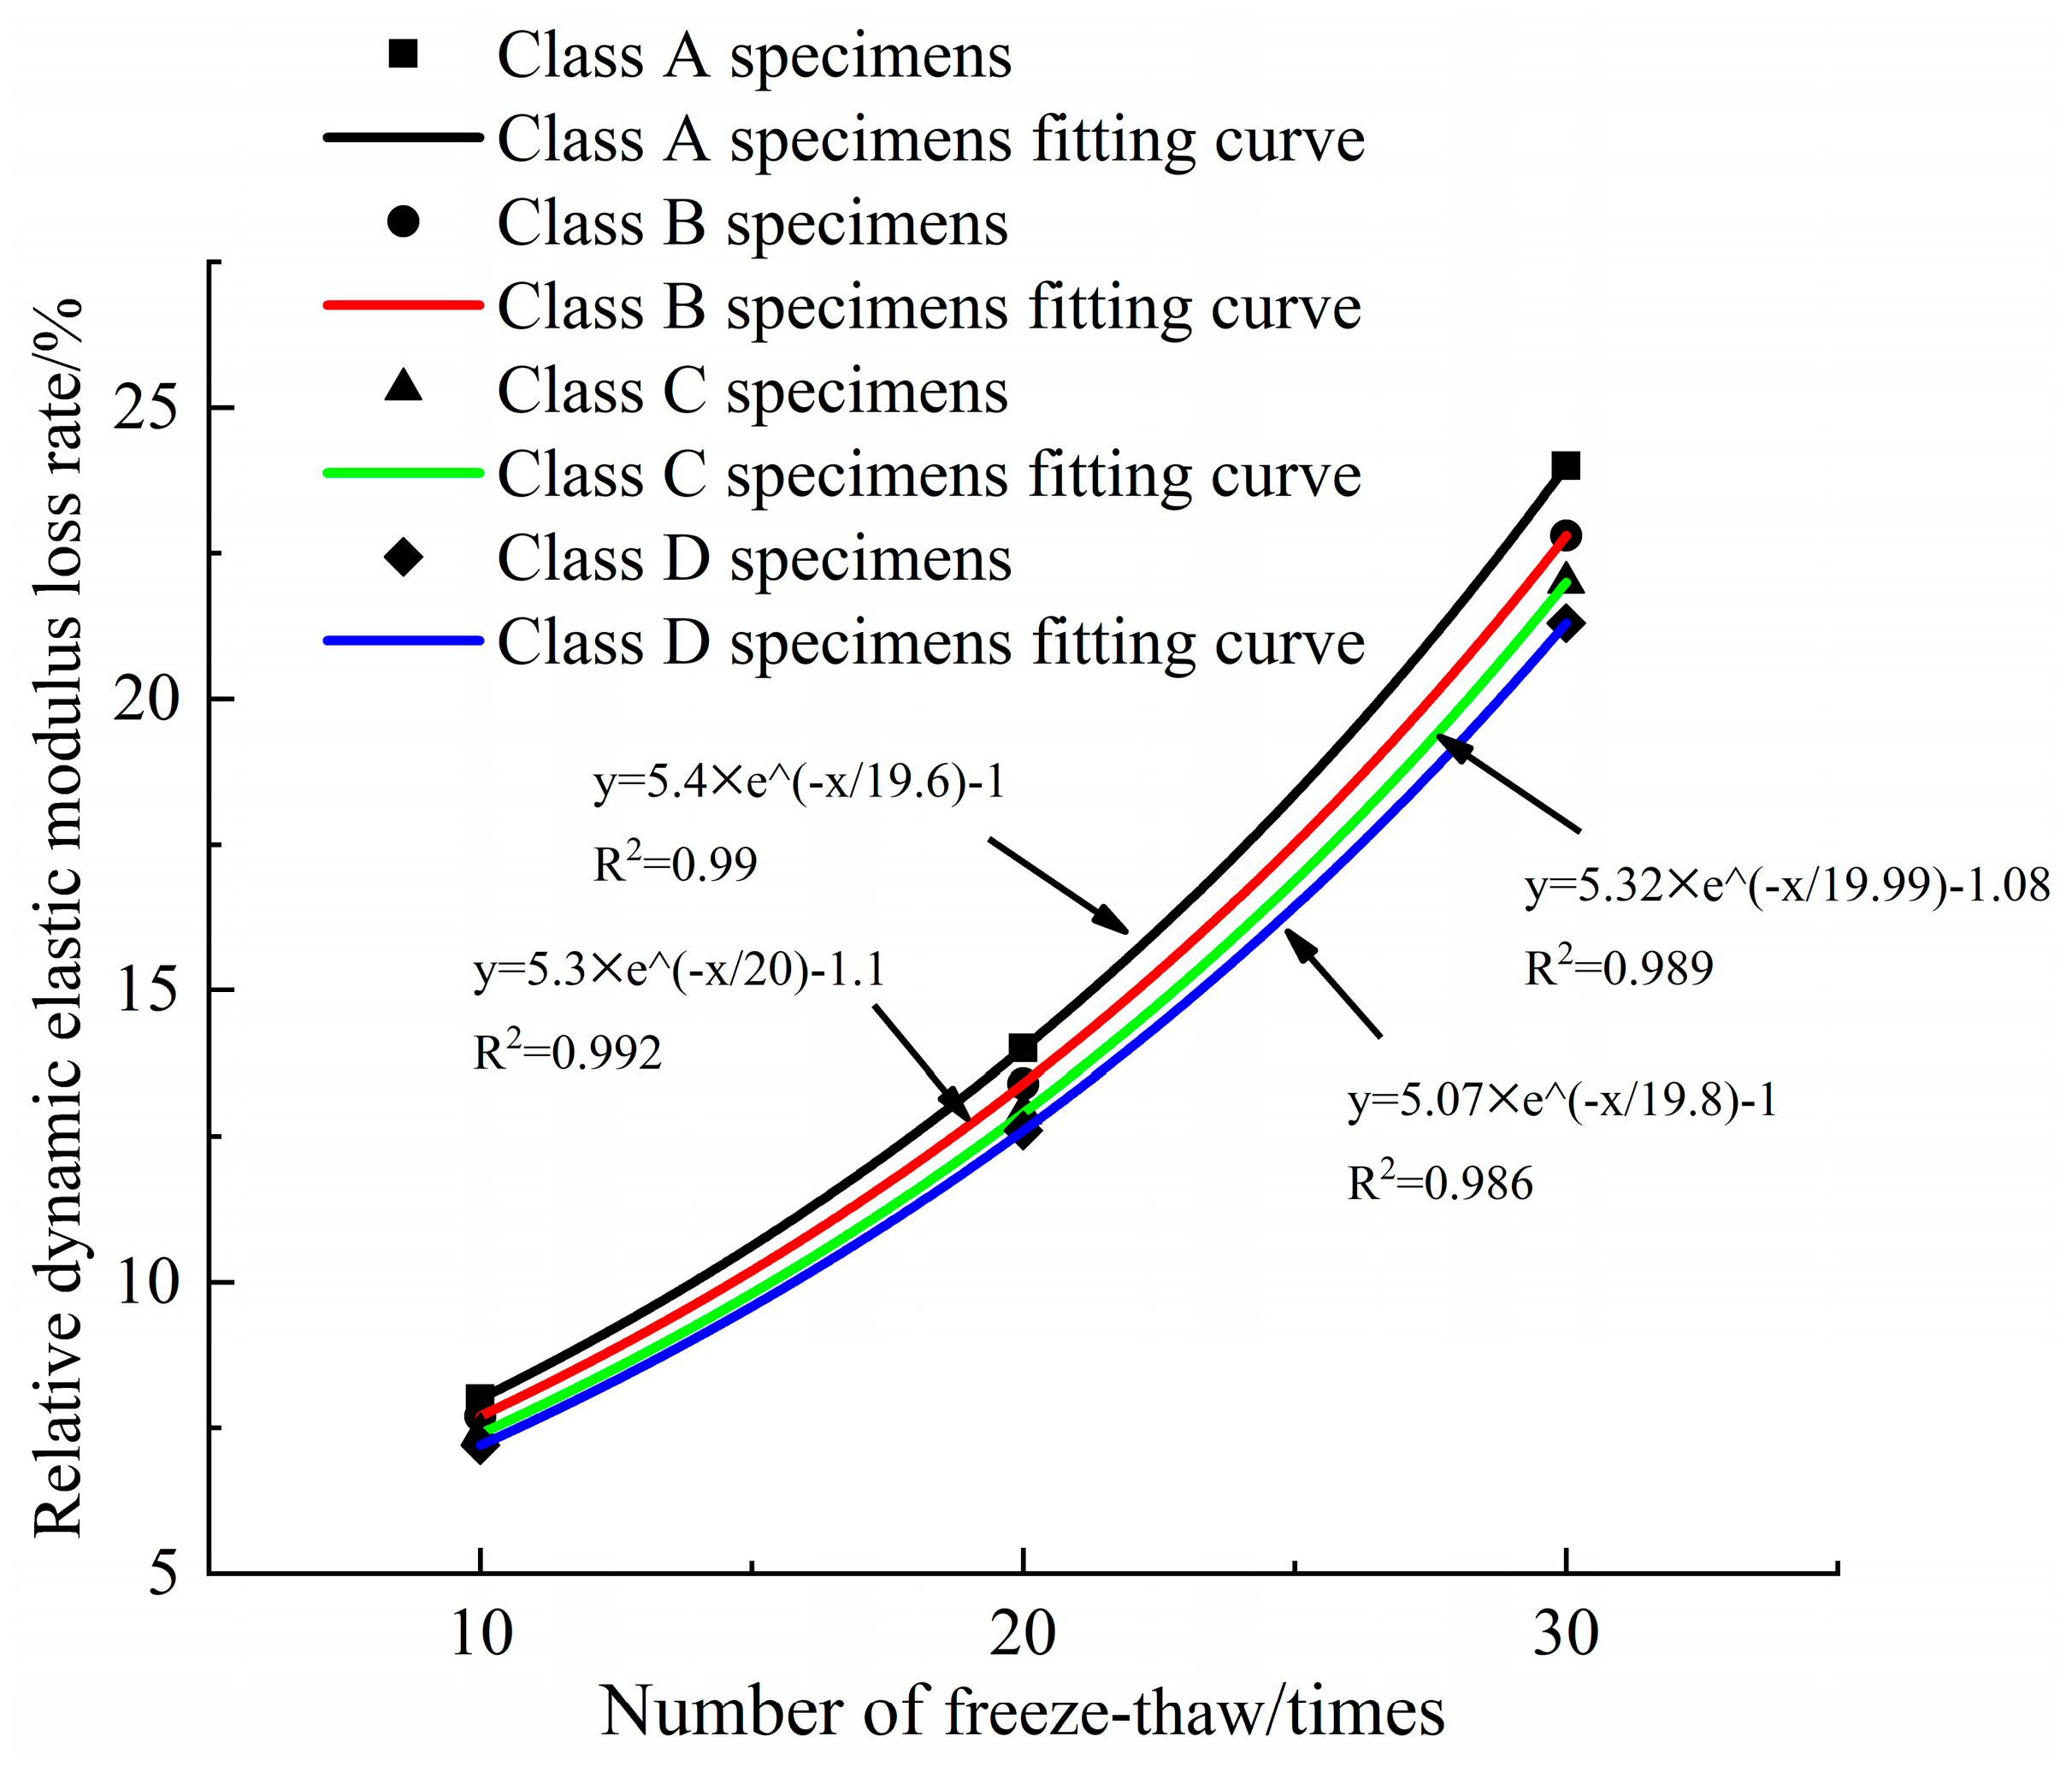
The experimental results demonstrate considerable freeze–thaw-induced deterioration in the concrete’s dynamic elastic modulus. As documented in Table 5, the measured dynamic elastic modulus values exhibit progressive degradation with increasing freeze–thaw cycles, while Table 6 quantifies the corresponding modulus reduction rates. Based on the data in Table 6, the relationship between the relative dynamic elastic modulus and the number of freeze–thaw cycles is illustrated in Figure 7. Both the experimental data points and regression curve distinctly reveal an exponential decay trend in the dynamic elastic modulus as freeze–thaw cycling accumulates.
Figure 7 clearly illustrates that increasing the freeze–thaw cycles corresponds with a gradual decline in mechanical properties, as shown by the steady decrease in the relative dynamic elastic modulus. For example, Type A specimens experienced an 8% reduction in the elastic modulus—from 31.32 GPa to 28.81 GPa—after just 10 cycles, which further dropped by 24% to 26.62 GPa after 30 cycles. This decline was mainly driven by crystallization pressures from water transitioning to ice, which triggered the formation of microcracks and extended existing fractures. Over successive cycles, these micro-defects merged, leading to discontinuities in the structure and a reduced capacity to bear loads.
Additionally, the water–cement ratio played a significant role in the degree of damage under the same cyclic conditions. After 30 freeze–thaw cycles, the loss in elastic modulus was 24% for Class A samples, 22.8% for Class B, 22% for Class C, and 21.3% for Class D. A higher water–cement ratio results in more moisture during mixing, which in turn develops a more extensive pore structure after the concrete cures. This increased porosity not only facilitates the growth of ice crystals but also amplifies the transmission of freeze–thaw stresses, thereby accelerating microstructural damage. Ultimately, these combined effects lead to a marked deterioration in mechanical properties, such as the elastic modulus.

4. Fractal Characteristics of Concrete Fracture

4.1. Analysis of Specimen Fracture Morphology

The fracture morphology of the concrete samples exhibited variation under different freeze–thaw cycle durations. In Figure 8, the failure morphology diagrams of the concrete under varying freeze–thaw cycles are presented. It can be observed that after 0 freeze–thaw cycles, the crushed fragments predominantly consisted of large-sized pieces, indicating incomplete destruction. Following the 30th freeze–thaw cycle, there was a significant increase in the number of fragments, with a corresponding decrease in particle size and a more pronounced degree of damage. This phenomenon arose due to the progressive intensification of damage to the test specimens as the number of freeze–thaw cycles increased, leading to a weakened resistance to external forces and an increased susceptibility to damage.

4.2. Analysis of Concrete Fragmentation Size

We collected the broken concrete fragments and used standard sieves with aperture diameters of 1 mm, 2.5 mm, 5 mm, 10 mm, and 15 mm to sieve the broken samples. The broken concrete fragments were classified into 0–1 mm, 1–2.5 mm, 2.5–5 mm, 5–10 mm, 10–15 mm, and greater than 15 mm. Due to the limitation of space, the results of some sieved concrete fragments are illustrated in Figure 9.

4.3. Calculation and Analysis of Fractal Dimension

The macroscopic failure of concrete arises from the accumulation of numerous small fractures, which in turn develop from even smaller cracks. This self-similar behavior inevitably results in a self-similar distribution of the fractured fragments. Consequently, it was essential to investigate the fractal properties of concrete specimens subjected to freeze–thaw cycles to analyze the inter-relationship among the water–cement ratio, the number of freeze–thaw cycles, and the extent of damage.
The size equation for concrete fragments is
x m = x i d i d i
where x i denotes the mean particle size of the debris on each screen layer, while d i represents the percentage of fragment mass corresponding to x i .
The fractal dimension is utilized to provide a more detailed description of the fragment distribution. The equation for the fragment distribution of the concrete sample is as follows:
lg [ M ( x ) / M ] = ( 3 E ) lg ( x / x m )
where E is the fractal dimension of the block size; M ( x ) and M represent the cumulative mass under each sieve and the total mass of the crushed particles, respectively; x and x m denote the particle size and the maximum particle size of the fragments, respectively.
In the double-logarithmic coordinate system defined by log [ M ( x ) / M ] / log ( x / x m ) , the logarithmic data points are fitted, and the slope of the resulting fitted line is determined to be K = 3 E , Subsequently, the fractal dimension calculation formula for the block size after fragmentation can be expressed as follows:
E = 3 K
The calculated curve illustrating the fractal dimensions of the concrete specimen block distribution is presented in Figure 10. From the characteristics of this fitted straight line, it can be concluded that the distribution of broken blocks resulting from concrete impact adheres to fractal law. The fractal dimensions corresponding to each specimen’s fragmentation, derived using Equations (3) to (5), are summarized in Table 7.
The analysis of Table 7 reveals two distinct trends in the fractal characteristics of the fractured concrete specimens. First, a positive correlation exists between freeze–thaw cycling and fractal dimension values, with increasing cycles producing more complex fracture patterns. For Type D specimens, the fractal dimension rose from 1.925 to 2.148 following freeze–thaw exposure, quantitatively demonstrating enhanced fragmentation.
Second, under equivalent cycling conditions, specimens with higher water–cement ratios consistently exhibited greater fractal dimensions. After 30 freeze–thaw cycles, the fractal dimensions were measured as follows: sample A at 2.225, sample B at 2.208, sample C at 2.188, and sample D at 2.162.

5. Conclusions

1. Water-saturated concrete specimens demonstrated a nonlinear mass change: an initial increase during the first 0–10 freeze–thaw cycles, followed by a decrease from 10 to 30 cycles. This behavior suggested a shift in the damage mechanism from the development of internal microcracks to the onset of macroscopic spalling.
2. Repeated freeze–thaw cycles progressively degraded the concrete’s mechanical properties, as evidenced by reductions in both the compressive strength and elastic modulus, while the peak strain increased, and the stress–strain curve shifted downward and to the right. Notably, when the number of freeze–thaw cycles was held constant, a higher water–cement ratio correlated with a more rapid decrease in strength, highlighting the crucial role of the water–cement ratio in determining frost resistance.
3. Both the freeze–thaw cycles and water–cement ratio were observed to affect the fractal dimension of the fractured specimens, with the fractal dimension rising consistently as the number of cycles increased—indicating a positive relationship with damage severity. Under identical freeze–thaw conditions, specimens with higher water–cement ratios consistently exhibited larger fractal dimensions. These findings offer quantitative support for employing fractal theory in assessing freeze–thaw damage in concrete.
4. This experiment focused exclusively on investigating the influence of the water–cement ratio on the mechanical properties of concrete. However, numerous other factors also play significant roles in determining the mechanical performance of concrete, such as the type and dosage of admixtures. Future research will be conducted by the authors to further explore these aspects.

Author Contributions

Writing—original draft preparation, H.Z. and J.X.; conceptualization, J.Z. and Y.C.; software, H.Z. and J.X.; supervision, J.Z. and W.H. All authors have read and agreed to the published version of the manuscript.

Funding

This project was supported by Open Research Grant of Joint National-Local Engineering Research Centre for Safe and Precise Coal Mining (grant No. EC2024026); the Open Research Fund of State Key Laboratory of Geomechanics and Geotechnical Engineering Safety, Institute of Rock and Soil Mechanics, Chinese Academy of Sciences, grant No. SKLGGES-024038; the Academic Sponsorship Program for Top-notch Talents in Disciplines of Anhui Provincial Universities (Project No.: gxbj2022111); and the Key Science Research Sponsorship Program of the Anhui Provincial Department of Education (project No. 2022AH052930).

Data Availability Statement

The original contributions presented in this study are incorporated within this article. For any further inquiries, please direct your questions to the corresponding author.

Conflicts of Interest

The authors declare no conflicts of interest.

References

  1. Zhang, Y.; Zhu, Y.; Hussein, H.H.; Chen, G. Flexural strengthening of reinforced concrete beams or slabs using ultra-high performance concrete (UHPC): A state of the art review. Eng. Struct. 2020, 205, 110035. [Google Scholar] [CrossRef]
  2. Ma, C.-K.; Chen, S.; Chin, C.-L.; Tian, J.; Fu, H. Axial compressive performance of CFRP-steel composite tube confined seawater sea-sand concrete intermediate slender columns. Constr. Build. Mater. 2024, 441, 137399. [Google Scholar] [CrossRef]
  3. Wu, Z.; Ma, C.-K.; Malaysia, U.T.; Fu, H.; Guo, K.; Chin, C.-L.; Jiangxi University of Engineering; Mai, R. Experimental Investigation of a Novel CFRP-Steel Composite Tube-Confined Seawater-Sea Sand Concrete Intermediate Long Column. Int. J. Integr. Eng. 2024, 16, 466–475. [Google Scholar] [CrossRef]
  4. Yuan, J.; Wu, X.; Tang, S.; Liu, H.; Chin, C.-L.; Tian, J.; Fu, H.; Mai, R. Axial compression behavior of GFRP-steel composite tube confined seawater sea-sand concrete intermediate long columns. Eng. Struct. 2025, 333, 120157. [Google Scholar] [CrossRef]
  5. Chen, F.L.; Qiao, P.Z. Probabilistic damage modeling and service-life prediction of concrete under freeze-thaw action. Mater. Struct. 2015, 48, 2697–2711. [Google Scholar] [CrossRef]
  6. Hassanzadeh, M.; Fridh, K.; Rosenqvist, M.; Bertron, A. Concrete alteration due to 55years of exposure to river water: Chemical and mineralogical characterisation. Cem. Concr. Res. 2017, 92, 110–120. [Google Scholar] [CrossRef]
  7. Wang, H.; Fan, W.; Liu, T.; An, Z. Experimental study on properties of fully-graded concrete under uniaxial dynamic compressive stress state after freezing-thawing cycles. J. Hydraul. Eng. 2015, 46, 732–738. [Google Scholar]
  8. Zhang, Q.; Wang, R.; Li, Y. Deterioration of concrete under the coupling effects of freeze–thaw cycles and other actions: A review. Constr. Build. Mater. 2022, 319, 126045. [Google Scholar] [CrossRef]
  9. Zhang, Y.; Yan, H.; Sun, W.; Mu, R. Damage and damage resistance of high strength concrete under the action of load and freeze-thaw cycles. Cem. Concr. Res. 1999, 29, 1519–1523. [Google Scholar] [CrossRef]
  10. Wang, B.; Pan, J.; Fang, R.; Wang, Q. Damage model of concrete subjected to coupling chemical attacks and freeze-thaw cycles in saline soil area. Constr. Build. Mater. 2020, 242, 118–205. [Google Scholar] [CrossRef]
  11. Han, N.; Tian, W. Experimental study on the dynamic mechanical properties of concrete under freeze–thaw cycles. Struct. Concr. 2018, 19, 1353–1362. [Google Scholar] [CrossRef]
  12. Li, Y.; Zhai, Y.; Liang, W.; Li, Y.; Dong, Q.; Meng, F. Dynamic mechanical properties and visco-elastic damage constitutive model of freeze–thawed concrete. Materials 2020, 13, 4056. [Google Scholar] [CrossRef] [PubMed]
  13. Shang, H.S.; Song, Y.P.; Ou, J.P. Behavior of high water-cement ratio concrete under biaxial compression after freeze-thaw cycles. J. Wuhan Univ. Technol. (Mater. Sci. Ed.) 2008, 23, 589–594. [Google Scholar] [CrossRef]
  14. Zhang, K.; Zhou, J.; Yin, Z. Experimental study on mechanical properties and pore structure deterioration of concrete under freeze–thaw cycles. Materials 2021, 14, 6568. [Google Scholar] [CrossRef] [PubMed]
  15. Xiao, S.; Monteiro, P.J.M.; Li, H. Influence of strain rates and loading histories on the compressive damage behaviour of concrete. Mag. Concr. Res. 2011, 63, 915–926. [Google Scholar] [CrossRef]
  16. Zhou, L.; Jiang, X.; Zheng, X.; Zhu, X.; Zhu, H.; Yan, Z.; Wang, Y.; Zhang, S.; Zhao, W.; Xu, F.; et al. Research progress of the thermophysical and mechanical properties of concrete subjected to freeze-thaw cycles. Constr. Build. Mater. 2022, 330, 127254. [Google Scholar] [CrossRef]
  17. Huang, C.; Chen, Y.; Wei, W.; Gao, Z.; Wang, Z.; Zhao, Q.; Wang, J.; Zhu, L. Study on dynamic compressive mechanical properties of freeze-thaw concrete. Constr. Build. Mater. 2022, 322, 126499. [Google Scholar] [CrossRef]
  18. Cannon, J.W. The Fractal Geometry of Nature. By Benoit B. Mandelbrot. Am. Math. Mon. 1984, 91, 594–598. [Google Scholar] [CrossRef]
  19. Zhai, Y.; Li, Y.; Li, Y.; Jiang, W.; Liu, X. Research on the impact loading and energy dissipation of concrete after elevated temperature under different heating gradients and cooling methods. Materials 2018, 11, 1651. [Google Scholar] [CrossRef]
  20. Li, Y.; Zhang, X.; Zhang, S. Classification and fractal characteristics of coal rock fragments under uniaxial cyclic loading conditions. Arab. J. Geosci. 2018, 11, 1–12. [Google Scholar] [CrossRef]
  21. Cao, M.S.; Ren, Q.W. Fractal behavior of concrete crack and its application to damage assessment. Key Eng. Mater. 2006, 312, 325–332. [Google Scholar] [CrossRef]
  22. Gan, L.; Zou, Z.; Zhang, Z.; Zhang, H.; Gu, H.; Jin, H. Investigation on the evolution of concrete pore structure under freeze-thaw and fatigue loads. J. Build. Eng. 2024, 97, 110914. [Google Scholar] [CrossRef]
  23. Jin, S.; Zhang, J.; Han, S. Fractal analysis of relation between strength and pore structure of hardened mortar. Constr. Build. Mater. 2017, 135, 1–7. [Google Scholar] [CrossRef]
  24. Wang, L.; Chen, L.; Liu, H.; Zhu, C.; Li, S.; Fan, H.; Zhang, S.; Wang, A. Dynamic behaviors and deterioration characteristics of coal under different initial gas pressures. Rock Soil Mech. 2023, 44, 144–158. [Google Scholar]
  25. Liu, X.; Zhai, Y.; Li, Y.; Liang, W. Research on fractal characteristics and energy dissipation of concrete suffered freeze-thaw cycle action and impact loading. Materials 2019, 12, 2585. [Google Scholar] [CrossRef]
Figure 1. Sample preparation.
Buildings 15 02009 g001
Figure 2. Partial specimen after melting.
Buildings 15 02009 g002
Figure 3. SHPB system.
Buildings 15 02009 g003
Figure 4. Dynamic stress balance curve of concrete.
Buildings 15 02009 g004
Figure 5. Relationship between mass loss ratio and freeze–thaw cycles.
Buildings 15 02009 g005
Figure 6. Stress–strain curves of concrete under varying freeze–thaw cycles.
Buildings 15 02009 g006aBuildings 15 02009 g006b
Figure 7. Loss rate of elastic modulus of concrete under varying freeze-thaw cycles.
Buildings 15 02009 g007
Figure 8. Concrete fracture patterns under different numbers of freeze–thaw cycles.
Buildings 15 02009 g008
Figure 9. Test block sieving results.
Buildings 15 02009 g009
Figure 10. Fractal dimension calculation curve of concrete fragments. (a) The fractal dimensions of Class D specimens following various numbers of freeze–thaw cycles. (b) The fractal dimensions of specimens exhibiting different water–cement ratios after 30 freeze–thaw cycles.
Buildings 15 02009 g010
Table 1. Ratio of concrete material usage for different mix ratios.
GroupsCementSandCrushed RockWater
A11.623.340.50
B11.512.920.47
C11.2252.4850.44
D11.182.630.41
Table 2. Relevant experimental parameters.
The Number of Test BlocksThe Size of The SpecimensThe Air PressureThe Freeze–Thaw Cycles
48∅50 mm × 25 mm0.3 MPa0, 10, 20, 30
Table 3. Concrete mass loss under varying freeze–thaw cycles: %.
Groups0102030
A0−0.360.151.2
B0−0.330.11.06
C0−0.3100.96
D0−0.300.9
Table 4. Strength values of specimens under various freeze–thaw cycle conditions (unit: MPa).
Groups0102030
A-135.3332.8630.2827.73
A-234.7532.1529.5626.74
A-334.1531.5428.7825.78
B-134.0331.8229.5327.31
B-233.5531.2628.9226.43
B-333.1030.6528.2725.51
C-133.8331.7129.5427.44
C-233.3531.1528.9226.56
C-332.8430.6128.4125.68
D-134.3532.2530.0528.36
D-233.7131.5129.2527.34
D-333.3531.1428.7426.53
Table 5. Variation in concrete’s relative dynamic modulus of elasticity with freeze–thaw cycle count (unit: GPa).
Groups0102030
A31.3228.2126.6223.8
B31.3429.9326.8324.19
C31.3629.042724.46
D31.3529.0627.0924.67
Table 6. Rate of relative dynamic elastic modulus loss in specimens subjected to varying numbers of freeze–thaw cycles, %.
Groups0102030
A081524
B07.714.422.8
C07.413.922
D07.313.621.3
Table 7. Sieving results of specimens.
GroupsArithmetic Mean of Mass Distribution/gFractal Dimension E
<11~2.52.5~55~1010~15>15
0-D1.523.415.0318.5121.3678.421.925
10-D3.364.067.3920.1223.2370.371.994
20-D5.226.9610.1322.8625.2757.332.069
30-D6.389.1214.3732.5721.3244.262.148
30-A7.5112.2616.3828.8623.2439.362.225
30-B6.8811.2316.0830.5221.8240.912.208
30-C6.3310.2414.6830.2322.8643.562.188
30-D6.089.3513.4533.1620.8444.242.162
Disclaimer/Publisher’s Note: The statements, opinions and data contained in all publications are solely those of the individual author(s) and contributor(s) and not of MDPI and/or the editor(s). MDPI and/or the editor(s) disclaim responsibility for any injury to people or property resulting from any ideas, methods, instructions or products referred to in the content.

