
The Effect of Low-Carbon Technology on Carbon Emissions Reduction in the Building Sector: A Case Study of Xi’an, China


 ,
, 

Abstract
1. Introduction
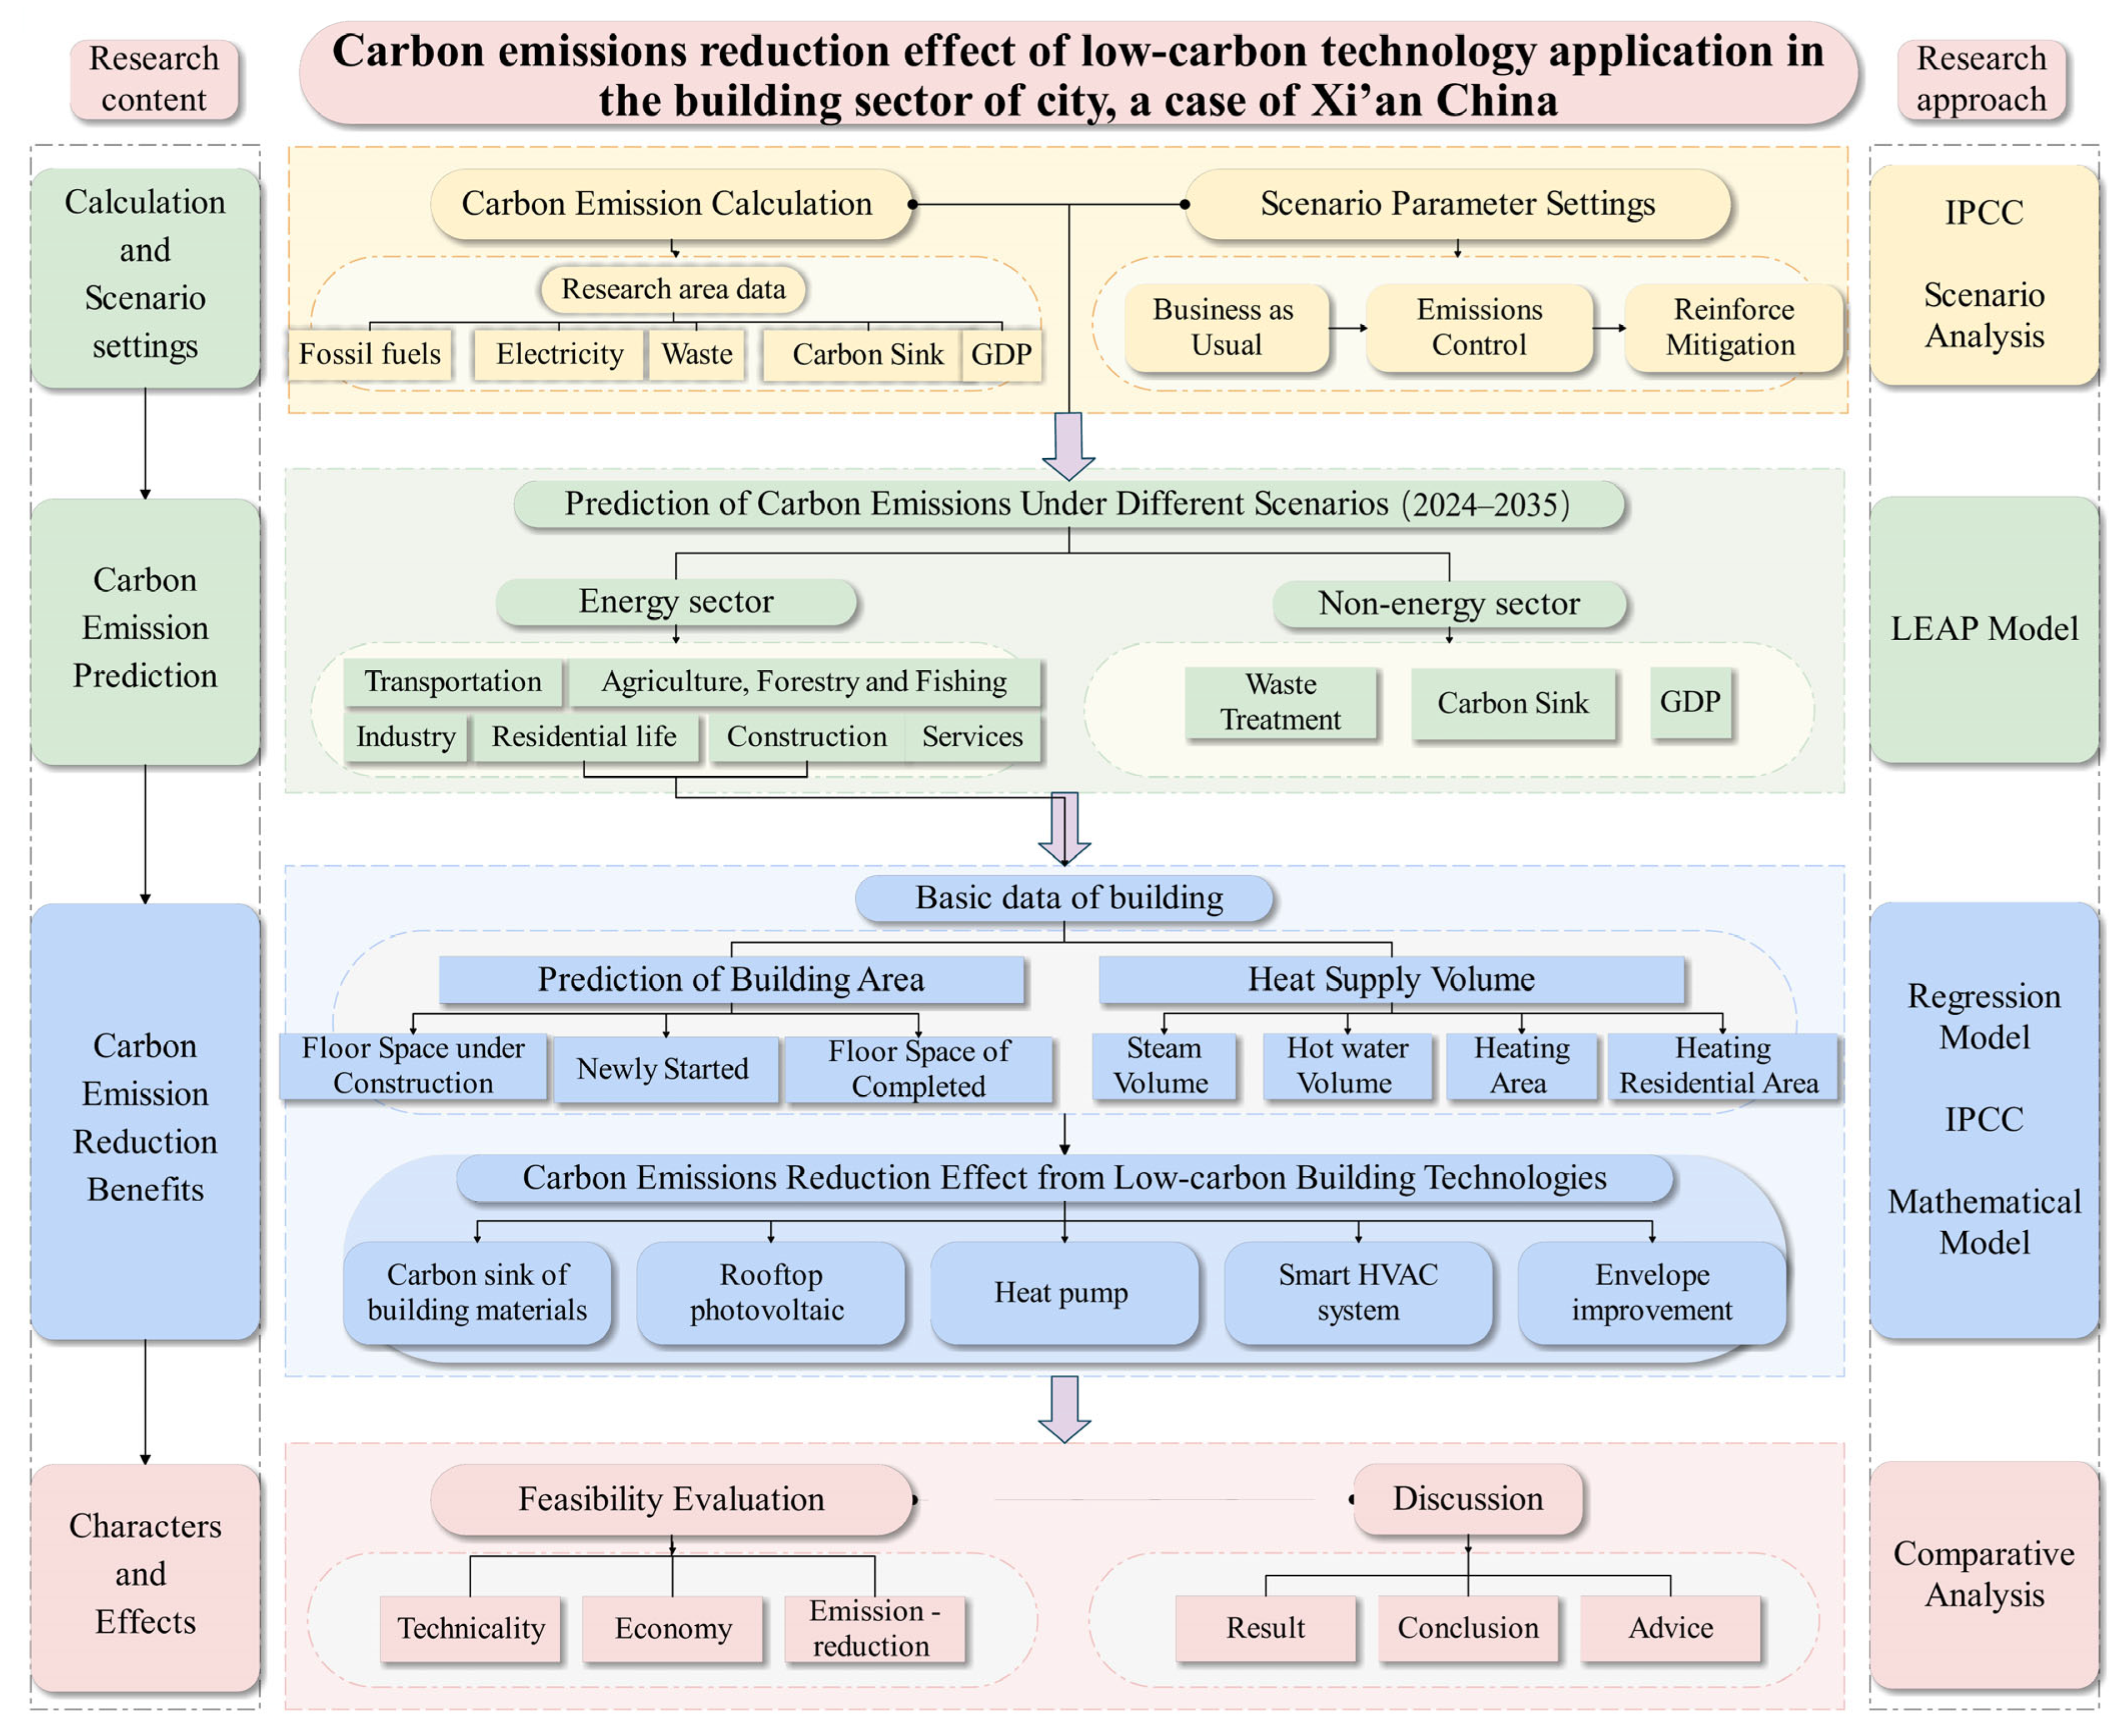
2. Materials and Methods
2.1. Research Area
2.2. Carbon Emission Analysis of Xi’an
Calculation of the Carbon Emissions
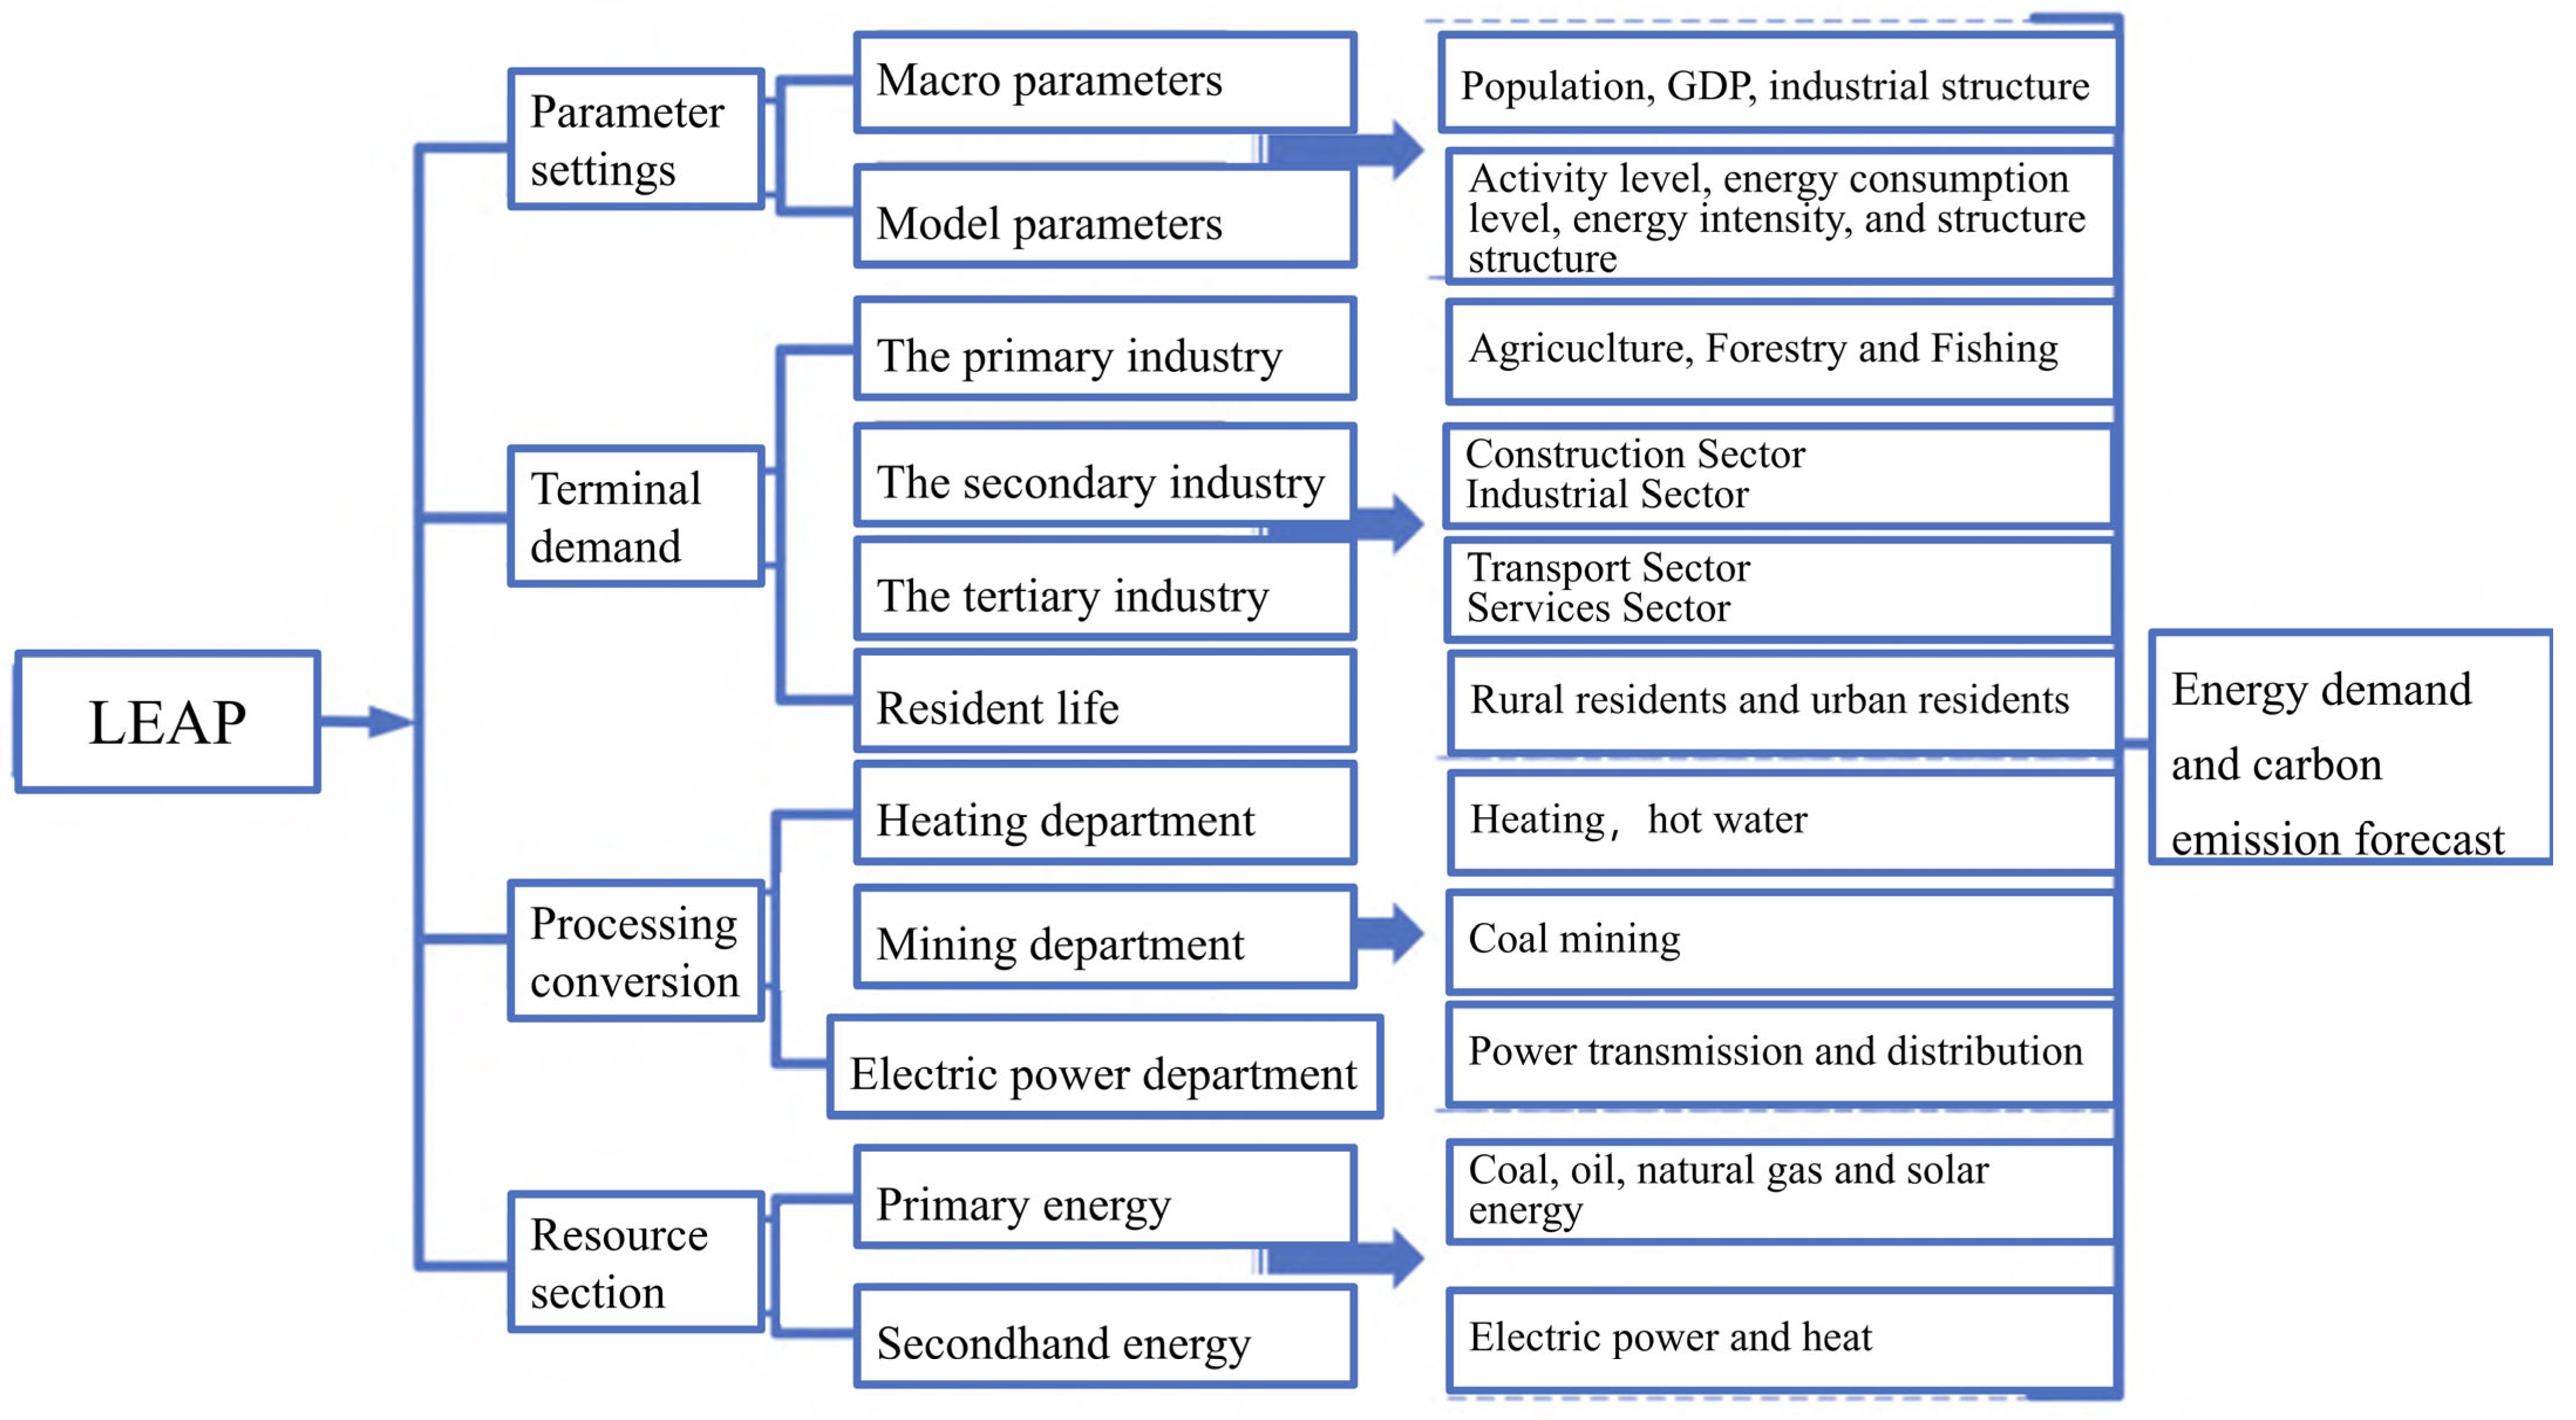
2.3. Prediction of the Future Carbon Emissions Under Different Scenarios
2.4. Carbon Emissions Reduction Effect from Building Low-Carbon Technologies
2.4.1. Prediction of Construction-Related Data
- (1)
- The built area prediction in the city
- (2)
- The heating demand prediction
2.4.2. Carbon Emissions Reduction Effect from Building Materials Carbon Sink
2.4.3. Carbon Emissions Reduction Effect from Building Heat Pumps
2.4.4. Carbon Emissions Reduction Effect from Rooftop Photovoltaic Systems
2.4.5. Carbon Emissions Reduction Effect from Smart Heating, Ventilation, and Air Conditioning Systems
2.4.6. Carbon Emissions Reduction Effect from Building Envelope Improvement
3. Results
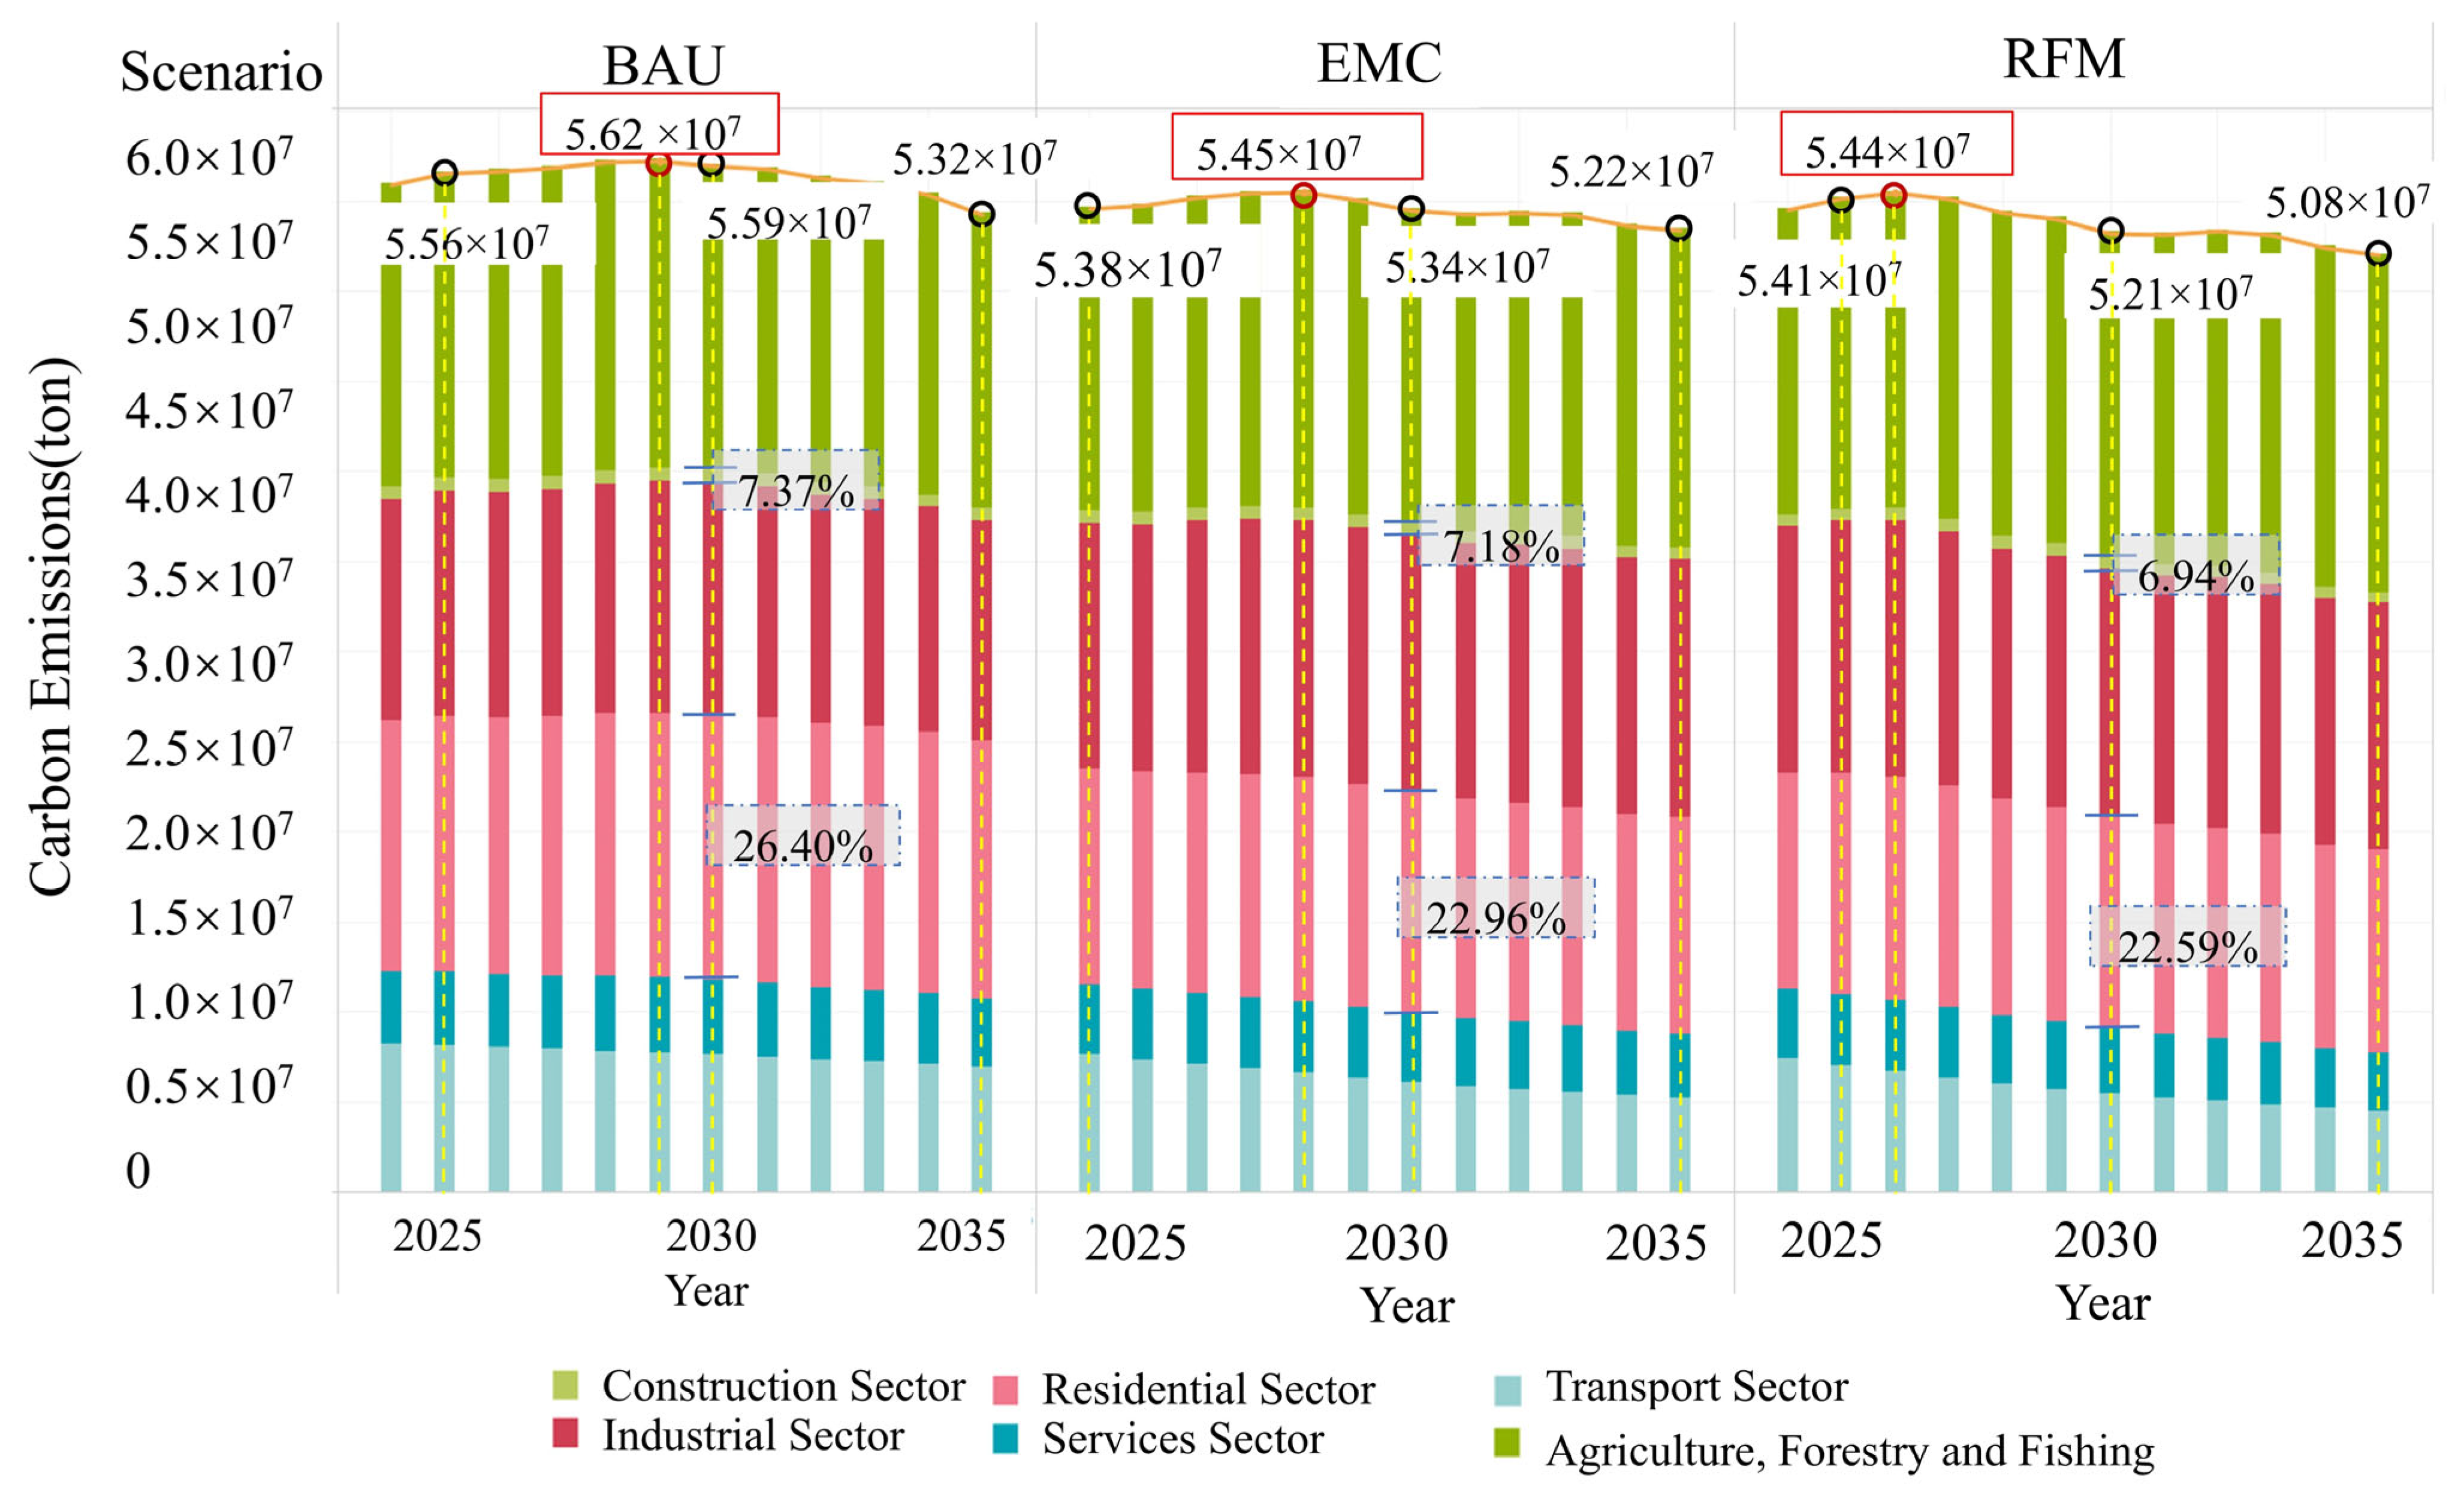
3.1. Carbon Emissions Characters of Xi’an
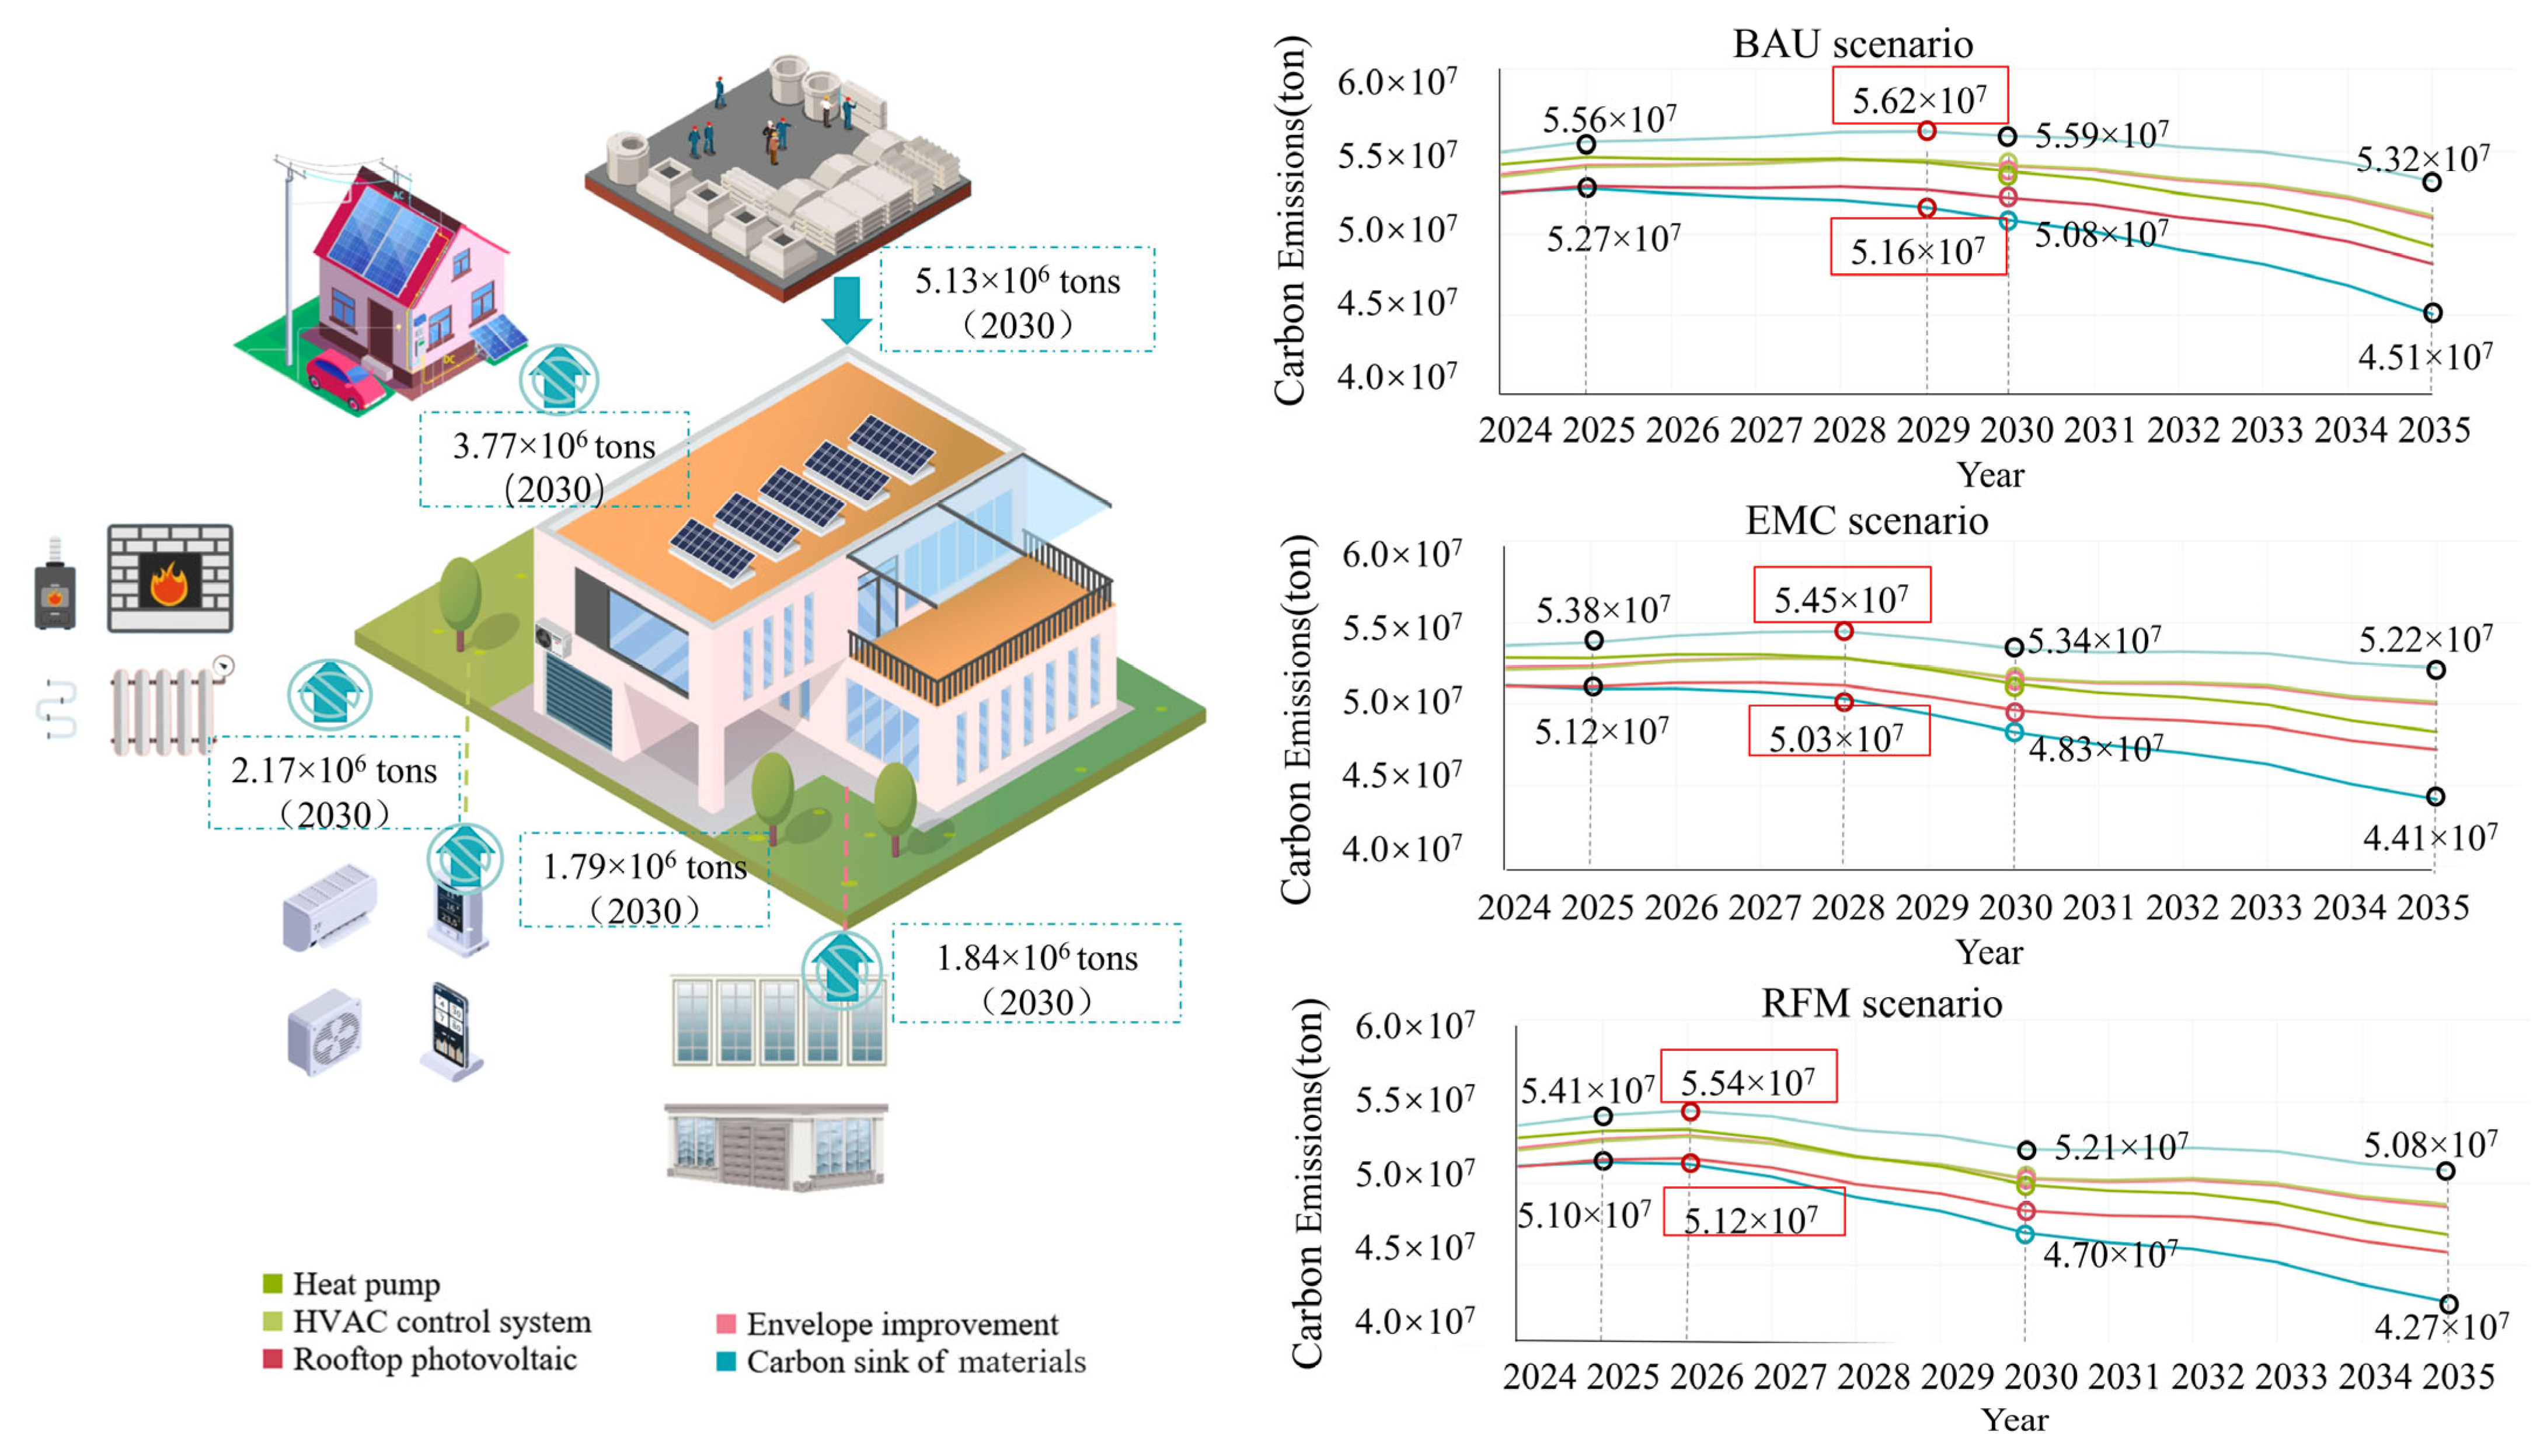
3.2. Carbon Emissions Reduction Effect from Building Low-Carbon Technologies of Xi’an
4. Discussion
4.1. The Urban Building Sector’s Substantial Carbon Mitigation Potential
4.2. Differences in Emission Reduction Potential and Feasibility of Low-Carbon Technologies
4.3. Limitations and Prospects
5. Conclusions
Supplementary Materials
Author Contributions
Funding
Data Availability Statement
Conflicts of Interest
References
- Zhao, X.; Ma, X.; Chen, B.; Shang, Y.; Song, M. Challenges toward carbon neutrality in China: Strategies and countermeasures. Resour. Conserv. Recycl. 2022, 176, 105959. [Google Scholar] [CrossRef]
- Ma, M.; Zhou, N.; Feng, W.; Yan, J. Challenges and opportunities in the global net-zero building sector. Cell Rep. Sustain. 2024, 1, 100154. [Google Scholar] [CrossRef]
- Luo, W.; Liu, W.; Liu, W.; Xia, L.; Zheng, J.; Liu, Y. Analysis of influencing factors and carbon emission scenario prediction during building operation stage. Energy 2025, 316, 134401. [Google Scholar] [CrossRef]
- Awan, A.; Kocoglu, M.; Subhan, M.; Utepkaliyeva, K.; bte Mohamed Yusoff, N.Y.; Hossain, M.E. Assessing energy efficiency in the built environment: A quantile regression analysis of CO2 emissions from buildings and manufacturing sector. Energy Build. 2025, 338, 115733. [Google Scholar] [CrossRef]
- Shi, H.; Chai, J.; Lu, Q.; Zheng, J.; Wang, S. The impact of China’s low-carbon transition on economy, society and energy in 2030 based on CO2 emissions drivers. Energy 2022, 239, 122336. [Google Scholar] [CrossRef]
- Yang, J.; Deng, Z.; Guo, S.; Chen, Y. Development of bottom-up model to estimate dynamic carbon emission for city-scale buildings. Appl. Energy 2023, 331, 120410. [Google Scholar] [CrossRef]
- Zhang, C.; Luo, H. Research on carbon emission peak prediction and path of China’s public buildings: Scenario analysis based on LEAP model. Energy Build. 2023, 289, 113053. [Google Scholar] [CrossRef]
- Tan, X.; Lai, H.; Gu, B.; Zeng, Y.; Li, H. Carbon emission and abatement potential outlook in China’s building sector through 2050. Energy Policy 2018, 118, 429–439. [Google Scholar] [CrossRef]
- Yuan, S.; Chen, X.; Du, Y.; Qu, S.; Hu, C.; Jin, L.; Xu, W.; Yan, G. Pathway of Carbon Emission Peak of China’s Building Sector. Res. Environ. Sci. 2022, 35, 394–404. [Google Scholar] [CrossRef]
- Xu, W.; Sun, D.; Dong, J.; Huang, S.; Yang, S. Technical pathways of dual carbon control in China’s buildings sector. Carbon Neutrality 2022, 1, 18. [Google Scholar] [CrossRef]
- Li, S.; Kong, W.; Wang, Y.; Yuan, L. Medium and long-term energy demand forecasts by sectors in China under the goal of “carbon peaking & carbon neutrality”: Based on the LEAP-China model. Energy 2024, 310, 133017. [Google Scholar] [CrossRef]
- Yuan, Y.; Wang, F.; Sun, L.; Liu, W.; Du, C.; Wang, C.; Yao, Y. Promote the decarbonization pathways of eco-industrial parks by considering their CO2 emissions structures and characters. J. Clean. Prod. 2024, 450, 141989. [Google Scholar] [CrossRef]
- Núñez, E.; Steyerberg, E.W.; Núñez, J. Regression Modeling Strategies. Rev. Española De Cardiol. 2011, 64, 501–507. [Google Scholar] [CrossRef]
- Churkina, G.; Organschi, A.; Reyer, C.P.O.; Ruff, A.; Vinke, K.; Liu, Z.; Reck, B.K.; Graedel, T.E.; Schellnhuber, H.J. Buildings as a global carbon sink. Nat. Sustain. 2020, 3, 269–276. [Google Scholar] [CrossRef]
- Zhao, R.; Huang, X.; Xue, J.; Guan, X. A practical simulation of carbon sink calculation for urban buildings: A case study of Zhengzhou in China. Sustain. Cities Soc. 2023, 99, 104980. [Google Scholar] [CrossRef]
- Gogtay, N.J.; Thatte, U.M. Principles of correlation analysis. J. Assoc. Physicians India 2017, 65, 78–81. [Google Scholar]
- Cleophas, T.J.; Zwinderman, A.H. Bayesian Pearson Correlation Analysis. In Modern Bayesian Statistics in Clinical Research; Cleophas, T.J., Zwinderman, A.H., Eds.; Springer International Publishing: Cham, Switzerland, 2018; pp. 111–118. [Google Scholar] [CrossRef]
- Zhang, Y.; Zheng, W.; Fang, H.; Xia, J. Clean heating in Northern China: Regional investigations and roadmap studies for urban area towards 2050. J. Clean. Prod. 2022, 334, 130233. [Google Scholar] [CrossRef]
- Xu, Z.; Li, H.; Xu, W.; Shao, S.; Wang, Z.; Gou, X.; Zhao, M.; Li, J. Investigation on the efficiency degradation characterization of low ambient temperature air source heat pump under partial load operation. Int. J. Refrig. 2022, 133, 99–110. [Google Scholar] [CrossRef]
- Zhong, T.; Zhang, Z.; Chen, M.; Zhang, K.; Zhou, Z.; Zhu, R.; Wang, Y.; Lü, G.; Yan, J. A city-scale estimation of rooftop solar photovoltaic potential based on deep learning. Appl. Energy 2021, 298, 117132. [Google Scholar] [CrossRef]
- Shafique, M.; Luo, X.; Zuo, J. Photovoltaic-green roofs: A review of benefits, limitations, and trends. Sol. Energy 2020, 202, 485–497. [Google Scholar] [CrossRef]
- Fakhraian, E.; Forment, M.A.; Dalmau, F.V.; Nameni, A.; Guerrero, M.J.C. Determination of the urban rooftop photovoltaic potential: A state of the art. Energy Rep. 2021, 7, 176–185. [Google Scholar] [CrossRef]
- Peng, J.; Lu, L. Investigation on the development potential of rooftop PV system in Hong Kong and its environmental benefits. Renew. Sustain. Energy Rev. 2013, 27, 149–162. [Google Scholar] [CrossRef]
- Yan, J.; Yang, Y.; Elia Campana, P.; He, J. City-level analysis of subsidy-free solar photovoltaic electricity price, profits and grid parity in China. Nat. Energy 2019, 4, 709–717. [Google Scholar] [CrossRef]
- Wang, Y.; He, J.; Chen, W. Distributed solar photovoltaic development potential and a roadmap at the city level in China. Renew. Sustain. Energy Rev. 2021, 141, 110772. [Google Scholar] [CrossRef]
- Wu, W.; Skye, H.M.; Domanski, P.A. Selecting HVAC systems to achieve comfortable and cost-effective residential net-zero energy buildings. Appl. Energy 2018, 212, 577–591. [Google Scholar] [CrossRef]
- Homod, R.Z. Analysis and optimization of HVAC control systems based on energy and performance considerations for smart buildings. Renew. Energy 2018, 126, 49–64. [Google Scholar] [CrossRef]
- Idrissi Kaitouni, S.; Sangkyu, P.; Mghazli, M.O.; El Mansouri, F.; Jamil, A.; Ahachad, M.; Brigui, J. Design parameters influencing the energy performance and indoor comfort of net zero energy building “NZEB” designed for semi-arid urban areas: Digital workflow methodology, sensitivity analysis and comparative assessment. Sol. Energy 2024, 268, 112264. [Google Scholar] [CrossRef]
- Huang, J.; Wang, S.; Teng, F.; Feng, W. Thermal performance optimization of envelope in the energy-saving renovation of existing residential buildings. Energy Build. 2021, 247, 111103. [Google Scholar] [CrossRef]
- Zhao, B.; Lu, K.; Zhang, W.; Jin, C.; Xuan, Q.; Pei, G. Thermo-responsive hydrogel-based building envelopes for building energy-saving. Sol. Energy 2025, 288, 113306. [Google Scholar] [CrossRef]
- Qin, X.; Liu, H.; Zhang, X.; Jiang, N.; Yang, L.; Jin, X. Thermal analysis of the window-wall interface for renovation of historical buildings. Energy Build. 2024, 310, 114108. [Google Scholar] [CrossRef]
- Bai, L.; Wang, S. Definition of new thermal climate zones for building energy efficiency response to the climate change during the past decades in China. Energy 2019, 170, 709–719. [Google Scholar] [CrossRef]
- Liu, C.; Ma, W.; Hao, J.; Luo, D.; Zuo, J.; Zhang, C. Energy Retrofitting Assessment of Public Building Envelopes in China’s Hot Summer and Cold Winter Climate Region. Buildings 2022, 12, 1866. [Google Scholar] [CrossRef]
- Zheng, Z.; Zhou, J.; Yang, Y.; Xu, F.; Liu, H. Economic optimization of exterior wall insulation in Chinese office buildings by coupling artificial neural network and genetic algorithm. Therm. Sci. Eng. Prog. 2024, 50, 102582. [Google Scholar] [CrossRef]
- Ren, W.R.; Wang, C.H.; Han, C.B.; Han, D.; Zheng, J.Y.; Cui, Y.N.; Song, X.M.; Jiang, Q.; Yan, H. Cement-based external wall insulation material with thermal performance improvement by partial substitution of calcium silicate. Energy Build. 2024, 317, 114415. [Google Scholar] [CrossRef]
- Mata, É.; Korpal, A.K.; Cheng, S.H.; Jiménez Navarro, J.P.; Filippidou, F.; Reyna, J.; Wang, R. A map of roadmaps for zero and low energy and carbon buildings worldwide. Environ. Res. Lett. 2020, 15, 113003. [Google Scholar] [CrossRef]
- Lippiatt, N.; Ling, T.-C.; Pan, S.-Y. Towards carbon-neutral construction materials: Carbonation of cement-based materials and the future perspective. J. Build. Eng. 2020, 28, 101062. [Google Scholar] [CrossRef]
- Lu, H.; You, K.; Feng, W.; Zhou, N.; Fridley, D.; Price, L.; de la Rue du Can, S. Reducing China’s building material embodied emissions: Opportunities and challenges to achieve carbon neutrality in building materials. iScience 2024, 27, 109028. [Google Scholar] [CrossRef]


| Scenario | Classification | 2025 | 2030 | 2035 |
|---|---|---|---|---|
| Business as usual (BAU) | Fossil fuels | 1. Excluding the transportation industry, fossil fuels such as crude oil, gasoline, diesel, and liquefied petroleum gas in other sectors will decrease by 0.8% annually. 2. In transportation, gasoline and diesel consumption decrease by 5% annually. 3. The consumption of natural gas in all sectors rises by 4% annually. | ||
| Electricity | The consumption of electricity power in all sectors rises by 6.6% annually. | |||
| Solid waste and sewage treatment | The annual rate of reduction for both solid waste generation and the Chemical Oxygen Demand (COD) in wastewater is 2%. | |||
| Clean energy | The proportion of clean energy generation has reached 20%. | 50%. | 70%. | |
| Forestry carbon sink | The area covered by grassland and forest has been expanded to encompass 48.03% | 49% | 50% | |
| GDP | The annual growth rate of the GDP is 6.5%. | |||
| Emissions control (EMC) | Fossil fuels | 1. Excluding the transportation industry, fossil fuels such as crude oil, gasoline, diesel, and liquefied petroleum gas in other sectors will decrease by 1.5% annually. 2. In the transportation sector, the consumption of gasoline and diesel decreases by 7.5% per year. 3. The consumption of natural gas in all sectors rises by 6% annually. | ||
| Electricity | The electricity consumption of electricity power in all sectors rises by 10% annually. | 10.5% annually. | 11% annually. | |
| Solid waste and sewage treatment | The annual rate of reduction for both solid waste generation and the Chemical Oxygen Demand (COD) in wastewater is 2%. | 3%. | 4%. | |
| Clean energy | The proportion of clean energy generation has reached 25%. | 55%. | 75%. | |
| Forestry carbon sink | The area covered by grassland and forest has been expanded to encompass 50% | 52% | 54% | |
| GDP | The annual growth rate of the GDP is 6.5%. | 6%. | 5.5%. | |
| Reinforce mitigation (RFM) | Fossil fuels | 1. Excluding the transportation industry, fossil fuels such as crude oil, gasoline, diesel, and liquefied petroleum gas in other sectors will decrease by 3% annually. 2. In the transportation sector, gasoline and diesel consumption decrease by 10% per year. 3. The consumption of natural gas in all sectors rises by 7% annually. | ||
| Electricity | The electricity consumption of electricity power in all sectors rises by 11% annually. | 11.5% annually. | 12% annually. | |
| Solid waste and sewage treatment | The annual rate of reduction for both solid waste generation and the Chemical Oxygen Demand (COD) in wastewater is 4%. | 5%. | 6%. | |
| Clean energy | The proportion of clean energy generation has reached 25%. | 60%. | 80%. | |
| Forestry carbon sink | The area covered by grassland and forest has been expanded to encompass 50% | 53% | 56% | |
| GDP | The annual growth rate of the GDP is 6%. | 5%. | 4%. | |
| Category | Expression | p Value | Fitting Degree R2 | F Test |
|---|---|---|---|---|
| Built-up area (10,000 m2) | S1 = 1685.053 × N − 3,383,658.772 | 0.000 | 0.943 | F = 132.845 (p = 0.000 ***) |
| New built area (10,000 m2) | S2 = 291.313 × N − 583,264.641 | 0.001 | 0.851 | F = 24.154 (p = 0.001 **) |
| Completed built area (10,000 m2) | S3 = 123.314 × N − 246,004.91 | 0.002 | 0.819 | F = 20.455 (p = 0.002 *) |
| Category | Expression | p-Value | Fitting Degree R2 |
|---|---|---|---|
| Total steam volume (10,000 GJ) | Q1 = 1843.927 | - | - |
| Total hot water volume (10,000 GJ) | Q2 = 661.782 × N − 1,329,014.105 | 0.000 *** | 0.920 |
| Heating area (10,000 m2) | S4 = 2603.1 × N − 5,228,494.216 | 0.000 *** | 0.887 |
| Residential heating area (10,000 m2) | S5 = 1905.564 × N − 3,825,721.505 | 0.001** | 0.846 |
| Heat Pump Market Type | Baseline Scenario | Main Applicable Scenarios | |
|---|---|---|---|
| Heating | Household heat pump heating unit | 100% coal burning | for residential heating in severe cold and cold regions |
| 100% gas wall-hung boiler | for residential heating in hot summer and cold winter regions | ||
| Heat pump air heater | 100% coal burning | for residential heating in severe cold and cold regions | |
| Commercial heat pump unit | 50% cogeneration + 10% gas boiler + 40% coal-fired boiler | for central heating in severe cold and cold regions | |
| Water source heat pump unit | |||
| Hot water | Household heat pump water heater | 50% gas water heater + 50% electric water heater | for the hot water supply in all regions |
| Commercial heat pump water heater | |||
| Type | Expression | p Value | Fit Degree R2 |
|---|---|---|---|
| Hot water sales | Q3 = 0.334 × N2 − 1308.235 × N + 1,282,101.84 | 0.000 *** | 0.996 |
| Heating sales | Q4 = 1.368 × N2 − 5509.464 × N + 5,548,091.723 | 0.000 *** | 0.996 |
Disclaimer/Publisher’s Note: The statements, opinions and data contained in all publications are solely those of the individual author(s) and contributor(s) and not of MDPI and/or the editor(s). MDPI and/or the editor(s) disclaim responsibility for any injury to people or property resulting from any ideas, methods, instructions or products referred to in the content. |
© 2025 by the authors. Licensee MDPI, Basel, Switzerland. This article is an open access article distributed under the terms and conditions of the Creative Commons Attribution (CC BY) license (https://creativecommons.org/licenses/by/4.0/).
Share and Cite
Zhang, D.; Sun, L.; Zhang, Y.; Liu, T.; Gao, L.; Wang, F.; Qiao, X.; Liu, Y.; Zuo, J.; Wang, Y. The Effect of Low-Carbon Technology on Carbon Emissions Reduction in the Building Sector: A Case Study of Xi’an, China. Buildings 2025, 15, 1989. https://doi.org/10.3390/buildings15121989
Zhang D, Sun L, Zhang Y, Liu T, Gao L, Wang F, Qiao X, Liu Y, Zuo J, Wang Y. The Effect of Low-Carbon Technology on Carbon Emissions Reduction in the Building Sector: A Case Study of Xi’an, China. Buildings. 2025; 15(12):1989. https://doi.org/10.3390/buildings15121989
Chicago/Turabian StyleZhang, Dongyi, Lu Sun, Yifan Zhang, Tianye Liu, Lu Gao, Fufu Wang, Xinting Qiao, Yuqi Liu, Jian Zuo, and Yupeng Wang. 2025. "The Effect of Low-Carbon Technology on Carbon Emissions Reduction in the Building Sector: A Case Study of Xi’an, China" Buildings 15, no. 12: 1989. https://doi.org/10.3390/buildings15121989
APA StyleZhang, D., Sun, L., Zhang, Y., Liu, T., Gao, L., Wang, F., Qiao, X., Liu, Y., Zuo, J., & Wang, Y. (2025). The Effect of Low-Carbon Technology on Carbon Emissions Reduction in the Building Sector: A Case Study of Xi’an, China. Buildings, 15(12), 1989. https://doi.org/10.3390/buildings15121989