
Correlation Between the Insolation Shadow Ratio and Thermal Comfort of Urban Outdoor Spaces in Residential Areas in Xi’an


Abstract
1. Introduction
2. Methodology
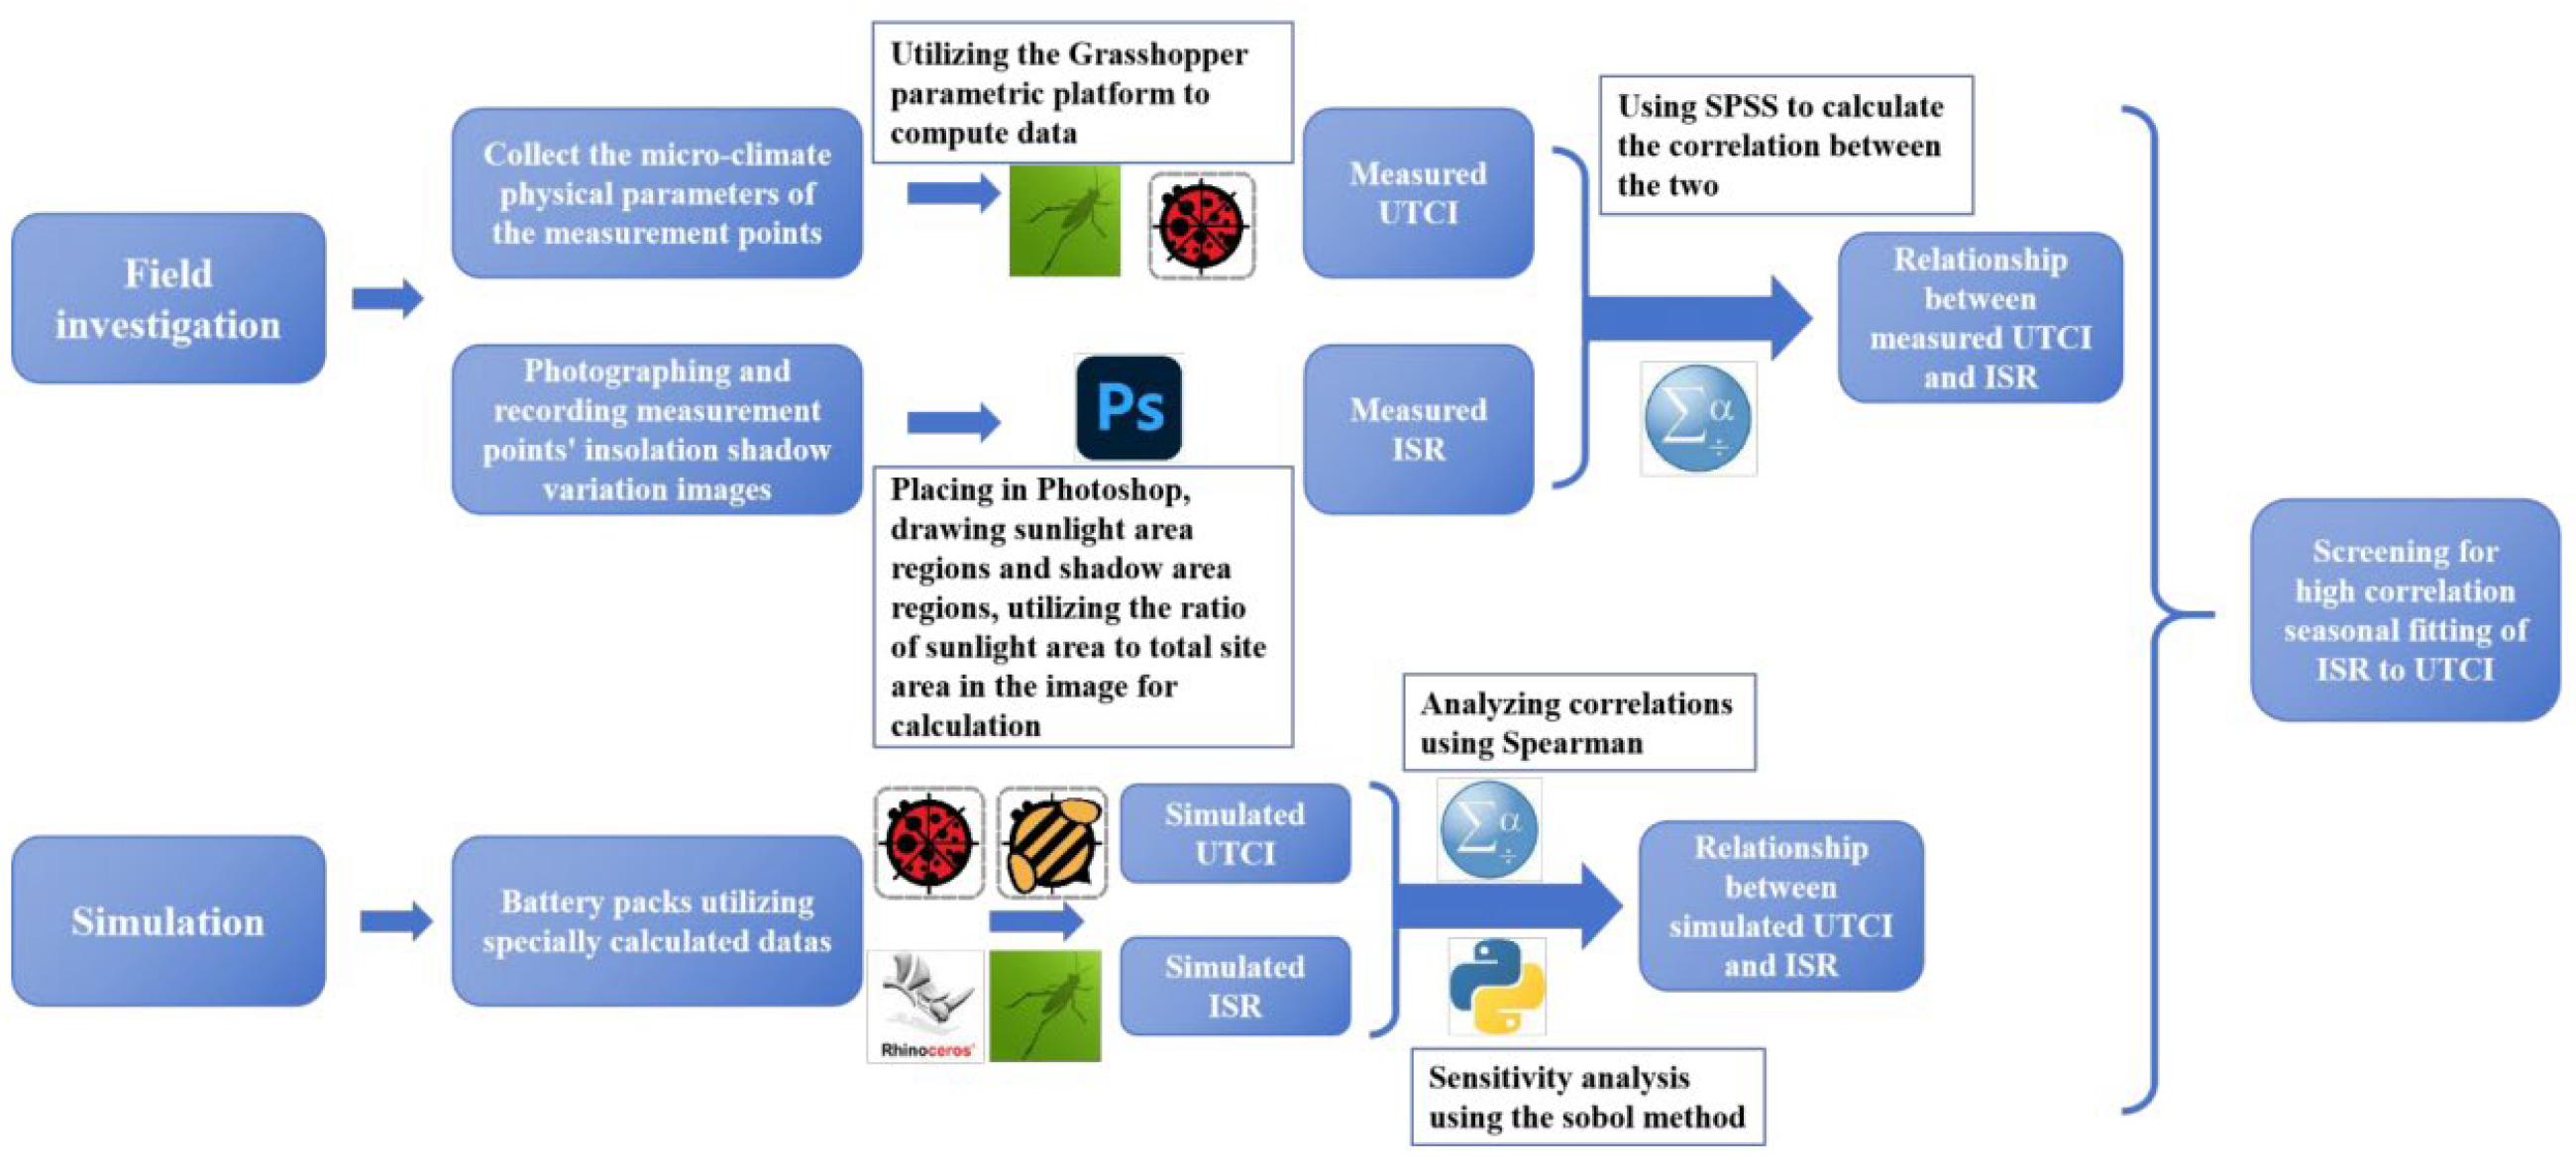
2.1. Research Framework
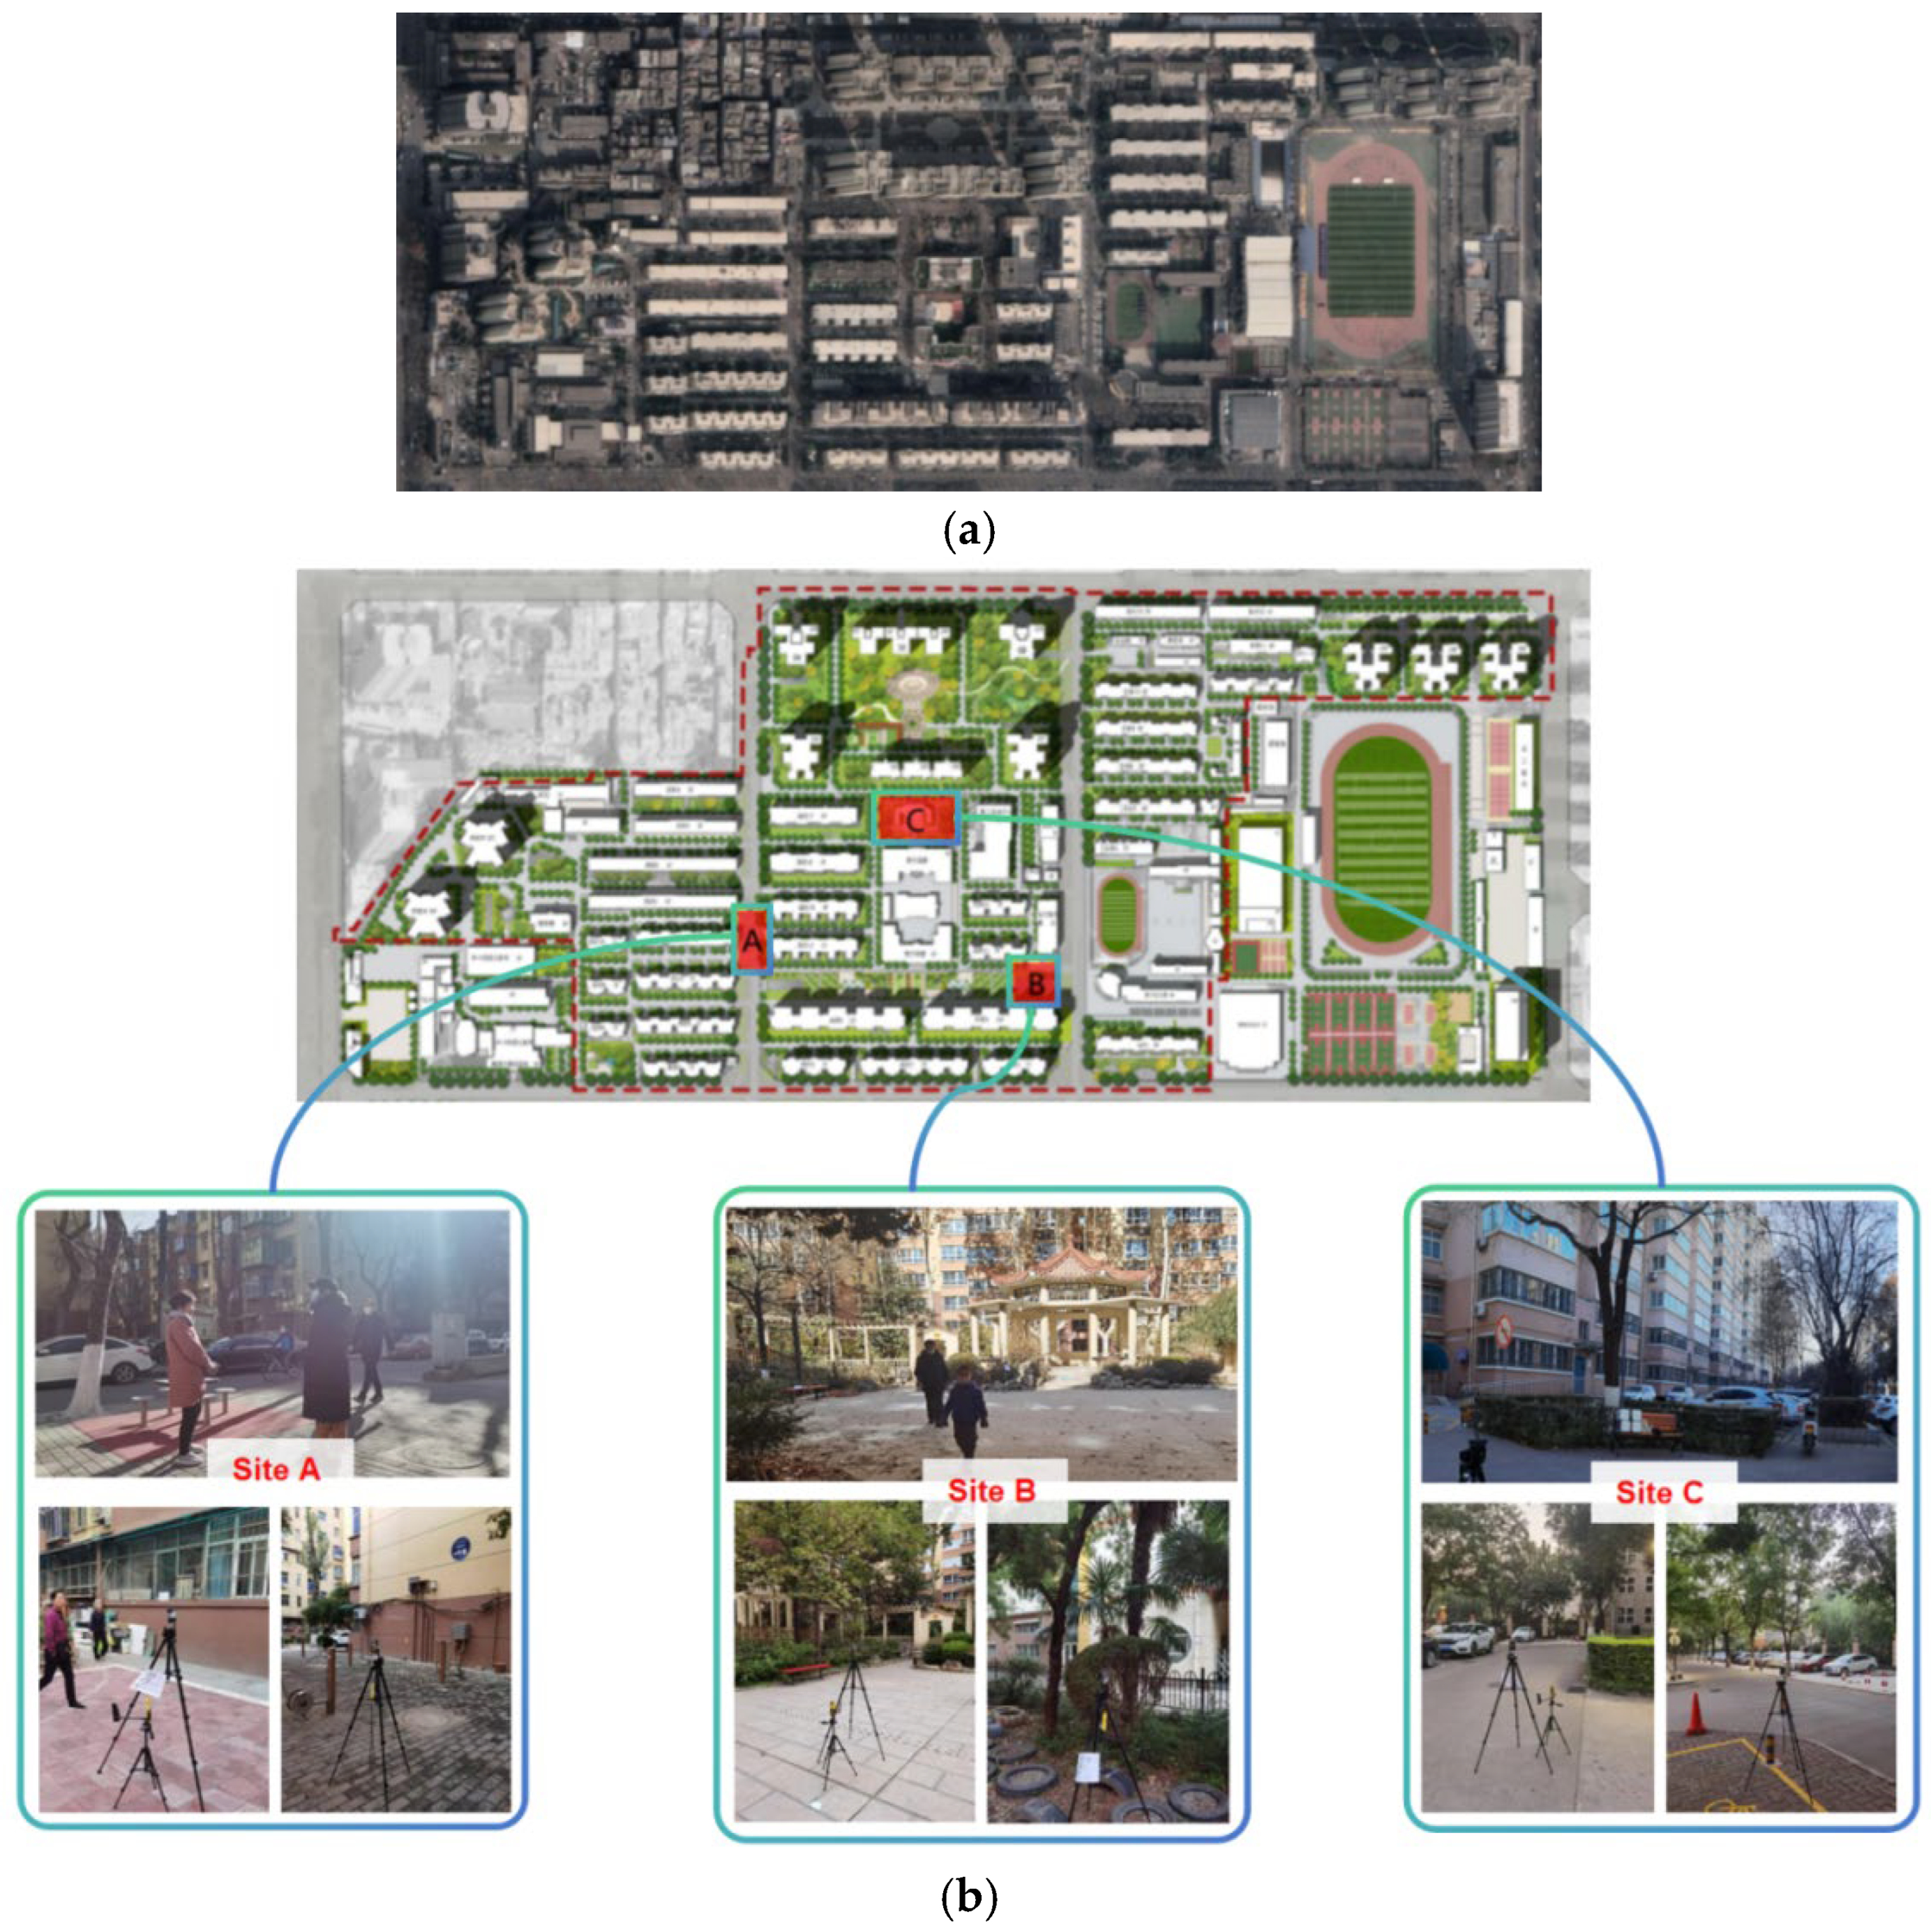
2.2. Sites
2.3. Field Investigation
2.3.1. Objectives
2.3.2. Content and Methods
2.4. Selection of Outdoor Thermal Comfort Indicators
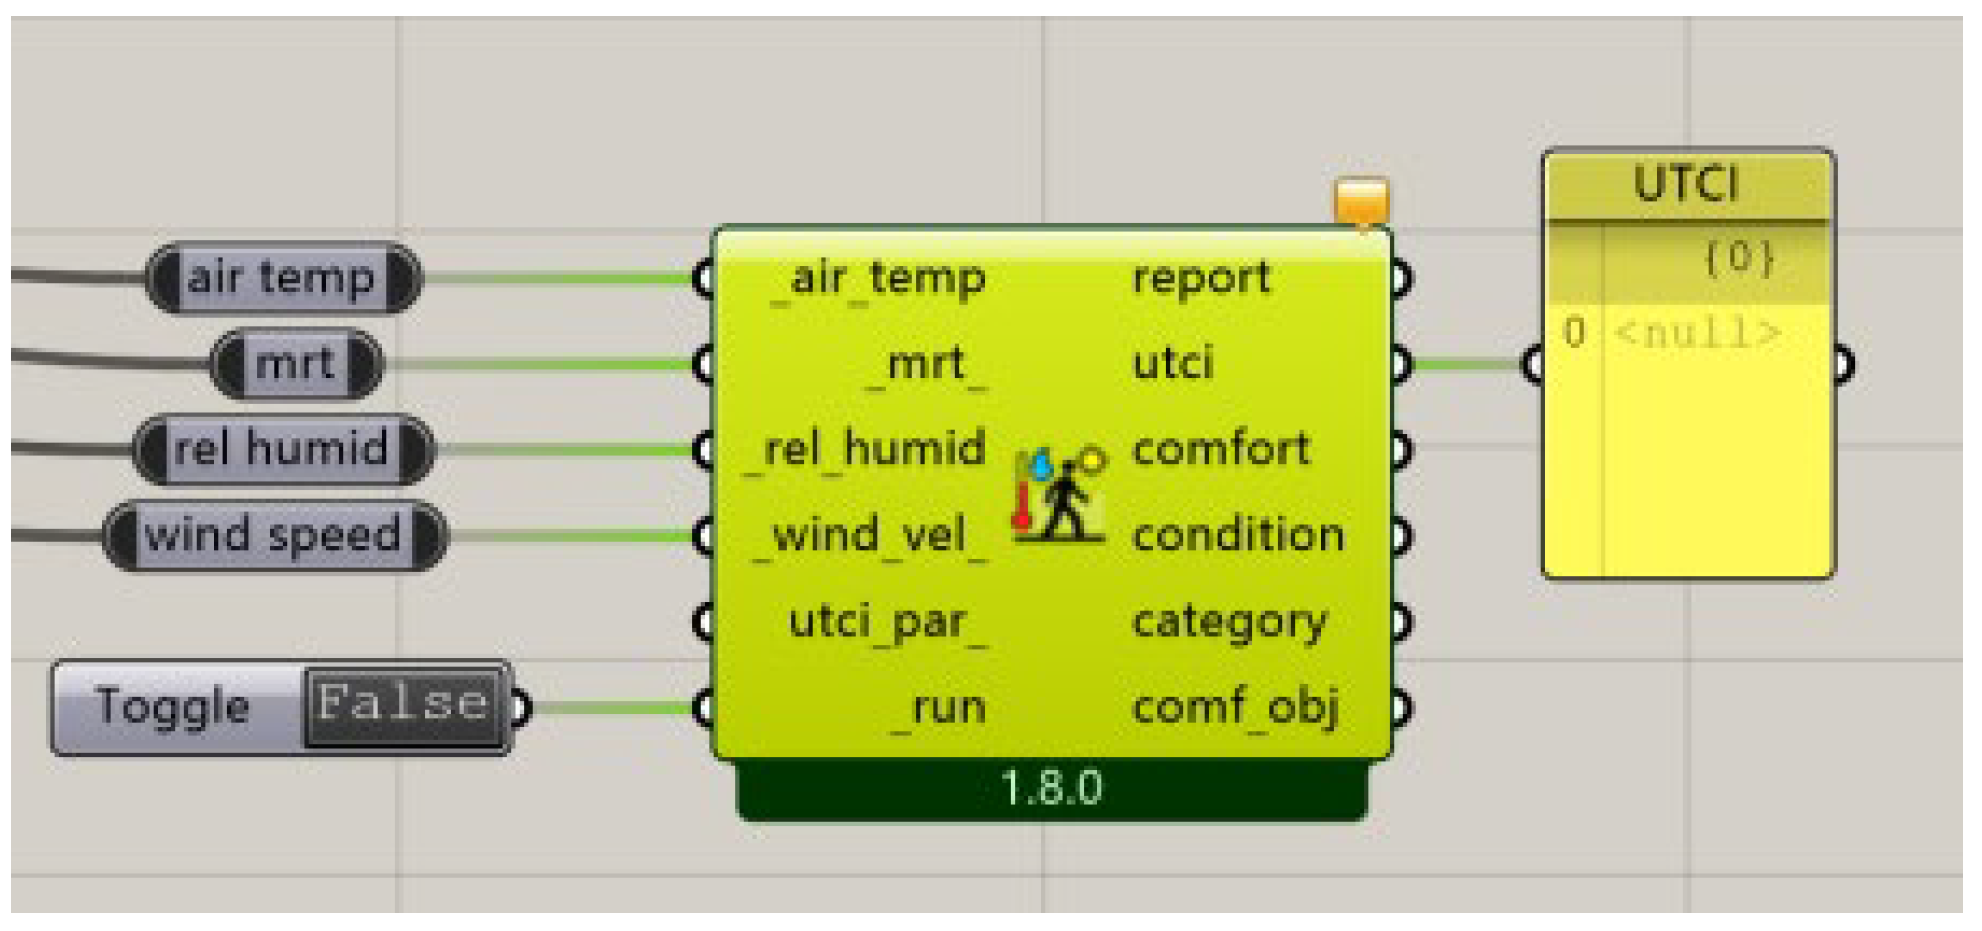
2.4.1. Method for Calculating the UTCI Based on Field Measurements
2.4.2. Method for Calculating the UTCI Based on Simulation
2.5. Concept and Calculation Method of the ISR Index
2.5.1. Method for Obtaining ISR Values Through Field Measurements
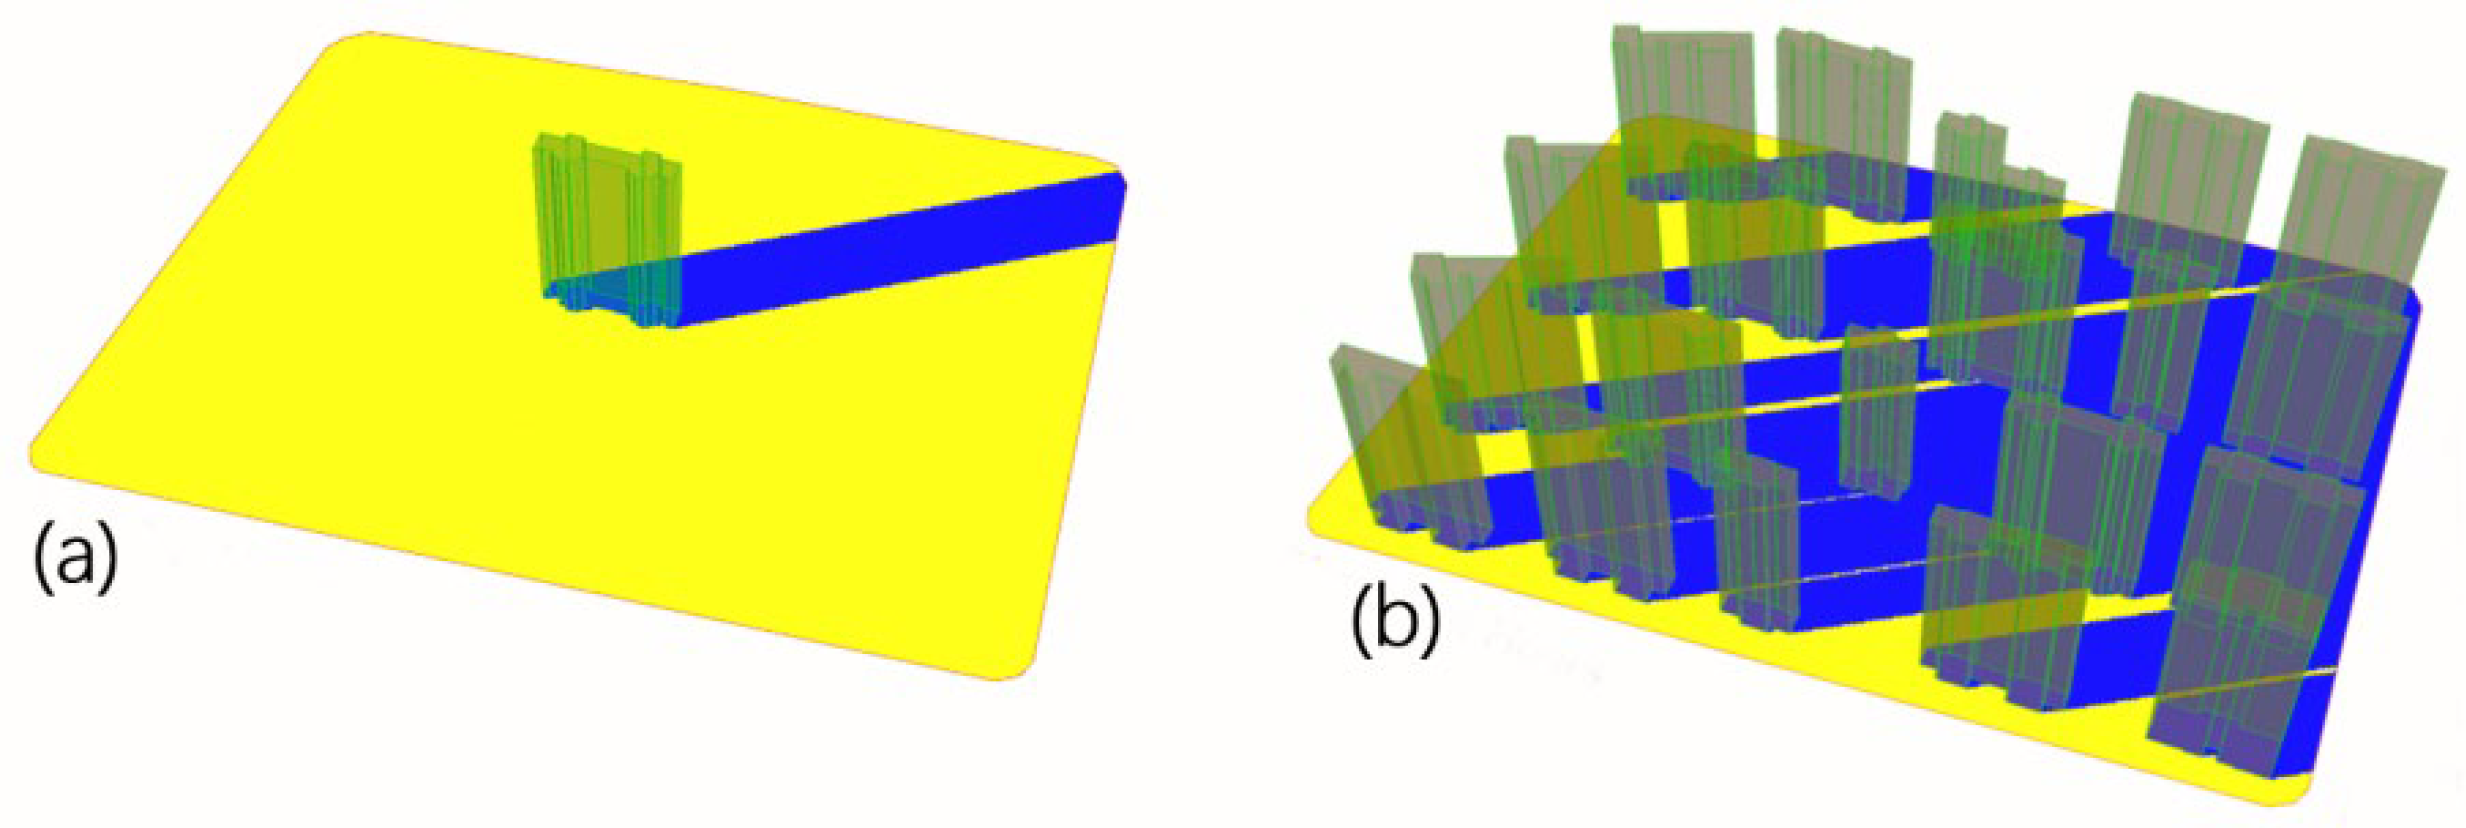
2.5.2. Method for Obtaining ISR Values Through Simulation
2.6. Validation of the Relationship Between Outdoor Thermal Comfort and the ISR
2.6.1. Spearman Correlation
2.6.2. Sobol Sensitivity Analysis
3. Results
3.1. Field Measurement Results
3.1.1. Measured Results of the Insolation Shadow Ratio for Different Types of Spaces
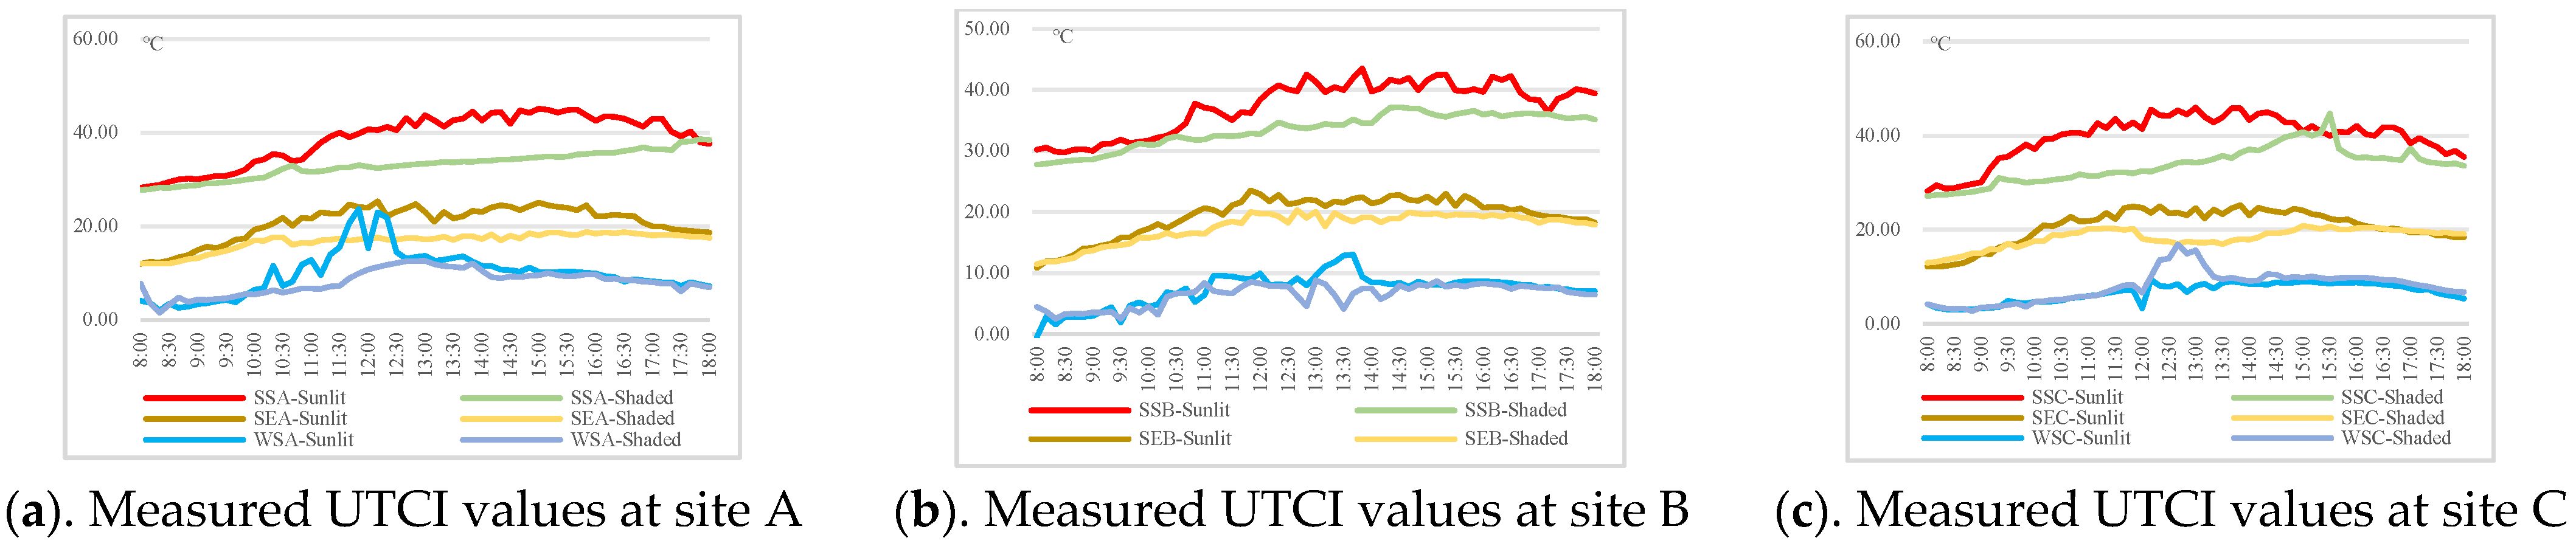
3.1.2. Measured UTCI Results for Different Types of Spaces
- (1)
- Comparison of measured UTCI data
- (2)
- Analysis of UTCI Differences Between Sunlit and Shaded Areas
- (3)
- Results and Analysis
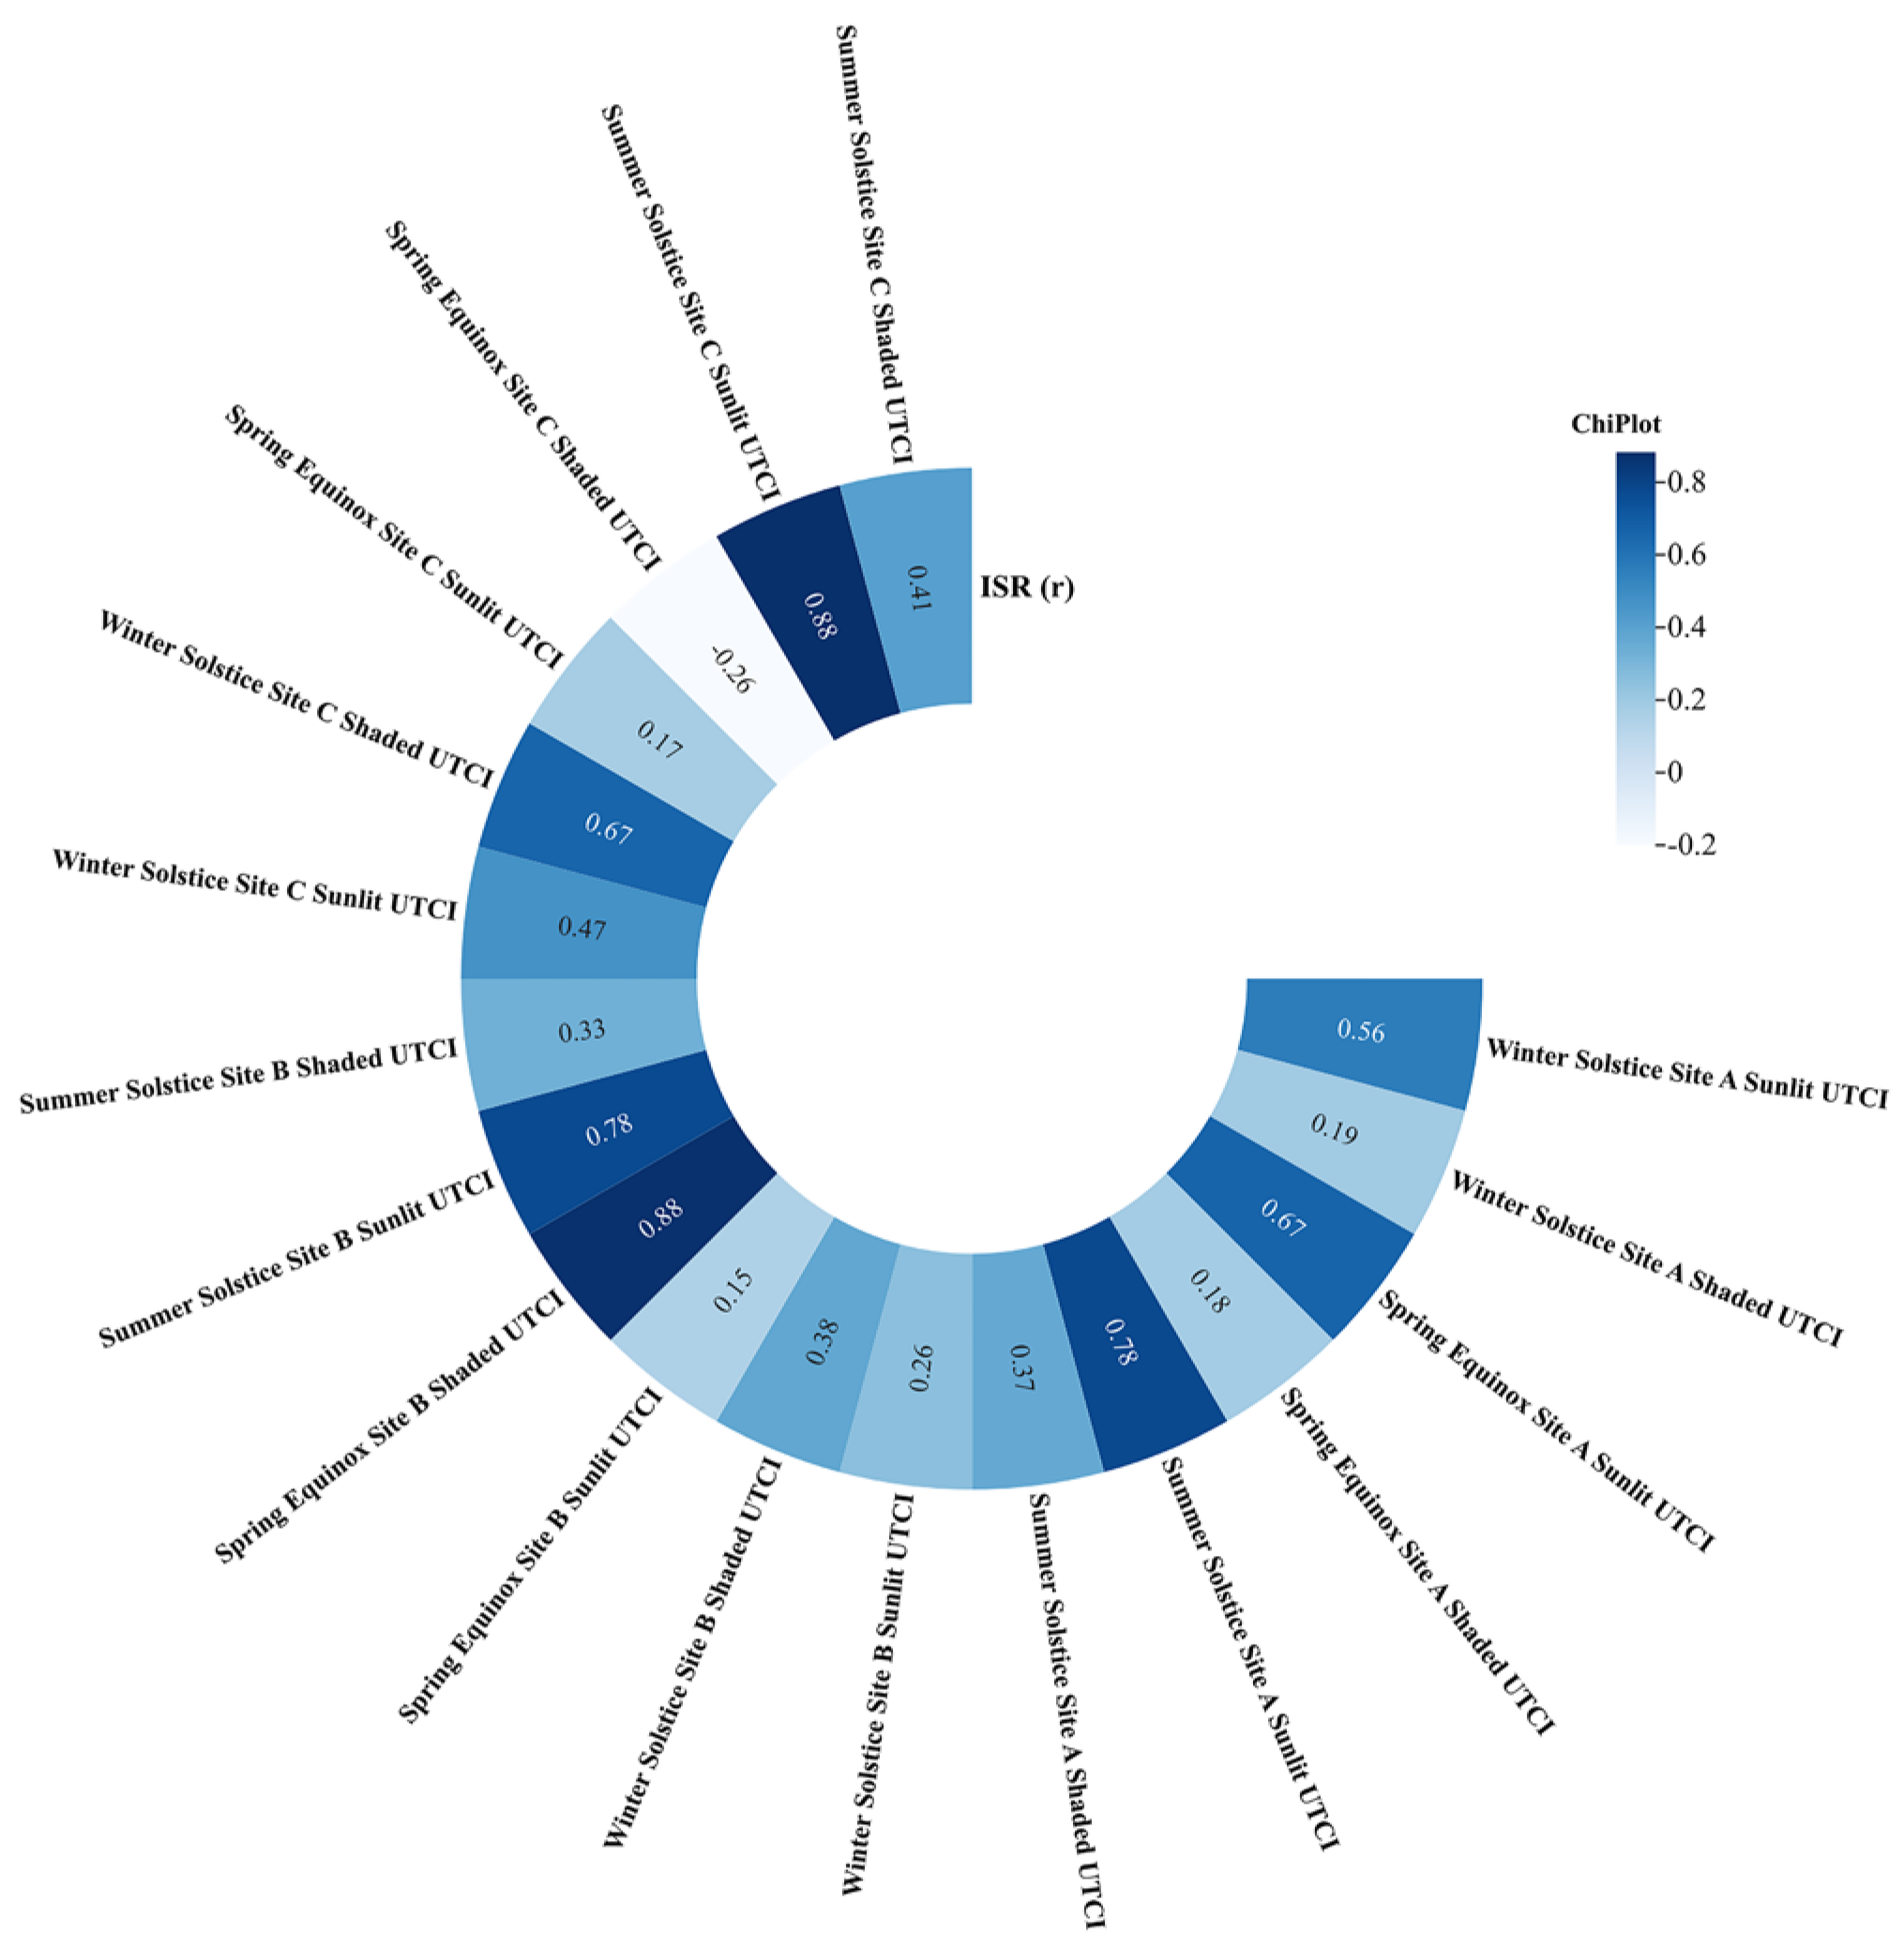
3.2. Correlation Analysis Between Measured ISR and UTCI
3.3. Simulation Results
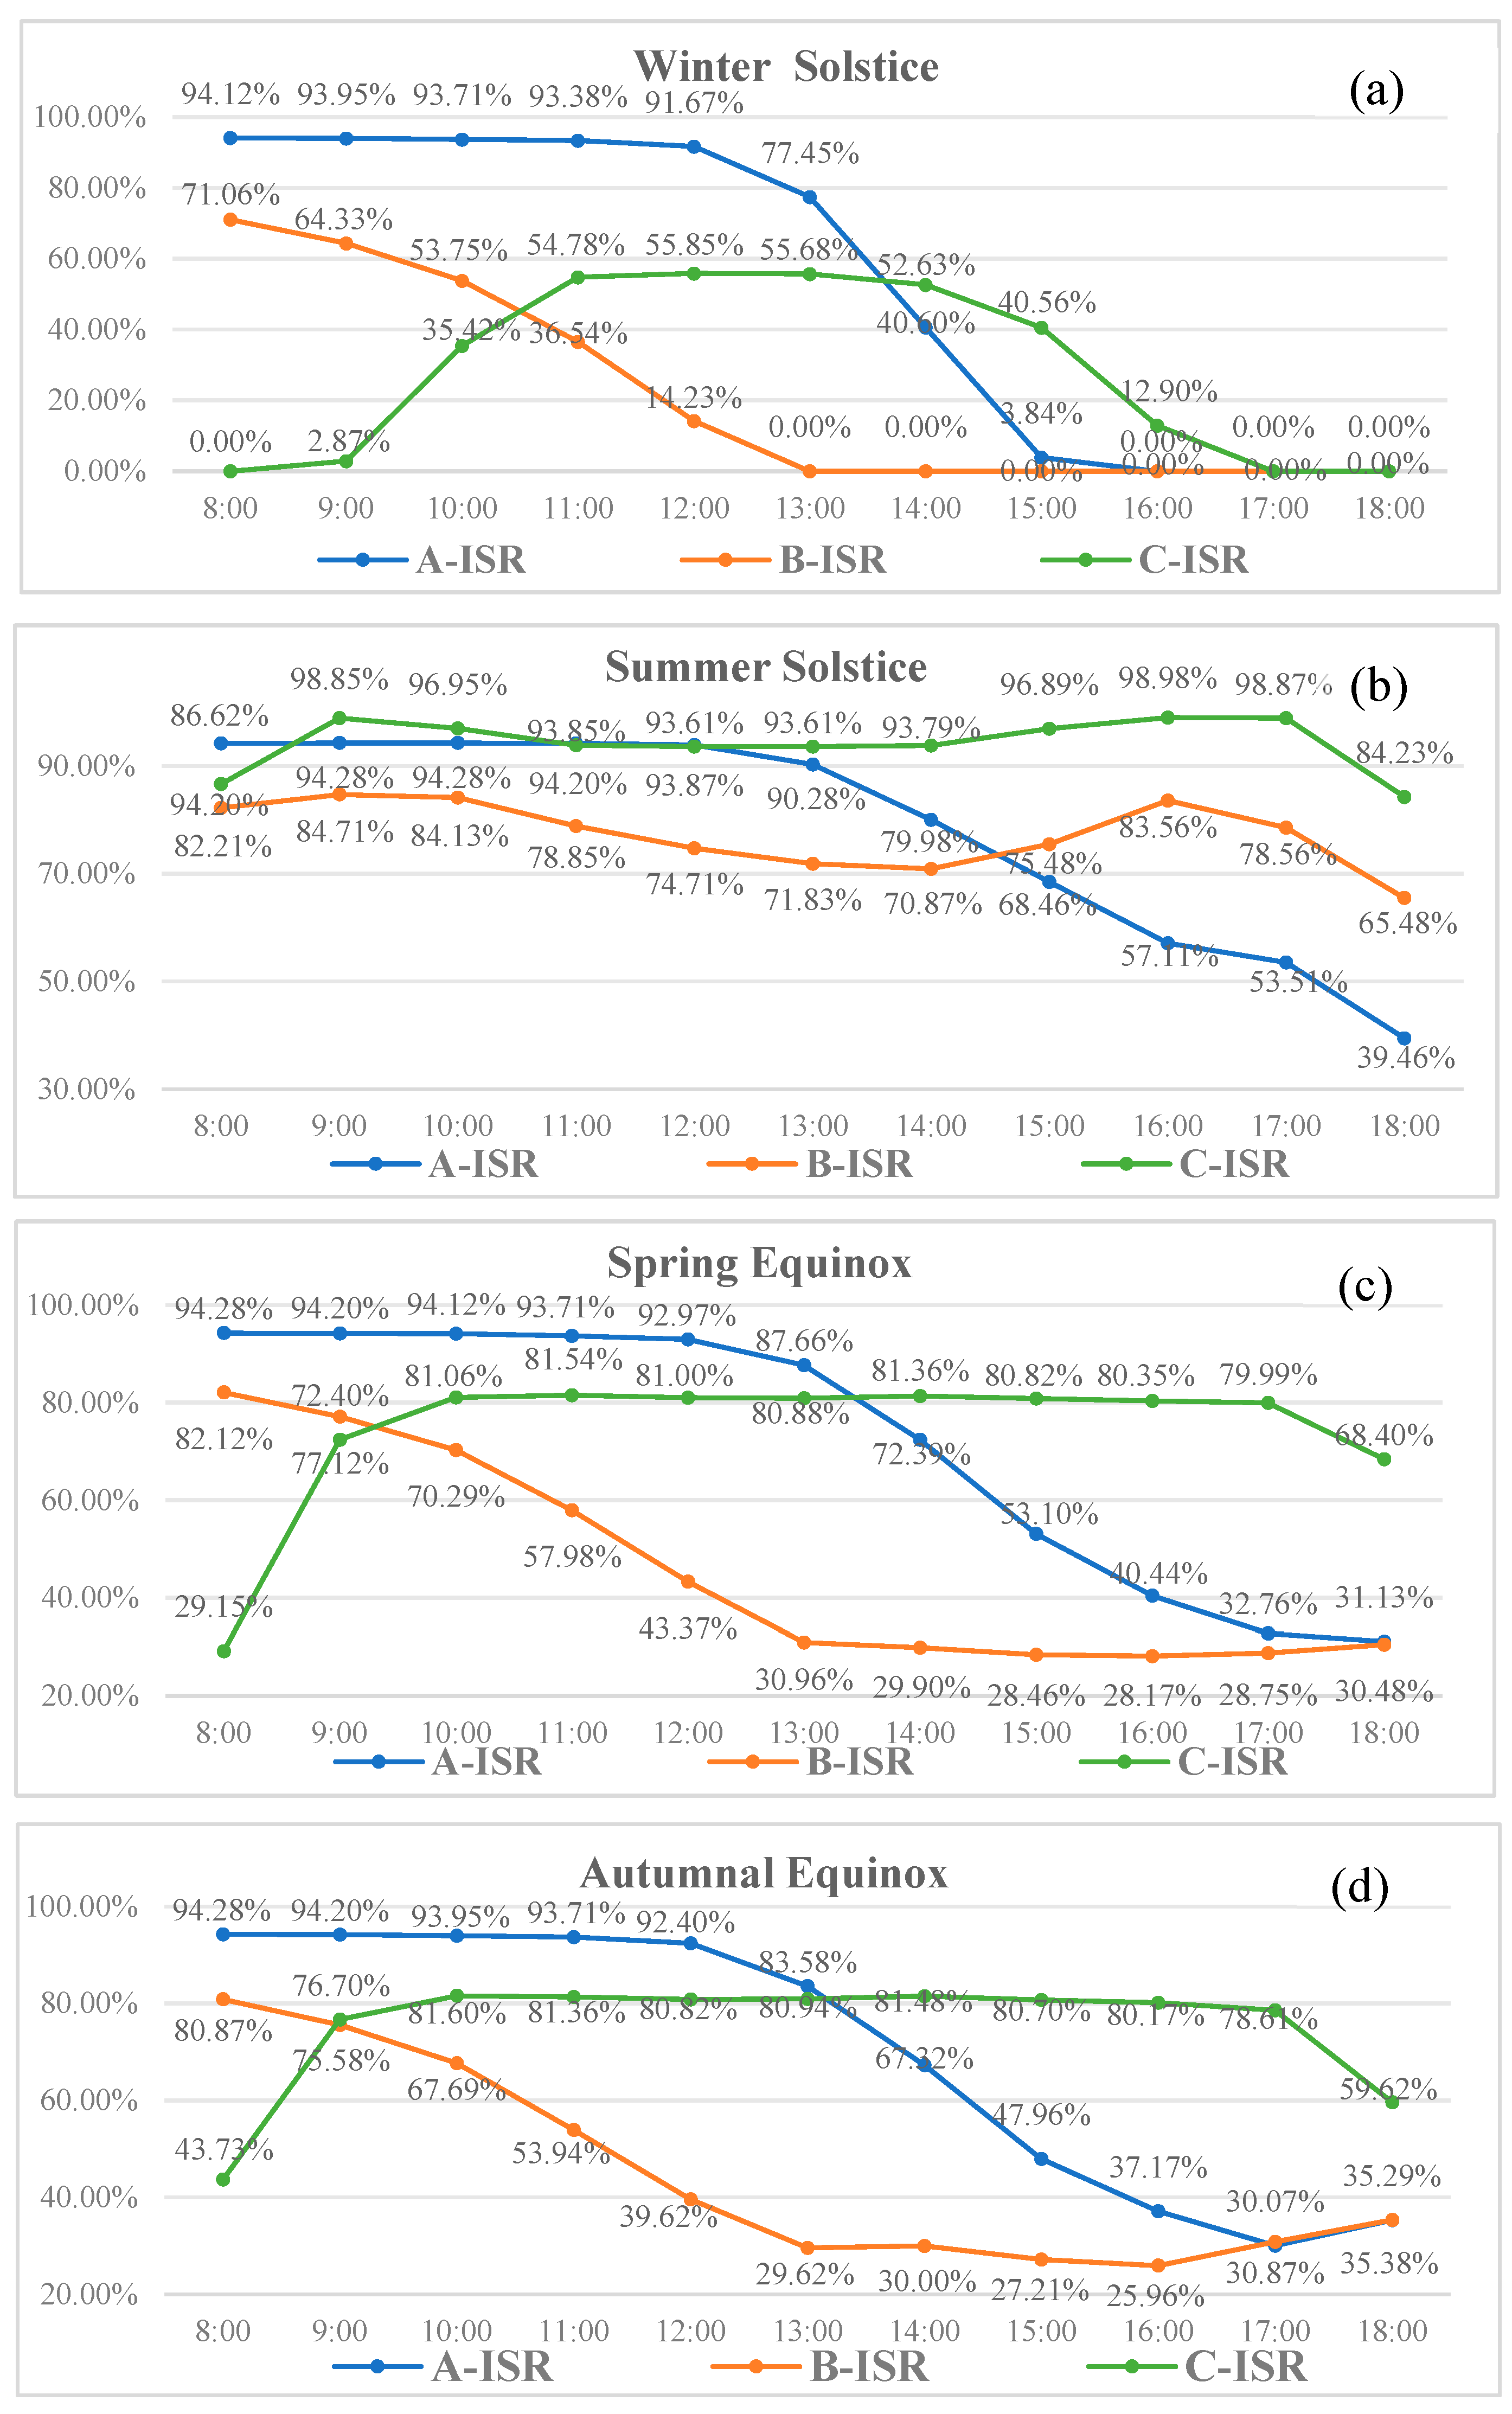
3.3.1. Simulated ISR
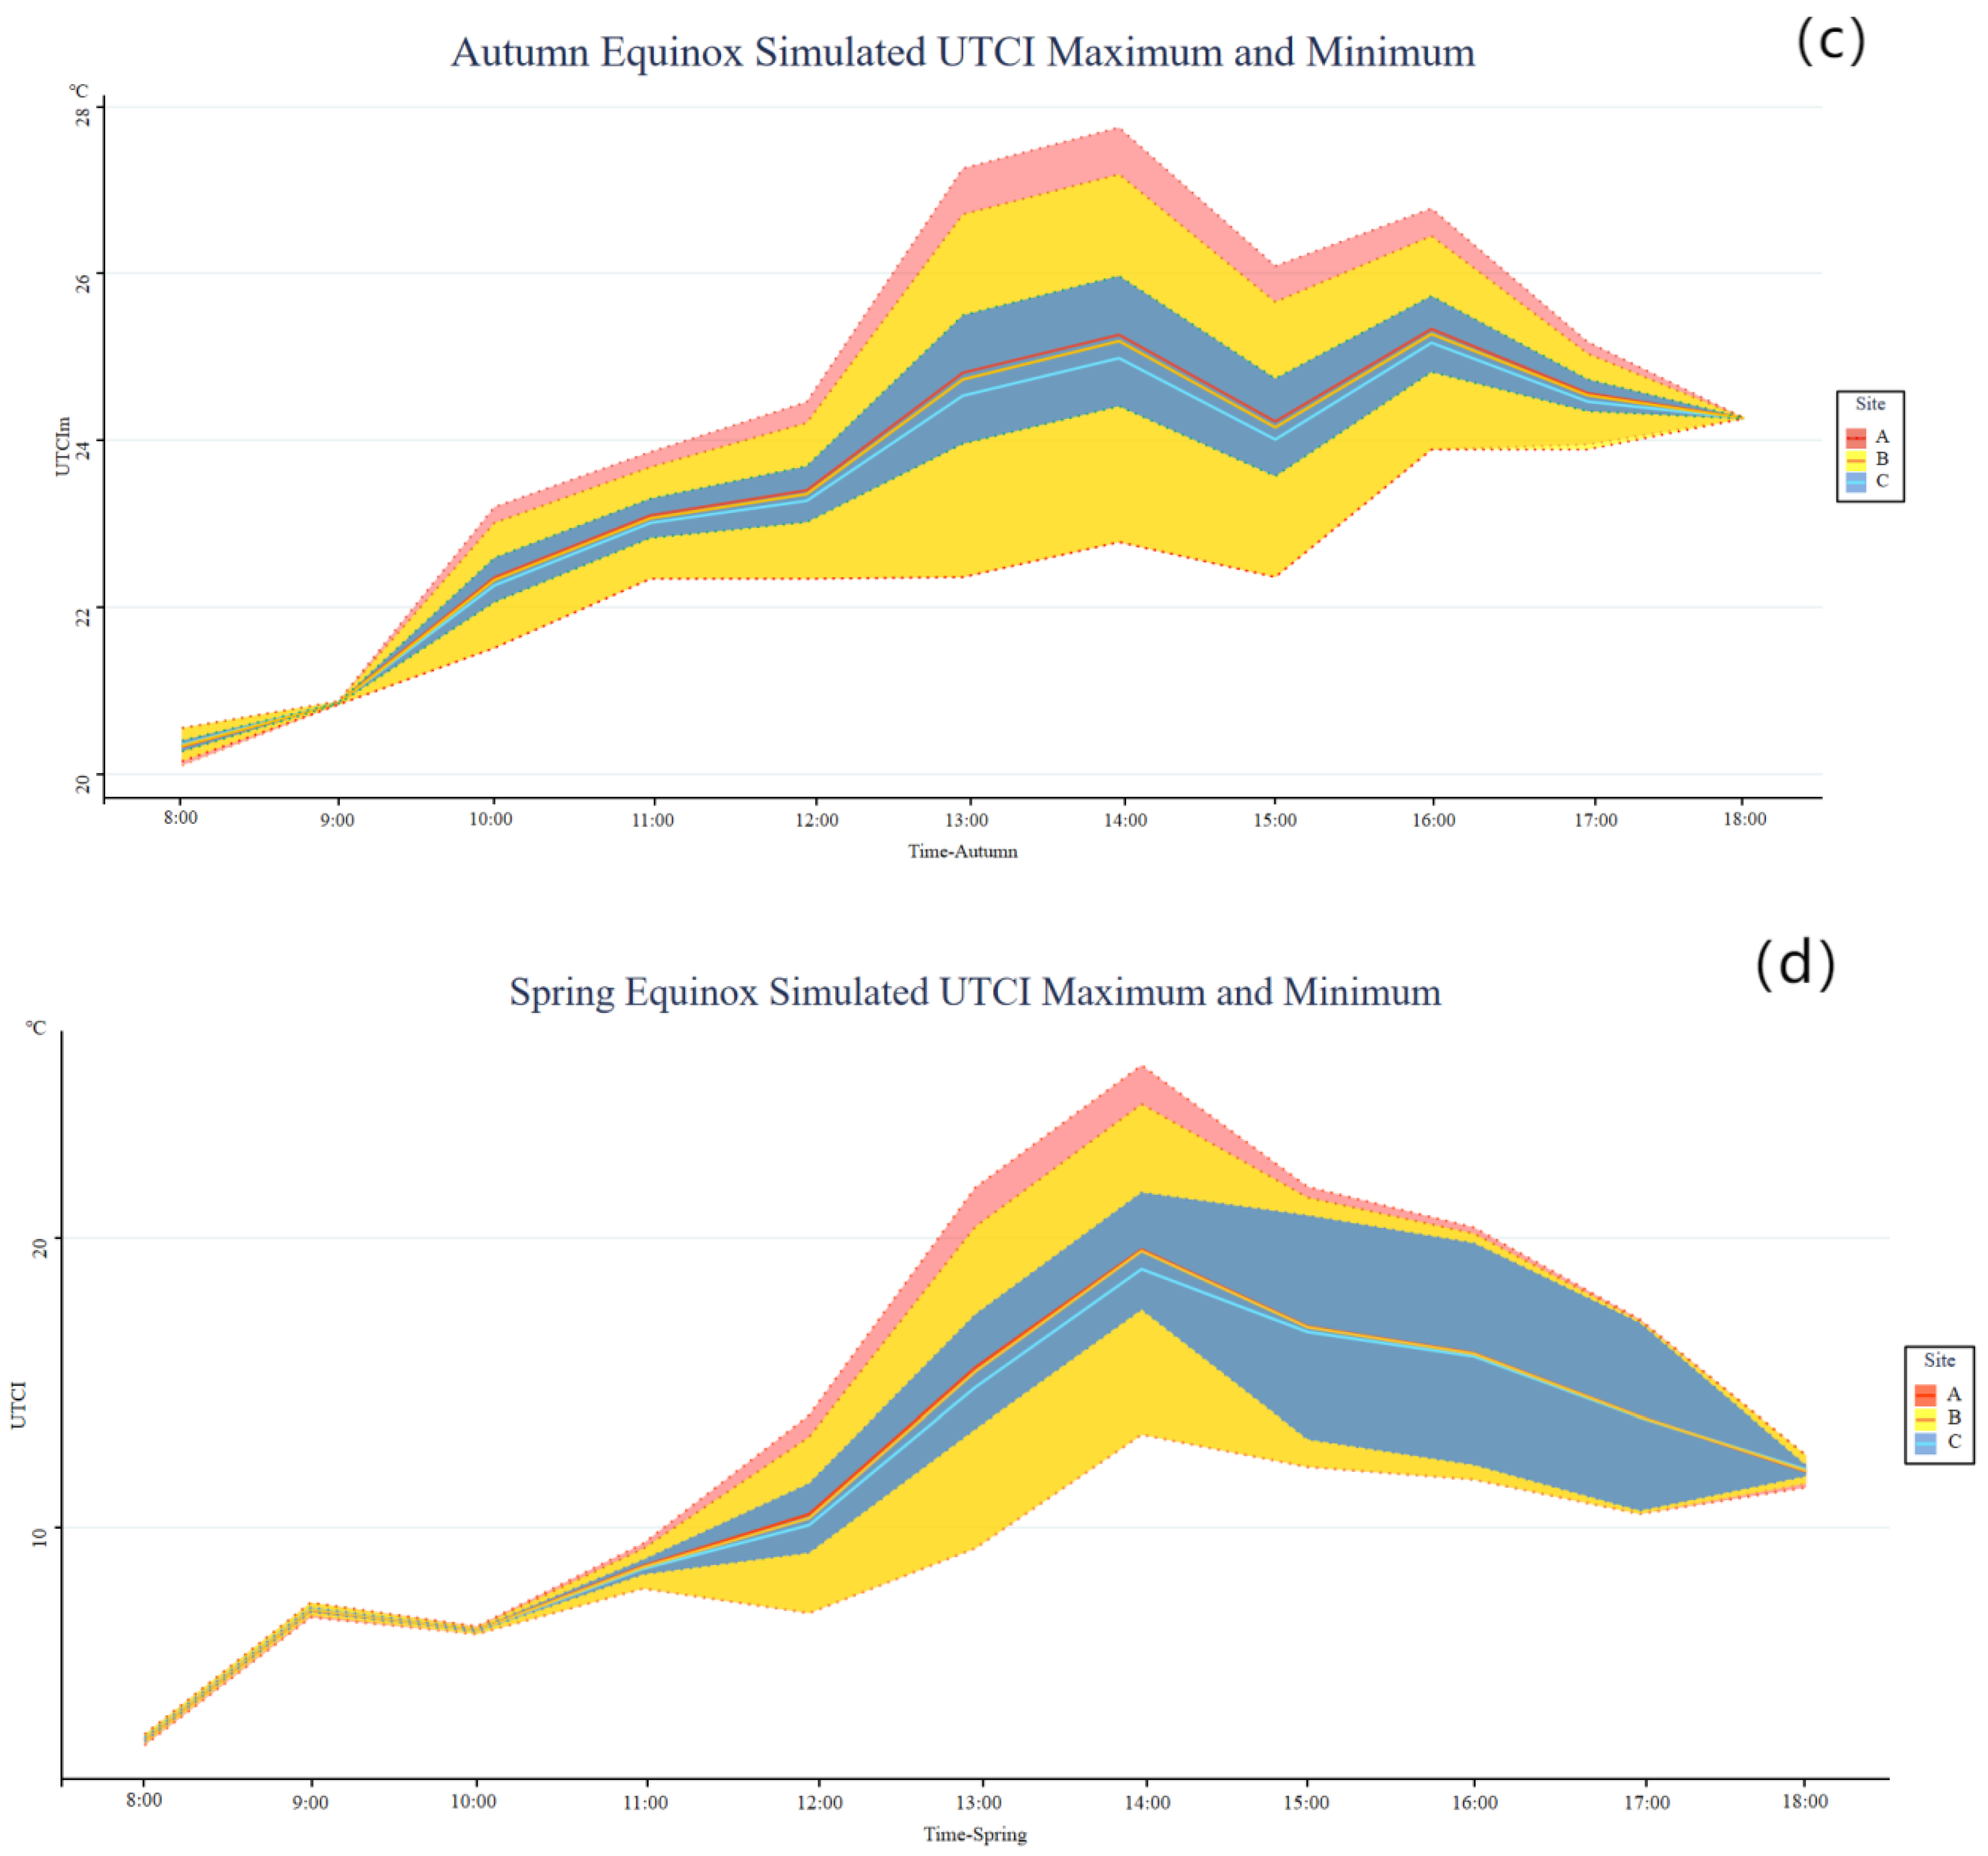
3.3.2. Simulated UTCI
- (1)
- Comparison of simulated UTCI data
- (2)
- Results and Analysis
3.4. Workflow Efficiency Comparison
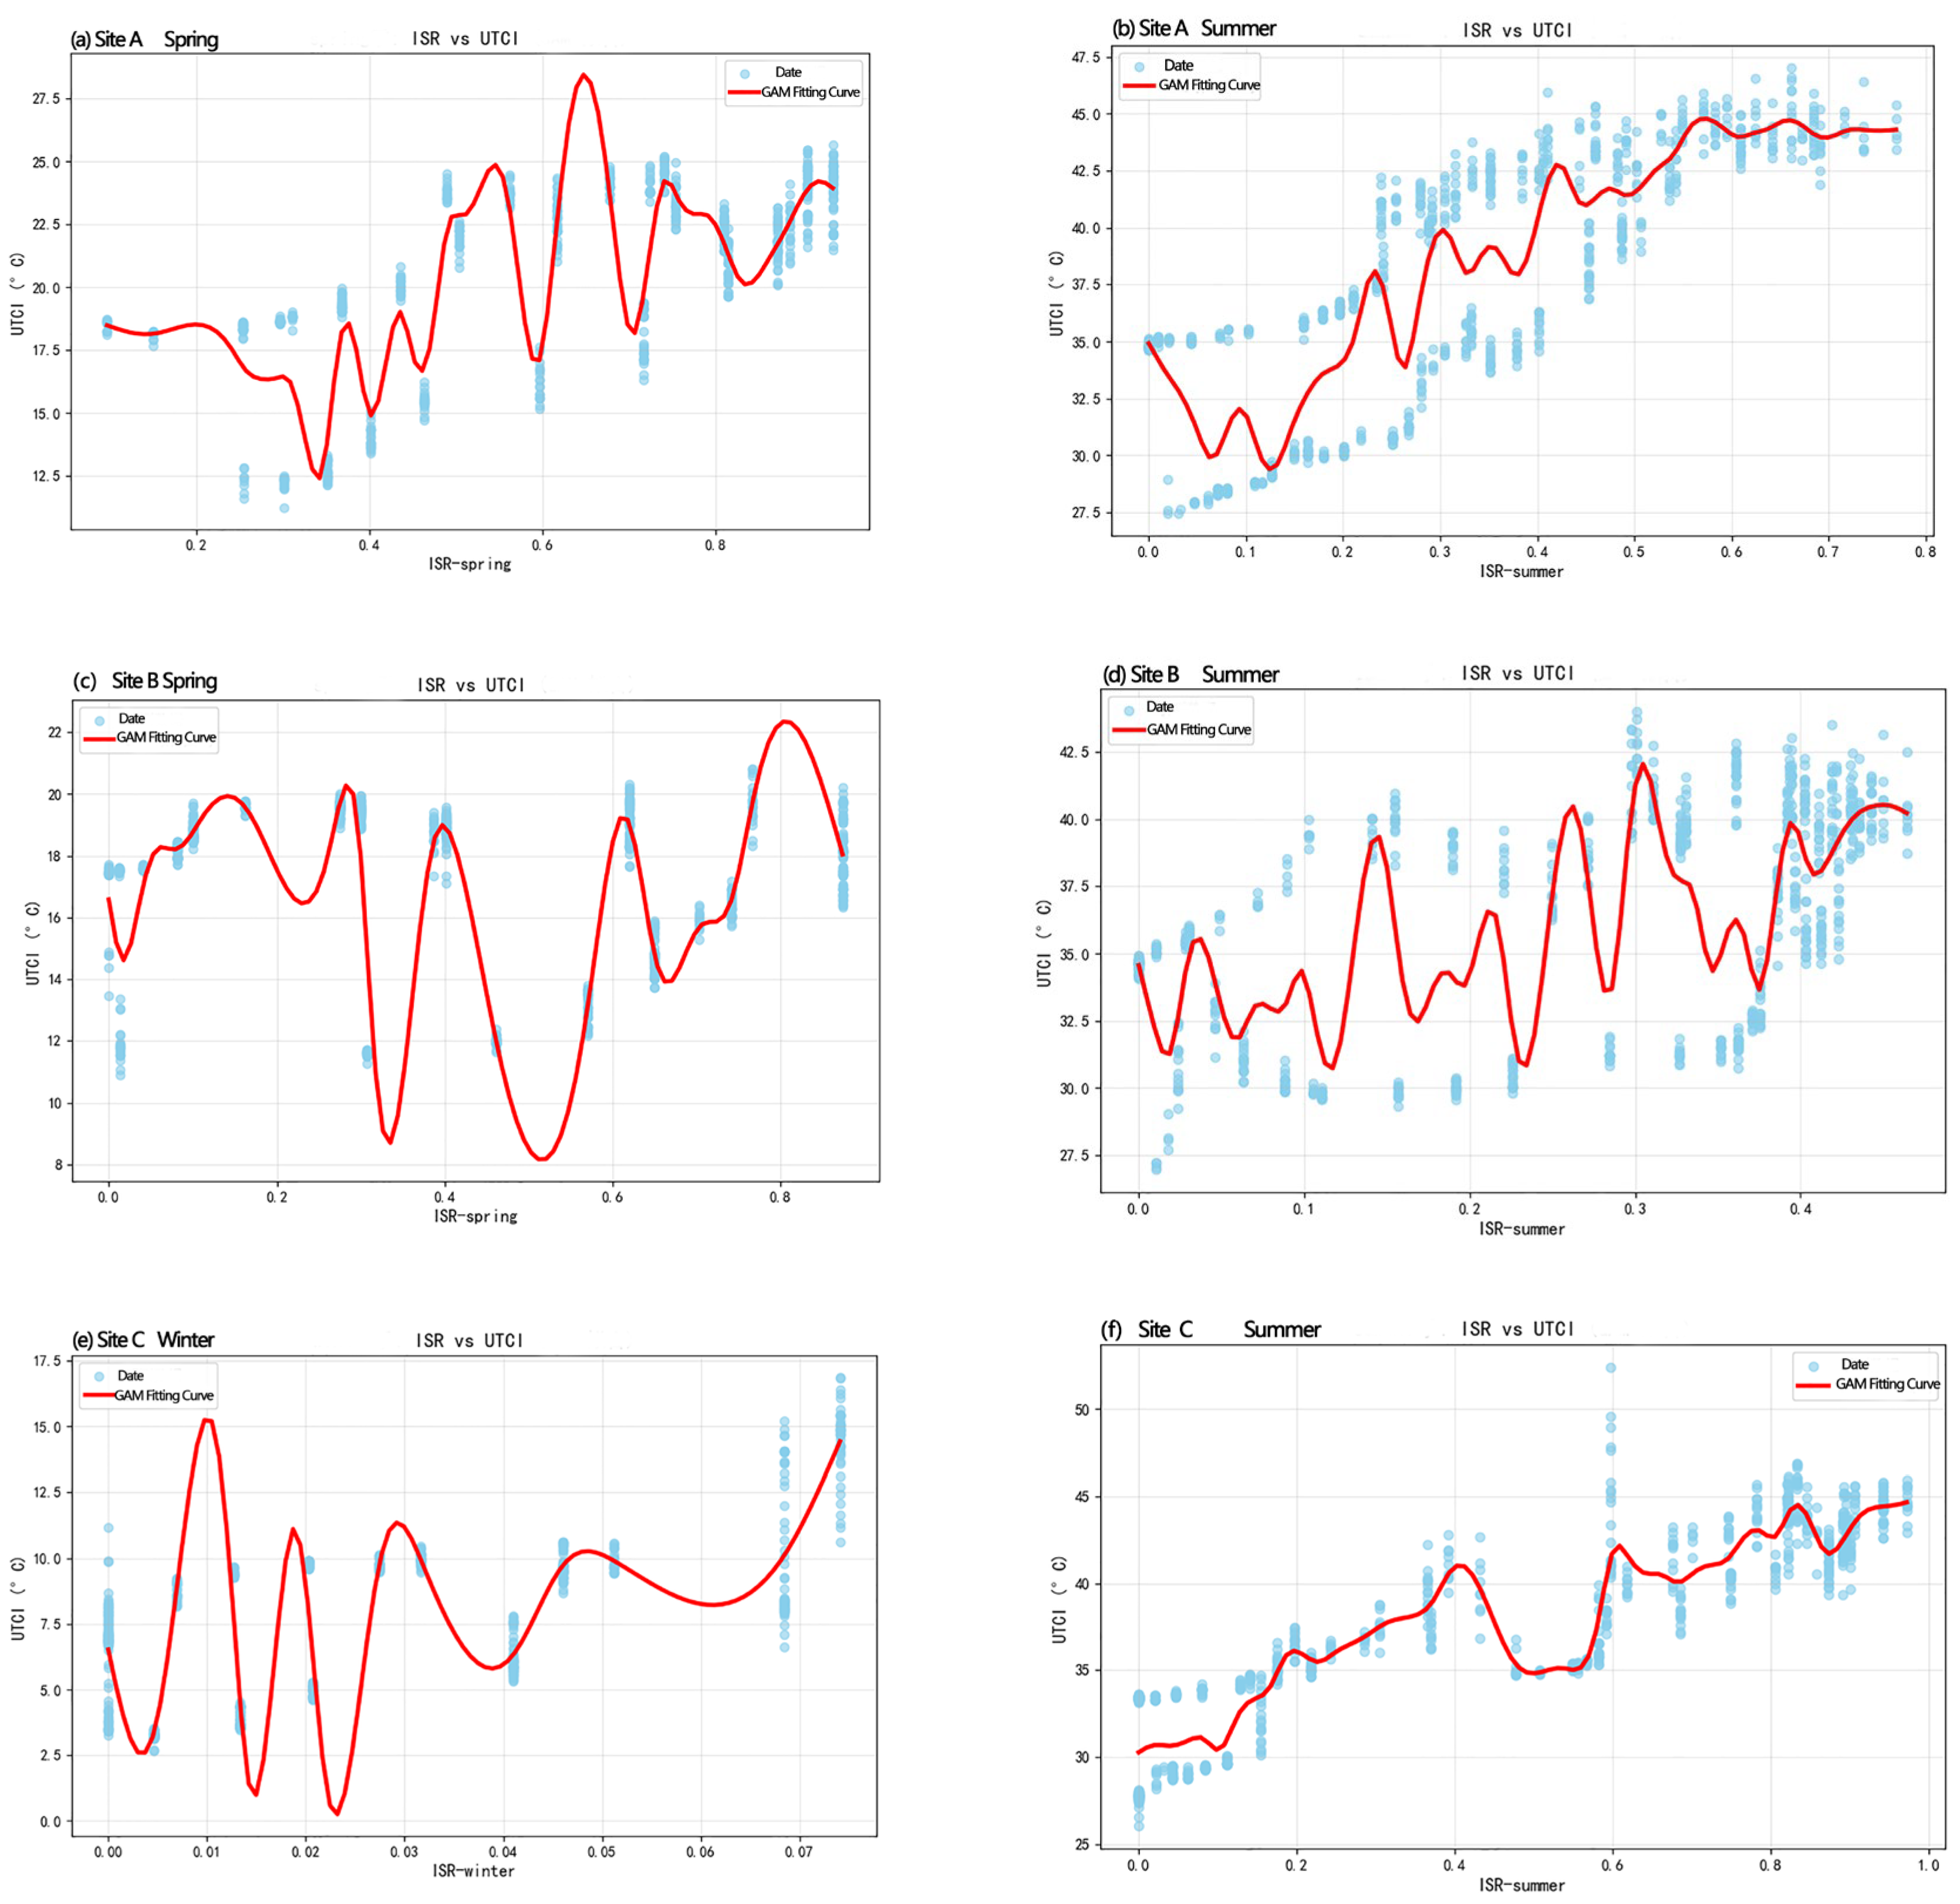
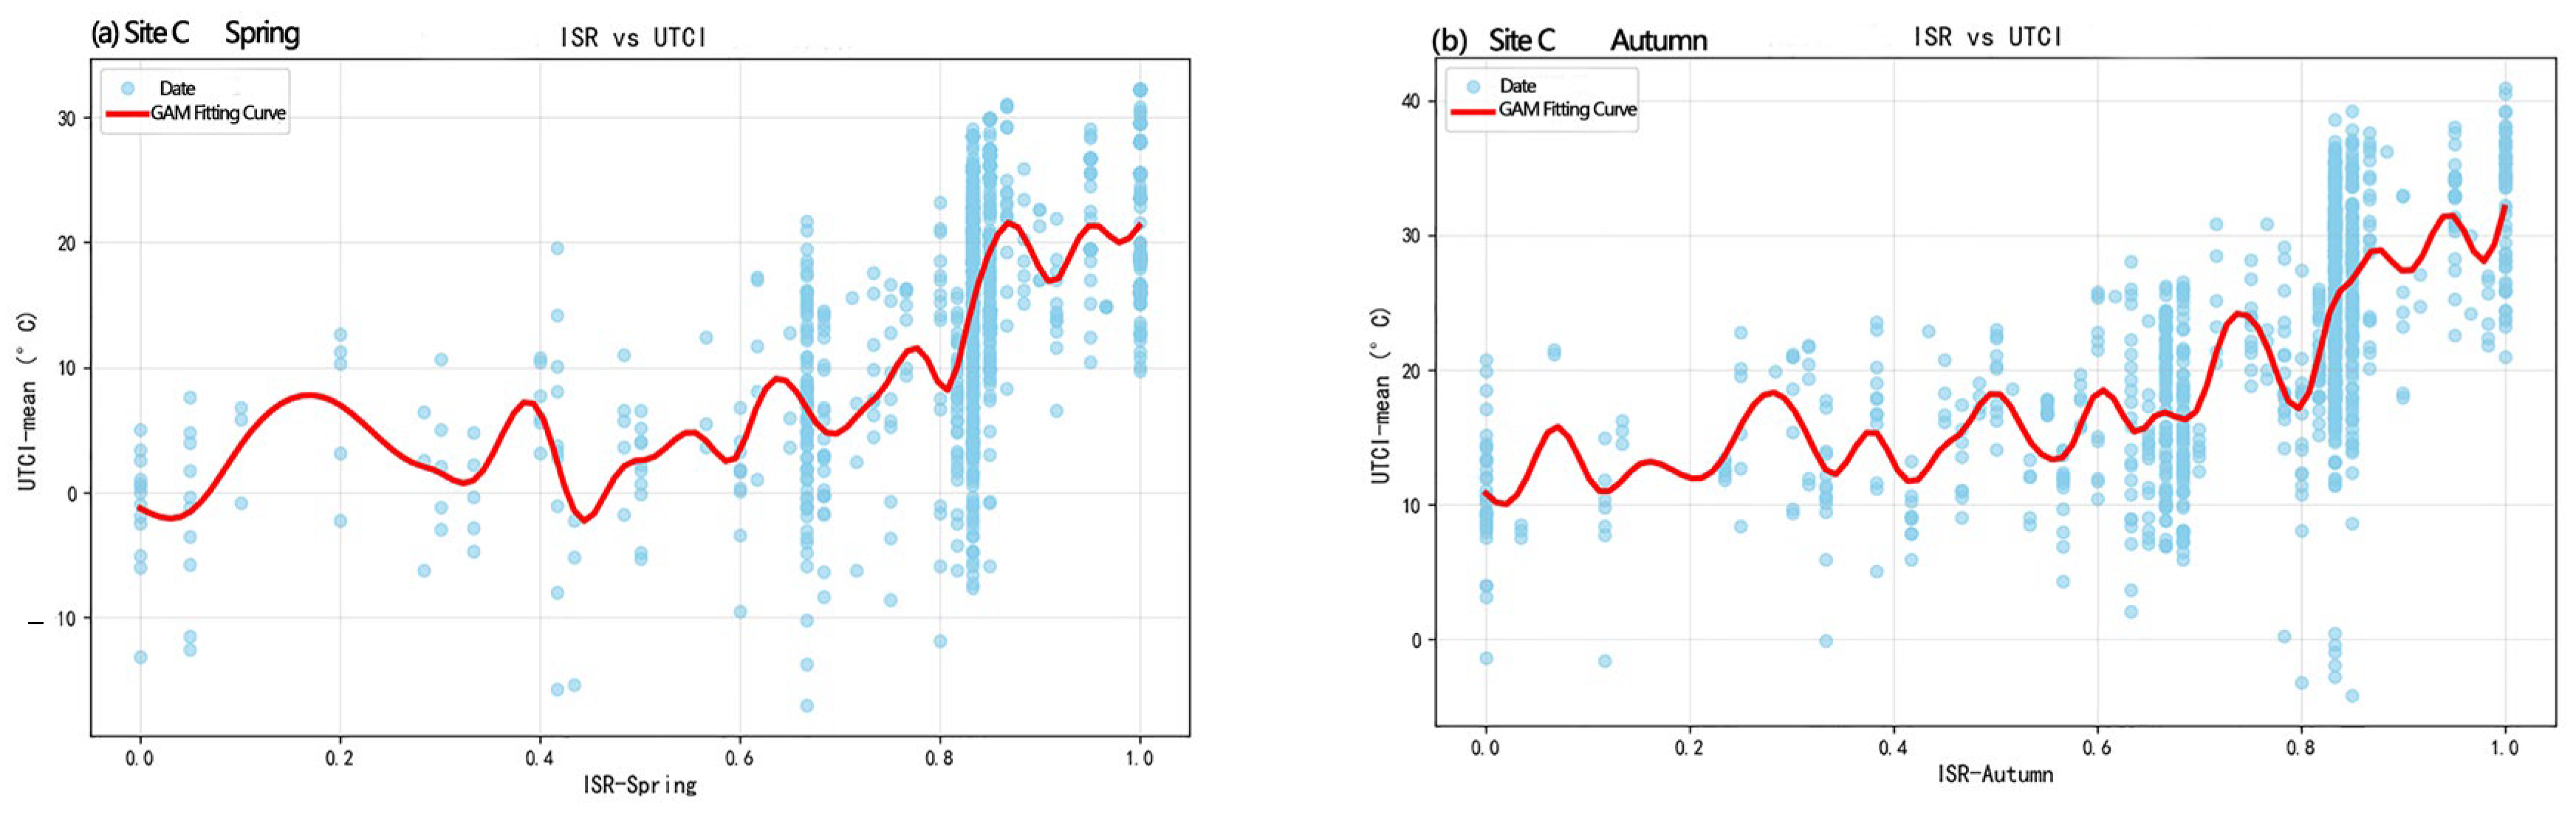
3.5. Correlation Analysis Between Simulated ISR and UTCI
3.6. Sensitivity Analysis Between Simulated ISR and UTCI Values
4. Discussion
4.1. Effect of ISR Variation on the UTCI
4.2. Reasons for Differences Between Measured Data and Simulated Data
- (1)
- Nonlinear relationships: The relationship between ISR and thermal comfort is not strictly linear. For instance, excessive solar exposure can increase discomfort in high-temperature seasons, while enhancing comfort in colder seasons. This suggests that the relationship between thermal comfort and ISR is complex, influenced by multiple factors such as season, wind speed, and humidity.
- (2)
- Localized microclimate effects: Factors such as the built environment, vegetation coverage, and surface materials can alter local microclimatic conditions, affecting thermal comfort. Even with the same ISR, variations in material thermal properties (e.g., absorption and reflectivity) can lead to differing surface temperatures, causing deviations in measured results.
- (3)
- Real-world complexity vs. idealized models: Real-world sites often involve numerous interacting factors not accounted for in idealized models. While the simulation primarily considers building-induced shadowing effects, real environments introduce additional uncertainties and overlapping variables, leading to deviations from predicted outcomes.
4.3. Data-Driven ISR Threshold Determination
- (1)
- Measured ISR Threshold Patterns
- (2)
- Simulated ISR Threshold Patterns
4.4. Practical Implementation of ISR Thresholds
5. Conclusions
5.1. Limitations
- (a)
- Data Acquisition Constraints in Complex Urban Environments
- (b)
- Geographic Impact ISR Thresholds
- (c)
- Mono-Variable Model Simplification
- (d)
- Lag Effects between Shading and Thermal Comfort Perception
5.2. Key Findings
- (1)
- Analytical results of the measured data:
- ➀
- A correlation between the ISR and the UTCI was observed across different sites, and it was validated using SPSS based on measured ISR and UTCI data from the actual residential area. The degree of correlation varied among the three sites. Site A and site B exhibited stronger positive correlations, while site C demonstrated a weaker correlation. An exception was observed during the vernal equinox at site C, where the measured ISR and UTCI data showed a negative correlation. Site C exhibited outliers during the vernal equinox. However, this anomaly is likely influenced by complex environmental factors, making it difficult to attribute the phenomenon to a single cause.
- ➁
- The strength of the correlation between the ISR and the UTCI of site A and site C was significantly higher in the sunlit areas than in the shaded areas; however, at site B, it was higher in the shaded areas than in the sunlit areas. The stronger correlation between ISR and UTCI in shaded areas compared to sunlit areas can be explained by two main factors: environmental factors and measurement point distribution. Shaded areas are more influenced by factors like building layout, vegetation, wind speed, and humidity. For example, vegetation in shaded areas can further cool the environment through transpiration, enhancing the ISR–UTCI correlation. Sunlit areas, less affected by these factors, show a weaker correlation. The placement of measurement points and surrounding shading from buildings or vegetation can amplify the impact of ISR on UTCI in shaded areas, especially when these areas are heavily obstructed or influenced by microclimatic conditions. Therefore, this demonstrates that shaded areas are more sensitive to environmental and microclimatic interactions than sunlit areas.
- (2)
- Analytical results of the simulation date:
- ➀
- The ISRs of site A on the four typical solar term days showed negative correlations with the UTCI, of different degrees.
- ➁
- The ISRs of site B showed positive correlations with the UTCI on the spring and autumn equinoxes and negative correlations on the winter and summer solstices.
- ➂
- The ISRs of site C on the four typical solar term days showed positive correlations with the UTCI, of different degrees.
- ➃
- The magnitude of the ISR variations had a direct impact on the range of outdoor thermal comfort fluctuations. As the ISR differences increased, the UTCI fluctuations became more pronounced, suggesting ISR as a potentially key factor in shaping the thermal environment of outdoor spaces.
5.3. Contributions
- (1)
- Theoretical Innovation: We propose the ISR as a novel morphometric index that quantifies solar shade dynamics and their nonlinear coupling with UTCI-based thermal comfort. This metric establishes an intuitive visualization framework linking shadow coverage (0–1 normalized) to physiological heat stress thresholds (9–26 °C UTCI).
- (2)
- Design Praxis Transformation: The ISR enables direct conversion of thermal comfort requirements into implementable shade design parameters and reduces the technical threshold of thermal environment optimization.
- (3)
- Build A New Research Pathway: We establish a dynamic solar exposure analysis framework that integrates field microclimate measurements and simulated data with GAM-based threshold modeling. Although the present study focuses on Xi’an, the ISR computation protocol—grounded in local solar trajectories and parametric solar–shadow modeling—is directly transferable to other cold-region contexts.
Author Contributions
Funding
Data Availability Statement
Acknowledgments
Conflicts of Interest
Appendix A

| 22 December 2022 | Panoramic Picture |
|---|---|
| 8:00–10:00 | 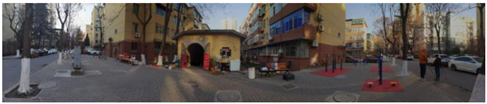 |
| 12:00–14:00 | 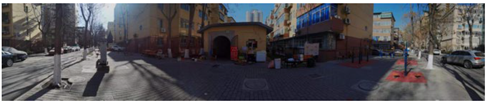 |
| 16:00–18:00 | 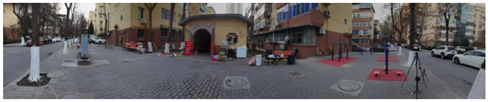 |
| 21 March 2023 | Panoramic Picture |
|---|---|
| 8:00–10:00 | 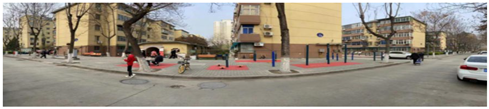 |
| 12:00–14:00 |  |
| 16:00–18:00 |  |
| 22 June 2023 | Panoramic Picture |
|---|---|
| 8:00–10:00 | 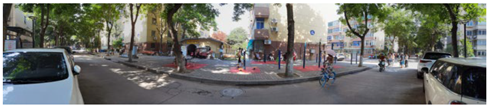 |
| 12:00–14:00 |  |
| 16:00–18:00 | 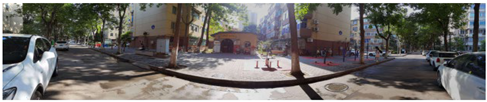 |
| Time | Winter Solstice | Spring Equinox | Summer Solstice | Autumnal Equinox | |
|---|---|---|---|---|---|
| Site A | 8:00 | 0.941 | 0.943 | 0.942 | 0.943 |
| 9:00 | 0.940 | 0.942 | 0.943 | 0.942 | |
| 10:00 | 0.937 | 0.941 | 0.943 | 0.940 | |
| 11:00 | 0.934 | 0.937 | 0.942 | 0.937 | |
| 12:00 | 0.917 | 0.930 | 0.939 | 0.924 | |
| 13:00 | 0.775 | 0.877 | 0.903 | 0.836 | |
| 14:00 | 0.406 | 0.724 | 0.800 | 0.673 | |
| 15:00 | 0.038 | 0.531 | 0.685 | 0.480 | |
| 16:00 | 0.000 | 0.404 | 0.571 | 0.372 | |
| 17:00 | 0.000 | 0.328 | 0.535 | 0.301 | |
| 18:00 | 0.000 | 0.311 | 0.395 | 0.353 | |
| Site B | 8:00 | 0.711 | 0.821 | 0.822 | 0.809 |
| 9:00 | 0.643 | 0.771 | 0.847 | 0.756 | |
| 10:00 | 0.538 | 0.703 | 0.841 | 0.677 | |
| 11:00 | 0.365 | 0.580 | 0.788 | 0.539 | |
| 12:00 | 0.142 | 0.434 | 0.747 | 0.396 | |
| 13:00 | 0.000 | 0.310 | 0.718 | 0.296 | |
| 14:00 | 0.000 | 0.299 | 0.709 | 0.300 | |
| 15:00 | 0.000 | 0.285 | 0.755 | 0.272 | |
| 16:00 | 0.000 | 0.282 | 0.836 | 0.260 | |
| 17:00 | 0.000 | 0.288 | 0.786 | 0.309 | |
| 18:00 | 0.000 | 0.305 | 0.655 | 0.354 | |
| Site C | 8:00 | 0.000 | 0.292 | 0.866 | 0.437 |
| 9:00 | 0.029 | 0.724 | 0.988 | 0.767 | |
| 10:00 | 0.354 | 0.811 | 0.970 | 0.816 | |
| 11:00 | 0.548 | 0.815 | 0.938 | 0.814 | |
| 12:00 | 0.559 | 0.810 | 0.936 | 0.808 | |
| 13:00 | 0.557 | 0.809 | 0.936 | 0.809 | |
| 14:00 | 0.526 | 0.814 | 0.938 | 0.815 | |
| 15:00 | 0.406 | 0.808 | 0.969 | 0.807 | |
| 16:00 | 0.129 | 0.803 | 0.990 | 0.802 |
| Time | Winter Solstice | Spring Equinox | Summer Solstice | Autumnal Equinox | ||||
|---|---|---|---|---|---|---|---|---|
| Min | Max | Min | Max | Min | Max | Min | Max | |
| 8:00 | −1.1 | 0.16 | 2.43 | 2.81 | 18.92 | 21.57 | 20.1 | 20.55 |
| 9:00 | −0.99 | 0.02 | 6.87 | 7.38 | 23.08 | 28 | 20.83 | 20.87 |
| 10:00 | −0.07 | 0.41 | 6.29 | 6.56 | 23.19 | 29.54 | 21.51 | 23.2 |
| 11:00 | −2.45 | −2.09 | 7.87 | 9.43 | 25.16 | 31.62 | 22.34 | 23.86 |
| 12:00 | 1.3 | 3.55 | 7.02 | 13.88 | 26.12 | 33.32 | 22.34 | 24.46 |
| 13:00 | −1.28 | 2.23 | 9.27 | 21.77 | 27.45 | 34.01 | 22.36 | 27.26 |
| 14:00 | 3.1 | 7.14 | 13.21 | 26.01 | 28.32 | 34.19 | 22.78 | 27.75 |
| 15:00 | 4.07 | 6.8 | 12.09 | 21.79 | 29.81 | 36.14 | 22.36 | 26.09 |
| 16:00 | 1.04 | 2.71 | 11.65 | 20.38 | 30.87 | 37.73 | 23.89 | 26.78 |
| 17:00 | 3.73 | 3.81 | 10.46 | 17.19 | 32.09 | 38.09 | 23.95 | 25.18 |
| 18:00 | 2.98 | 4.44 | 11.38 | 12.49 | 32.21 | 36.79 | 24.26 | 24.27 |
| Time | Winter Solstice | Spring Equinox | Summer Solstice | Autumnal Equinox | ||||
|---|---|---|---|---|---|---|---|---|
| Min | Max | Min | Max | Min | Max | Min | Max | |
| 8:00 | −0.95 | 0.16 | 2.48 | 2.81 | 18.92 | 21.3 | 20.15 | 20.55 |
| 9:00 | −0.88 | 0.02 | 6.93 | 7.38 | 23.08 | 27.66 | 20.83 | 20.87 |
| 10:00 | −0.02 | 0.41 | 6.29 | 6.53 | 23.19 | 29.18 | 21.51 | 23.01 |
| 11:00 | −2.45 | −2.13 | 7.87 | 9.25 | 25.16 | 31.26 | 22.34 | 23.68 |
| 12:00 | 1.3 | 3.29 | 7.02 | 13.13 | 26.12 | 32.84 | 22.34 | 24.21 |
| 13:00 | −1.28 | 1.82 | 9.27 | 20.41 | 27.45 | 33.57 | 22.36 | 26.71 |
| 14:00 | 3.1 | 6.66 | 13.21 | 24.66 | 28.32 | 33.88 | 22.78 | 27.19 |
| 15:00 | 4.07 | 6.49 | 12.09 | 21.42 | 29.81 | 35.87 | 22.36 | 25.66 |
| 16:00 | 1.04 | 2.52 | 11.65 | 20.17 | 30.87 | 37.49 | 23.89 | 26.45 |
| 17:00 | 3.73 | 3.8 | 10.46 | 17.14 | 32.09 | 38 | 23.89 | 25.04 |
| 18:00 | 3.15 | 4.44 | 11.51 | 12.49 | 32.21 | 36.78 | 24.26 | 24.27 |
| Time | Winter Solstice | Spring Equinox | Summer Solstice | Autumnal Equinox | ||||
|---|---|---|---|---|---|---|---|---|
| Min | Max | Min | Max | Min | Max | Min | Max | |
| 8:00 | −0.63 | −0.24 | 2.57 | 2.69 | 19.94 | 20.7 | 20.27 | 20.4 |
| 9:00 | −0.62 | −0.31 | 7.06 | 7.21 | 25.99 | 26.92 | 20.84 | 20.85 |
| 10:00 | 0.1 | 0.25 | 6.38 | 6.46 | 27.36 | 28.37 | 22.06 | 22.59 |
| 11:00 | −2.34 | −2.22 | 8.37 | 8.86 | 29.48 | 30.47 | 22.83 | 23.3 |
| 12:00 | 2.02 | 2.72 | 9.12 | 11.51 | 30.49 | 31.8 | 23.02 | 23.69 |
| 13:00 | −0.16 | 0.93 | 13.41 | 17.36 | 31.4 | 32.61 | 23.96 | 25.5 |
| 14:00 | 4.39 | 5.65 | 17.54 | 21.59 | 32.36 | 33.2 | 24.41 | 25.97 |
| 15:00 | 4.94 | 5.8 | 13.05 | 20.79 | 34.55 | 35.28 | 23.57 | 24.74 |
| 16:00 | 1.58 | 2.1 | 12.17 | 19.83 | 36.33 | 36.97 | 24.82 | 25.73 |
| 17:00 | 3.75 | 3.78 | 10.58 | 17.06 | 37.55 | 37.8 | 24.35 | 24.73 |
| 18:00 | 3.52 | 3.97 | 11.78 | 12.13 | 32.27 | 36.75 | 24.26 | 24.27 |
References
- Huo, K.; Qin, R.; Zhao, J.; Ma, X. Long-Term Tracking of Urban Structure and Analysis of Its Impact on Urban Heat Stress: A Case Study of Xi’an, China. Ecol. Indic. 2025, 174, 113418. [Google Scholar] [CrossRef]
- Morganti, M.; Salvati, A.; Coch, H.; Cecere, C. Urban Morphology Indicators for Solar Energy Analysis. Energy Procedia 2017, 134, 807–814. [Google Scholar] [CrossRef]
- Open Knowledge Maps. Knowledge Map for Research on Outdoor Thermal Comfort in Shaded Areas. 11 June 2024. Available online: https://openknowledgemaps.org/map/b898def6d0ee7b3ff345d7fdfa13fb5c (accessed on 4 June 2024).
- Lai, D.; Liu, W.; Gan, T.; Liu, K.; Chen, Q. A Review of Mitigating Strategies to Improve the Thermal Environment and Thermal Comfort in Urban Outdoor Spaces. Sci. Total Environ. 2019, 661, 337–353. [Google Scholar] [CrossRef]
- Elnabawi, M.H.; Jamei, E. The thermal perception of outdoor urban spaces in a hot arid climate: A structural equation modelling (SEM) approach. Urban Clim. 2024, 55, 101969. [Google Scholar] [CrossRef]
- Jänicke, B.; Milošević, D.; Manavvi, S. Review of User-Friendly Models to Improve the Urban Micro-Climate. Atmosphere 2021, 12, 1291. [Google Scholar] [CrossRef]
- Lau, K.K.-L.; Lindberg, F.; Rayner, D.; Thorsson, S. The Effect of Urban Geometry on Mean Radiant Temperature under Future Climate Change: A Study of Three European Cities. Int. J. Biometeorol. 2015, 59, 799–814. [Google Scholar] [CrossRef]
- Li, J. A Theory and Method of Solar Adaptive Urban Design. Ph.D. Thesis, Southeast University, Nanjing, China, 2019. Available online: https://kns.cnki.net/kcms2/article/abstract (accessed on 8 June 2024).
- Compagnon, R. Solar and Daylight Availability in the Urban Fabric. Energy Build. 2004, 36, 321–328. [Google Scholar] [CrossRef]
- Salata, F.; Golasi, I.; de Lieto Vollaro, R.; de Lieto Vollaro, A. Urban Microclimate and Outdoor Thermal Comfort. A Proper Procedure to Fit ENVI-Met Simulation Outputs to Experimental Data. Sustain. Cities Soc. 2016, 26, 318–343. [Google Scholar] [CrossRef]
- Acero, J.A.; Koh, E.J.Y.; Tan, Y.S.; Leslie; Norford, K. Quantifying the Effect of Building Shadowing and Cloudiness on Mean Radiant Temperature in Singapore. Atmosphere 2021, 12, 1012. [Google Scholar] [CrossRef]
- Wang, M.; Gou, Z. Gaussian Mixture Model Based Classification for Analyzing Longitudinal Outdoor Thermal Environment Data to Evaluate Comfort Conditions in Urban Open Spaces. Urban Clim. 2024, 53, 101792. [Google Scholar] [CrossRef]
- Huang, T.; Li, J.; Xie, Y.; Niu, J.; Mak, C.M. Simultaneous Environmental Parameter Monitoring and Human Subject Survey Regarding Outdoor Thermal Comfort and Its Modelling. Build. Environ. 2017, 125, 502–514. [Google Scholar] [CrossRef]
- Johansson, E.; Emmanuel, R. The Influence of Urban Design on Outdoor Thermal Comfort in the Hot, Humid City of Colombo, Sri Lanka. Int. J. Biometeorol. 2006, 51, 119–133. [Google Scholar] [CrossRef] [PubMed]
- Song, Z.; Wang, Y.; Li, J.; Liu, T.; Li, Y. How Building Arrangements Can Improve Outdoor Thermal Comfort and Indoor Sunlight? Proc. Inst. Civ. Eng.—Munic. Eng. 2024, 177, 111–129. [Google Scholar] [CrossRef]
- Liu, Z.; Li, J.; Xi, T. A Review of Thermal Comfort Evaluation and Improvement in Urban Outdoor Spaces. Buildings 2023, 13, 3050. [Google Scholar] [CrossRef]
- Costa, I.T.; Wollmann, C.A.; Writzl, L.; Iensse, A.C.; da Silva, A.N.; de Freitas Baumhardt, O.; Gobo, J.P.A.; Shooshtarian, S.; Matzarakis, A. A Systematic Review on Human Thermal Comfort and Methodologies for Evaluating Urban Morphology in Outdoor Spaces. Climate 2024, 12, 30. [Google Scholar] [CrossRef]
- Han, Y.; Jo, Y.; Kim, E.J. Influence of Landscape Interventions on Thermal Comfort under Time-Varying Building Shadow; New Gwanghwamun Square Case, Seoul, South Korea. Heliyon 2023, 9, e19436. [Google Scholar] [CrossRef]
- Liu, B.; Liu, Y.; Cho, S.; Chow, D.H.C. Urban Morphology Indicators and Solar Radiation Acquisition: 2011–2022 Review. Renew. Sustain. Energy Rev. 2024, 199, 114548. [Google Scholar] [CrossRef]
- Nouri, A.S.; Costa, J.P.; Matzarakis, A. Examining Default Urban-Aspect-Ratios and Sky-View-Factors to Identify Priorities for Thermal-Sensitive Public Space Design in Hot-Summer Mediterranean Climates: The Lisbon Case. Build. Environ. 2017, 126, 442–456. [Google Scholar] [CrossRef]
- Miao, C.; Yu, S.; Hu, Y.; Zhang, H.; He, X.; Chen, W. Review of Methods Used to Estimate the Sky View Factor in Urban Street Canyons. Build. Environ. 2020, 168, 106497. [Google Scholar] [CrossRef]
- Watson, I.D.; Johnson, G.T. Graphical Estimation of Sky View-Factors in Urban Environments. J. Climatol. 1987, 7, 193–197. [Google Scholar] [CrossRef]
- Yi, P.; Liu, L.; Huang, Y.; Zhang, M.; Liu, H.; Bedra, K.B. Study on the Coupling Relationship between Thermal Comfort and Urban Center Spatial Morphology in Summer. Sustainability 2023, 15, 5084. [Google Scholar] [CrossRef]
- Yan, H.; Zhang, L.; Ding, X.; Zhang, Z.; Qi, Z.; Jiang, L.; Bu, D. Multi-Objective Optimization of Outdoor Thermal Comfort and Sunlight Hours in Elderly Residential Areas: A Case Study of Beijing, China. Buildings 2024, 14, 3770. [Google Scholar] [CrossRef]
- Zhang, M.; You, W.; Qin, Q.; Peng, D.; Hu, Y.; Gao, Z.; Buccolieri, R. Investigation of Typical Residential Block Typologies and Their Impact on Pedestrian-Level Microclimate in Summers in Nanjing, China. Front. Archit. Res. 2022, 11, 278–296. [Google Scholar] [CrossRef]
- Salgado-Conrado, L.; Lopez-Montelongo, A.; Alvarez-Macias, C.; Hernadez-Jaquez, J. Review of Heliodon Developments and Computational Tools for Building Shadow Analysis. Buildings 2022, 12, 627. [Google Scholar] [CrossRef]
- Lin, T.-P.; Matzarakis, A.; Hwang, R.-L. Shading Effect on Long-Term Outdoor Thermal Comfort. Build. Environ. 2010, 45, 213–221. [Google Scholar] [CrossRef]
- Lindberg, F.; Grimmond, C.S.B. Nature of vegetation and building morphology characteristics across a city: Influence on shadow patterns and mean radiant temperatures in London. Urban Ecosyst. 2011, 14, 617–634. [Google Scholar] [CrossRef]
- Memon, R.A.; Chirarattananon, S.; Vangtook, P. Thermal Comfort Assessment and Application of Radiant Cooling: A Case Study. Build. Environ. 2008, 43, 1185–1196. [Google Scholar] [CrossRef]
- de Dear, R.J.; Brager, G.S. Thermal Comfort in Naturally Ventilated Buildings: Revisions to ASHRAE Standard 55. Energy Build. 2002, 34, 549–561. [Google Scholar] [CrossRef]
- Shaw, E.W. Thermal Comfort: Analysis and Applications in Environmental Engineering, by P. O. Fanger. 244 Pp. DANISH TECHNICAL PRESS. Copenhagen, Denmark, 1970. Danish Kr. 76, 50. R. Soc. Health J. 1972, 92, 164. [Google Scholar] [CrossRef]
- Das, S.; Subudhi, S. A Review on Different Methodologies to Study Thermal Comfort. Int. J. Environ. Sci. Technol. 2022, 19, 2155–2171. [Google Scholar] [CrossRef]
- Lai, D.; Chen, B.; Liu, K. Quantification of the Influence of Thermal Comfort and Life Patterns on Outdoor Space Activities. Build. Simul. 2020, 13, 113–125. [Google Scholar] [CrossRef]
- Höppe, P. The Physiological Equivalent Temperature—A Universal Index for the Biometeorological Assessment of the Thermal Environment. Int. J. Biometeorol. 1999, 43, 71–75. [Google Scholar] [CrossRef]
- Matzarakis, A.; Mayer, H.; Iziomon, M.G. Applications of a Universal Thermal Index: Physiological Equivalent Temperature. Int. J. Biometeorol. 1999, 43, 76–84. [Google Scholar] [CrossRef] [PubMed]
- Ji, W.; Zhu, Y.; Du, H.; Cao, B.; Lian, Z.; Geng, Y.; Liu, S.; Xiong, J.; Yang, C. Interpretation of Standard Effective Temperature (SET) and Explorations on Its Modification and Development. Build. Environ. 2022, 210, 108714. [Google Scholar] [CrossRef]
- Jia, X.; Li, S.; Zhu, Y.; Du, Z.; Cao, B. Development of the Universal Standard Effective Temperature for Evaluating Thermal Comfort across Different Metabolic Rates. Build. Environ. 2024, 250, 111149. [Google Scholar] [CrossRef]
- Zhao, Q.; Lian, Z.; Lai, D. Thermal Comfort Models and Their Developments: A Review. Energy Built Environ. 2021, 2, 21–33. [Google Scholar] [CrossRef]
- Bröde, P.; Krüger, E.; Fiala, D. UTCI: Validation and Practical Application to the Assessment of Urban Outdoor Thermal Comfort. Geogr. Pol. 2013, 86, 11–20. [Google Scholar] [CrossRef]
- Fiala, D.; Havenith, G.; Broede, P.; Kampmann, B.; Jendritzky, G. UTCI-Fiala Multi-Node Model of Human Heat Transfer and Temperature Regulation. Int. J. Biometeorol. 2012, 56, 429–441. [Google Scholar] [CrossRef]
- Mahdavinejad, M.; Shaeri, J.; Nezami, A.; Goharian, A. Comparing Universal Thermal Climate Index (UTCI) with Selected Thermal Indices to Evaluate Outdoor Thermal Comfort in Traditional Courtyards with BWh Climate. Urban Clim. 2024, 54, 101839. [Google Scholar] [CrossRef]
- Wereski, S.; Krzyżewska, A.; Dobek, M. Winter UTCI Variability in Poland in the 21st Century. Misc. Geogr. 2020, 24, 128–137. [Google Scholar] [CrossRef]
- Blazejczyk, K.; Epstein, Y.; Jendritzky, G.; Staiger, H.; Tinz, B. Comparison of UTCI to Selected Thermal Indices. Int. J. Biometeorol. 2012, 56, 515–535. [Google Scholar] [CrossRef] [PubMed]
- Zare, S.; Hasheminejad, N.; Shirvan, H.E.; Hemmatjo, R.; Sarebanzadeh, K.; Ahmadi, S. Comparing Universal Thermal Climate Index (UTCI) with Selected Thermal Indices/Environmental Parameters during 12 Months of the Year. Weather. Clim. Extrem. 2018, 19, 49–57. [Google Scholar] [CrossRef]
- Jin, H.; Liu, S.; Kang, J. Thermal Comfort Range and Influence Factor of Urban Pedestrian Streets in Severe Cold Regions. Energy Build. 2019, 198, 197–206. [Google Scholar] [CrossRef]
- Nie, T.; Lai, D.; Liu, K.; Lian, Z.; Yuan, Y.; Sun, L. Discussion on Inapplicability of Universal Thermal Climate Index (UTCI) for Outdoor Thermal Comfort in Cold Region. Urban Clim. 2022, 46, 101304. [Google Scholar] [CrossRef]
- Wu, J.; Jin, T.; Wu, Y.; Ding, Y.; Mu, Y.; Zeng, D. The Variation of UTCI with the Background of Climate Change and Its Implications for Tourism in a Complicated Climate Region in Western China. Sustainability 2022, 14, 15047. [Google Scholar] [CrossRef]
- Wu, Z.; Kong, F.; Wang, Y.; Sun, R.; Chen, L. The Impact of Greenspace on Thermal Comfort in a Residential Quarter of Beijing, China. Int. J. Environ. Res. Public Health 2016, 13, 1217. [Google Scholar] [CrossRef]
- Park, S.; Stanton; Tuller, E.; Jo, M. Application of Universal Thermal Climate Index (UTCI) for Microclimatic Analysis in Urban Thermal Environments. Landsc. Urban Plan. 2014, 125, 146–155. [Google Scholar] [CrossRef]
- Ning, S.; Jing, W.; Ge, Z. Sunlight Perception and Outdoor Thermal Comfort in College Campuses: A New Perspective. Sci. Rep. 2023, 13, 16112. [Google Scholar] [CrossRef]
- Cohen, J.; Cohen, P.; Stephen; West, G.; Aiken, L. Applied Multiple Regression/Correlation Analysis for the Behavioral Sciences, 3rd ed.; Routledge: New York, NY, USA, 2013. [Google Scholar] [CrossRef]
- Jebli, I.; Belouadha, F.-Z.; Kabbaj, M.I.; Tilioua, A. Prediction of Solar Energy Guided by Pearson Correlation Using Machine Learning. Energy 2021, 224, 120109. [Google Scholar] [CrossRef]
- de Winter, J.C.F.; Gosling, S.D.; Potter, J. Comparing the Pearson and Spearman correlation coefficients across distributions and sample sizes: A tutorial using simulations and empirical data. Psychol. Methods 2016, 21, 273–290. [Google Scholar] [CrossRef]
- Nossent, J.; Elsen, P.; Bauwens, W. Sobol’ Sensitivity Analysis of a Complex Environmental Model. Environ. Model. Softw. 2011, 26, 1515–1525. [Google Scholar] [CrossRef]
- Tian, W. A Review of Sensitivity Analysis Methods in Building Energy Analysis. Renew. Sustain. Energy Rev. 2013, 20, 411–419. [Google Scholar] [CrossRef]
- Tortorelli, D.A.; Michaleris, P. Design Sensitivity Analysis: Overview and Review. Inverse Probl. Eng. 1994, 1, 71–105. [Google Scholar] [CrossRef]
- Zhou, Y.; Tam, V.W.Y.; Le, K.N. Sensitivity Analysis of Design Variables in Life-Cycle Environmental Impacts of Buildings. J. Build. Eng. 2023, 65, 105749. [Google Scholar] [CrossRef]


| Time Period | Winter Solstice—ISR | Spring Equinox—ISR | Summer Solstice—ISR |
|---|---|---|---|
| 8:00–10:00 | 9.7% | 46.33% | 12.66% |
| 10:00–12:00 | 40.66% | 87.16% | 30.45% |
| 12:00–14:00 | 43.97% | 93.53% | 23.94% |
| 14:00–16:00 | 1.06% | 67.67% | 67.21% |
| 16:00–18:00 | 0% | 43.59% | 41.08% |
| Reference Day | Site A (Average ISR) | Site B (Average ISR) | Site C (Average ISR) |
|---|---|---|---|
| Winter Solstice (22 December) |  0.5887 0.5887 |  0.2399 0.2399 |  0.3107 0.3107 |
| Spring Equinox (21 March) |  0.7152 0.7152 |  0.4615 0.4615 | 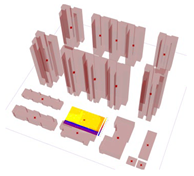 0.7427 0.7427 |
| Summer Solstice (22 June) | 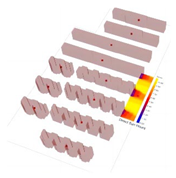 0.7815 0.7815 |  0.7731 0.7731 | 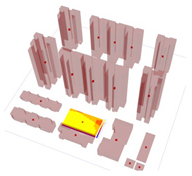 0.945 0.945 |
| Autumn Equinox (23 September) | 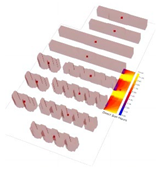 0.6999 0.6999 |  0.4516 0.4516 |  0.7507 0.7507 |
| Reference Day | Site A (UTCI-Mean) | Site B (UTCI-Mean) | Site C (UTCI-Mean) |
|---|---|---|---|
| Winter Solstice (22 December) |  1.32–2.27 °C 1.32–2.27 °C |  1.32–2.18 °C 1.32–2.18 °C |  1.62–1.92 °C 1.62–1.92 °C |
| Spring Equinox (21 March) |  9.14–14.31 °C 9.14–14.31 °C | 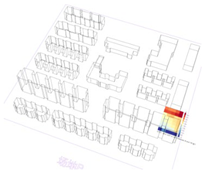 9.14–13.89 °C 9.14–13.89 °C | 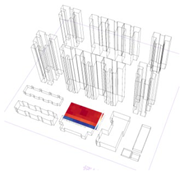 10.24–13.17 °C 10.24–13.17 °C |
| Summer Solstice (22 June) | 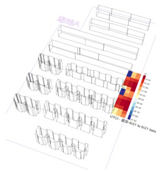 27.02–32.82 °C 27.02–32.82 °C | 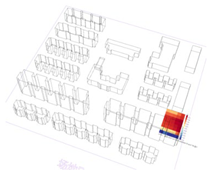 27.02–32.53 °C 27.02–32.53 °C | 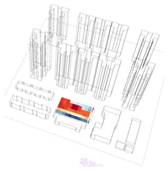 31.11–31.90 °C 31.11–31.90 °C |
| Autumn Equinox (23 September) | 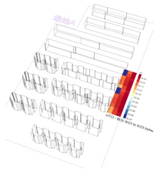 22.47–24.52 °C 22.47–24.52 °C |  22.47–24.29 °C 22.47–24.29 °C | 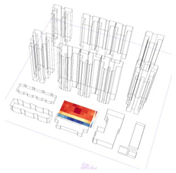 23.14–23.78 °C 23.14–23.78 °C |
| Site A UTCI | Site B UTCI | Site C UTCI | ||||
|---|---|---|---|---|---|---|
| Si | ST | Si | ST | Si | ST | |
| Winter ISR | 1.0388 | 1.0388 | 0.9943 | 0.9948 | 0.9715 | 0.9711 |
| Summer ISR | 0.9974 | 0.9974 | 0.9871 | 0.9871 | 1.0030 | 1.0030 |
| Spring ISR | 1.0088 | 1.0088 | 0.9834 | 0.9835 | 1.0030 | 1.0030 |
| Autumn ISR | 1.0060 | 1.0060 | 0.9994 | 0.9986 | 0.9808 | 0.9808 |
Disclaimer/Publisher’s Note: The statements, opinions and data contained in all publications are solely those of the individual author(s) and contributor(s) and not of MDPI and/or the editor(s). MDPI and/or the editor(s) disclaim responsibility for any injury to people or property resulting from any ideas, methods, instructions or products referred to in the content. |
© 2025 by the authors. Licensee MDPI, Basel, Switzerland. This article is an open access article distributed under the terms and conditions of the Creative Commons Attribution (CC BY) license (https://creativecommons.org/licenses/by/4.0/).
Share and Cite
Song, J.; Liu, Y.; Chow, D.H.C.; Liu, B.; Cho, S. Correlation Between the Insolation Shadow Ratio and Thermal Comfort of Urban Outdoor Spaces in Residential Areas in Xi’an. Buildings 2025, 15, 1995. https://doi.org/10.3390/buildings15121995
Song J, Liu Y, Chow DHC, Liu B, Cho S. Correlation Between the Insolation Shadow Ratio and Thermal Comfort of Urban Outdoor Spaces in Residential Areas in Xi’an. Buildings. 2025; 15(12):1995. https://doi.org/10.3390/buildings15121995
Chicago/Turabian StyleSong, Jie, Yu Liu, David Hou Chi Chow, Bo Liu, and Seigen Cho. 2025. "Correlation Between the Insolation Shadow Ratio and Thermal Comfort of Urban Outdoor Spaces in Residential Areas in Xi’an" Buildings 15, no. 12: 1995. https://doi.org/10.3390/buildings15121995
APA StyleSong, J., Liu, Y., Chow, D. H. C., Liu, B., & Cho, S. (2025). Correlation Between the Insolation Shadow Ratio and Thermal Comfort of Urban Outdoor Spaces in Residential Areas in Xi’an. Buildings, 15(12), 1995. https://doi.org/10.3390/buildings15121995