1. Introduction
In recent years, the excessive transverse expansion of pavement arch has often occurred in semi-rigid base pavement in the northwestern part of China [
1,
2]. In some areas, there are 103 transverse arches of this stripped pavement in 100 km of roads, with widths ranging from 0–100 cm and heights up to nearly 10 cm, which brings great hidden dangers to the construction of regional highway networks and driving safety [
3].
Studies have shown that the reason for this arching phenomenon is that the cement-treated base (CTB) generates expansive crystalline products such as ettringite and sodium sulfate decahydrate crystals under the action of heat-salt coupling [
4,
5,
6,
7,
8]. The internal expansion stress of the mixture increases [
9,
10,
11,
12], which leads to the expansion and cracking of the base. Notably, this issue is particularly prevalent in regions characterized by arid climates, low precipitation, significant temperature differentials, and high salinity in surface minerals and groundwater. The large diurnal temperature variations provide ample external driving forces for the crystallization process responsible for expansion [
13,
14,
15]. Concurrently, surface minerals and high-salinity groundwater supply the essential crystal sources for the backfill material [
16].
To solve the excessive expansion issue, many scholars have carried out systematic research by means of laboratory tests, theoretical analysis, and numerical simulation [
17,
18,
19,
20,
21,
22,
23,
24,
25,
26]. Wei Shao et al. [
27] proposed a chloride ion diffusion model considering the coupling effect of calcium dissolution and sulfate erosion in cement-based materials, which is used to describe the competition between sulfate and chloride salts in the cement matrix. Liang Song et al. [
1] studied the influence of different factors on the arch expansion characteristics of CTB through a low-temperature salt expansion test. The factors such as salt content, water content, cement dosage, compaction degree, and cooling rate will affect the arch expansion deformation. It is recommended that the salt content in cement stabilized macadam should be controlled below 0.2%, and the skeleton dense structure should be adopted. Weixing Bao et al. [
2] studied the effects of cement dosage, sulfate content, and temperature on the deformation and strength characteristics of the mixture through mechanical tests and microscopic test methods. Combined with the change of fine microscopic parameters, the mechanism of salt expansion deformation of sulfate attack cement stabilized crushed stone is analyzed, and it is suggested to reduce the amount of cement to control the arch expansion deformation of the material. Mengyuan Zhang et al. [
3] designed an indoor accelerated simulation test of cement-stabilized crushed stone materials under the coupling of water, heat, and salt, and studied the expansion deformation and deterioration of cement-stabilized crushed stone materials under different gradation types, temperatures, humidity, and temperature-humidity cycle changes. Combined with CT scanning, the pore structure change of the mixture was studied to explain the expansion deformation mechanism. Qian Hui Xiao et al. [
28] studied the effect of sulfate attack on the durability of the mixture under negative temperature conditions. The results showed that with the increase of freeze-thaw cycles, the strength of the mixture decreased significantly due to the continuous erosion of sulfate. Ke Tang et al. [
29] designed a study on the compaction characteristics of CTB material in saline soil area, and analyzed the influence of temperature, cement dosage, and sulfate content on the compaction results by orthogonal test. It is proposed that the construction temperature be carefully selected in sulfate saline soil areas to avoid construction during the low-temperature period, and a lower cement dose should be used to slow down the salt expansion disease of the base. Wang et al. [
30], investigates the optimum design of active tensegrity structures through topology optimization. The topology-optimized active designs obtained through the proposed approach can further decrease the material consumption compared with sizing-optimized active tensegrity designs, hence leading to more lightweight structures.
In the existing research, scholars pay more attention to the mechanism of arch expansion and generally tend to utilize model tests and numerical simulation methods. On the other hand, the research measures are mostly deficient in long-term in-situ monitoring, and there is little focus on the evaluation of the operational effect in practical engineering.
In this paper, to address the excessive expansion issue, we first, based on statistical analysis, propose a technical method for expansion relief grooves (ERG) to alleviate the issue. Then, the three-year-long monitoring term involving the temperature, stress, and displacement is carried out. Finally, based on the statistical analysis of the monitoring data, the effect of different materials on pavement arch expansion in the specific climate environment of the test area is systematically evaluated.
The novelty of this work lies in (1) proposing a novel ERG design based on statistical analysis of pavement data, (2) conducting a three-year on-site monitoring to compare stress and displacement variations of two groove materials (ATB-25 and graded gravel) under different environmental conditions during service, (3) systematically evaluating the effectiveness from both technical and economic perspectives, culminating in a recommended optimal solution. Ultimately, this research provides practical engineering recommendations and construction guidelines for addressing arching deformation defects in regional road base layers.
2. Disease Investigation and ERGs Design
To solve the problem of arch expansion in regional highway engineering, this paper conducts field research on arch expansion diseases of multiple roads. The spatial distribution and size form of arch expansion disease were statistically analyzed, and then the reasonable spacing and width of the ERG were given.
2.1. Statistics of Road Arch Expansion Disease
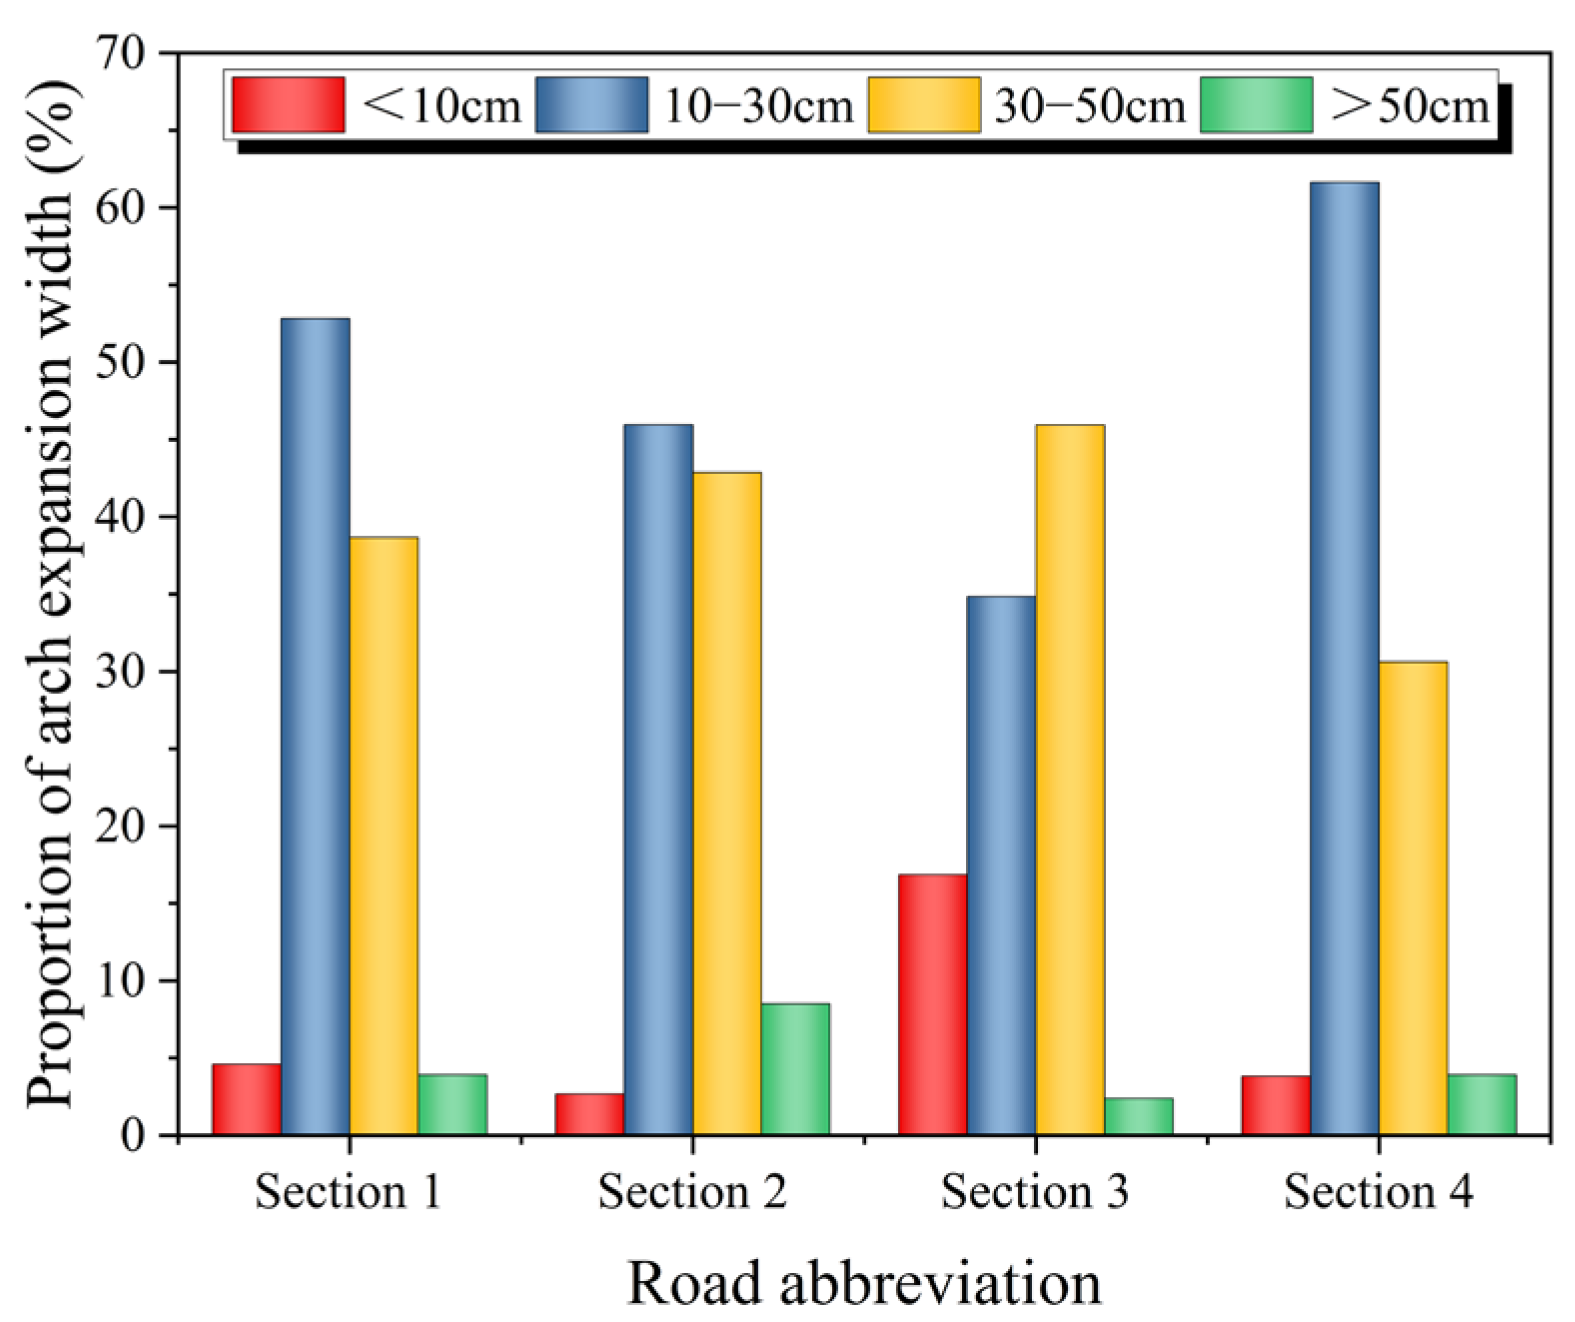
In this paper, four typical roads in the area were selected to investigate the arch expansion disease, and the width and spatial distribution of arch expansion were statistically analyzed. The width and distribution spacing of the arch expansion in four sections are shown in
Figure 1 and
Figure 2.
The arch expansion in the four sections is mainly distributed perpendicular to the driving direction of the road. The height of the arch expansion is in the range of 0–10 cm. The length of the arch expansion is basically the same as the width of the road. Therefore, it is considered that the arch expansion mainly exists in the form of a linear arching. In this paper, the arch expansion width is divided into four grades: less than 10 cm, 10–30 cm, 30–50 cm, and more than 50 cm. As shown in
Figure 1, the width of the arch expansion disease is mainly concentrated in 10–50 cm. The spacing of arch expansion is divided into: less than 100 m, 100–200 m, 200–400 m, and more than 400 m. From
Figure 2, the arch expansion spacing is mainly concentrated in 100–200 m, accounting for more than 50%.
The analysis considered that the expansion stress generated by the continuous 200 m base layer in the test area is the threshold value of arching deformation. When the continuous length of the base layer exceeds 200 m, a 10–50 cm arching deformation may be generated to release the accumulated expansion stress. Therefore, it is considered that the width of the ERG is 50 cm and the spacing is 200 m, which can meet the local engineering requirements.
2.2. Structural Design of ERG
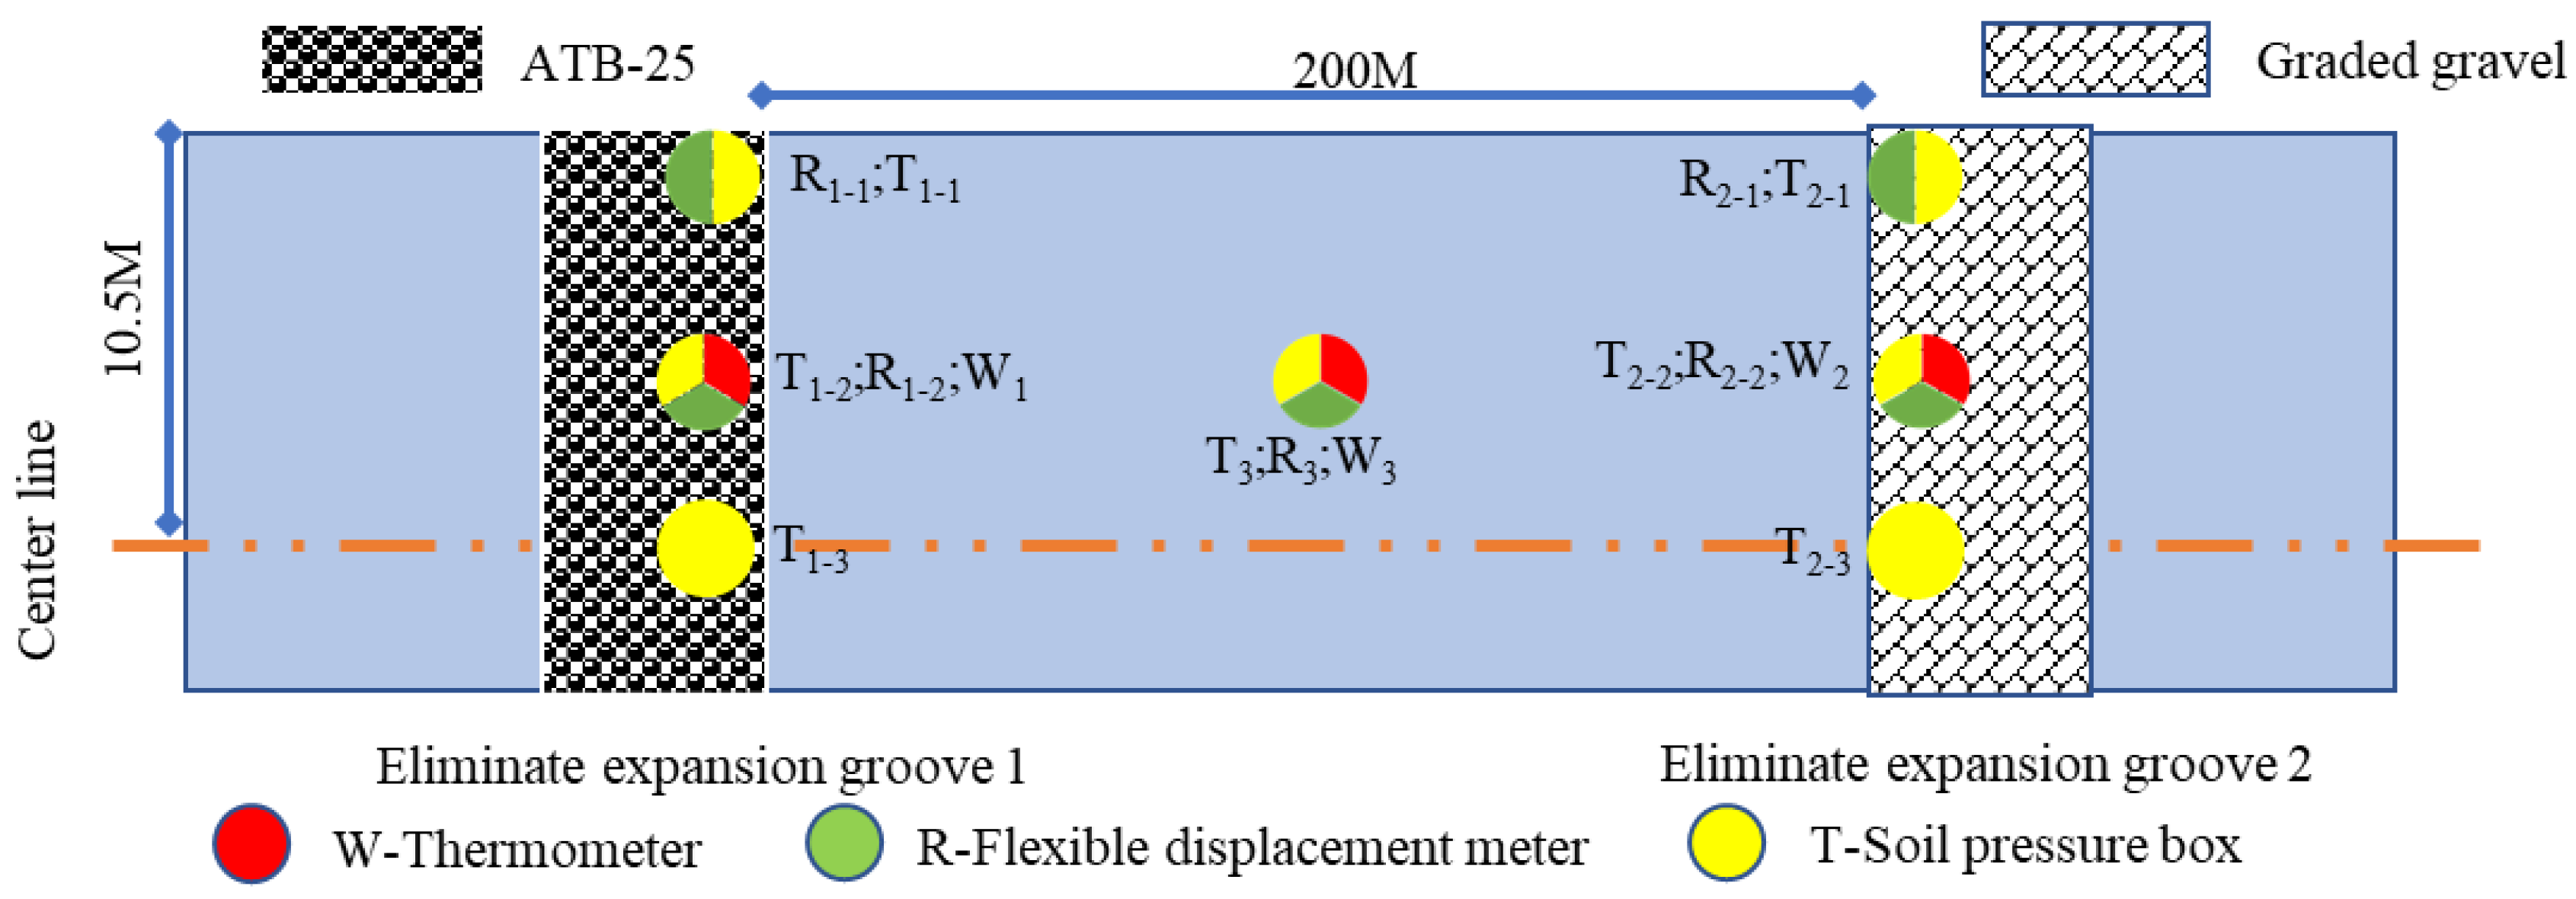
ERGs should have good deformation compatibility and sufficient bearing capacity, mostly using flexible fillers. Combined with the local construction conditions and material limitations, this paper selects graded gravel (GG) and ATB-25 as the filling materials for the ERGs to pave the trial section. Furthermore, according to the statistical results of the arch expansion disease, the width of the ERGs is set to 50 cm, and the spacing is 200 m. The structural design of the trial section is shown in
Figure 3.
2.3. Materials of the Trial Section
2.3.1. CTB Asphalt Pavement
In this study, the pavement structure of the test section is consistent with the conventional pavement structure in the study area. According to the drawings provided by the design unit, the pavement structure used in the trial section is a CTB asphalt pavement structure. The surface material is medium-grain asphalt concrete (AC-20), and the base and subbase materials are CTB. The material index of each structural layer of the pavement meets the relevant technical requirements.
2.3.2. ATB-25 Eliminates Expansion Groove
ATB-25 is a graded crushed stone material that uses asphalt as a binder. It has good adhesion, so it can be connected to the pavement for better collaborative work. At the same time, the material has good flexibility and can adapt to the slight deformation of the pavement structure. The mixture ratio and related mechanical properties selected in this paper are shown in
Table 1 and
Table 2.
2.3.3. GG Eliminates Expansion Groove
GG is a flexible material obtained by mixing stones of different particle sizes in a certain proportion. It is characterized by high strength, good stability, reasonable material void structure, and good deformation coordination ability [
31]. The target gradation selected in this paper is shown in
Table 3, and the basic mechanical properties of the material are shown in
Table 4.
2.4. Construction Techniques
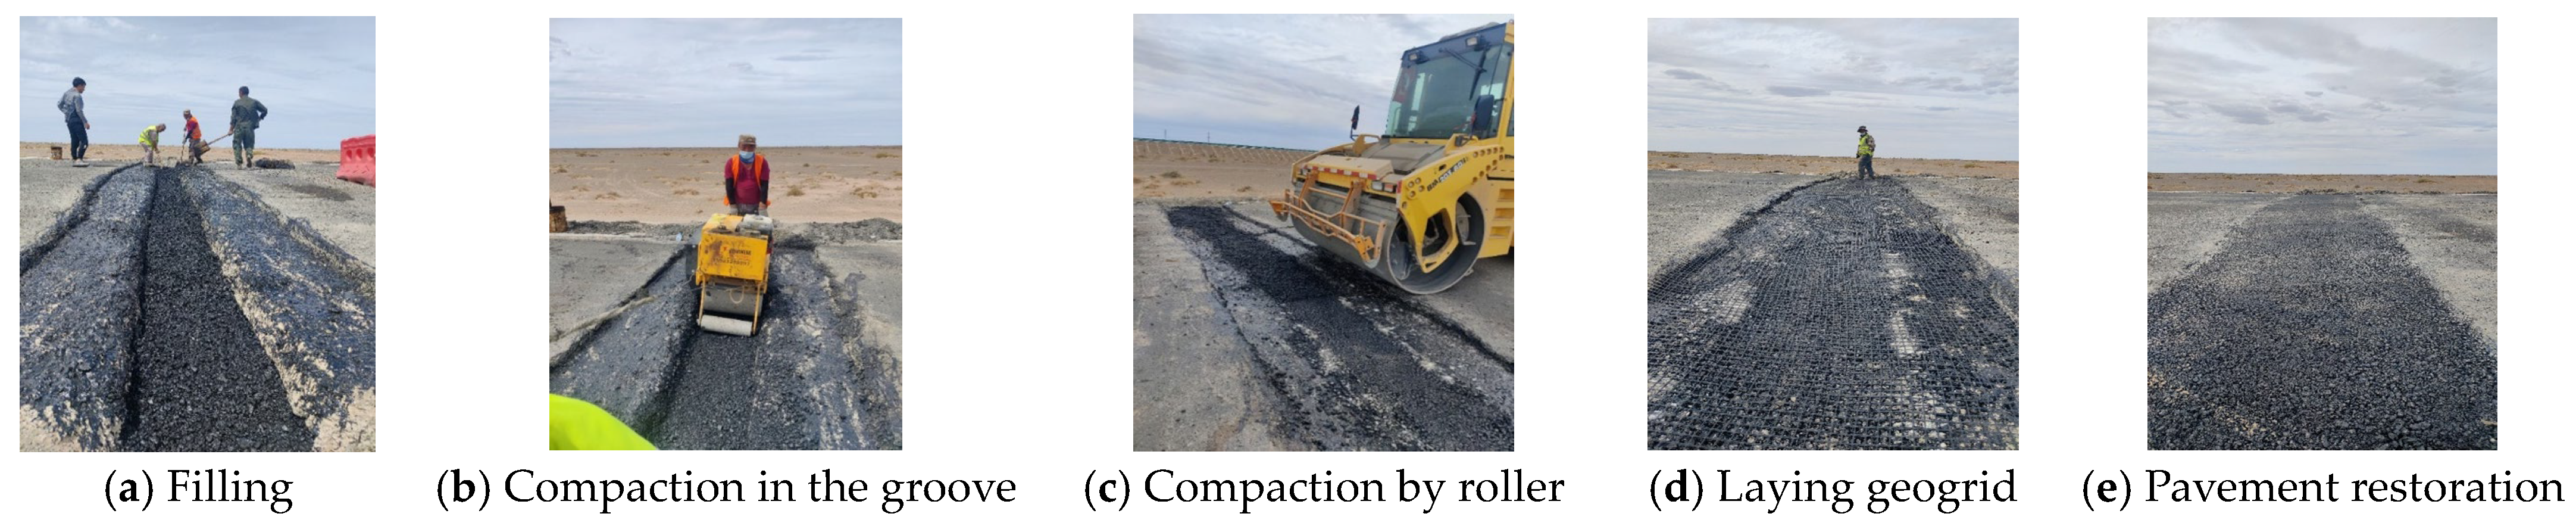
Figure 4 briefly introduces the paving process of the ATB-25 to eliminate the expansion groove. The paving process of the GG ERG is the same, but there is no need to pave the geogrid.
For new roads, the construction process of the ERGs includes slotting, filling, and compaction. First, within 1–2 days of paving and compaction of the base, a cutting machine is used to cut the cement-stabilized gravel base, remove the gravel, and level the top surface at the preset position. Then, the GG or ATB-25 asphalt mixture is used for backfilling. After the filling is completed, the mechanical leveling is performed, and the local height difference should not be greater than 3 cm. Finally, the small roller is used to compact, and the compaction degree should not be less than 94%. When ATB-25 asphalt mixture is used as the filling material to eliminate the expansion groove, it is necessary to overlay the geogrid on top of the grooves. The geogrid laying range should include the whole groove and extend 50 cm forward and backward.
3. Monitoring Scheme of the Trial Section
To track and evaluate the treatment effect of the ERG on the arch expansion, temperature, stress, and displacement sensors were buried in the trial section for 3 years. The sensor embedding adopts the following principles:
- (1)
The disease is symmetrically distributed along the center line of the road, so only the pavement structure on the right side of the center line is monitored.
- (2)
Temperature monitoring mainly considers the thermal conductivity of the material, which was buried in the 1/4 of the road in different structures.
- (3)
Stress monitoring mainly considers the boundary conditions, the traffic load distribution, and the mechanical properties of the material. Pressure boxes were buried at the side line, the middle line, and the 1/4 of the road.
- (4)
To ensure that the pressure box is in full contact with the adjacent structure, the initial compressive stress is uniformly adjusted to 200 KPa.
- (5)
Displacement monitoring mainly considers the traffic load distribution and the mechanical properties of the material. Displacement meters were buried at the side line and the 1/4 of the road.
Based on the above principles, the sensor embedding scheme is shown in
Figure 5.
The sensor numbering form is: Ax-y. Where A represents the monitoring project: W represents the temperature, T represents the compressive stress, and R represents the displacement; x represents the monitoring structure: 1 represents the ATB-25 ERG, 2 represents the GG ERG, 3 represents the CTB; y represents the monitoring position: 1 represents the side line, 2 represents the 1/4 of the road, and 3 represents the middle line of the road. The sensors’ arrangement scheme is shown in
Table 5.
The monitoring utilizes the YT-DG-0800 flexible displacement meter (100 mm, 0.1 mm accuracy), YT-BD-0100 temperature sensor (0.1 °C accuracy), and YT-ZX-0300 dual-membrane earth pressure cell (120 mm diameter, 0.1 kPa accuracy) from Hunan Yituo Sensing Technology Co., Ltd. (Changsha, China).
4. Results and Analysis
4.1. Environmental Temperature and Base Temperature
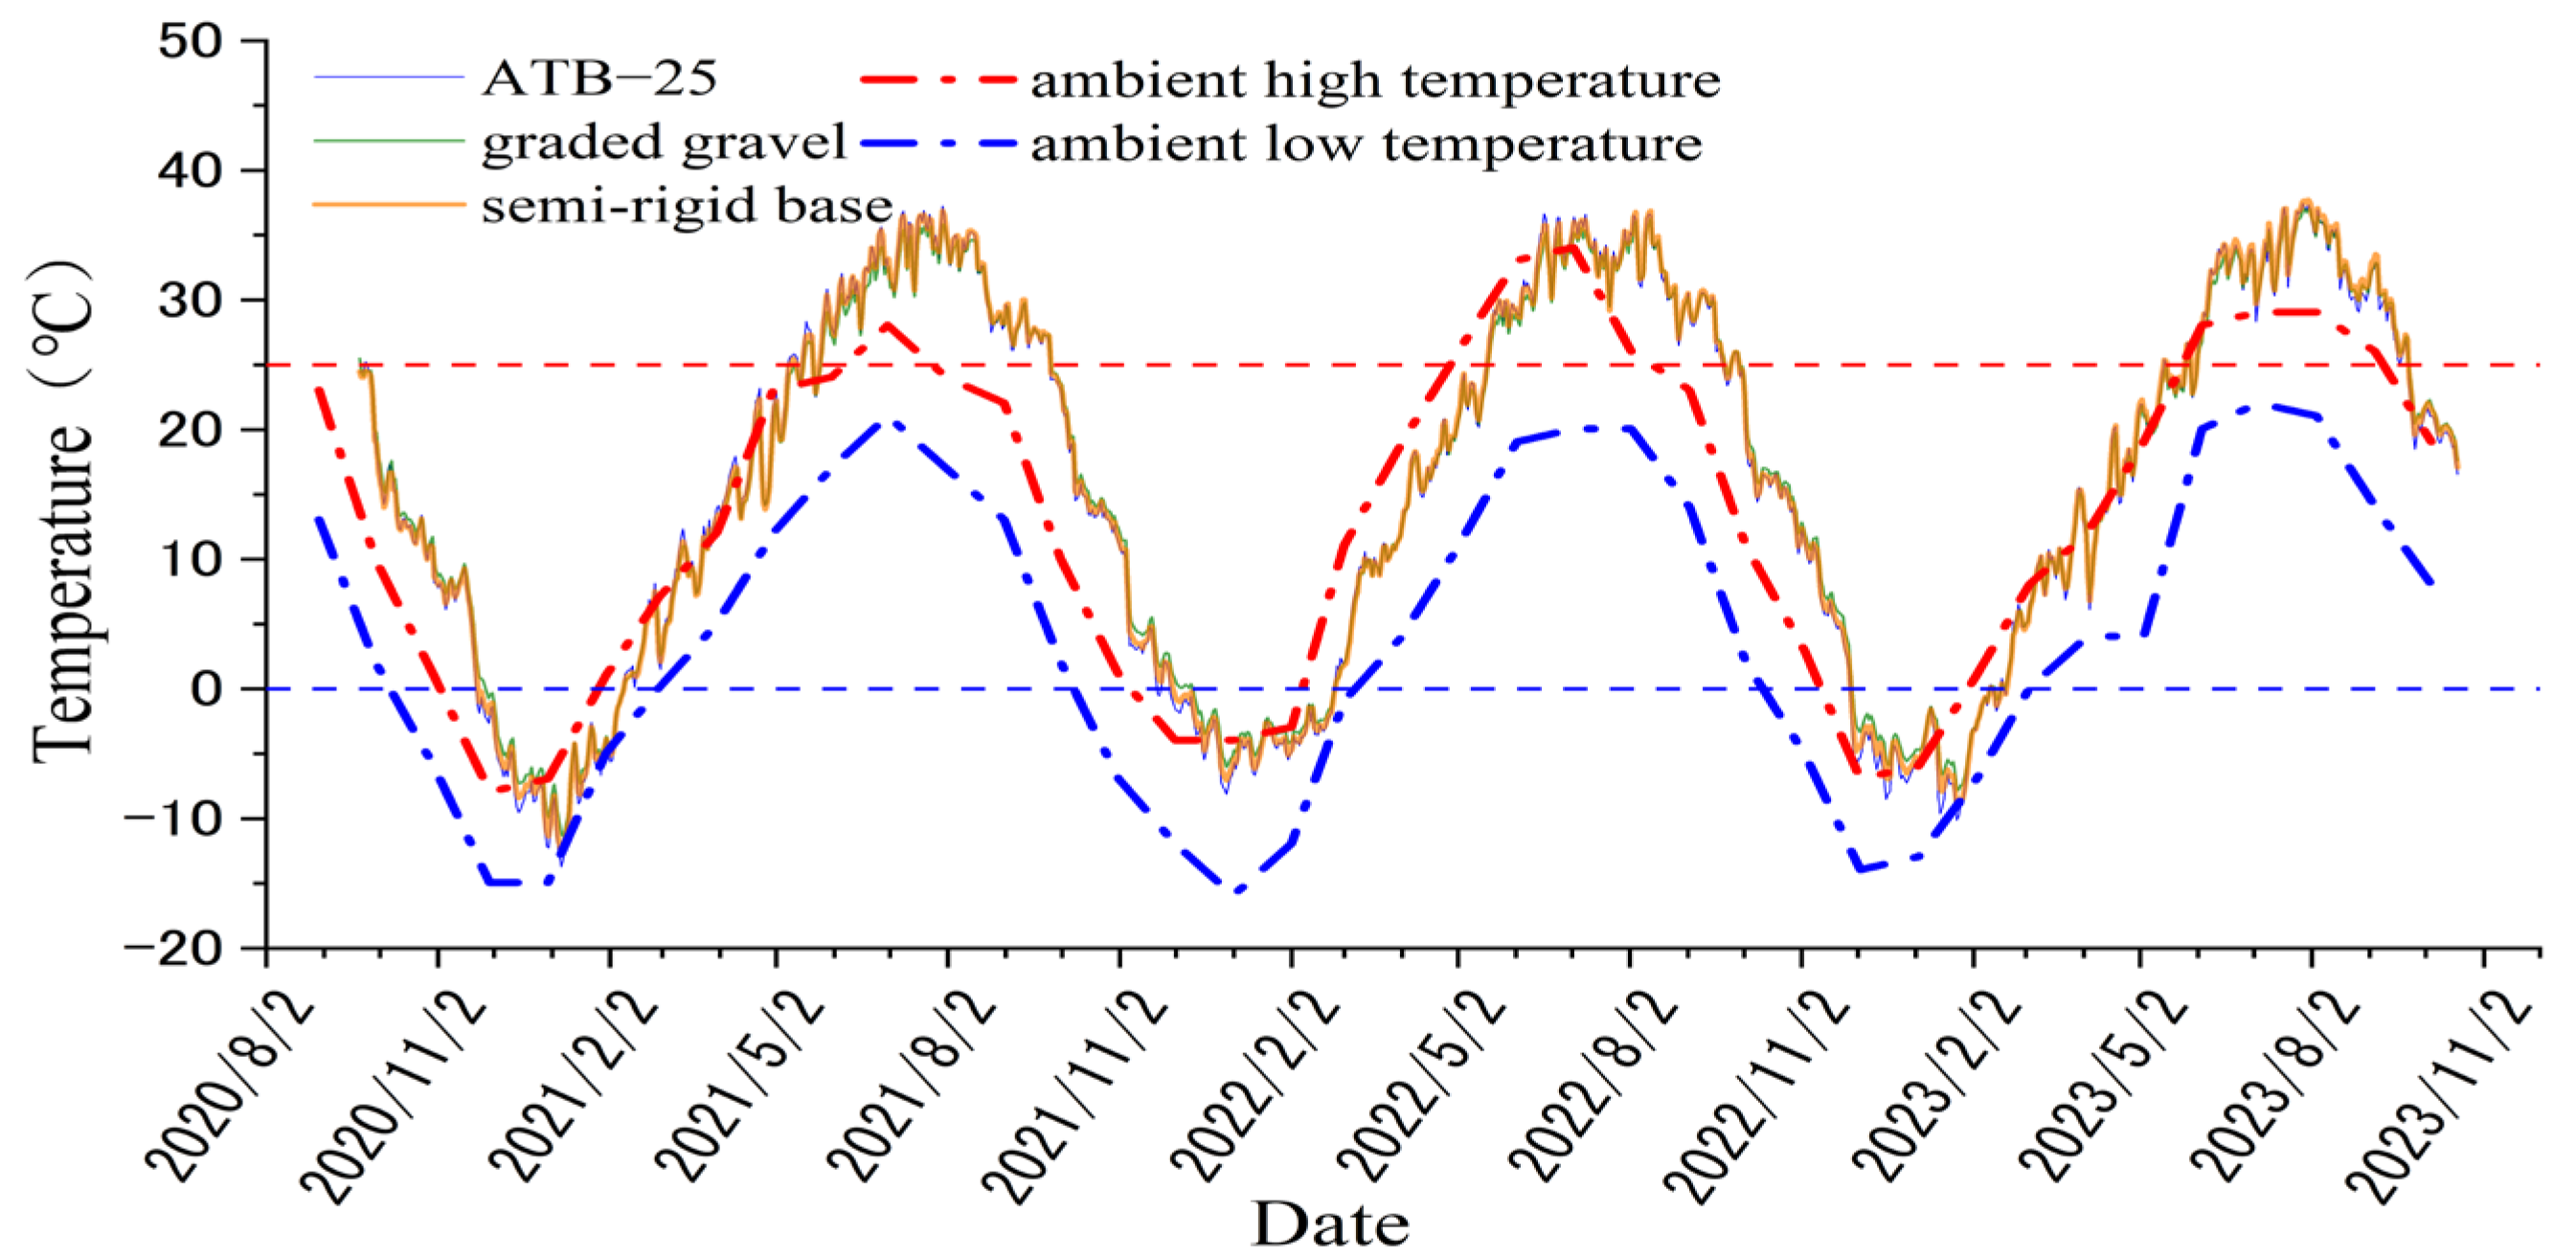
Figure 6 shows the long-term monitoring results of the temperature sensors at three locations.
As shown in
Figure 6, from December to March is the local cold season. The temperature in the pavement structure drops below 0 °C, and the minimum temperature is about −16 °C, which usually appears in January. June to August is the local warm season. The temperature in the pavement structure rises to more than 25 °C, and the highest temperature is about 40 °C, which usually appears in July. It can be seen that the temperature in the pavement structure basically follows the high temperature of the environment and presents a sinusoidal function change. In the rising section of the curve, the temperature in the pavement structure is obviously fitted with the high temperature of the environment. In the falling section of the curve, the temperature in the pavement structure is 5–10 °C higher than the environmental temperature.
According to the analysis, this phenomenon is caused by the heat absorption of black asphalt surfaces. The temperature began to rise in February. Due to the heat absorption of the black asphalt surface, the temperature in the pavement structure increased rapidly. The temperature began to decline in August. Due to the solar radiation, the black asphalt surface maintained a high temperature, and the temperature in the pavement structure decreased slowly. The black asphalt surface makes the temperature inside the pavement structure higher than the ambient temperature and maintains the high level for a longer time. This provides favorable conditions for heat-salt expansion of CTB in summer.
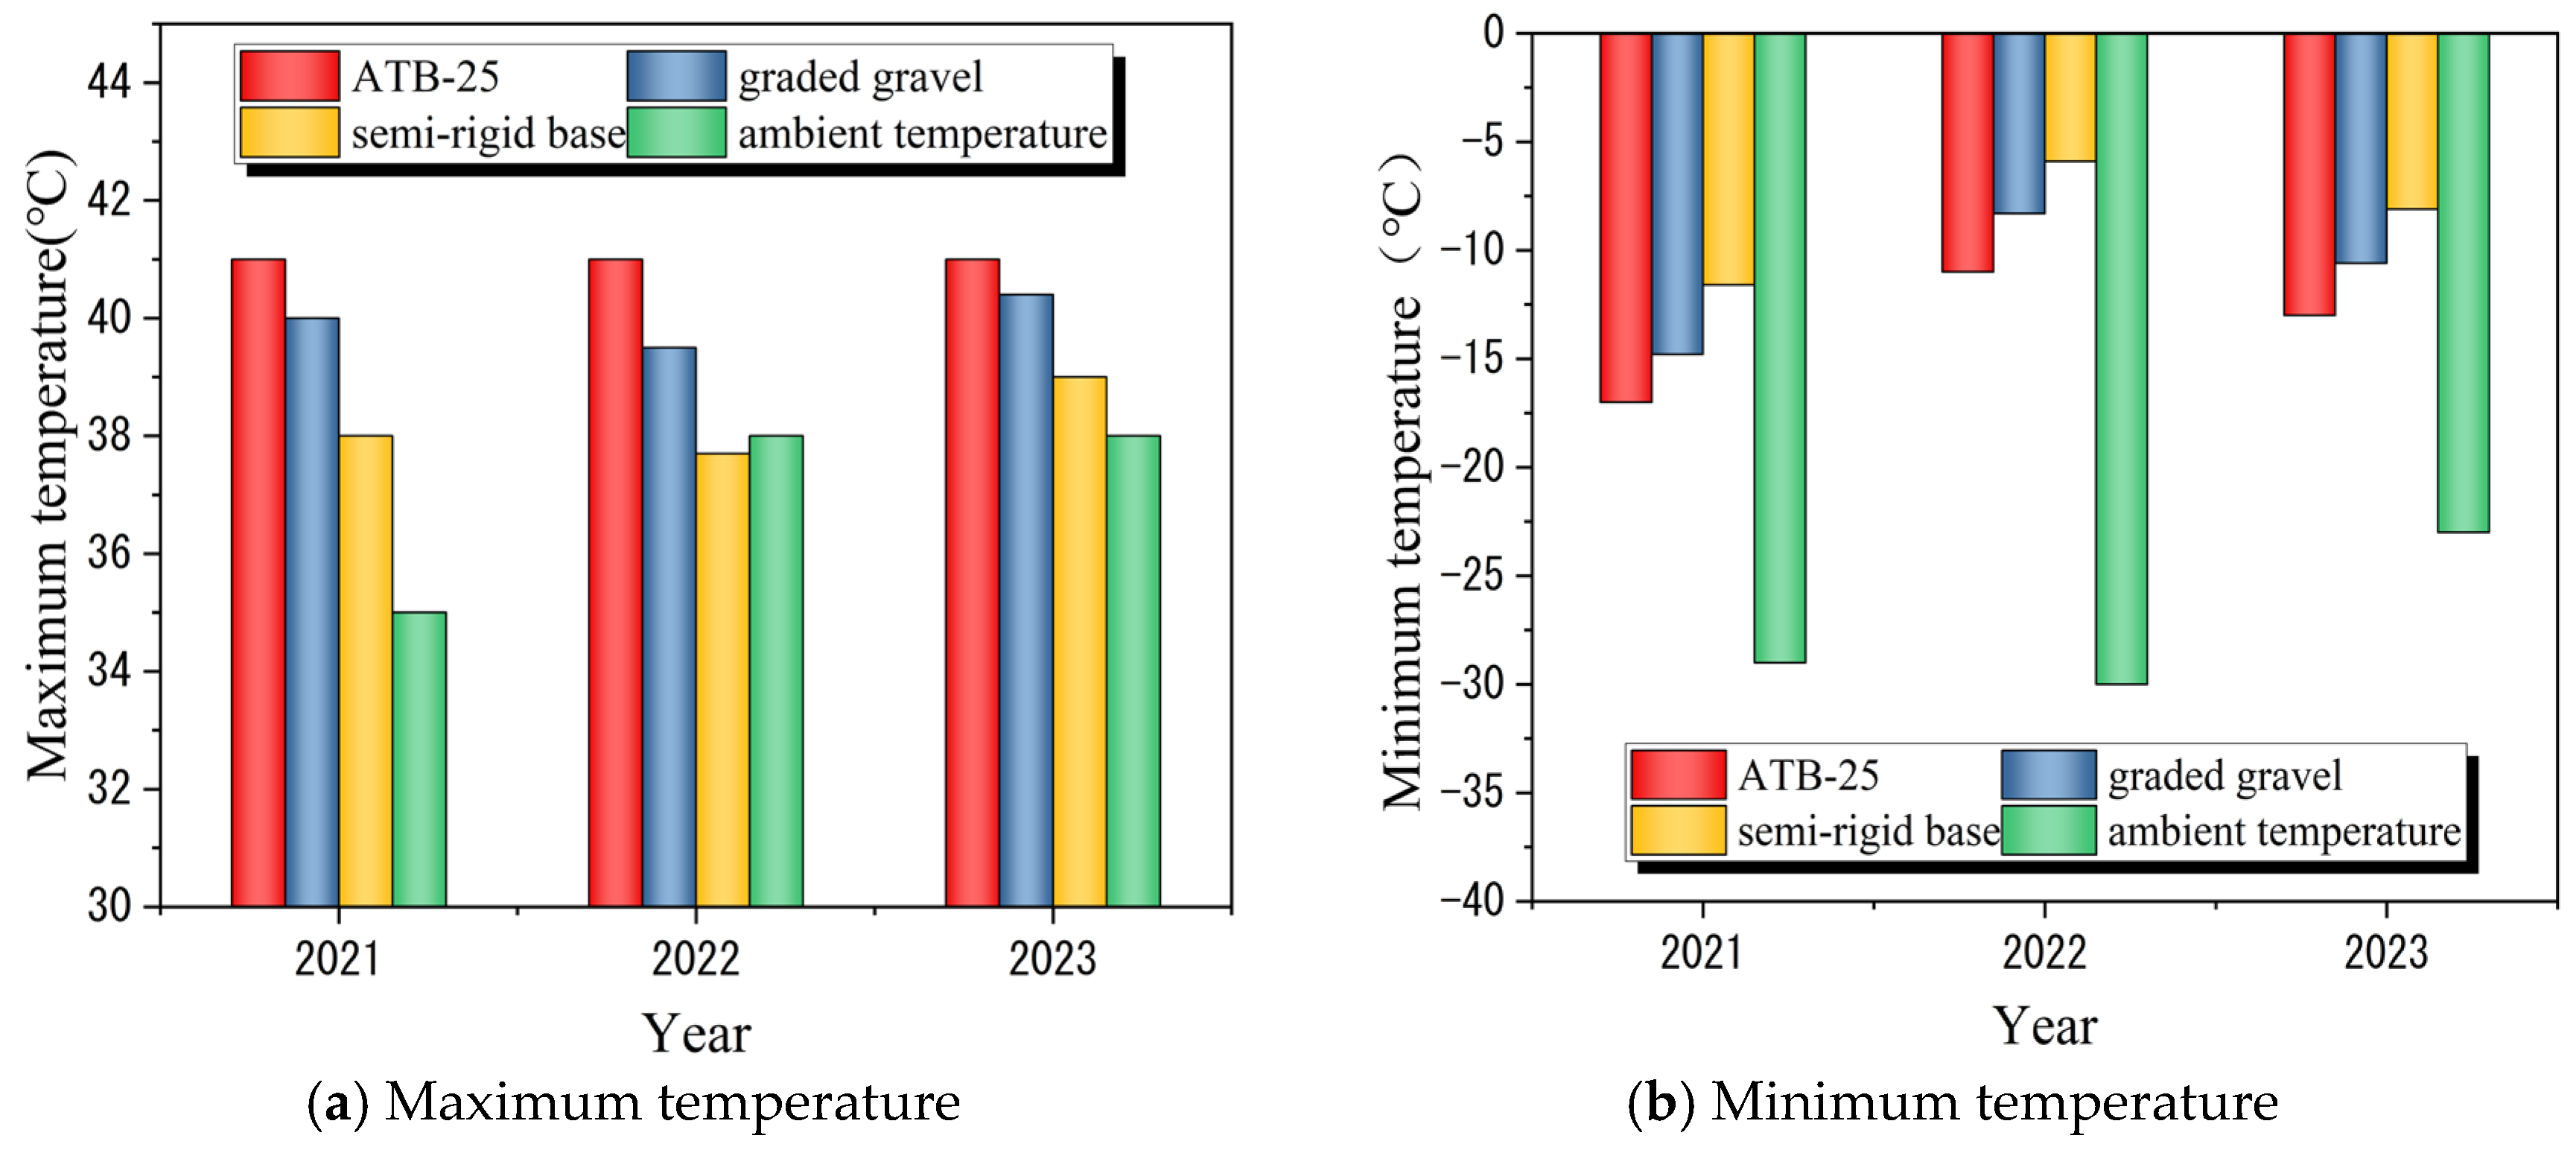
Because the temperature difference between different materials is not obvious in the annual temperature curve, this paper selects the extreme temperature recorded by the sensor every year to compare with the daily extreme temperature of the environment. The results are shown in
Figure 7.
As shown in
Figure 7. The comparison of the maximum temperature shows that: ATB-25 > GG > CTB > environmental temperature. The comparison of the lowest temperature shows that: environmental temperature > ATB-25 > GG > CTB. The annual temperature difference in different structures is calculated as follows: ATB-25 (55 °C) > GG (51 °C) > CTB (47 °C).
The temperature difference between the structures is mainly caused by the different thermophysical properties and looseness of the materials. The ATB-25 eliminates expansion grooves and uses asphalt-stabilized filler. The thermal conductivity of the material is high, and the annual temperature difference of the structure is the largest. GG eliminates expansion grooves and has a good heat exchange channel. The annual temperature difference is larger than that of CTB. The thermal conductivity of CTB is low, and the structure is relatively dense, so the annual temperature difference is the smallest. The analysis thinks that the large annual temperature difference inside the pavement structure provides a favorable environment and external power for the arch expansion. Under the combined action of temperature stress and expansion stress, the CTB has expansion deformation during the high temperature period in summer, and gradually develops into arch expansion.
4.2. Base Pressure Analysis
According to the monitoring scheme of
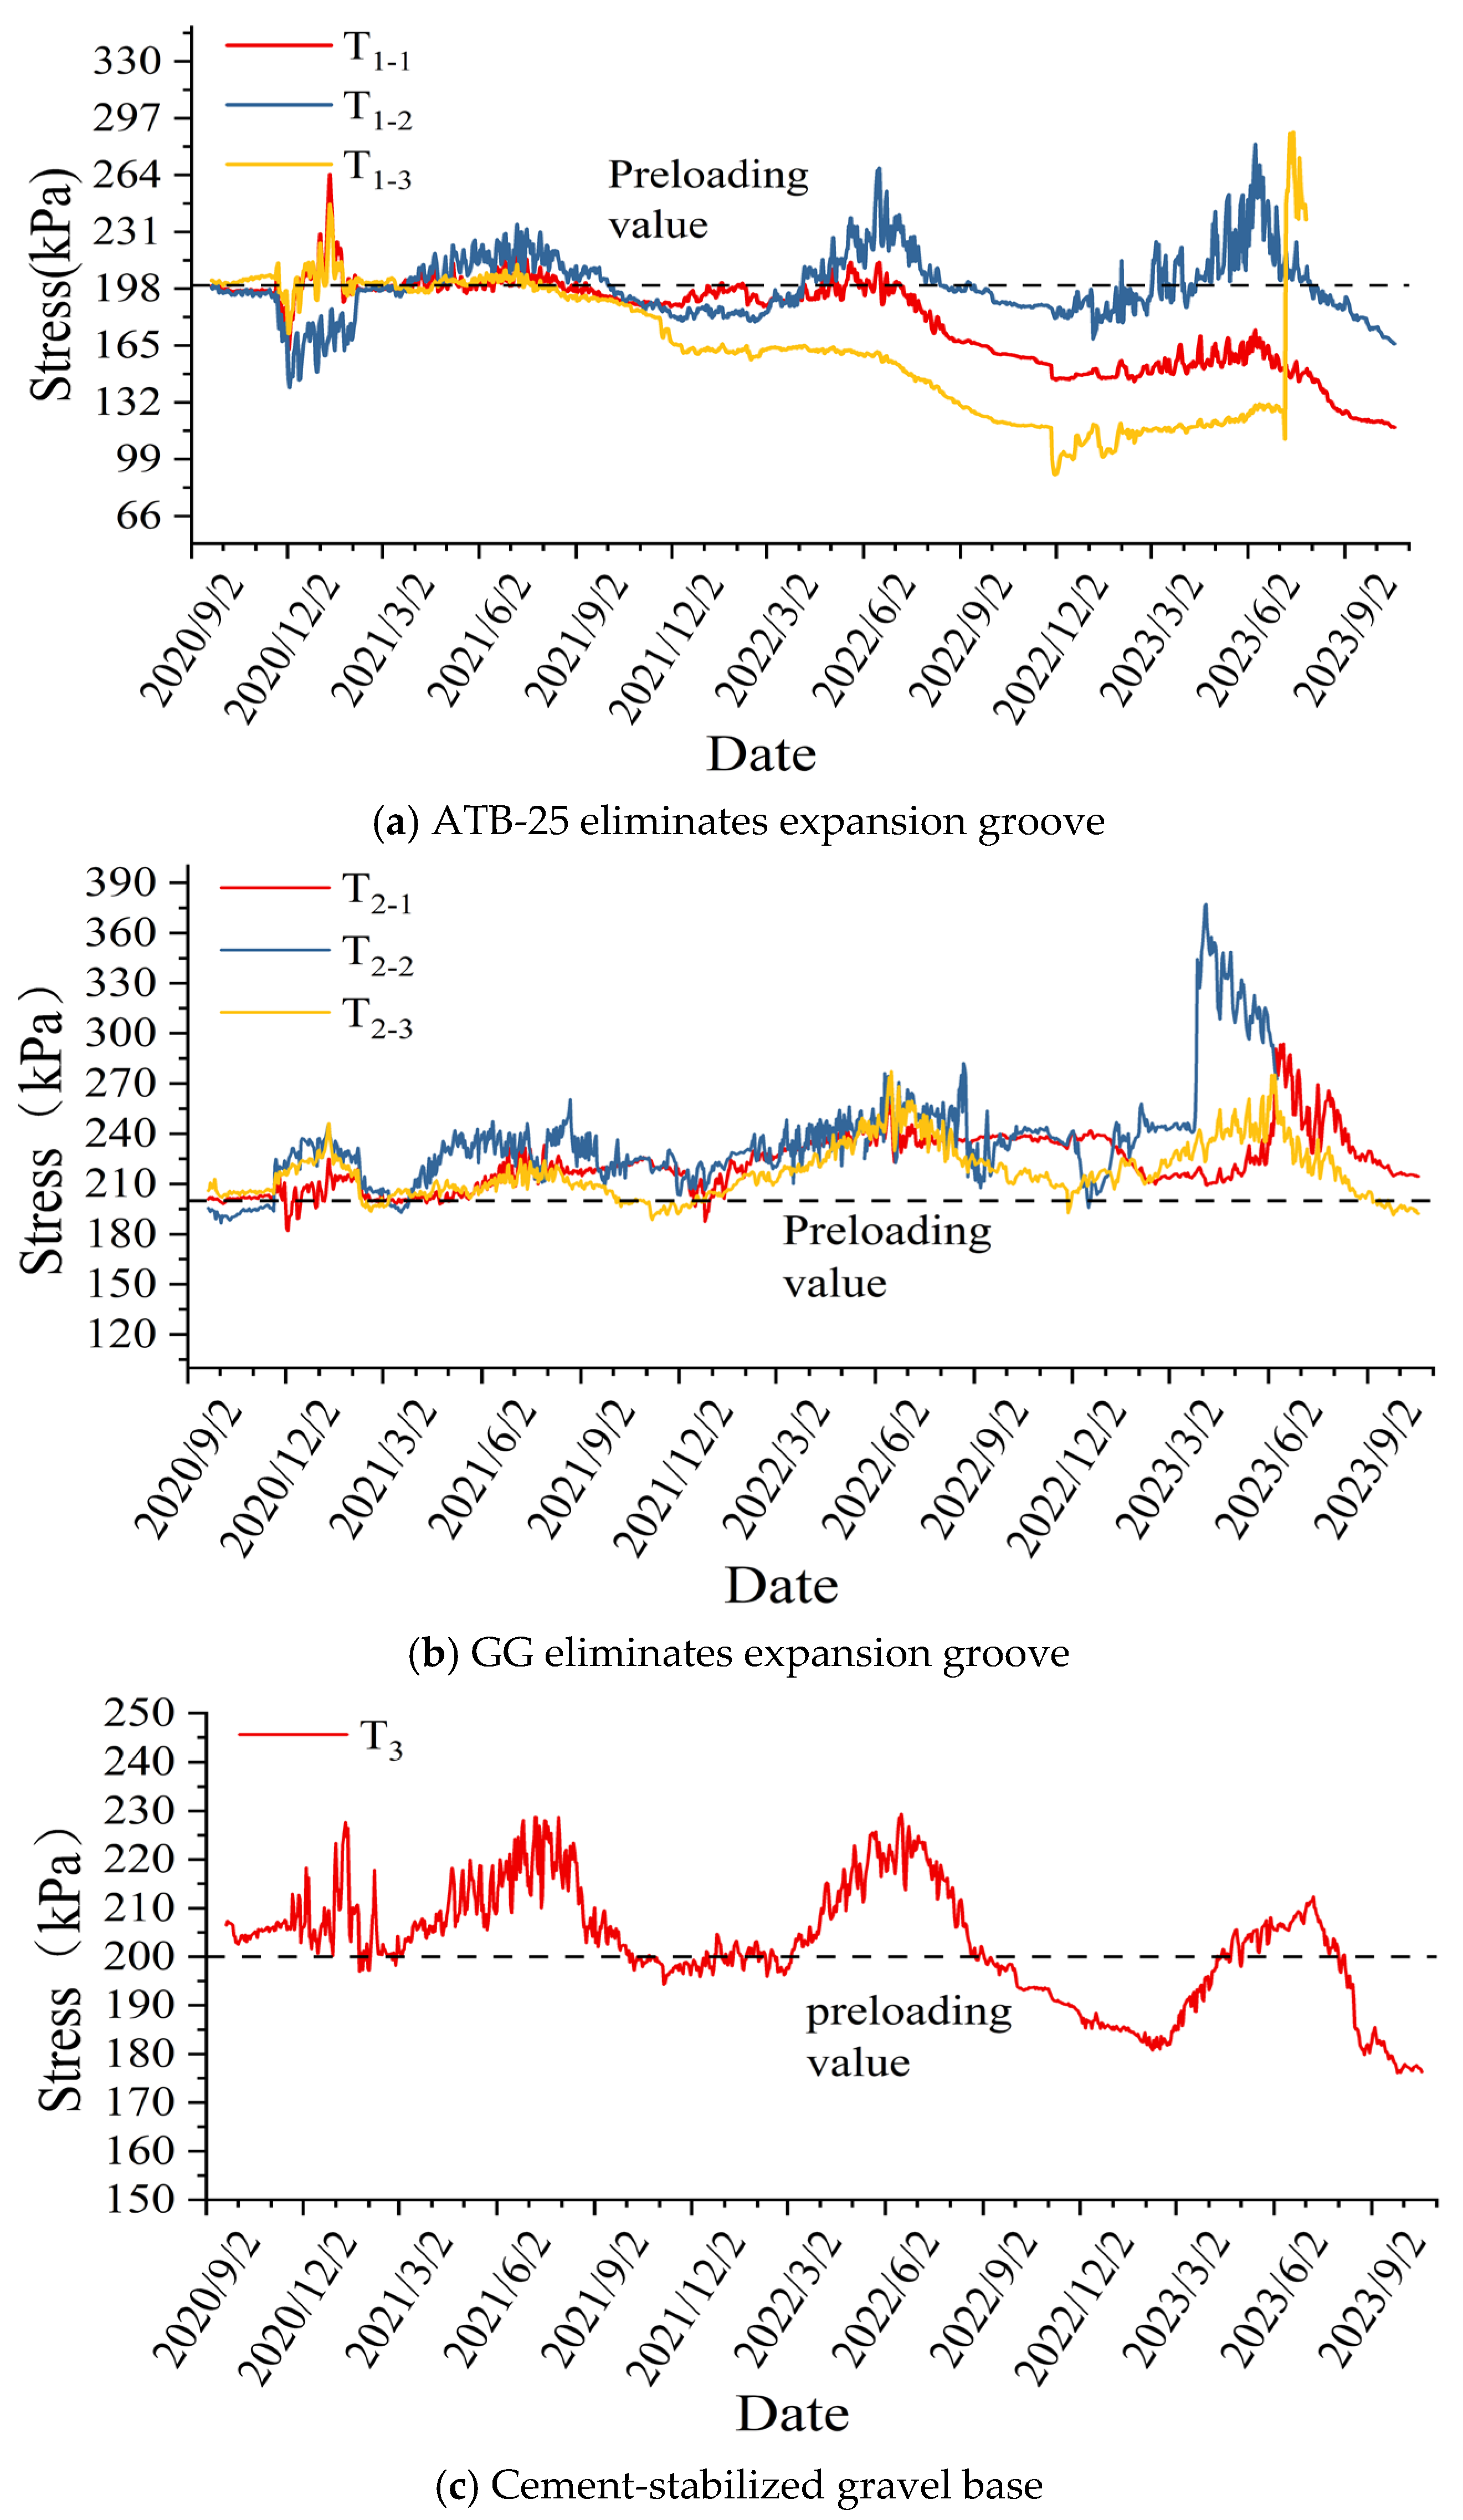
Table 5, the stress monitoring results of different structures are shown in
Figure 8a–c.
As shown in
Figure 8a, there is a high correlation between the stress curve of the ATB-25 groove and the seasonal alternation. The compressive stress increases from March to July and decreases from August to February. The peak of the stress curve appeared in July, and the low value appeared in February. This trend is the same as the local temperature change. When the temperature rises, the thermal expansion of the base layer leads to an increase in the compressive stress in the groove; when the temperature decreases, the frozen shrinkage of the base layer leads to a reduction in the compressive stress in the groove.
Comparing the different buried positions in the cross section, T1-2 > T1-1 > T1-3. Compressive stress peaks at T1-2 increase each year, and compressive stress peaks at T1-1 and T1-3 decrease every year (without considering the sudden change in stress at T1-3 in July 2023). There are two main reasons for this stress state: First, the vehicle load is mainly concentrated on 1/4 of the road. Secondly, the lateral constraints at the middle line and the side line of the road are relatively loose; the expansion stress can be released horizontally here, and the longitudinal expansion compressive stress is relatively reduced. As for the stress mutation phenomenon at T1-3, it is considered that the adjacent base layer has a huge expansion deformation, resulting in a sharp increase in the compressive stress of the ERG. After reaching the peak value, the stress curve shows a fluctuating decline. This is because the groove produces compression deformation, which releases part of the expansion stress and makes the stress curve decrease.
As shown in
Figure 8b, the stress change of GG eliminates the expansion groove and has little correlation with the seasonal alternation. However, the overall trend is still that the compressive stress increases in summer and decreases in winter. Compared with the ATB-25 groove, the stress of the three positions in the structure increases, and the compressive stress at the same stage is higher than that of the ATB-25 groove.
From the mechanism analysis, the compressive stress generated by the expansion groove is due to the thermal expansion of the base layer, so the change in the compressive stress is related to the seasonal change. When the GG is subjected to compressive stress, this part of the crushed stone will be pushed to both sides, resulting in the overall structure being able to work together. Therefore, the compressive stress trend in the whole expansion groove structure is consistent and increases during the monitoring period. It can be found that T2-3 also produced a stress mutation in April 2023, and showed a significant fluctuating downward process. According to the analysis, this fluctuating decline reflects the cyclic process of ‘stress increase-deformation generation-stress partial release-stress re-accumulation’.
As shown in
Figure 8c, the stress of CTB is related to seasonal alternation. The internal pressure stress of the base began to rise in March, peaked in July, declined in August, and reached a low value in February. The stress trend of CTB is consistent with the law of thermal expansion and cold contraction of materials. The decrease of the peak stress is due to the strength attenuation of the material under complex stress conditions.
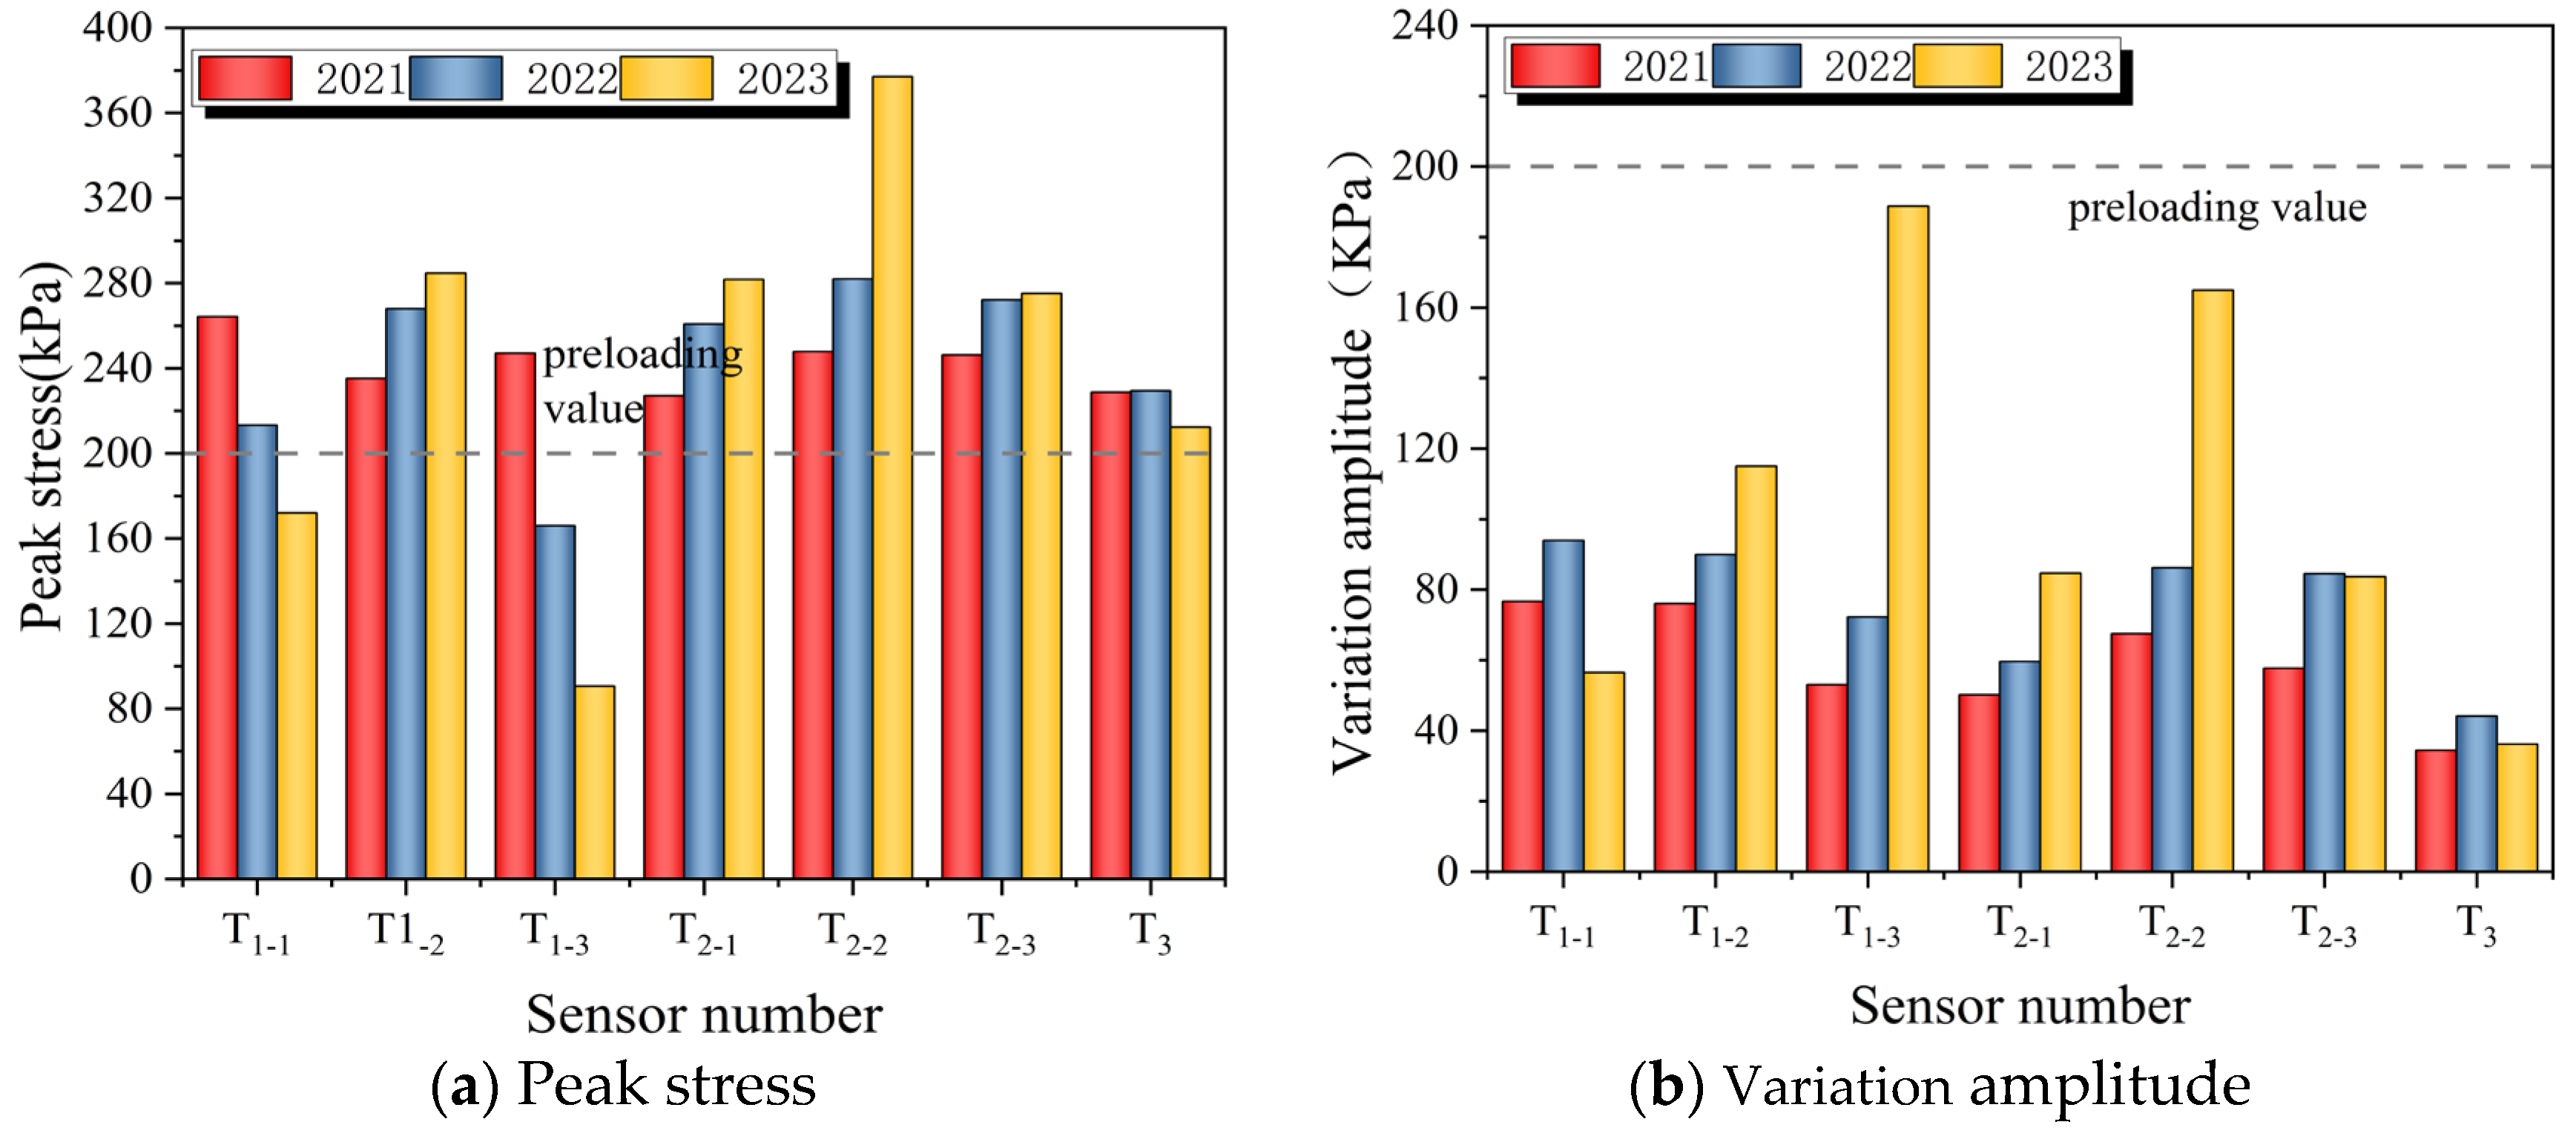
To compare the stress conditions in the structures, this paper makes a statistical analysis of the peak stress and the annual stress fluctuation amplitude in each year. The results are shown in
Figure 9.
The stress peaks at different positions in the ATB-25 groove show different trends. By the summer of 2023, the peak stress at T1-2 of the road increased to 142.33% of the initial stress; the peak stress at T1-1 and T1-3 decreased to 86.01% and 45.33% of the initial stress, respectively. In the GG groove, the stress peak at different positions shows the same trend. By the summer of 2023, the peak stress at T2-1, T2-2 and T2-3 increased to 140.84%, 188.5%, and 137.56% of the initial stress. The peak stress of the CTB is significantly smaller than that of the ERGs. The stress change is relatively stable and only slightly decreases in 2023.
Two kinds of ERG materials have opposite stress trends at the side line and the middle of the road. The analysis shows that this is mainly due to the difference in material properties. In the ATB-25 groove, the structural reorganization process is restricted by viscosity, and the deformation adjustment ability is weaker than that of GG. This makes the mixture at 1/4 of the road hard to push to the other sides, so the boundary filler is relatively loose. Coupled with the temperature and stress cycle, the strength of the material decays, so the peak compressive stress decreases.
It can be seen from
Figure 9b that the compressive stress change amplitude of the two kinds of ERGs is the same, and the peak value and variation range of stress in the grooves are significantly higher than those of CTB. This phenomenon fully shows the effect of relieving the expansion stress by the ERG. The pressure generated by the heat-salt is well released to both grooves so that its stress is maintained at a low level and relatively stable.
4.3. Base Displacement Analysis
According to the monitoring scheme of
Table 5, the displacement monitoring results are shown in
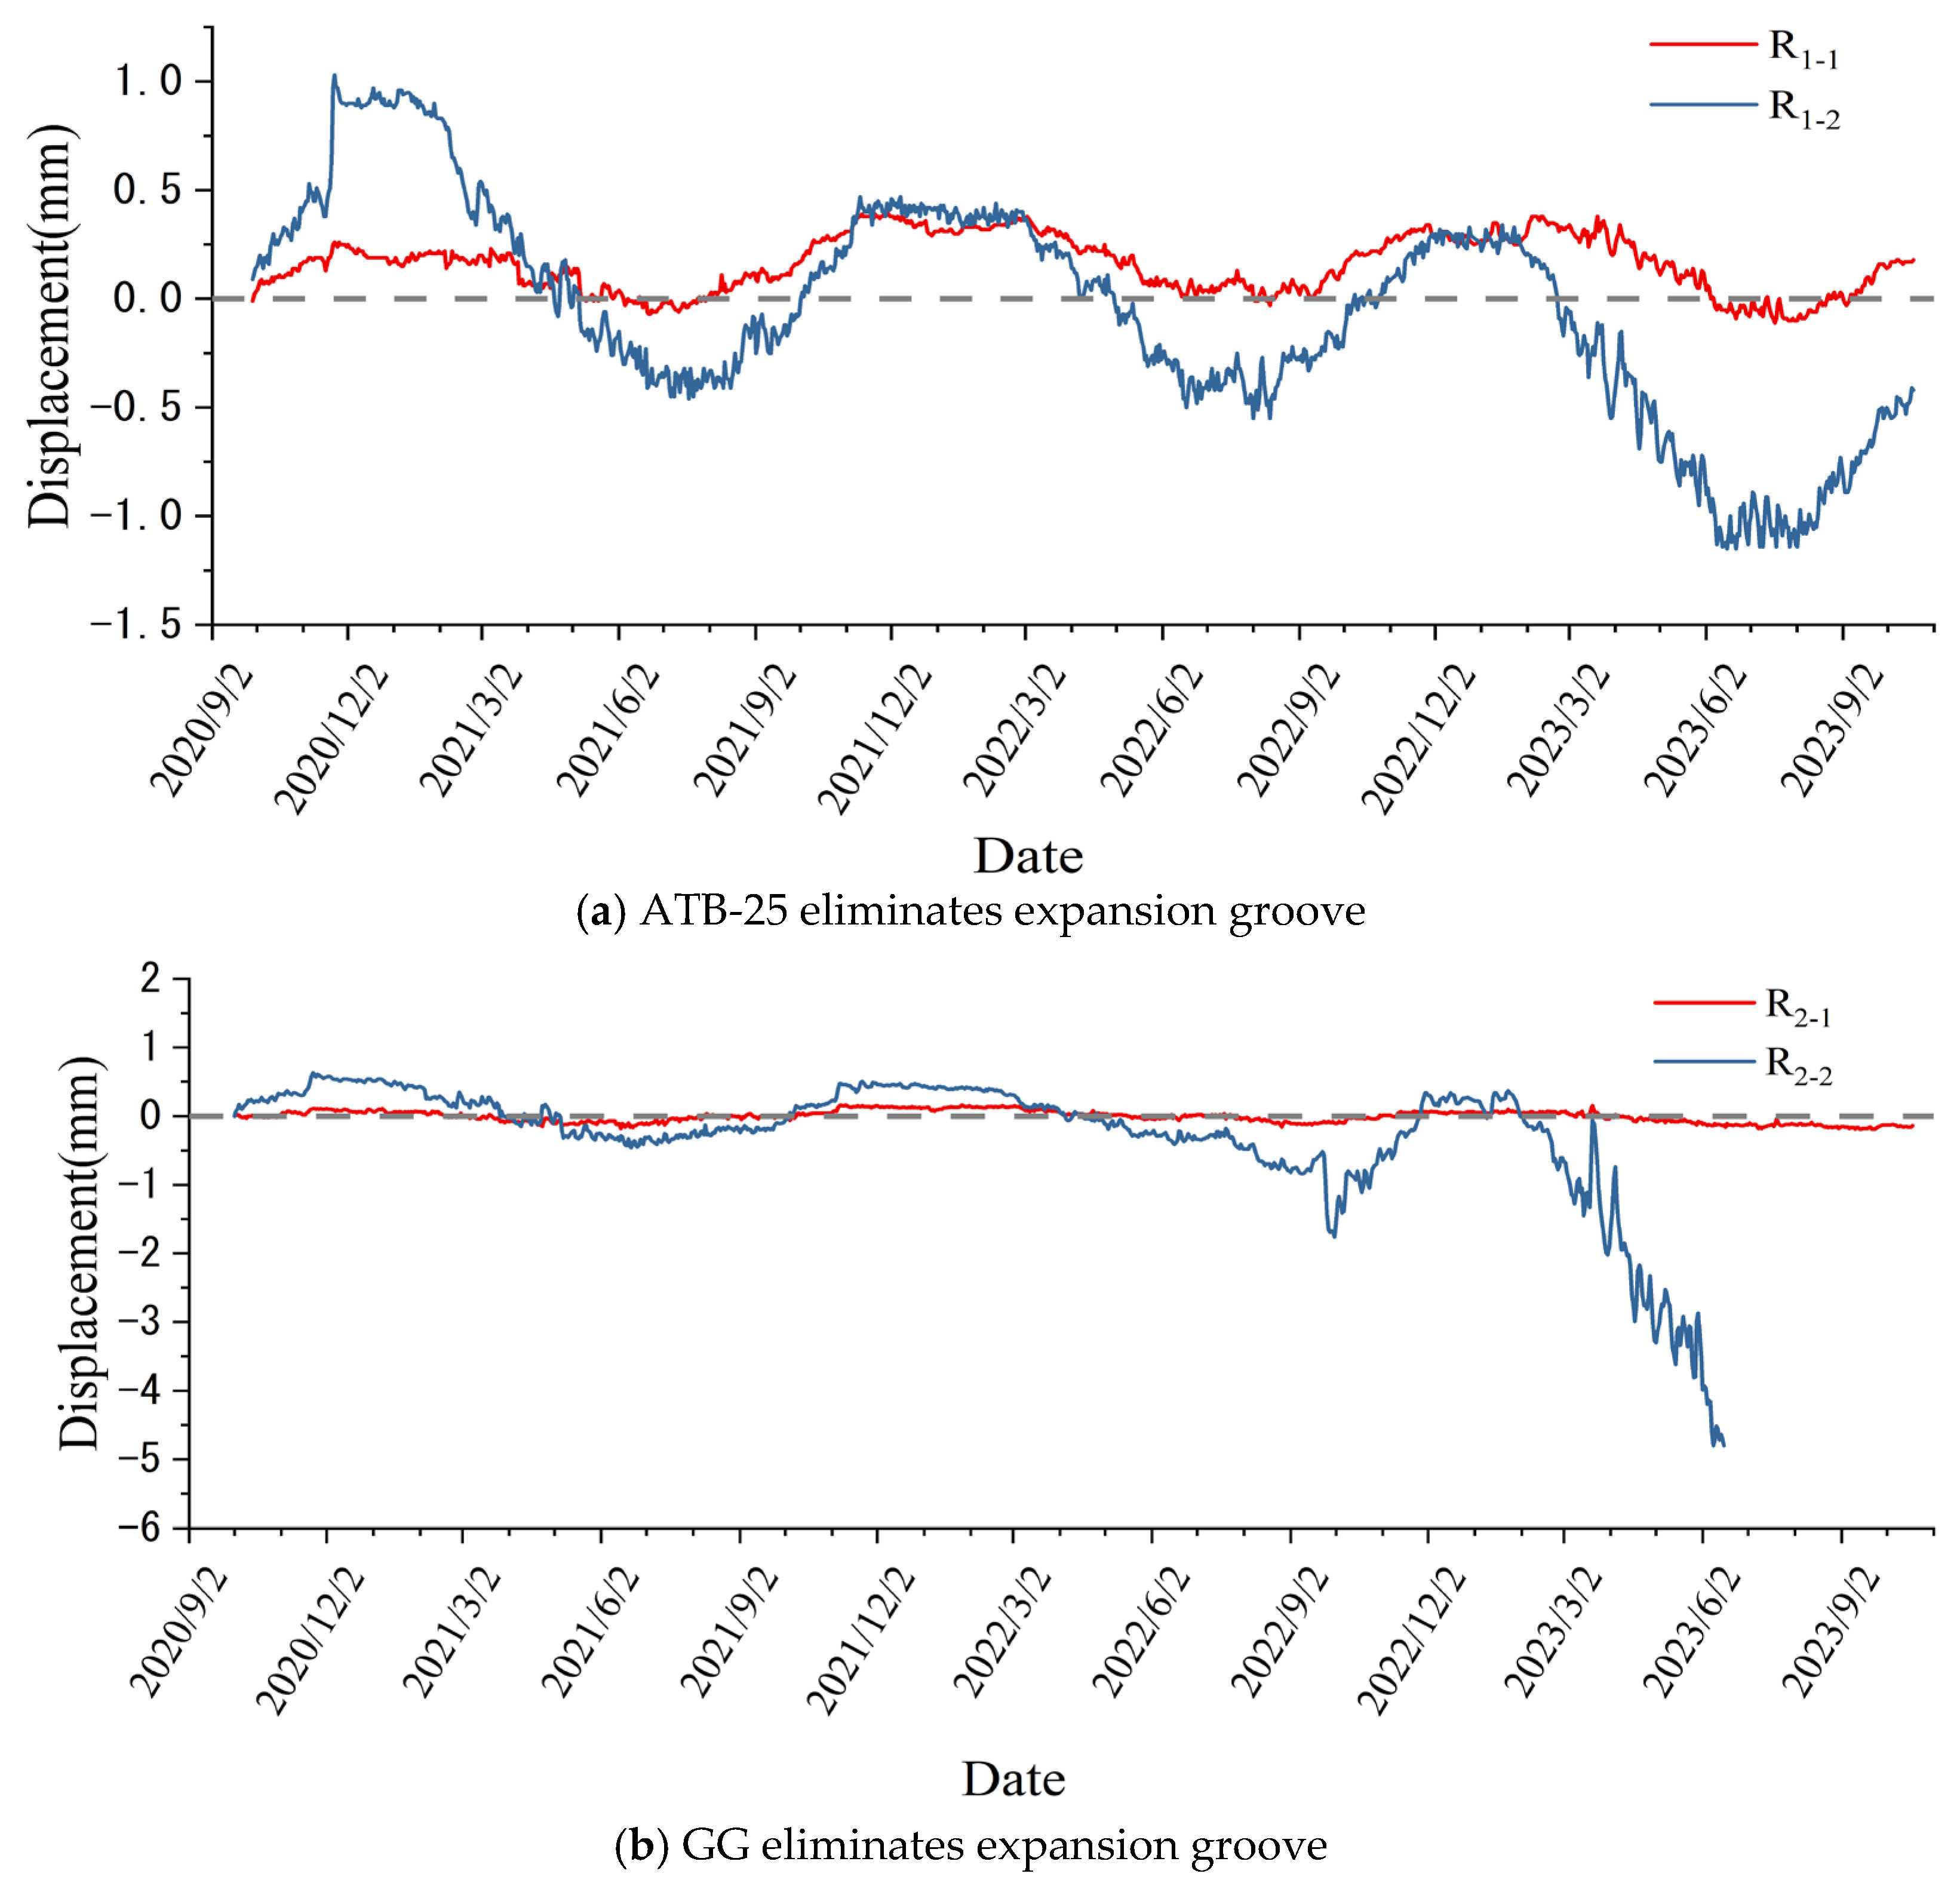
Figure 10a–c.
As shown in
Figure 10a, the displacement meter in the ATB-25 groove shows a negative number in summer. The thermal expansion of the (CTB) induces compressive stresses at locations where expansion joints have been omitted. This stress concentration results in measurable transverse compressive strain, manifested as a reduction in joint width. Displacement monitoring data corroborate this mechanistic behavior: positive readings recorded during winter conditions demonstrate the CTB’s volumetric contraction in response to temperature decreases, consistent with its coefficient of thermal contraction. Due to the bonding synergy and vehicle load, the ERG produces extension deformation and width recovery. Compared with different buried positions in the cross section, the displacement meter data at R
1-2 fluctuated significantly with the seasons. In summer, large compressive deformation occurs, and in winter, the deformation is partially restored, and the peak value of compressive deformation increases year by year. The displacement curve at R
1-1 is relatively flat, and the peak value of compression deformation is controlled within 0.3 mm, without deformation accumulation. Combined with the stress monitoring data, the mechanism of displacement changes in the ATB-25 groove is fully explained. At 1/4 of the road, the vehicle load is mainly concentrated here, and the lateral constraint is tight. Therefore, the peak compressive stress is large, and the compressive deformation increases during the monitoring period. At the side line, the distribution of vehicle loads is less and the lateral constraint is loose, so the peak compressive stress is small, and the compressive deformation is relatively stable.
From
Figure 10b, it can be seen that the variation law of the displacement with the alternation of seasons in the GG groove is the same as that in the ATB-25 groove. In 2023, the compression deformation of R
2-2 (4.85 mm) is significantly larger than the compression deformation of R
1-2 (1.15 mm). There are two main reasons for this phenomenon. Firstly, in 2023, the compressive stress at T
2-2 (385 KPa) is 32% higher than that at T
1-2 (115 KPa). Secondly, the deformation adjustment ability of the GG is better, and the gravel at 1/4 of the road can be pushed to other sides, so a large compression deformation is generated. The compression deformation at R
2-2 surged in April 2023, corresponding to the T2-2 stress surge at the same stage. Therefore, it can be considered that the expansion of the adjacent base leads to a sharp increase in the compressive stress in the groove, resulting in a large compressive deformation, and the position of the sensor is offset, so the monitoring data is distorted.
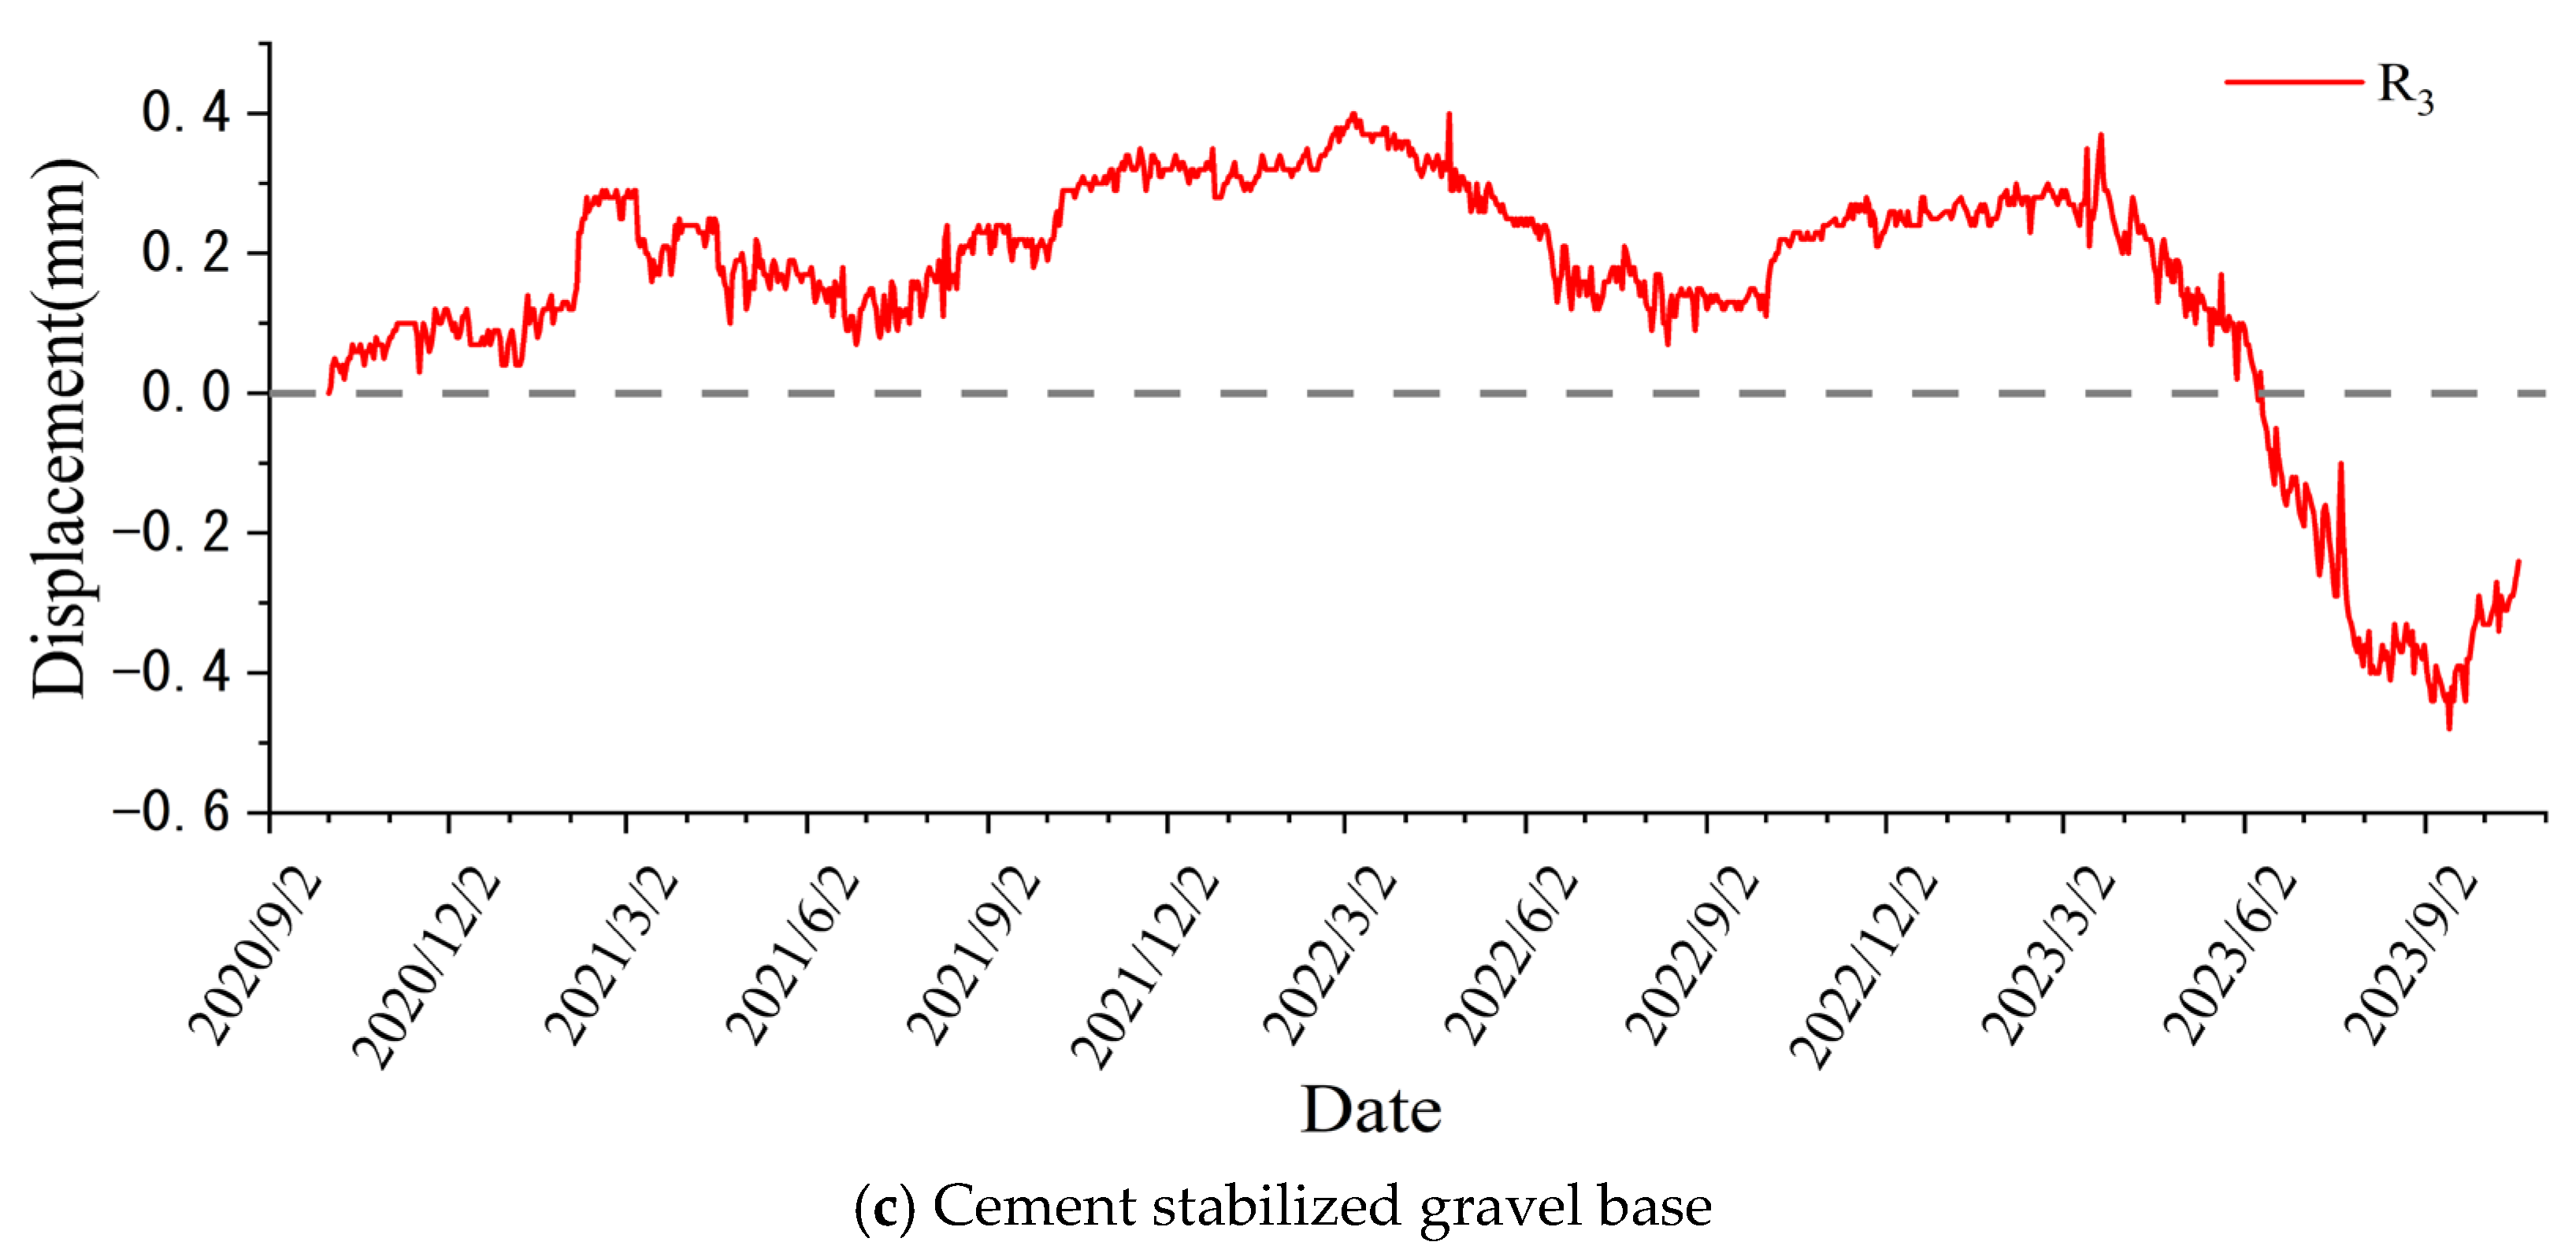
It can be seen from
Figure 10c that the CTB did not produce compression deformation in the first two years after the road operation. Because of the deformation adjustment effect of the ERG on both sides, the base mainly produced extension deformation. In 2023, the compressive deformation accumulated in the expansion grooves on both sides reached the peak, and the deformation adjustment ability was weakened, so the compressive deformation was generated.
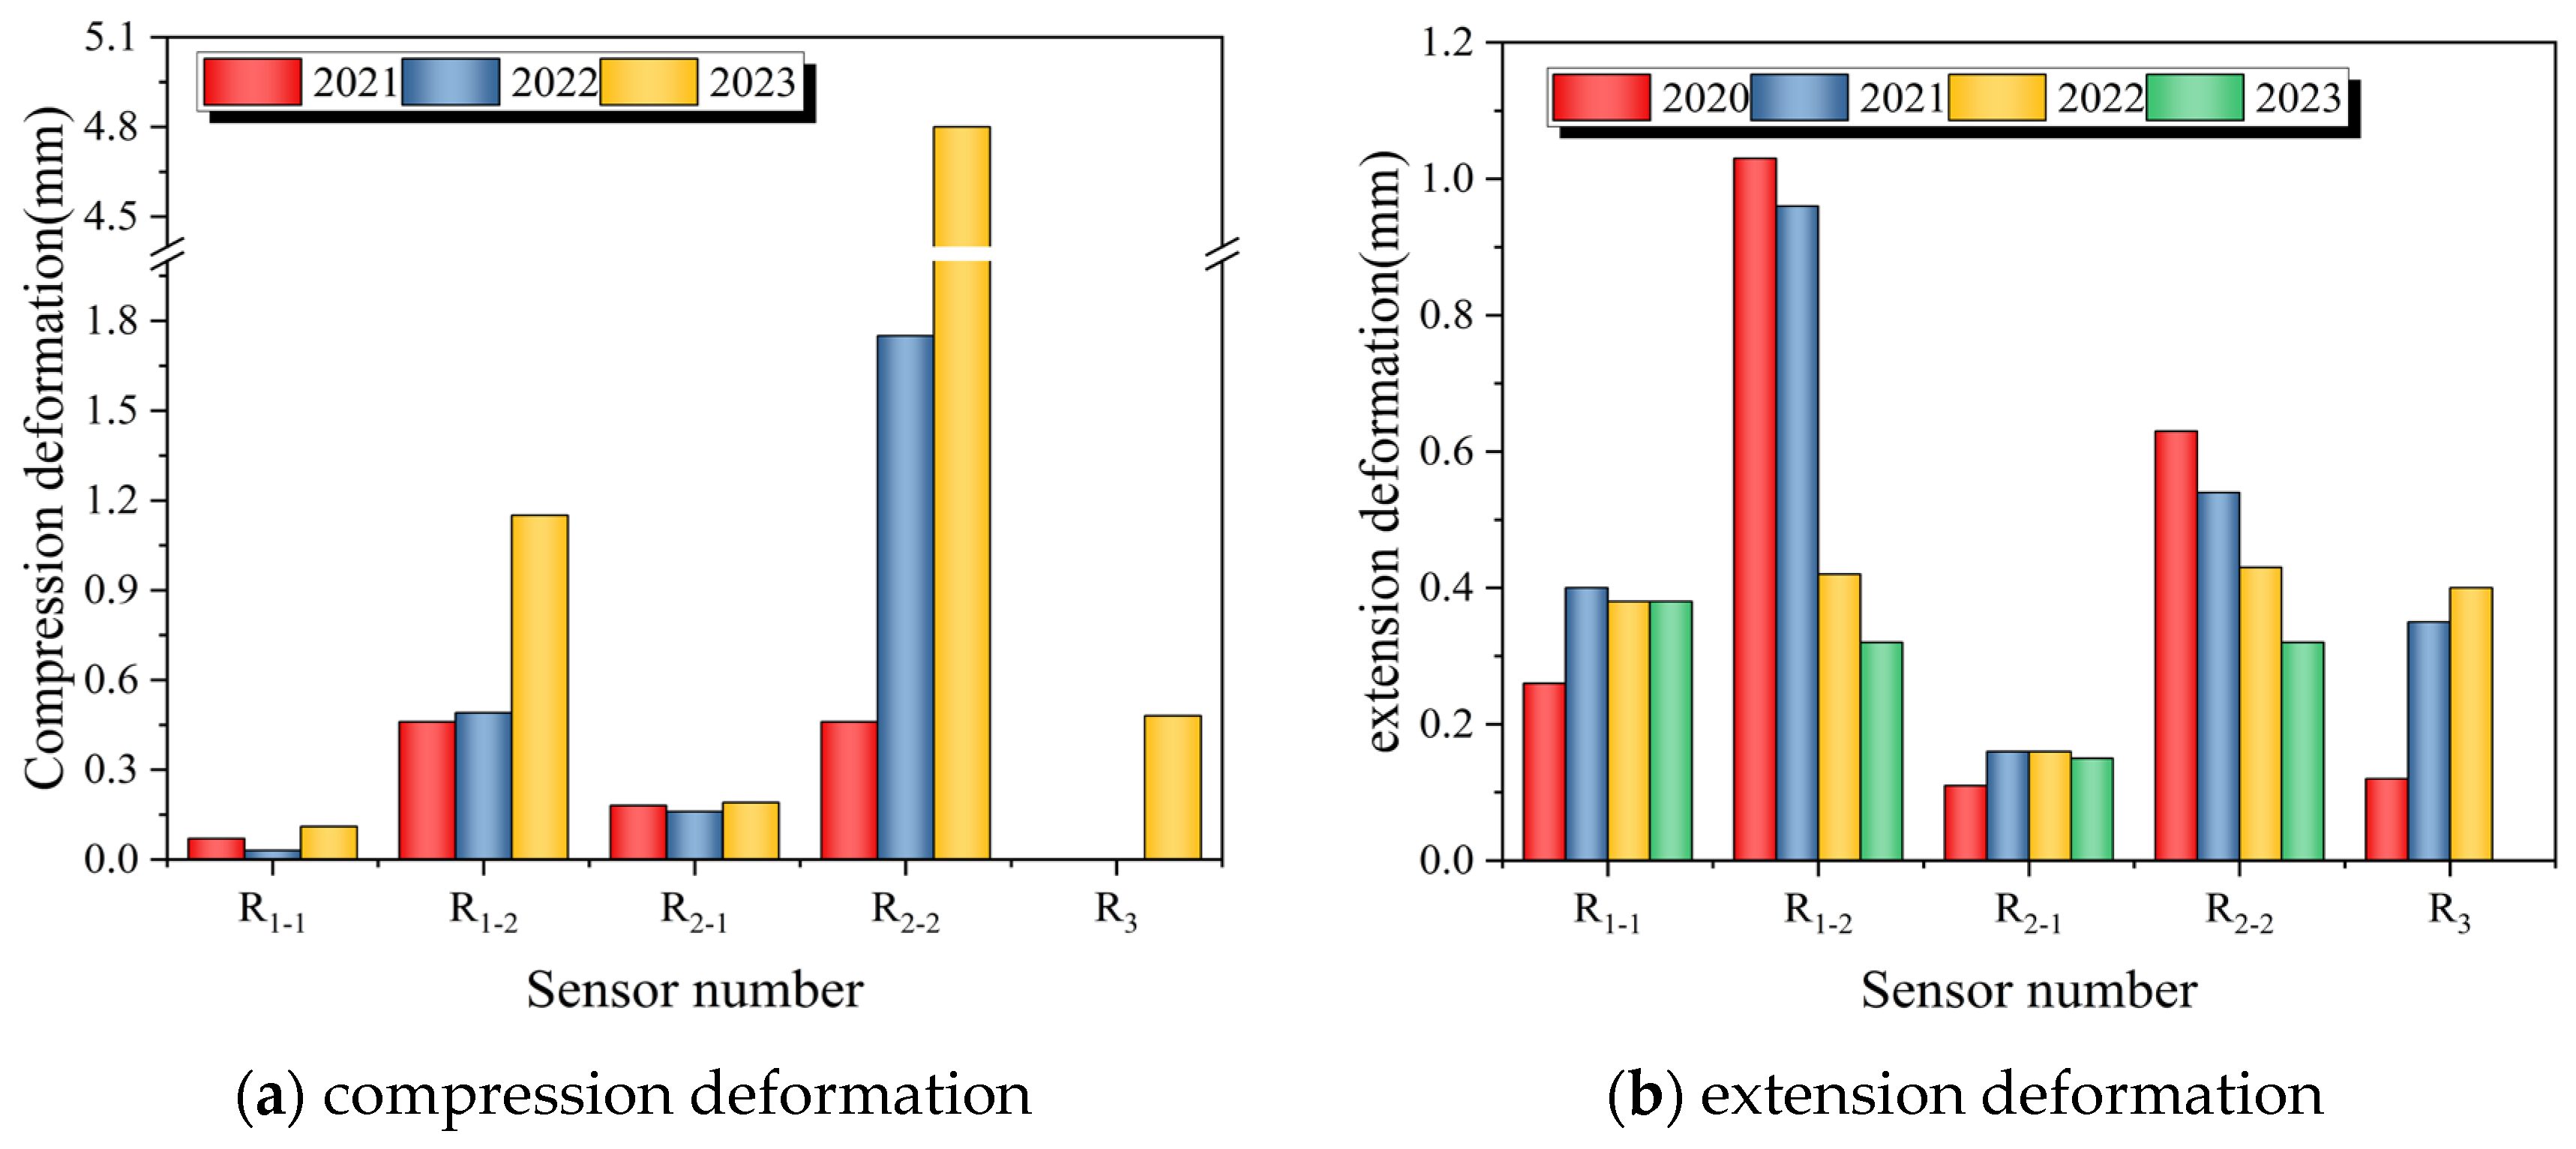
To facilitate the comparison of the deformation characteristics of different structures, this paper makes a statistical analysis of the peak deformation in different positions over 3 years. The specific results are shown in
Figure 11.
As shown in
Figure 11a. The analysis of different buried positions shows that the compression deformation at 1/4 of the road is greater than that at the side line. This is consistent with the stress distribution in the groove. The reason for this phenomenon is the load distribution and boundary constraints. The analysis of different structures shows that the compression deformation of the GG groove > ATB-25 groove> CTB. The analysis of different years shows that the peak value of compression deformation increases across all monitoring phases, and the compression deformation of 2023 at 1/4 of the road is the most significant. The peak compression deformation of R
1-2 in 2023 (1.15 mm) increased by 155% compared with that in 2021 (0.45 mm). The peak compression deformation (4.8 mm) at R2-2 in 2023 increased by 943% compared with that in 2021 (0.45 mm). R3 did not produce compression deformation in 2021 and 2022, and only produced a compression deformation of 0.48 mm in the summer of 2023.
The difference in compression among structures reflects the deformation adjustment ability of the ERG. The larger the compression deformation, the better the deformation adjustment ability. The compression deformation of CTB is smaller than that of both grooves, which verifies that both grooves have a good eliminate expansion effect. The compression deformation of the GG groove is larger than that of the ATB-25 groove, which proves that the GG groove has better deformation adjustment ability and is more suitable for filling the ERG.
From
Figure 11b, the analysis of different buried positions shows that the extension deformation at 1/4 of the road is greater than that at the side line. The analysis of different structures shows that the extension deformation of ATB-25 groove > GG groove > CTB. The analysis of different years shows that the extension deformation at R
1-2 and R
2-2 decreases, the extension deformation at R
3 increases, and the extension deformation at R
1-1 and R
2-1 is relatively stable over the course of monitoring.
The peak value of extension deformation is decreasing throughout the monitoring process. It shows that there is plastic deformation accumulation in both structures under the action of the annual temperature cycle. The CTB produces seasonal expansion and contraction, and the plastic deformation accumulates in the cycle process. Therefore, it produces greater compressive stress on the ERG and makes the ERG produce increasing compression deformation. When the ERG is subjected to compressive stress, the plastic deformation also accumulates. This part of the deformation did not recover with the base retraction in winter, resulting in the expansion deformation of the groove decreasing across all monitoring phases. The cumulative effect of plastic deformation makes it necessary to consider the time effect when using the ERG. When the accumulation of plastic deformation in the groove is overly large, the deformation coordination performance will decrease, and the structure will lose the eliminate expansion effect.
4.4. Temperature-Stress-Deformation Multi-Field Coupling Analysis
Through the previous analysis, it was found that the stress and displacement of the ERGs are closely related to the seasonal variation, as shown in
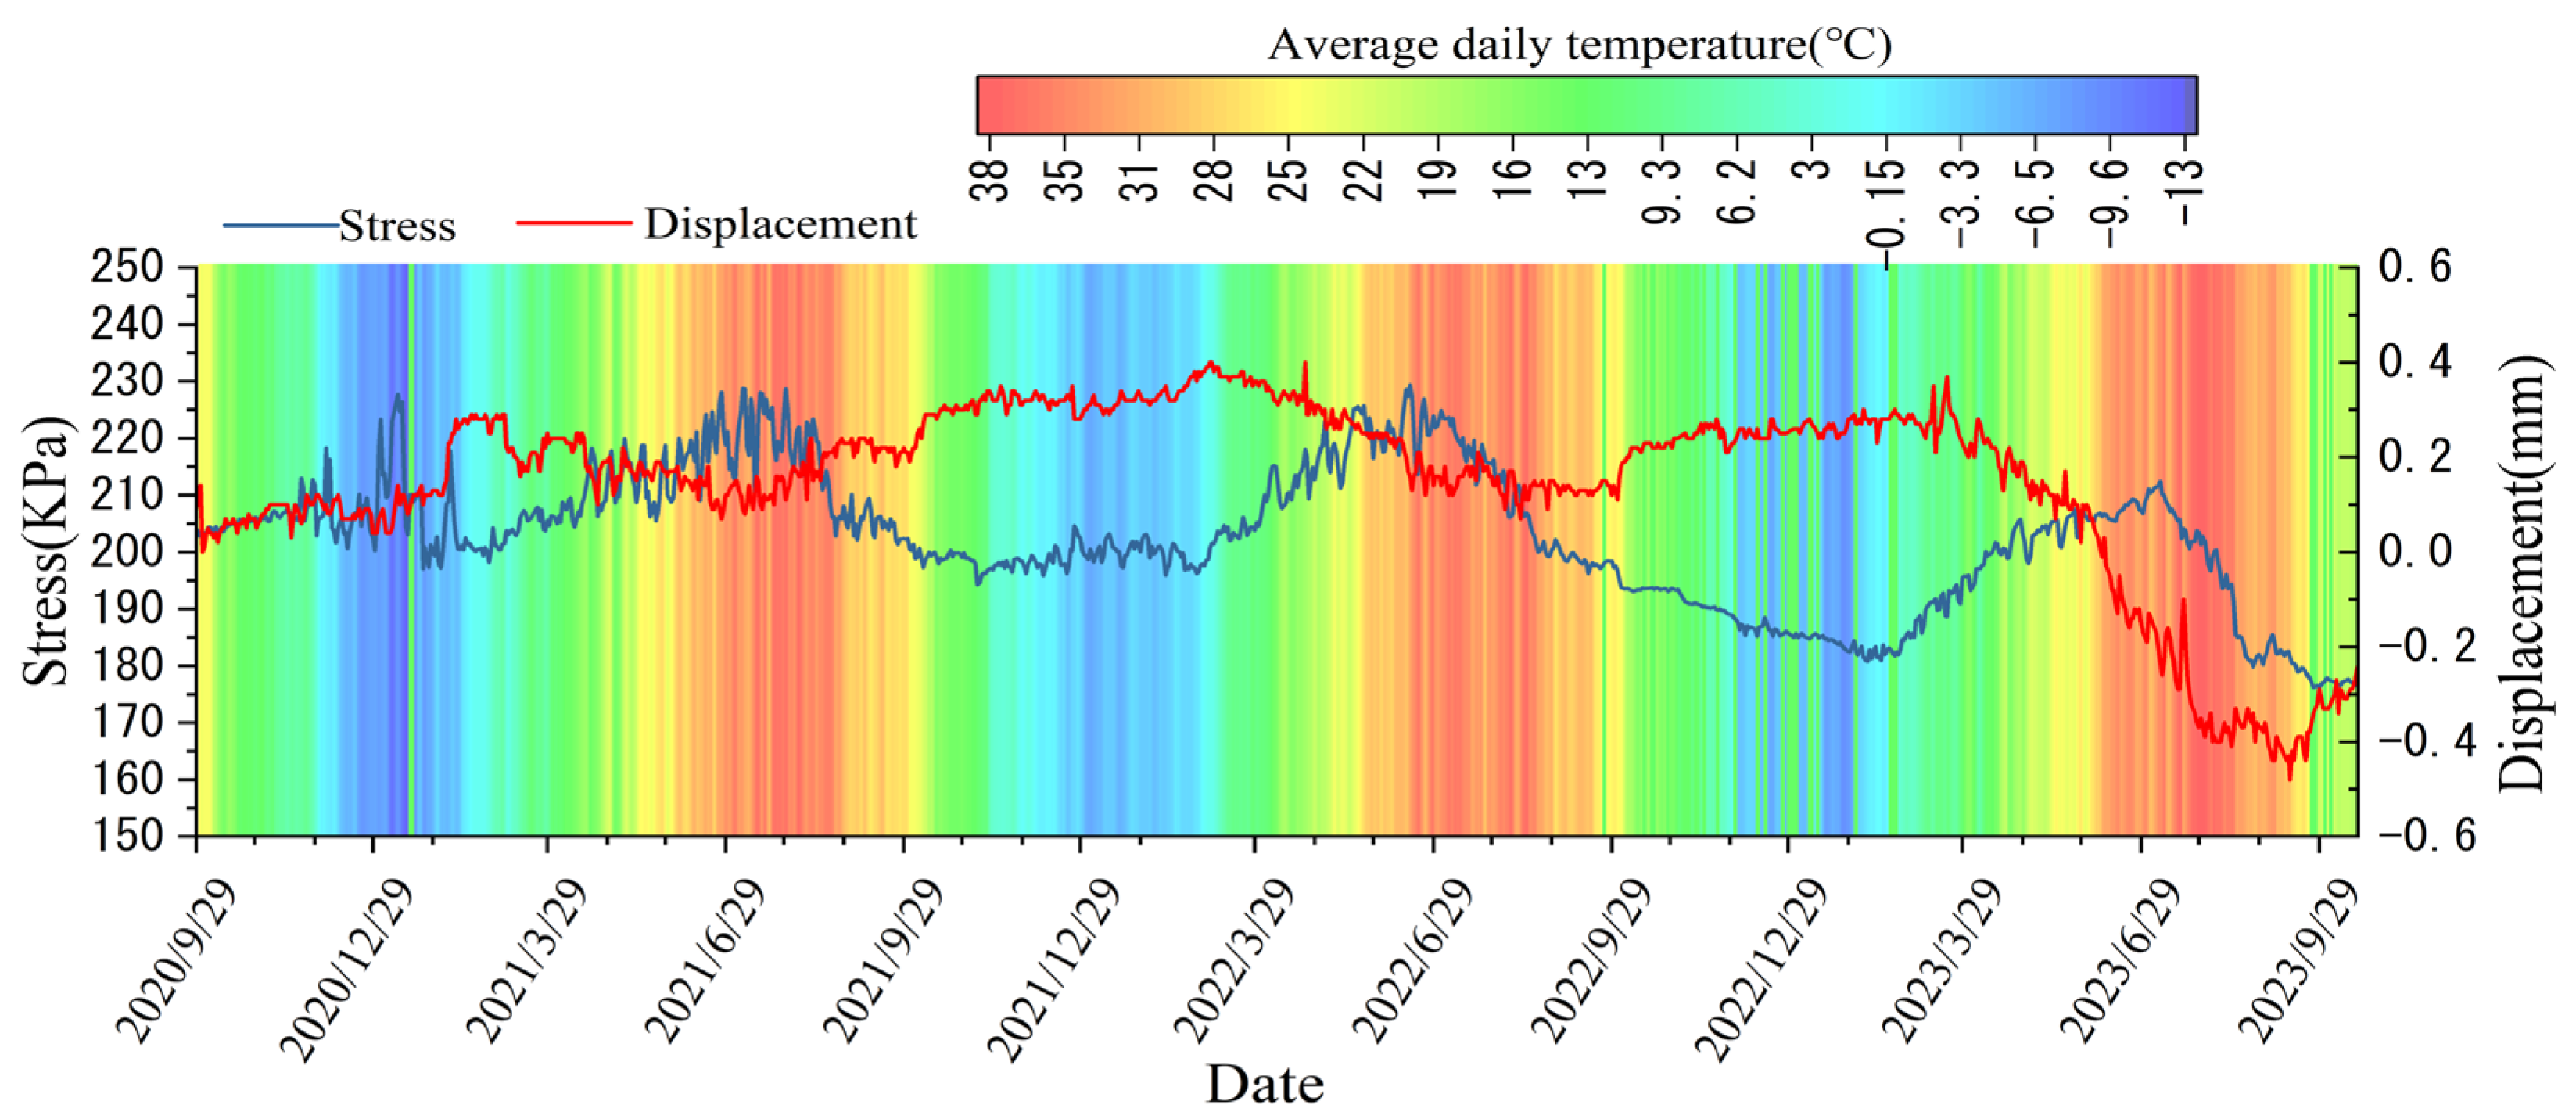
Figure 12. To fully analyze the mechanical behavior of the pavement with the ERGs under the condition of a large temperature difference, this paper uses the three-field combined analysis method of temperature-stress-deformation to evaluate its expansion relief ability.
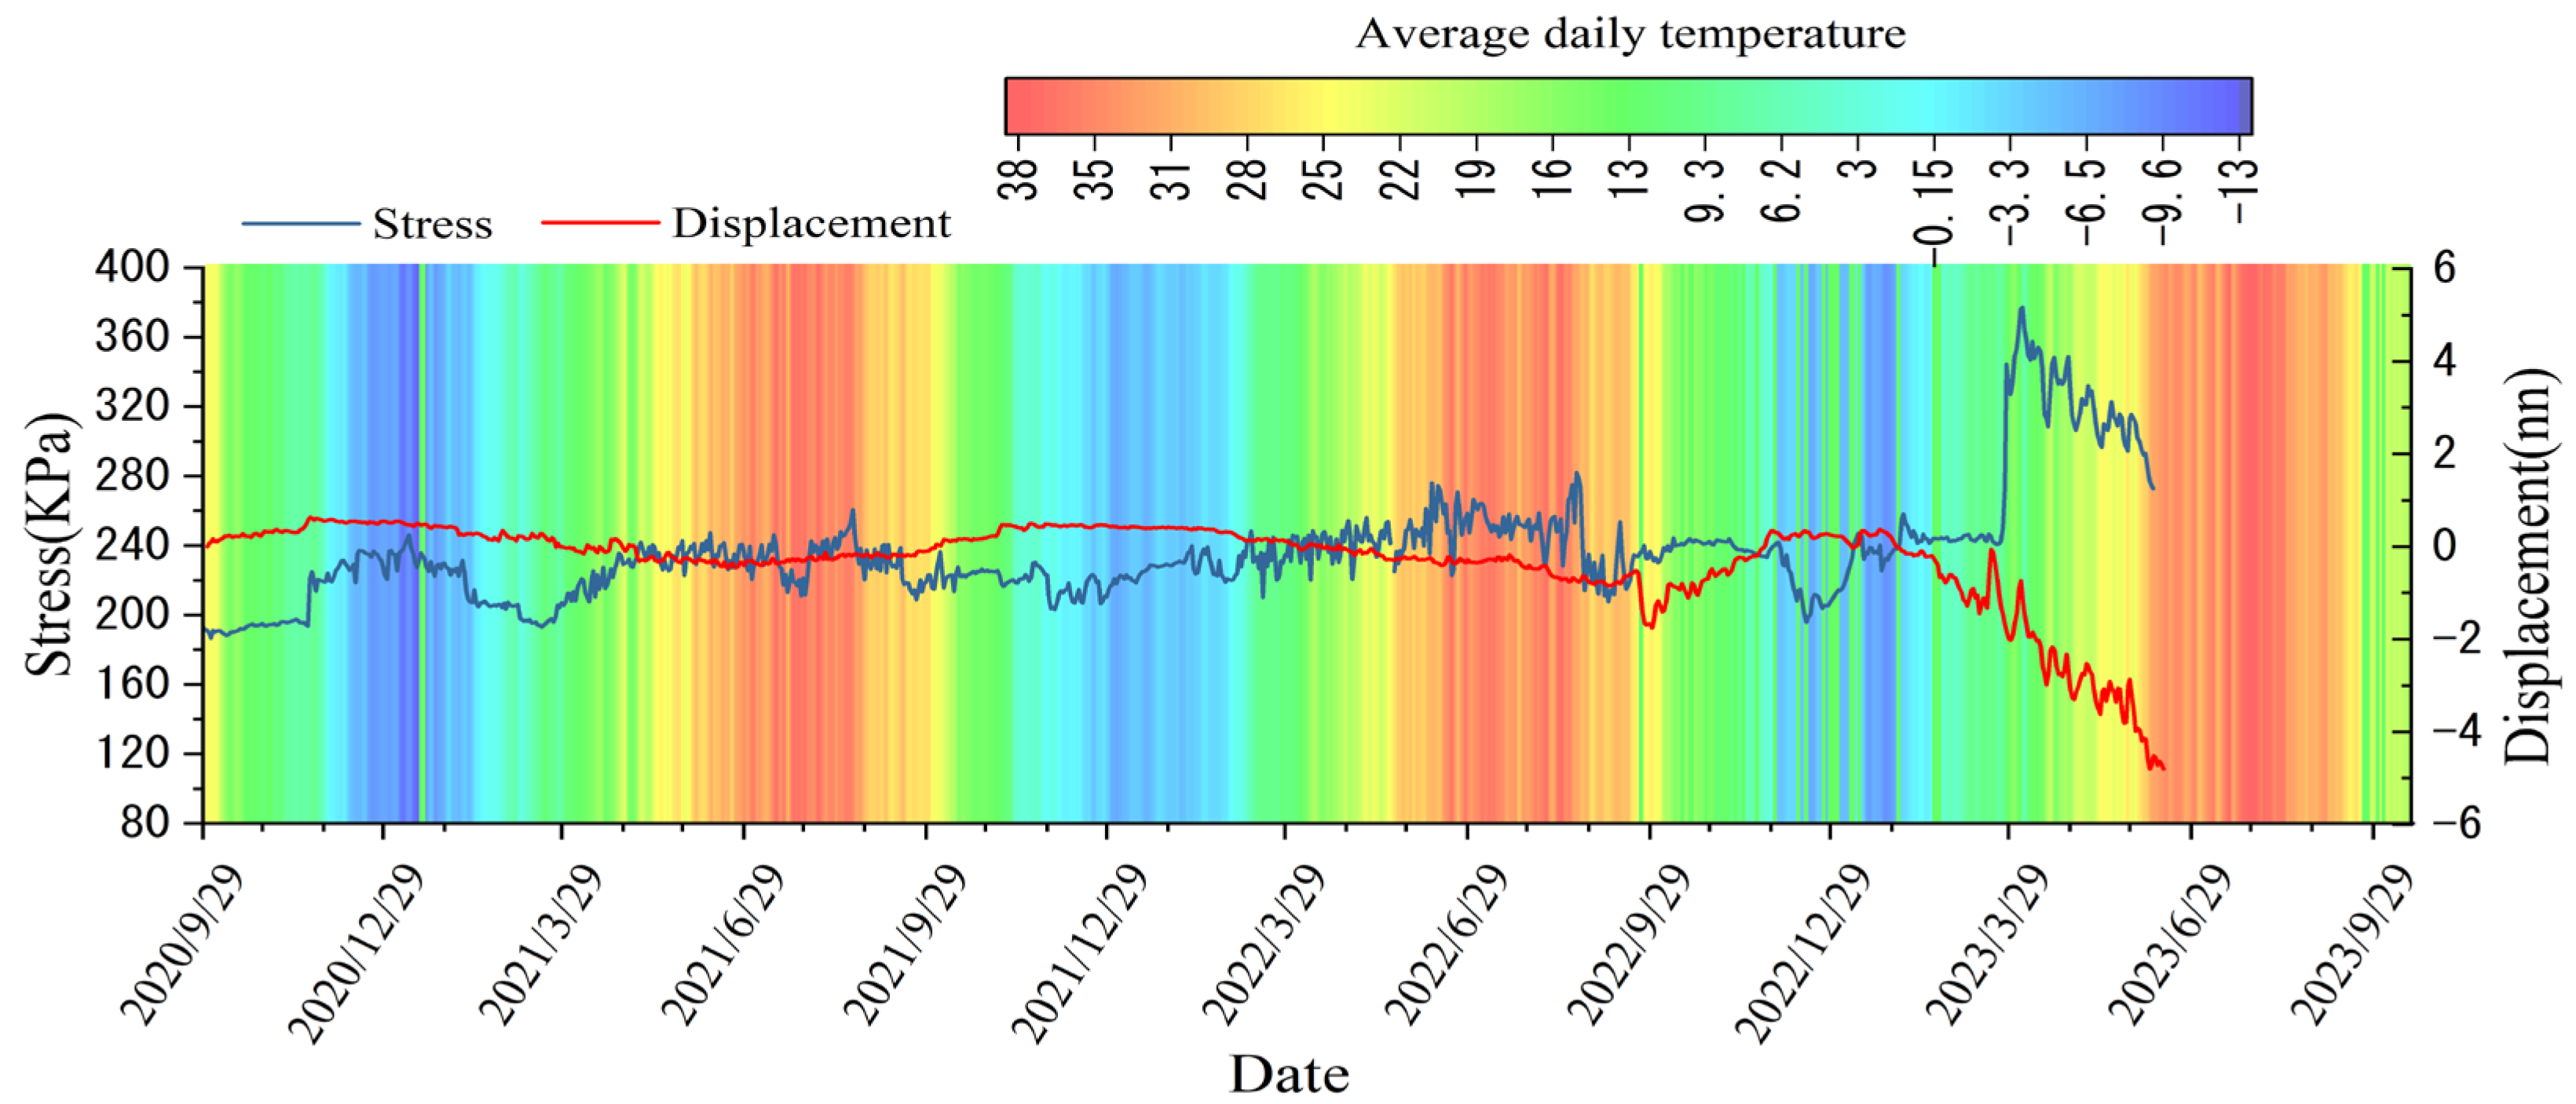
4.4.1. ATB-25 ERG
Figure 13 illustrates the variations in temperature, stress, and displacement fields within the ATB-25 ERG over a three-year period. It is evident that changes in structural stress and displacement fields are highly correlated with temperature fluctuations. (1) From June to August, the local warm season, temperatures within the pavement structure exceed 25 °C. Under high-temperature conditions, the CTB undergoes thermal expansion, leading to an increasing trend in compressive stress on the ATB-25 ERG, resulting in compressive deformation (indicated by negative displacement values). (2) During the local cold season (December to February), pavement temperatures drop below 0 °C, causing the thermally expanded cement-stabilized base layer to contract. Consequently, compressive stress on the ATB-25 expansion relief groove decreases, with partial recovery of compressive deformation and minor tensile deformation occurring under vehicle loads.
Over the three-year operational period, the peak compressive stresses were: 235.2 kPa (July 2021), 267.94 kPa (June 2022), and 284.66 kPa (June 2023). The maximum compressive deformations were: 0.46 mm (August 2021), 0.49 mm (August 2022), and 1.15 mm (August 2023). Temperature peaks within the structure reached 41 °C (July 2021), 41 °C (July 2022), and 41 °C (August 2023). Comparative analysis reveals a slight increase in annual stress peaks and a significant rise in annual deformation peaks over the three-year service period. The analysis suggests that plastic deformation gradually accumulates in the cement-stabilized crushed stone base layer during actual service, leading to a year-by-year increase in compressive stress on the expansion relief groove. The ATB-25 expansion relief groove experiences reduced fatigue strength under sustained compressive stress and accumulates partial plastic deformation, ultimately causing a sharp surge in compressive deformation during the third year.
Additionally, a hysteresis effect is observed in the timing of deformation peaks, which typically occur approximately one month after stress peaks. This phenomenon is attributed to the fact that the ERG functions as a passive load-bearing structure, with its compressive stress governed by the deformation process of the cement-stabilized crushed stone base layer. During high-temperature periods, thermal expansion of the cement-stabilized base layer generates compressive stress on the groove, reaching peak stress levels. Under prolonged high temperatures, the groove continues to endure elevated compressive stress, accumulating plastic compressive deformation over time. As a result, the peak compressive deformation generally occurs after the peak stress.
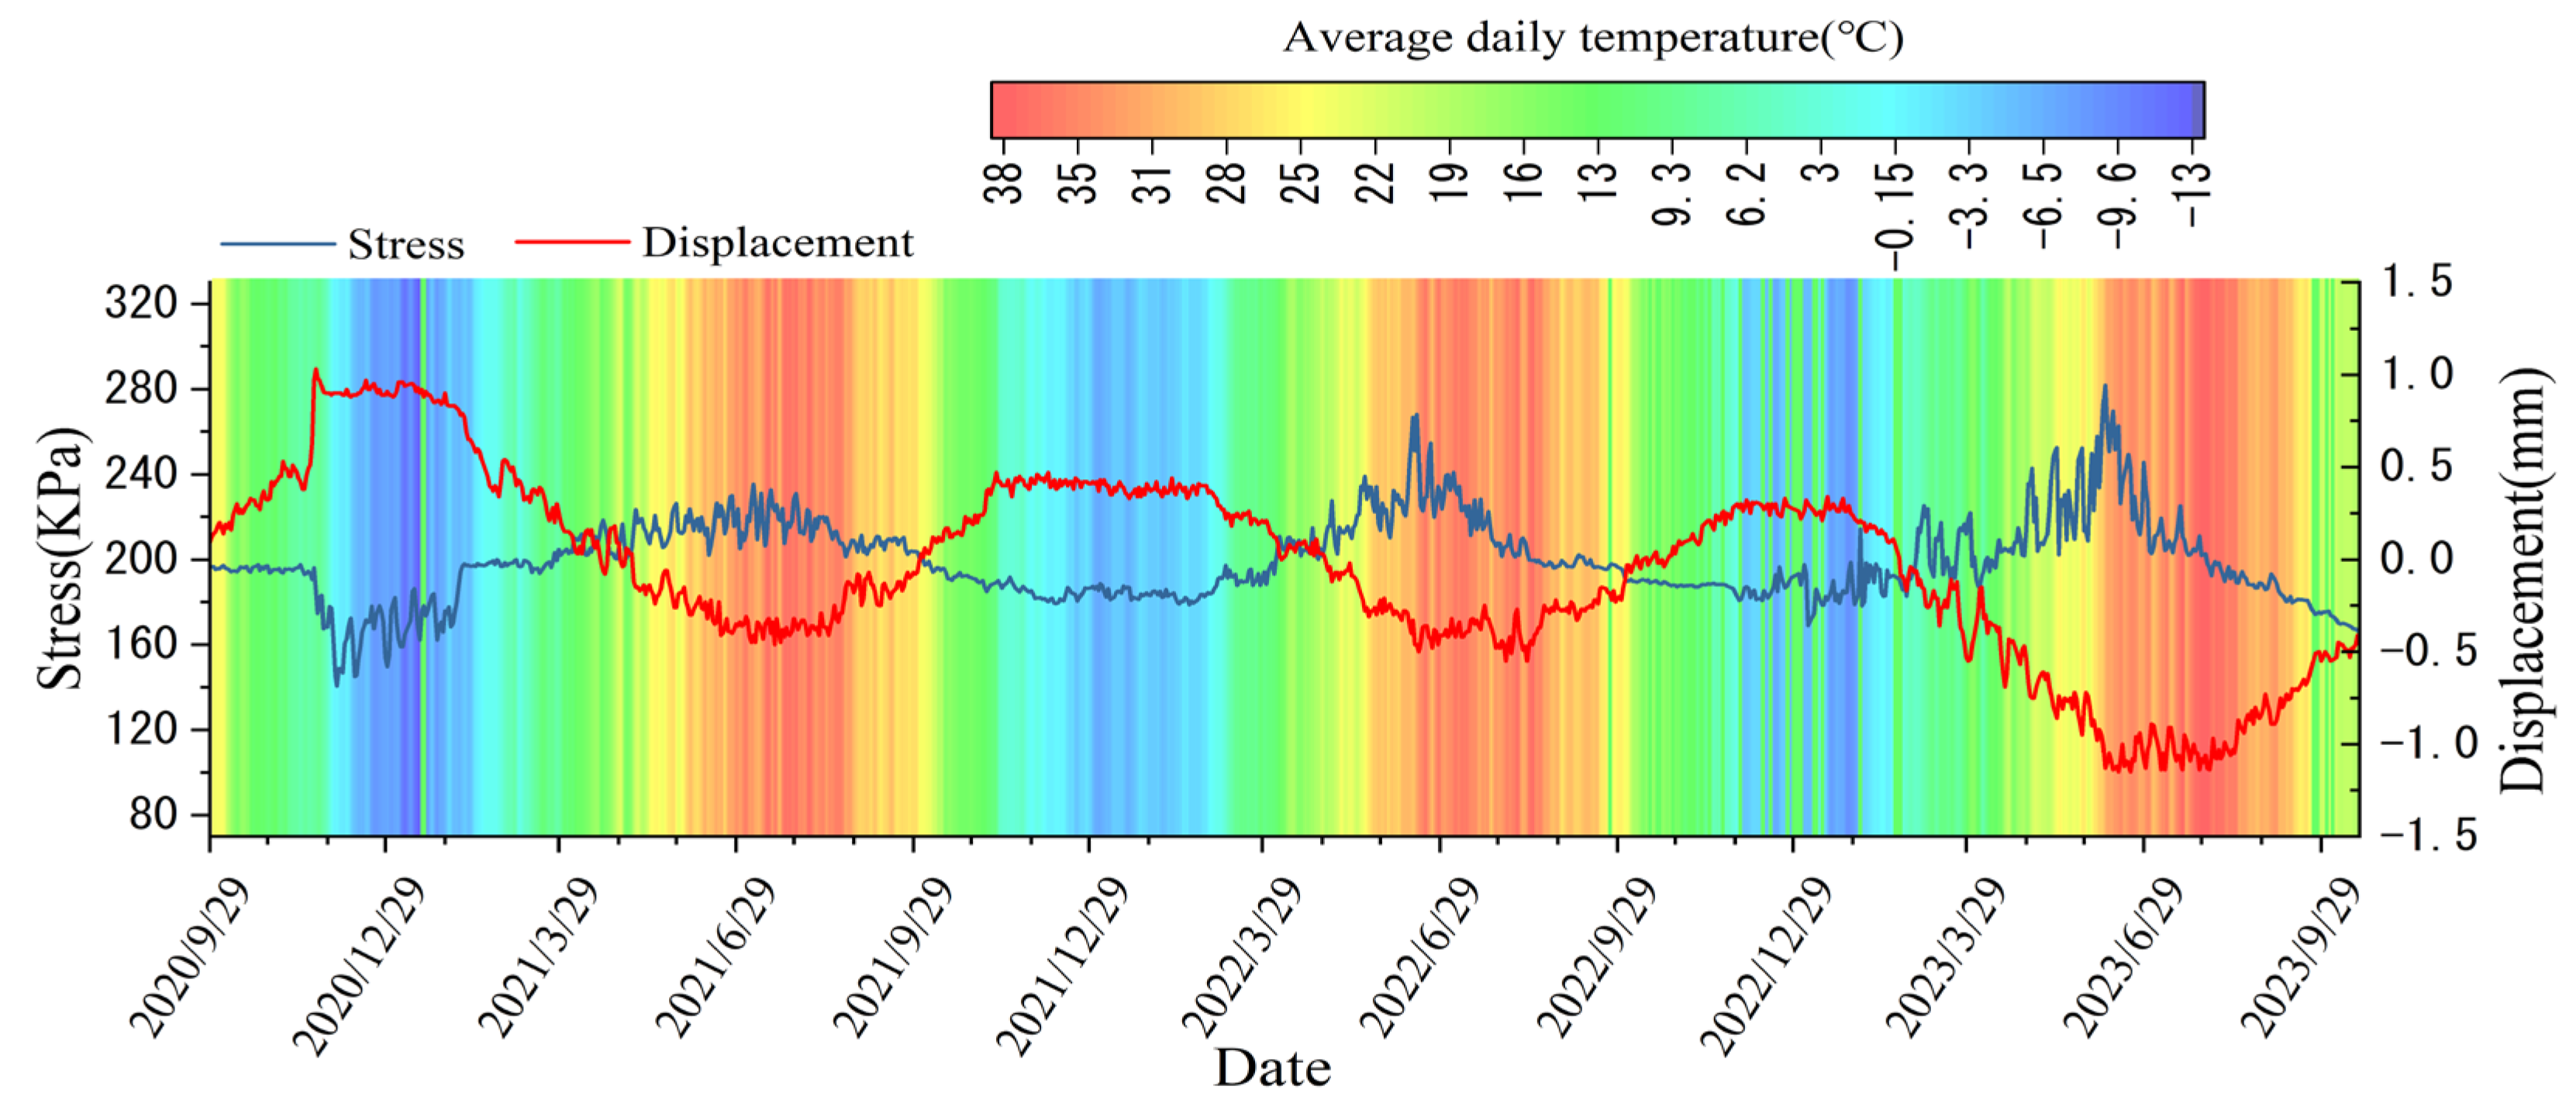
4.4.2. GG ERG
Figure 14 illustrates the variations in temperature, stress, and displacement fields of the graded gravel expansion relief groove over a three-year period. Compared to the ATB-25 expansion relief groove, the stress and deformation fields of the graded crushed stone groove exhibit weaker correlations with temperature. Nevertheless, it still follows the fundamental pattern of increased compressive stress and compressive deformation during summer, and reduced compressive stress with partial recovery of deformation during winter.
In contrast to the ATB-25 groove, the graded crushed stone groove features a loose structure. Under compressive stress, it undergoes structural reorganization, leading to stress redistribution within the base layer. Consequently, the stress and displacement fields exhibit more complex variations.
The maximum compressive deformation recorded in the GG ERG (4.8 mm) is 317.4% higher than that of the ATB-25 (1.15 mm). This indicates that the GG exhibits superior deformation adjustment capability compared to the ATB-25 groove. Therefore, it is recommended to use GG as the filler material for expansion relief grooves to address arching deformation defects.
4.4.3. CTB
Figure 15 comprehensively shows three changes at 1/4 of the CTB. There is a certain correlation between stress and temperature. The thermal expansion and cold contraction of CTB under a large temperature difference environment is the main cause of arch expansion disease in the region. It can be seen that the compressive stress of the base increases in summer and decreases in winter. The deformation is relatively stable in the first two years, and the compressive deformation occurs in the summer of the third year. During the three-year road operation period, the compressive stress peaks were: 228.74 kPa (2021-7), 229.32 kPa (2022-6), 212.34 kPa (2023-6); compression deformation peaks were: 0.48 mm (2023-9); the temperature peaks in the structure were: 38 °C (2021-7), 37.7 °C (2022-7), 39 °C (2023-8).
It is found that the peak value of compressive stress in CTB is smaller than that of the two measuring expansion grooves, and there is no compression deformation in the first two years of service. This verifies the stress release effect and deformation adjustment effect of the ERG structure on the base arch expansion. The 0.48 mm compression deformation generated in the summer of 2023 shows that with the increase of time, the plastic deformation accumulated in the groove reaches a certain threshold, and the deformation coordination ability decreases. Therefore, it is necessary to consider the attenuation of its deformation adjustment performance with time and maintain it regularly when using the ERG to deal with the thermal-salt arch expansion disease of CTB.
From the above, it can be seen that the seasonal temperature change trend is the main external factor driving the thermal expansion deformation of the CTB.
Table 6 lists the thermal-mechanical-deformation trends of CTB in different seasons.
5. Discussions
5.1. Filler Suitability Analysis
Both GG and ATB-25 ERGs show a good effect on alleviating the arch expansion of the base during service.
Among them, ATB-25 material belongs to a viscous-elastic-plastic material, which has good cooperative working ability with each structure. There is no obvious surge or drop in the stress and deformation curve, and the curve is relatively continuous. However, the temperature sensitivity of the material is high, and the internal temperature change is more intense. It is easy to produce temperature stress during service, which is not conducive to the maintenance of the service performance of the ERG.
Graded Gravel is a kind of flexible material with a loose structure. It has good deformation coordination ability. The material is not sensitive to temperature; the performance is relatively stable in a large temperature difference environment. Compared with the ATB-25 ERG, the GG produced greater compression deformation during the high temperature period in summer, indicating that the effect of relieving arch expansion was better than that of ATB-25, so the graded gravel was more suitable as the ERG filler.
5.2. Economic Efficiency Analysis
According to the survey results of the disease in the area, 103 arch expansion diseases occurred in the KL400-KL500 section without the anti-expansion groove. The local road maintenance department currently adopts the method of re-milling to deal with such diseases. The average cost of dealing with arch disease is about 3000 yuan, so the local road maintenance department has a road maintenance cost of up to 300,000 yuan per 100 km of road sections every year. The use of ERGs to deal with arch diseases can effectively reduce the frequency of the expansion and the height of arching, save a lot of maintenance costs, and reduce the risk of vehicle rollover instability caused by road arching.
The spacing of the expansion groove is 200 m, and 500 expansion grooves need to be laid every 100 km. The laying cost of each expansion groove is 1300 yuan, and the one-time laying cost is about 650,000 yuan. Compared with the existing treatment scheme of arch expansion disease, according to the 15-year service cycle of the first-class road, the maintenance cost of the road maintenance part is 4.5 million yuan per 100 km. Using ERGs to prevent arch expansion disease can save nearly 4 million yuan of road maintenance costs and reduce the risk of related accidents.


