Article

Crushed Stone Grain Shapes Classification Using Convolutional Neural Networks

by
Alexey N. Beskopylny
1,*,
Evgenii M. Shcherban’
2,
Sergey A. Stel’makh
3,
Irina Razveeva
3,
Alexander L. Mailyan
4,
Diana Elshaeva
3,
Andrei Chernil’nik
3,
Nadezhda I. Nikora
3 and
Gleb Onore
5
1
Department of Transport Systems, Faculty of Roads and Transport Systems, Don State Technical University, 344003 Rostov-on-Don, Russia
2
Department of Engineering Geometry and Computer Graphics, Don State Technical University, 344003 Rostov-on-Don, Russia
3
Department of Unique Buildings and Constructions Engineering, Don State Technical University, 344003 Rostov-on-Don, Russia
4
Department of Urban Construction and Economy, Don State Technical University, 344003 Rostov-on-Don, Russia
5
Institute of Applied Computer Science, University ITMO, Kronverksky Pr. 49, 197101 Saint Petersburg, Russia
*
Author to whom correspondence should be addressed.
Buildings 2025, 15(12), 1982; https://doi.org/10.3390/buildings15121982
Submission received: 8 May 2025 / Revised: 1 June 2025 / Accepted: 6 June 2025 / Published: 8 June 2025
(This article belongs to the Section Building Materials, and Repair & Renovation)

Abstract

:
Currently, intelligent technologies are becoming both a topical subject for theoretical discussions and a proper tool for transforming traditional industries, including the construction industry. The construction industry intensively uses innovative methods based on intelligent algorithms of various natures. As practice shows, modern intelligent technologies based on AI surpass traditional ones in accuracy and speed of information processing. This study implements methods using convolutional neural networks, which solve an important problem in the construction industry—to classify crushed stone grains by their shape. Rapid determination of the crushed stone grain class will allow determining the content of lamellar and acicular grains, which in turn is a characteristic that affects the strength, adhesion, and filler placement. The classification algorithms were based on the ResNet50, MobileNetV3 Small, and DenseNet121 architectures. Three-dimensional images of acicular, lamellar, and cuboid grains were converted into single-channel digital tensor format. During the laboratory experiment, the proposed intelligent algorithms demonstrated high stability and efficiency. The total processing time for 200 grains, including the photo recording stage, averaged 16 min 41 s, with the accuracy reaching 92%, which is comparable to the results of manual classification by specialists. These models provide for the complete automation of crushed stone grain typing, leading to reduced labor costs and a decreased likelihood of human error.

1. Introduction

Improving the quality control systems for building materials is an objective need for the worldwide construction industry [1]. Conducting traditional laboratory tests according to approved regulatory methods requires large labor costs and time [2]. The application of intelligent technologies, with a focus on computer vision (CV), presents methodologies for considerable enhancements to finished product quality and reductions in quality control expenditure [3,4].
The shape of crushed stone grains plays an important role in monitoring its quality and operation. Its strength, bulk density, and durability depend on the geometry of the grains. Accordingly, this also affects the quality indicators of materials, one of the components of which is crushed stone. The indicator “content of plate-shaped (flaky) and needle-shaped grains” characterizes the quality of crushed stone through its geometry. Therefore, a clear classification of crushed stone grains by shape ensures the accuracy of its quality control and the correct choice of the area of its application [5].
This work aims to develop convolutional neural network-based computer vision models, utilizing ResNet50, MobileNetV3 Small, and DenseNet121 architectures, for the classification of crushed stone grains into three categories: acicular, lamellar, and cuboid. The goals of this study are:
  • collection and pre-processing of the empirical base;
  • selection of neural network architectures most suitable for solving the tasks;
  • selected algorithms training;
  • assessment of trained algorithms’ performance on a test sample;
  • examination of the findings in accordance with principal classification model quality metrics;
  • conducting a comparative analysis for the determination of the crushed stone grain shape by comparing manual classification, classification from work [5], and the results of the current study.
The study significantly advances theoretical understanding by exploring the potential of convolutional neural networks within artificial intelligence for morphological analysis of crushed stone grains. The algorithm developed in this work is of practical importance, as it facilitates the conversion of three-dimensional images of assorted crushed stone grains into tensors for intelligent classification.

2. Literature Review

Using artificial intelligence (AI) methods is increasingly common in the construction industry [6,7,8,9]. In [10], the authors proposed a framework and paradigm for measuring the quality of large-scale and high-precision street spaces using a combination of big data and artificial intelligence, which will help improve the measurement and assessment of street spatial quality based on multi-temporal street view images while providing the underlying data and relevant decision support for renovation and upgrading. Construction safety professionals face serious challenges characterized by a high rate of accidents and fatalities [11,12]. Intelligent technologies enable a significant qualitative improvement in the monitoring of construction site processes [13,14,15,16,17]. Virtual reality (VR), building information modeling (BIM), machine learning (ML), and artificial intelligence are the most commonly used digital technologies within this area [18,19,20,21,22]. In several works, AI and ML methods are applied for sustainable and intelligent design of buildings and structures, offering a new approach to combining artificial intelligence and practical engineering applications [23,24,25,26,27]. Regression models based on machine learning methods have found their application in predicting the fundamental properties of various building materials, products, and structures [28,29,30,31,32]. And CV methods, in turn, have been actively used to analyze the quality of materials and search for defects [33,34,35].
Additionally, forecasting, ML methods are becoming part of classification algorithms [36,37]. These algorithms are relevant for classifying bulk building materials, such as aggregates for concrete and road construction [38,39,40]. Quality control of large aggregate plays an important role in forming the final properties of building and road products and structures [41,42]. It has been revealed that approaches based on deep neural networks, which are used to classify various minerals and aggregates by grain types and sizes, provide high accuracy comparable to manual grain sorting [43,44,45,46]. Deep learning methods achieve high accuracy in construction applications of various types, which is confirmed by several studies [47,48,49,50,51]. The reliability of deep learning methods is confirmed by the obtained average accuracy rates and comparative analyses with traditional methods. For example, detection of external cladding material for its classification as “brick” and “stone” achieved average accuracy rates up to 76% [50]. In addition, the datasets and proposed classification methods for materials such as concrete and stone have been successfully applied previously [51].
Using convolutional neural networks (CNNs) [52] for detecting damage to building products and structures has long been widespread and studied in many articles [53,54]. The use of CNN provided generally high detection accuracy, which made it possible to recommend them for further work and practical application [55,56]. There are known studies on the use of CNN for predicting the properties of aggregate from recycled concrete [57] and the distribution of grains in the microstructure of polycrystalline materials [58] and by size [59]. In addition, previous studies have developed automatic recognition systems for classifying stones [36,37]. However, there is a shortage of studies studying the shape of aggregate grains, characterized by the indicator “content of plate-shaped (flaky) and needle-shaped grains”, using artificial intelligence methods. This indicator is a complex characteristic of several other indicators immediately, such as strength, bulk density, voidness, adhesion, and placement. Therefore, finding alternative methods for its determination that are not inferior in quality and speed to known laboratory manual tests is an urgent task. We have already developed a new method for classifying crushed stone grains by morphological characteristics using neural networks capable of processing point clouds [5,60]. In this study, the development of the idea was continued to eliminate the gaps in the convolutional neural networks usage for classifying the shape of crushed stone grains. The study’s scientific contribution is the development of convolutional neural network-based computer vision models, enabling fully automated crushed stone grain classification. This automation reduces time, labor costs, and human-error-related quality control issues.

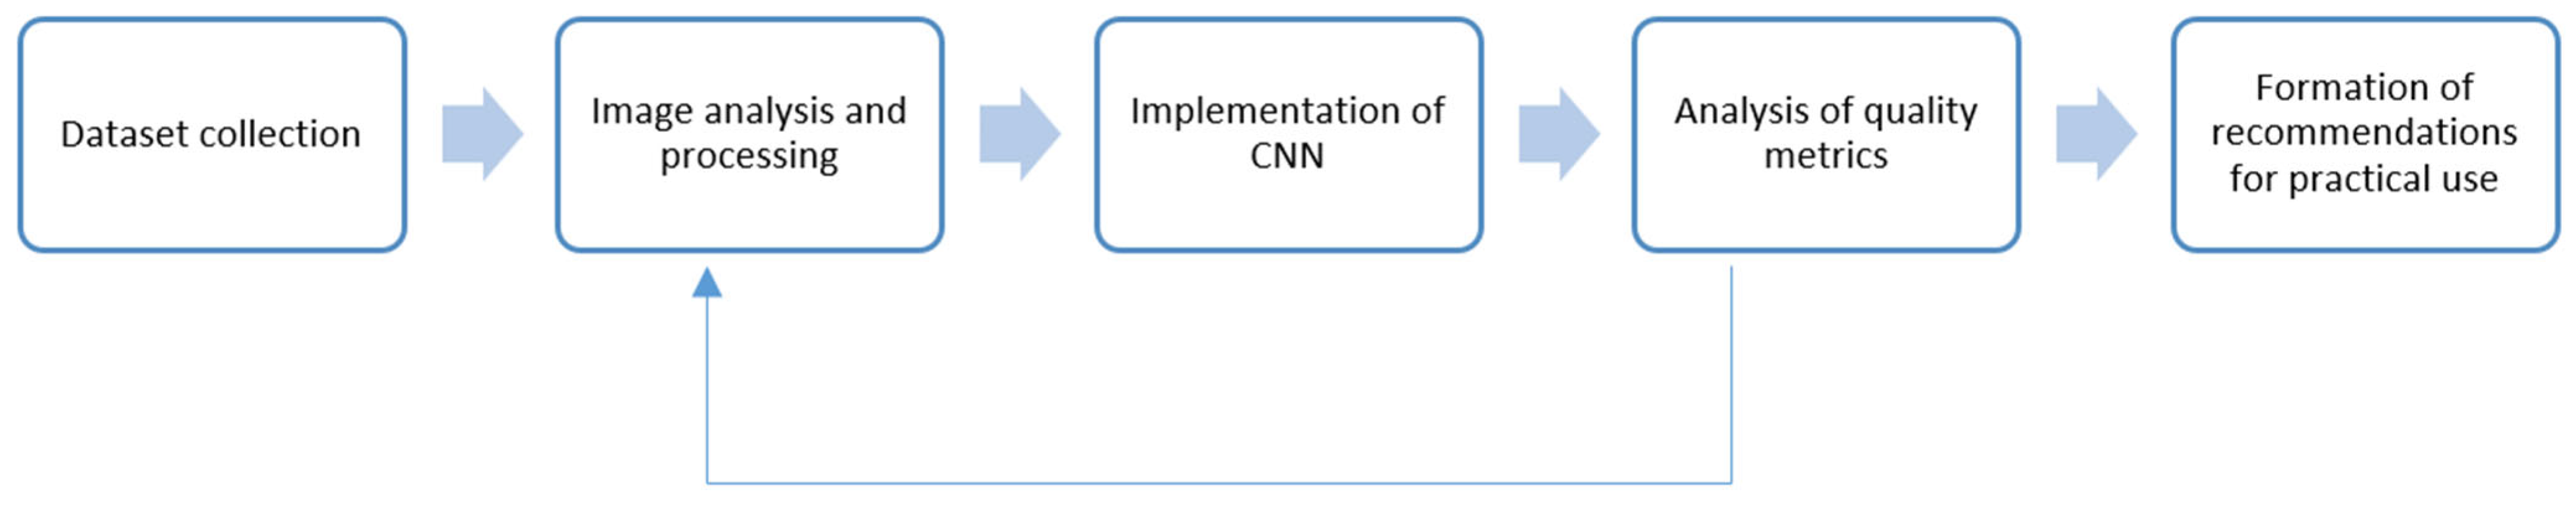
3. Materials and Methods

A schematic representation of the study’s five integrated stages is provided in Figure 1.
(1)
dataset collection: at this stage, the selected building material is described, and samples are collected;
(2)
image analysis and processing;
(3)
CNN implementation (training, optimization, and testing);
(4)
quality metrics analysis: if low metrics are detected that do not satisfy the subject area, it is necessary to return to stage 2 and refine the original dataset, as well as analyze the settings of the models;
(5)
formation of recommendations for practical use: At this stage, it is necessary to pay attention to the requirements for the practical application of the developed models, as well as limitations, to identify prospects for improving the results.
The content of lamellar and acicular grains is determined manually in the laboratory according to the method [5,61].

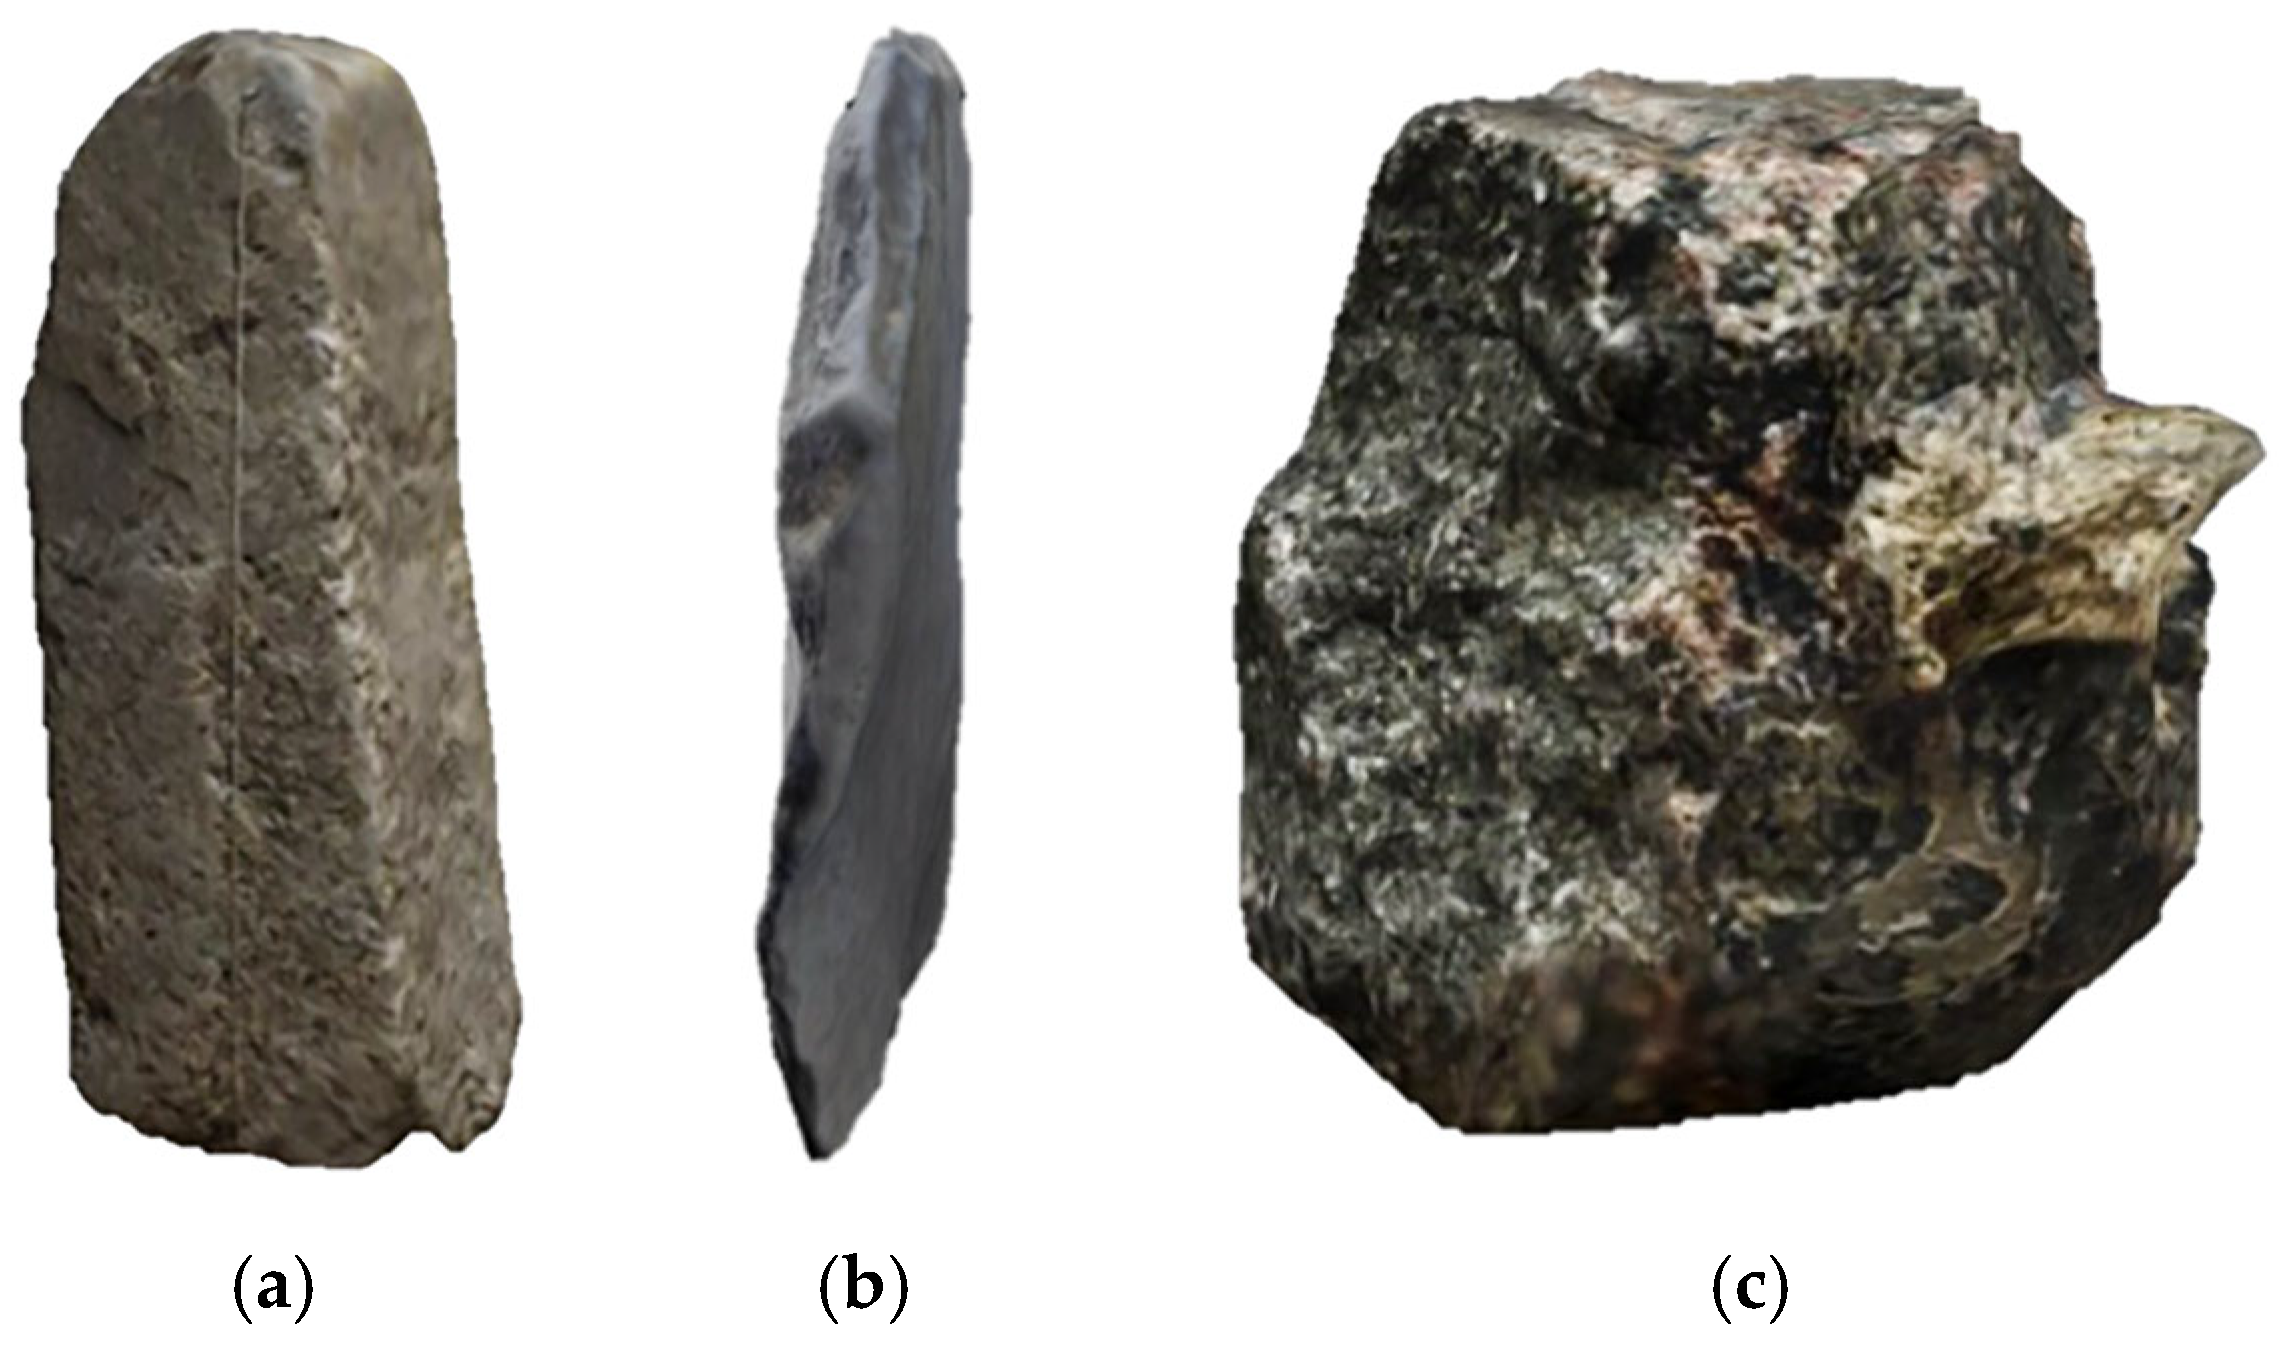
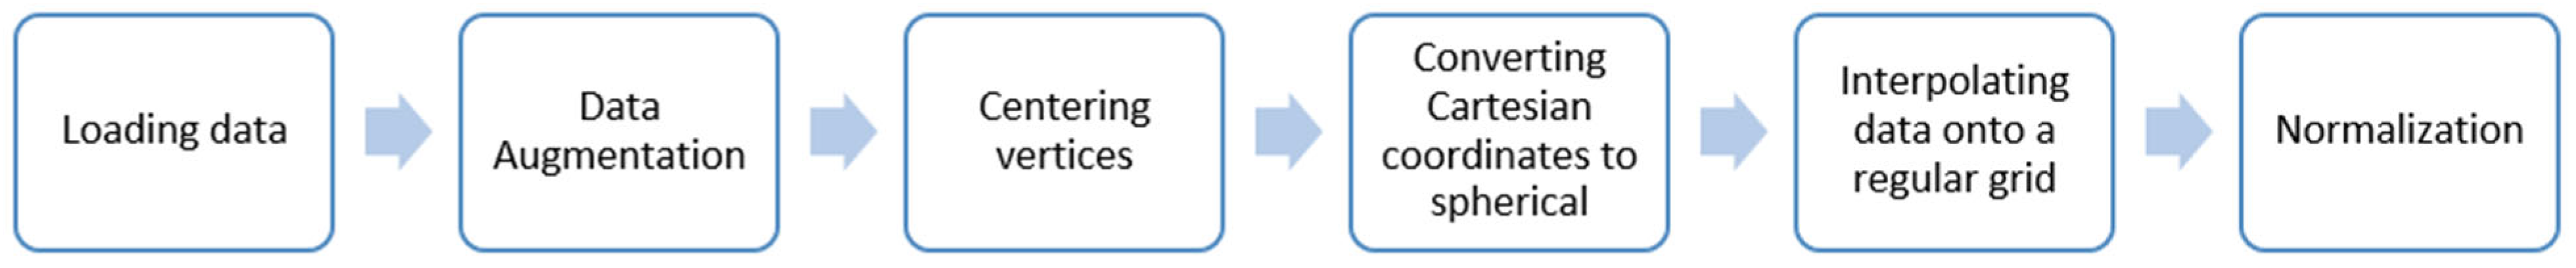
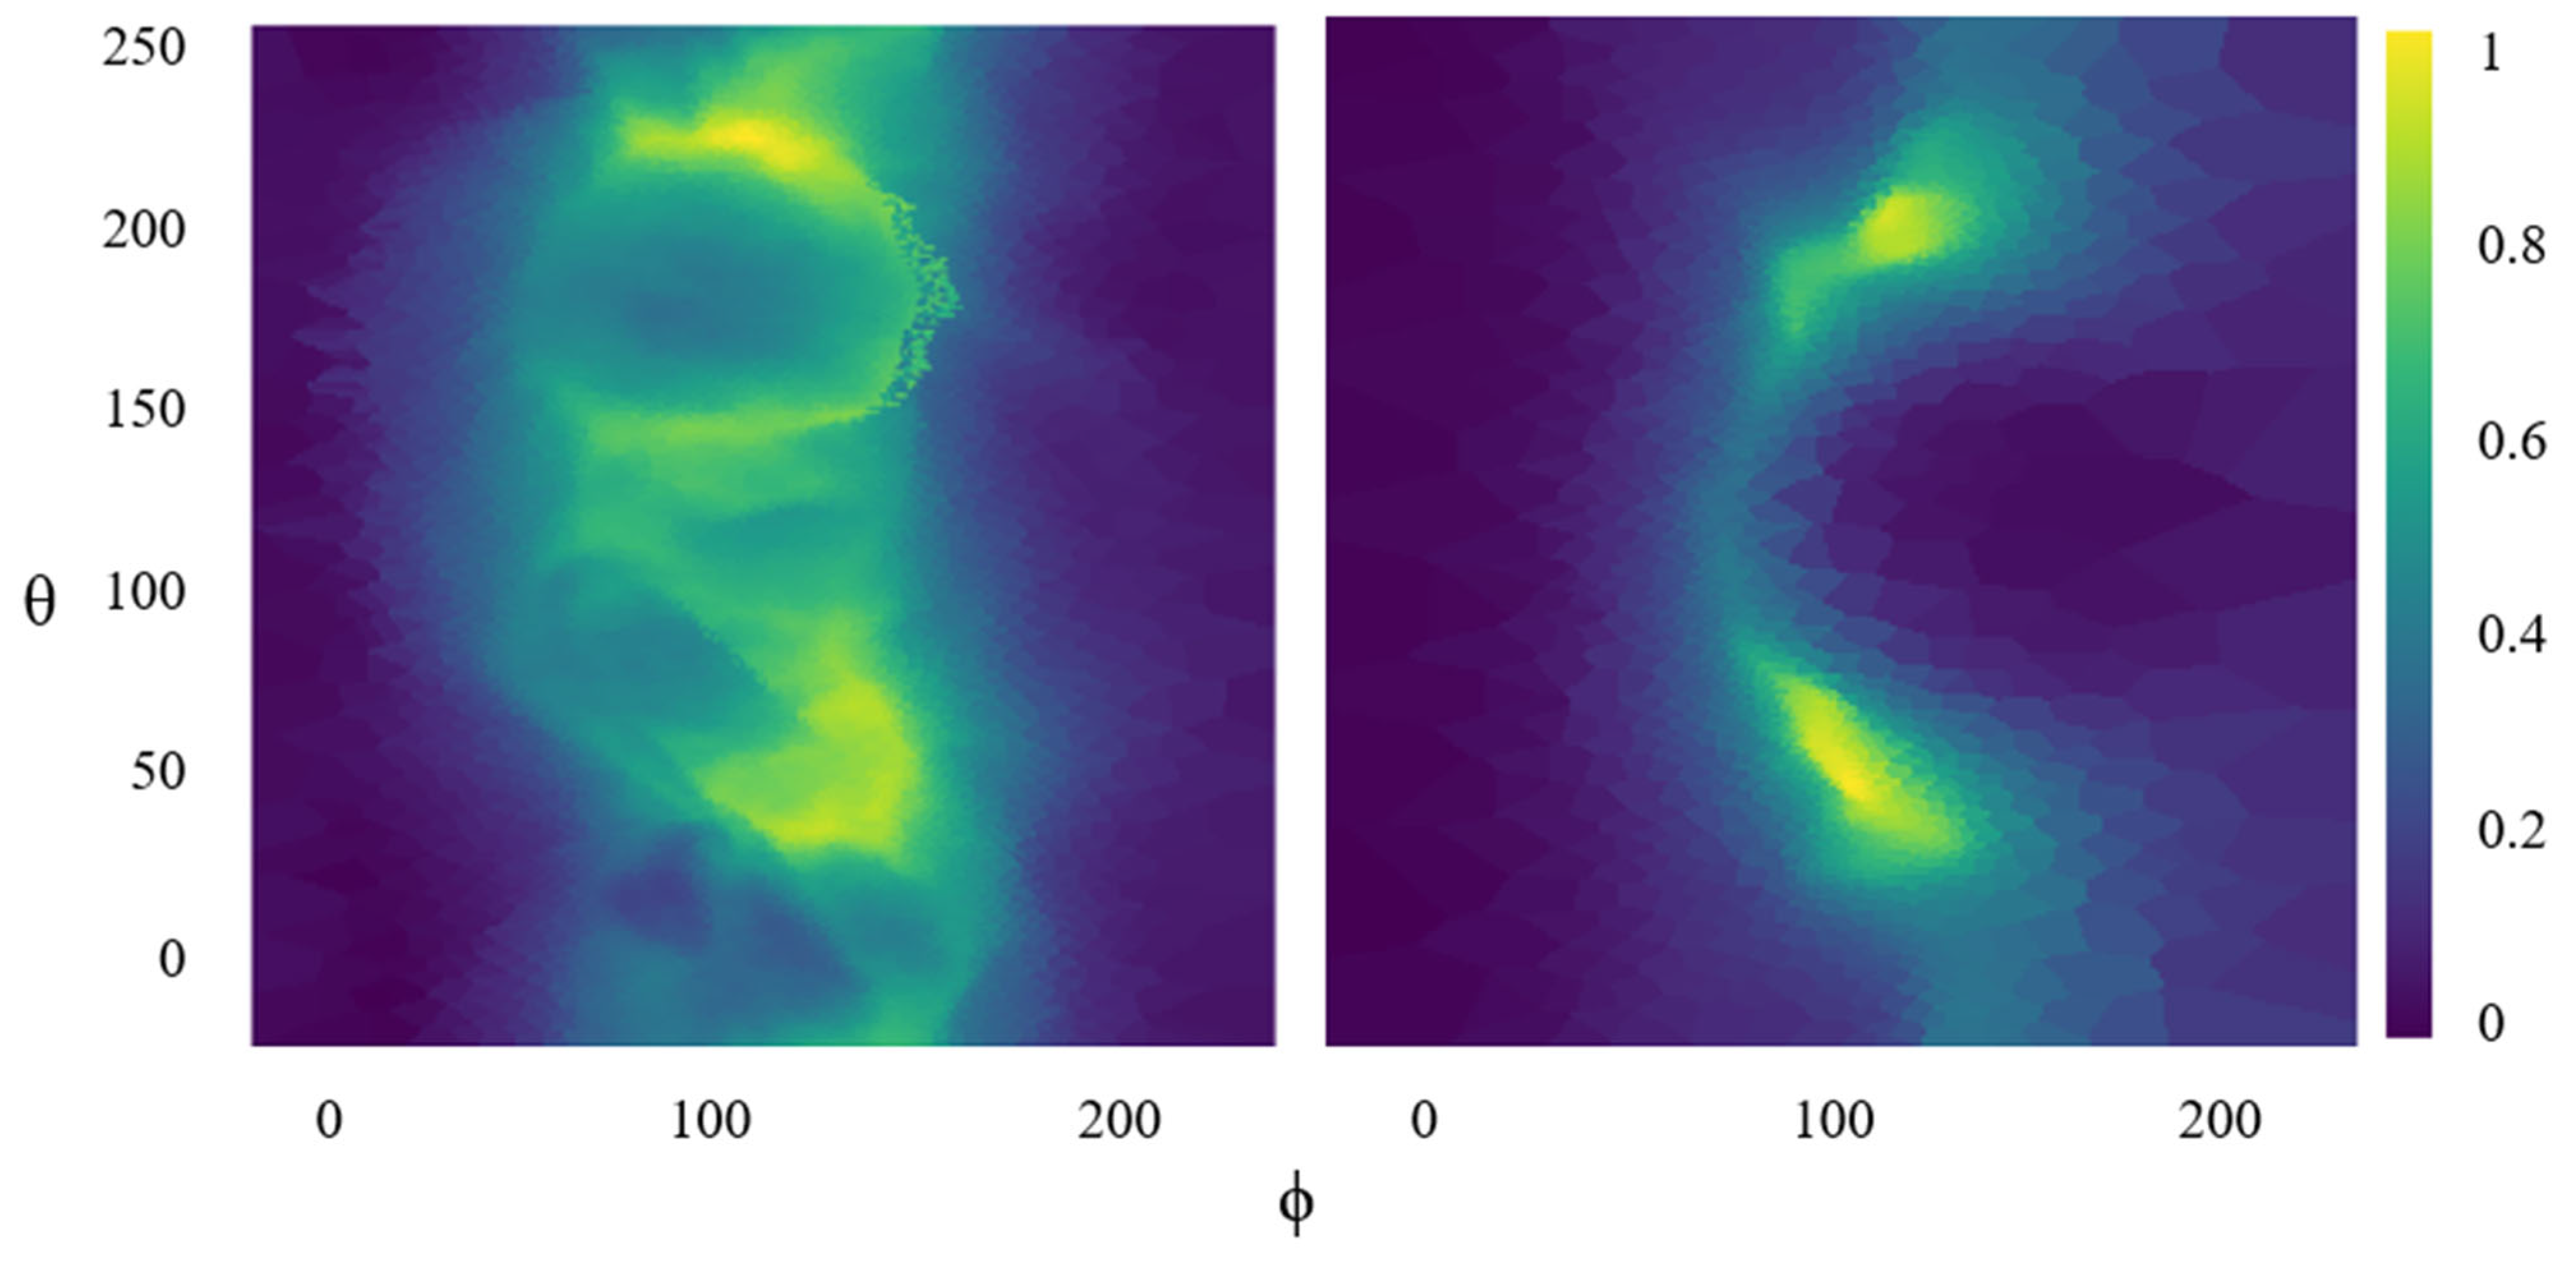
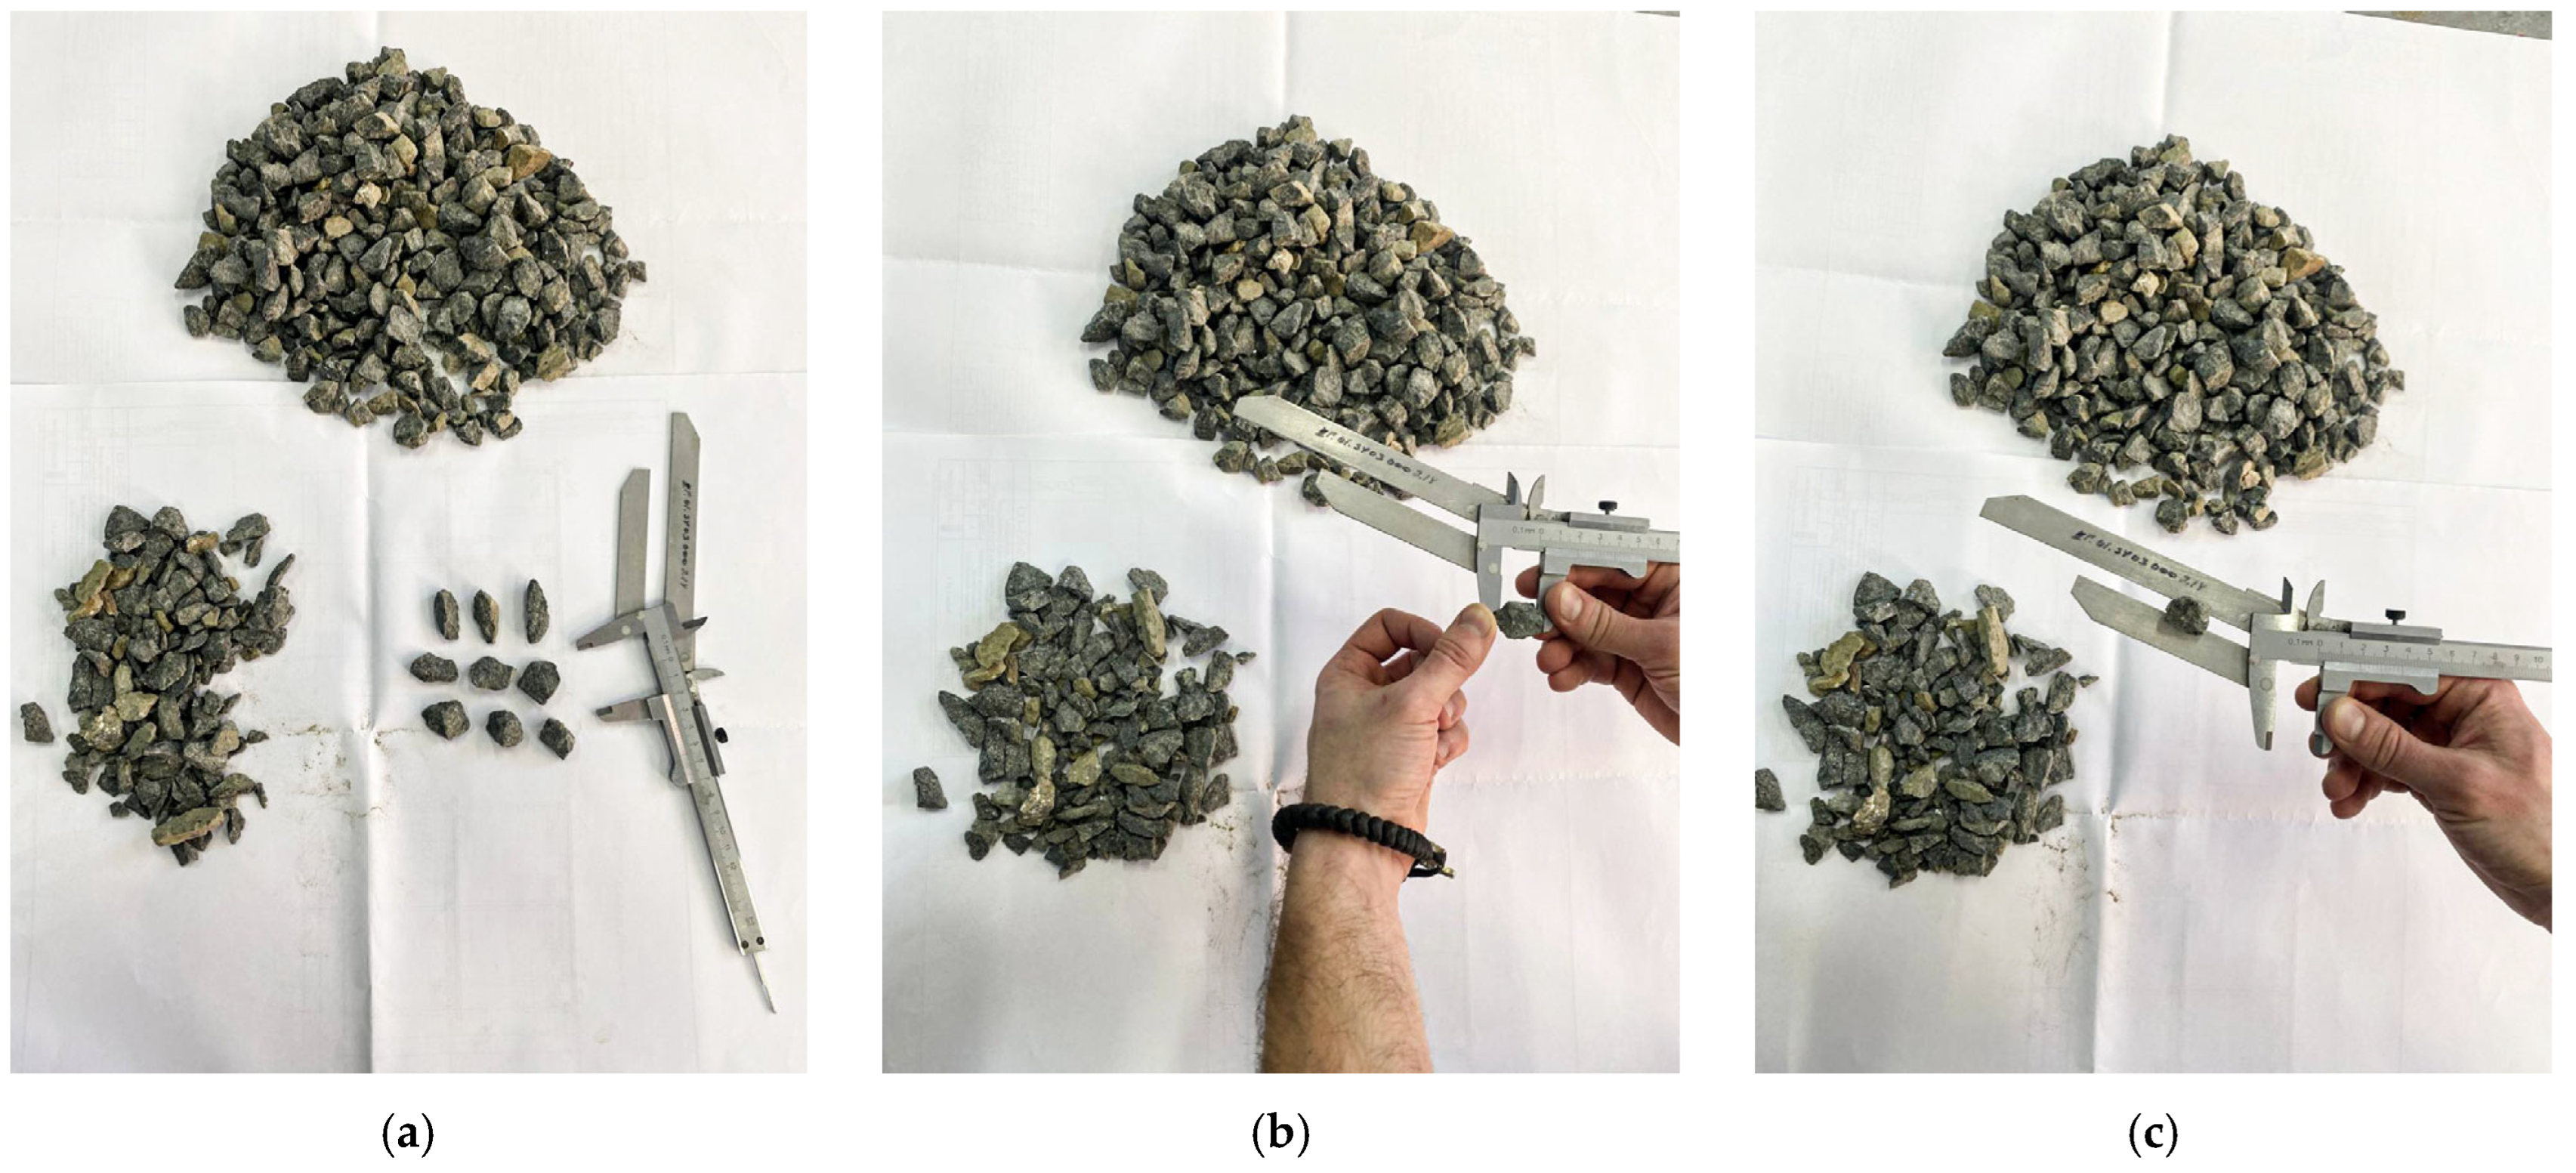
3.1. Dataset Collection, Image Analysis, and Processing

The object of the study was crushed stone from the manufacturer “Pavlovsk Nerud” (Pavlovsk, Russia) with grain sizes from 10 to 40 mm, a bulk density of 1475 kg/m3, a true density of 2652 kg/m3, a crushability of 12.0%, and a content of lamellar and acicular grains of 12.5%.
To collect the empirical base for the study under laboratory conditions, 45 crushed stone samples were photographed, including: 15 class acicular (Figure 2a), 15 class lamellar (Figure 2b), and 15 class cuboid (Figure 2c).
The image analysis and processing step can be divided into the stages shown in Figure 3. The source data are three-dimensional models of objects in .OBJ format, which are stored in folders corresponding to different classes of objects (cuboidal, needle_like, plate_like), divided into training and test samples (train, test). To load the data, the “trimesh library (https://github.com/mikedh/trimesh) (accessed on 5 May 2025)” was used, which allows loading and processing three-dimensional models.
When augmenting each 3D model, random geometric transformations are applied sequentially: arbitrary rotations and shifts, and random noise is added along their normal for minor surface distortions. Also, for the plate_like and needle_like classes, asymmetric stretching and compression along the axes are additionally performed to enhance the characteristic shapes of plates and needles. The result is a diverse set of 3D models suitable for expanding the training sample.
The key factor in compensating for possible losses of invariance was a large-scale augmentation technique, including random rotations (by ±45°) and shifts during training. This method allowed us to generalize the model to different grain orientations, even with distortions caused by resizing. Thus, rotational invariance is achieved not only because of spherical coordinates but also due to augmentation.
After loading the model, the center of mass of the object’s vertices is calculated. This is necessary so that the object is centered relative to the origin. The center of mass is calculated as the arithmetic mean of all vertices:
C = 1 N i = 1 N v i
where vi are the coordinates of the i-th vertex, N is the total number of vertices.
All vertices of the model are shifted by a vector equal to the center of mass:
v i = v i c
For each vertex of the object, a transformation is performed from Cartesian coordinates (x, y, z) to spherical coordinates (r, ϕ, θ), where: r is the distance from the origin to the vertex, ϕ is the azimuth angle (from −π to π), θ is the polar angle (from 0 to π).
The formulas for performing the transformation are as follows:
r = x 2 + y 2 + z 2
ϕ = arctan y x
θ = arccos z r ,     r 0 ,     i f     r = 0 ,       t h e n     θ = 0
To create a regular grid, the Griddata interpolation method from the Scipy library (version 1.7.3) is used. The interpolation points are spherical coordinates (ϕ, θ), and the values are radii. Interpolation is performed using the nearest neighbor method, which ensures the preservation of the data structure and minimizes information loss. The regular grid is defined as:
ϕ [ π ,   π ] ,
θ [ 0 ,   π ]
with a discretization step:
Δ ϕ = 2 π 255 ,     Δ θ = π 255
The result of the interpolation is a two-dimensional grid of size 256 × 256, where each grid element corresponds to the value of the radius at a given point:
r g r i d = g r i d d a t a ϕ ,   θ , r ,   ϕ g r i d ,   θ g r i d , m e t h o d = n e a r e s t
After interpolation, the radius values are normalized to the range [0,1] to ensure data uniformity and improve the convergence of machine learning algorithms. Normalization is performed using the formula:
r n o r m = r g r i d r min r max r min
where r min and r max are the minimum and maximum values of the radius on the grid.
The normalized data is saved in .npy format for further use. Each file corresponds to one three-dimensional model and contains a tensor of size 256 × 256 × 1.
To check the correctness of the data transformation, two random tensors are visualized using the Plotly library (version 5.24.1) (Figure 4).
The visualization is a heat map, where the angles ϕ and θ are plotted along the axes, and the radius r is indicated by color. The heat map is constructed using the formula:
z = r n o r m ϕ ,     θ
where z is the normalized radius value at the point (ϕ, θ).
The proposed method for transforming 3D models into 2D tensor representations allows one to efficiently prepare data for machine learning tasks, such as object classification or clustering. Transformation into spherical coordinates and interpolation onto a regular grid ensure invariance to the object’s position in space and preserve important geometric characteristics. Data normalization improves the convergence of algorithms and increases the quality of models. Visualization of the results allows one to verify the correctness of the transformation and interpret the obtained data.
It should be noted that despite the fact that the tensors have a single-channel structure (dimension 256 × 256 × 1) and contain only numerical values of the radius, a color scale is used for visualization. Thus, heat maps are displayed in color solely for the purpose of increasing clarity, while the data remains single-channel. Such an approach allows one to more effectively interpret the geometry of the object and visually distinguish subtle variations in the radius values. Color visualization is implemented using the “viridis” scale, which maps radius values to colors from violet to yellow. This allows for a more visual interpretation of the object’s morphology, while the data itself is stored as single-channel (black and white) tensors.
Although the transformation of 3D models into spherical coordinates provides partial rotation invariance, resizing to 224 × 224 × 1 may indeed introduce distortions. However, we used an interpolation library (Griddata with the nearest neighbor method) to preserve the data structure at the stage of creating 256 × 256 × 1 tensors. Subsequent resizing to 224 × 224 × 1 was performed with preservation of the proportional distribution of radius values in order to minimize information loss.
Unlike traditional 2D methods working with “flat” images (object projections), the proposed method for working with 3D images preserves the geometry of the object. This is important for classifying objects by their shape, since classical 2D approaches lose information about depth and other volume characteristics. In addition, these approaches introduce sensitivity to the shooting angle (for example, needle-shaped grain may appear cuboid at certain angles).

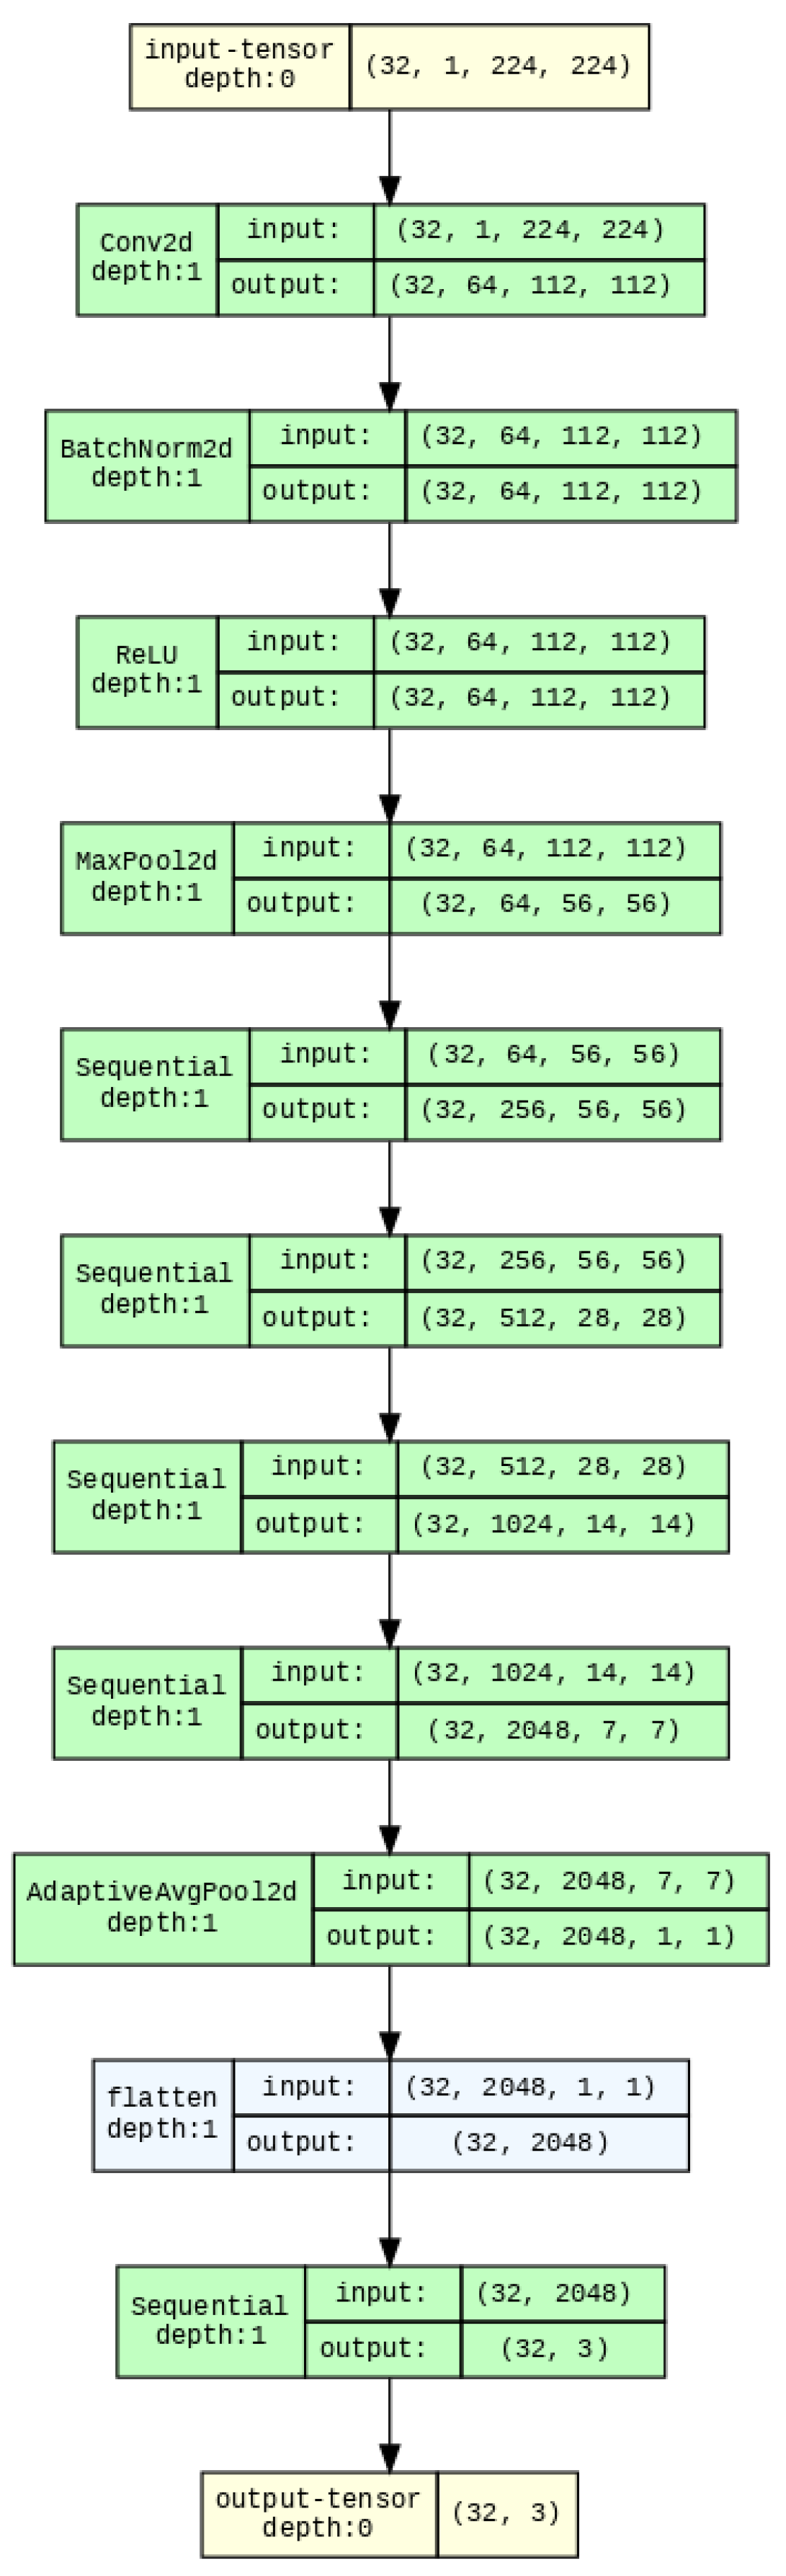
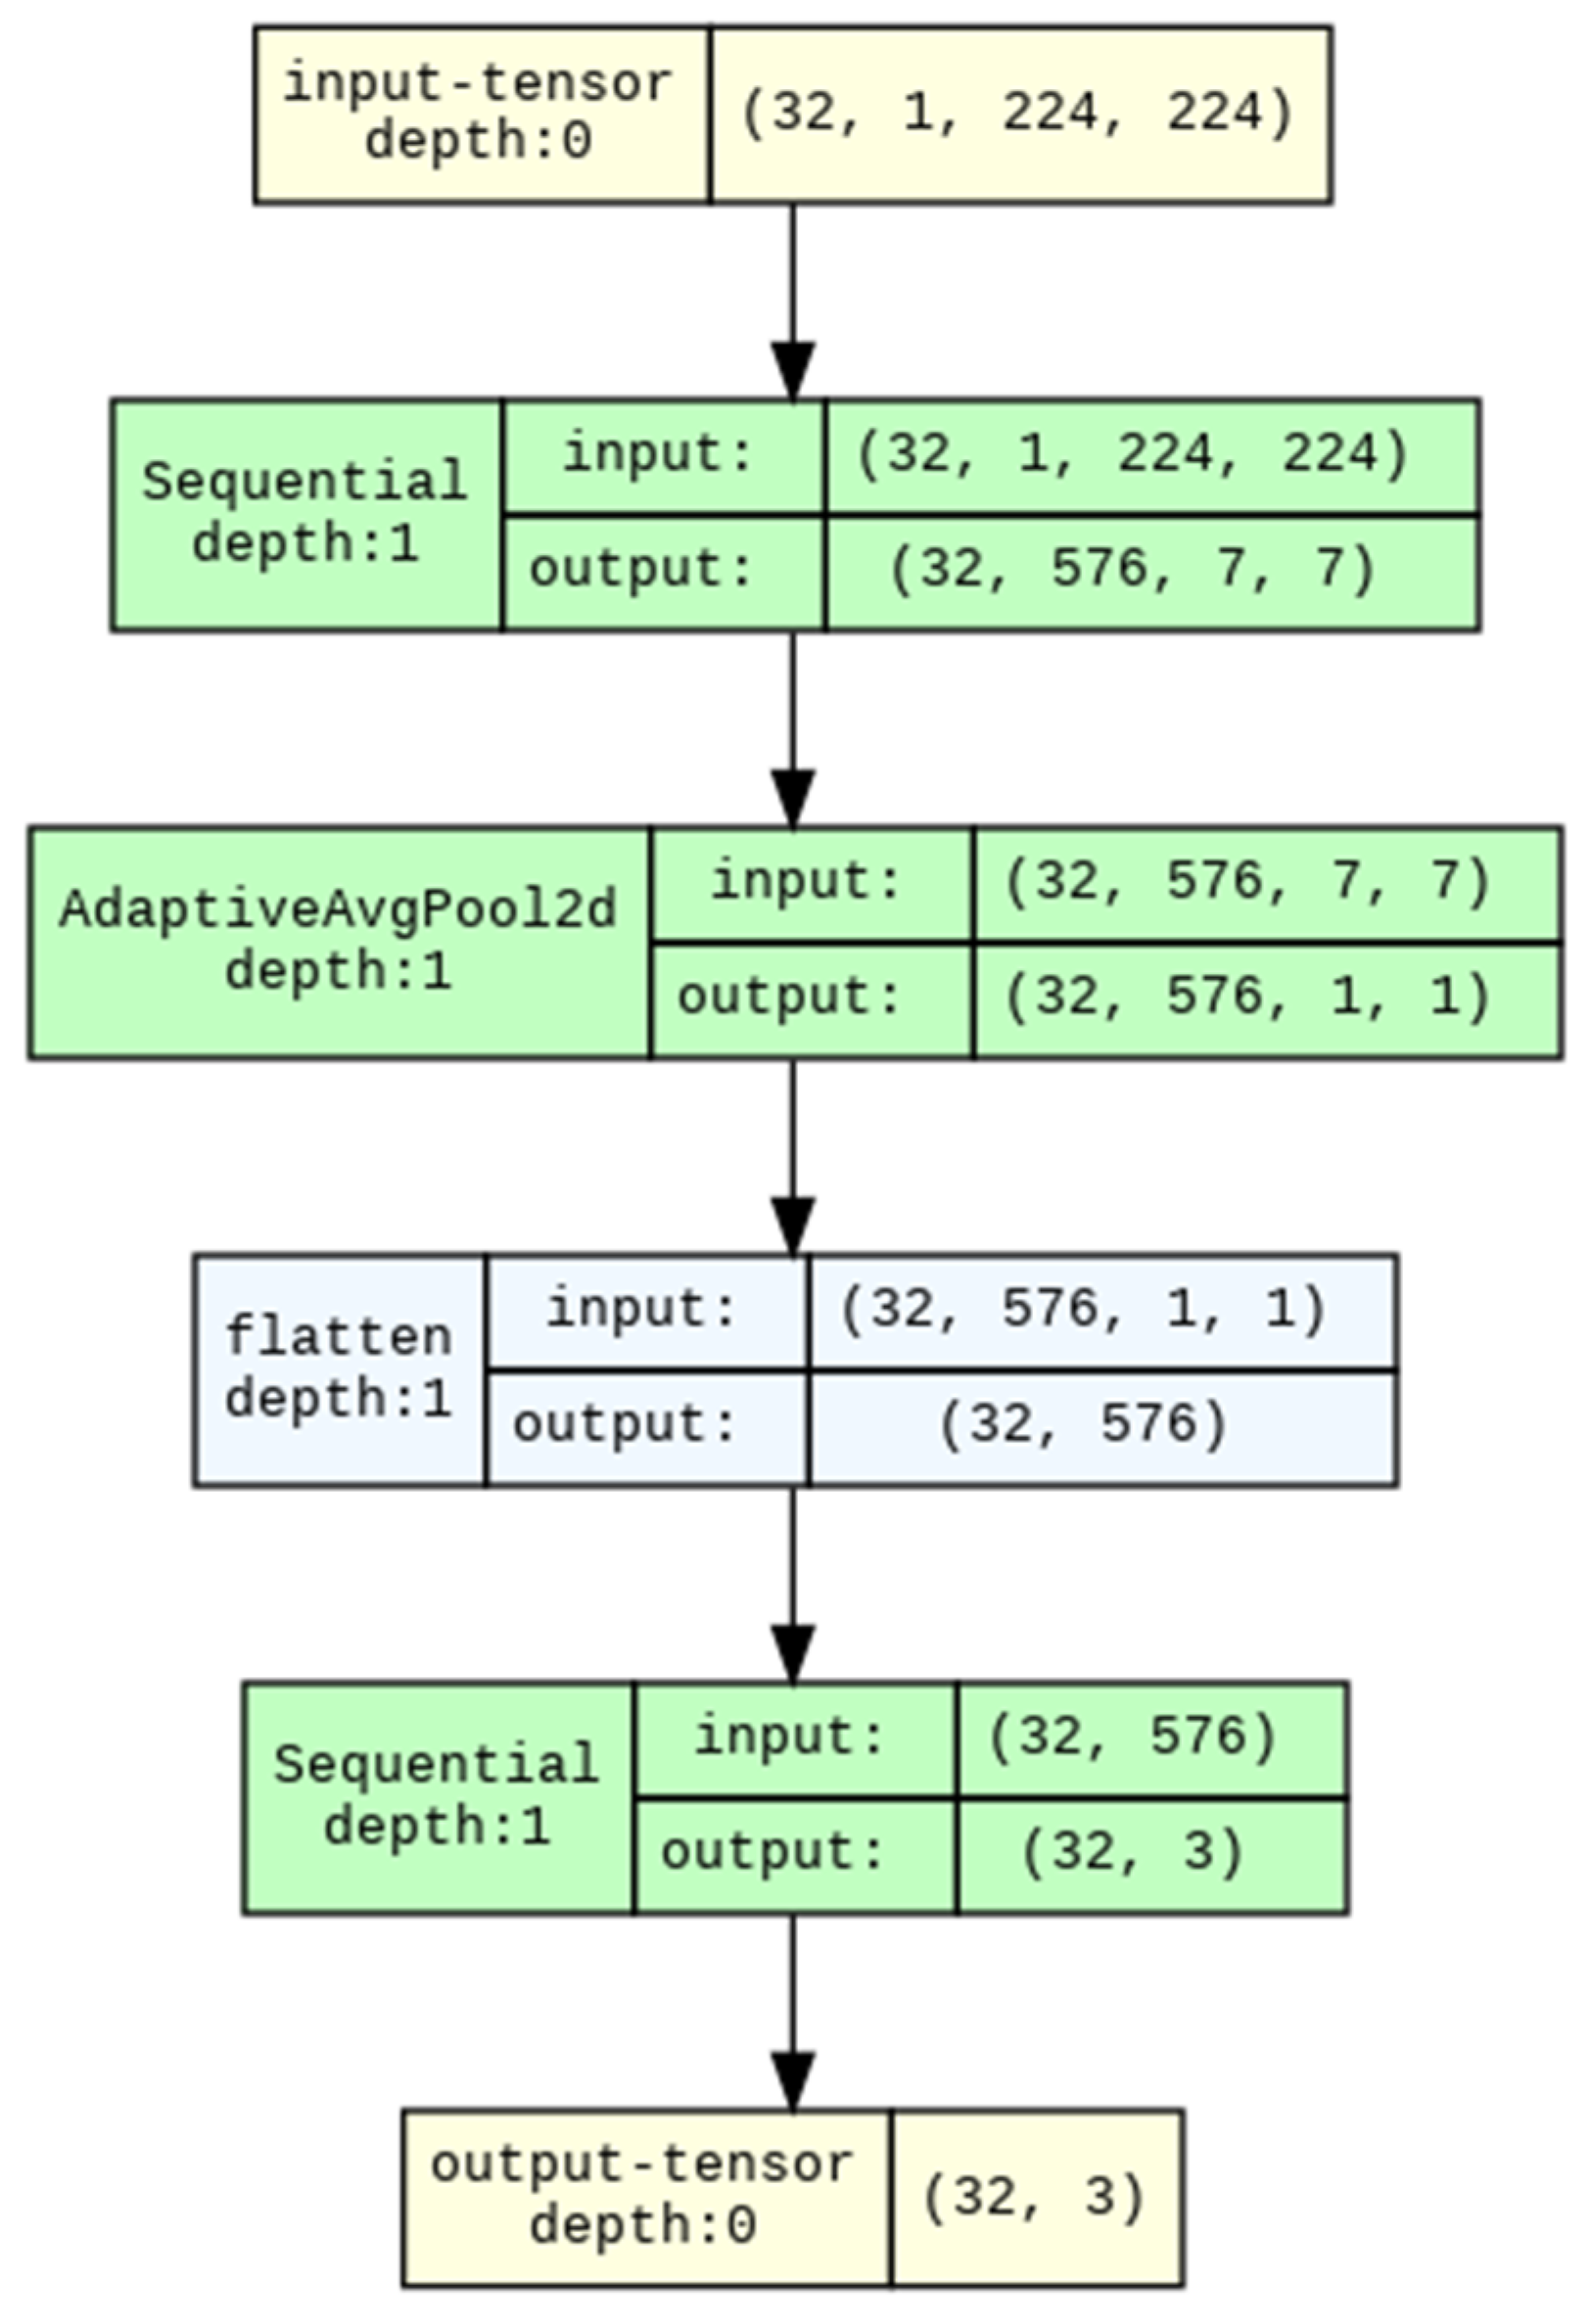
3.2. Selection of Neural Network Architectures

The base architecture for the first model is a pre-trained ResNet50 adapted for processing single-channel images (Figure 5). ResNet50 is a deep convolutional neural network with “skip connections” that facilitates more efficient training by reducing the vanishing gradient problem [62].
The following modifications were made to the basic model during implementation to solve the problem.
  • The first convolutional layer is adapted to work with single-channel images.
  • The fully connected layer is replaced by a sequence:
    -
    Dropout (0.5) to prevent overfitting. The parameter 0.5 means disabling 50% of neurons to avoid overfitting.
    -
    Linear (in_features, 3), where in_features is the dimension of the features before the fully connected layer, and 3 is the number of classes.
When preparing the input data for CNN, it is necessary to transform the input data to a certain format, namely:
  • -
    changing the size to 224 × 224 × 1, which corresponds to the input size of the ResNet50 model;
    -
    transformation into a tensor and bringing the order of the axes to the format (C, H, W), where C (Channels) is the number of channels in the image, H (Height) is the height of the image in pixels, and W (Width) is the width of the image in pixels;
    -
    normalization of pixel values by the mean and standard deviation.
MobileNetV3 Small was used as the second model. This CNN is a highly efficient and compact convolutional neural network, specially designed for computer vision applications with an emphasis on optimizing performance and saving resources [63]. The architecture uses inverted residual blocks, which include bottlenecks that help reduce the dimensionality of feature maps, as well as squeeze-and-excitation modules that adaptively calibrate the significance of different channels based on input data (Figure 6).
The following modifications were made to the basic model during the implementation to solve the problem.
  • The first convolutional layer is adapted to work with single-channel images.
  • The fully connected layer is replaced with a sequence:
    -
    Dropout (0.3) to prevent overfitting. The parameter 0.3 means disabling 30% of neurons to avoid overfitting.
    -
    Linear (in_features, 3), where in_features is the dimension of the features before the fully connected layer, and 3 is the number of classes.
When preparing data for the CNN input, it is necessary to transform the input data to a certain format, namely:
  • -
    changing the size to 224 × 224 × 1, which corresponds to the input size of the MobileNetV3 Small model;
    -
    transforming into a tensor and bringing the order of the axes to the format (C, H, W);
    -
    normalizing pixel values by the mean and standard deviation. The third model is based on DenseNet121. DenseNet121 is a deep convolutional neural network based on dense blocks, where each layer is directly connected to all subsequent layers [64]. This architecture promotes efficient gradient propagation and improves feature reuse, which reduces the risk of vanishing gradients and improves the accuracy of the model (Figure 7).
The following modifications were made to the basic model during implementation to solve the problem.
  • The first convolutional layer is adapted to work with single-channel images.
  • The fully connected layer is replaced by a sequence:
    -
    Dropout (0.5) to prevent overfitting. The parameter 0.5 means disabling 50% of neurons to avoid overfitting.
    -
    Linear (in_features, 3), where in_features is the dimension of the features before the fully connected layer, and 3 is the number of classes.
When preparing data for the CNN input, it is necessary to transform the input data to a certain format, namely:
  • -
    changing the size to 224 × 224 × 1, which corresponds to the input size of the DenseNet121 model;
    -
    converting to a tensor and bringing the order of the axes to the format (C, H, W);
    -
    normalization of pixel values by mean and standard deviation.
All three models were chosen to compare the trade-off between accuracy and performance. ResNet50 and DenseNet121 demonstrate high accuracy, while MobileNetV3 Small provides a balance between speed and classification quality. DenseNet121 was trained for 10 epochs, which is less than ResNet50 and MobileNetV3 (15 epochs). This decision was based on preliminary experiments, where DenseNet121 achieved a stable loss function value by 8–10 epochs. The early stopping method was not used for all models. An additional experiment was conducted to check the stability of the results: DenseNet121 was trained on 15 epochs; the accuracy increased slightly on the training set (from 90% to 91.5%), but the accuracy on the test set dropped, which indicates overfitting and adaptation of the model to the training data.
All three architectures (ResNet50, MobileNetV3 Small, and DenseNet121) were pre-trained on ImageNet. This provides the models with common features, such as edges, textures, and shapes that can be useful for analyzing the geometric features of gravel grains. The importance of transfer learning lies in the use of pre-trained weights, which significantly reduced training time and increased the initial accuracy of the models. Without transfer learning, the accuracy at the initial stages would have been 15–20% lower.
To prevent overfitting, the following approaches were used:
-
Dropout (disabling some neurons during training): 0.5 for ResNet50 and DenseNet121, 0.3 for MobileNetV3 Small;
-
L2 regularization (weight decay): a higher coefficient for MobileNetV3 Small compensated for its smaller number of parameters;
-
Data augmentation also helps reduce overfitting: random rotations (±45°), shifts and noise were applied in the preprocessing stage. This increased the diversity of the data and improved the generalization ability.

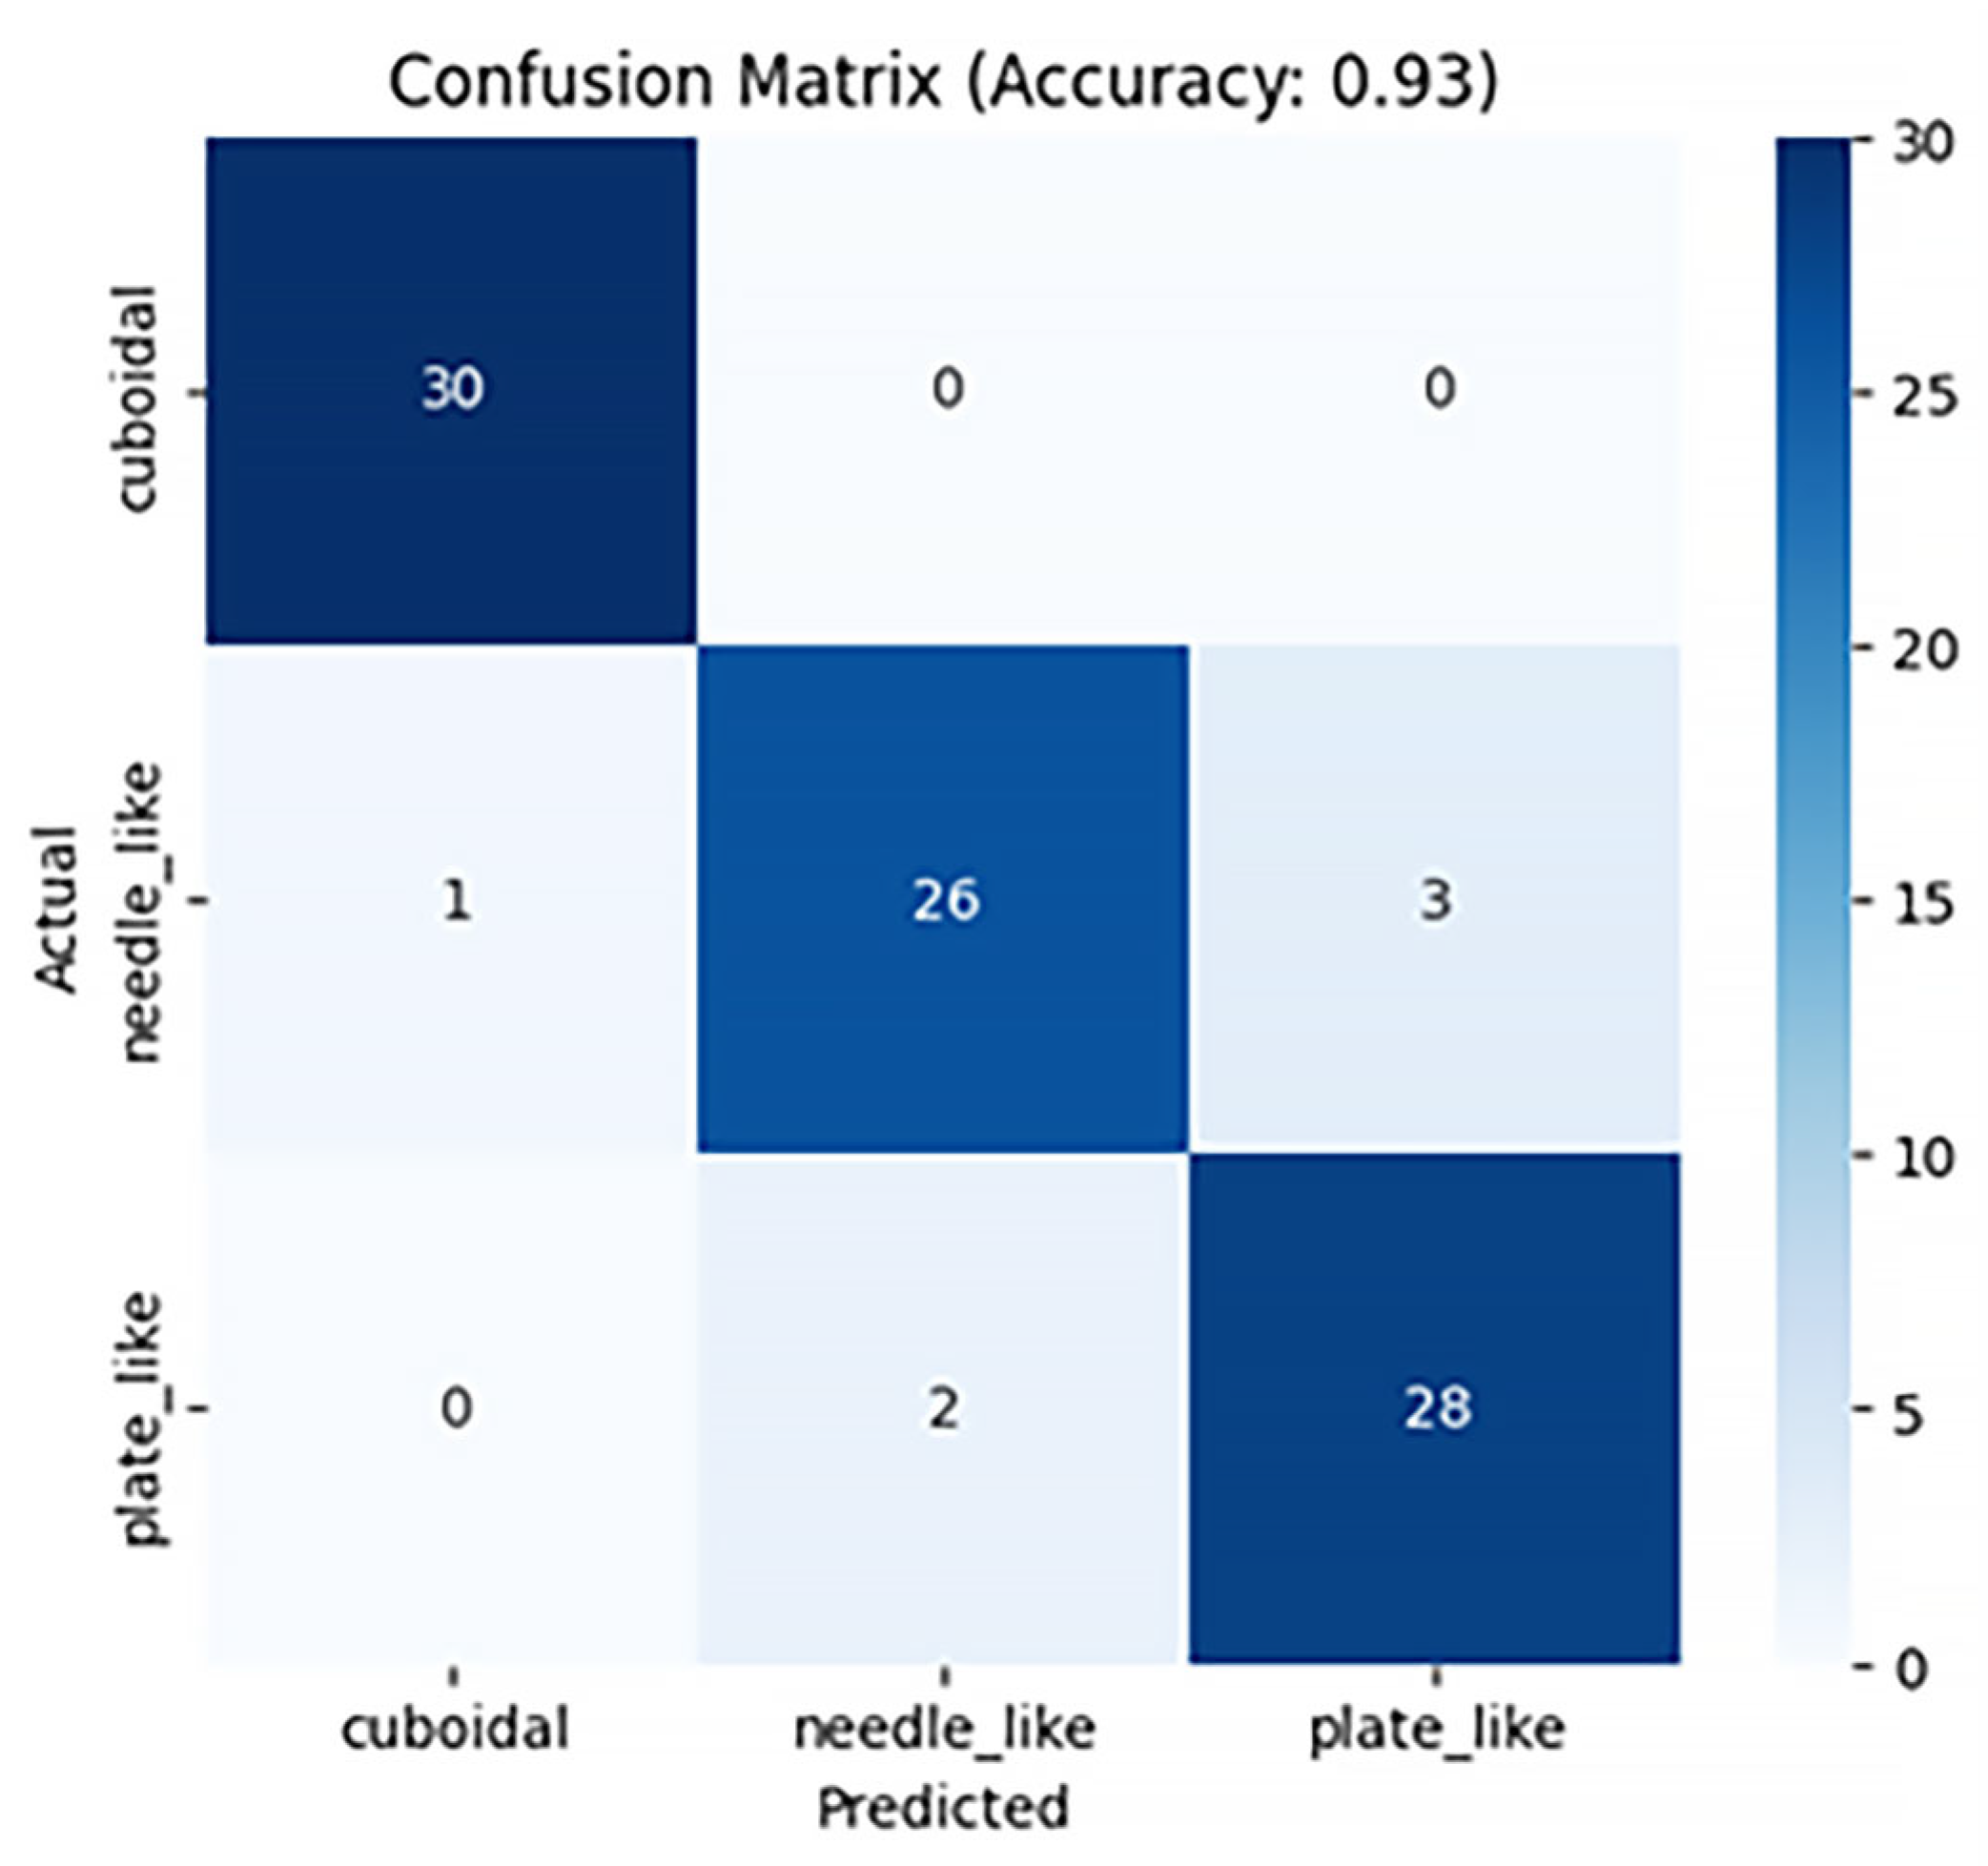
4. Results and Discussion

The software implementation of the algorithms, their optimization, and testing using the above-mentioned architectures were carried out using the high-level Python 3.12 language. The study also involved: an environment for developing and executing program code in the Google Colab cloud (with the connection of NVIDIA Tesla T4 computing accelerators), a cross-platform integrated development environment, PyCharm Community Edition 2023.3.2, and an open-source machine learning library, Torch 2.6.0. The development was carried out using the above-mentioned tools due to the fact that Python has an extensive ecosystem of libraries for creating AI models.
When training a CNN, the selection of hyperparameter values has a significant impact on the final quality metrics. Table 1 shows the main hyperparameters of the model used in the training process.
The CrossEntropyLoss function is used as the loss function. This function is effective in the case of multi-class classification and is defined by the formula:
L = 1 N i = 1 N c = 1 C y i , c log p i , c
where N is the number of examples in the dataset; C is the number of classes (in this study, C = 3); y i , c is a binary indicator variable equal to 1 if class c is the true class, for example i, and 0 otherwise; p i , c is the predicted probability that example i belongs to class c.
The Adam optimizer was applied in the training process of the selected models. This method works well with various neural network architectures and demonstrates fast convergence, especially at the beginning of training, and stability during the training process [65]. The learning rate in this study is chosen to be 0.0001, which is considered relatively low. This means that the weight updates will be small, which can lead to a more stable training process and also help to avoid overfitting.
The regularization coefficient for the ResNet50 and DenseNet121 architectures is chosen to be 10 3 . For the lighter MobileNetV3 Small model, designed to run on mobile devices with limited computing resources, the value of 10 2 is chosen, since a higher regularization coefficient can help compensate for a smaller number of parameters, preventing overfitting and enhancing the model’s capacity for generalization.

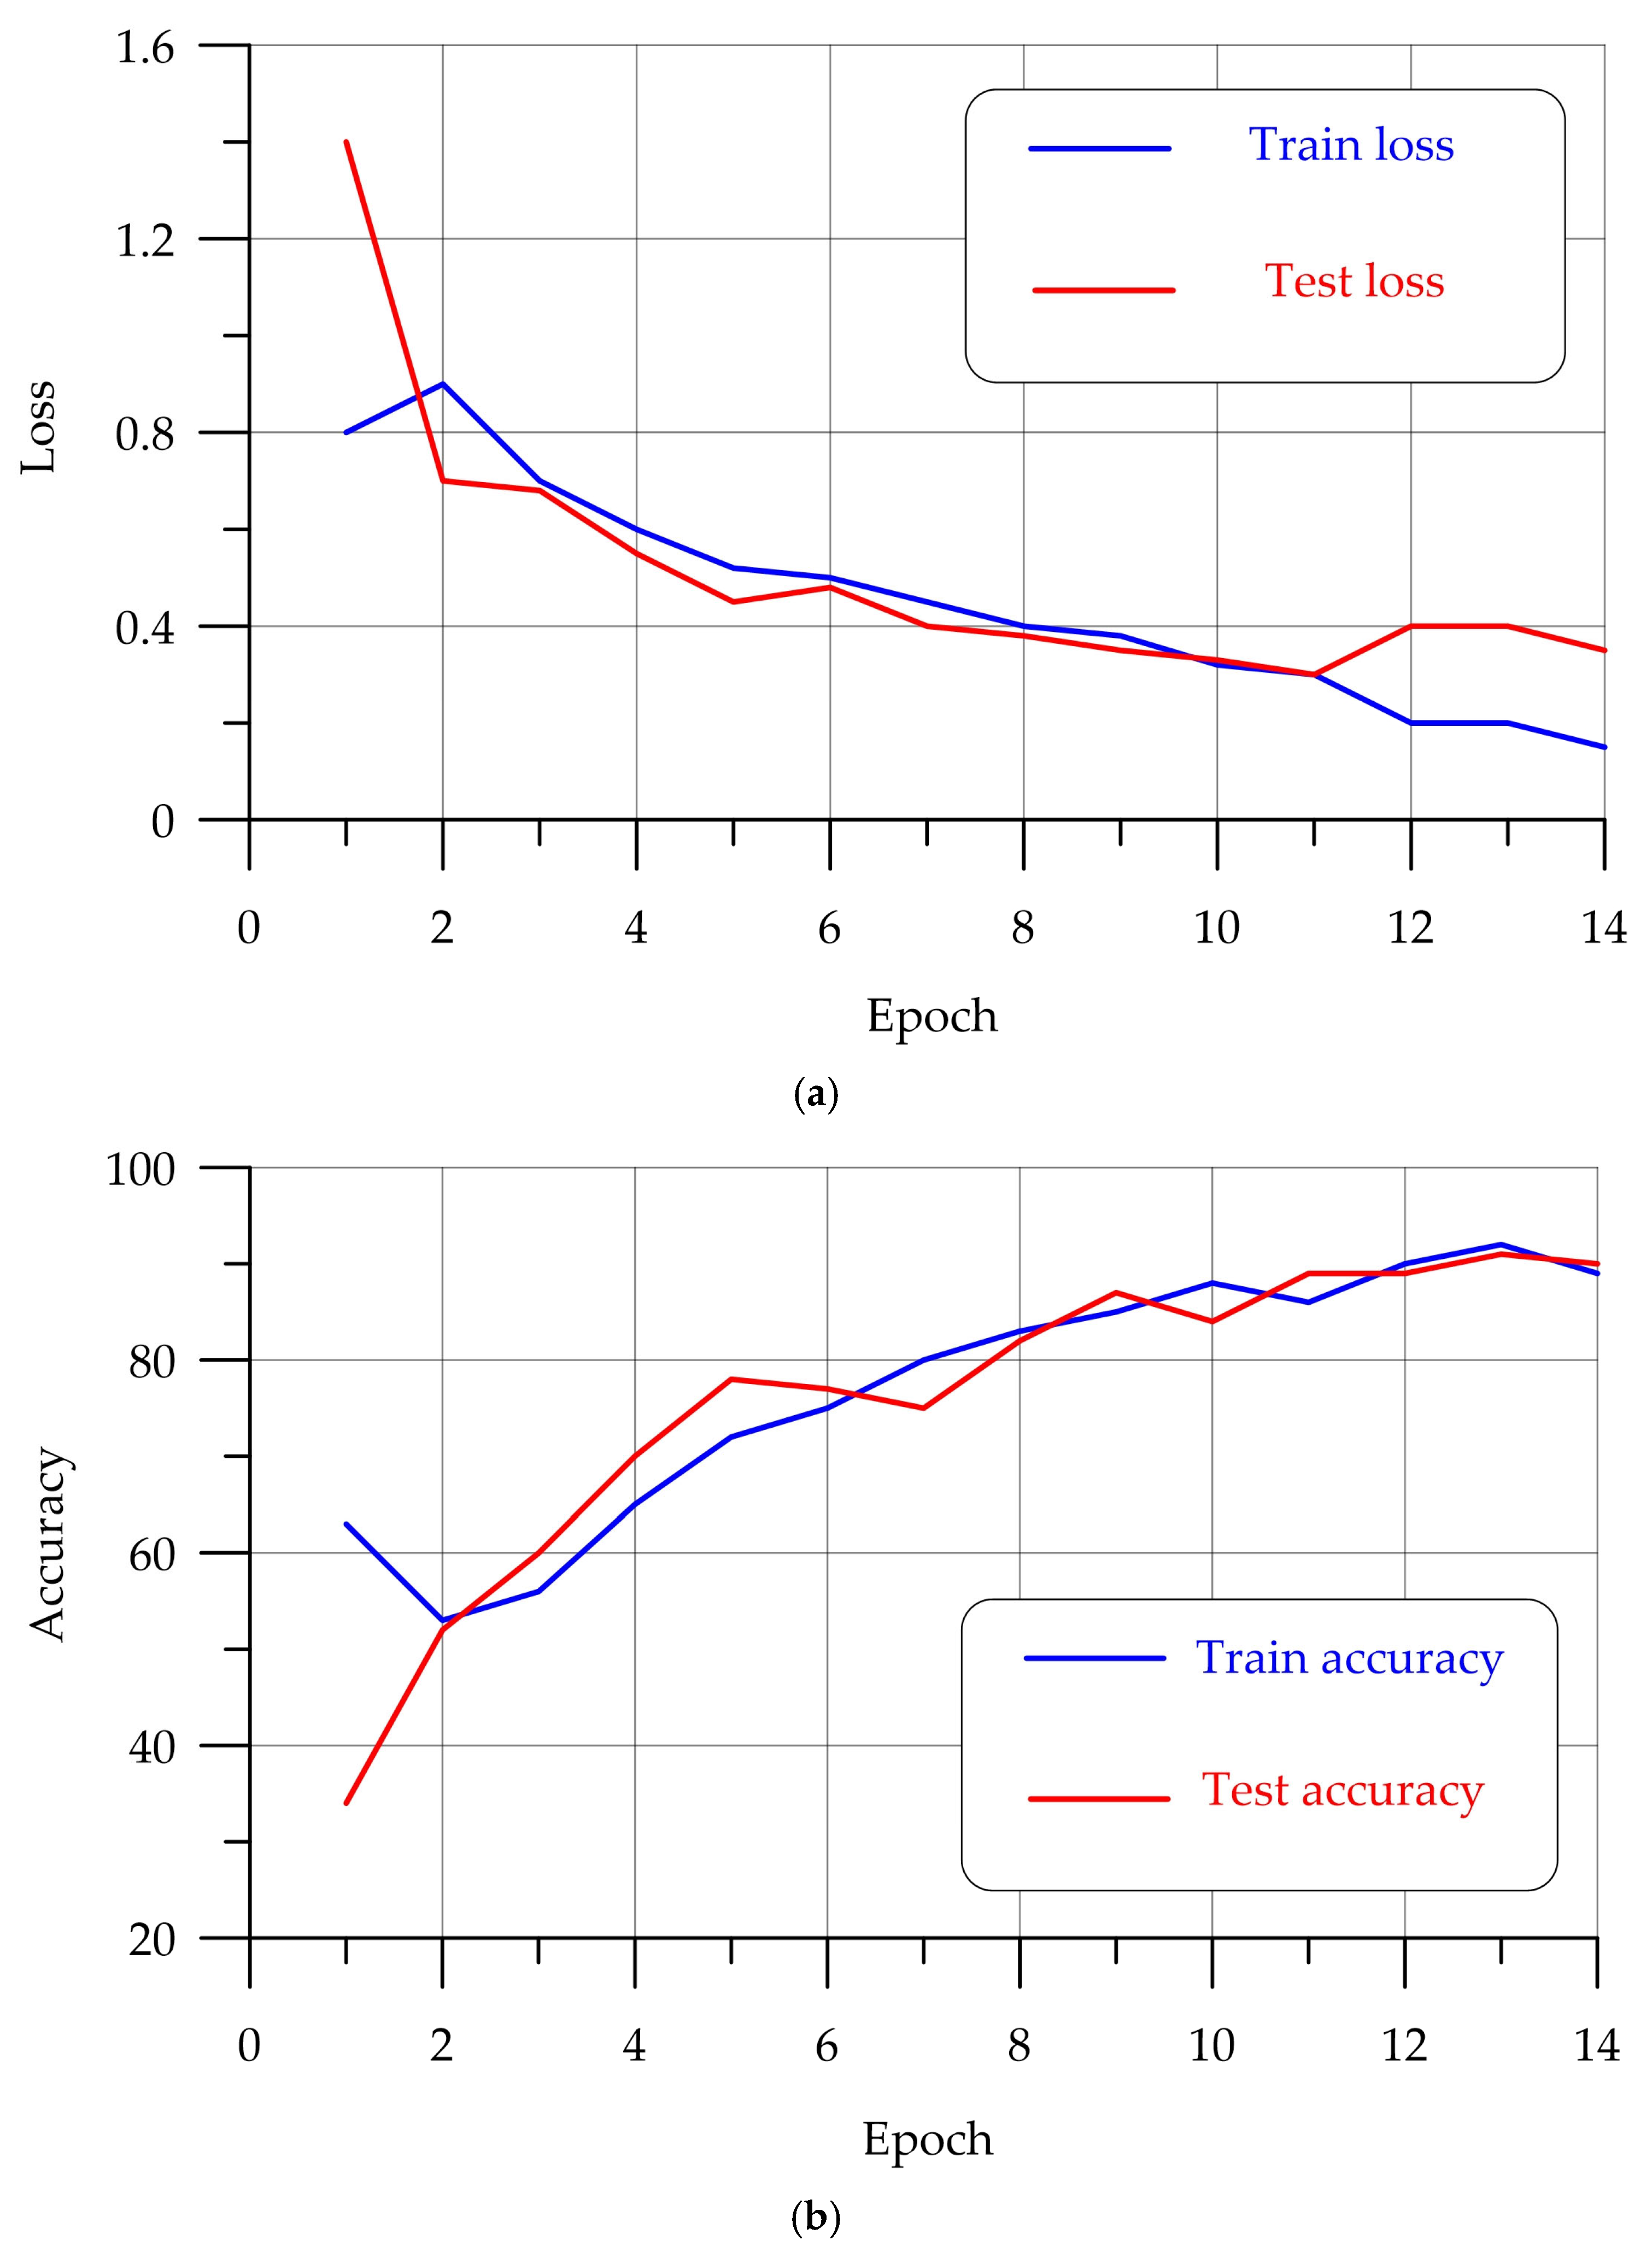
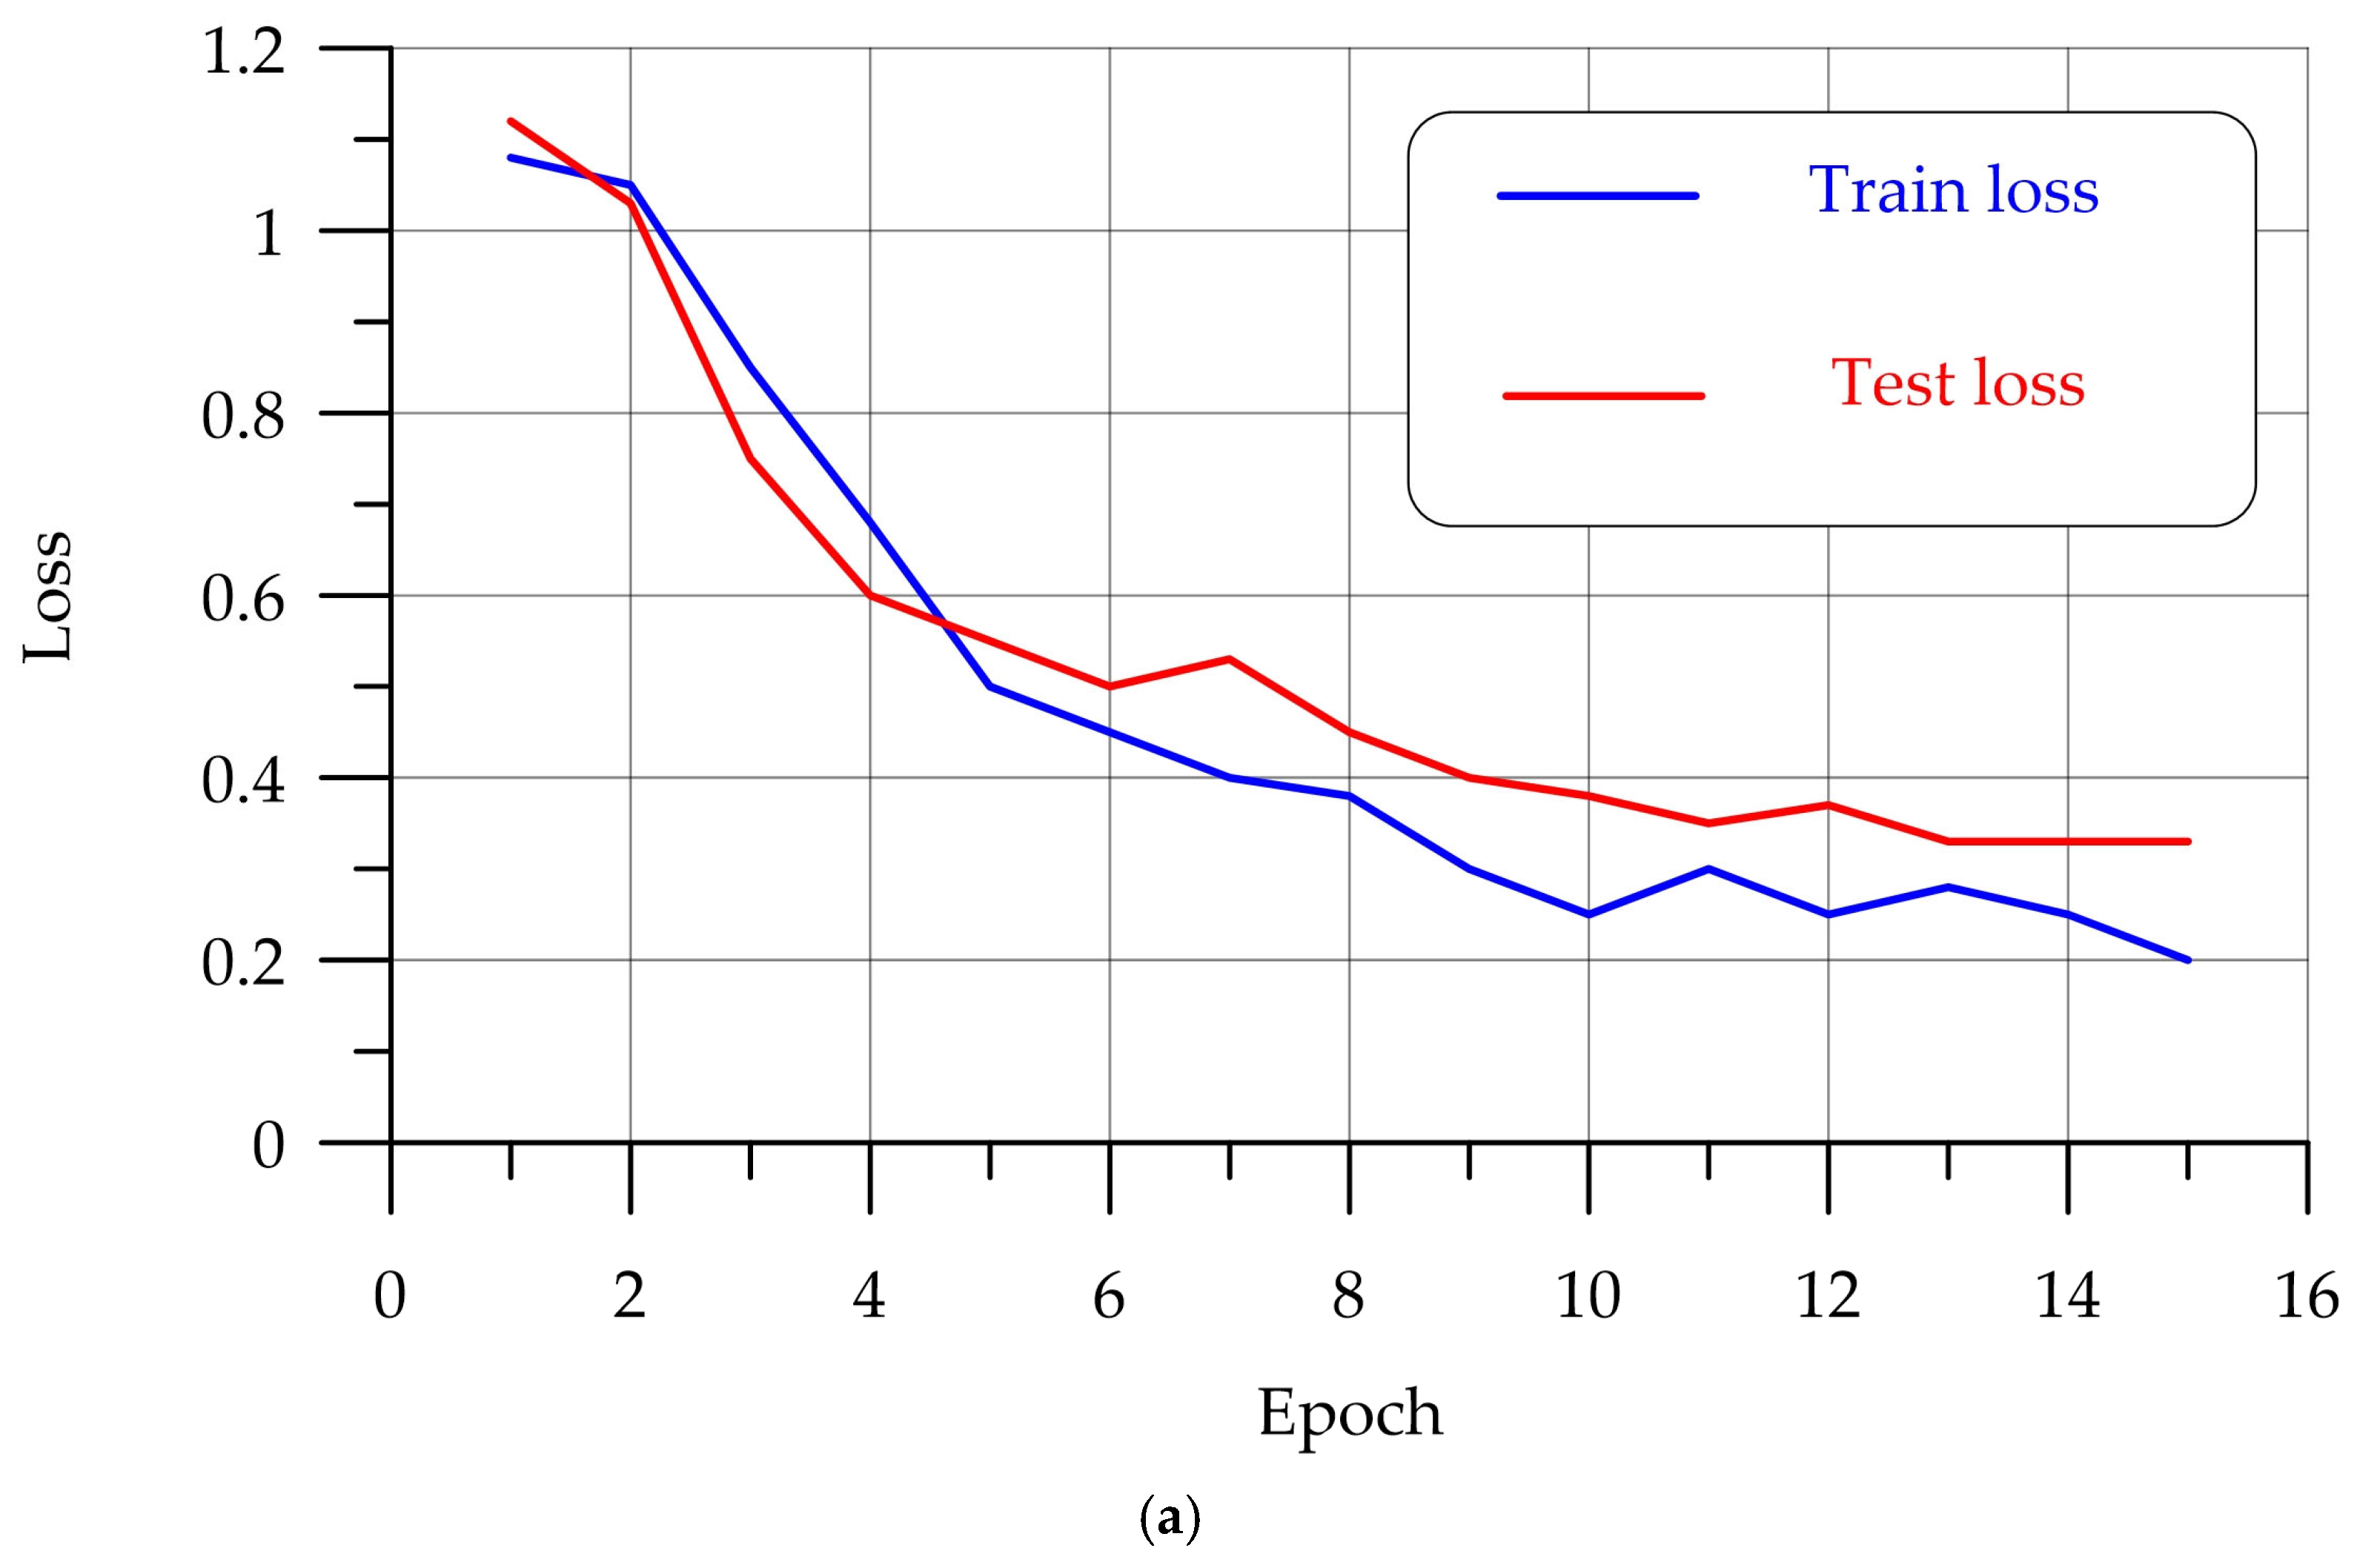
4.1. Training the Model Based on ResNet50

During the training of the model based on ResNet50, the average value of the loss function, as well as the classification accuracy on the training and test samples, is calculated at the end of each epoch. Figure 8 visualizes the Loss Curve and Accuracy Curve. The graph shows that the training process is stable: the error is steadily decreasing, while the accuracy, in turn, is increasing.
The Confusion Matrix (Figure 9) shows the distribution of predicted classes relative to the true labels. It allows researchers to assess the generalizability of the model and identify possible classes that cause classification errors.
By analyzing the matrix, we can conclude that the model most often makes mistakes when classifying gravel grains of the plate_like class and the needle_like class. These errors are caused by the visual similarity of the classes. However, the percentage of errors is small.

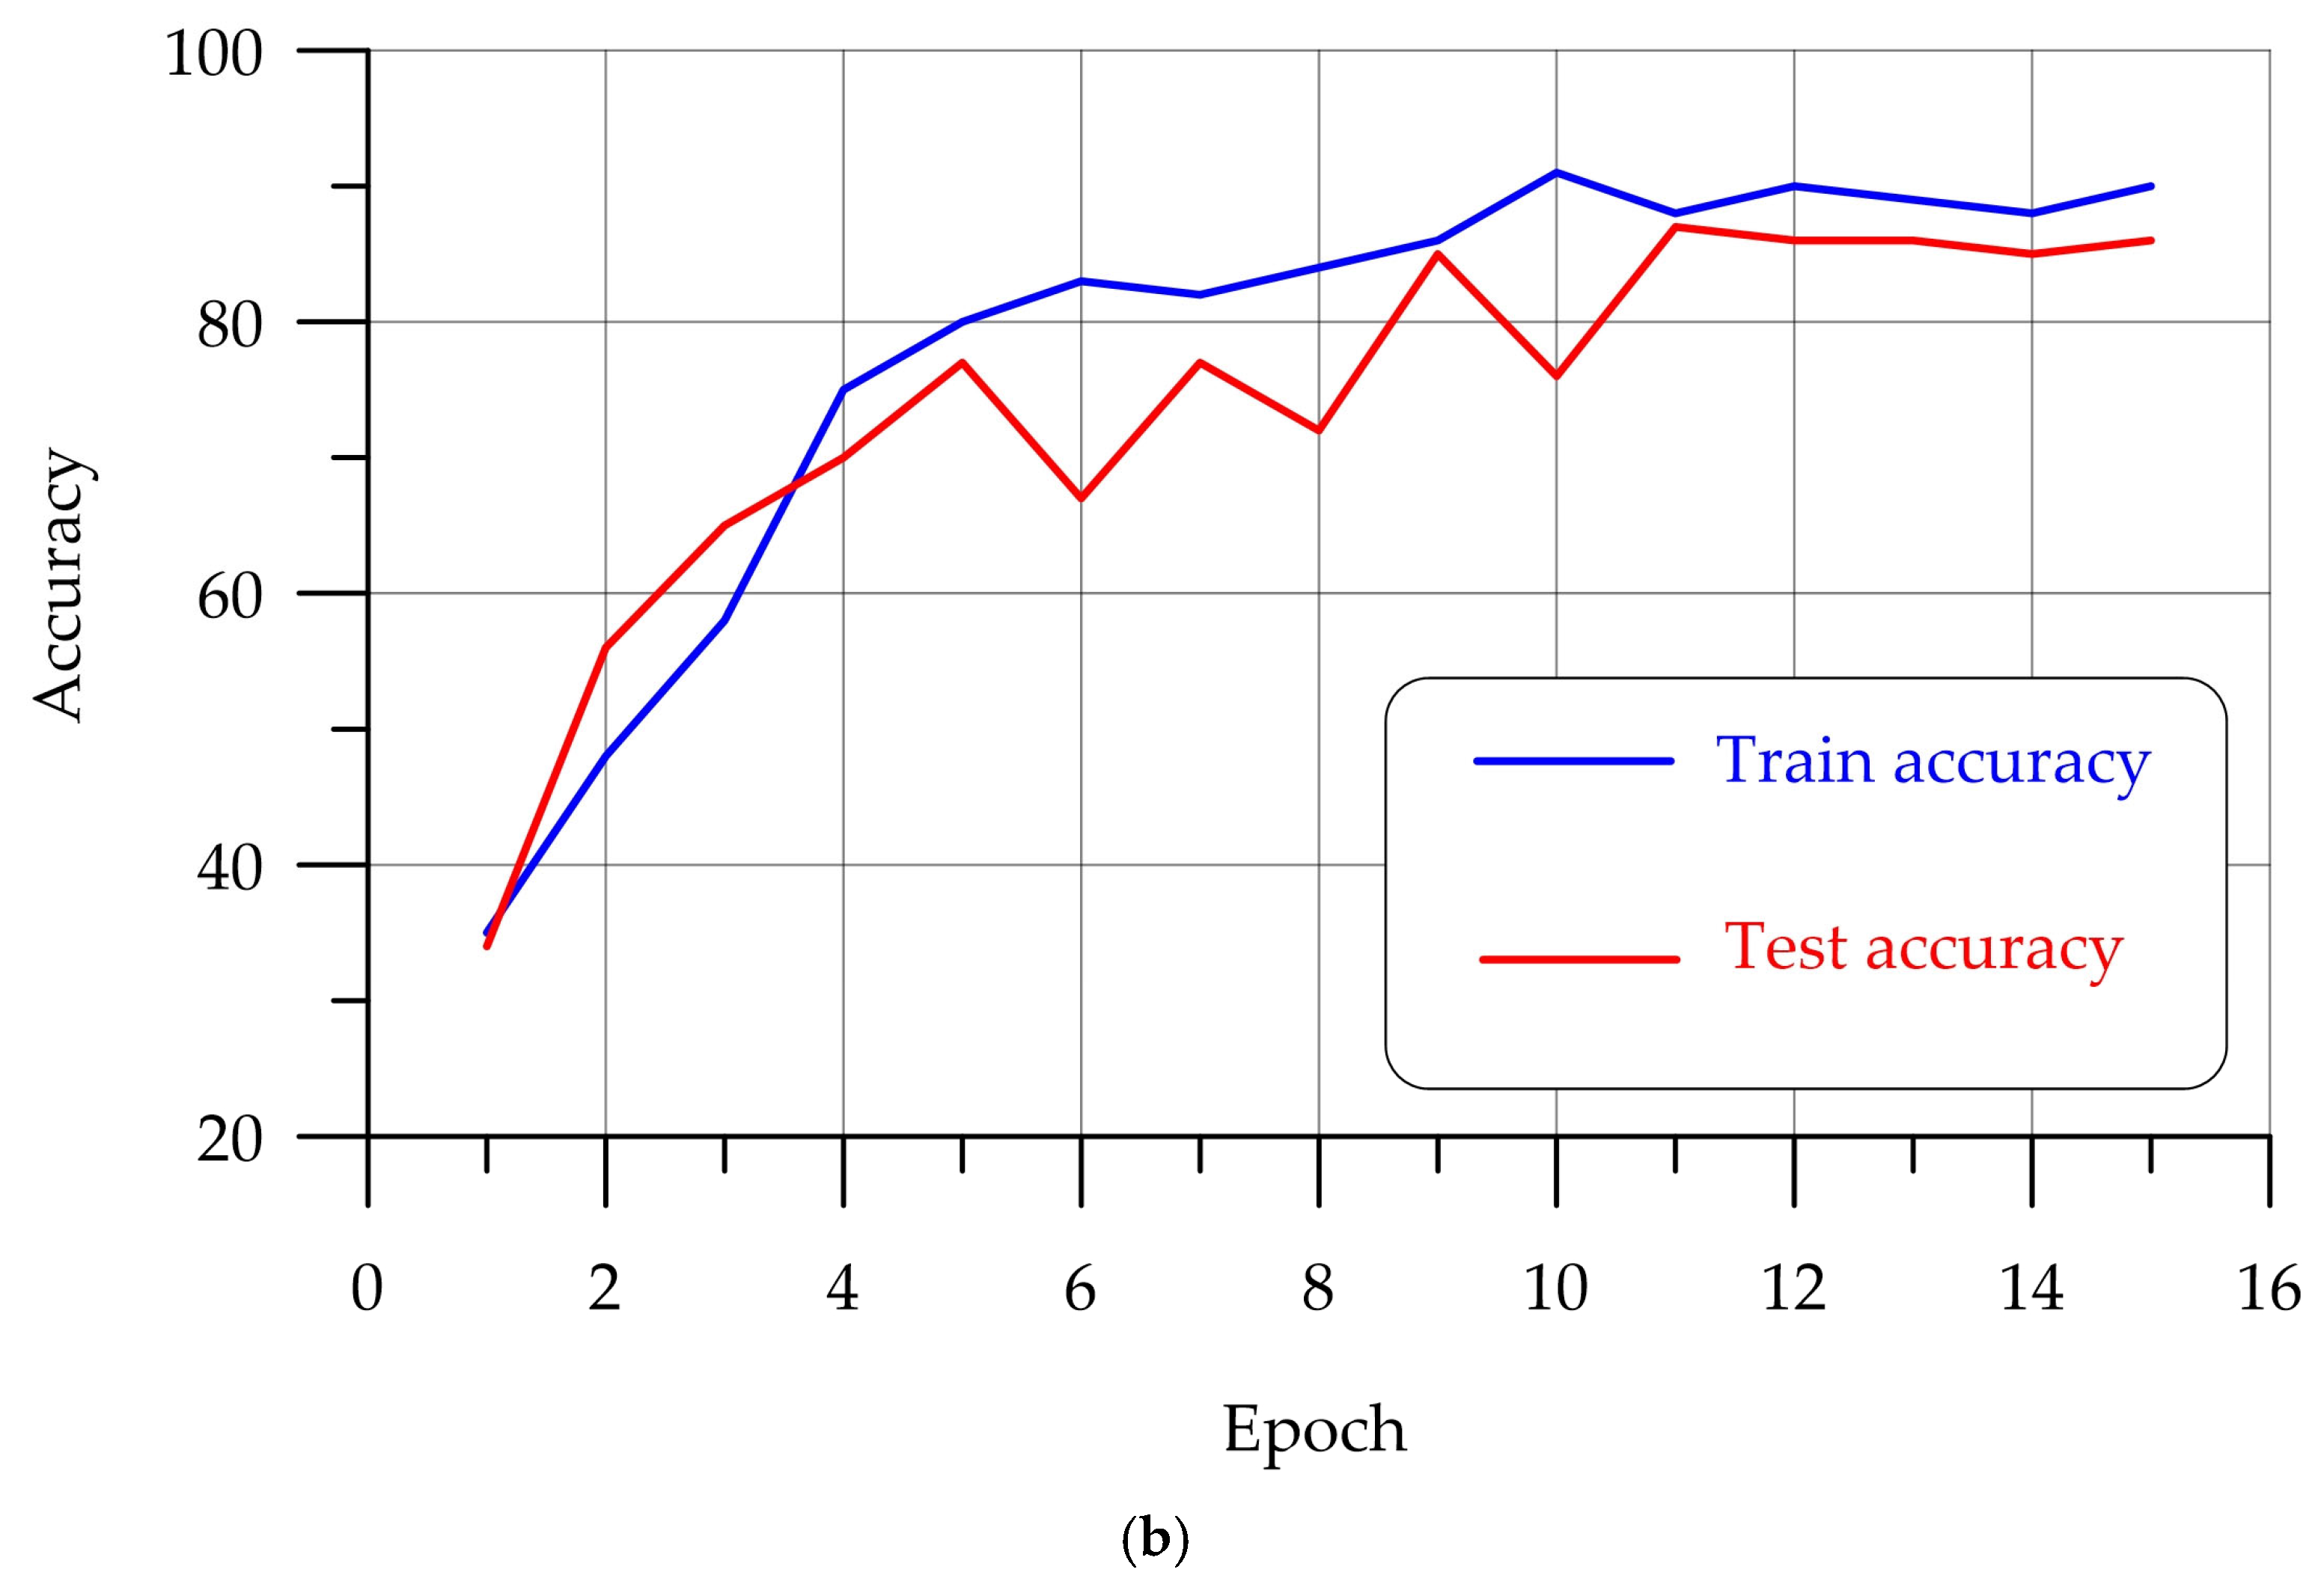
4.2. Training the Model Based on MobileNetv3 Small

To assess the quality of training, the Loss Curve and Accuracy Curve graphs were plotted for the model based on MobileNetv3 Small (Figure 10).
According to the graphs in Figure 10, the values of the loss function decrease from epoch to epoch, while the accuracy increases. This indicates that the model converges to the optimal solution and the curves stabilize.
According to the error matrix (Figure 11), this model also makes an error in classifying gravel grains of the plate_like class and the needle_like class. The reason for the error again lies in the external similarity of the classes. 7 needle_like samples were classified by the model as plate_like, and 4 plate_like samples were mistakenly assigned to the needle_like class.

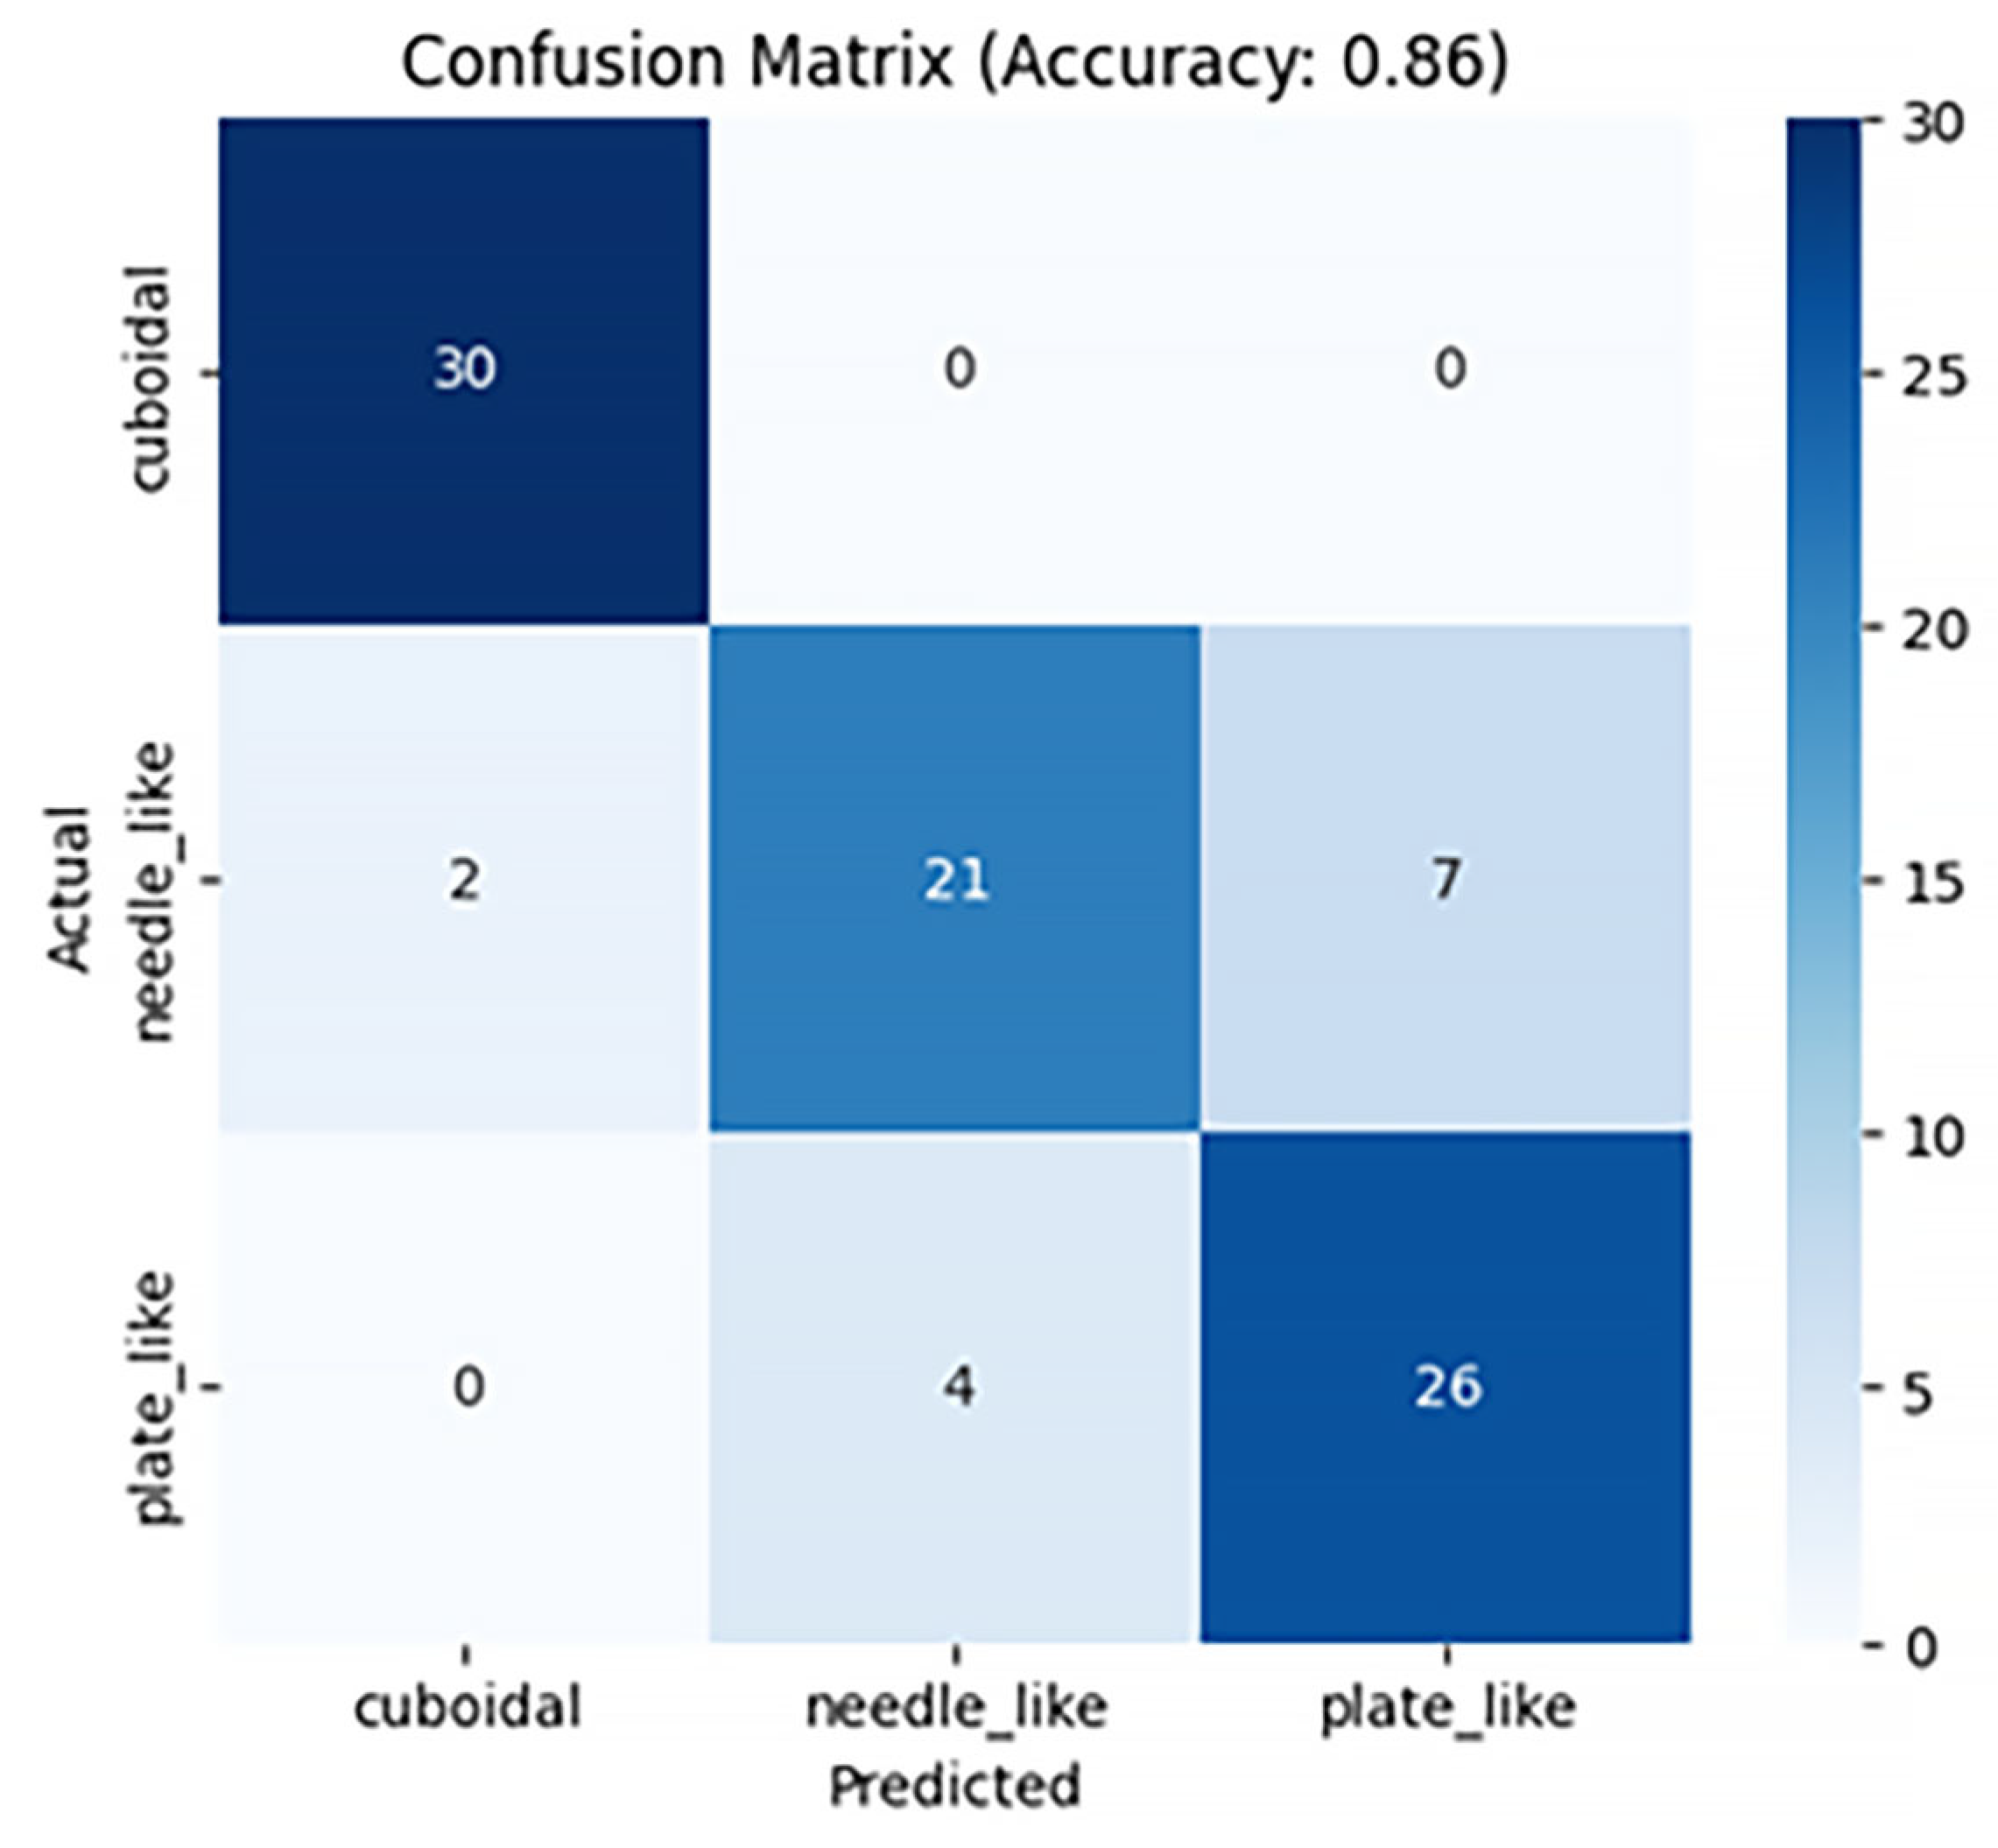
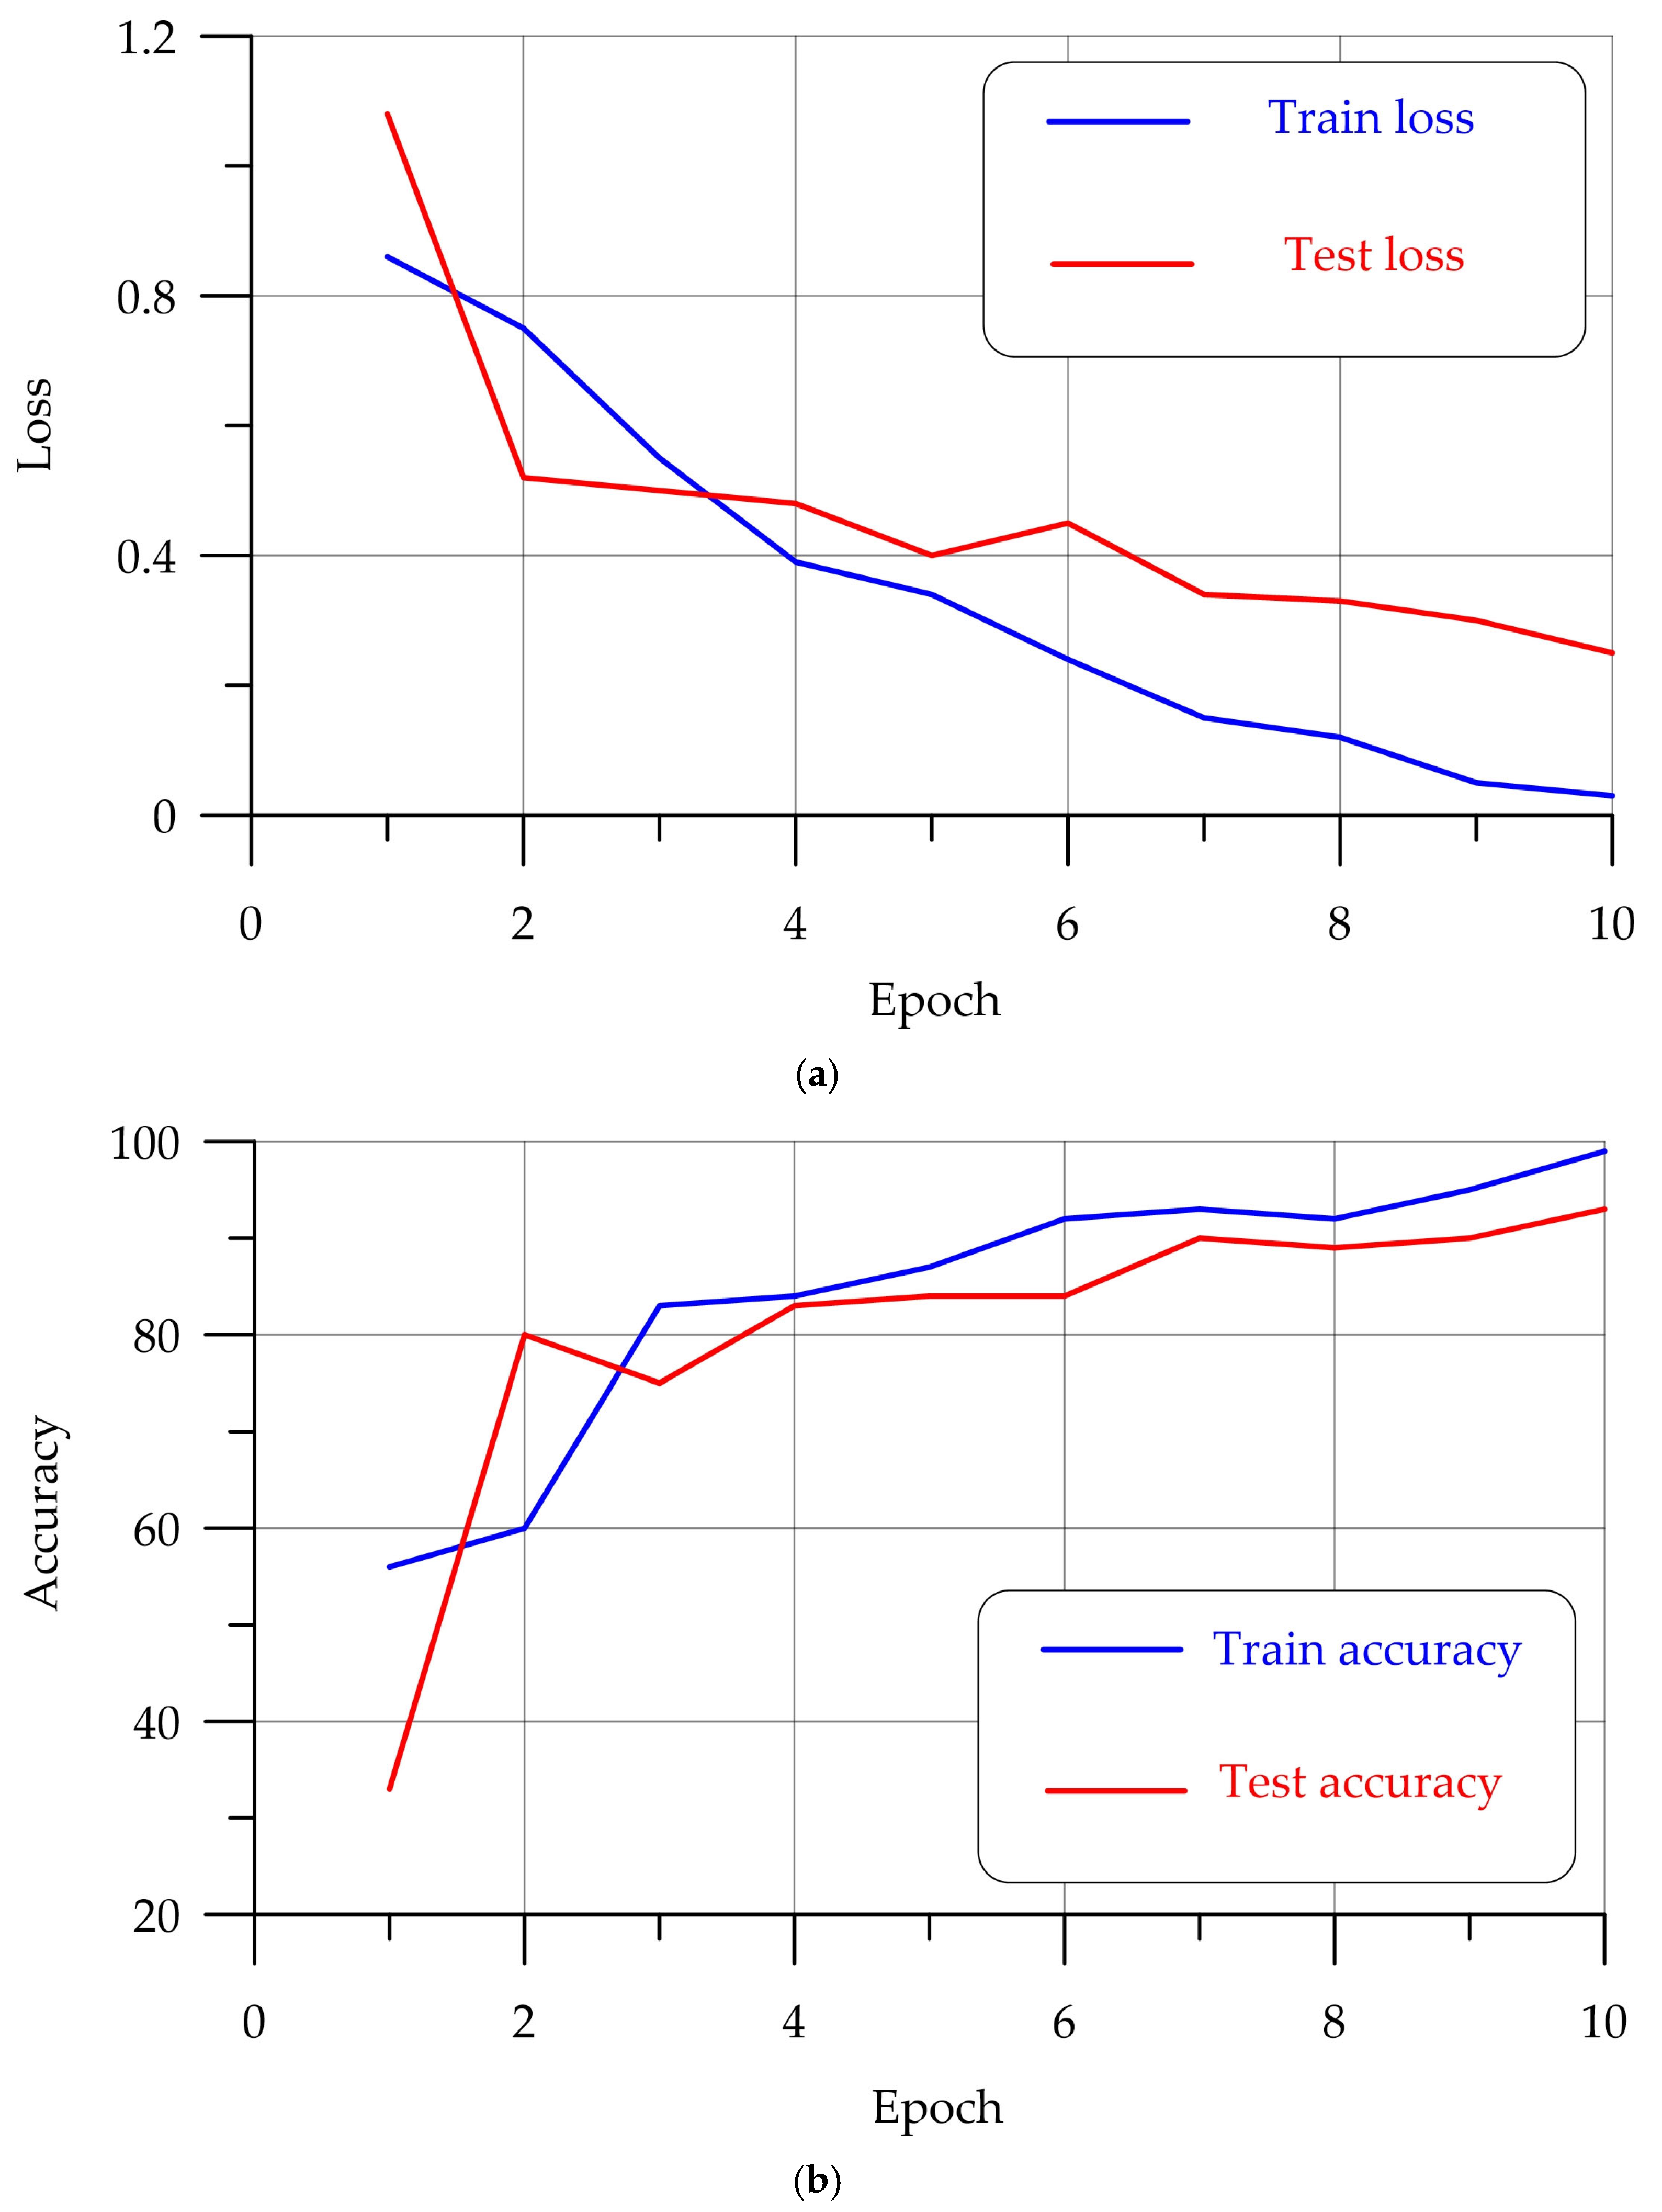
4.3. Training the DenseNet121-Based Model

Figure 12 is visualized to evaluate the performance of the DenseNet121 model during training. Training is stable, with errors steadily decreasing as accuracy increases. No overfitting is observed, and the curves are stabilizing, indicating that the model has reached its training limit with the currently selected hyperparameters.
The confusion matrix shown in Figure 13 gives an idea of which classes are most often confused.
The result of this model is almost identical to the result of the ResNet50-based model. As in the case of the first two models, the matrix analysis allowed us to identify the model’s weaknesses and understand that we need to continue working towards more accurate identification of the plate_like and needle_like classes. All three models cope with the grains of the cuboidal class without errors.
In addition to visualizing the training graphs and confusion matrices in this study, the quality of the implemented models is assessed in Table 2 using the Precision, Recall, and F1 metrics.
P r e c i s i o n P = t p i t p i + f p i
R e c a l l R = t p i t p i + f n i
F 1 = 2 P i   R i P i + R i
where t p i is the number of samples that actually belong to class i and were correctly predicted as class i; f p i is the number of samples that do not belong to class i but were predicted as class i; f n i is the number of samples that belong to class i but were predicted as another class.
In this study, for the case of multi-class classification, the average values of these metrics for all classes were used.
High values of the Precision metric, from 0.86 to 0.94, which are demonstrated by the developed models, mean that most of the predicted positive examples are indeed positive. Recall values from 0.85 to 0.93 mean that the model finds most of the positive examples. The F1 metric, which is the harmonic mean between Precision and Recall, ranges from 0.85 to 0.93. The efficiency of the developed intelligent algorithms is demonstrated by comparing their computational time for crushed stone grain classification via computer vision with a mobile grain size ratio template (standard manual method) and prior methods (see [5]).
Under controlled laboratory conditions, the sample comprised 200 grains, with a distribution of 72 cubic, 68 acicular, and 60 platy grains. Measurements with the template were carried out by five specialists with different experiences working with this tool (Figure 14).
The application of intelligent methods for classification required an initial photographic record obtained at 16:40. The time for processing 200 images using pre-trained convolutional networks ResNet50, MobileNetV3 Small, and DenseNet121 was 00:01, 00:02, and 00:01 s, respectively (Table 3).
It is worth noting that the average accuracy of the developed algorithms exceeds the CV methods presented in the previous study [5], while the ResNet50 and DenseNet121 models demonstrate high accuracy comparable to the work of a specialist.
Classification by specialists demonstrates high accuracy—up to 98% (average—90%), but the total execution time is from 17:36 to 26:14 min (average—21:19) for processing 200 grains. At the same time, a decrease in accuracy is observed among less experienced specialists, which emphasizes the subjectivity of visual assessment.
In turn, the proposed intelligent algorithms ResNet50, MobileNetV3 Small, and DenseNet121 demonstrate high stability and efficiency. The total processing time, including the photo fixation stage, is on average 16 min 41 s, while the accuracy of ResNet50 and DenseNet121 reaches 92% and 90%, respectively, which is comparable to or superior to the results of manual classification by specialists. Despite the difference in input modalities (point clouds and spherical tensors), the comparison is justified by the fact that all methods solve the same problem—automated classification of the shape of crushed stone grains. Since, when selecting 200 grains, the number of representatives of each class is approximately the same, the overall percentage of accuracy is sufficient to understand the success of the classification. The superiority of the developed intelligent algorithms over the manual method is that they do not require a break in their work, are capable of performing monotonous work for a long time, and are not affected by the fatigue factor.
A comparative analysis of the developed methods and an automated stone recognition system for Calabrian quarries (Southern Italy) is presented [36]. Researchers employed Convolutional Neural Networks (CNNs) for feature extraction in stone classification, subsequently utilizing Softmax, Multinomial Logistic Regression (MLR), Support Vector Machines (SVMs), k-Nearest Neighbors (kNNs), Random Forests (RFs), and Gaussian Naive Bayes (GNB) for classification. With the combination of different CNNs and different ML methods, the accuracy achieved in this study ranged from 78.9 to 99.9, which is comparable to the results obtained in the present study. In [66], a concatenated convolutional neural network (Con-CNN) method is proposed for classifying geological rock types based on petrographic thin sections. The proposed method provides an overall accuracy of 89.97%. The accuracy of the present study, when tested in real conditions, reaches 92.0%.
Functional machine learning methods are used for automatic classification of ornamental rocks [67]. On a small test sample (32 samples), the error was 1%. In the present study, in 200 samples, the error for the best model was 8%, which is approximately comparable with the study [67].
The conducted comparative analysis of the results confirmed the effectiveness of the developed convolutional neural network algorithms in classifying the shape of crushed stone grains, which consists of reducing labor costs and reducing the likelihood of human factor influence on the sorting quality.

5. Conclusions

The following results were achieved during the implementation of this study.
(1)
Three-dimensional images of three crushed stone grain classes were processed to generate tensors, which were subsequently compiled into an empirical database.
(2)
Parameters for stable training were selected, and convolutional neural networks ResNet50, MobileNetV3 Small, and DenseNet121 were trained.
(3)
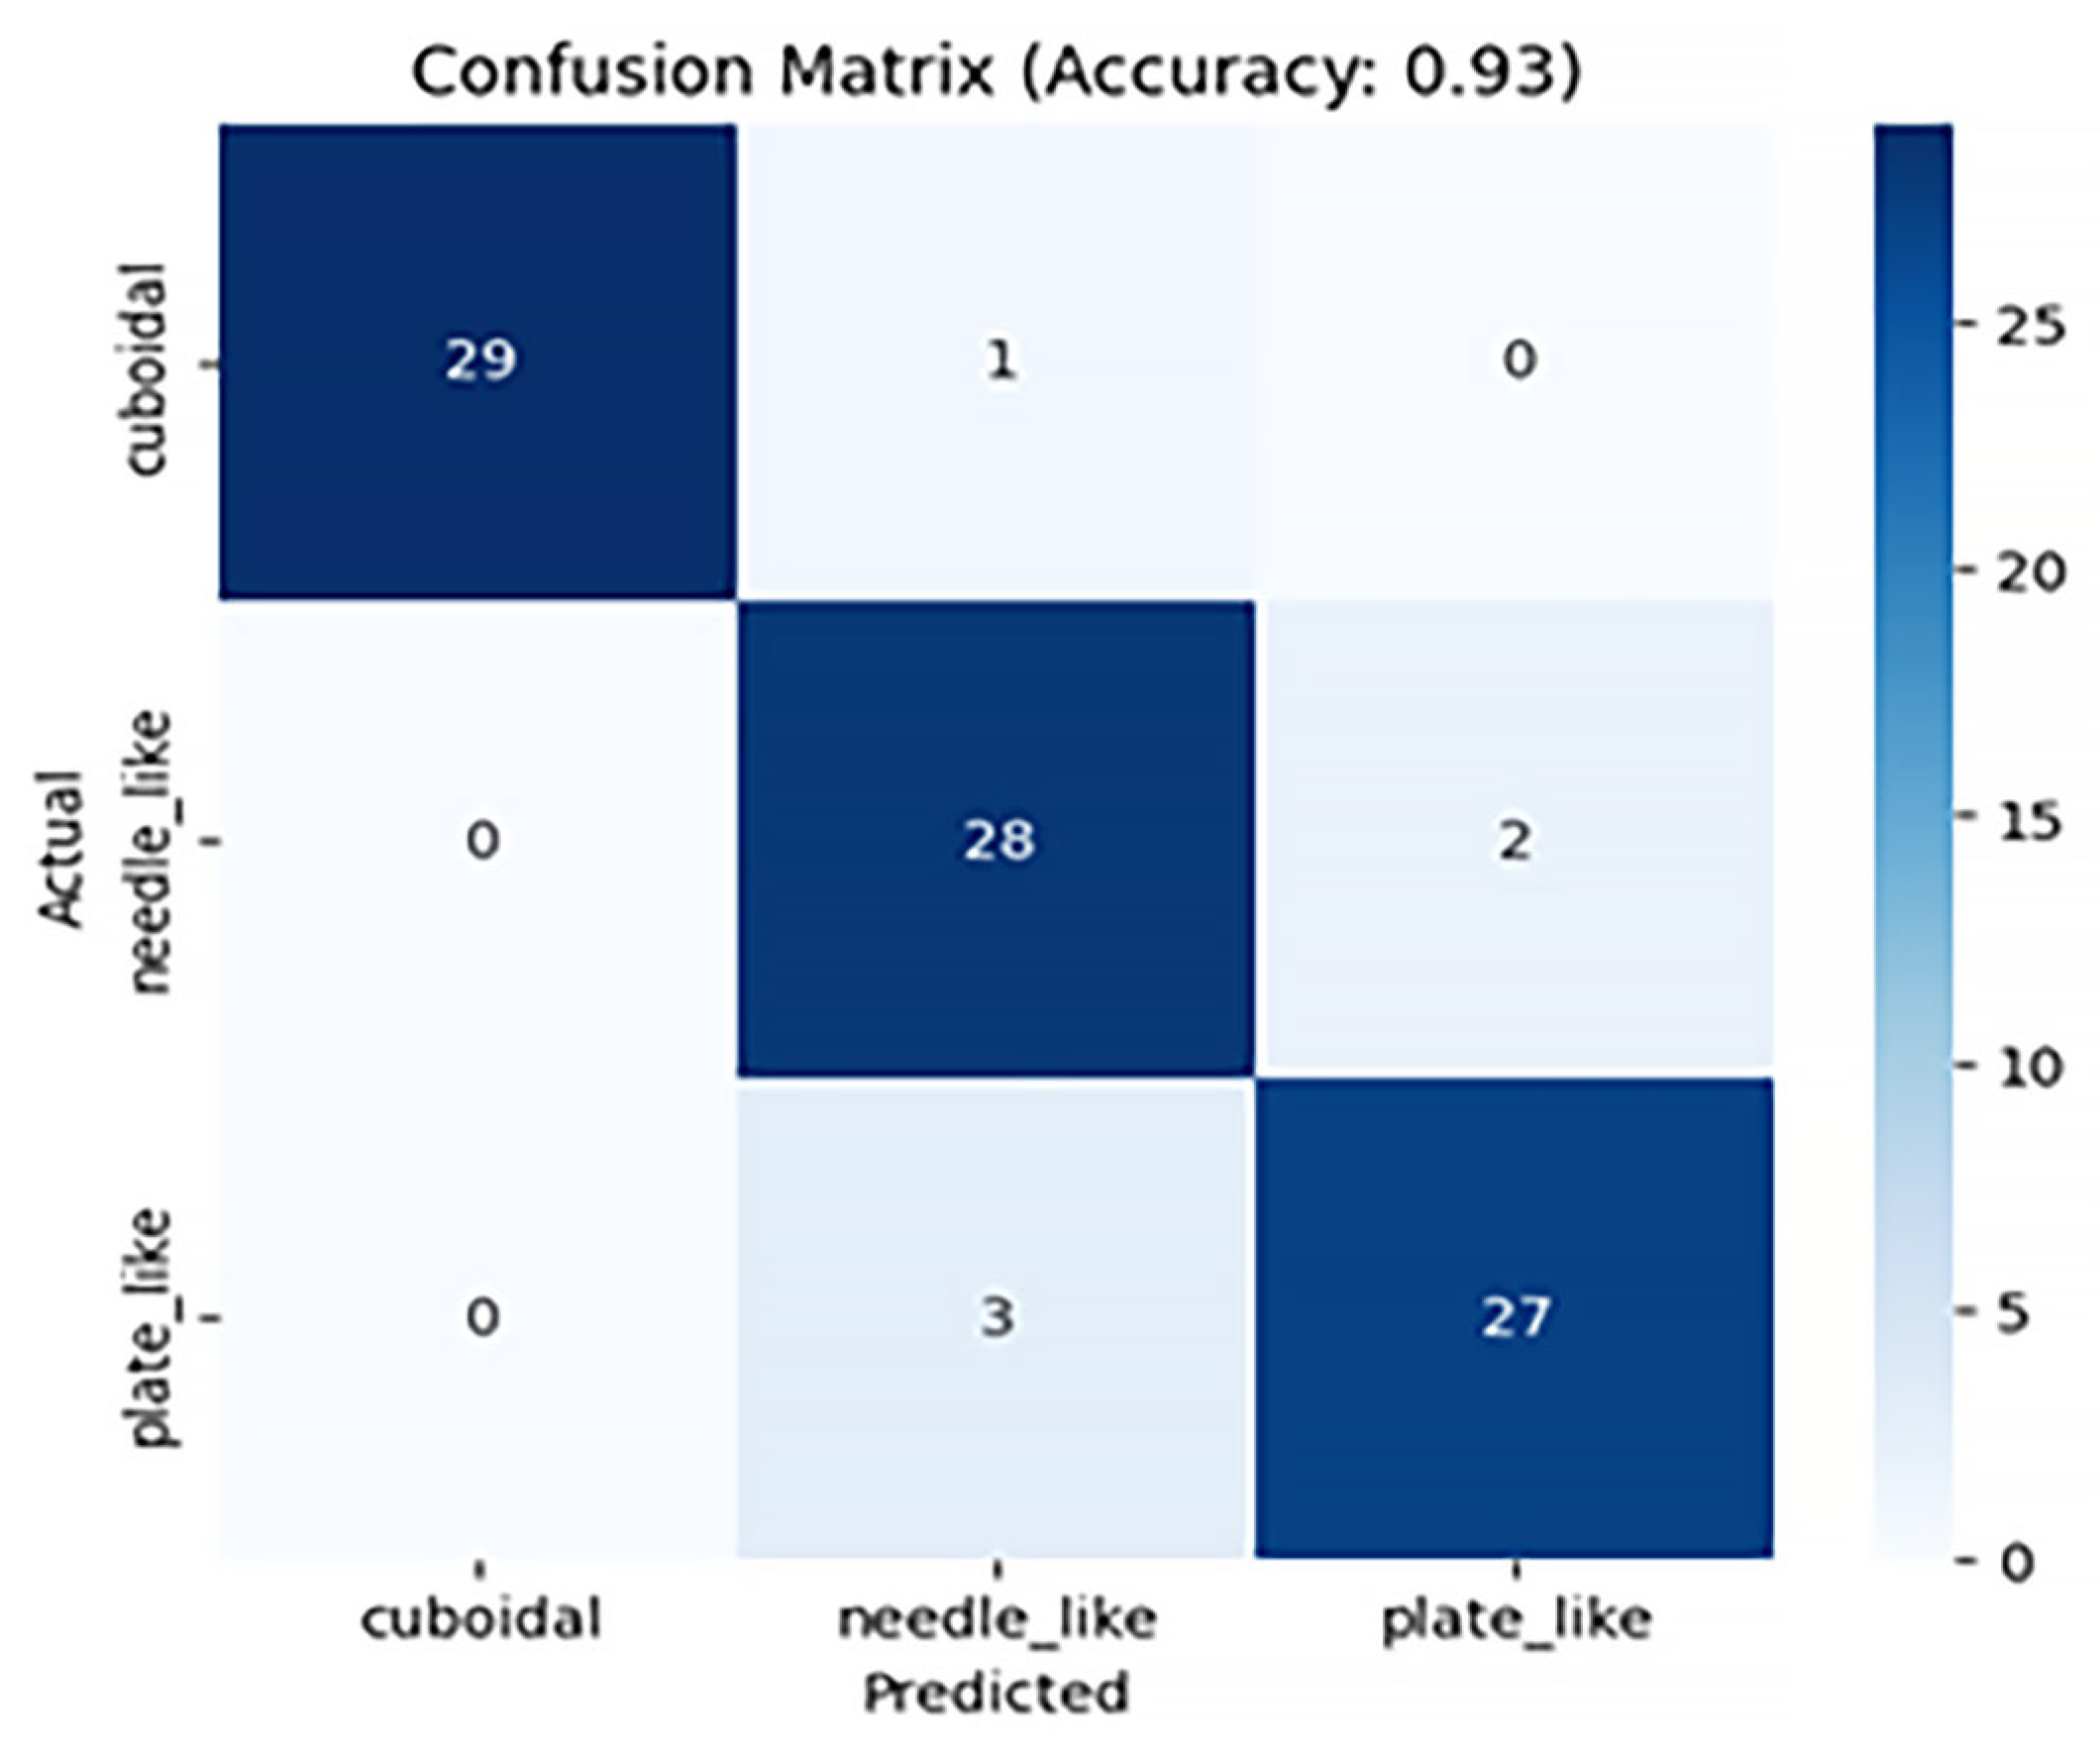
When tested on a test sample, the developed algorithms demonstrated high values of the Precision metric: from 0.86 to 0.94.
(4)
The simplified architecture of MobileNetV3 Small with reduced computational costs is suitable for use on mobile devices.
(5)
A comparison of the developed method with the manual classification method and the method of neural network models of computer vision, specially developed for working with three-dimensional data presented in the form of point clouds, was carried out. A high classification accuracy of 92% was achieved, which confirms the effectiveness of the proposed approach. The result is comparable with the use of traditional analysis methods and surpasses them with large sample volumes (200 or more grains).
(6)
The developed models allow for the complete automation of the process of determining the type of crushed stone grains, which reduces labor costs and also reduces the likelihood of human factor influence.
(7)
The prospect of improving the model lies in the following actions:
-
expanding the training sample to improve the accuracy and generalizability of the algorithms. As shown in the study, stones from the plate_like class and the needle_like class are visually very similar, which can complicate their classification, which requires an expansion of the dataset.
-
the methods considered can be adapted for classifying other types of building materials, which expands its applicability in various industries;
-
the versatility and cross-platform nature of computer vision models open up opportunities for their integration into existing industrial quality control and automation systems.
When applying the developed algorithms in practice, there are a number of limitations associated with the following factors:
  • -
    models can classify data that are very different from the training set with low accuracy, for example, stones from new geological conditions. If it is necessary to apply to special types of building materials, it is worth retraining the model;
    -
    the implementation of the retraining process and the use of such models requires computing resources, which may be a limitation for some users.
The developed algorithms can be useful both in academic and practical terms. Understanding the operation of convolutional neural networks and the features of their architectures expands both practical and theoretical skills in working with intelligent models. High-quality trained models can become part of industrial applications, acting as an element of automation.
Future work is planned in the direction of expanding the list of models, studying the adaptation of architectures that explicitly support rotation invariance, and analyzing the impact of various resizing methods (bicubic interpolation vs. nearest neighbor) on geometric features.

Author Contributions

Conceptualization, I.R., S.A.S., E.M.S., A.C. and D.E.; methodology, S.A.S., E.M.S., N.I.N. and I.R.; software, G.O. and I.R.; validation, I.R., N.I.N., G.O., S.A.S., E.M.S. and D.E.; formal analysis, I.R. and A.C.; investigation, I.R., S.A.S., E.M.S., A.N.B., A.C. and D.E.; resources, I.R. and A.L.M.; data curation, I.R., A.L.M. and N.I.N.; writing—original draft preparation, I.R., S.A.S., E.M.S. and A.N.B.; writing—review and editing, I.R., S.A.S., E.M.S. and A.N.B.; visualization, I.R., S.A.S., E.M.S., A.N.B. and A.C.; supervision, A.N.B.; project administration, A.N.B.; funding acquisition, E.M.S. All authors have read and agreed to the published version of the manuscript.

Funding

This research received no external funding.

Institutional Review Board Statement

Not applicable.

Informed Consent Statement

Not applicable.

Data Availability Statement

Data are contained within the article.

Acknowledgments

The authors would like to acknowledge the administration of Don State Technical University for their support and resources.

Conflicts of Interest

The authors declare no conflicts of interest.

Abbreviations

The following abbreviations are used in this manuscript:
AbbreviationExpanded
AIArtificial Intelligence
BIMBuilding Information Model
CNNConvolutional Neural Network
CVComputer Vision
GNBGaussian Naive Bayes
GPUGraphics Processing Unit
kNNk-Nearest Neighbors
MLMachine Learning
MLRMultinomial Logistic Regression
RFRandom Forest
SVMSupport Vector Machine
VRVirtual Reality

References

  1. Kondratieva, T.N.; Chepurnenko, A.S. Prediction of the Strength of the Concrete-Filled Tubular Steel Columns Using the Artificial Intelligence. Mod. Trends Constr. Urban Territ. Plan. 2024, 3, 40–48. [Google Scholar] [CrossRef]
  2. Beskopylny, A.N.; Stel’makh, S.A.; Shcherban’, E.M.; Mailyan, L.R.; Meskhi, B.; Razveeva, I.; Kozhakin, A.; Pembek, A.; Elshaeva, D.; Chernil’nik, A.; et al. Prediction of the Compressive Strength of Vibrocentrifuged Concrete Using Machine Learning Methods. Buildings 2024, 14, 377. [Google Scholar] [CrossRef]
  3. Seo, J.; Han, S.; Lee, S.; Kim, H. Computer vision techniques for construction safety and health monitoring. Adv. Eng. Inform. 2015, 29, 239–251. [Google Scholar] [CrossRef]
  4. Ferraris, C.; Amprimo, G.; Pettiti, G. Computer Vision and Image Processing in Structural Health Monitoring: Overview of Recent Applications. Signals 2023, 4, 539–574. [Google Scholar] [CrossRef]
  5. Beskopylny, A.N.; Shcherban’, E.M.; Stel’makh, S.A.; Shilov, A.A.; Razveeva, I.; Elshaeva, D.; Chernil’nik, A.; Onore, G. Developing Computer Vision Models for Classifying Grain Shapes of Crushed Stone. Sensors 2025, 25, 1914. [Google Scholar] [CrossRef]
  6. Kondratieva, T.N.; Chepurnenko, A.S. Prediction of Rheological Parameters of Polymers by Machine Learning Methods. Adv. Eng. Res. (Rostov-on-Don). 2024, 24, 36–47. [Google Scholar] [CrossRef]
  7. Wang, Y.; Li, J.; Zhang, X.; Yao, Y.; Peng, Y. Recent Development in Intelligent Compaction for Asphalt Pavement Construction: Leveraging Smart Sensors and Machine Learning. Sensors 2024, 24, 2777. [Google Scholar] [CrossRef]
  8. Fan, R.; Tian, A.; Li, Y.; Gu, Y.; Wei, Z. Research Progress on Machine Learning Prediction of Compressive Strength of Nano-Modified Concrete. Appl. Sci. 2025, 15, 4733. [Google Scholar] [CrossRef]
  9. Qin, X.; Xu, Z.; Liu, M.; Zhang, Y.; Wang, Y.; Yang, Z.; Ling, X. Mechanical Properties and Elastic Modulus Prediction of Mixed Coal Gangue Concrete. Materials 2025, 18, 1240. [Google Scholar] [CrossRef]
  10. Li, P.; Xu, Y.; Liu, Z.; Jiang, H.; Liu, A. Evaluation and Optimization of Urban Street Spatial Quality Based on Street View Images and Machine Learning: A Case Study of the Jinan Old City. Buildings 2025, 15, 1408. [Google Scholar] [CrossRef]
  11. Park, J.; Kang, D. Artificial Intelligence and Smart Technologies in Safety Management: A Comprehensive Analysis Across Multiple Industries. Appl. Sci. 2024, 14, 11934. [Google Scholar] [CrossRef]
  12. Chepurnenko, A.S.; Kondratieva, T.N. Determining the Rheological Parameters of Polymers Using Machine Learning Techniques. Mod. Trends Constr. Urban Territ. Plan. 2024, 3, 71–83. [Google Scholar] [CrossRef]
  13. Sobol, B.V.; Soloviev, A.N.; Vasiliev, P.V.; Lyapin, A.A. Modeling of Ultrasonic Flaw Detection Processes in the Task of Searching and Visualizing Internal Defects in Assemblies and Structures. Adv. Eng. Res. (Rostov-on-Don) 2023, 23, 433–450. [Google Scholar] [CrossRef]
  14. Ivanova, S.; Kuznetsov, A.; Zverev, R.; Rada, A. Artificial Intelligence Methods for the Construction and Management of Buildings. Sensors 2023, 23, 8740. [Google Scholar] [CrossRef]
  15. Lee, Y.-C.; Shariatfar, M.; Rashidi, A.; Lee, H.W. Evidence-driven sound detection for prenotification and identification of construction safety hazards and accidents. Autom. Constr. 2020, 113, 103127. [Google Scholar] [CrossRef]
  16. George, M.R.; Nalluri, M.R.; Anand, K.B. Severity Prediction of Construction Site Accidents Using Simple and Ensemble Decision Trees. In Proceedings of SECON’21; Lecture Notes in Civil Engineering; Springer: Cham, Switzerland, 2021; Volume 171, pp. 599–608. [Google Scholar]
  17. Jayaram, M.A. Computer vision applications in construction material and structural health monitoring: A scoping review. Mater. Today Proc. 2023, in press. [CrossRef]
  18. Nizina, T.A.; Nizin, D.R.; Selyaev, V.P.; Spirin, I.P.; Stankevich, A.S. Big data in predicting the climatic resistance of building materials. I. Air temperature and humidity. Constr. Mater. Prod. 2023, 6, 18–30. [Google Scholar] [CrossRef]
  19. Wu, T.; Chen, Z.; Li, S.; Xing, P.; Wei, R.; Meng, X.; Zhao, J.; Wu, Z.; Qiao, R. Decoupling Urban Street Attractiveness: An Ensemble Learning Analysis of Color and Visual Element Contributions. Land 2025, 14, 979. [Google Scholar] [CrossRef]
  20. Rabbi, A.B.K.; Jeelani, I. AI integration in construction safety: Current state, challenges, and future opportunities in text, vision, and audio based applications. Autom. Constr. 2024, 164, 105443. [Google Scholar] [CrossRef]
  21. Laqsum, S.A.; Zhu, H.; Haruna, S.I.; Ibrahim, Y.E.; Al-shawafi, A. Mechanical and Impact Strength Properties of Polymer-Modified Concrete Supported with Machine Learning Method: Microstructure Analysis (SEM) Coupled with EDS. J. Compos. Sci. 2025, 9, 101. [Google Scholar] [CrossRef]
  22. Baudrit, C.; Dufau, S.; Villain, G.; Sbartaï, Z.M. Artificial Intelligence and Non-Destructive Testing Data to Assess Concrete Sustainability of Civil Engineering Infrastructures. Materials 2025, 18, 826. [Google Scholar] [CrossRef] [PubMed]
  23. Ma, K.; Yao, C.; Liu, B.; Hu, Q.; Li, S.; He, P.; Han, J. Segment Anything Model-Based Hyperspectral Image Classification for Small Samples. Remote Sens. 2025, 17, 1349. [Google Scholar] [CrossRef]
  24. Almusaed, A.; Yitmen, I. Architectural Reply for Smart Building Design Concepts Based on Artificial Intelligence Simulation Models and Digital Twins. Sustainability 2023, 15, 4955. [Google Scholar] [CrossRef]
  25. Liao, W.; Lu, X.; Fei, Y.; Gu, Y.; Huang, Y. Generative AI design for building structures. Autom. Constr. 2024, 157, 105187. [Google Scholar] [CrossRef]
  26. Eller, B.; Movahedi Rad, M.; Fekete, I.; Szalai, S.; Harrach, D.; Baranyai, G.; Kurhan, D.; Sysyn, M.; Fischer, S. Examination of Concrete Canvas under Quasi-Realistic Loading by Computed Tomography. Infrastructures 2023, 8, 23. [Google Scholar] [CrossRef]
  27. Chepurnenko, A.S.; Turina, V.S.; Akopyan, V.F. Artificial intelligence model for predicting the load-bearing capacity of eccentrically compressed short concrete filled steel tubular columns. Constr. Mater. Prod. 2024, 7, 2. [Google Scholar] [CrossRef]
  28. Hematibahar, M.; Kharun, M.; Beskopylny, A.N.; Stel’makh, S.A.; Shcherban’, E.M.; Razveeva, I. Analysis of Models to Predict Mechanical Properties of High-Performance and Ultra-High-Performance Concrete Using Machine Learning. J. Compos. Sci. 2024, 8, 287. [Google Scholar] [CrossRef]
  29. Beskopylny, A.N.; Stel’makh, S.A.; Shcherban’, E.M.; Razveeva, I.; Kozhakin, A.; Pembek, A.; Kondratieva, T.N.; Elshaeva, D.; Chernil’nik, A.; Beskopylny, N. Prediction of the Properties of Vibro-Centrifuged Variatropic Concrete in Aggressive Environments Using Machine Learning Methods. Buildings 2024, 14, 1198. [Google Scholar] [CrossRef]
  30. Ullah, A.; Asami, K.; Holtz, L.; Röver, T.; Azher, K.; Bartsch, K.; Emmelmann, C. A Machine Learning Approach for Mechanical Component Design Based on Topology Optimization Considering the Restrictions of Additive Manufacturing. J. Manuf. Mater. Process. 2024, 8, 220. [Google Scholar] [CrossRef]
  31. Ji, Y.; Wang, D.; Wang, J. Study of recycled concrete properties and prediction using machine learning methods. J. Build. Eng. 2024, 94, 110067. [Google Scholar] [CrossRef]
  32. Jeong, D.; Jeong, T.; Lee, C.; Choi, Y.; Lee, D. A Study on Guidelines for Constructing Building Digital Twin Data. Buildings 2025, 15, 434. [Google Scholar] [CrossRef]
  33. Mundt, M.; Majumder, S.; Murali, S.; Panetsos, P.; Ramesh, V. Meta-Learning Convolutional Neural Architectures for Multi-Target Concrete Defect Classification with the COncrete DEfect BRidge IMage Dataset. In Proceedings of the 2019 IEEE/CVF Conference on Computer Vision and Pattern Recognition (CVPR), Long Beach, CA, USA, 15–20 June 2019; pp. 11188–11197. [Google Scholar] [CrossRef]
  34. Vasiliev, P.V.; Senichev, A.V.; Giorgio, I. Visualization of internal defects using a deep generative neural network model and ultrasonic nondestructive testing. Adv. Eng. Res. (Rostov-on-Don) 2021, 21, 143–153. [Google Scholar] [CrossRef]
  35. Pooraskarparast, B.; Dang, S.N.; Pakrashi, V.; Matos, J.C. Performance of Fine-Tuning Techniques for Multilabel Classification of Surface Defects in Reinforced Concrete Bridges. Appl. Sci. 2025, 15, 4725. [Google Scholar] [CrossRef]
  36. Tropea, M.; Fedele, G.; De Luca, R.; Miriello, D.; De Rango, F. Automatic Stones Classification through a CNN-Based Approach. Sensors 2022, 22, 6292. [Google Scholar] [CrossRef]
  37. Tereso, M.; Rato, L.; Gonçalves, T. Automatic classification of ornamental stones using Machine Learning techniques A study applied to limestone. In Proceedings of the 2020 15th Iberian Conference on Information Systems and Technologies (CISTI), Seville, Spain, 24–27 June 2020; pp. 1–6. [Google Scholar] [CrossRef]
  38. Dvorkin, L.; Bordiuzhenko, O.; Tracz, T.; Mróz, K. Optimizing Porous Concrete Using Granite Stone-Crushing Waste: Composition, Strength, and Density Analysis. Appl. Sci. 2024, 14, 6934. [Google Scholar] [CrossRef]
  39. Tarekegn, Y.G.; Lahmer, T.; Tarekegn, A.G.; Ftwi, E.G. Effects of Coating Thickness and Aggregate Size on the Damping Properties of Concrete: A Numerical Simulation Approach. Coatings 2025, 15, 610. [Google Scholar] [CrossRef]
  40. Suhendro, T.; Nugroho, R.A. Using Cube Coarse Aggregate to Determine the Compressive Strength of Concrete by Measuring Packing Density and Using Indian Standard and ACI Methods with Variations of Testing Age and Cement Products. Eng. Proc. 2025, 84, 91. [Google Scholar] [CrossRef]
  41. Hu, Z.; Liu, H.; Zhang, W.; Hei, T.; Ding, X.; Dong, Z. Evaluation of CBR of Graded Crushed Stone of Flexible Base Structural Layer Based on Discrete Element Model. Materials 2023, 16, 363. [Google Scholar] [CrossRef]
  42. Miao, Y.; Liu, X.; Hou, Y.; Li, J.; Wu, J.; Wang, L. Packing Characteristics of Aggregate with Consideration of Particle size and Morphology. Appl. Sci. 2019, 9, 869. [Google Scholar] [CrossRef]
  43. Lux, J.; Lau Hiu Hoong, J.D.; Mahieux, P.Y.; Turcry, P. Classification and estimation of the mass composition of recycled aggregates by deep neural networks. Comput. Ind. 2023, 148, 103889. [Google Scholar] [CrossRef]
  44. Fang, Z.; Song, S.; Wang, H.; Yan, H.; Lu, M.; Chen, S.; Li, S.; Liang, W. Mineral classification with X-ray absorption spectroscopy: A deep learning-based approach. Miner. Eng. 2024, 217, 108964. [Google Scholar] [CrossRef]
  45. Lau Hiu Hoong, J.D.; Lux, J.; Mahieux, P.Y.; Turcry, P.; Aït-Mokhtar, A. Determination of the composition of recycled aggregates using a deep learning-based image analysis. Autom. Constr. 2020, 116, 103204. [Google Scholar] [CrossRef]
  46. Nie, J.; Wang, Y.; Yu, Z.; Zhou, S.; Lei, J. High-precision grain size analysis of laser-sintered Al2O3 ceramics using a deep-learning-based ceramic grains detection neural network. Comput. Mater. Sci. 2025, 250, 113724. [Google Scholar] [CrossRef]
  47. Ji, S.-Y.; Jun, H.-J. Deep Learning Model for Form Recognition and Structural Member Classification of East Asian Traditional Buildings. Sustainability 2020, 12, 5292. [Google Scholar] [CrossRef]
  48. Benchabana, A.; Kholladi, M.-K.; Bensaci, R.; Khaldi, B. Building Detection in High-Resolution Remote Sensing Images by Enhancing Superpixel Segmentation and Classification Using Deep Learning Approaches. Buildings 2023, 13, 1649. [Google Scholar] [CrossRef]
  49. Gil, A.; Arayici, Y. Point Cloud Segmentation Based on the Uniclass Classification System with Random Forest Algorithm for Cultural Heritage Buildings in the UK. Heritage 2025, 8, 147. [Google Scholar] [CrossRef]
  50. Wang, S.; Han, J. Automated detection of exterior cladding material in urban area from street view images using deep learning. J. Build. Eng. 2024, 96, 110466. [Google Scholar] [CrossRef]
  51. Wang, S.; Park, S.; Park, S.; Kim, J. Building façade datasets for analyzing building characteristics using deep learning. Data Brief 2024, 57, 110885. [Google Scholar] [CrossRef]
  52. Taye, M.M. Theoretical Understanding of Convolutional Neural Network: Concepts, Architectures, Applications, Future Directions. Computation 2023, 11, 52. [Google Scholar] [CrossRef]
  53. Obukhov, A.D.; Dedov, D.L.; Surkova, E.O.; Korobova, I.L. 3D Human Motion Capture Method Based on Computer Vision. Adv. Eng. Res. (Rostov-on-Don) 2023, 23, 317–328. [Google Scholar] [CrossRef]
  54. Beskopylny, A.N.; Stel’makh, S.A.; Shcherban’, E.M.; Razveeva, I.; Kozhakin, A.; Meskhi, B.; Chernil’nik, A.; Elshaeva, D.; Ananova, O.; Girya, M.; et al. Computer Vision Method for Automatic Detection of Microstructure Defects of Concrete. Sensors 2024, 24, 4373. [Google Scholar] [CrossRef] [PubMed]
  55. Liu, N.; Ge, Y.; Bai, X.; Zhang, Z.; Shangguan, Y.; Li, Y. Research on Damage Detection Methods for Concrete Beams Based on Ground Penetrating Radar and Convolutional Neural Networks. Appl. Sci. 2025, 15, 1882. [Google Scholar] [CrossRef]
  56. Borovkov, A.I.; Vafaeva, K.M.; Vatin, N.I.; Ponyaeva, I. Synergistic Integration of Digital Twins and Neural Networks for Advancing Optimization in the Construction Industry: A Comprehensive Review. Constr. Mater. Prod. 2024, 7, 7. [Google Scholar] [CrossRef]
  57. Zhang, Y.; Jiang, Y.; Li, C.; Bai, C.; Zhang, F.; Li, J.; Guo, M. Prediction of cement-stabilized recycled concrete aggregate properties by CNN-LSTM incorporating attention mechanism. Mater. Today Commun. 2025, 42, 111137. [Google Scholar] [CrossRef]
  58. Padhan, M.K.; Rai, A.; Mitra, M. Prediction of grain size distribution in microstructure of polycrystalline materials using one dimensional convolutional neural network (1D-CNN). Comput. Mater. Sci. 2023, 229, 112416. [Google Scholar] [CrossRef]
  59. Kroell, N.; Thor, E.; Göbbels, L.; Schönfelder, P.; Chen, X. Deep learning-based prediction of particle size distributions in construction and demolition waste recycling using convolutional neural networks on 3D laser triangulation data. Constr. Build. Mater. 2025, 466, 140214. [Google Scholar] [CrossRef]
  60. Li, D.; Lu, C.; Chen, Z.; Guan, J.; Zhao, J.; Du, J. Graph Neural Networks in Point Clouds: A Survey. Remote Sens. 2024, 16, 2518. [Google Scholar] [CrossRef]
  61. GOST 8267-93; Crushed Stone and Gravel of Solid Rocks for Construction Works. Specifications. Standartinform: Moscow, Russia, 2018. Available online: https://www.russiangost.com/p-16864-gost-8267-93.aspx (accessed on 5 June 2025).
  62. He, K.; Zhang, X.; Ren, S.; Sun, J. Deep Residual Learning for Image Recognition. In Proceedings of the 2016 IEEE Conference on Computer Vision and Pattern Recognition (CVPR), Las Vegas, NV, USA, 27–30 June 2016; pp. 770–778. [Google Scholar] [CrossRef]
  63. Howard, A.; Sandler, M.; Chu, G.; Chen, L.-C.; Chen, B.; Tan, M.; Wang, W.; Zhu, Y.; Pang, R.; Vasudevan, V.; et al. Searching for MobileNetV3. arXiv 2019, arXiv:1905.02244. [Google Scholar] [CrossRef]
  64. Albelwi, S.A. Deep Architecture based on DenseNet-121 Model for Weather Image Recognition. Int. J. Adv. Comput. Sci. Appl. 2022, 13, 559–565. [Google Scholar] [CrossRef]
  65. Kingma, D.P.; Ba, J. Adam: A Method for Stochastic Optimization. In Proceedings of the International Conference on Learning Representations, San Diego, CA, USA, 7–9 May 2015; pp. 1–13. [Google Scholar]
  66. Su, C.; Xu, S.; Zhu, K.; Zhang, X. Rock classification in petrographic thin section images based on concatenated convolutional neural networks. Earth Sci. Inf. 2020, 13, 1477–1484. [Google Scholar] [CrossRef]
  67. Sanchez-Catasus, C.A.; Batista-García-Ramó, K.; Melie-Garcia, L. Brain connectivity by single-photon emission computed tomography and graph theory: A mini-review. Acad. Med. 2023, 1, 1. [Google Scholar] [CrossRef]
Figure 1. Sequence of research stages.
Buildings 15 01982 g001
Figure 2. The shape (class) of crushed stone grains: (a) needle-like; (b) plate-like; (c) cuboid.
Buildings 15 01982 g002
Figure 3. Image analysis and processing.
Buildings 15 01982 g003
Figure 4. Visualization of tensors.
Buildings 15 01982 g004
Figure 5. ResNet50 architecture.
Buildings 15 01982 g005
Figure 6. MobileNetV3 Small architecture.
Buildings 15 01982 g006
Figure 7. DenseNet121 architecture.
Buildings 15 01982 g007
Figure 8. Visualization of graphs for the ResNet50-based model: (a) Loss Curve; (b) Accuracy Curve.
Buildings 15 01982 g008
Figure 9. Confusion Matrix for the ResNet50-based model.
Buildings 15 01982 g009
Figure 10. Visualization of graphs for the model based on MobileNetv3 small: (a) Loss Curve; (b) Accuracy Curve.
Buildings 15 01982 g010aBuildings 15 01982 g010b
Figure 11. Confusion Matrix for the MobileNetv3 Small-based model.
Buildings 15 01982 g011
Figure 12. Visualization of graphs for the DenseNet121-based model: (a) Loss Curve; (b) Accuracy Curve.
Buildings 15 01982 g012
Figure 13. Confusion Matrix for the DenseNet121-based model.
Buildings 15 01982 g013
Figure 14. Manual measurement: (a) instruments; measurement of the maximum (b) and minimum (c) grain size of crushed stone using a moving template.
Buildings 15 01982 g014
Table 1. Main hyperparameters of the model used in the training process.
NumParameterValue
1Model architectureResNet50 (modified)MobileNetV3 smallDenseNet121
2Input image size224 × 224 × 1
3Number of classes3
4Activation functionReLU
5Loss functionCrossEntropyLoss
6OptimizerAdam
7Learning rate (lr)0.0001
8Regularization coefficient (weight decay)1 × 10−31 × 10−21 × 10−3
9Batch size32
10Number of epochs151510
11Device usedGPU
12Num params (total)25,636,7122,542,8568,062,504
13GFLOPS4.090.062.83
14File Size, MB97.89.830.8
Table 2. Summary table of model quality metrics.
ModelPrecisionRecallF1
ResNet500.940.930.93
MobileNetV3 Small0.860.850.85
DenseNet1210.930.930.93
Table 3. Results of comparison of crushed stone quality control by the indicator “content of lamellar and needle-shaped grains” using the manual method with computer vision methods.
MethodPhoto Fixation Time, Minutes:SecondsOperating Time, Minutes:SecondsTotal, Minutes:SecondsAccuracy, %
1Grain Size Ratio Template and Visual Method
1.1Person 1-17:3617:3698
1.2Person 2-18:4818:4896
1.3Person 3-20:1720:1790
1.4Person 4-23:4123:4184
1.5Person 5-26:1426:1480
Average results of the method using the grain size ratio template21:1990
2Computer Vision Algorithms
2.1PointNet [5]16:4000:2017:0083
2.2PointCloudTransformer [5]16:4000:2817:0888
Average performance of the algorithms17:0486
2.3ResNet5016:4000:0116:4192
2.4MobileNetV3 Small16:4000:0216:4282
2.5DenseNet12116:4000:0116:4190
Average performance of the proposed algorithms16:4188
Disclaimer/Publisher’s Note: The statements, opinions and data contained in all publications are solely those of the individual author(s) and contributor(s) and not of MDPI and/or the editor(s). MDPI and/or the editor(s) disclaim responsibility for any injury to people or property resulting from any ideas, methods, instructions or products referred to in the content.

