Article

Dynamic Damage Characteristics of Red Sandstone: An Investigation of Experiments and Numerical Simulations

1
Anhui Construction Engineering Road Port Construction Group Co., Ltd., Hefei 230022, China
2
School of Civil and Hydraulic Engineering, Hefei University of Technology, Hefei 230009, China
*
Author to whom correspondence should be addressed.
Buildings 2025, 15(11), 1845; https://doi.org/10.3390/buildings15111845
Submission received: 9 April 2025 / Revised: 20 May 2025 / Accepted: 21 May 2025 / Published: 27 May 2025

Abstract

This study investigates damage characteristics of red sandstone under dynamic loads to clarify the effects of construction disturbances and blasting on the stability of surrounding rock during mountain tunnel construction in water-rich strata. Dynamic impact experiments at various loads were conducted using the Split Hopkinson Pressure Bar (SHPB) instrument, complemented by simulations of the fracturing process in saturated sandstone using finite element software. This analysis systematically examines the post-fracture granularity mass fraction, stress-strain curves, peak stress-average strain rate relationship, and fracture patterns. The dynamic response mechanism of red sandstone during the process of tunnel blasting construction was thoroughly investigated. Experimental results reveal that the peak stress and failure strain exhibit strain rate dependency, increasing from 45.65 MPa to 115.34 MPa and 0.95% to 5.23%, respectively, as strain rate elevates from 35.53 s−1 to 118.71 s−1. The failure process of red sandstone is divided into four stages: crack closure, nearly elastic phase, rapid crack development, and rapid unloading. Dynamic peak stress and average strain rate in sandstone demonstrate an approximately linear relationship, with the correlation coefficient being 0.962. Under different impact loads, fractures in specimens typically expand from the edges to the center and evolve from internal squeezing fractures to external development. Peak stress, degree of specimen breakage, and energy dissipation during fracturing are significantly influenced by the strain rate. The numerical simulations confirmed experimental findings while elucidating the failure mechanism in surrounding rocks under varying strain rates. This work pioneers a multiscale analysis framework bridging numerical simulation with a blasting construction site, addressing the critical gap in time-dependent deformation during tunnel excavation.

1. Introduction

In recent years, tunnel projects in the mountainous areas have significantly advanced local transportation in China [1]. Red sandstone formations, widely distributed in the southwestern region, are a typical geologic formation with low strength and rapid disintegration upon contact with water [2]. The red sandstone is characterized by its fine-grained composition and high susceptibility to water erosion. This makes them particularly vulnerable to geological disasters, posing significant challenges for tunnel constructions in the region [3]. Numerous engineering cases have highlighted significant safety risks in tunnel construction when encountering sandstone. The red sandstone leads to big challenges in ensuring the stability of surrounding structures and preventing water seepage into the tunnel [4]. Particularly when tunnels traverse water-rich, weak sandstone layers, the excavation faces are highly susceptible to severe deformation, instability, or even extensive collapse. These issues can lead to not only construction delays but also substantial economic losses and casualties in severe cases [5]. Consequently, understanding the damage mechanism of large deformation and instability influenced by dynamical loading during sandstone tunnel excavation and developing corresponding preventive measures are crucial.
Although significant progress has been made in understanding the static mechanical properties of sandstone [6], the damage mechanisms under the effects of blasting, impact, and vehicular loads remain unclear, necessitating further research into its dynamic load-induced damage characteristics [7,8]. The field of rock dynamics encompasses the study of how rocks behave and respond when they are subjected to dynamic forces such as seismic waves, explosions, or impact loading [9]. This area of research involves analyzing the mechanical properties and behavior of rocks under varying conditions, including high strain rates and extreme pressures. The Split Hopkinson Pressure Bar (SHPB) test, a commonly used experimental technique in the field of rock dynamics, has seen significant progress in recent years [10,11,12,13]. This method allows researchers to investigate how rocks behave under high strain rates and impact loading conditions, offering valuable insights into their mechanical properties and response to dynamic events. With its ability to replicate engineering scenarios like earthquakes, explosions, and traffic impacts, the SHPB test remains a focal point in rock dynamics. Wang et al. [14] have conducted a dynamic triaxial test using an SHPB platform on fractured sandstone, analyzing its mechanical and damage characteristics. Qi et al. [15] performed graded cyclic loading and unloading experiments on brittle rocks and derived a damage-constitutive model for the loading and unloading phases. Hartley et al. [16] indicate that the conditions of stress levels, loading rates, and modes of loading significantly impact the mechanical behavior of soft rocks. However, there remains a dearth of comprehensive understanding concerning the damage characteristics and mechanisms of sandstone in tunnel engineering under dynamic loads, underscoring the imperative for further experimental research.
With the progress of computer technology, numerical simulations have gained widespread use in the field of rock dynamics research [17]. Numerical simulations allow researchers to analyze complex rock behavior under various conditions, providing valuable insights into the mechanics of rock deformation, failure, and seismic response. These simulations of the SHPB test have produced meaningful research outcomes [18]. Mahabadi et al. [19] developed an SHPB pressure bar model to replicate the dynamic failure process in composite rock, examining the correlations among rock layer inclinations, strain rates, dynamic compressive strength, and dynamic elastic modulus. Flores-Johnson et al. [20] analyzed both experimental and simulation results from SHPB tests, elucidating the variations in incident and transmitted energy across different strain rates. Jankowiak et al. [21] simulated the dynamic behavior of rocks under varying impact loads. Yao et al. [22] utilized the LS-DYNA finite element simulation software to conduct a numerical simulation of the impact test process on argillaceous siltstone. Through a comparison of both simulation and experimental results, they observed a correlation between the form of specimen failure and impact velocity. These investigations unveiled discernible patterns in strain rate and fracture development within sedimentary rocks. The integration of SHPB measurement with numerical simulation to investigate the dynamic damage characteristics of red sandstone holds significant scientific importance [23]. Consequently, the implementation of rate-dependent modeling in LS-DYNA for red sandstone and the framework of experimental–numerical validation require improvement.
A key deficiency in prior research is that existing studies predominantly focus on the mechanical properties of red sandstone under static loading conditions, while paying insufficient attention to the failure mechanism and damage evolution under dynamic loading scenarios of blasting construction. The objective of this study is to propose an integrated analytical approach combining experimental data with simulation results and systematically investigate the fragmentation mechanism of red sandstone under dynamic impact loads.
Therefore, this study firstly investigates the dynamical characteristics of red sandstone by using SHPB experiments under various dynamic loads. Utilizing the LS-DYNA numerical simulation software, it analyzes the damage processes and rate effects on red sandstone under different loads, comparing impact test results with simulation outcomes. Conclusively, this research discusses the damage characteristics and mechanisms of sandstone, providing references for improving support and blasting parameters and assessing the stability of surrounding rocks in mountain tunnels.

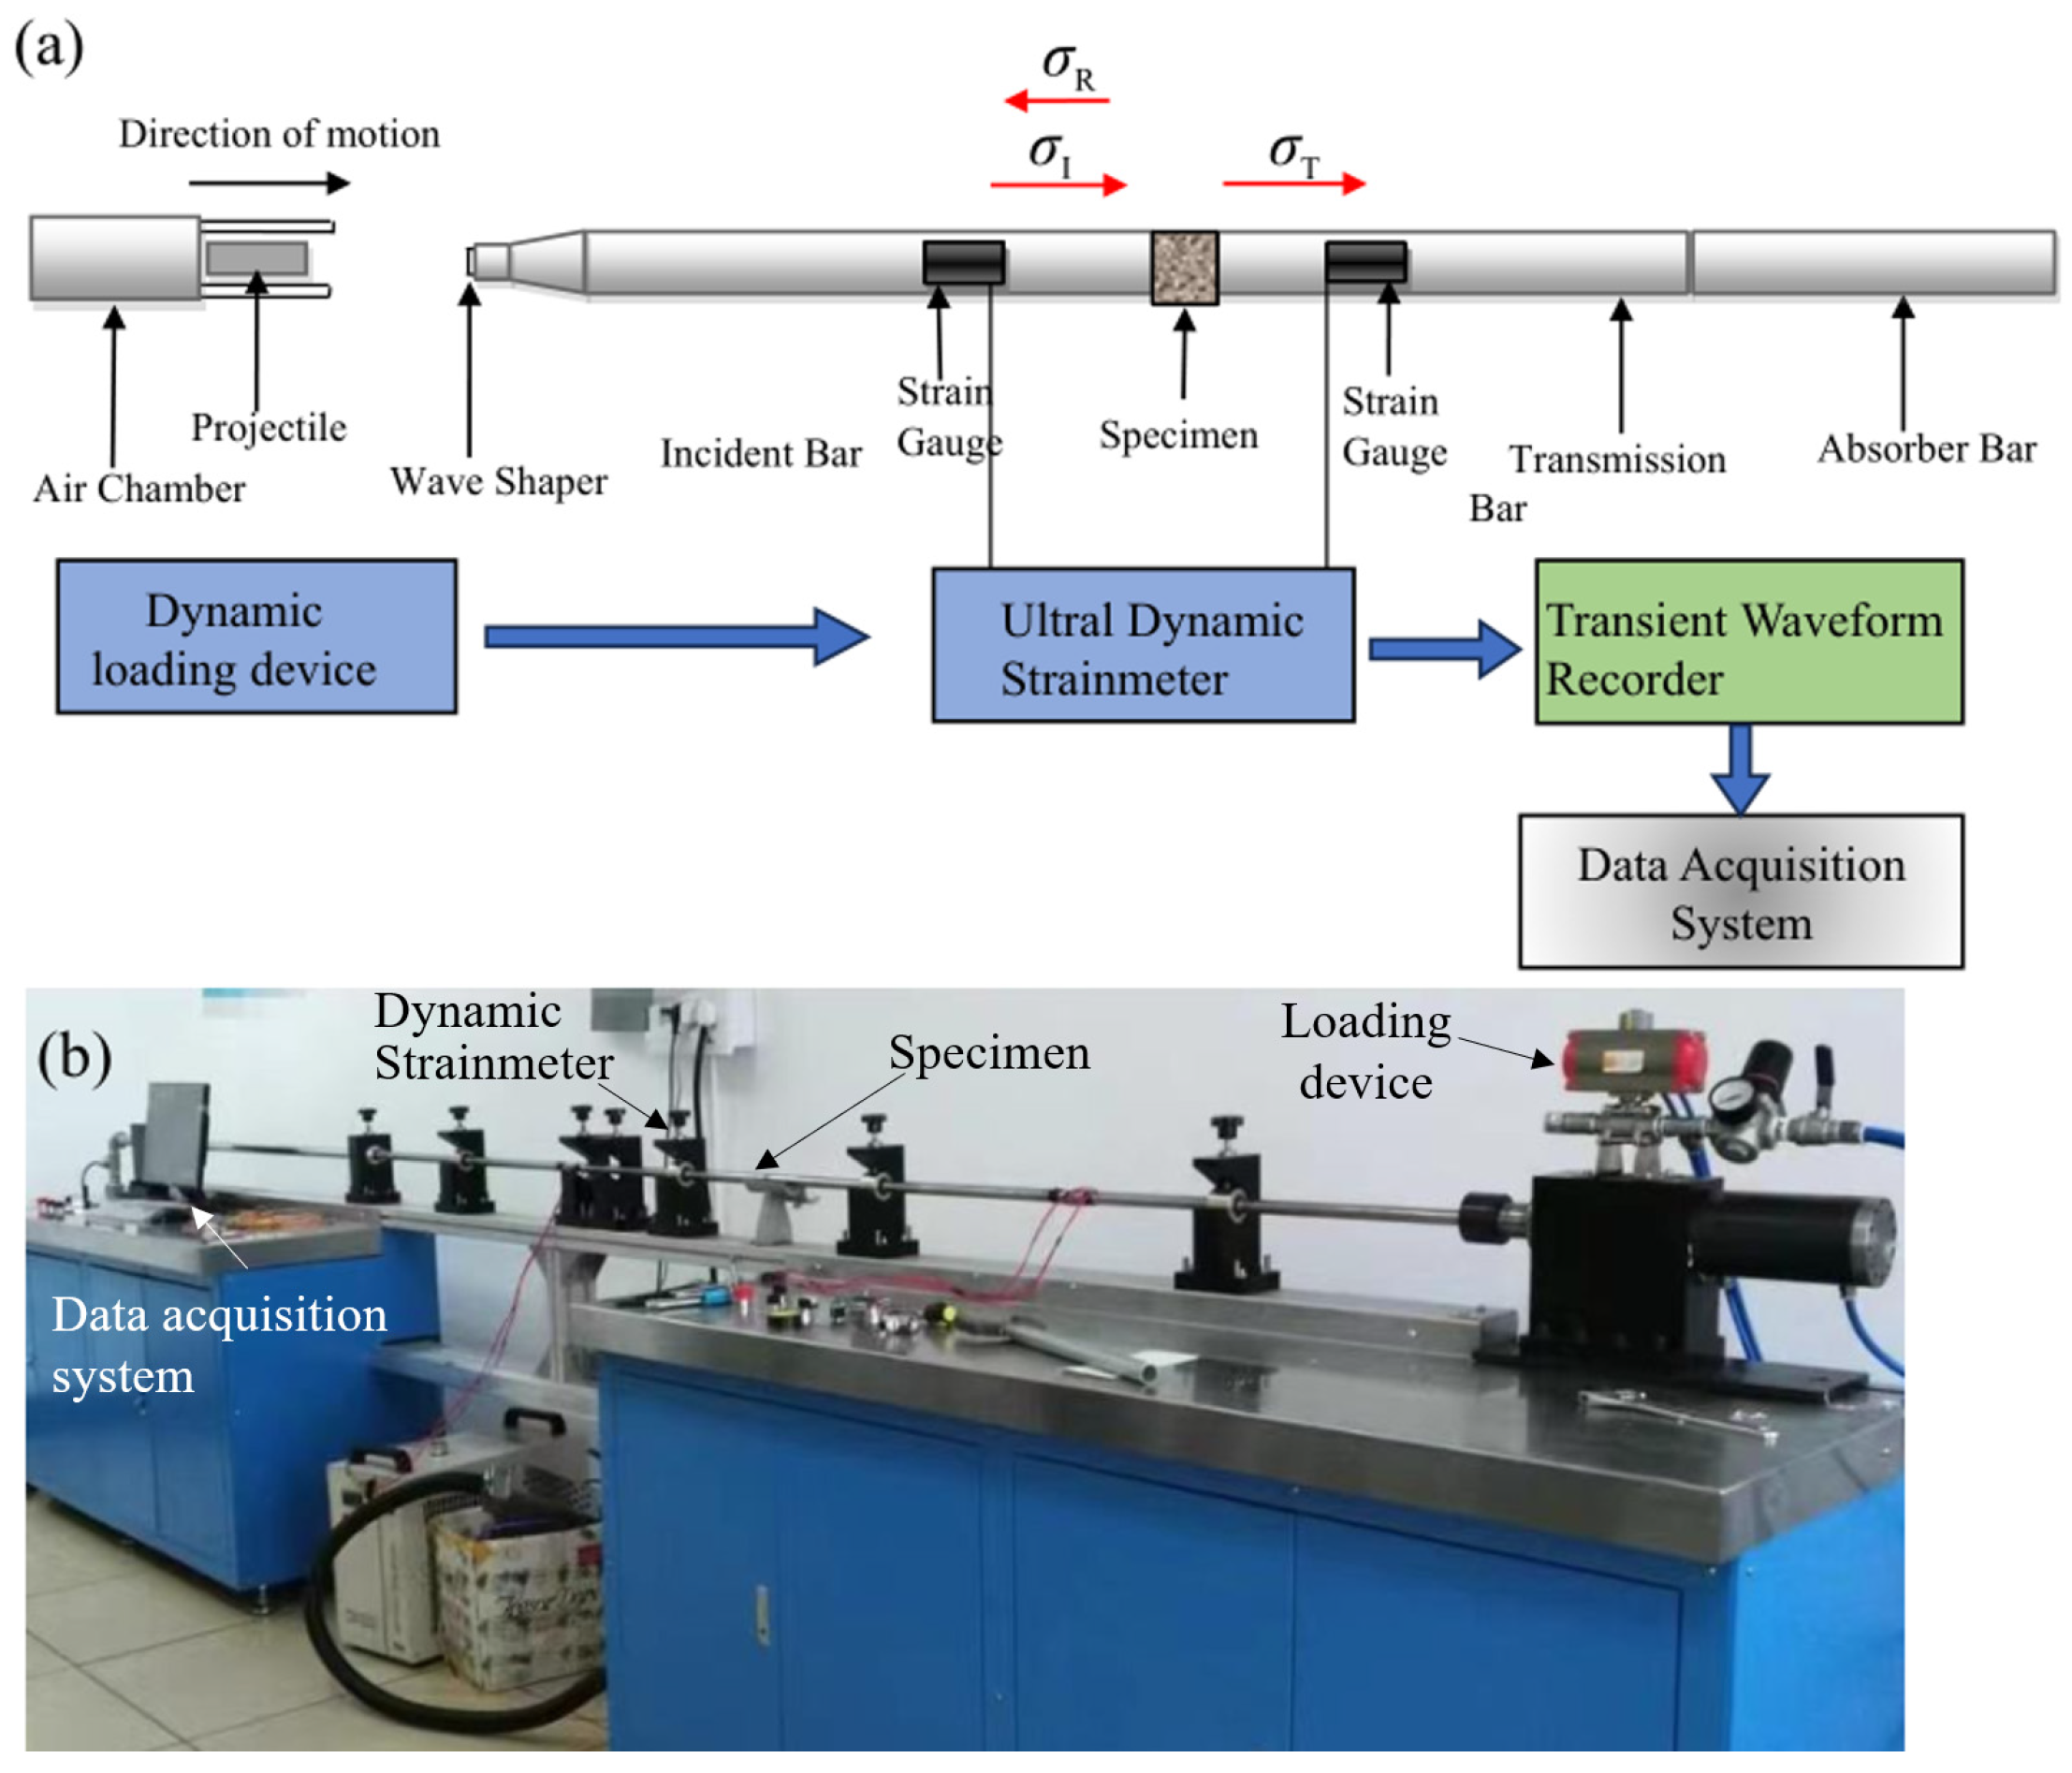
2. Experimental Materials and Methods

2.1. Engineering Background

As shown in Figure 1a, the examined sandstone under investigation was collected in Hefei, Anhui province, China (latitude 32°11′01″ N, longitude 117°08′12″ E). This region experiences distinct wet and dry seasons, with a high annual temperature of 22 °C and an average precipitation of 1000 mm. The rock samples were collected from the mountain slope in Hefei using the Mazier triple-tube core barrel (Yuxiu Instrument & Equipment Co., ltd. from Shanghai, China) to minimize sampling disturbance. The rock cores had a diameter of 76 mm and a length of 1.0 m, as shown in Figure 2b. The sampling depth chosen for sampling was from 3.0 m to 4.0 m. The underground water table of this stratum is at a depth of approximately 2.0 m. When exposed to rainy conditions, the rock samples undergo slight volume expansion, water seepage occurs, and the integrity of the rock is undermined. Photographs of the sandstone specimens at their dry and wet states are shown in Figure 1c. The weathering degree of red sandstone is highly significant. There are conspicuously visible signs of erosion on its surface, and the binding force between particles has notably decreased. The rock matrix exhibits pervasive internal fracturing, with macroscopic specimens undergoing progressive fragmentation into discrete particulate assemblies.
The construction of this mountain tunnel under investigation has a length of 838 m and an excavation span of 16.8 m. It is categorized as a single-bore and three-lane tunnel with a large cross-section. Due to the complex geological conditions, the excavation method of three steps is employed for the construction of the highway tunnel. The short-footage excavation of the upper step should be conducted first, and the support should be implemented promptly to guarantee the stability of the top. Subsequently, the middle steps are excavated, with the same supporting measures carried out. Finally, the lower steps are excavated to gradually advance the tunneling process. The excavation face and the surrounding rock exposure, as depicted in Figure 1, display well-developed joints and fractures with significant groundwater recharge. The presence of these clearly defined joints and fractures indicates a high level of structural complexity within the rock formation. These features exhibit considerable softening upon contact with water, making them prone to sudden water and mud inrushes. During the exploration phase, drilling revealed that the groundwater level was approximately 3 m below the surface, indicating poor integrity and developed joint fractures in the red sandstone, which reduced the stability and integrity of the surrounding rock structure during tunnel excavation.

2.2. Specimen Preparation

The presence of indigenous and excavation-induced fractures within the red sandstone creates pathways for groundwater seepage, allowing pore water to infiltrate the rock. As a result, the rock undergoes a process of softening, which can have significant implications for engineering and construction projects in water-rich regions. The basic physical and mechanical parameters of the sandstone are outlined in Table 1. The natural water contents of multiple groups of sandstone specimens were determined using the drying method, with the averages recorded as the final water content. The dry densities of the specimens were measured using the volumetric method. The coefficient of variation (COV) serves to measure the degree of relative dispersion. Regarding the red sandstone in this research, the coefficient of variation of physical and mechanical indicators typically ranges from 6% to 15%. The COV indicates that the properties of the red sandstone specimens are relatively homogeneous.

2.3. Testing Program

The sandstone specimens were positioned within a vacuum saturator for water saturation treatment over 24 h, ensuring that the collected specimens were fully water-saturated. Initially, the experiment involved collecting homogeneously textured intact rock from the tunnel engineering site. These rocks were processed into cylindrical specimens with a diameter of 50 mm and an aspect ratio of 0.5. The ends of the specimens were precision-ground to ensure a flatness of less than 0.4 mm and non-parallelism of less than 0.2 mm. The SHPB experimental system (Figure 2) is comprised of five main components: a dynamic loading device, a projectile velocity measuring device, a dynamic strain testing module, a dynamic-static combined loading device, and a data analysis system. This configuration allows for the realization of various loading waveforms and real-time data collection. The loading device is capable of performing axial compression tests and confined pressure impact tests within a pressure range of 0 to 50 MPa. Both the dynamic strain testing system and the data processing system are designed to monitor the fracture process and deformation of the specimen in real-time. In the SHPB experimental setup, the incident bar, transmission bar, and projectile have a density of 7800 kg/m3, an elastic modulus of 210 GPa, and a Poisson’s ratio of 0.30. The bars have a diameter of 50 mm and are 2000 mm in length, while the spindle-shaped projectile measures 75 mm in length. Before conducting the experiment, a circular rubber pad is affixed to the center of the front end of the incident bar to facilitate semi-sinusoidal waveform loading. The striker is propelled by air pressure in the launching chamber, colliding with the impact bar at a predetermined rate. The stress-strain curves are derived from these data after processing. As shown in Table 2, the impact loads are set in increments of 0.5, 0.6, 0.7, and 0.8 MPa, with the corresponding mean strain rates of 50.4, 70.5, 90.6, 120.2, and 160.1 m/s. The specimens were labeled from S1 to S5. The SHPB tests were conducted following the reference method for SHPB tests of rock materials [24]. In the SHBP experiment, the bullet velocity was measured using strain gauges and waveform analysis.

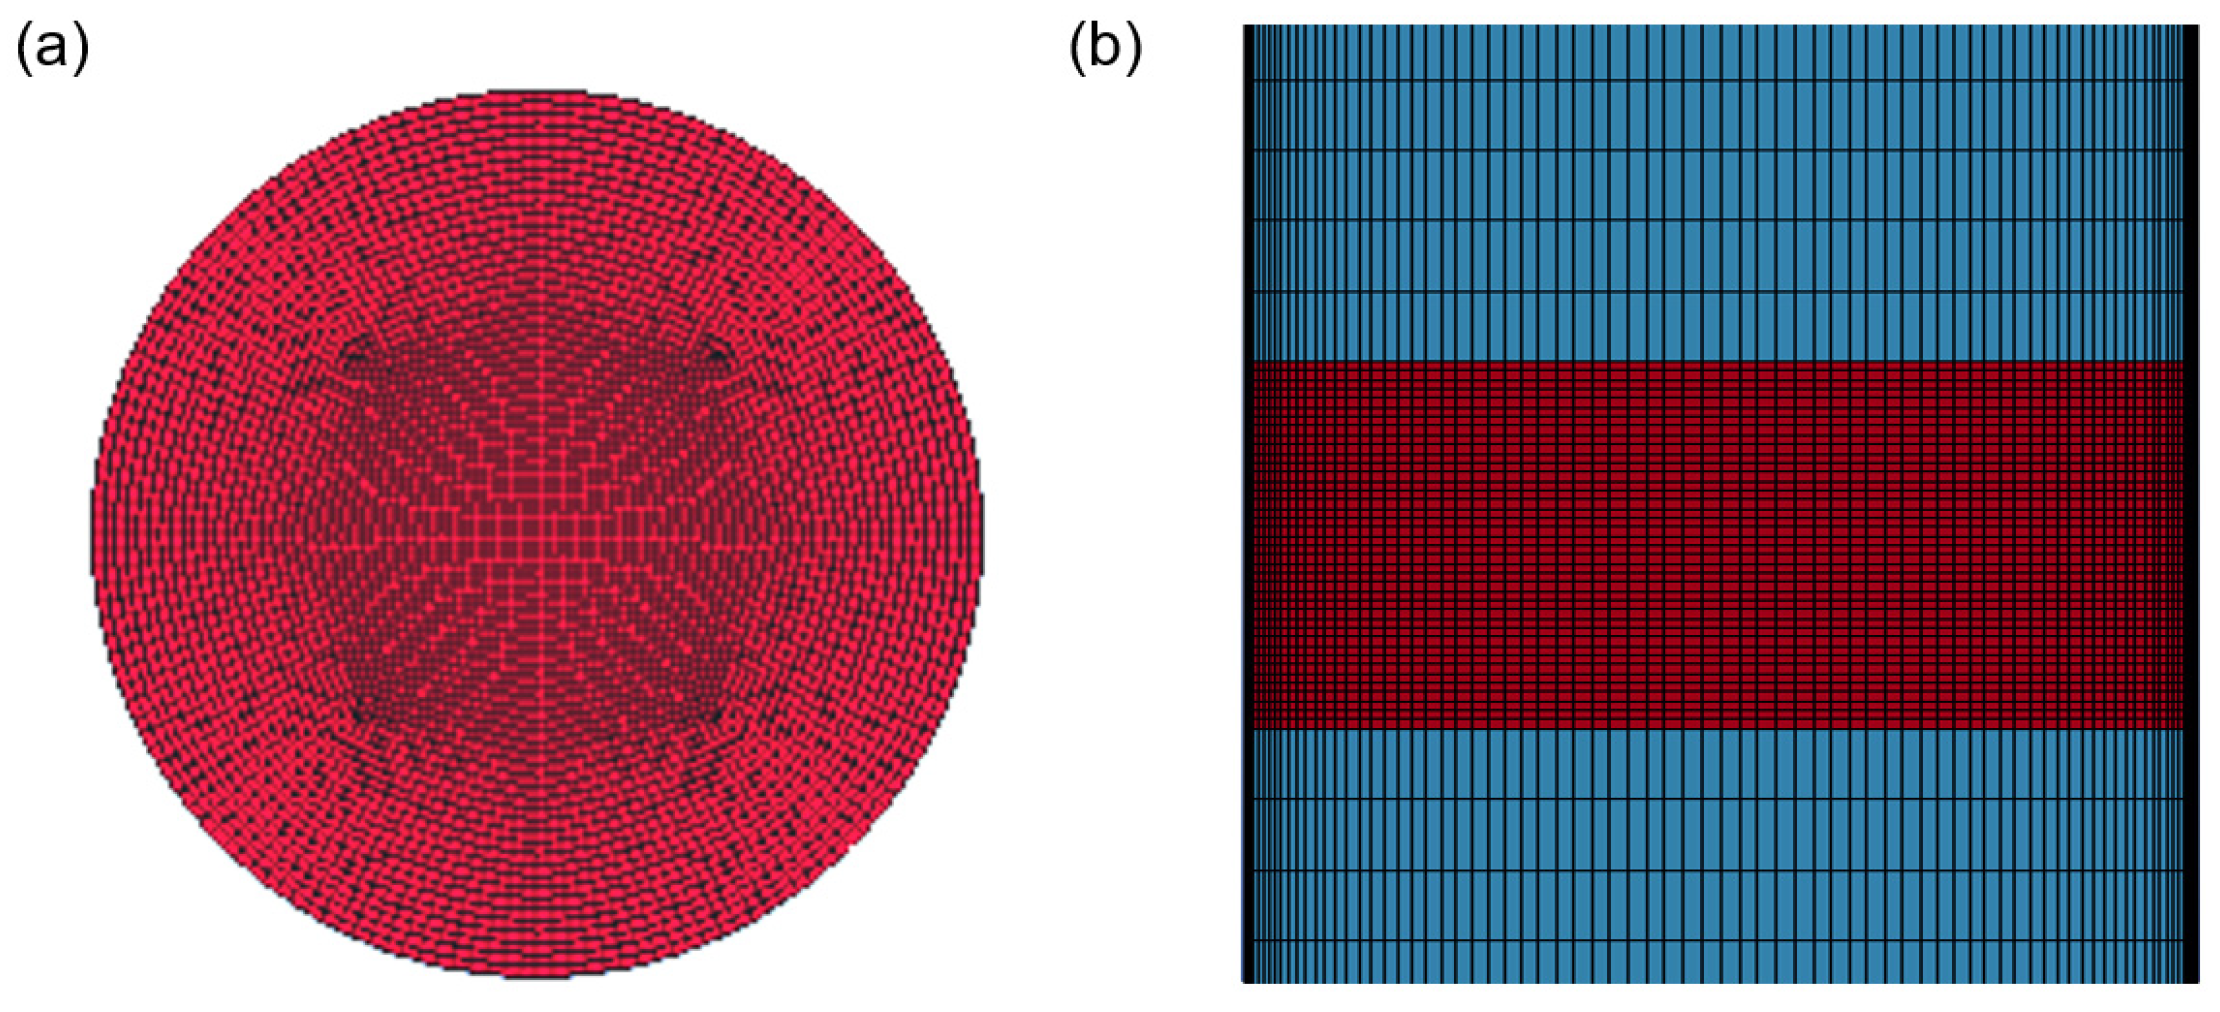
2.4. Numerical Modelling and Analysis

The LS-DYNA program, known for its explicit algorithm, excels in solving large deformation and complex nonlinear structural problems, showcasing its robust functionality in nonlinear dynamic analysis. The ANSYS/LS-DYNA solution process involves three main steps: pre-processing, solving, and post-processing. During pre-processing, the steps include defining the material model and element type, constructing the model, meshing, forming PART, applying loads, and defining contacts and initial conditions. The solving step uses the solver to process the keyword file (k-file) generated during pre-processing. Post-processing employs LS-Prepost to construct the models for the specimen, pressure bar, and projectile, using face-to-face contact for model interactions. All nodes at both ends of the pressure bar are fixed with single-point constraints. Figure 3 depicts the end face of the specimen and the pressure bar model. The 8-node hexahedral solid elements are utilized for the specimen modeling. The material model (MAT-PLASTIC-KINEMATIC) was selected for this study. The numerical model and mesh division of the rock sample are illustrated in Figure 3. The incident and transmission rods measure 240 cm and 140 cm in length, respectively, while cylindrical specimens feature a diameter of 50 mm and a height of 25 mm. Structured meshing employs axial divisions of 10 mm with 40 circumferential partitions for rods (the elastic modulus is 210 GPa) with 126,000 elements and 30 axial/140 circumferential partitions for specimens with 86,640 elements.

3. Results

3.1. Test Conditions

The stress uniformity curves of saturated sandstone presented in Figure 4 demonstrate that the superposition of the incident wave and the reflected wave is essentially consistent with the transmitted wave. This indicates that the stress within the sandstone sample attains the equilibrium state during the SHPB tests. The strain time history curve of sandstone under diverse strain rates (Figure 5) shows that the strain increases approximately linearly before the impact time reaches 130 μs. The phenomenon implies that the condition of constant strain rate loading basically enters the loading stage. Subsequently, the sandstone sample enters the unloading stage, where the structural damage in the rock intensifies, the crack expands rapidly, and the strain continues to increase but at a reduced growth rate. The loading waveform was adjusted as closely as possible to the actual loading through parameter adjustment, thereby ensuring that the experiments precisely reflect the mechanical response of red sandstone. The overlap ratio between the incident wave and the transmitted wave attains 92%, manifesting remarkable consistency in both the time domain and the amplitude domain.

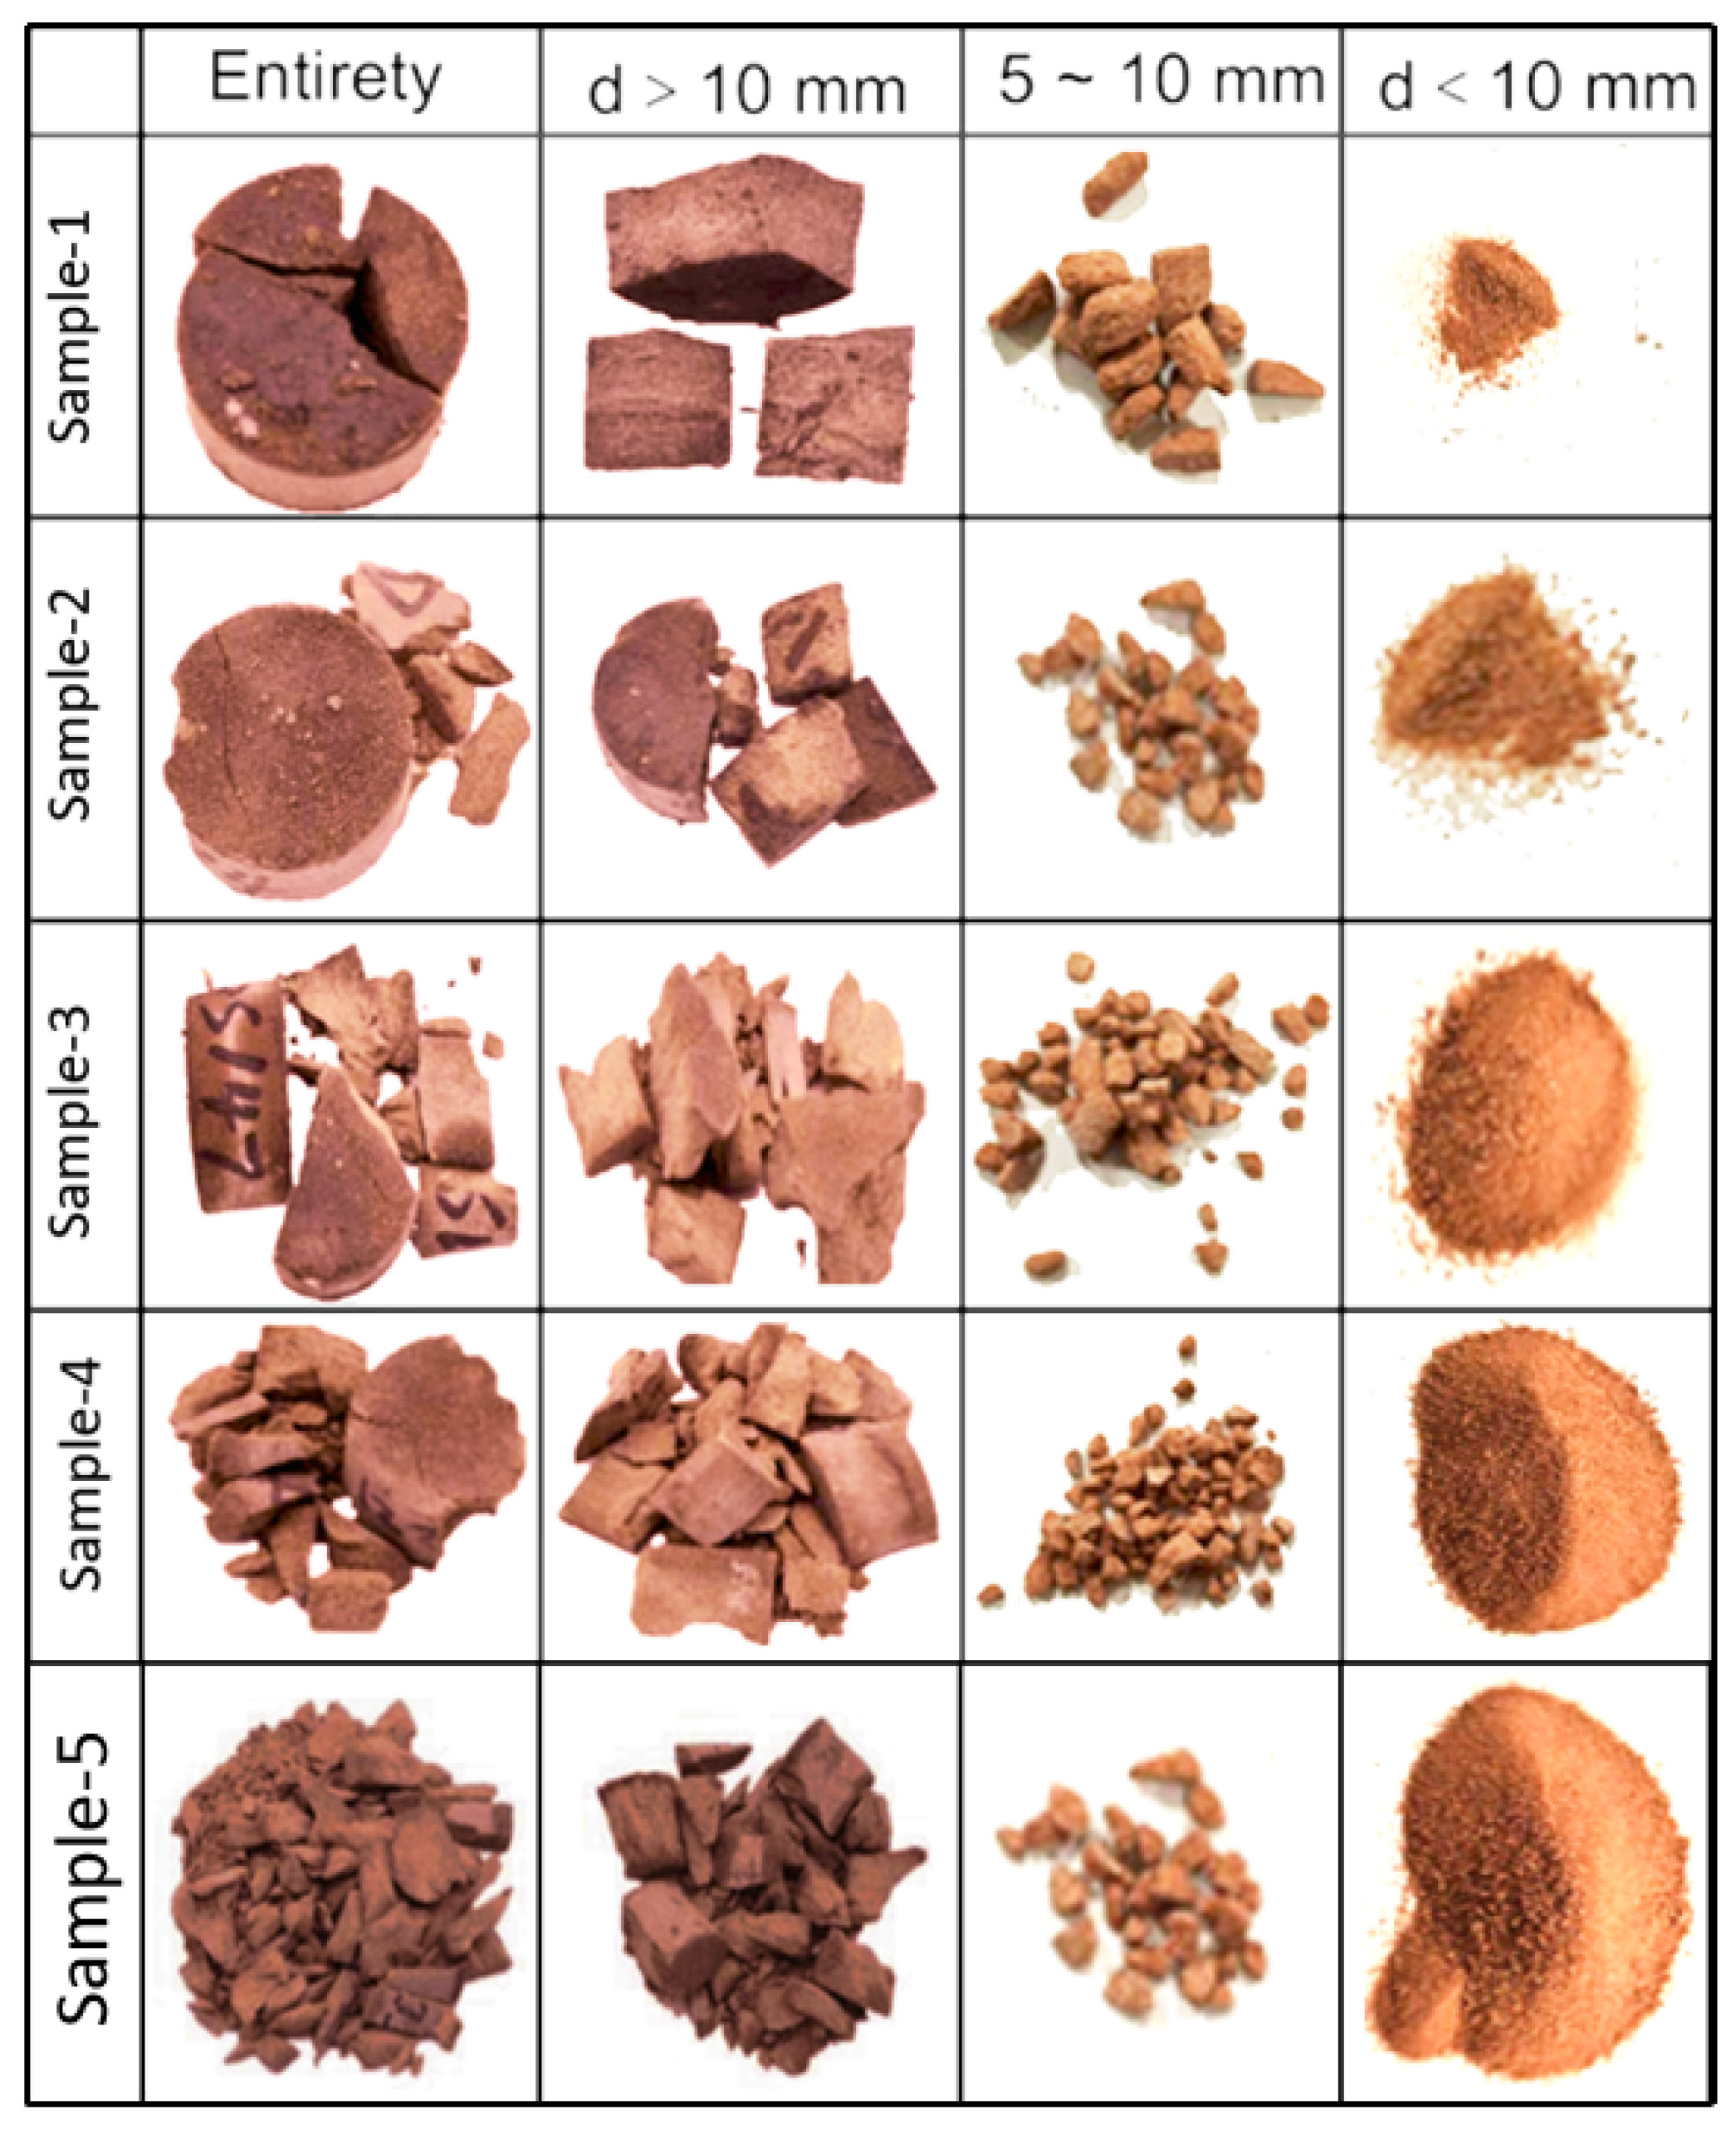
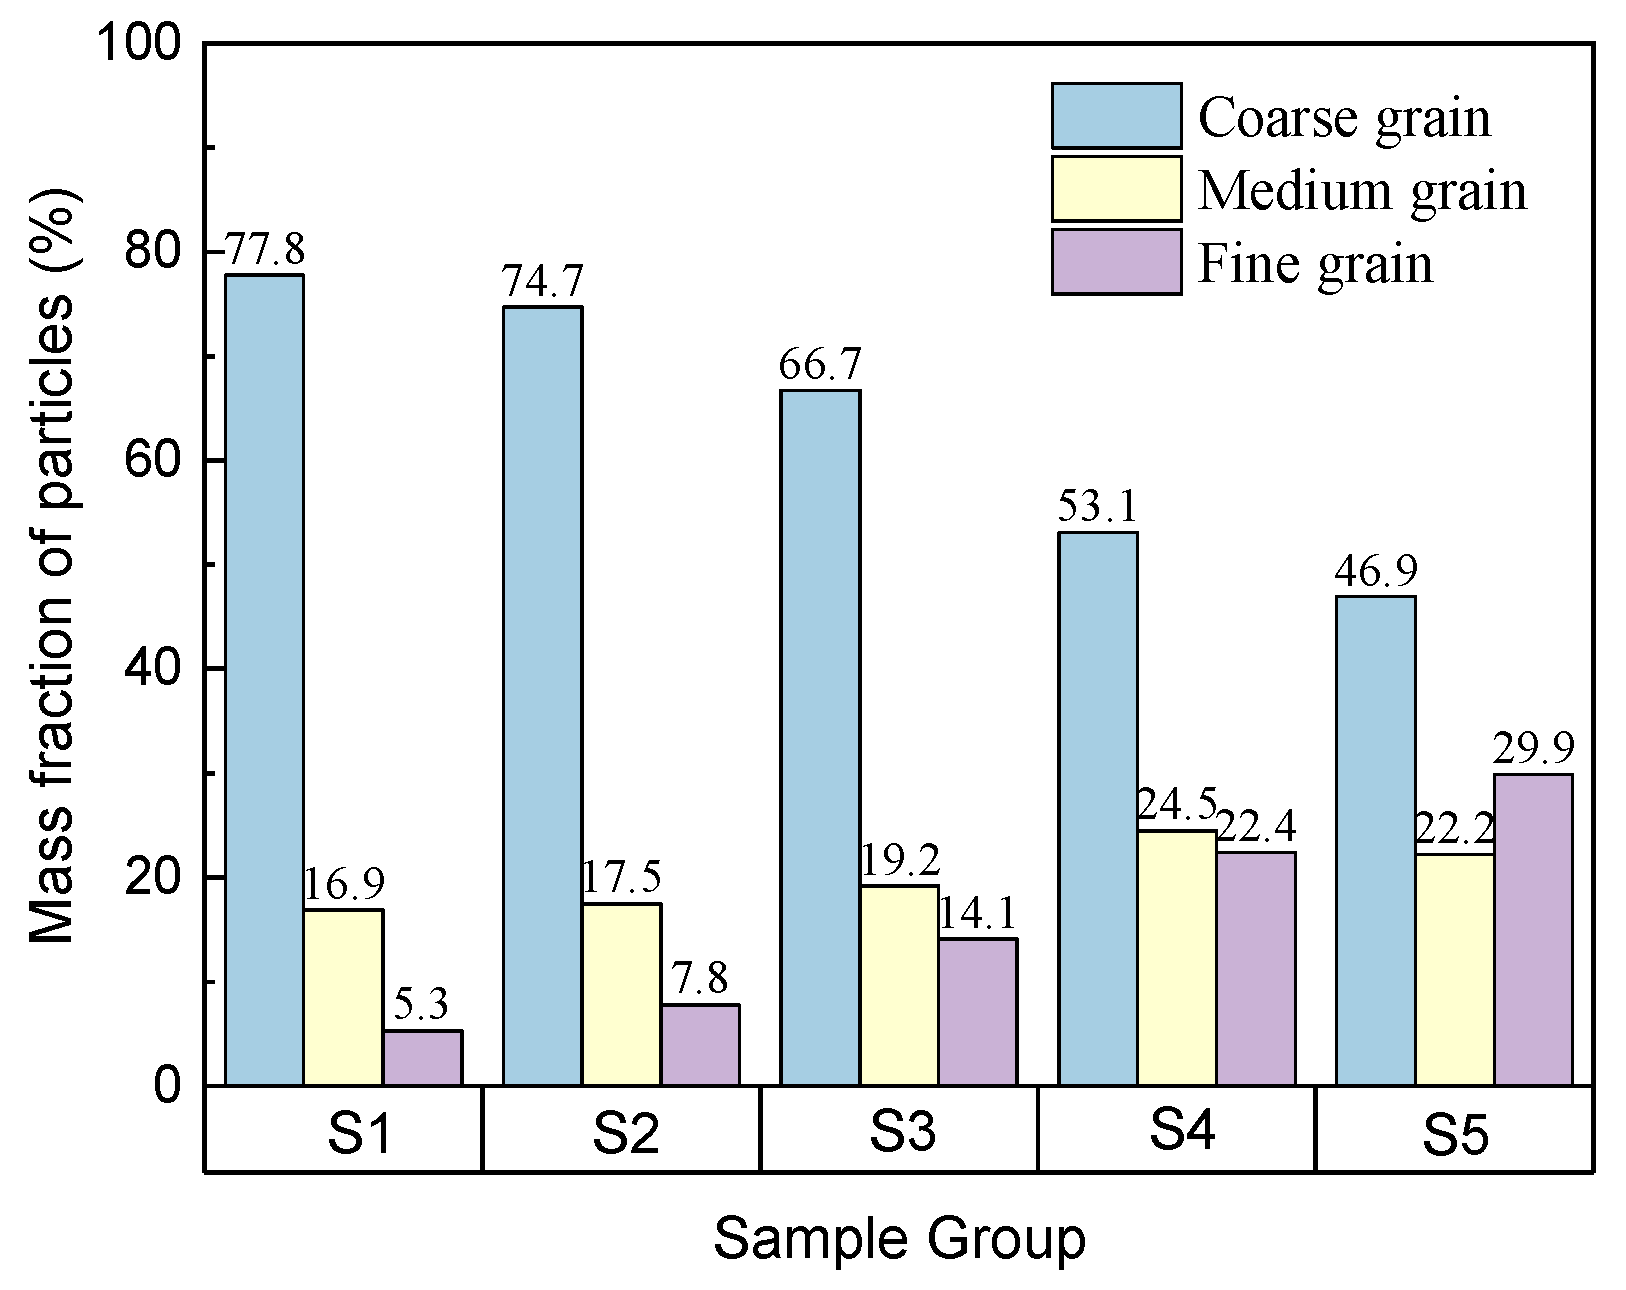
3.2. Fracture Morphology of Red Sandstone

The features of red sandstone impact fractures under varying dynamic loads are depicted in Figure 3. The figure provides a detailed visual representation of how the sandstone responds to different levels of dynamic loading, allowing for a comprehensive understanding of its behavior under varying conditions. These data are crucial for analyzing the mechanical properties and potential applications of sandstone in engineering and geotechnical projects. The impact pressures shown in Figure 6 ranges sequentially from 0.5 to 0.8 MPa. After the impact, the sandstone was sieved and weighed to establish the relationship between the sandstone particle mass fraction and the impact load. The particle size distribution in the form of mass fraction after sieving of broken sandstone is illustrated in Figure 6. The various forms of rock damage resulting from different dynamic load conditions are classified into four fracture scenarios, encompassing minor cracking, fracturing, severe fracturing, and pulverization.
Under an impact load of 0.5 MPa, the specimen maintained its structural integrity, displaying minimal cracking and several discernible radial fractures. After passing through 5 mm and 10 mm sieves, the particle size distribution exhibited a pronounced disparity, indicating a significant polarization in particle sizes, with those smaller than 10 mm accounting for only 1% of the total mass (Figure 7). The specimen’s overall performance under an impact load of 0.5 MPa indicates its capacity to endure significant levels of stress without experiencing catastrophic failure. The minimal presence of cracking and radial fractures in this specimen suggests a high resistance to low-impact loads for the red sandstone. When subjected to an impact load of 0.6 MPa, Specimen S2 showed more fracturing and a slight increase in both the number and size of fractures. The proportion of particles smaller than 10 mm exhibited a slight increase; however, the specimen maintained its overall structure with no notable detachment of substantial chunks in the sandstone. At an impact load of 0.7 MPa, Specimen S3 displayed significant fracturing, with fine fractures rapidly propagating along four radial lines and dispersing outward, ultimately resulting in the fragmentation of the specimen with visible chunks detaching. Specimen S4 and S5, subjected to high-impact load speeds, underwent pulverization and lost their structural integrity, resulting in a significant reduction in larger particles. Subsequent sieving revealed a decrease in the number of particles larger than 10 mm, accompanied by a substantial increase in finer particles, leading to a mass ratio close to 3:2. In summary, with the increase in impact load from 0.5 to 0.8 MPa, there was a noticeable trend towards greater severity of fracture in the specimens, a decrease in the mass fraction of large particles, and a reduction in the size of these particles. This observed pattern suggests that higher impact loading results in increased energy dissipation through fragmentation of the sandstone specimen.
Under impact loads, the mechanical mechanism through which the failure mode of red sandstone shifts from toughness to brittleness mainly originates from the energy dissipation mechanism governed by the strain rate. At low strain rates, energy is dissipated progressively through crack propagation. At high strain rates, elastic strain may play a dominant role in the rapid release process, which is evidenced by macroscopic brittle splitting characteristics.

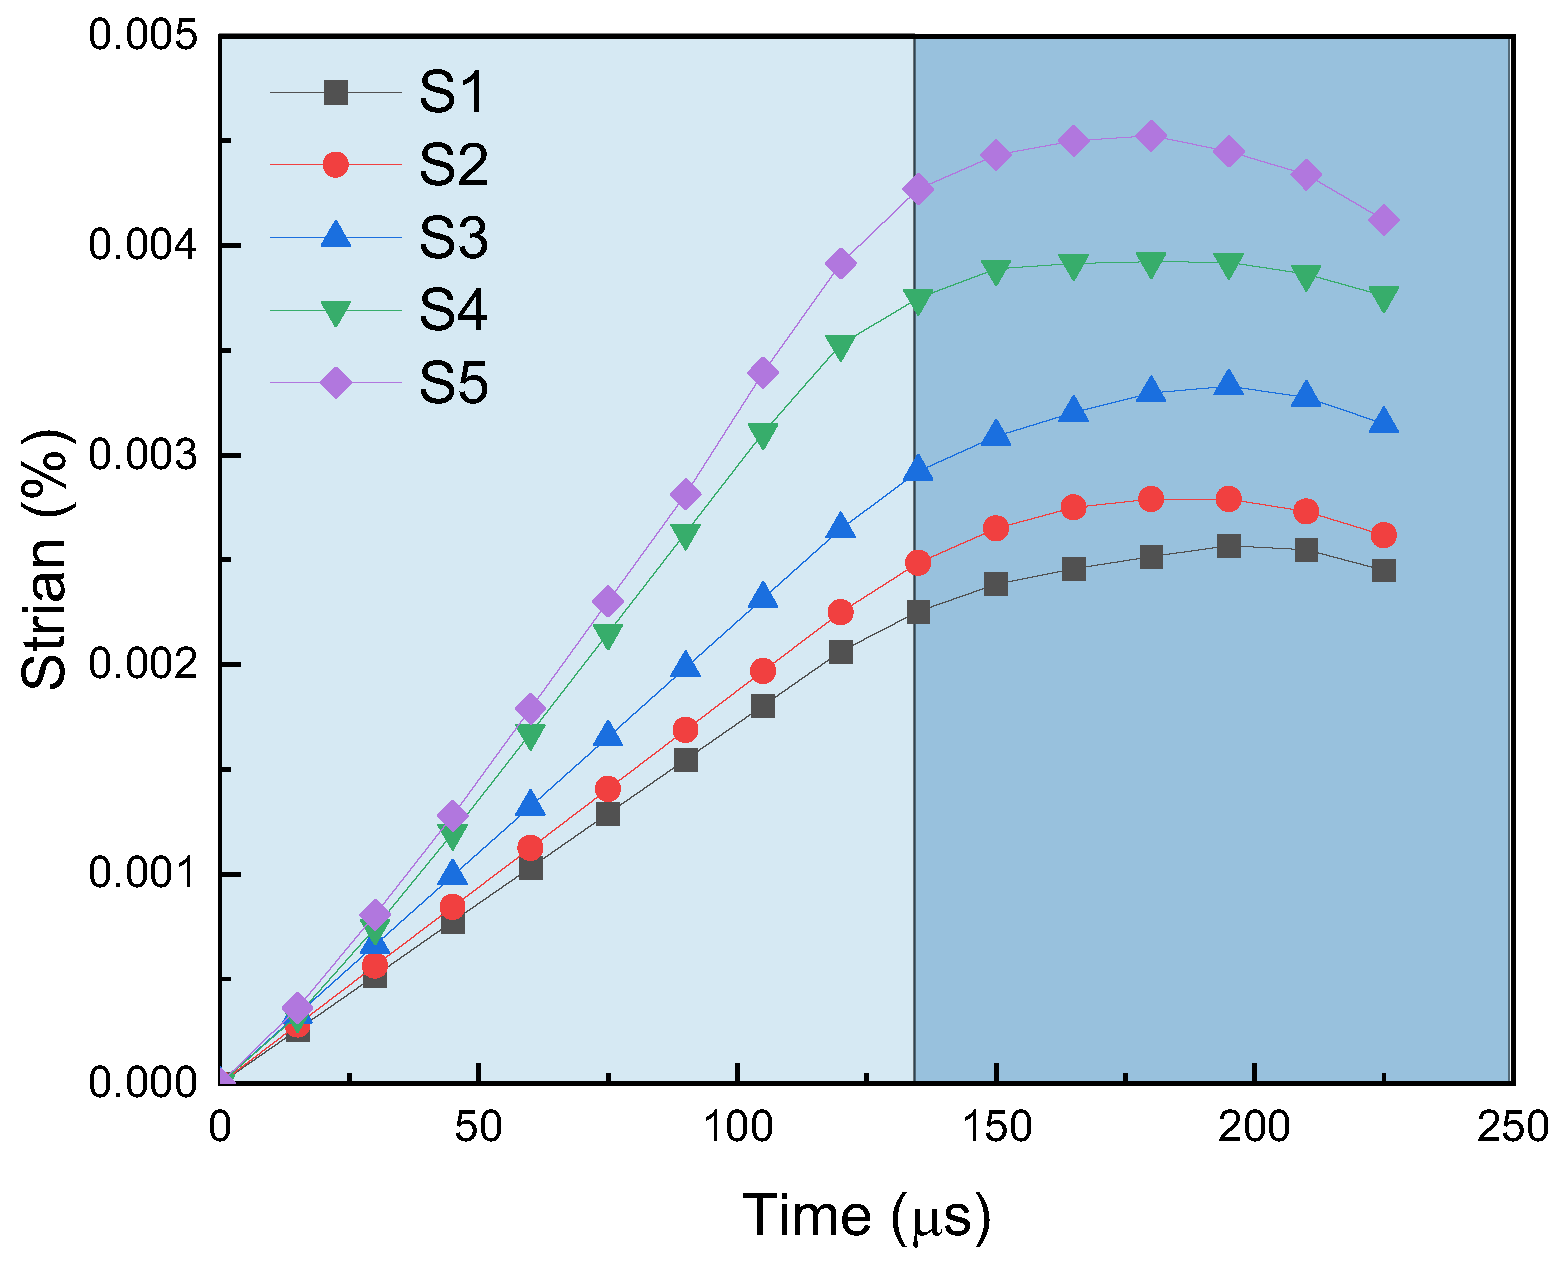
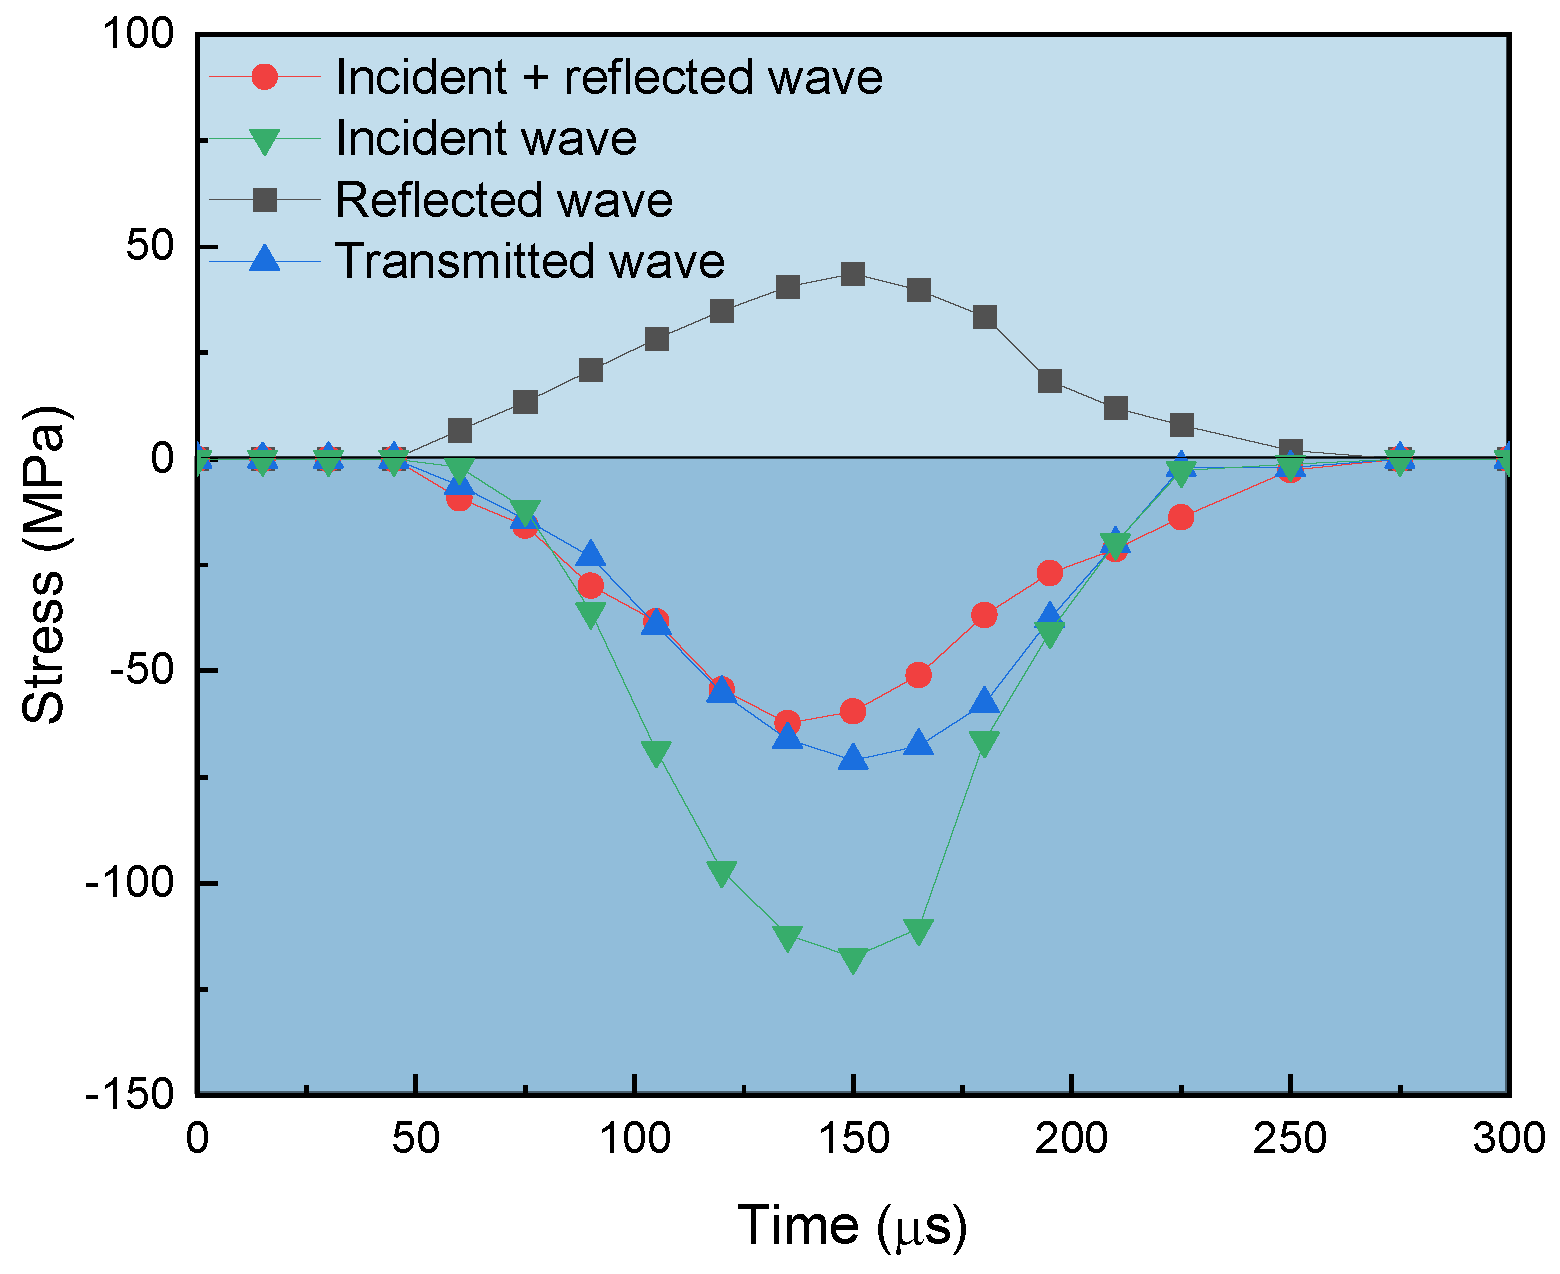
3.3. Stress-Strain Curves

During the SHPB test, calculations for stress and strain must satisfy the assumptions of one-dimensional stress wave propagation and stress equilibrium. From these principles, the equations for stress, strain rate, and strain are derived as shown in Equation (1). To achieve a balanced distribution of stress-strain in the sandstone during the loading process, Equation (1) can be simplified to Equation (2) [25].
σ s = A B 2 A s E B ( ε I + ε R + ε T ) ε ˙ s ( t ) = C 0 L s ( ε I ε R ε T ) ε s = 0 t ε ˙ s ( τ ) d τ
σ s = A B A s E B ε T ε ˙ s ( t ) = 2 C 0 L s ε R ε s = 2 C 0 L s 0 t ε R d τ
where εI, εp, and εr represent the incident, reflected, and transmitted strain pulses, respectively. AB and AS are the cross-sectional areas of the bar and the rock specimen. EB is the elastic modulus of the bar. σs, ε ˙ s t and εs, respectively, represent the stress, strain rate, and strain of the specimen. C0 indicates the longitudinal elastic wave velocity of the bar. Ls is the initial length of the rock specimen.
Based on the experimental data obtained, the stress-strain curves of red sandstone under various impact loads are depicted in Figure 8. These curves demonstrate consistent patterns across different levels of impact. Figure 6 categorizes the stress-strain curves of red sandstone under dynamic loading into four distinct phases: I (compaction stage), II (elastic stage), III (crack growth stage), and IV (failure stage). The compaction stage, Stage I, is notably brief, during which the inherent cracks within the rock briefly compress under the high-velocity impact, resulting in a minimal compaction effect on the stress-strain curve. Consequently, there are no significant fluctuations in stress and strain during this stage. In Stage II, the numerous pores and micro-cracks within the red sandstone absorb energy, thereby enhancing the rock’s capacity for elastic deformation. This phase is characterized by a nearly linear increase in the stress-strain curve, indicating an elastic behavior of the specimen. Stage III sees the energy-absorbing micro-cracks interconnect, leading to stress concentration and the rapid formation of macroscopic primary cracks. This results in a convex upward trajectory of the stress-strain curve, culminating in peak stress. Stage IV, the failure stage, is considerably longer compared to the period before peak stress. During this stage, the stress-strain curve continuously declines, ultimately leading to the complete fragmentation and failure of the rock specimen [26].
As illustrated in Figure 7, various behaviors are observed at different strain rates: at a strain rate of 32.5 s−1, the specimen displays minor cracking with several radial fractures and reaches a peak stress of 43.65 MPa; at a strain rate of 75.5 s−1, the specimen breaks into a broad spectrum of graded fragments. When the strain rate exceeds 95.0 s−1, the specimen fractures into even finer particles, beginning to produce powder and showing a marked increase in energy dissipation. Post-fracture, larger fragments of the red sandstone primarily appear as split cylindrical bodies with predominantly rectangular cross-sections, while smaller fragments are generally irregular cones with triangular cross-sections. With increasing impact load and strain rate, there is a notable increase in the number of smaller sandstone fragments, and the predominant type of failure is tensile. The relationship between peak stress and average strain rate is presented in Figure 9. At lower strain rates, the sandstone exhibits relatively low peak stress, but both the peak stress and failure strain of the specimen increase with the average strain rate. As the average strain rate rises from 35.53 s−1 to 118.71 s−1, the peak stress increases from 45.65 MPa to 115.34 MPa, and the failure strain grows from 0.95% to 5.23%. Overall, there is an approximate linear relationship between peak stress and average strain rate, as demonstrated by the fitting linear equation. The slope of the linearity is correlated with the sensitivity parameters of peak stress and strain rate. This coefficient may quantify the response of dynamic behavior to the changes in loading rates [27]. Additionally, the intercept potentially represents the static yield stress under quasi-static conditions of the red sandstone.
σ r = 17.56 + 0.802 · ε ·
where σs represents the peak stress, MPa; and ε ˙ denotes the average strain rate in s−1.

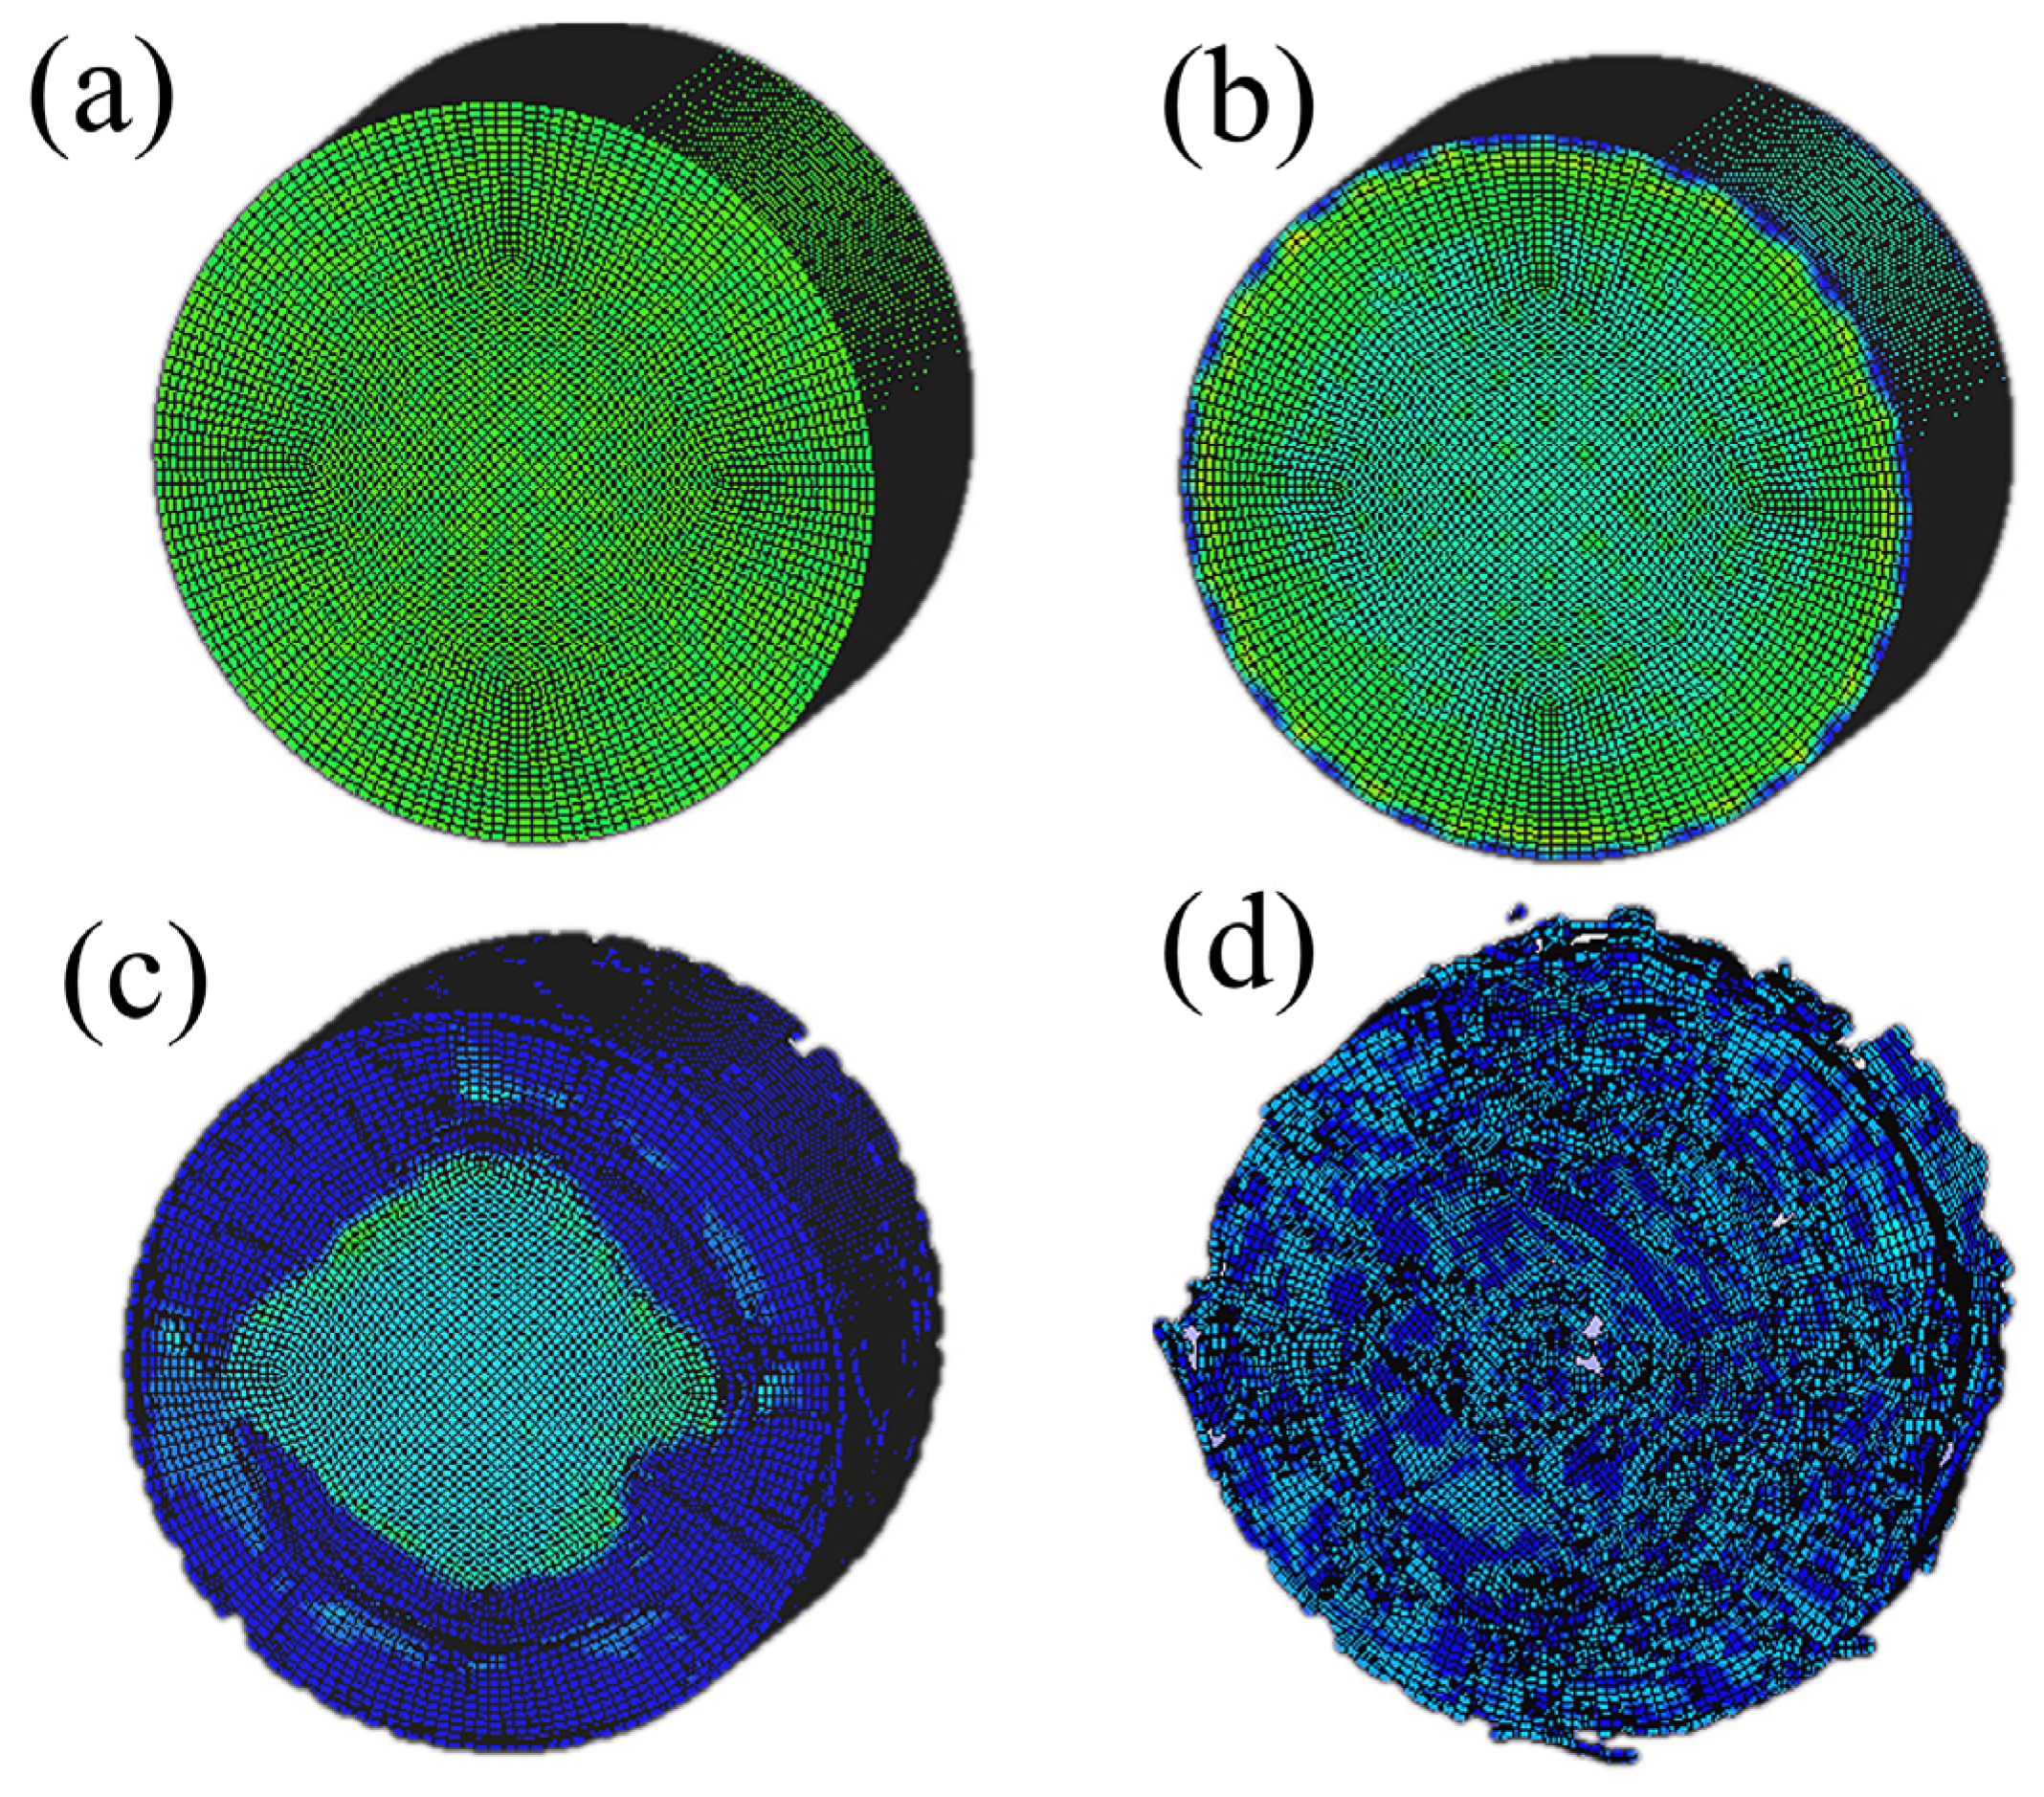
4. Simulation Analysis

To deepen our understanding of the stress state, damage evolution patterns, and the damage failure process of red sandstone specimens, the dynamic destruction process and axial compression stress changes were simulated under an impact velocity of 15.2 m/s. Figure 10 illustrates the destruction process of the specimen and the stress cloud diagram, which reflects the stress level of the saturated sandstone specimens under axial compression during the dynamic impact process. From Figure 10a, at t = 264 μs, the specimen remains intact without any damage. Figure 10b, when t = 397 μs, shows the stress wave reflecting into a tensile stress wave at the contact edge (free boundary), causing tensile stress to accumulate at the edges of the specimen and gradual damage accrual (blue areas begin to appear around the specimen end face, indicating areas under stress according to the legend). When t = 474 μs, numerous micro-cracks develop around the specimen and dynamically extend, causing the surface units of the specimen edges to gradually fall off (Figure 10c). Given that the edges of the specimen are free boundaries where tensile stress waves are more likely to reflect, and considering the rock’s lower tensile strength compared to its compressive strength, the internal tensile stress in the specimen reaches a threshold, leading to tensile fracture and gradual disintegration of the surrounding units. Micro-cracks start to gather and extend from the edges toward the center, becoming interconnected. When t = 575 μs, the stress intensifies at the middle of the specimen end face, causing the micro-cracks to coalesce, extend further, and interconnect, ultimately resulting in an axial splitting damage mode and complete fracture and disintegration of the red sandstone (Figure 10d).
The phenomenon of dynamic cracks in red sandstone spreading from the periphery to the center is primarily attributed to the fact that the edge area has endured higher stress and strain. Coupled with its pore structure and the weak bond between particles, it serves as the initiation point of crack propagation. With the formation and development of cracks, under the combined influence of energy release, particle fragmentation, and internal structure disruption, the cracks spread towards the center along the shortest path or the direction with the highest propensity for expansion [28]. This failure mode is relatively prevalent in the study of rock mechanics, especially for rock types featuring high porosity and a relatively loose structure [29]. Furthermore, the edges of rock specimens are susceptible to micro-defects, which arise from mechanical processing. The distribution density of defects at the rock edges is typically higher than that within. Consequently, the edges of specimens serve as the main areas for damage initiation under impact loading [30].

5. Discussion

5.1. Comparison of Simulated and Tested Results on Stress-Strain Relationship

In ANSYS/LS-DYNA (R12.0) numerical simulation software, a single element from the middle part of both the incident and reflected bars is selected. This selection corresponds to the locations where strain gauges are attached in the experiment, enabling the output of strain-time curves [31]. Subsequently, the corresponding stress-strain curves are calculated and compared with those obtained experimentally. As illustrated in Figure 11, under various strain rate conditions, the stress-strain curves from both SHPB experiments and numerical simulations exhibit similar change patterns. Figure 11 demonstrates that at high strain rates, the simulated stress-strain curve trends closely align with those observed in the experimental data, divided into three distinct phases: the stress rising phase, the stress buffer phase, and the strain softening phase.

5.2. Comparison of Simulated and Tested Results on Failure Modes

Figure 12 presents comparative illustrations of failure modes from both SHPB tests and numerical simulations. The red sandstone specimens were subjected to five impact velocities, corresponding to five different average strain rates. As the impact velocity increases, the specimens tend to fracture into smaller fragments, and the number of fractured pieces also rises. Regarding damage morphology, the specimens exhibit longitudinal through-going cracks, with axial splitting as the predominant failure mode. The numerical simulations replicate these damage modes, aligning closely with the experimental results. The experimental–numerical validation framework has relative errors of 6.7%, 3.5%, 4.2%, 7.3%, and 2.9%, respectively. When comparing the damage morphology after a single impact under three different strain rates, it becomes clear that the fracture degree of the specimens increases significantly with the average strain rate. This trend suggests that higher impact velocities lead to a quicker increase in the fractured surface area, accompanied by a progressive rise in strain energy and cumulative specific energy. These observations indicate that the specimens absorb external energy rapidly, showing a marked intensification of specimen breakage. This behavior reflects the strain rate effect on the energy absorption and dissipation characteristics of the red sandstone. Analyzing the damage morphology of specimens with the same aspect ratio under different impact velocities reveals that at a lower average strain rate, the energy imparted by the impact is less, resulting in fewer activated micro-cracks. These cracks primarily extend along the direction of compressive stress, interconnecting to form longitudinal through-going cracks, thus manifesting an axial splitting damage mode. At higher impact velocities (e.g., an average strain rate of 94.24 s−1), the energy from the incident wave is greater, leading to more extensive internal damage after the impact. This condition increases the number of crack extensions and activates more dynamic extension [28]. The macroscopic appearance under these conditions shows a rise in the number of fractured pieces accompanied by a significant amount of debris, indicating a transition from axial splitting to fragmentation. The results of the study confirm that the numerical simulations are consistent with the SHPB test outcomes, effectively reflecting the strain rate effect on the dynamic damage characteristics of rock dynamics.
Through detailed analysis of each specimen’s destruction process, it was found that at the onset of the stress wave impact, the edges of the red sandstone specimens were the first to sustain impact damage, producing several radial fractures. As the stress wave persisted, fractures and breakage expanded from the edges toward the center, while the specimen’s internal native and newly formed fractures extended outward. This progression intensified the fragmentation of the specimens, with the damage predominantly characterized by typical tensile failure and a combination of axial splitting and compression failure. As the impact load increased, the extent of specimen fragmentation advanced from minor breakage with intact chunks to severe fragmentation, with large chunks diminishing and a proliferation of small fragments and powder. Overall, a comparative analysis of the simulation results and experimental data revealed that the simulated and experimentally observed fragmentation patterns of the red sandstone were fundamentally similar. From the perspective of energy dissipation imbalance, the excavation disturbance of the surrounding rock causes the elastic strain energy of the surrounding rock to accumulate rapidly. When the energy dissipation exceeds the fracture energy threshold of the rock mass, the irreversible dissipation through crack propagation triggers the dynamic instability of the tunnel, rather than the quasi-static failure in the low-stress area [32].
Advanced computational models integrate geological variables with dynamic parameters of rock to predict blast-induced fracture networks in tunnel construction. The failure mode of rock specimens transitions from ductile crack propagation to brittle sudden fracture with increasing strain rate, indicating reduced energy absorption capacity and more abrupt failure processes under high strain rate conditions. It is necessary to achieve a relative balance between construction safety and engineering economy through quantitative monitoring and dynamic adjustment of support strategies for tunnelling. These research findings can offer robust theoretical support for rock blasting design in tunnel excavation, assist in optimizing blasting parameters (such as charge quantity and blasting sequence), thereby minimizing damage to the surrounding rock mass. Moreover, future research should develop approaches for cyclic loading calculation, thus simulating the cumulative damage effect of rocks subjected to repeated blasting.

6. Conclusions

This study provides a comprehensive analysis of the dynamic load effects on the red sandstone in tunnel engineering, utilizing SHPB testing and numerical simulations to ascertain dynamic damage characteristics.
(1) Experimental results reveal that with the increase of the impact load, the particle size distribution after the impact shows a direct proportion between the degree of fragmentation of the specimen and the impact load as the impact load rises.
(2) Analysis of the damage process under a 0.5 MPa impact load indicates that the specimen’s edges are the initial sites of damage initiation. As the strain rate increases, specimen fragmentation intensifies, leading to extensive fragmentation or even pulverization.
(3) Peak stress and failure strain exhibit strain rate dependency, increasing from 45.65 MPa to 115.34 MPa and 0.95% to 5.23%, respectively, as strain rate elevates from 35.53 s−1 to 118.71 s−1. The correlation coefficient between dynamic peak stress and strain rate is over 0.96. The degree of specimen fragmentation provides valuable insights into the behavior of materials under high-stress conditions.
(4) Through optimizing the parameters of the material model and meshing strategies, the simulation results of stress-strain curves and fragmentation mode demonstrate excellent consistency with the experimental data.
(5) The findings from SHPB experiments and numerical simulations provide theoretical support for tunnelling, enabling optimization of parameters for surrounding rock blasting to reduce surrounding rock damage and improve tunnelling safety. Future studies should establish cyclic loading frameworks to simulate cumulative damage in rocks under repeated blasting.

Author Contributions

Writing-original draft: Y.Q., Data curation: Y.Q., Conceptualization: R.A., Writing-review & editing: R.A., Methodology: Y.S., Investigation: Y.S.; Resources: R.H., Visualization: R.H., Software: C.L. All authors have read and agreed to the published version of the manuscript.

Funding

This research was funded by the National Natural Science Foundation of China (42262013) and the Gansu Provincial Science and Technology Plan Project (No. 21JR7RA541).

Data Availability Statement

Data are available upon reasonable request.

Conflicts of Interest

Authors Yelin Qian, Ying Su, Ruicai Han, and Changchun Li were employed by the company Anhui Construction Engineering Road Port Construction Group Co., Ltd. Ran An was employed by Hefei University of technology. The remaining authors declare that the research was conducted in the absence of any commercial or financial relationships that could be construed as a potential conflict of interest.

References

  1. Mangano, G.; Alves, T.M.; Zecchin, M.; Civile, D.; Critelli, S. The Rossano-San Nicola Fault Zone evolution impacts the burial and maturation histories of the Crotone Basin, Calabrian Arc, Italy. Pet. Geosci. 2023, 29, 2022–2085. [Google Scholar] [CrossRef]
  2. Sadisun, I.A.; Bandono; Shimada, H.; Ichinose, M.; Matsui, K. Physical disintegration characterization of mudrocks subjected to slaking exposure and immersion tests. Indones. J. Geosci. 2010, 5, 219–255. [Google Scholar]
  3. Walske, M.L.; McWilliam, H.; Doherty, J.; Fourie, A. Influence of curing temperature and stress conditions on mechanical properties of cementing paste backfill. Can. Geotech. J. 2016, 53, 148–161. [Google Scholar] [CrossRef]
  4. Liu, J.; Xu, Q.; Wang, S.; Siva Subramanian, S.; Wang, L.; Qi, X. Formation and chemo-mechanical characteristics of weak clay interlayers between alternative mudstone and sandstone sequence of gently inclined landslides in Nanjiang, SW China. Bull. Eng. Geol. Environ. 2020, 79, 4701–4715. [Google Scholar] [CrossRef]
  5. Njeru, R.M.; Sofyan, A.; Halisch, M.; Kóbor, B.; Szanyi, J. Optimizing Micro-CT Resolution for Geothermal Reservoir Characterization in the Pannonian Basin. Energies 2024, 17, 3081. [Google Scholar] [CrossRef]
  6. Gelencsér, O.; Árvai, C.; Mika, L.T.; Breitner, D.; LeClair, D.; Szabó, C.; Falus, G.; Szabó-Krausz, Z. Effect of hydrogen on calcite reactivity in sandstone reservoirs: Experimental results compared to geochemical modeling predictions. J. Energy Storage 2023, 61, 106737. [Google Scholar] [CrossRef]
  7. Munoz, H.; Taheri, A.; Chanda, E. Rock Drilling Performance Evaluation by an Energy Dissipation Based Rock Brittleness Index. Rock Mech. Rock Eng. 2016, 49, 3343–3355. [Google Scholar] [CrossRef]
  8. Michal, K.; Pawel, B.; Jerzy, M. Determination and validation of Karagozian-Case Concrete constitutive model parameters for numerical modeling of dolomite rock. Int. J. Rock Mech. Min. Sci. 2020, 129, 512–522. [Google Scholar]
  9. Kong, L.W.; Zeng, Z.X.; Bai, W.; Wang, M. Engineering geological properties of weathered swelling mudstones and their effectson the landslides occurrence in the Yanji section of the Jilin-Hunchun high-speed railway. Bull. Eng. Geol. Environ. 2018, 77, 1491–1503. [Google Scholar] [CrossRef]
  10. Chloe, A. Micro-macro mechanics of damage and healing in rocks. Open Geomech. 2020, 25, 251–257. [Google Scholar]
  11. Alves, M.; Karagiozova, D.; Micheli, G.B.; Calle, M.A.G. Limiting the influence of friction on the split Hopkinson pressure bar tests by using a ring specimen. Int. J. Impact. Eng. 2012, 49, 130–141. [Google Scholar] [CrossRef]
  12. Che, W.; Li, L.; Chen, Z.; Liang, D.; Guo, Y. Impact Resistance of Rubberized Alkali-Activated Concrete Incorporating Recycled Aggregate and Recycled Steel Fiber. Buildings 2024, 14, 322. [Google Scholar] [CrossRef]
  13. Gao, H.; An, R.; Zhang, X.; Wang, G.; Liu, X.; Xu, Y. Dynamic evolution of desiccation cracks and their relationship with the hydraulic properties of expansive soil. Int. J. Geomech. 2024, 24, 04023299. [Google Scholar] [CrossRef]
  14. Yao, Y.; Zhao, F.; Li, J.; Liu, J.; Liu, Z.; Wang, Y.; Zhuang, R.; Liu, L.; Zhao, Y.; Xu, Z. SHPB Experiment and MPM Simulation on Dynamic Properties of Unsaturated Clay UnderImpact Loading. Appl. Sci. 2025, 15, 3123. [Google Scholar] [CrossRef]
  15. Qi, C.Z.; Wang, M.Y.; Bai, J.P.; Wei, X.K.; Wang, H.S. Investigation into size and strain rate effects on the strength of rock-like materials. Int. J. Rock Mech. Min. Sci. 2016, 86, 132–140. [Google Scholar] [CrossRef]
  16. Hartley, R.S.; Cloete, T.J.; Nurick, G.N. An experimental assessment of friction effects in the split Hopkinson pressure bar using the ring compression test. Int. J. Impact. Eng. 2007, 34, 1705–1728. [Google Scholar] [CrossRef]
  17. Maassen, S.F.; Niekamp, R.; Bergmann, J.A.; Pöhl, F.; Schröder, J.; Wiederkehr, P. Modeling of the Split-Hopkinson-Pressure-Bar experiment with the explicit material point method. Comput. Part. Mech. 2022, 9, 153–166. [Google Scholar] [CrossRef]
  18. Zhu, W.C.; Bai, Y.; Li, X.B.; Niu, L.L. Numerical simulation on rock failure under combined static and dynamic loading during SHPB tests. Int. J. Impact. Eng. 2012, 49, 142–157. [Google Scholar] [CrossRef]
  19. Mahabadi, O.K.; Cottrell, B.E.; Grasselli, G. An Example of Realistic Modelling of Rock Dynamics Problems: FEM/DEM Simulation of Dynamic Brazilian Test on Barre Granite. Rock. Mech. Rock. Eng. 2010, 43, 707–716. [Google Scholar] [CrossRef]
  20. Flores-Johnson, E.A.; Li, Q.M. Structural Effects on Compressive Strength Enhancement of Concrete-like Materials in a Split Hopkinson Pressure Bar Test. Int. J. Impact. Eng. 2017, 109, 408–418. [Google Scholar] [CrossRef]
  21. Jankowiak, T.; Rusinek, A.; Voyiadjis, G.Z. Modeling and Design of SHPB to Characterize Brittle Materials under Compression for High Strain Rates. Materials 2020, 13, 2191. [Google Scholar] [CrossRef] [PubMed]
  22. Yao, W.; Xia, K.W.; Zhang, T. Dynamic fracture test of Laurentian granite subjected to hydrostatic pressure. Exp. Mech. 2019, 59, 245–250. [Google Scholar] [CrossRef]
  23. Wang, C.L.; Zhou, B.K.; Li, C.F.; Cao, C.; Sui, Q.R.; Zao, G.M.; Yu, W.J.; Chen, Z.; Wang, Y.; Liu, B.; et al. Experimental investigation on the spatio-temporal-energy evolution pattern of limestone fracture using acoustic emission monitoring. J. Appl. Geophys. 2022, 206, 104787. [Google Scholar] [CrossRef]
  24. Gong, F.Q.; Li, X.B.; Rao, Q.H.; Liu, X. Reference method for determining sample size in SHPB tests of rock materials. J. Vib. Shock 2013, 32, 24–28. [Google Scholar]
  25. Xu, D.S.; Zhang, Z.J.; Qin, Y.; Yang, Y. Effect of particle size on the failure behavior of cemented coral sand under impact loading. Soil Dyn. Earthq. Eng. 2021, 149, 106884. [Google Scholar] [CrossRef]
  26. Prabhu, S.; Qiu, T. Simulation of Split Hopkinson Pressure Bar Tests on Sands Using the Discrete-Element Method. Int. J. Geomech. 2022, 22, 06021036. [Google Scholar] [CrossRef]
  27. Rotariu, A.-N.; Trana, E.; Matache, L. Young’s Modulus Calculus Using Split Hopkinson Bar Tests on Long and Thin Material Samples. Materials 2022, 15, 3058. [Google Scholar] [CrossRef] [PubMed]
  28. Khosravani, M.R. Inverse characterization of UHPC material based on Hopkinson bar test. Appl. Eng. Sci. 2021, 6, 100043. [Google Scholar] [CrossRef]
  29. Merle, R.; Zhao, H. On the errors associated with the use of large diameter SHPB, correction for radially non-uniform distribution of stress and particle velocity in SHPB testing. Int. J. Impact Eng. 2006, 32, 1964–1980. [Google Scholar] [CrossRef]
  30. Tian, H.; Kempka, T.; Yu, S.; Ziegler, M. Mechanical properties of sandstones exposed to high temperature. Rock. Mech. Rock. Eng. 2016, 49, 321–327. [Google Scholar] [CrossRef]
  31. Fang, F.; Chen, S.J.; Wang, Y.J.; Huang, W.P.; Han, Z.Y. Cracking mechanism and strength criteria evaluation of granite affected by intermediate principal stresses subjected to unloading stress state. Int. J. Rock Mech. Min. Sci. 2021, 143, 104783. [Google Scholar] [CrossRef]
  32. Gavrus, A.; Bucur, F.; Rotariu, A.; Cananau, S. Mechanical behavior analysis of metallic materials using a Finite Element modeling of the SHPB test, a numerical calibration of the bar’s elastic strains and an inverse analysis method. Int. J. Mater. Form. 2014, 8, 567–579. [Google Scholar] [CrossRef]
Figure 1. Photographs of (a) Sampling location; (b) Mazier samples; and (c) expansive soil in natural and dry state.
Buildings 15 01845 g001
Figure 2. Description of the SHPB experiment: (a) Test procedure diagram; (b) real instrument.
Buildings 15 01845 g002
Figure 3. Numerical model of rock sample: (a) Surface of specimens, (b) Mesh division.
Buildings 15 01845 g003
Figure 4. Curves of impact strain and impact time.
Buildings 15 01845 g004
Figure 5. Curves of impact stress and impact time.
Buildings 15 01845 g005
Figure 6. Fracture characteristics of sandstone under different impact loads.
Buildings 15 01845 g006
Figure 7. Relationship between particle size, mass fractions, and impact load.
Buildings 15 01845 g007
Figure 8. Stress-strain curves of red sandstone under different dynamic loads.
Buildings 15 01845 g008
Figure 9. Relationship between the mean strain rate and the peak strength.
Buildings 15 01845 g009
Figure 10. Dynamic failure process at a velocity of 15.2 m/s at different times: (a) t = 264 μs, (b) t = 397 μs, (c) t = 474 μs, and (d) t = 575 μs.
Buildings 15 01845 g010
Figure 11. Experimental and simulated results of dynamic stress and strain curves. (a) ε ˙ = 32.5 s−1, (b) ε ˙ = 38.5 s−1, (c) ε ˙ = 60.2 s−1, (d) ε ˙ = 90.4 s−1, (e) ε ˙ = 117.8 s−1.
Buildings 15 01845 g011
Figure 12. Comparison of the failure mode at: (a) low impact velocity; (b) medium impact velocity; (c) high impact velocity.
Buildings 15 01845 g012
Table 1. Basic physical properties of the red sandstone.
ParameterDry Density
(g/cm)
Saturation Degree (%)Cohesion
(MPa)
Internal Friction Angle (%)Elastic Modulus
(GPa)
Permeability
(m/s)
Value2.3723.56.4239.515.431.52 × 10−7
COV6.213.58.86.711.29.3
Table 2. SHPB testing parameters of red sandstone.
SpecimenDiameter
(mm)
Thickness
(mm)
Impact Load/MPaVelocity
(m·s−1)
Peak Stress/MPaStrain Rate/s−1Degree of Fragmentation
S149.9325.080.54.6539.8130.22Minor cracking
S250.0224.930.54.9243.6532.53Minor cracking
S349.9625.020.66.1253.2275.25Severe cracking
S450.0725.110.78.0089.3094.24Severe fragmentation
S550.0525.130.89.27122.14113.7Pulverization
Disclaimer/Publisher’s Note: The statements, opinions and data contained in all publications are solely those of the individual author(s) and contributor(s) and not of MDPI and/or the editor(s). MDPI and/or the editor(s) disclaim responsibility for any injury to people or property resulting from any ideas, methods, instructions or products referred to in the content.

