Article

Carbon Emission Analysis of Tunnel Construction of Pumped Storage Power Station with Drilling and Blasting Method Based on Discrete Event Simulation

1
Faculty of Land Resources Engineering, Kunming University of Science and Technology, Kunming 650093, China
2
Power China Kunming Engineering Corporation Limited, Kunming 650051, China
3
State Key Laboratory of Hydraulic Engineering Intelligent Construction and Operation, Tianjin University, Tianjin 300072, China
4
School of Civil Engineering, Tianjin University, Tianjin 300072, China
*
Author to whom correspondence should be addressed.
Buildings 2025, 15(11), 1846; https://doi.org/10.3390/buildings15111846
Submission received: 10 April 2025 / Revised: 21 May 2025 / Accepted: 21 May 2025 / Published: 27 May 2025
(This article belongs to the Section Building Energy, Physics, Environment, and Systems)

Abstract

Under the “dual-carbon” strategy, accurately quantifying carbon emissions in water conservancy projects is crucial to promoting low-carbon construction. However, existing life cycle assessment (LCA) methods for carbon emissions during the mechanical construction stage often fail to reflect actual processes and are limited by high costs and lengthy data collection, potentially leading to inaccurate estimates. To address these challenges, this paper proposes a carbon emission evaluation method for the mechanical construction stage, based on carbon footprint theory and discrete event simulation (DES). This method quantifies equipment operation time and energy consumption during the drilling and blasting processes, enabling a detailed and dynamic emission analysis. Using the Fumin Pumped Storage Power Station Tunnel Project as a case study, a comparative analysis is conducted to examine the carbon emission characteristics of drilling and blasting operations under different surrounding rock conditions based on DES. The validity of the proposed model is confirmed by comparing its results with monitoring data and LCA results. The results show a clear upward trend in carbon emission intensity as surrounding rock conditions deteriorate, with emission intensity rising from 8405.82 kgCO2e/m for Class II to 16,189.30 kgCO2e/m for Class V in the headrace tunnel. The total carbon emissions of the water conveyance tunnels reach 40,019.64 tCO2e, with an average intensity of 13,565.98 kgCO2e/m. This study presents a refined and validated framework for assessing the carbon emissions of pumped storage tunnels. It addresses key limitations of traditional LCA methods in the mechanical construction stage and provides a practical tool to support the green transition of hydraulic infrastructure.

1. Introduction

As global warming accelerates, it poses growing threats to Earth’s ecological balance and climate stability. Consequently, achieving global carbon neutrality has become a widely recognized international objective [1,2,3]. In recent years, major global economies have conducted systematic research on carbon emission management [4,5,6]. China [7], the European Union [8], and other regions have established strategic targets for carbon peaking and carbon neutrality. In parallel, carbon reduction technologies have been implemented across key sectors such as building [9], energy [10], and transportation [11]. Pumped storage power station, as a green, low-carbon, and highly efficient energy technology for energy storage and conversion, plays a crucial role in supporting renewable energy integration and promoting sustainable energy utilization [12]. According to the Medium- and Long-Term Development Plan for Pumped Storage (2021–2035), China aims to commission 62 million kW of pumped storage capacity by 2025 and approximately 120 million kW by 2030. By the end of 2023, China’s total operational pumped storage hydropower capacity had reached 50.94 million KW, leading the world [13].
Greenhouse gas (GHG) emissions are a major contributor to global warming, with infrastructure development being a significant source of such emissions [14]. Against the backdrop of China’s “dual-carbon” targets, the construction of pumped storage power stations is rapidly expanding [15]. However, large-scale construction inevitably results in substantial resource consumption and carbon emissions. Therefore, accurately quantifying carbon emissions during the construction phase is essential for promoting green and low-carbon development in pumped-storage projects. As a core component of the pumped storage power stations, tunnel construction has been extensively studied in the fields of construction and transportation, where mature methodologies for carbon emission assessment have been established [16,17,18,19]. Lee et al. [20] identified seven major sources of carbon emissions in tunnel construction: (1) lining concrete, (2) shotcrete operations, (3) tunnel embankment and external excavations, (4) drainage work, (5) use of umbrellas, (6) transport operations of excavated material, and (7) bolting. These activities collectively account for over 89% of total emissions during the construction phase. Xu et al. further examined carbon emissions under different surrounding rock grades and found that weaker rock conditions lead to higher GHG emissions, with tunnel support and lining identified as the dominant emission sources [21]. Damián and Zamorano’s study on high-speed railroad tunnels revealed that support, lining, and infrastructure works contribute approximately 70% of the total environmental impact during construction, with concrete, diesel, and steel responsible for 89.3–99.9% of this impact [22]. Li et al. compared carbon emissions across different rock mass grades using the life cycle assessment (LCA) method, demonstrating that emissions from material production and construction activities increase with the deterioration of surrounding rock conditions [23]. Wu et al. applied the LCA approach to the Hong Kong-Zhuhai-Macao Bridge cross-sea tunnel and found that building material production and operation/maintenance phases accounted for 85.2% of total life cycle emissions, while the construction phase contributed 9.9% [24]. However, research on carbon emissions in the field of hydropower engineering remains limited, particularly in the context of pumped storage power tunnel projects, where the practical application of carbon emission calculation methods is still insufficient. Further efforts are needed to develop carbon emission assessment approaches tailored to the specific characteristics of hydropower infrastructure [25,26,27].
Traditional life cycle assessment (LCA) methods rely on static statistical data for carbon emission accounting, which limits their accuracy in modeling localized processes [28]. To enable dynamic carbon emission management during the mechanical construction stage, discrete event simulation (DES) has emerged as an effective quantitative approach for modeling emissions in construction activities [29,30]. By decomposing construction processes into discrete events—each with defined start, execution, and end times—and coordinating them through event-based scheduling mechanisms, DES facilitates the optimization of construction sequences [31]. González and Echaveguren were among the first to apply this methodology to environmental impact assessments in road construction projects [32]. Lewis et al. investigated the emission characteristics and coefficients of 34 types of equipment across seven categories and developed a carbon emission model based on DES to evaluate emissions from engineering machinery under both operational and idle conditions [33]. Liu proposed a life cycle carbon emission evaluation model for concrete dams, integrating LCA and DES to reveal the interdependencies among carbon emissions, project costs, and construction schedules, thereby enabling optimization of dam construction planning [34].
To address the issue of carbon emissions from tunnel construction in pumped storage power stations under different surrounding rock conditions, this study proposes a carbon emission calculation model covering the stages of material production, transportation, and mechanical construction based on the carbon footprint concept. Furthermore, by integrating the actual tunnel excavation process, a model based on DES is developed to quantify carbon emissions during tunnel construction. Finally, a practical engineering case is used to calculate and analyze carbon emissions during the construction phase across various surrounding rock grades. This study provides a feasible calculation framework and practical reference for evaluating carbon emissions in the construction phase of tunnels in pumped storage power station projects.

2. Carbon Emission Calculation Model for Tunnel Construction

2.1. General LCA-Based Model for Tunnel Construction

Carbon emissions from tunnel construction in pumped storage power stations are influenced by multiple factors, including material production, transportation, mechanical operations, and surrounding rock conditions. Transportation-related emissions are largely determined by the type of materials, transport distance, and mode of delivery. During the mechanical construction stage, equipment selection and operating time have a significant impact on emission levels. Additionally, the quality of surrounding rock conditions directly affects overall carbon output. To ensure accurate and reliable carbon emission estimates, it is essential to clearly define emission sources and establish consistent calculation principles. Figure 1 illustrates the composition of carbon emissions throughout the tunnel construction period.
Figure 1 indicates that all carbon emission sources during the pre-construction and mechanical construction stages of tunneling are tied to energy consumption. Given the complexity of construction activities, emission sources are broadly categorized into building materials and energy use to avoid overly detailed tracking. For instance, emissions from construction equipment are calculated solely based on their energy consumption. Moreover, practices such as waste recycling, the adoption of low-carbon and energy-efficient technologies, and ecological greening can effectively reduce emissions and partially offset those associated with material production.
Following the above principles, the emission factor method is adopted to develop a general model for calculating carbon emissions from tunnel excavation in pumped storage power stations. In this approach, carbon emissions are estimated by multiplying direct or indirect activity data by corresponding emission factors. The calculation process is divided into three stages: material production, transportation, and mechanical construction. Total emissions are obtained by summing the emissions from each stage, as expressed in Equation (1).
C = C 1 + C 2 + C 3
where C1 represents the carbon emissions from building material production, C2 represents the carbon emissions from the material transportation stage, and C3 represents the carbon emissions from the mechanical construction stage. The methodology for calculating carbon emissions at each stage is outlined as follows.
(1)
Material production stage: Carbon emissions in this stage are calculated as the sum of emissions from each material type, obtained by multiplying material consumption by its corresponding carbon emission factor. Based on the bill of quantities, emissions for this stage can be determined using Equation (2).
C 1 = i M i β i
where Mi is the consumption of the ith material; βi is the carbon emission factor corresponding to the ith material.
(2)
Material transportation stage: Carbon emissions in this stage primarily result from the energy consumed by transport vehicles moving materials from their source to the construction site, including on-site transportation and material handling. Key parameters such as material volume, transport distance, mode of transport, and duration are determined by project scale and construction experience. Using fuel consumption data from the Quota of Hourly Costs for Hydropower Construction Machinery (Trial Version) [35], total fuel usage is multiplied by the corresponding carbon emission factor to calculate emissions for this stage, as expressed in Equation (3).
C 2 = j γ j M j = j γ j i α j M i t L i 4 v M c
where γj is the carbon emission factor of the jth type of fuel; Mj is the consumption of the jth type of fuel; Mit is the total weight of the ith type of goods; Mc is the load capacity of the vehicle; Li is the transportation distance of the ith type of engineering materials; v is the average transportation speed of the transportation vehicle; αj is the amount of the jth fuel consumed per vehicle shift (8 h).
(3)
Mechanical construction stage: Carbon emissions in this stage are calculated using the energy consumption index of construction machinery from the Quota of Hourly Costs for Hydropower Construction Machinery (Trial Version) [35]. The operating time of each machine is determined by analyzing the actual work volume and corresponding equipment productivity. Emissions for this stage are then calculated using Equation (4).
C 3 = k γ k M k = k γ k l r α r , k V l t t r , l 8
where γk is the carbon emission factor of the kth energy source; Mk is the consumption of the kth energy source; Vlt is the total volume of the lth construction task; tr,l is the productivity of the rth type of machinery in the lth construction task; and αr,k is the amount of the kth energy source consumed by the rth type of machinery per shift (8 h).
When calculating carbon emissions during the mechanical construction stage using Equation (4), it is necessary to collect detailed data on the operating hours and energy consumption of various types of machinery. However, this process is often hindered by challenges such as difficulties in data collection, high costs, and long durations. In addition, due to the difficulty in accurately defining the actual working status of equipment, carbon emission estimates may be subject to significant deviations.

2.2. DES-Based Model for Mechanical Construction Stage

Carbon emission calculations for tunnel construction in pumped storage power stations include both the pre-construction and mechanical construction stages. Emissions from the pre-construction stage, including material production, transportation, and site preparation, are calculated using Equations (2) and (3). In contrast, the mechanical construction stage involves diverse processes, construction methods, and equipment. The traditional emission calculation method (i.e., Equation (4)) often leads to considerable deviations due to difficulties in parameter acquisition, limited accuracy, and the omission of the dynamic nature of construction activities. To address these limitations, this study employs a DES approach to simulate and analyze carbon emissions during the mechanical construction stage. By capturing the operating and idle times of construction equipment and applying energy consumption indices from the Quota of Hourly Costs for Hydropower Construction Machinery (Trial Version) [35], the model improves the accuracy of carbon emission estimates for this stage.

2.2.1. Modeling Process

This section adopts a DES approach to dynamically model the mechanical construction stage of tunnel excavation. By aligning with specific construction processes, the method generates a detailed inventory of energy consumption, primarily including diesel, gasoline, and electricity. Figure 2 illustrates the DES-based carbon emission calculation process, which comprises the following steps: (1) defining construction procedures, (2) identifying discrete machinery events, (3) establishing the temporal probability density distribution of events, (4) building the DES model, (5) validating the model, (6) calculating and analyzing carbon emissions, (7) optimizing construction scenarios, and (8) supporting decision-making. This method enables accurate estimation of machinery operating time and corresponding carbon emissions, thereby facilitating construction plan optimization and emission control. For example, simulation results can help identify machinery with high carbon intensity, allowing for optimization of operational configurations or substitution with energy-efficient alternatives. These insights offer practical guidance for construction design and promote emission reduction in carbon-intensive phases.
Based on tunnel excavation data and construction procedures, a discrete event model for tunnel construction is developed by mapping the operational flow of construction equipment and the relationships among construction events. The model construction process includes defining construction sequences, identifying discrete events for various machinery, and determining the probability density functions of event durations. The methodology and operational logic of the discrete event model are illustrated in Figure 3.
(1)
Defining the tunnel excavation sequence: On-site construction primarily includes tunnel excavation using the drilling and blasting method, primary support, and secondary lining. As construction machinery and resources are discretely distributed across these processes, discrete event modeling by the construction process is necessary.
(2)
Separating construction machinery discrete events: After defining the construction sequence, discrete events associated with the machinery required for each stage must be identified. These events are categorized into three types: queuing events, conditional events, and execution events.
(3)
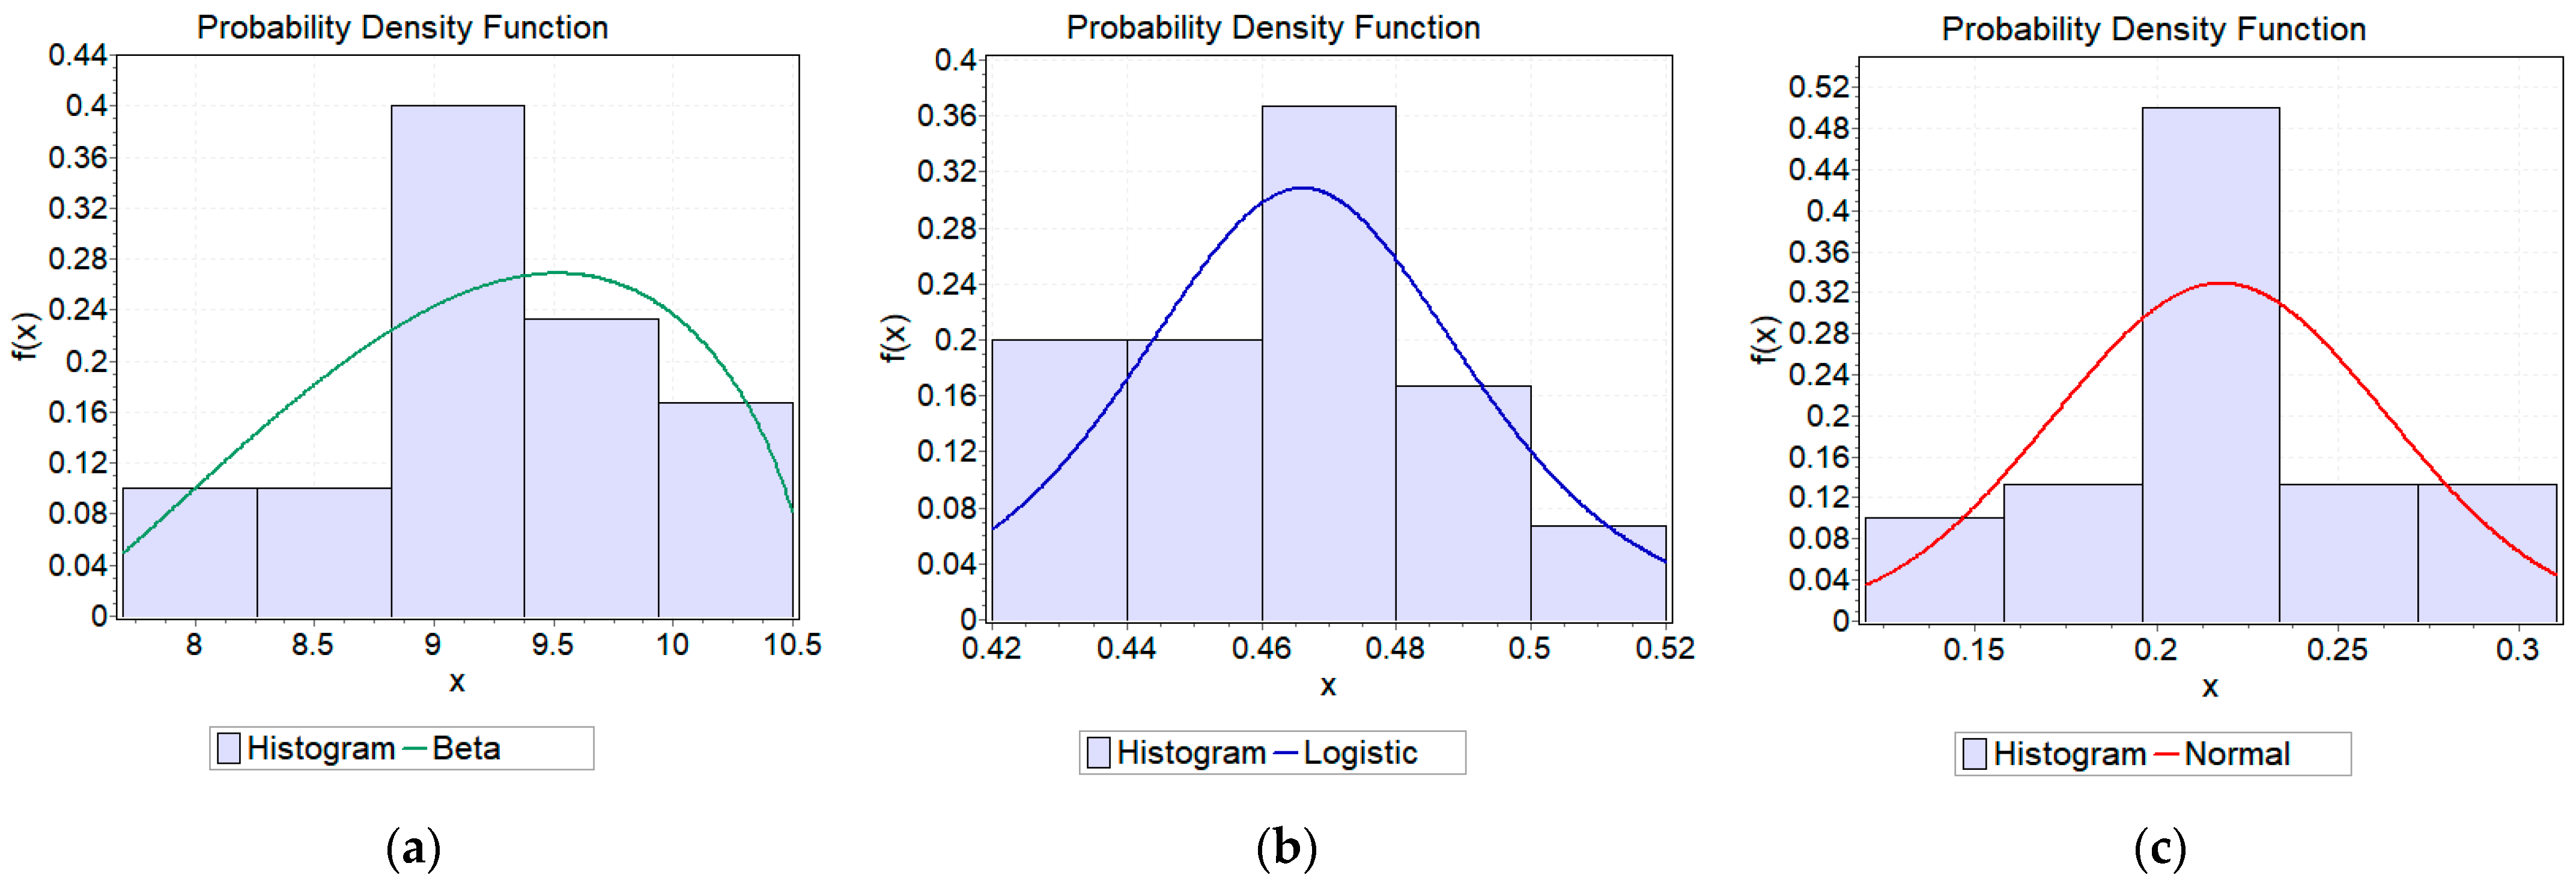
Determining the probability density functions of time: By collecting construction data and analyzing surveillance footage, the operating and idle times of machinery during each stage are statistically analyzed. These time parameters are then abstracted into probability density distribution functions for use in the model.
In this study, a discrete event model for tunnel construction is developed using the Microsoft Visio platform (Version 2021) and the basic elements of the EZStrobe template (Version 4.20). Construction resource parameters and time probability distribution functions are input into the model, and the construction process is simulated using Stroboscope (Version 5,24,6,4). During modeling, event activity times are collected through field recordings or surveillance videos. Given the interdependency of construction steps, it is difficult to manually capture precise activity durations. Therefore, video footage is used to statistically record the duration of each construction step, with each discrete event recorded at least 30 times to ensure the sample size met statistical analysis requirements [34]. Finally, the activity durations of construction machinery are analyzed to establish probability density functions for equipment operation times.

2.2.2. Model Formulation

A complete DES framework must include termination conditions. For simulations without a natural endpoint, an artificial termination condition must be defined. In the EZStrobe environment (Version 4.20), appropriate termination conditions can be set by limiting the simulation duration, the number of times a specific activity begins, or the total quantity of resource flows.
By inputting the initial number of equipment resources, model termination conditions, and the discrete event model into the analysis software, the construction processes of each tunnel construction stage can be simulated using EZStrobe (Version 4.20). This enables the extraction of statistical data for the discrete events of construction machinery. The simulation provides both the operating and idle times of each type of machinery. Based on these results and the energy consumption indices from the Quota of Hourly Costs for Hydropower Construction Machinery (Trial Version) [35], the energy consumption for each machine is calculated. The actual operating and idle times of each piece of equipment are represented by Equations (5) and (6).
T r o p = l = 1 n t l r
T r d = T r T r o p = T r l = 1 n t l r
where tlr is the operation length of the rth type of machinery in the lth construction task, and the operation occurs n times; Trop is the total operation time of the rth type of machinery; Trd is the total idle time of the rth type of machinery; Tr is the total operating time of the rth type of machinery.
Given the high operational frequency of construction machinery across tasks, it is challenging to fully monitor and record both the number of operations nr and the duration of each operation tlr. To address this, the average operating duration is introduced to simplify Equation (5).
T r o p = n r t r ¯
where t r ¯ is the average operating hours of the rth type of machinery under each construction operation task.
Lewis et al. found that construction equipment generates significant carbon emissions even while idle, with the carbon emission factor during idle time being approximately 20% of that during active operation [33,34]. Accordingly, the energy consumption of each energy type can be quantified using Equation (8), and the corresponding carbon emissions during the mechanical construction stage, based on DES, can be calculated using Equation (9).
M k = r α r , k o p T r o p 8 + r α r , k i d T r i d 8 = 1.2 r α r , k o p T r o p 8
C 3 = k γ k M k = 1.2 k γ k r α r , k o p n r t r ¯ 8
where γk represents the carbon emission factor for the kth type of energy; α r , k o p and α r , k i d are the kth amount of energy consumed per shift by the rth type of machinery in operation and standby, respectively; coefficient 1.2 is the coefficient of energy consumption after considering standby energy consumption; and C3′ is the carbon emission of the machinery construction stage based on discrete event simulation.

2.2.3. Carbon Emission Factors

The carbon emission factors adopted in this study are primarily sourced from Standard for Calculation of Building Carbon Emission [36]. In addition, relevant findings from construction-related carbon emission studies [1,25,27,37,38] are incorporated to supplement and adjust the data as needed. When multiple sources provide differing values without a clearly preferred reference, the arithmetic mean is used. The emission factor for electricity is based on the regional power grid mix specific to southern China. The energy sources and materials emission factors are summarized in Table 1 and Table 2.

3. Case Study on Carbon Emission Assessment of Pumped Storage Tunnel Construction

3.1. Project Overview

This paper relies on the Fumin Pumped Storage Power Station Project, which is located in Kuanzhuang Town, Fumin County, Kunming, Yunnan Province. The upper and lower reservoirs are about 10 km and 3 km away from the road mileage of Kuanzhuang Town, and the road mileage of Kuanzhuang Town is about 59 km away from Kunming City, and the straight-line distance from the 110 kV Beiying substation is about 38 km. The project has better transportation conditions and more abundant construction resources of all types.
This project is classified as a Class I (large type I) project. The permanent major buildings, such as the upper reservoir retaining building, discharge building, water conveyance system, plant, and lower reservoir, are designated as Grade 1 structures. The secondary buildings are classified as Grade 3, and the temporary buildings are categorized as Grade 4. The power station has an installed capacity of 1200 MW, with four vertical shaft single-stage mixed-flow reversible pump turbines of 300 MW capacity installed. The project hub building mainly consists of the upper reservoir, lower reservoir, water transmission system, underground plant and ground switching station, and other buildings. The upper reservoir has a total capacity of about 812 × 104 m3 and a regulating capacity of 763 × 104 m3. The main dam is a reinforced concrete panel rockfill dam. The total capacity of the lower reservoir is 1011 × 104 m3, the regulating capacity is 760 × 104 m3, and the dam is a concrete panel rockfill dam. The north line scheme of the water transmission and power generation system consists of the upper reservoir, water transmission system (the total length of the water pipeline between the inlet/outlet of the upper and lower reservoirs is 2950 m), underground plant system (the underground caverns in the plant mainly include: main and auxiliary plant caverns, main transformer cavern, tailgate cavern, busbar cavern, traffic cable cavern, traffic cavern for entering the plant, transporting cavern of the main transformer, transporting cavern of the tailgate, ventilating and safety cavern, 500 kV outgoing vertical shafts and flat caverns, exhaust ventilation shaft and flat caves, drainage corridors, drainage holes, etc.), lower reservoir and recharge system (500 kV outlet shaft and flat hole, drainage corridor, drainage hole, etc.), lower reservoir and water replenishment system. The three-dimensional arrangement of the pumped storage power station is shown in Figure 4. After completion, the power station will undertake the tasks of peak shifting, valley filling, energy storage, frequency control, phase control, and emergency accident backup of the power grid in Yunnan Province.
The water conveyance and power generation system primarily consists of the headrace tunnel, underground powerhouse, and tailrace tunnel. The underground caverns are generally buried at depths ranging from 200 m to 350 m. The surrounding rock mainly comprises slightly weathered to fresh basalt and limestone, characterized predominantly by hard rock formations. The integrity of the rock mass is estimated to range from good to poor, with Class III rock being the most prevalent, and partial occurrences of Class II, IV, and V rock. Overall, the geological conditions of the surrounding rock are considered favorable. This section focuses on the case-based calculation of carbon emissions from water conveyance tunnel construction under different surrounding rock classes.

3.2. Carbon Emission Intensity Assessment

This section takes the headrace tunnel excavated through drilling and blasting in Class II surrounding rock of the Fumin Project as a case study. The LCA method is employed to quantify carbon emissions from pre-construction (material production and transportation stages), while the proposed DES model is used to estimate emissions from the mechanical construction stage. These two approaches are integrated to assess the total carbon emissions throughout the tunnel construction process.

3.2.1. LCA-Based Assessment for Pre-Construction Stage

Carbon emission data for the material production and transportation stages are primarily obtained from design drawings, budget estimates, and relevant quota specifications. Due to the wide variety and substantial quantities of materials involved, the analysis focuses on those with the highest consumption and emission potential, including ammonium nitrate explosives, concrete, rock bolts, and steel mesh. In accordance with Standard for Calculation of Building Carbon Emission, an average transport distance of 40 km is assumed for concrete, and 500 km for all other materials [36]. Using the headrace tunnel in Class II surrounding rock as a representative case, the per-meter material consumption for excavation and support activities is quantified. Carbon emissions from material production and transportation are subsequently estimated using the LCA method, following Equations (2) and (3), and the results are summarized in Table 3. The results indicate that the carbon emission intensity during the pre-construction stage is 7257.24 kgCO2e/m, of which 6273.39 kgCO2e/m is attributed to material production and 983.85 kgCO2e/m to material transportation.

3.2.2. DES-Based Assessment for Mechanical Construction Stage

To establish a DES model for carbon emission estimation during tunnel excavation, it is first necessary to define the construction procedures and identify the discrete events associated with the operation of major machinery. In this study, the tunnel is excavated using the drilling and blasting method. The construction process primarily consists of cave excavation, primary support, and secondary lining. The workflow of tunnel excavation and the major construction equipment are illustrated in Figure 5.
Subsequently, discrete events associated with key construction equipment are identified and separated. Based on the construction design documents and the major machinery used in tunnel excavation, the process flow and logical sequence of each construction stage are established, as illustrated in Figure 6. Discrete event activities for essential equipment such as a rock drill, a vertical claw rock loader, and a dump truck are analyzed. Specifically, the rock drill is responsible for borehole drilling, the vertical claw loader performs loading, and the dump truck operates in four stages: loading, transporting, unloading excavated material, and returning to the site.
The cave excavation stage is taken as a representative example to analyze carbon emissions during the mechanical construction stage. A DES model for the drilling and blasting method in water conveyance tunnel construction is developed, as illustrated in Figure 7. In this figure, circles represent resource types and quantities, rectangles represent activities of heavy construction equipment on site, and rectangles without angled corners represent the activities that need to obtain resources. The numbers along arrows denote the quantity of resources acquired per event. For example, in the drilling stage, once construction begins, the process enters the “Rock drills for drilling holes” activity. When the queue length for the hand-held drill resource exceeds zero, the subsequent “Drilling” activity is triggered. This activity requires eight rock drills, and the duration of a single operation follows a Beta distribution: Beta (5.8595, 7.1, 7.6891). Upon completion of the drilling activity, the model proceeds to the “drilling completed” node, which serves as a transition to subsequent operations such as explosive placement.
Based on on-site construction records, surveillance video, and expert input from construction technicians, 30 sets of single-cycle operation time data are collected for each type of equipment activity. Statistical analysis is conducted, including time distribution selection, curve fitting, and optimal distribution identification using the Kolmogorov–Smirnov (K–S) test. Figure 8 presents fitted curves for selected event activity durations: drilling time follows a Beta distribution, explosive placement time follows a normal distribution, and ventilation dispersion time follows a Lognormal distribution.
The fitted parameters of time distribution functions for each event in the drilling and blasting process are summarized in Table 4. The critical value of the K–S test for 30 samples is 0.241 [39]. According to the results in Table 4, all K–S test statistics are below the critical threshold, indicating that the fitted distributions for each time series pass the K–S test.
The statistical results of time distribution functions for each construction event, as shown in Table 4, are input into the discrete event model illustrated in Figure 7, along with the configuration parameters for construction equipment resources. The model is used to simulate the tunnel excavation process, with a termination condition set at a cumulative excavation volume of 70.65 m3 of rock. After conducting 30 simulation runs of tunnel excavation using Stroboscope (Version 5,24,6,4), the average operating time for each construction machinery type under different discrete events is obtained. Based on the Quota of Hourly Costs for Hydropower Construction Machinery (Trial Version) [35] and relevant equipment manuals, the energy consumption per work shift for each machine is determined. Energy use and the corresponding carbon emissions during drill-and-blast excavation are then calculated using Equations (8) and (9). The results are presented in Table 5.
For Class II surrounding rock conditions, the total carbon emissions for one operational cycle of tunnel excavation amounted to 1895.63 kgCO2e. Given that the average excavation length per work cycle is 2.5 m, the carbon emission intensity was calculated as 758.25 kgCO2e/m, indicating that each linear meter of tunnel excavation generates approximately 758.25 kgCO2e in emissions.
Based on this methodology, process decomposition, discrete event modeling, and statistical analysis of time distribution functions are performed for primary support and secondary lining construction. Similarly, carbon emissions for primary support and secondary lining construction within the mechanical construction stage are calculated, with results shown in Table 6 and Table 7. For tunnel sections with Class II surrounding rock, the carbon emission intensity for primary support is calculated as 303.55 kgCO2e/m, while that for secondary lining is 86.78 kgCO2e/m.
Figure 9 illustrates the distribution of carbon emission intensity during the mechanical construction stage of a tunnel with Class II surrounding rock, along with the emission contributions of different equipment types. The tunnel excavation stage is the primary source of emissions, accounting for 66.0% of total carbon emission intensity, followed by primary support at 26.4%, and secondary lining at only 7.6%. Among the equipment, dump trucks exhibit the highest carbon emission intensity, reaching 286.74 kgCO2e/m, primarily due to their extended operating times and high diesel consumption. This is followed by ventilation systems (214.97 kgCO2e/m), wheel loader (158.22 kgCO2e/m), and drilling equipment (106.64 kgCO2e/m). As core equipment used in excavation and support stages, these machines should be prioritized in emission reduction strategies. The calculated carbon emission intensity for this stage is 1148.58 kgCO2e/m of tunnel constructed.

3.2.3. Summary of Carbon Emission Results

In summary, the carbon emissions associated with the pre-construction and mechanical construction stages of the Class II surrounding rock headrace tunnel are presented in Table 8. The calculated carbon emission intensity for this tunnel section is 8405.82 kgCO2e/m.

3.3. DES Model and Carbon Emission Results Validation

3.3.1. Model Validation

The validity of the DES model is verified by analyzing its output and comparing the simulated working times of various equipment with actual measurements [40]. During the tunnel excavation stage, dump trucks account for the highest proportion of energy consumption. Therefore, this section uses dump truck operations as a representative example to compare the average activity durations from field monitoring with the results generated by the DES model. The comparison results are presented in Table 9.
These results indicate that the DES method can accurately simulate the operational durations of dump truck activities. The differences between the simulation outputs and the field monitoring data were all within 3.1%, with the deviation for idle time being 2.2%. In addition, a comparative analysis was conducted for the average operating times of equipment used during the primary support and secondary lining stages. The differences between the measured values and the DES simulation results in these stages were all within 5%. These findings confirm that the constructed DES model can reliably reflect the actual working conditions of heavy construction equipment.

3.3.2. Carbon Emission Results Validation

In tunnel construction carbon accounting, the LCA method typically relies on the Quota of Hourly Costs for Hydropower Construction Machinery (Trial Version) [35], which converts bill of quantities data into corresponding machinery work shifts to estimate energy consumption. Carbon emissions are then calculated using emission factor methods [23,24]. To compare the accuracy of different approaches, this study once again takes a single dump truck operation cycle as an example. The carbon emissions calculated from measured data, DES simulation, and the LCA method are presented in Table 10.
The results show that the deviation between the DES and the measured data is 1.3%, whereas the deviation between the LCA and the measured data reaches 19.5%. This discrepancy is primarily attributed to differences in data sources between the two methods. LCA relies on standardized or historical statistical data, often using averaged or generalized values that have been aggregated and simplified. It typically calculates emissions based on the total operating time of equipment, which makes it difficult to reflect real-time operational conditions [28,40]. However, LCA has notable advantages in terms of data structure and methodological maturity, making it well-suited for carbon footprint assessments at a macro level. In contrast, DES provides higher accuracy and dynamic adaptability in the calculation of carbon emissions during construction processes. It is particularly effective for analyzing carbon emissions at the micro level, such as individual construction activities. Nevertheless, DES modeling is complex, requiring a detailed understanding of construction workflows and high-quality input data, which limits its applicability in large-scale or system-wide emission assessments. Therefore, the development of DES-based carbon emission models can help address the limitations of LCA in capturing fine-grained construction dynamics and offer a more robust pathway for improving the scientific rigor of carbon accounting in engineering projects.

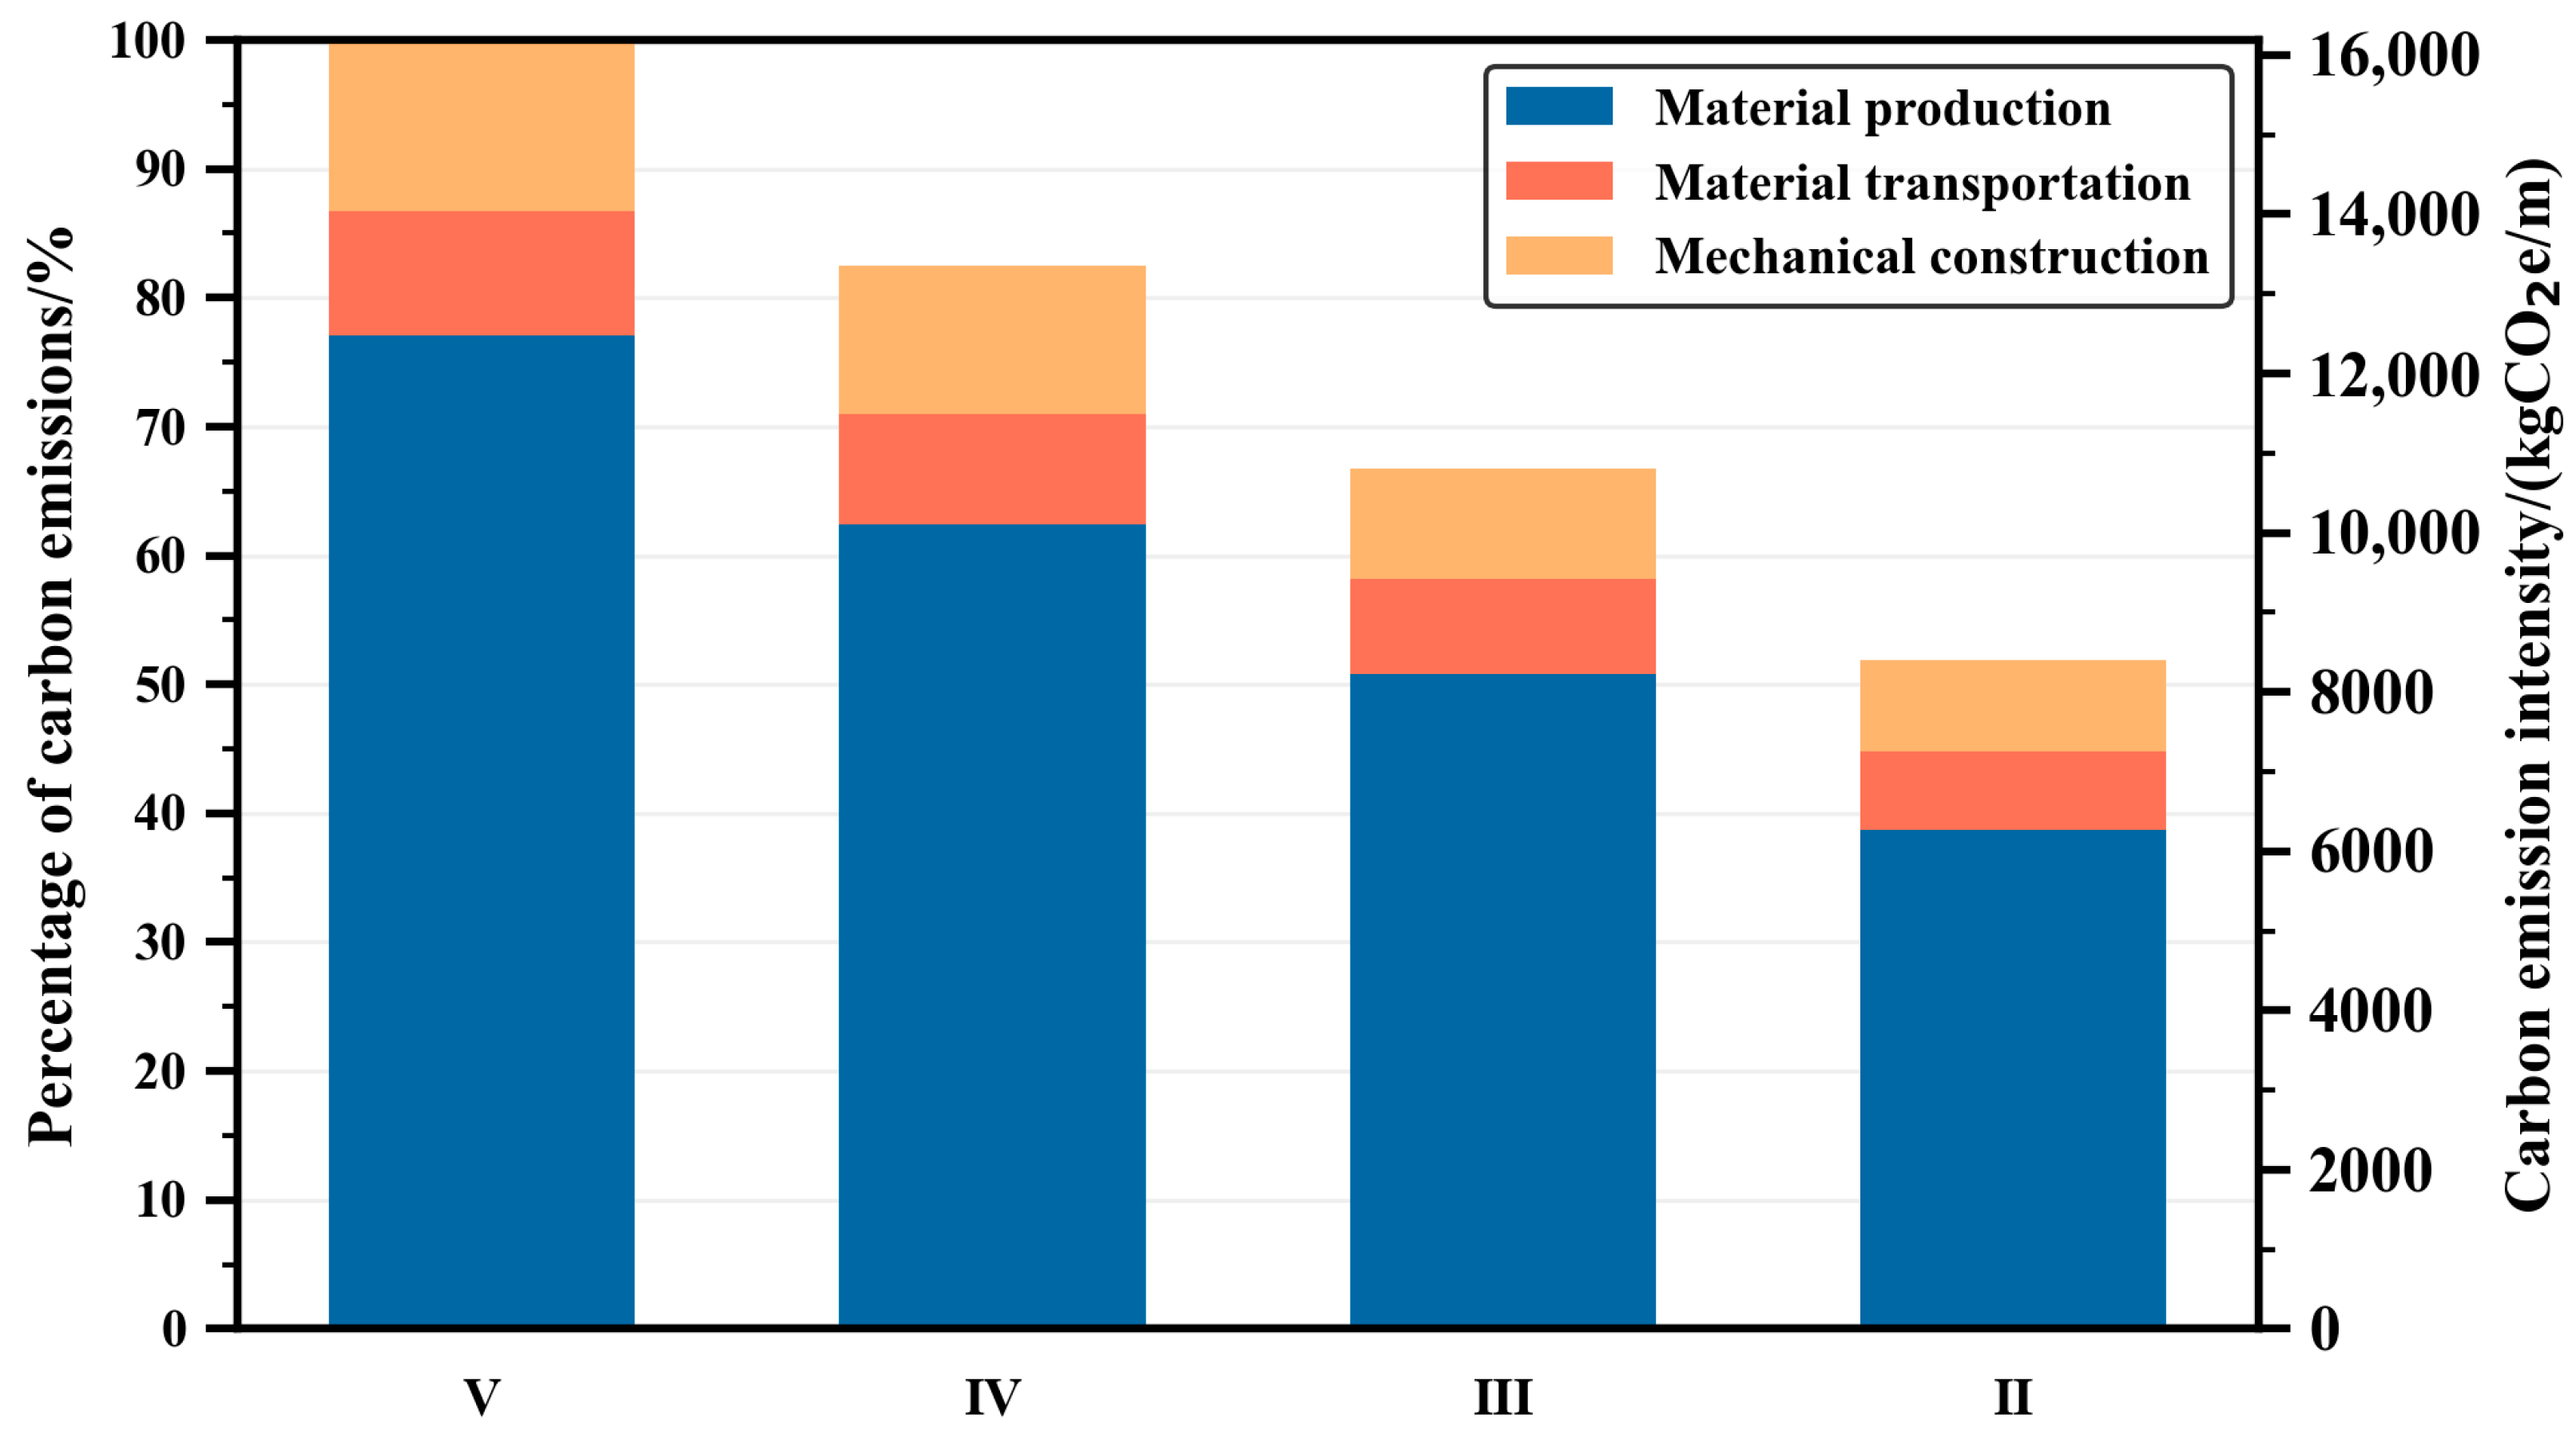
3.4. Carbon Emission Comparison with Different Surrounding Rock Grades

The previous section presented the carbon emission estimation model developed in this study and demonstrated its effectiveness in quantifying emissions during the construction phase of the headrace tunnel under Class II surrounding rock conditions. Building upon this model, carbon emissions were further assessed for tunnel sections located in Class III, Class IV, and Class V surrounding rock conditions. The corresponding results are summarized in Table 11.
As shown in the table, the total carbon emission intensity during the construction phase exhibits a clear upward trend with the deterioration of surrounding rock quality. Specifically, the carbon emission intensities are 8405.82 kgCO2e/m for Class II, 10,799.14 kgCO2e/m for Class III, 13,352.89 kgCO2e/m for Class IV, and 16,189.30 kgCO2e/m for Class V. These findings indicate a clear correlation between geological conditions of the rock mass and the level of carbon emissions generated during tunnel construction. Moreover, the observed trend is consistent with previous research findings [1,21,23], which further supports the validity of the proposed carbon emission model for tunnel construction projects under different geological conditions.
Figure 10 compares the carbon emission intensities of headrace tunnel construction under different surrounding rock classes during the construction phase. The results indicate that the emission intensity associated with Class V rock is 1.20 times higher than that of Class IV, 1.50 times higher than that of Class III, and 1.93 times higher than that of Class II. Regarding the carbon emissions across different construction stages, material production consistently represents the largest proportion, accounting for 74.6% to 77.1% of total emissions. In contrast, material transportation and mechanical construction contribute comparably, each comprising approximately 10% of the total.
According to the above results, surrounding rock conditions have a significant impact on carbon emission intensity across different stages of tunnel construction. As rock quality deteriorates, particularly under poor conditions such as Class V, the support system of the water conveyance tunnel must be dynamically adjusted to ensure structural stability in accordance with actual construction organization requirements. Compared to Class II and III surrounding rocks, these adjustments typically include doubling the thickness of shotcrete, halving the spacing of rock bolts, and introducing steel supports. As a result, the consumption of support materials increases markedly, accompanied by higher energy demand for mechanical operations. These factors lead to a substantial rise in carbon emissions, particularly during the material production and construction stages.

3.5. Total Carbon Emissions of the Water Conveyance Tunnel System

The total length of the water conveyance system tunnels between the upper and lower reservoir inlets/outlets of the Fumin Pumped Storage Power Station is 2950 m. This includes a 2180 m headrace tunnel with a diameter of 6m and a 770 m tailrace tunnel with a diameter of 7.5 m. The carbon emission intensity for headrace tunnel construction has already been calculated. Using the proposed emission quantification model, the carbon emission intensity for tailrace tunnel construction is obtained and summarized in Table 12.
Based on the BIM model and geological survey data, the lengths of different surrounding rock sections along the water conveyance tunnels are determined. Using the carbon emission intensities for both the headrace and tailrace tunnels construction, the total carbon emissions during the construction phase of the entire water conveyance system are calculated, as summarized in Table 13. Overall, the total tunnel length is 2950 m, with Class III surrounding rock accounting for the largest proportion at 46.39%. The total carbon emissions during the construction phase amounted to 40,019.64 tCO2e, with an average emission intensity of 13,565.98 kgCO2e/m.
Figure 11 illustrates the key construction elements and the spatial distribution of carbon emission intensity across different tunnel segments of the water conveyance tunnel system during the construction phase. Influenced by factors such as tunnel geometry, excavation method, and surrounding rock conditions, the emission intensity varies considerably along the alignment.
The inlet and outlet sections near the upper and lower reservoirs are mainly composed of Class IV and V surrounding rocks, which are closer to the surface and exhibit poor geological stability. Compared to Class III sections, these areas require significantly enhanced support measures, including nearly doubling the shotcrete thickness and halving the spacing of rock bolts, along with the addition of steel supports. In terms of geometry, the tailrace tunnel features a larger tunnel diameter of 7.5 m, compared to 6 m in the headrace tunnel. The increased cross-sectional area leads to greater excavation volumes and higher demand for support materials. Combined with the use of the benching excavation method, which reduces construction efficiency and extends equipment operation time, these factors significantly amplify carbon emission intensity, particularly in the tailrace tunnel.
In contrast, deeper tunnel segments pass through more stable Class III and II rocks and adopt full-face excavation with reduced support requirements. These conditions improve construction efficiency and reduce material and energy consumption, resulting in noticeably lower carbon emissions per unit length.
Quantitatively, the headrace tunnel construction contributes a total of 26,084.01 tCO2e, with an average carbon emission intensity of 11,965.14 kgCO2e/m. While the tailrace tunnel construction generates 13,935.63 tCO2e at a higher average intensity of 18,098.22 kgCO2e/m. Among all sections, the lower reservoir inlet and outlet section exhibits the highest carbon emission intensity, reaching 22,933.62 kgCO2e/m. These variations in carbon emission intensity are primarily driven by differences in tunnel length, cross-sectional size, surrounding rock conditions, and excavation methods. Targeted mitigation strategies, such as adopting energy-efficient machinery and optimizing alignment to avoid geologically unfavorable zones, can effectively reduce overall carbon emissions.

4. Discussion

4.1. Uncertainty Analysis in Carbon Emission Assessment

It is undeniable that, during the mechanical construction stage, the scheduling of on-site personnel and the operation durations of machinery are subject to considerable randomness. In addition, energy consumption parameters and carbon emission factors originate from diverse sources, and different calculation methods may yield varying results. These factors contribute to the uncertainty in carbon emission estimations.
To address this issue, future research should focus on improving the accuracy of carbon emission factors for mechanical construction. By integrating field monitoring data with big data analytics, a multidimensional database can be developed, including equipment type, operation time, energy consumption, and CO2 concentration. This would facilitate the establishment of engineering-specific energy consumption profiles and localized emission factor systems, providing a more reliable data foundation for carbon footprint assessments in tunnel projects.

4.2. Carbon Reduction Strategies in Tunnel Construction

Currently, there is a growing emphasis on energy conservation and emission reduction in the field of hydropower development. Systematic research on carbon emissions from hydraulic engineering and the advancement of carbon mitigation strategies have become key industry trends. This study calculated the carbon emission intensity during the construction phase of the water conveyance tunnels at the Fumin Pumped Storage Power Station. Compared to domestic and international benchmarks for tunnel construction, the emission intensity remains relatively high [1,2,23]. Based on the emission characteristics and project-specific conditions, the following carbon reduction measures are proposed for the Fumin Tunnel Project:
(1)
Use of Energy-Efficient Equipment and Regular Maintenance
In this case study, equipment such as dump trucks and ventilation systems contributes significantly to carbon emissions during tunnel construction. Their energy consumption levels directly influence the overall effectiveness of emission reduction efforts. The adoption of high-efficiency and stable energy-saving equipment can effectively lower carbon emissions during the construction stage. For example, the General Specification for Building Energy Conservation and Renewable Energy Utilization recommends the use of variable-frequency ventilators in tunnel ventilation systems. These systems can dynamically adjust airflow rates to meet ventilation requirements while minimizing energy consumption. Moreover, establishing a sound equipment operation and maintenance management system and performing routine maintenance can reduce abnormal energy consumption caused by equipment aging or malfunction, thereby further supporting emission reduction objectives.
(2)
Optimize excavation zones and construction paths
In the current project, Class IV and V surrounding rock account for approximately 40% of the total length of the water conveyance tunnels. As previously analyzed, the carbon emission intensity during excavation in Class II rock is 1.6 to 1.9 times lower than that in Class IV and V rock. Quantitative analysis indicates that reducing the length of Class V tunnel segments by 10% could lower the project’s total carbon emissions by approximately 3.3%. Therefore, by optimizing construction paths to avoid tunnel sections with poor geological conditions, it is possible to significantly reduce carbon emissions during the construction phase while simultaneously improving construction efficiency and operational safety.
(3)
Incorporating intelligent technologies for real-time carbon monitoring
Currently, China’s pursuit of its “dual-carbon” targets faces several challenges, including limited data transparency, inaccurate carbon measurement, and difficulties in regulatory oversight. As carbon neutrality efforts continue to advance, policy documents increasingly emphasize the importance of “monitoring”, “intelligence”, and “digitalization”, highlighting the growing integration of advanced information technologies with carbon management in engineering projects. By deploying intelligent carbon monitoring infrastructure, key data such as CO2 concentration and equipment energy consumption can be collected in real time and integrated into digital twin platforms. This enables the development of dynamic carbon accounting models. Leveraging artificial intelligence technologies, such systems can support carbon emission trend forecasting, emission profile analysis, and the intelligent planning of emission reduction strategies. Ultimately, this facilitates real-time carbon monitoring and supports the dynamic optimization of energy use structures.

4.3. Limitations of Calculation Results

The carbon emission results presented in this study are based on the specific construction conditions of the Fumin Pumped Storage Power Station and should not be directly applied to other tunnel projects without adaptation. However, the carbon accounting model and analytical approach developed in this research possess a certain degree of generalizability and may serve as a methodological reference for similar projects. In addition, the study reveals a clear trend of increasing carbon emissions associated with the deterioration of surrounding rock conditions, as well as proposes targeted emission reduction measures. These findings offer practical insights that may benefit the planning and management of carbon emissions in related engineering contexts.

5. Conclusions

This study proposes an integrated carbon emission calculation method that combines LCA with DES, aiming to overcome the limitations of the traditional LCA method in accurately quantifying carbon emissions during the mechanical construction stage. The DES component enables dynamic modeling of construction processes, capturing equipment operation sequences and time-dependent variability to improve estimation accuracy. The Fumin Pumped Storage Power Project serves as a case study to apply the proposed method, compare carbon emissions under different surrounding rock conditions, and validate the reliability of the DES-based calculations. Furthermore, the study analyzes emission characteristics and explores potential mitigation strategies. The main conclusions are as follows:
(1)
A hybrid carbon emission calculation model is developed for the construction phase of pumped storage tunnel projects by integrating the carbon emission factor method with a combined LCA-DES model. The proposed method incorporates the dynamic characteristics of construction activities through DES. This integration enables more precise estimation of carbon emissions across varying geological conditions, particularly during the mechanical construction stage.
(2)
Based on the Fumin Pumped Storage Power Project, carbon emissions during the construction phase are evaluated under different rock conditions using the DES method. Validation against monitoring data revealed a 1.3% deviation in dump truck operations, while the difference using LCA reached 19.5%, demonstrating the superior accuracy of DES. The results indicate that emission intensity increases as rock quality deteriorates, from 8405.82 kgCO2e/m for Class II to 16,189.30 kgCO2e/m for Class V, primarily due to higher energy and equipment demands. The total carbon emissions for the water conveyance system during the construction phase are 40,019.64 tCO2e.
(3)
Carbon emissions from the material production stage contribute approximately 75% of the total emissions during tunnel construction and represent the most influential component in determining overall carbon output. Carbon emission reduction can be achieved through the adoption of energy-efficient equipment, regular maintenance practices, optimized excavation planning and routing, and the integration of smart technologies for real-time carbon monitoring and control.
(4)
Admittedly, this study is subject to operational variability and uncertainty in key parameters, which may result in deviations in carbon emission estimates. The generalizability of the findings is also limited. Future research could integrate construction-site big data analytics to establish project-specific equipment energy parameters and localized emission factors, thereby enhancing the precision of carbon emission estimates.

Author Contributions

Conceptualization, Y.Z., S.W. and H.C.; methodology, Y.Z.; software, T.Z. and J.L.; formal analysis, Z.D.; investigation, Y.Z.; data curation, T.Z.; writing—original draft preparation, T.Z., Z.D. and J.L.; writing—review and editing, Y.Z. and S.W.; supervision, Y.Z.; project administration, S.W. All authors have read and agreed to the published version of the manuscript.

Funding

This research was funded by the National Natural Science Foundation of China, grant number 52334004 and the Project of Yunnan Provincial Department of Science and Technology, grant number 202305AK340003.

Data Availability Statement

The original contributions presented in this study are included in the article. Further inquiries can be directed to the corresponding author.

Conflicts of Interest

Author Yong Zhang was employed by the company Power China Kunming Engineering Corporation Limited. The remaining authors declare that the research was conducted in the absence of any commercial or financial relationships that could be construed as a potential conflict of interest.

Abbreviations

The following abbreviations are used in this manuscript:
GHGGreenhouse gas
LCALife cycle assessment
DESDiscrete event simulation
RMRRock mass rating

References

  1. Guo, Y.L.; Sun, W.H.; Xu, H.W.; He, W.; Chen, Z.; Guo, C. Comparison between Shield Method and Drill and Blast Method Regarding Carbon Emission Intensity in Subway Tunnel Construction. Mod. Tunn. Technol. 2023, 60, 14–23+64. [Google Scholar]
  2. Zeng, H.R.; Sun, W.H.; He, W.; Guo, Y.L.; Guo, C. Study on the Carbon Emission Prediction Model for Railway Tunnel Construction Based on Machine Learning. Mod. Tunn. Technol. 2023, 60, 29–39. [Google Scholar]
  3. Evro, S.; Oni, B.A.; Tomomewo, O.S. Global Strategies for a Low-carbon Future: Lessons from the US, China, and EU’s Pursuit of Carbon Neutrality. J. Clean. Prod. 2024, 461, 142635. [Google Scholar] [CrossRef]
  4. Chen, L.Y.; Gao, X.; Hua, C.X.; Gao, S.T.; Yue, A.B. Evolutionary Process of Promoting Green Building Technologies Adoption in China: A Perspective of Government. J. Clean. Prod. 2021, 279, 123607. [Google Scholar] [CrossRef]
  5. Zhu, Q.R.; Leibowicz, B.D.; Busby, J.W.; Shidore, S.; Adelman, D.E.; Olmstead, S.M. Enhancing Policy Realism in Energy System Optimization Models: Politically Feasible Decarbonization Pathways for the United States. Energy Policy 2022, 161, 112754. [Google Scholar] [CrossRef]
  6. Bahn-Walkowiak, B.; Magrini, C.; Berg, H.; Gözet, B.; O’Brien, M.; Arjomandi, T.; Doranova, A.; Gallou, M.T.; Gionfra, S.; Graf, V.; et al. Eco-Innovation and Digitalisation: Case Studies, Environmental and Policy Lessons from EU Member States for the EU Green Deal and the Circular Economy: EIO Biennial Report 2020; European Commission: Brussels, Belgium, 2021; pp. 1–99. [Google Scholar]
  7. Xi Jinping’s Speech at the General Debate of the Seventy-Fifth United Nations General Assembly. Available online: https://www.xinhuanet.com/politics/leaders/2020-09/22/c_1126527652.htm (accessed on 20 February 2025).
  8. Şentürk, Z. The Energy Charter Treaty and the European Green Deal: A Critical Analysis Under EU and International Trade Law. In The EU Green Deal and Its Implementation, 1st ed.; Nomos Verlagsgesellschaft: Baden, Germany, 2023; pp. 157–184. [Google Scholar]
  9. Joseph, V.R.; Mustaffa, N.K. Carbon Emissions Management in Construction Operations: A Systematic Review. Eng. Constr. Archit. Manag. 2023, 30, 1271–1299. [Google Scholar] [CrossRef]
  10. De La Peña, L.; Guo, R.; Cao, X.J.; Ni, X.J.; Zhang, W. Accelerating the energy transition to achieve carbon neutrality. Resour. Conserv. Recycl. 2022, 177, 105957. [Google Scholar] [CrossRef]
  11. Amin, A.; Altinoz, B.; Dogan, E. Analyzing the Determinants of Carbon Emissions from Transportation in European Countries: The Role of Renewable Energy and Urbanization. Clean Technol. Environ. Policy 2020, 22, 1725–1734. [Google Scholar] [CrossRef]
  12. Yang, R.P.; Fan, Z.T. Application and Prospects of Pumped-storage Power Stations in New Power System. Sino-Glob. Energy 2023, 28, 12–17. [Google Scholar]
  13. China’s Pumped-Storage Hydropower Capacity Ranks First in the World. Available online: https://digitalpaper.stdaily.com/http_www.kjrb.com/kjrb/html/2024-09/10/content_577419.htm (accessed on 20 February 2025).
  14. Zhang, Y.J.; Jiang, L.; Shi, W. Exploring the Growth-adjusted Energy-emission Efficiency of Transportation Industry in China. Energy Econ. 2020, 90, 104873. [Google Scholar] [CrossRef]
  15. Li, Y.L.; Xie, P.P.; Yang, Y.; Yang, Y.G.; Lu, Q.Y. Life Cycle Carbon Emission Characteristics of Pumped Storage and New Energy Storage. In Proceedings of the IET Conference Proceedings CP910, Stevenage, UK, 14–15 December 2024. [Google Scholar]
  16. Rodríguez, R.; Pérez, F. Carbon Foot Print Evaluation in Tunneling Construction Using Conventional Methods. Tunn. Undergr. Space Technol. 2021, 108, 103704. [Google Scholar] [CrossRef]
  17. Pritchard, J.A.; Preston, J. Understanding the Contribution of Tunnels to the Overall Energy Consumption of and Carbon Emissions from a Railway. Transp. Res. Part D Transp. Environ. 2018, 65, 551–563. [Google Scholar] [CrossRef]
  18. Jarast, P.; Bakhshi, M. Carbon footprint emissions of different tunneling construction methods. In Expanding Underground-Knowledge and Passion to Make a Positive Impact on the World, 1st ed.; CRC Press: Boca Raton, FL, USA, 2023; pp. 65–73. [Google Scholar]
  19. Taylor, R.M.; Chanudet, V.; Drommi, J.L.; Aelbrecht, D. Assessing the carbon footprint of pumped storage hydropower—A case study. In Role of Dams and Reservoirs in a Successful Energy Transition, 1st ed.; CRC Press: Boca Raton, FL, USA, 2023; pp. 590–599. [Google Scholar]
  20. Lee, J.; Shim, J.A.; Kim, K.J. Analysis of Environmental Load by Work Classification for NATM Tunnels. KSCE J. Civ. Environ. Eng. Res. 2016, 36, 307–315. [Google Scholar]
  21. Xu, J.F.; Guo, C.; Chen, X.F.; Zhang, Z.H.; Yang, L.; Wang, M.N.; Yang, K. Emission Transition of Greenhouse Gases with the Surrounding Rock Weakened—A Case Study of Tunnel Construction. J. Clean. Prod. 2019, 209, 169–179. [Google Scholar] [CrossRef]
  22. Damián, R.; Zamorano, C.I. Environmental Impact Assessment of High-speed Railway Tunnel Construction: A Case Study for Five Different Rock Mass Rating Classes. Transp. Geotech. 2022, 36, 100817. [Google Scholar] [CrossRef]
  23. Li, J.H.; Xi, M.X.; Shen, Y.; Lu, A.; Zhu, H.H. Calculation and Composition Assessment of the Carbon Emission in the Construction Phase of Highway Tunnels Based on SimaPro. Mod. Tunn. Technol. 2023, 60, 20–28. [Google Scholar]
  24. Wu, H.Y.; Zhou, W.W.; Bao, Z.K.; Long, W.J.; Chen, K.Y.; Liu, K. Life Cycle Assessment of Carbon Emissions for Cross-sea Tunnel: A Case Study of Shenzhen-Zhongshan Bridge and Tunnel in China. Case Stud. Constr. Mater. 2024, 21, e03502. [Google Scholar] [CrossRef]
  25. Huang, Y.Q.; Liu, Y.R.; Xu, W.B.; Li, J.F. Life cycle carbon emissions of water reservoir and hydroelectric projects: A case study of the Quanmutang project. J. Tsinghua Univ. (Sci. Technol.) 2022, 62, 1366–1373. [Google Scholar]
  26. Xu, S.M.; Zhang, G.; Wang, F.; Pu, L. Carbon Emission Reduction Calculation Method for Pumped Storage Based on CCER Rules. Electr. Power 2024, 57, 175–182. [Google Scholar]
  27. Li, Z.; Du, H.L.; Xiao, Y.; Guo, J.S. Carbon footprints of two large hydro-projects in China: Life-cycle assessment according to ISO/TS 14067. Renew. Energy 2017, 114, 534–546. [Google Scholar] [CrossRef]
  28. Yang, T.; Dong, Y.; Tang, B. Developing a dynamic life cycle assessment framework for buildings through integrating building information modeling and building energy modeling program. Sci. Total Environ. 2024, 946, 174284. [Google Scholar] [CrossRef] [PubMed]
  29. Martinez, J.C. Methodology for Conducting Discrete Event Simulation Studies in Construction Engineering and Management. J. Constr. Eng. Manag. 2010, 136, 3–16. [Google Scholar] [CrossRef]
  30. AbouRizk, S.M.; Hajjar, D. A Framework for Applying Simulation in Construction. Can. J. Civ. Eng. 1998, 25, 604–617. [Google Scholar] [CrossRef]
  31. Pena-Mora, F.; Han, S.W.; Lee, S.H.; Park, M. Strategic-Operational Construction Management: Hybrid System Dynamics and Discrete Event Approach. J. Constr. Eng. Manag. 2008, 9, 701–710. [Google Scholar] [CrossRef]
  32. González, V.; Echaveguren, T. Exploring the Environmental Modeling of Road Construction Operations Using Discrete-event Simulation. Autom. Constr. 2012, 24, 100–110. [Google Scholar] [CrossRef]
  33. Lewis, P.; Leming, M.; Rasdorf, W. Impact of Engine Idling on Fuel Use and CO2 Emissions of Nonroad Diesel Construction Equipment. J. Manag. Eng. 2011, 28, 31–38. [Google Scholar] [CrossRef]
  34. Liu, C.N. Research on Evaluating Methods for Carbon Emissions of Concrete Dams Based on Life Cycle Assessment. Master’s Thesis, Tsinghua University, Beijing, China, 2013. [Google Scholar]
  35. China Renewable Energy Engineering Institute; China Electricity Council. Quota of Hourly Costs for Hydropower Construction Machinery (Trial Version); China Electric Power Press: Beijing, China, 2024. [Google Scholar]
  36. GB/T 51366–2019; Standard for Calculation of Building Carbon Emission. China Construction Industry Press: Beijing, China, 2019.
  37. Lai, W.; Qin, J.; Pan, Y.; Zhang, Y. Efficient Online Calculation and Reduction Measures for Metro Foundation Pit Carbon Emission. J. Shanghai Jiao Tong Univ. 2025, 1, 1–21. [Google Scholar]
  38. Hou, G.Y.; Ma, X.Y.; Yang, Z.H. Calculation and Analysis of Carbon Emissions in the Whole Life Cycle of Pumped Storage Power Stations. J. Environ. Sci. 2023, 43, 326–335. [Google Scholar]
  39. Miller, L.H. Table of Percentage Points of Kolmogorov Statistics. J. Am. Stat. Assoc. 1956, 51, 111–121. [Google Scholar] [CrossRef]
  40. Liu, C.; Wu, Q.; Tang, W. Carbon Emission Evaluation of Heavy Equipment on Dam Construction Site Using Discrete Event Simulation. IOP Conf. Ser. Earth Environ. Sci. 2021, 675, 012027. [Google Scholar] [CrossRef]
Figure 1. Schematic diagram of carbon emission calculation for tunnel construction in pumped storage power station.
Buildings 15 01846 g001
Figure 2. Calculation flow of carbon emissions during the mechanical construction stage based on DES.
Buildings 15 01846 g002
Figure 3. Steps of discrete event modeling for tunnel construction.
Buildings 15 01846 g003
Figure 4. Three-dimensional layout of Fumin Pumped Storage Power Station.
Buildings 15 01846 g004
Figure 5. Schematic of on-site construction process of tunnel and the main equipment.
Buildings 15 01846 g005
Figure 6. Construction process flow diagram of each link of tunnel excavation.
Buildings 15 01846 g006
Figure 7. Discrete event model for cave excavation.
Buildings 15 01846 g007
Figure 8. Fitting of the time distribution function for the activity distribution of some construction events of the cave excavation: (a) drilling; (b) explosive placement; (c) ventilation dispersion.
Buildings 15 01846 g008
Figure 9. Comparison of carbon emission intensity and equipment-specific emissions during tunnel construction in class II surrounding rock.
Buildings 15 01846 g009
Figure 10. Comparison of construction carbon emission intensity of headrace tunnel under different rock grades.
Buildings 15 01846 g010
Figure 11. Schematic diagram of key construction-related elements from tunnels in various segments of the water conveyance system.
Buildings 15 01846 g011
Table 1. Carbon emission factors of energy sources.
Energy SourceCarbon Emission FactorUnitReference
Electricity0.80kgCO2e/kWh[36,37]
Diesel3.59kgCO2e/kg[25,36,38]
Gasoline3.50kgCO2e/kg[25,36,38]
Table 2. Carbon emission factors of materials.
MaterialCarbon Emission FactorUnitReference
Plain steel plate2.43kgCO2e/kg[1,36]
Galvanized steel plate2.60kgCO2e/kg[1,36]
Small and medium steel products (rebar, steel wire)2.31kgCO2e/kg[1,36]
Ammonium nitrate explosive0.263kgCO2e/kg[36]
C20 concrete237.32kgCO2e/m3[1,36]
C25 concrete266.18kgCO2e/m3[1,36]
C30 concrete294.81kgCO2e/m3[1,36]
Cement mortar400.94kgCO2e/m3[1,36]
Sand6.60kgCO2e/t[1,36]
Gravel4.40kgCO2e/t[1,36]
Table 3. Pre-construction carbon emission intensity for Class II surrounding rock.
Substructure ItemMaterial Consumption per MeterMaterial ProductionMaterial Transportation
Carbon Emission Factor (kgCO2e/kg or m3)Carbon Emissions Intensity
(kgCO2e/m)
Average Transport Distance (km)Diesel Consumption (kg)Carbon Emissions Intensity
(kgCO2e/m)
Ammonium nitrate explosive installation14.13 kg0.2633.72500.000.321.14
Shotcrete support6.37 m3237.321511.7340.0078.07280.28
Rock bolt support103.99 kg2.31240.21500.002.358.42
Steel mesh reinforcement169.22 kg2.31390.90500.003.8213.71
Concrete pouring (crown arch)9.83 m3266.182616.5540.00120.48432.52
Steel reinforcement (crown arch)3.45 kg2.317.97500.000.080.28
Concrete pouring (side wall)5.62 m3266.181495.9340.0068.88247.28
Steel reinforcement (side wall)2.76 kg2.316.38500.000.060.22
Total--6273.39--983.85
Table 4. Temporal distribution of activities of construction events in cave excavation.
Event ActivitiesTime DistributionParametersK–S
Rock drill drillingBeta5.8598, 7.1, 7.68910.093
Explosive placementLogistic0.01623, 0.4660.161
VentilationNormal0.04606, 0.217670.135
Loading of slagLognormal0.10889, 1.2315, 00.193
Transportation of slagNormal0.11967, 0.023560.148
Unloading of slagUniform0.23808, 0.338590.150
Table 5. Energy consumption and carbon emissions of mechanical equipment for cave excavation.
Mechanical and EquipmentEnergy Consumption per Shift
(kg or kWh/8 h)
Quantity of EquipmentShifts per UnitTotal Diesel Consumption (kg)Total Electricity Consumption (kWh)Carbon Emissions
(kgCO2e)
Rock drill22.65 kWh81.150\208.38201.05
Wheel loader160 kg30.12560\258.48
Ventilator528 kWh20.563\557.04537.43
Vertical claw rock loader50.40 kg/110 kWh10.56328.3561.90181.82
Dump truck128 kg40.325166.4\716.85
Table 6. Energy consumption and carbon emissions of mechanical equipment for primary support.
Mechanical and EquipmentEnergy Consumption per Shift
(kg or kWh/8 h)
Quantity of EquipmentShifts per UnitTotal Diesel Consumption (kg)Total Electricity Consumption (kWh)Carbon Emissions
(kgCO2e)
Concrete mixer truck96 kg20.28855.20\237.80
Concrete wet spraying machine243.2 kWh20.563\273.60263.97
Wheel loader160 kg10.16326.00\112.01
Flatbed truck99.6 kg20.06312.45\53.63
Rock drill22.65 kWh80.375\67.9565.56
Grouting pump143.2 kWh10.188\26.8525.90
Table 7. Energy consumption and carbon emissions of mechanical equipment for secondary lining.
Mechanical and EquipmentEnergy Consumption per Shift
(kg or kWh/8 h)
Quantity of EquipmentShifts per UnitTotal Diesel Consumption (kg)Total Electricity Consumption (kWh)Carbon Emissions
(kgCO2e)
Rebar bending machine48 kWh20.291\27.9626.98
Flatbed truck99.6 kg20.05110.11\9.75
Wheel loader160 kg10.163\26.0025.08
Welding machine85.52 kWh10.509\43.5141.98
Concrete mixer truck96 kg20.16531.68\30.56
Concrete pump216 kWh10.386\83.4380.49
Concrete vibrator16 kWh20.068\2.192.11
Table 8. Carbon emission intensity for Class II surrounding rock tunnel construction.
Substructure ItemMaterial Consumption per MeterTotal Carbon Emissions Intensity
(kgCO2e/m)
Material
Production
Material TransportationMechanical Construction
Carbon Emission Intensity (kgCO2e/m)Proportion (%)Carbon Emission Intensity (kgCO2e/m)Proportion (%)Carbon Emission Intensity (kgCO2e/m)Proportion (%)
Ammonium nitrate explosive installation14.13 kg205.913.721.811.140.55201.0597.64
Rock excavation28.26 m3557.200.000.000.000.00557.20100.00
Shotcrete support6.37 m31992.721511.7376.86280.2814.07200.7110.07
Rock bolt support103.99 kg320.91240.2174.858.422.6372.2822.52
Steel mesh reinforcement169.22 kg435.17390.9089.8313.713.1530.567.02
Concrete pouring (crown arch)9.83 m33075.372616.5585.08432.5214.0626.300.86
Steel reinforcement (crown arch)3.45 kg26.957.9729.570.281.0418.7069.39
Concrete pouring (side wall)5.62 m31762.171495.9384.89247.2814.0318.961.08
Steel reinforcement (side wall)2.76 kg29.426.3821.680.220.7522.8277.57
Total8405.826273.3974.63983.8511.711148.5813.66
Table 9. Comparison of average operating times for different dump truck activities.
ActivitiesMonitoring Results (min)DES Model Results (min)Differences
(%)
Loading22.122.83.1
Transporting53.855.22.5
Unloading16.917.42.9
Returning61.460.61.3
Idling30.531.22.2
Table 10. Comparison of carbon emissions for a single operation cycle using different methods.
MethodCarbon Emissions
(kgCO2e)
Differences
(%)
Monitoring results707.280
DES model results716.851.3
LCA results845.5219.5
Table 11. Carbon emission intensity of headrace tunnel construction under different rock grades.
RMR ClassConstruction StageCarbon Emission Intensity (kgCO2e/m)Proportion (%)
IIMaterial production6273.3874.63
Material transportation983.8611.71
Mechanical construction1148.5813.66
Total8405.82100.00
IIIMaterial production8225.1076.16
Material transportation1191.5611.04
Mechanical construction1382.4812.80
Total10,799.14100.00
IVMaterial production10,107.1175.69
Material transportation1388.3410.40
Mechanical construction1857.4413.91
Total13,352.89100.00
VMaterial production12,477.0677.07
Material transportation1563.249.66
Mechanical construction2149.0013.27
Total16,189.30100.00
Table 12. Carbon emission intensity of tailrace tunnel construction under different rock grades.
RMR ClassCarbon Intensity (kgCO2e/m)
III14,301.33
IV19,009.03
V24,615.59
Table 13. Length of construction sections of water conveyance system with different surrounding rock grades and carbon emissions.
RMR ClassLength of Drilling and Blasting Section (m)Carbon Emissions
(tCO2e)
II189.551593.34
III1590.5418,566.66
IV623.039251.57
V546.8810,608.07
Total2950.0040,019.64
Disclaimer/Publisher’s Note: The statements, opinions and data contained in all publications are solely those of the individual author(s) and contributor(s) and not of MDPI and/or the editor(s). MDPI and/or the editor(s) disclaim responsibility for any injury to people or property resulting from any ideas, methods, instructions or products referred to in the content.

