Article

Research on a Damage Assessment Method for Concrete Components Based on Material Damage

1
College of Civil Engineering, Tongji University, Shanghai 200092, China
2
CITIC General Institute of Architectural Design and Research Co., Ltd., Wuhan 430014, China
*
Authors to whom correspondence should be addressed.
Buildings 2025, 15(11), 1844; https://doi.org/10.3390/buildings15111844
Submission received: 16 April 2025 / Revised: 18 May 2025 / Accepted: 23 May 2025 / Published: 27 May 2025
(This article belongs to the Section Building Materials, and Repair & Renovation)

Abstract

:
With the popularization of the concept of seismic performance-based design, the correct and quantitative evaluation of post-earthquake damage to structural components has become a research focus. Referring to the concrete constitutive relationship mentioned in the Chinese national standard GB/T 50010-2010, this study proposes a damage assessment method for concrete components based on material damage. According to the value of the uniaxial damage evolution parameter of concrete (dc(t)), the damage grades of concrete components are defined. It is specified that, when the value of dc(t) is less than the dc(t),r value corresponding to the peak concrete strain (εc(t),r), the concrete component is in a non-damaged state (Level L1). When the value of dc(t) is greater than the dc(t)u value corresponding to the concrete strain (εc(t)u), the concrete component is in a severely damaged state (Level L6). When the value of dc(t) is between these two values, the damage grade of the concrete component (levels L2 to L5) is determined using linear interpolation. To promote its engineering application, this study also proposes a quantitative expression for the damage assessment method for concrete components based on dc(t). To verify the rationality of the damage assessment method for concrete components based on dc(t), a refined model of rectangular, T-shaped, and L-shaped concrete shear wall components was established using ABAQUS software, and a nonlinear finite element analysis was carried out. The simulation results show that (a) the damage assessment method for concrete components based on dc(t) can better characterize damage to concrete shear wall components; (b) when defining the damage grades of concrete shear wall components, using dc is more reasonable than using dt; and (c), from a macroscopic perspective, the damage assessment method for concrete components based on dc(t) is more in line with actual expectations and has a higher safety factor compared with the damage assessment method for concrete components based on the concrete compressive strain (εc) mentioned in the Chinese association standard T/CECA 20024-2022.

1. Introduction

With the popularization of the concept of seismic performance-based design, the correct and quantitative evaluation of post-earthquake damage to structural components has become a research focus [1,2,3,4]. For engineering applications, most of the current mainstream seismic design methods for building structures adopt the seismic design approach based on performance requirements [5,6]. Its essence lies in taking corresponding measures for different seismic performance levels of structures, ensuring that the damage grades of different types of components meet the expected requirements and that the seismic performance objectives of the structures are achieved. Therefore, the correct and quantitative evaluation of the damage grades of components after an earthquake is the core of the seismic design method based on performance requirements. Regarding damage assessments of components, most of the current research focuses on establishing a quantitative expression that reflects the damage grades of components. The Park–Ang model [7] is recognized as a relatively typical one. The internal essence of component damage is the result of the continuous development and accumulation of material damage. Unfortunately, the current quantitative expressions fail to reflect the degree of material damage. With the continuous development of computational technology and material constitutive relationships [8,9,10,11,12], it has become possible to establish a quantitative expression that reflects component damage at the material level. Based on this, referring to the concrete constitutive relationship mentioned in the Chinese national standard GB/T 50010-2010, this study proposes a damage assessment method for concrete components based on material damage. According to the value of the uniaxial damage evolution parameter of concrete (dc(t)), the damage grades of concrete components are defined. This allows the damage assessment method to effectively reflect the degree of material damage and establishes a direct correlation between the mesoscopic damage evolution of materials and the macroscopic damage evaluation of components.
In recent years, there have been frequent seismic activities around the world. Typical examples include the 1994 Northridge earthquake [13], the 1995 Kobe earthquake [14], the 1999 Kocaeli earthquake [15], the 2008 Wenchuan earthquake [16], the 2010 Maule earthquake [17], the 2011 Tohoku earthquake [18], and the 2023 Antakya earthquake [19]. With the increase in the urban population and the reduction in land resources, shear wall structures with relatively high lateral stiffness have been widely used in high-rise buildings [20]. Once the vertical components of high-rise buildings have suffered serious seismic damage, the losses will be immeasurable. Therefore, it is of great research value to evaluate the damage grades of shear wall components after an earthquake. To verify the rationality of the proposed damage assessment method for concrete components based on dc(t), a refined model of rectangular, T-shaped, and L-shaped concrete shear wall components was established using ABAQUS 2024 software, and a nonlinear finite element analysis was carried out. The value of dc(t) was derived according to the simulation outputs, and the damage grade of the concrete shear wall component was defined. Finally, the damage assessment method for concrete components based on dc(t) was compared with the damage assessment method for concrete components based on a compressive strain mentioned in the Chinese association standard T/CECA 20024-2022 [21], and the rationality of the damage assessment method for concrete components based on dc(t) was determined from a macroscopic perspective.

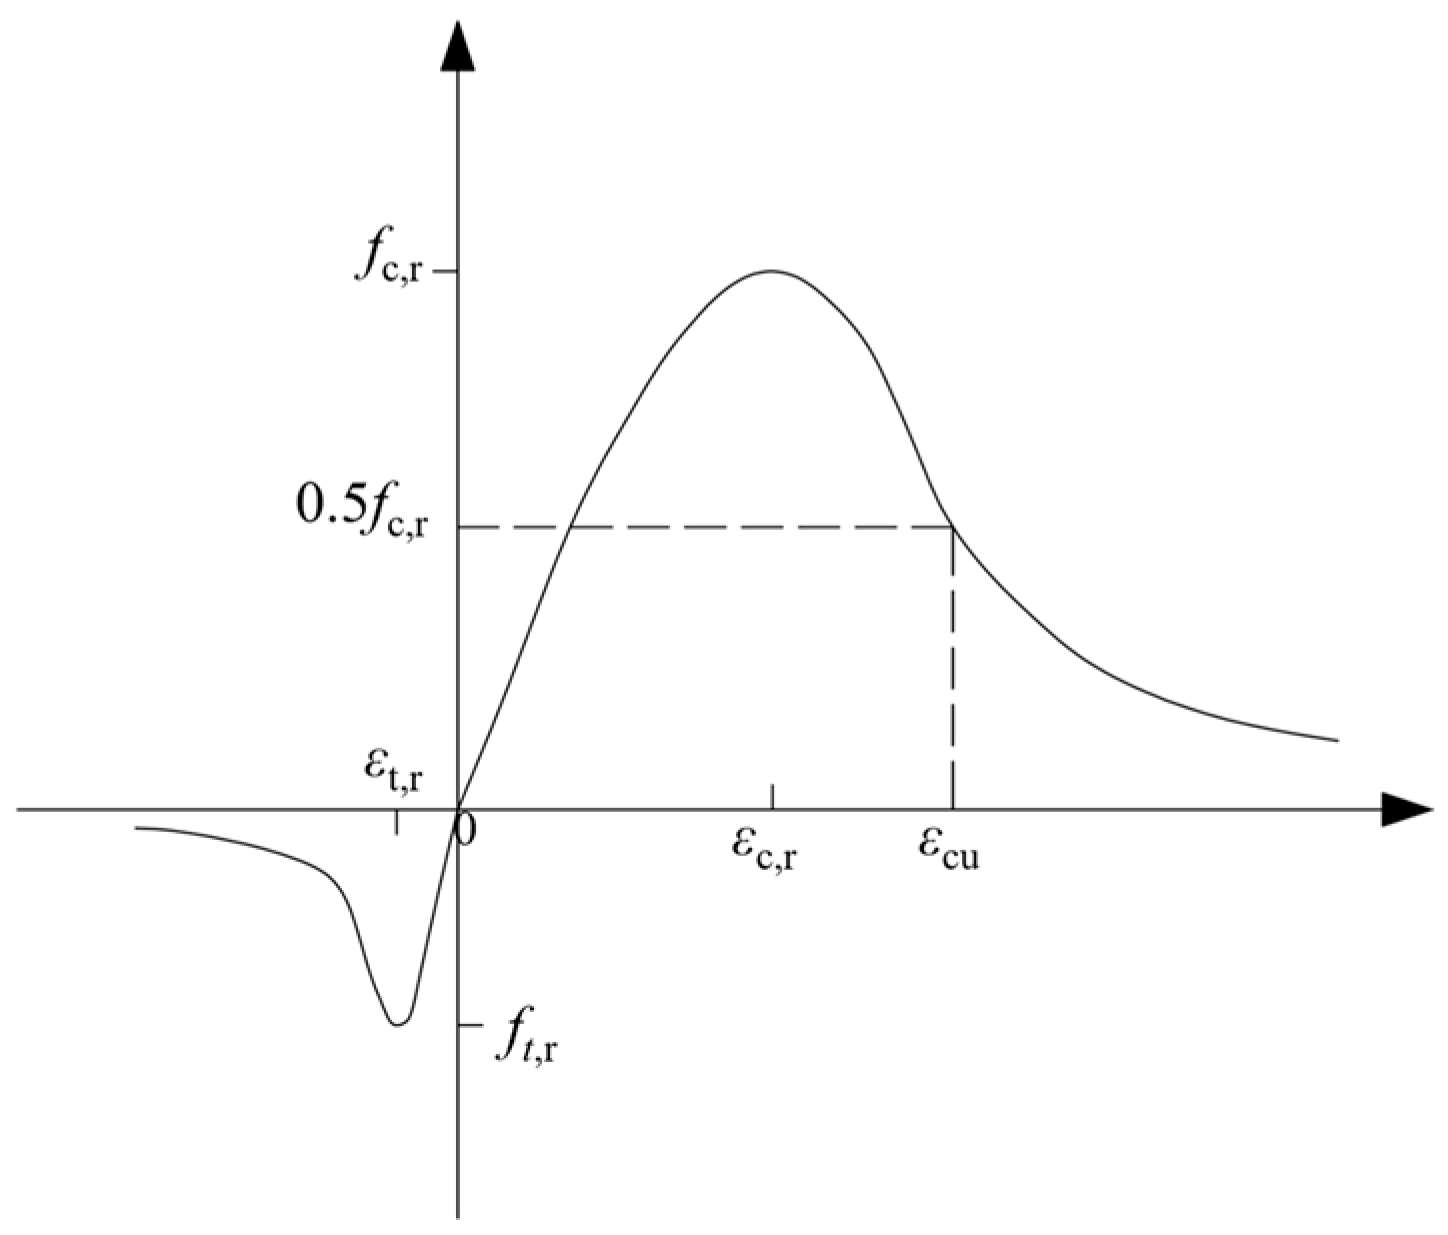
2. Constitutive Relationship of Concrete

In the long process of studying the constitutive relationship of concrete, various theories such as classical elastic mechanics, plastic mechanics, and fracture mechanics have been successively introduced. Unfortunately, based on in-depth research, these theories all have certain limitations in reflecting the mechanical behavior of concrete under stress. It was not until Dougill [22] applied the basic concept of damage mechanics [23] to describe the nonlinearity of concrete that research on the constitutive relationship of concrete entered a new stage of development. Subsequent studies have shown that the nonlinearity of macroscopic damage evolution stems from the randomness of the distribution of fracture strains at the mesoscopic level. The macroscopic damage evolution law should seek its internal mechanism and modeling approach in a physical analysis at the mesoscopic level. Based on this, Li et al. [10] introduced the concept of energy equivalent strain, combined the elastoplastic damage model with the uniaxial random damage model, and then extended the one-dimensional damage evolution law to the multi-dimensional stress–strain space, establishing a multi-dimensional elastoplastic random damage constitutive model for concrete. In this way, the randomness of microscopic fracture strains is combined with the nonlinearity of macroscopic mechanical behavior, achieving a comprehensive reflection of the nonlinearity and randomness of concrete materials. This model can not only ideally reflect the special behaviors unique to concrete materials but also reflect the random variation range of the strength of concrete under multi-dimensional stress conditions, providing a basis for a nonlinear analysis at the structural level. To accurately describe the mechanical behavior of concrete, the constitutive relationship of concrete mentioned in GB/T 50010-2010 [24] also introduced the concept of damage, using dt and dc to characterize the damage of concrete. The uniaxial stress–strain curve of concrete mentioned in GB/T 50010-2010 is shown in Figure 1. The values of dt can be determined according to Equations (1)–(4), and the dt values corresponding to different concrete strength grades are shown in Table 1. When x ≤ 1, Equation (2) is directly fitted based on the test results, and the calculation results of the damage evolution parameter may be negative in some cases; thus, Equation (2) can be corrected according to Equations (5) and (6) [25].
σ = ( 1 d t ) E c ε
d t = 1 ρ t ( 1.2 0.2 x 5 ) ( x 1 ) 1 ρ t α t ( x 1 ) 1.7 + x ( x > 1 )
x = ε ε t , r
ρ t = f t , r E c ε t , r
d t = 1 ρ t n t n t 1 + x n t ( x 1 ) 1 ρ t α t ( x 1 ) 1.7 + x ( x > 1 )
n t = 1 / ( 1 ρ t )
where αt is a parameter related to the tensile descending segment of Figure 1, which is detailed in reference [24]. The Chinese national standard JGJ 3-2010 [26] states that, when carrying out the seismic performance design of structures, the standard values of material strength should be used for checking the calculation of the components. Therefore, in this article, ft,r is the standard value of concrete tensile strength; εt,r is the concrete peak tensile strain corresponding to ft,r, which is detailed in reference [24]; and dt is the uniaxial tensile damage evolution parameter of concrete.
The values of dc can be determined according to Equations (7)–(11). The dc values corresponding to different concrete strength grades are shown in Table 2.
σ = ( 1 d c ) E c ε
d c = 1 ρ c n n 1 + x n ( x 1 ) 1 ρ c α c ( x 1 ) 2 + x ( x > 1 )
ρ c = f c , r E c ε c , r
n = E c ε c , r E c ε c , r f c , r
x = ε ε c , r
where αc is a parameter related to the compressive descending segment of Figure 1, which is detailed in reference [24]. JGJ 3-2010 [26] states that, when carrying out the seismic performance design of structures, the standard values of material strength should be used for checking the calculation of the components. Therefore, in this study, fc,r is the standard value of concrete compressive strength; εc,r is the concrete peak compressive strain corresponding to fc,r, which is detailed in reference [24]; and dc is the uniaxial compressive damage evolution parameter of concrete.

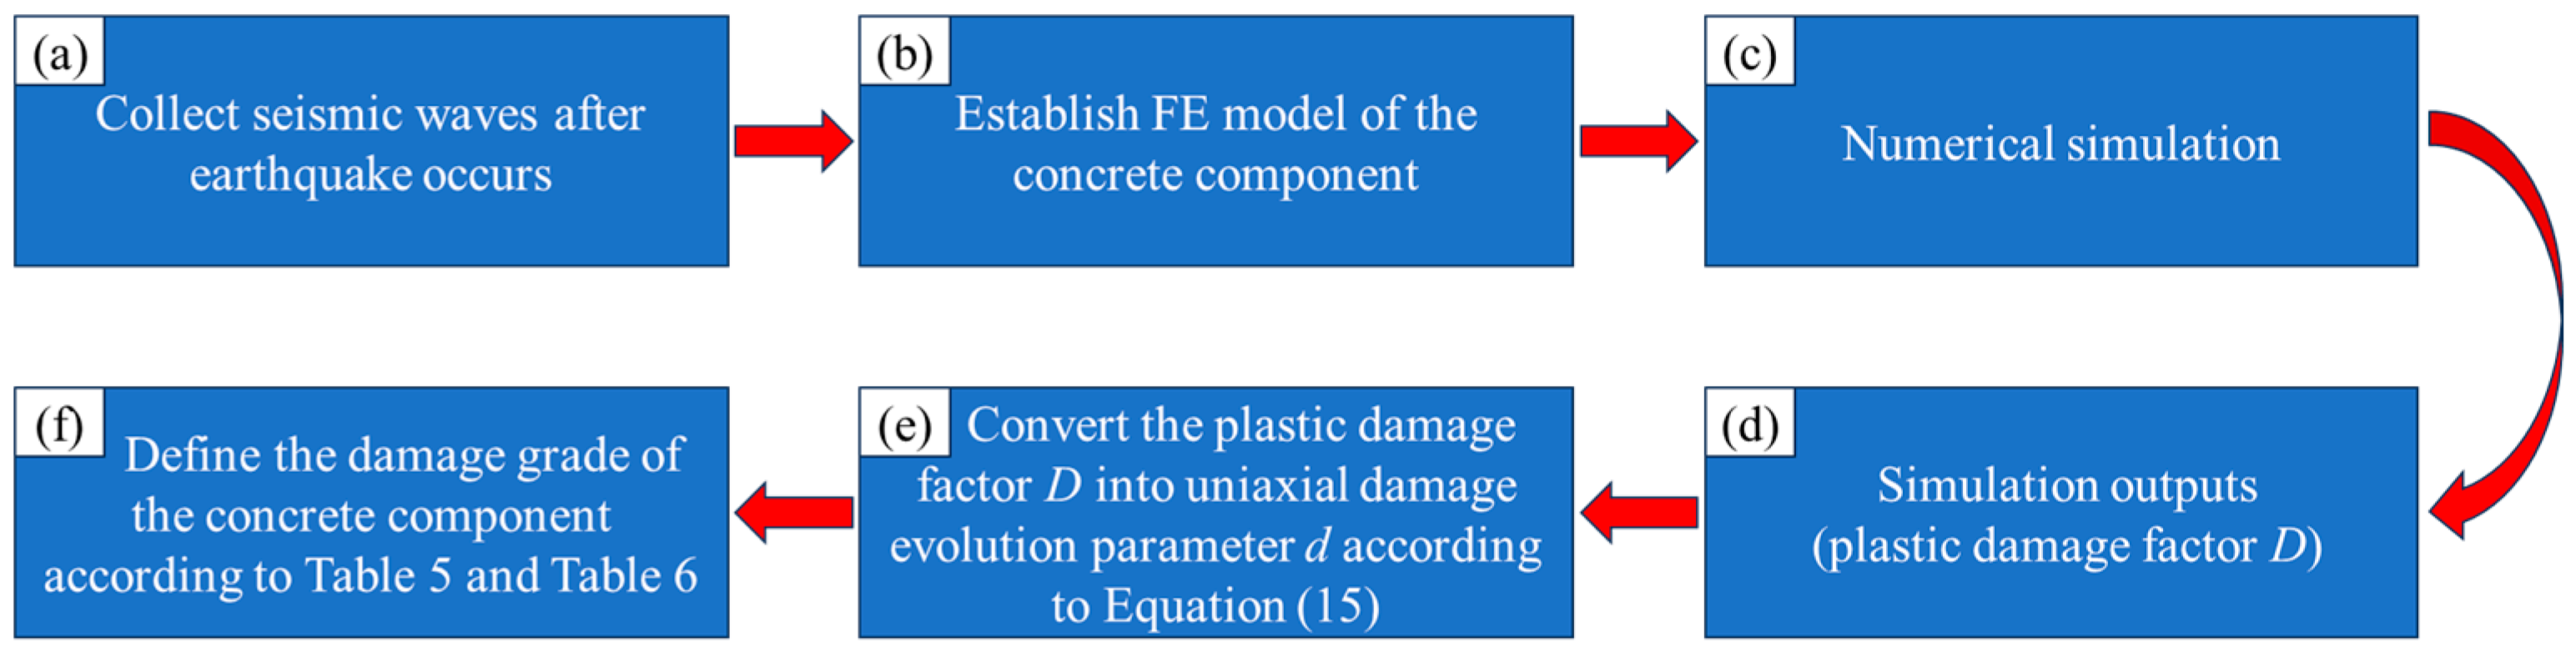
3. Damage Assessment Method for Concrete Components

The Chinese association standard T/CECA 20024-2022, issued by the China Engineering and Consulting Association, mentions several methods for evaluating the damage of concrete components from the material level. The damage grades of concrete components can be classified from Level L1 (non-damaged state) to Level L6 (severely damaged state) according to the compressive strain of concrete or the compressive damage variable of concrete, as shown in Table 3. However, the compressive damage variable of concrete mentioned in the Chinese association standard T/CECA 20024-2022 is different from the compressive damage variable of concrete (dc) mentioned in GB/T 50010-2010. It takes into account the residual strain of concrete under a repeated load, and the specific differences are detailed in references [21,24]. Since the Chinese association standard is not a Chinese national standard, for the convenience of engineering application and for the quantitative evaluation of the damage grade of concrete components, this study refers to the concrete constitutive relationship mentioned in GB/T 50010-2010 and proposes a damage assessment method for concrete components based on material damage. The damage grade of each concrete component was defined according to the value of the uniaxial damage evolution parameter of concrete (dc(t)).
It is specified that, when the value of dc(t) is less than the value of dc(t),r corresponding to the concrete peak strain εc(t),r, the concrete component is in a non-damaged state (Level L1). When the value of dc(t) is greater than the value of dc(t)u corresponding to the concrete strain εc(t)u, the concrete component is in a severely damaged state (Level L6). When the value of dc(t) is between these two values, the damage grade of the concrete component (Levels L2 to L5) is determined using the method of linear interpolation, as shown in Table 4 and Figure 2. Substituting the data in Table 1, Table 2 and Table 4, the damage grades of concrete components corresponding to the dc(t) values under different concrete strength grades are shown in Table 5 and Table 6.
For engineering applications, an ideal damage index should meet at least two conditions: (a) when the component is in a non-damaged state, the value should converge to 0; (b) when the component is in a severely damaged state, the value should converge to 1. Obviously, it is not ideal to define the damage grades of concrete components solely by using dc(t). As mentioned in the Introduction, regarding the damage assessment of components, most of the current research focuses on establishing a quantitative expression that reflects the damage grade of components. To meet the above two conditions and be consistent with the mainstream research, this study refers to the widely recognized Park–Ang model (Equation (12)), which considers the effects of elastoplastic deformation and low-cycle fatigue on damage [7], introduces a damage index, Dc(t), which is closely related to dc(t), and establishes its quantitative expression, as shown in Equations (13) and (14). Referring to reference [27], the relationship between the tensile and compressive damage indices and the damage grades of concrete components is shown in Table 7.
D = x m x cu + β E h F y x cu
D c 0 = α d c d c , r d cu d c , r + β E h M y φ cu
D t 0 = α d t d t , r d tu d t , r + β E h M y φ tu
where xcu is the ultimate displacement under monotonic loading. xm is the maximum deformation under actual seismic action. Fy is the yield shear force. Eh is the cumulative energy dissipation. α is a regulation coefficient, whose value is taken as 0.8, referring to reference [27]. Dc0 and Dt0 are, respectively, the compressive and tensile damage indices of the damage assessment method for concrete components based on material damage. β is the energy dissipation factor of the component. For Equations (13) and (14), since dc(t) itself has taken into account the influence of cumulative energy consumption, the value of β is taken as 0. My is the yield-bending moment. φcu is the ultimate curvature at the maximum deformation.

4. Numerical Simulation

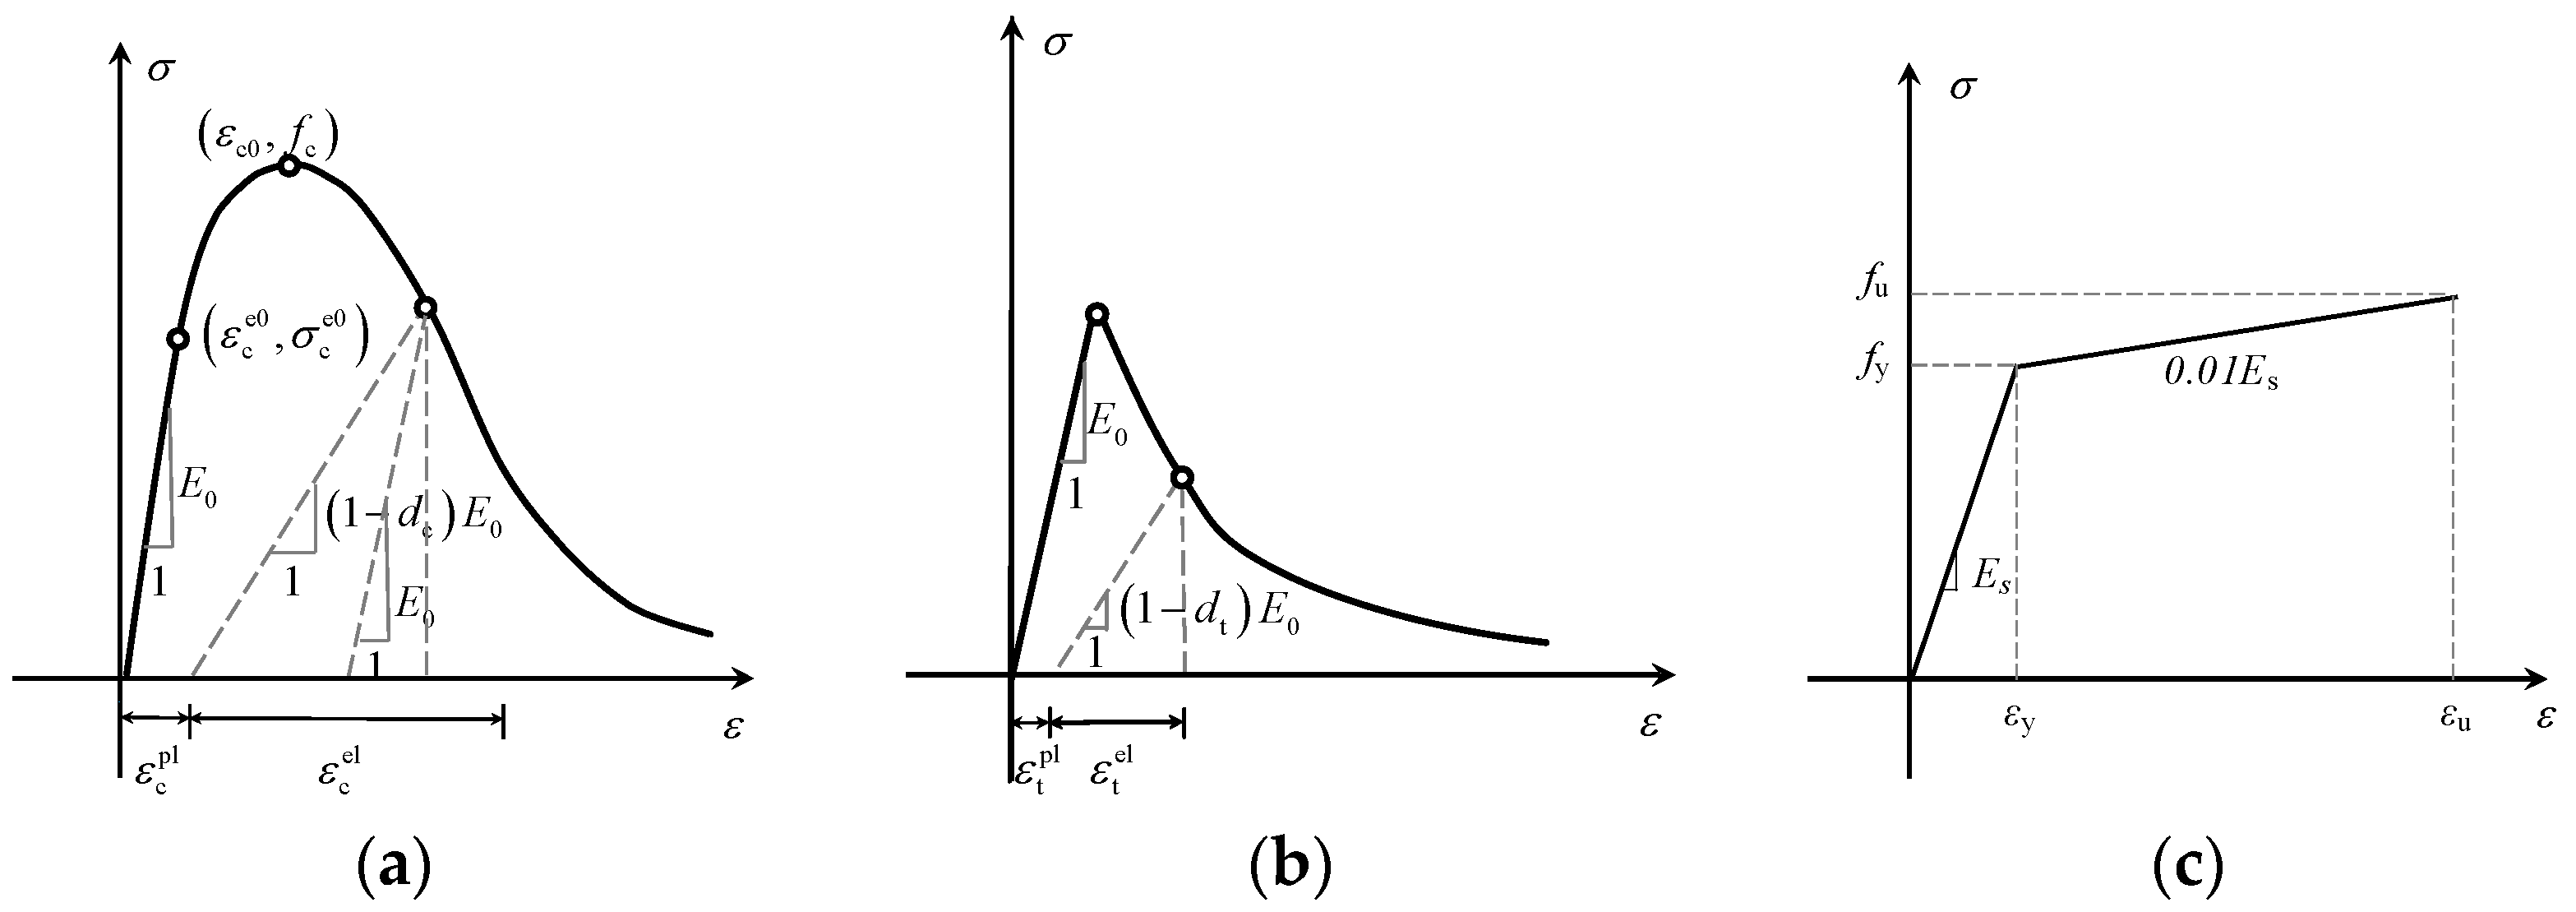
4.1. Application of Uniaxial Damage Evolution Parameter of Concrete dc(t) in ABAQUS

ABAQUS provides three options for the constitutive model of concrete. The concrete damage plasticity model was first proposed by Lubliner et al. [28] and revised by Lee and Fenves [29]. Since it takes into account the differences in the tensile and compressive properties of the material, etc., it can describe the nonlinear behavior of concrete well and is widely used in the numerical simulation of concrete components [30,31]. Unfortunately, the ABAQUS user manual [32] lacks an explanation of the value assignment of the plastic damage factor D in the concrete damage plasticity model. If the value of dc(t) provided by GB/T 50010-2010 is directly used, it cannot meet the requirements of data inspection in ABAQUS, and it is not easy to converge the calculation results. At present, there are many studies on the application of dc(t) in ABAQUS. Equation (15) refers to reference [33]; that is, it is determined according to the assumption of energy equivalence. The conversion between the values of D and d of concrete is shown in Equation (15):
D = 1 ( 1 d ) γ
where γ is the damage adjustment coefficient. For compressive damage, its value is 0.5; for tensile damage, its value is 0.35.

4.2. Test Results

To verify the rationality of the damage assessment method for concrete components based on dc(t), a refined model of rectangular, T-shaped, and L-shaped concrete shear wall components was established using ABAQUS software. This research mainly focused on the damage of shear wall components under low cyclic repeated loads. The data cited the pseudo-static tests of cast-in-place shear wall specimens carried out by Gu et al. [34,35,36]. The test results of the specimens at the characteristic points are shown in Table 8.
The cross-sectional dimensions and reinforcement arrangements of the shear wall specimens are shown in Figure 3. For a rectangular shear wall, the height, width, and thickness are 2700 mm, 1800 mm, and 200 mm, respectively. For the T-shaped shear wall, the height, web width, flange width, and thickness are 2700 mm, 1800 mm, 1650 mm, and 200 mm, respectively. For the L-shaped shear wall, the height, web width, flange width, and thickness are 2700 mm, 1800 mm, 925 mm, and 200 mm, respectively. The compressive strengths of the rectangular, T-shaped, and L-shaped shear wall specimens are 60.1 MPa, 37.2 MPa, and 37.2 MPa, respectively, and the strength grades of all the reinforcing bars are HRB400E.
The loading devices were all composed of vertical and horizontal loading devices. Vertical loads were applied using a vertical actuator fixed on the reaction frame, and horizontal loads were applied with a horizontal actuator through a loading beam. After the specimen was hoisted to the testing platform, it was fixed to the laboratory floor with anchor bolts. The load/displacement hybrid control loading system was applied. Before the specimen yielded, the load control was used. After the specimen yielded, the displacement control was employed. The cyclic loading history is shown in Figure 4. The details of the specimen design principles, mechanical properties of materials, loading schemes, etc., are described in references [34,35,36].

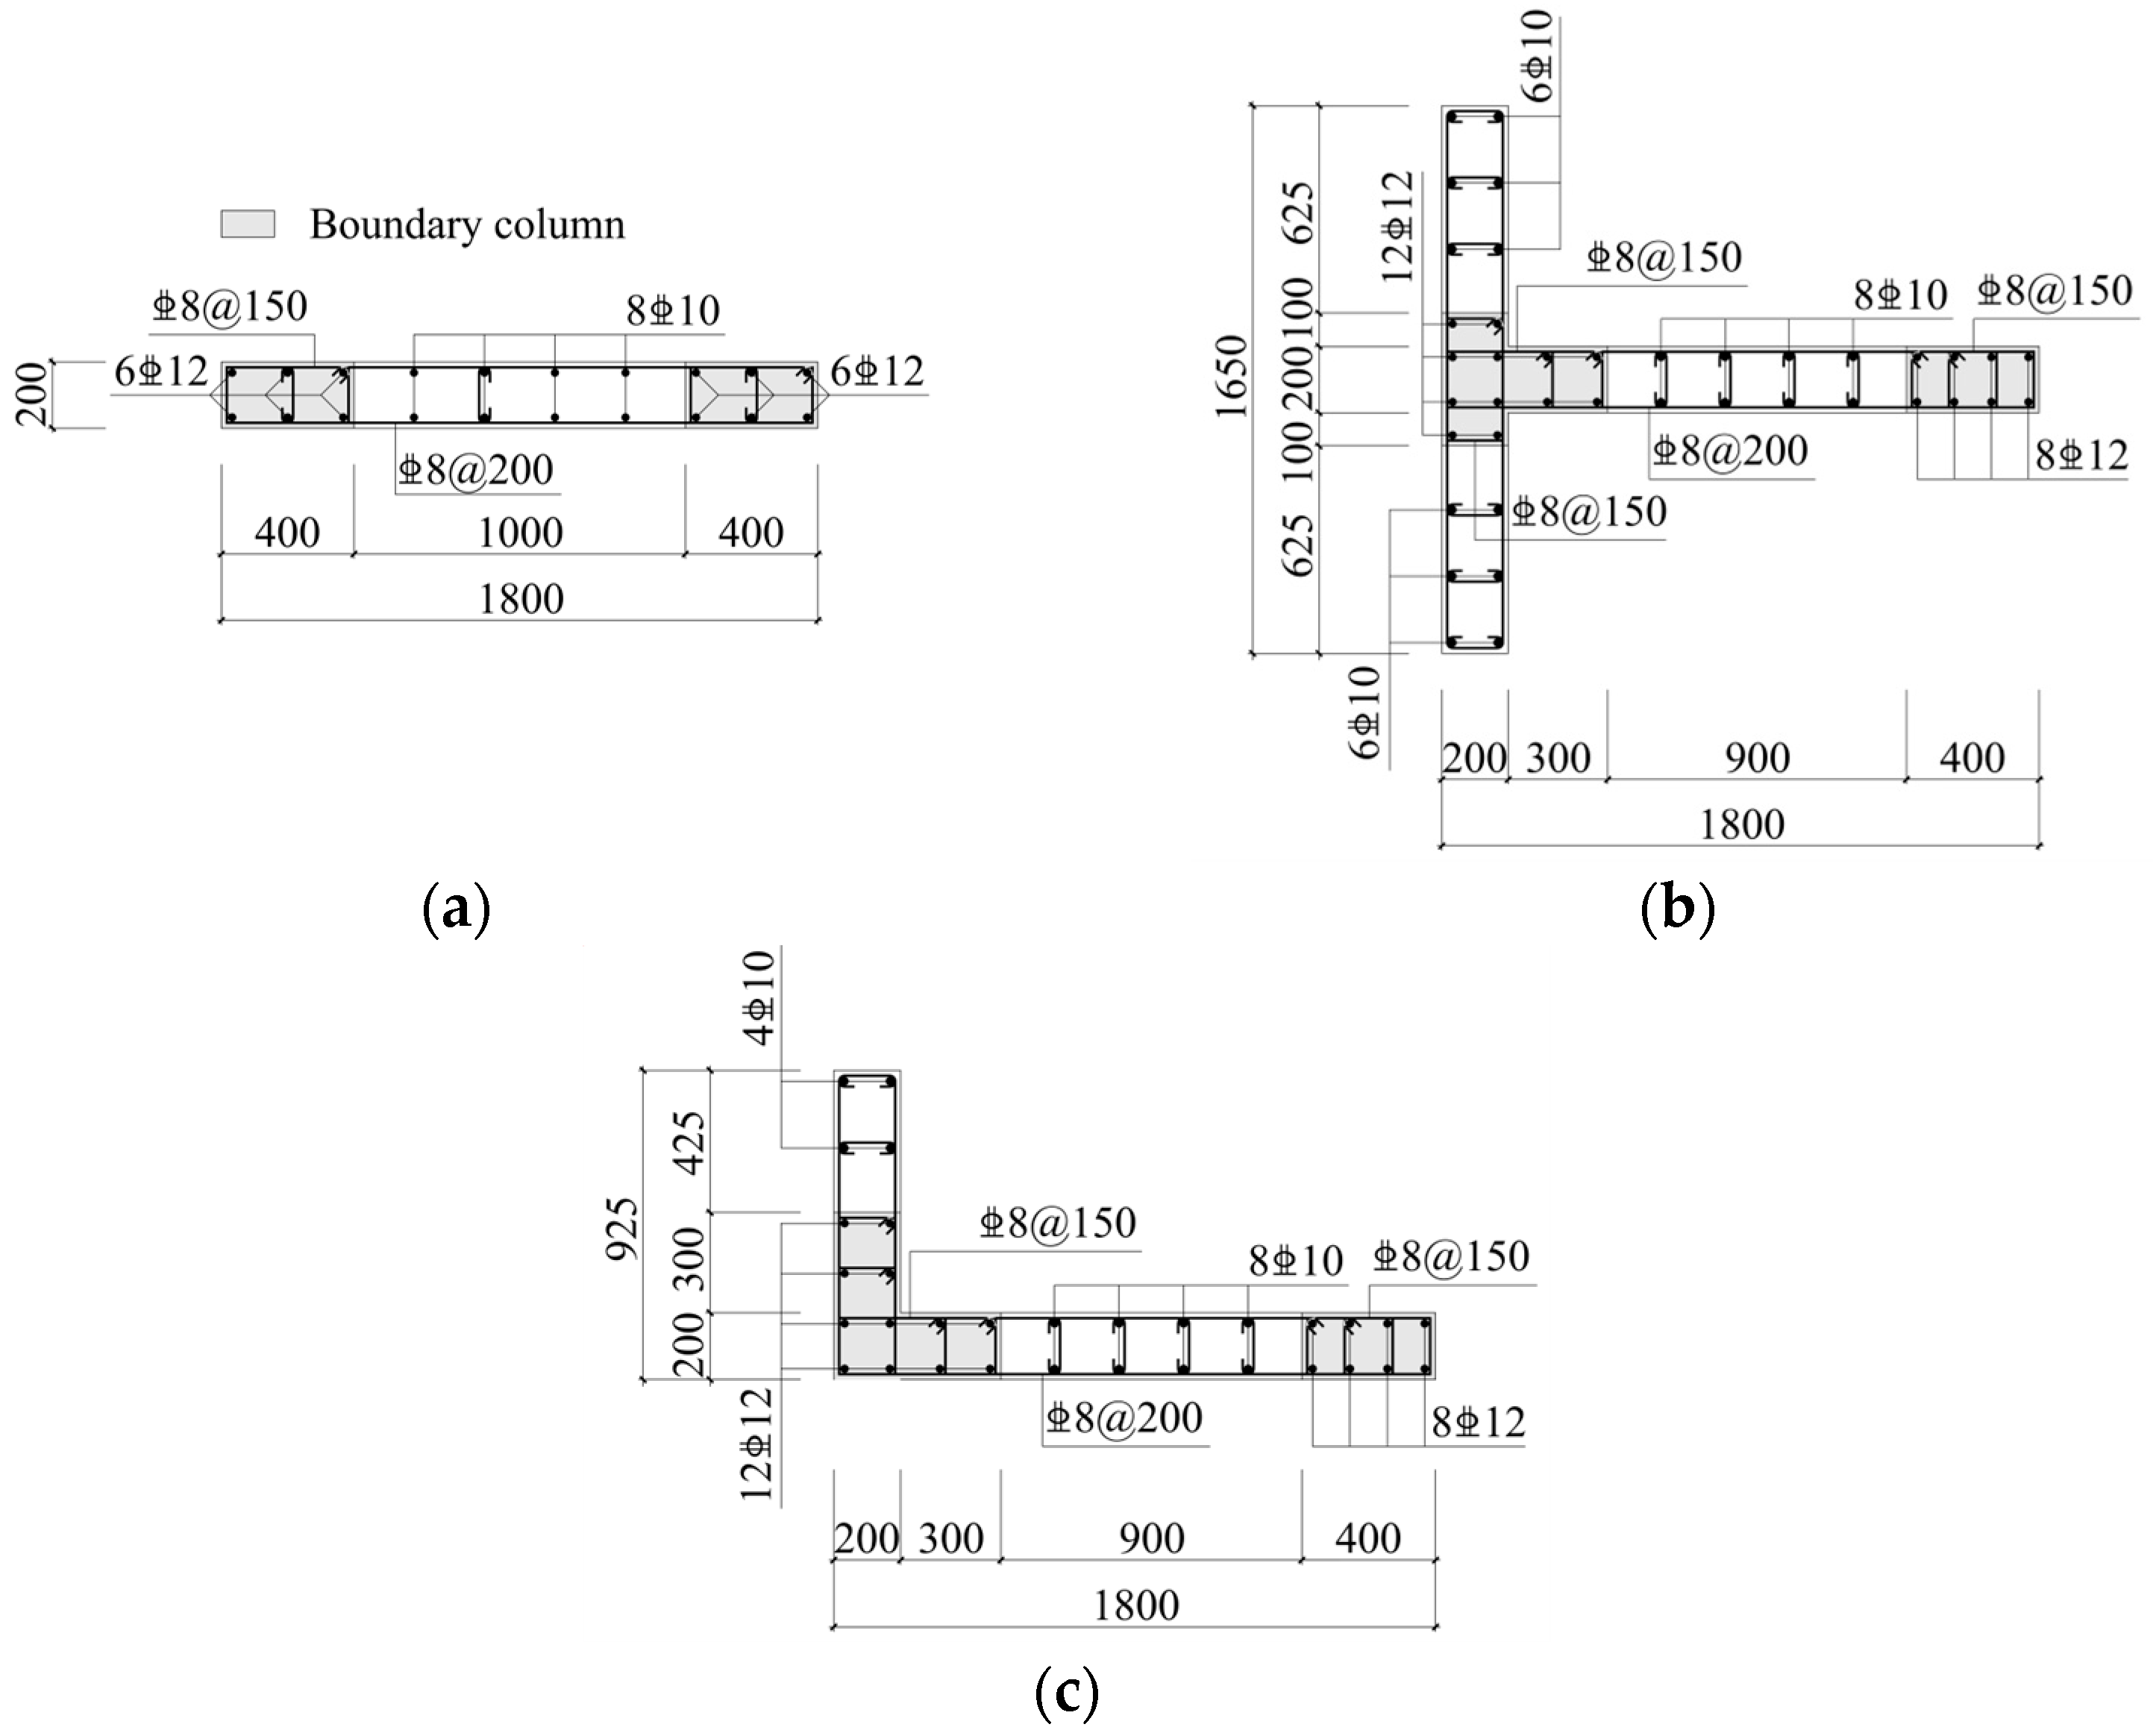
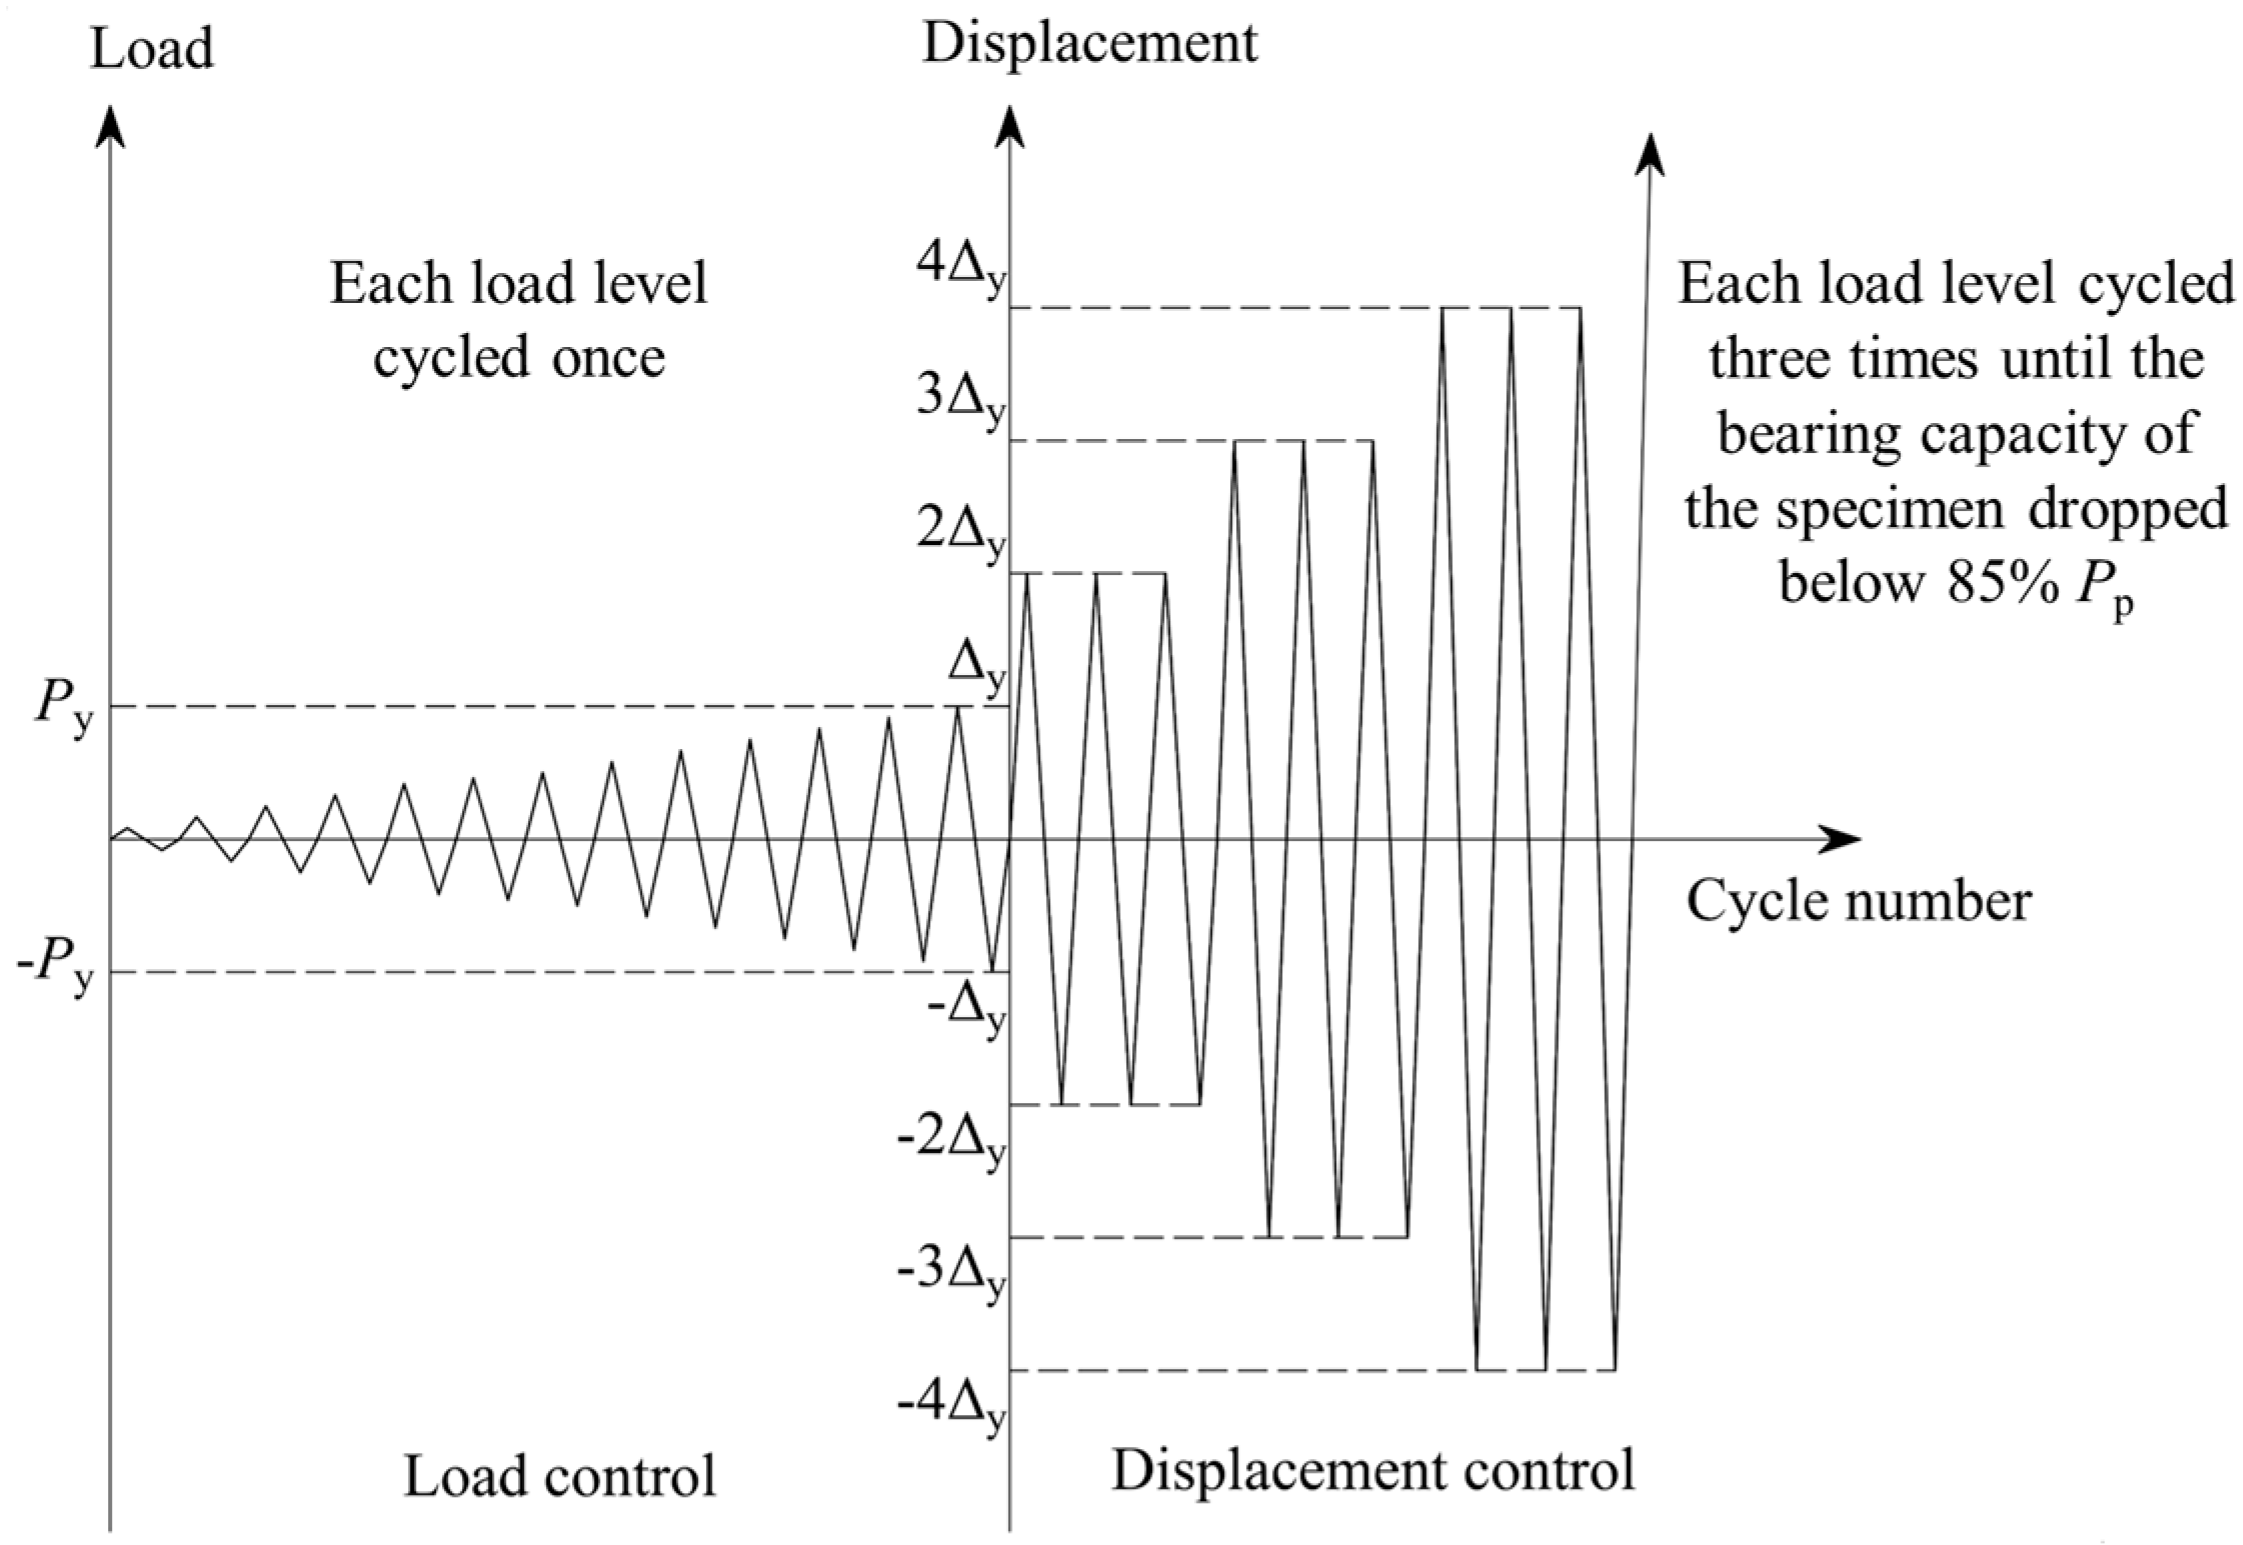
4.3. Development of FE Model

The concrete and steel bars were modeled separately. In terms of material models, the built-in concrete damage plasticity model was adopted for the concrete material, as shown in Figure 5a,b. The relevant physical meanings are detailed in reference [38]. According to reference [39], the values of the CDP model parameters are shown in Table 9. For the steel bar material, a bilinear elastic/plastic model was used, as shown in Figure 5c. fy, fu, εy, εu, and Es are, respectively, the yield strength, ultimate strength, yield strain, ultimate strain, and elastic modulus of the steel bar.
The dimensions of the FE model are entirely identical to those of the test specimen. The C3D8R was adopted for the concrete, and the T3D2 was adopted for the steel bars. All the steel bars were embedded in the concrete. After a mesh sensitivity analysis, the mesh size of the concrete was selected as 50 mm, and the mesh size of the steel bars was selected as 25 mm. Further reducing the mesh size would not significantly improve the accuracy but would greatly increase the computational cost. The foundations of the FE models RCW-1, RCW-T, and RCW-L all employ fixed-end constraints, which are consistent with the experimental boundary conditions. The loading process was categorized into two distinct phases. First, vertical axial compression was applied via a concentrated force. Second, low-cycle repeated loads were applied via displacement, with the displacement being consistent with the experimental results. For T-shaped and L-shaped shear walls, the loading direction is specified as “positive” when the flange is in tension and “negative” when the flange is in compression.

4.4. Verification of FE Model

Figure 6 presents a comparison of the load/displacement curves between the tests and simulations of the rectangular, T-shaped, and L-shaped shear walls. Table 10 provides a comparison of the loads and displacements at the peak points between the tests and simulations.
It can be seen that, for rectangular, L-shaped, and T-shaped shear walls, the differences between the simulation’s and experiment’s peak loads (the average of absolute values of positive and negative differences) are 5.0%, 7.5%, and 6.5%, respectively. These results are relatively reliable and overall meet engineering accuracy requirements. For rectangular, L-shaped, and T-shaped shear walls, the differences between peak displacements corresponding to peak loads from the simulation and experiment (the average of absolute values of positive and negative differences) are 12.5%, 12.0%, and 9.0%, respectively. These differences can be mainly attributed to three factors: (1) the boundary conditions in the simulation are completely idealized, while there are gaps between the loading devices and the test specimens in the experiment; (2) bond slip between steel bars and concrete is ignored in the simulation; and (3) the viscous coefficient v was calibrated to minimize the difference in peak loads between simulation and experiment as much as possible. Overall, the differences between the simulation and test results are within an acceptable range, and the development trend of the simulation curve is consistent with that of the test.

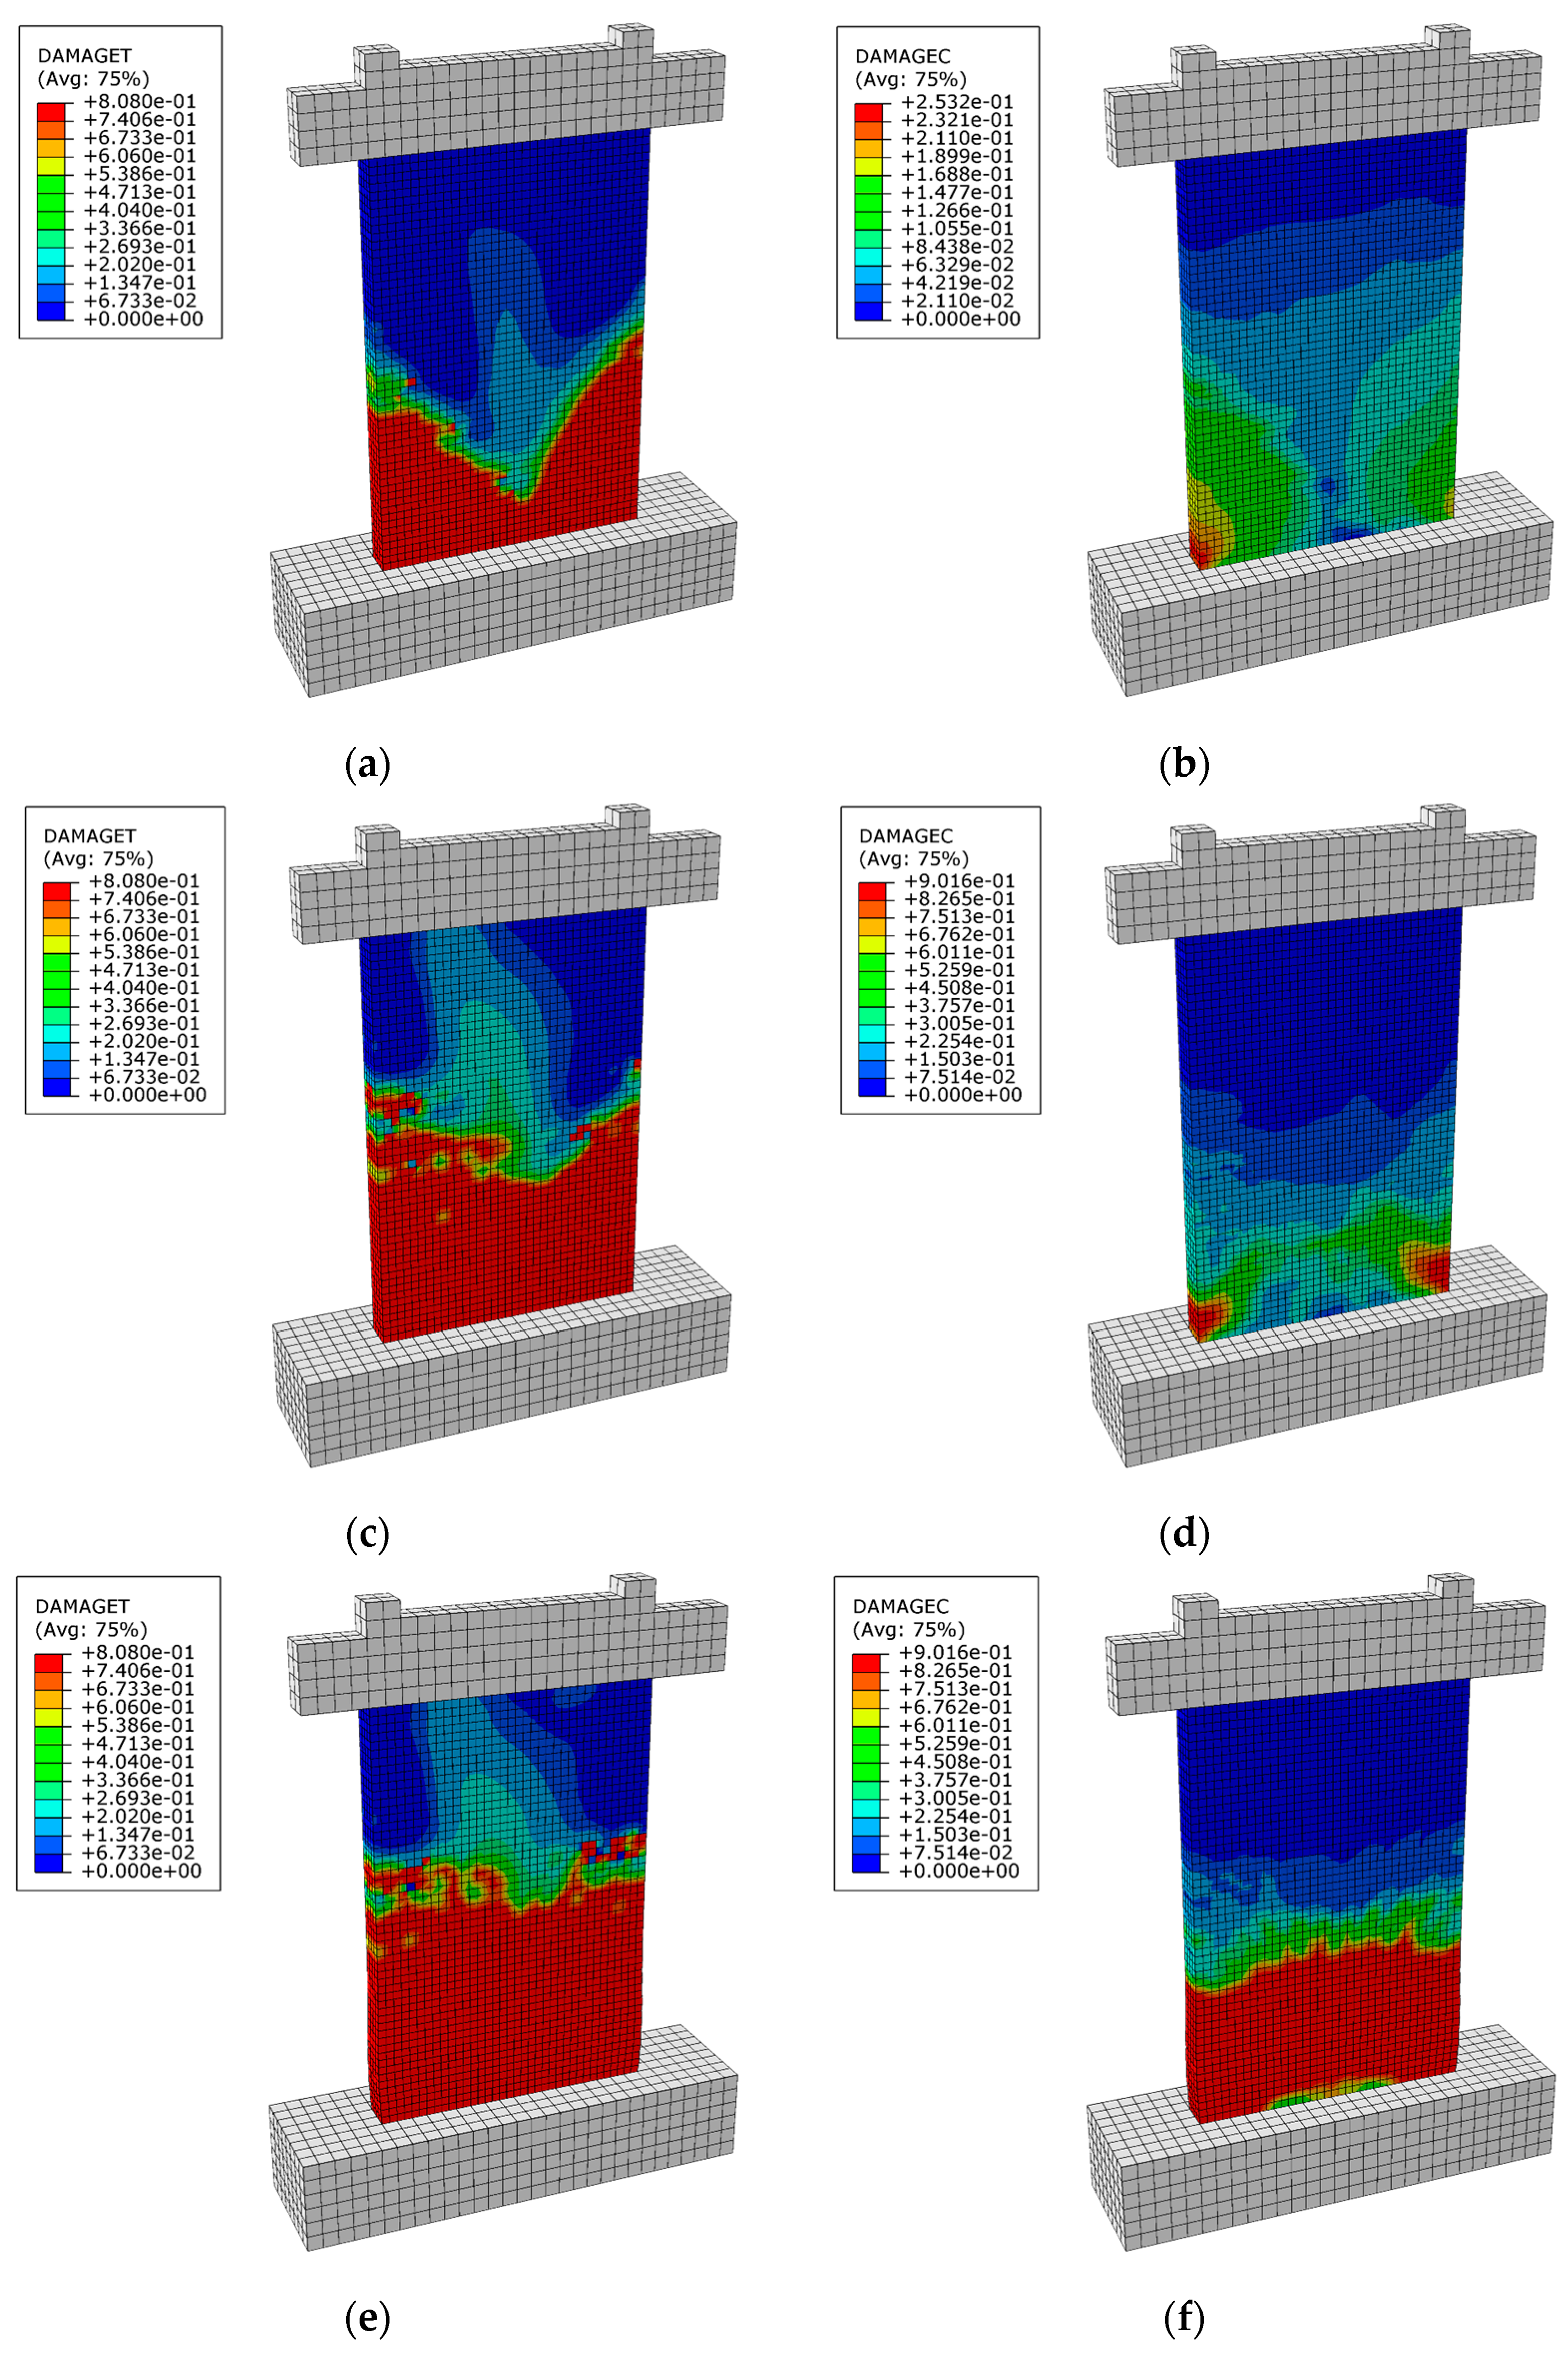
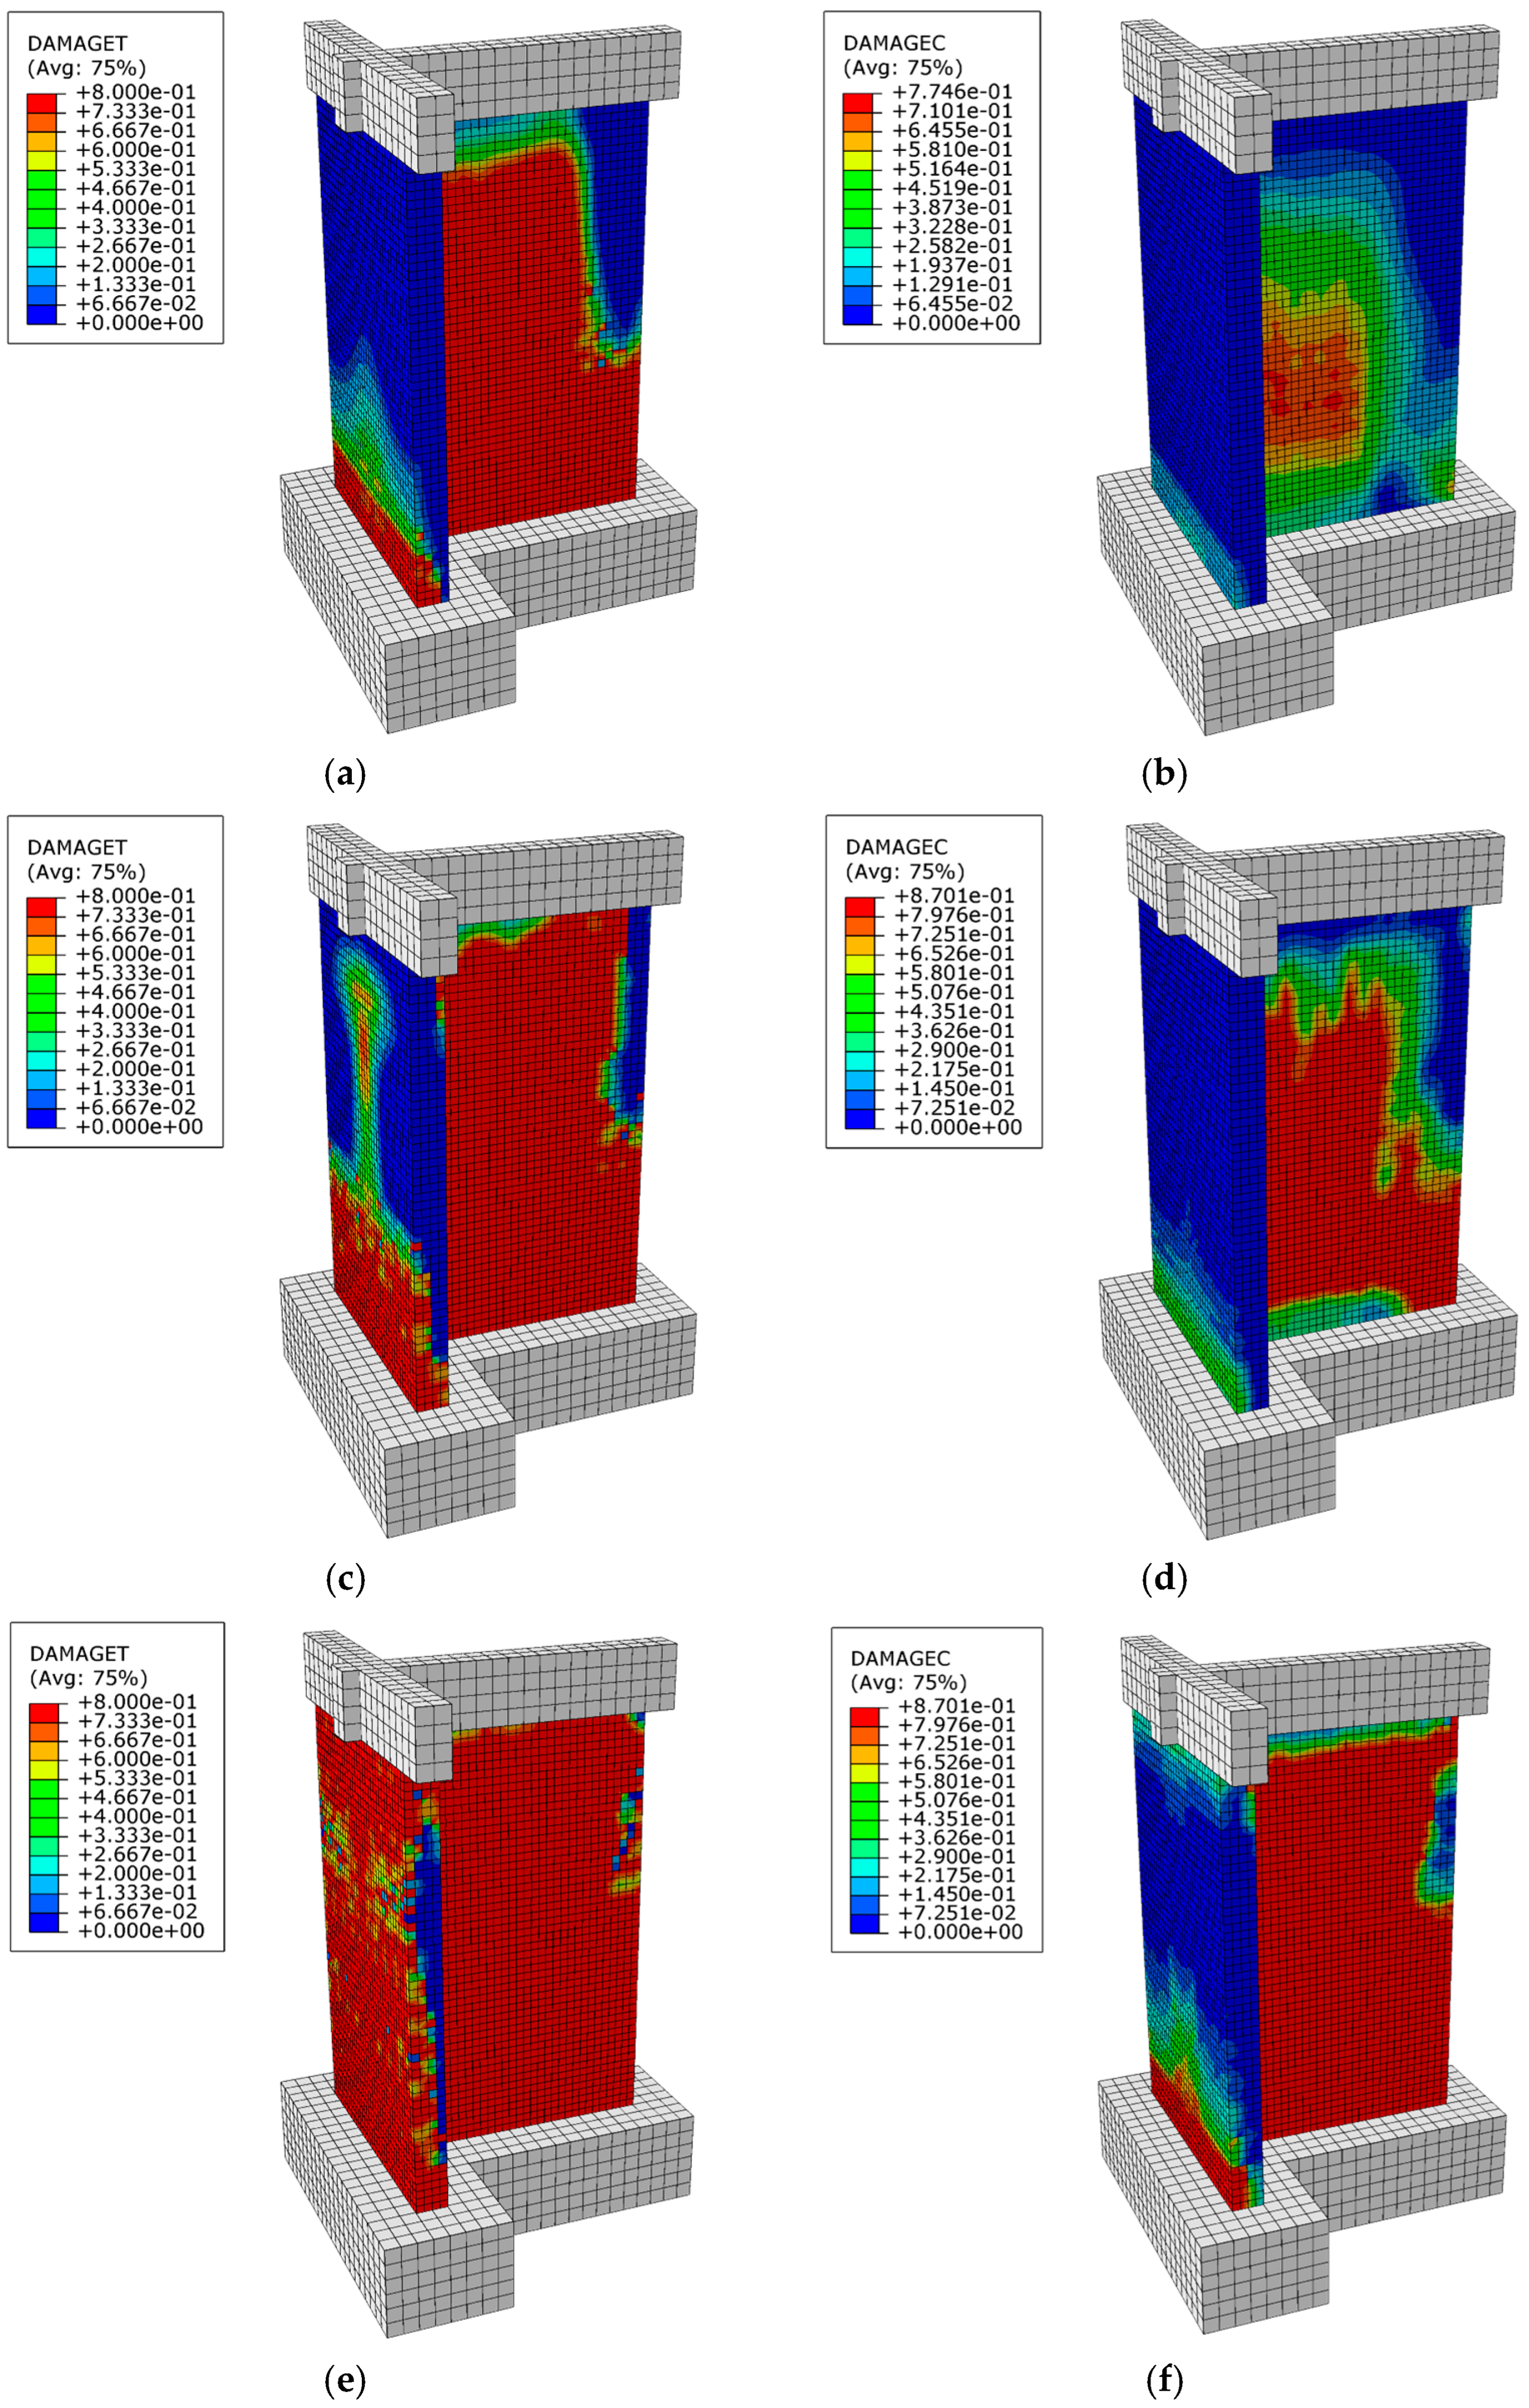
4.5. Damage Analysis

For the rectangular shear wall, the concrete damage of RCW-1 at the characteristic points is shown in Figure 7. As the load was applied, the maximum value of the tensile plastic damage factor Dt reached 0.81 quickly. According to Equation (14), the dt value at this time was 0.99, which is consistent with the appearance of horizontal cracks in the test shear wall. When the load was increased to the yield displacement, the maximum value of the compressive plastic damage factor Dc at the bottom of RCW-1 reached 0.90. According to Equation (14), the dc value at this time was 0.99. According to Table 6, the concrete component was at the L6 level at this time, which is consistent with the crushing and spalling of the concrete at the corner of the test shear wall. When the load was increased to the peak displacement, the dc value in about one-third of the area of RCW-1 was 0.99, and the dt value in about half of the area was 0.99, which is basically consistent with the failure phenomenon shown by the test shear wall. It should be noted that, due to the poor tensile performance of the concrete and the early development of cracks, the tensile plastic damage factor reached the peak value quickly. Compared with the dt value, it is more reasonable to define the damage grade of the concrete shear wall component by using the dc value. As the damage at the bottom of RCW-1 was the most serious when the test was terminated, the bottom unit of the shear wall was selected as the analysis object, and its M-dc curve is shown in Figure 8. In the initial stage of loading, the section bending moment increased, but the value of dc was 0; this is mainly because, in the initial stage of loading, the concrete had good compressive performance, and there was no compressive damage at the bottom of RCW-1. As the applied load increased, the dc value began to increase, and at this time, the section bending moment increased rapidly. After the load was increased to the yield displacement, the increase rate of the section bending moment slowed down, but the uniaxial compressive damage evolution parameter of the concrete dc increased rapidly to 1.0. After unloading, the uniaxial compressive damage evolution parameter of the concrete dc was still 1.0, as represented by the vertical section at the end of the curve.
Since the T-shaped and L-shaped shear walls are not completely symmetrical structures, the compressive and tensile damages on both sides of the web developed asymmetrically, and the damage degree of the web on the side close to the flange is lighter than that of the web on the other side. For the T-shaped shear wall, the concrete damage of RCW-T at the characteristic points is shown in Figure 9, and the M-dc curve of its bottom unit is shown in Figure 10. For the L-shaped shear wall, the concrete damage of RCW-L at the characteristic points is shown in Figure 11, and the M-dc curve of its bottom unit is shown in Figure 12. When loading in the positive direction, the curve development trend of the T-shaped and L-shaped shear walls was similar to that of the rectangular shear wall. When loading in the reverse direction, the initial value of the compressive damage evolution parameter of concrete dc was already close to 0.3. As the applied displacement increased, the compressive stress of the unit at the junction of the flange and the web kept increasing. However, due to the relatively large stiffness of the flange, only the slope of the curve changed: the compressive damage evolution parameter of concrete dc increased linearly to 1.0, which is consistent with the phenomenon that only slight damage occurs at the bottom of the flange when the test fails.

4.6. Damage Assessment

The step-by-step process for evaluating the damage grade using the proposed method is shown in Figure 13. Table 11 provides the results of a structural comparison that quantitatively evaluated the rectangular, T-shaped, and L-shaped concrete shear wall components between the damage assessment method for concrete components based on dc(t) and the damage assessment method for concrete components based on concrete compressive strain εc in the Chinese association standard T/CECA 20024-2022. The results are as follows: (1) Due to the poor tensile performance of concrete and the early development of cracks, the tensile plastic damage factor Dt reaches the peak value quickly. Compared with dt, it is more reasonable to define the damage grade of the concrete shear wall component by using dc. (2) When using dc and the compressive damage index of concrete Dc0 to define the damage grade of the concrete shear wall component, the evaluation results are basically consistent. (3) From a macroscopic perspective, the damage assessment method for concrete components proposed in this study is more in line with actual expectations than the damage assessment method for concrete components based on dc(t) and the damage assessment method for concrete components based on εc. It also has a higher safety factor. This is because, as shown in the literature [34,35,36], when a specimen yields, a large number of cross-diagonal cracks appears on its surface, accompanied by local concrete spalling and steel bar yielding. In engineering applications, this exceeds the serviceability limit state of the shear wall and constitutes irreversible damage. However, according to the damage assessment method for concrete components based on εc, the damage grade of the component is lower than that determined with the damage assessment method based on dc(t). For the flange of model RCW-T, it even remains in the L1 non-damaged state, which is inconsistent with the actual damage of the component and poses significant safety risks. Therefore, the method proposed in this article has a higher safety factor.

5. Conclusions

Referring to the concrete constitutive relationship mentioned in GB/T 50010-2010, this study proposed a damage assessment method for concrete components based on material damage. According to the values of dc(t), the damage grades of concrete components were defined. To verify the rationality of the damage assessment method for concrete components proposed in this study, a refined model of rectangular, T-shaped, and L-shaped concrete shear wall components was established using ABAQUS software, and a nonlinear finite element analysis was carried out. Finally, the damage assessment method for concrete components proposed in this study was used to assess the damage grades of concrete shear wall components, and the main conclusions are as follows:
(1)
The damage assessment method for concrete components proposed in this study can well represent the damage grades of concrete shear wall components. Due to the poor tensile performance of concrete and the early development of cracks, the tensile plastic damage factor Dt reaches the peak value quickly; it is more scientific and reasonable to define the damage grade of concrete shear wall components using the value of dc than using the value of dt, as it can more accurately reflect the actual damage status of the components.
(2)
Using dc and the compressive damage index of concrete Dc0 to define the damage grade of the concrete shear wall component, the evaluation results are basically consistent.
(3)
From a macroscopic perspective, the damage assessment method for concrete components based on dc(t) is more in line with actual expectations and has a higher safety factor compared with the damage assessment method for concrete components based on concrete compressive strain εc mentioned in the Chinese association standard T/CECA 20024-2022.

Author Contributions

Conceptualization, X.R.; Methodology, X.R.; Investigation, H.W., X.R. and M.T.; Data curation, H.W.; Writing—original draft, H.W.; Visualization, M.T.; Supervision, X.R. and Z.L.; Project administration, X.R.; Funding acquisition, X.R. and Z.L. All authors have read and agreed to the published version of the manuscript.

Funding

This research was funded by National Natural Science Foundation of China [grant number 52478198].

Data Availability Statement

The original contributions presented in this study are included in the article. Further inquiries can be directed to the corresponding authors.

Conflicts of Interest

Authors Hongjun Wang, Zhi Li and Mingsheng Tang were employed by CITIC General Institute of Architectural Design and Research Co., Ltd. The remaining author declares that the research was conducted in the absence of any commercial or financial relationships that could be construed as a potential conflict of interest.

References

  1. Shan, J.; Wang, L.; Loong, C.N.; Zhang, H.; Huang, P. Damage tracking and hysteresis-based evaluation of seismic-excited RC shear wall using monitoring data. Struct. Des. Tall Spec. Build. 2024, 33, e2087. [Google Scholar] [CrossRef]
  2. Shan, J.; Zhuang, C.; Loong, C.N. Parametric identification of Timoshenko-beam model for shear-wall structures using monitoring data. Mech. Syst. Signal Process. 2023, 189, 110100. [Google Scholar] [CrossRef]
  3. Hernandez, E.M.; May, G. Dissipated energy ratio as a feature for earthquake-induced damage detection of instrumented structures. J. Eng. Mech. 2013, 139, 1521–1529. [Google Scholar] [CrossRef]
  4. Xiong, C.; Lu, X.; Lin, X. Damage assessment of shear wall components for RC frame–shear wall buildings using story curvature as engineering demand parameter. Eng. Struct. 2019, 189, 77–88. [Google Scholar] [CrossRef]
  5. SEAOC Vision 2000 Committee. Performance-Based Seismic Engineering of Building; Structural Engineers Association of California: Sacramento, CA, USA, 1995. [Google Scholar]
  6. Xu, R.F.; Dai, G.Y. Performance-based seismic design of tall building structures beyond the code-specification. China Civ. Eng. J. 2005, 1, 1–10. (In Chinese) [Google Scholar]
  7. Park, Y.J.; Ang, A.H.S. Mechanistic seismic damage model for reinforced concrete. J. Struct. Eng. 1985, 111, 722–739. [Google Scholar] [CrossRef]
  8. Wu, J.Y.; Li, J.; Faria, R. An energy release rate-based plastic-damage model for concrete. Int. J. Solids Struct. 2006, 43, 583–612. [Google Scholar] [CrossRef]
  9. Grassl, P.; Jirásek, M. Damage-plastic model for concrete failure. Int. J. Solids Struct. 2006, 43, 7166–7196. [Google Scholar] [CrossRef]
  10. Li, J.; Ren, X. Stochastic damage model for concrete based on energy equivalent strain. Int. J. Solids Struct. 2009, 46, 2407–2419. [Google Scholar] [CrossRef]
  11. Cicekli, U.; Voyiadjis, G.Z.; Al-Rub, R.K.A. A plasticity and anisotropic damage model for plain concrete. Int. J. Plast. 2007, 23, 1874–1900. [Google Scholar] [CrossRef]
  12. Nie, J.G.; Wang, Y.H. Comparison study of constitutive model of concrete in ABAQUS for static analysis of structures. Eng. Mech. 2013, 30, 59–67. (In Chinese) [Google Scholar]
  13. Scientists of the US Geological Survey and the Southern California Earthquake Center. The magnitude 6.7 Northridge, California, earthquake of 17 January 1994. Science 1994, 266, 389–397. [Google Scholar] [CrossRef] [PubMed]
  14. Yamaguchi, N.; Yamazaki, F. Estimation of strong motion distribution in the 1995 Kobe earthquake based on building damage data. Earthq. Eng. Struct. Dyn. 2001, 30, 787–801. [Google Scholar] [CrossRef]
  15. Durukal, E.; Erdik, M. Physical and economic losses sustained by the industry in the 1999 Kocaeli, Turkey earthquake. Nat. Hazards 2008, 46, 153–178. [Google Scholar] [CrossRef]
  16. Zhao, B.; Taucer, F.; Rossetto, T. Field investigation on the performance of building structures during the 12 May 2008 Wenchuan earthquake in China. Eng. Struct. 2009, 31, 1707–1723. [Google Scholar] [CrossRef]
  17. Jünemann, R.; de La Llera, J.C.; Hube, M.A.; Cifuentes, L.A.; Kausel, E. A statistical analysis of reinforced concrete wall buildings damaged during the 2010, Chile earthquake. Eng. Struct. 2015, 82, 168–185. [Google Scholar] [CrossRef]
  18. Goda, K.; Pomonis, A.; Chian, S.C.; Offord, M.; Saito, K.; Sammonds, P.; Fraser, S.; Raby, A.; Macabuag, J. Ground motion characteristics and shaking damage of the 11th March 2011 Mw9.0 Great East Japan earthquake. Bull. Earthq. Eng. 2013, 11, 141–170. [Google Scholar] [CrossRef]
  19. Wang, T.; Chen, J.; Zhou, Y.; Lin, X.; Wang, X.; Shang, Q. Preliminary investigation of building damage in Hatay under February 6, 2023 Turkey earthquakes. Earthq. Eng. Eng. Vib. 2023, 22, 853–866. [Google Scholar] [CrossRef]
  20. Xu, G.; Guo, T.; Li, A.Q. Seismic resilient shear wall structures: A state-of-the-art review. Sci. China Technol. Sci. 2023, 66, 1640–1661. [Google Scholar] [CrossRef]
  21. T/CECA 20024–2022; Standard for Performance-Based Seismic Design of Building Structures. China Building Materials Industry Press: Beijing, China, 2022. (In Chinese)
  22. Dougill, J.W. On stable progressively fracturing solids. J. Appl. Math. Phys. 1976, 27, 423–437. [Google Scholar] [CrossRef]
  23. Lemaitre, J.; Desmorat, R. Engineering Damage Mechanics: Ductile, Creep, Fatigue and Brittle Failures; Springer: Berlin/Heidelberg, Germany, 2006. (In Chinese) [Google Scholar]
  24. GB/T 50010–2010; Code for Design of Concrete Structures. China Architecture & Building Press: Beijing, China, 2024. (In Chinese)
  25. Ren, X.D.; Li, J. Calculation of concrete damage and plastic deformation. Build. Struct. 2015, 45, 29–31. (In Chinese) [Google Scholar]
  26. JGJ 3–2010; Technical Specification for Concrete Structures of Tall Building. China Architecture & Building Press: Beijing, China, 2010. (In Chinese)
  27. Ou, J.P.; He, Z.; Wu, B.; Qiu, F.W. Seismic damage performance-based design of reinforced concrete structures. Earthq. Eng. Eng. Dyn. 1999, 1, 21–30. (In Chinese) [Google Scholar]
  28. Lubliner, J.; Oliver, J.; Oller, S.; Onate, E. A plastic-damage model for concrete. Int. J. Solids Struct. 1989, 25, 299–326. [Google Scholar] [CrossRef]
  29. Lee, J.; Fenves, G.L. Plastic-damage model for cyclic loading of concrete structures. J. Eng. Mech. 1998, 124, 892–900. [Google Scholar] [CrossRef]
  30. Lei, B.; Qi, T.; Li, Y.; Jin, Z.; Qian, W. An enhanced damaged plasticity model for concrete under cyclic and monotonic triaxial compression. Eur. J. Mech.-A/Solids 2023, 100, 104999. [Google Scholar] [CrossRef]
  31. Shafaie, V.; Ghodousian, O.; Ghodousian, A.; Homayounfar, M.; Rad, M.M. Slant shear tests and fuzzy logic integration for evaluating shear bond strength in SCC and FRSCC repair applications. Case Stud. Constr. Mater. 2025, 22, e04176. [Google Scholar] [CrossRef]
  32. Hibbitt, Karlsson & Sorensen. ABAQUS/Standard: User’s Manual; Dassault Systèmes: Johnston, RI, USA, 1997. [Google Scholar]
  33. Yao, F.B.; Guan, Q.; Wang, P.D. Simulation analysis of damage factor based on ABAQUS damaged plasticity model. Struct. Eng. 2019, 35, 76–81. (In Chinese) [Google Scholar]
  34. Dong, G.; Gu, Q.; Tan, Y.; Tian, S.; Gao, H. Experimental analysis on the seismic performance of prefabricated double-face superposed shear walls with different horizontal connection. J. Vib. Shock. 2020, 39, 107–114. (In Chinese) [Google Scholar]
  35. Luo, Y.Q.; Gu, Q.; Zhao, D.F.; Tian, S.; Tan, Y. Research on a seismic performances of T-shaped double-sided composited concrete shear walls with constructional edge members. Ind. Constr. 2021, 51, 90–97. (In Chinese) [Google Scholar]
  36. Gu, Q.; Yu, G.; Tan, Y.; Zhao, D.-F.; Gao, H.-Y. Experimental study on seismic behavior of L-shape double-side precast composite shear walls with constructional boundary elements. J. Archit. Civ. Eng. 2021, 38, 47–55. (In Chinese) [Google Scholar]
  37. Park, R. Evaluation of ductility of structures and structural assemblages from laboratory testing. Bull. N. Z. Soc. Earthq. Eng. 1989, 22, 155–166. [Google Scholar] [CrossRef]
  38. Alfarah, B.; López-Almansa, F.; Oller, S. New methodology for calculating damage variables evolution in Plastic Damage Model for RC structures. Eng. Struct. 2017, 132, 70–86. [Google Scholar] [CrossRef]
  39. Gu, Q.; Ji, Y.; Cheng, J.F.; Peng, Y.; Zhao, D.; Ruan, Z. Seismic Behavior of L-Shaped Precast Concrete Double-Faced Superposed Shear Wall with Steel Truss Connectors. J. Build. Eng. 2025, 106, 112658. [Google Scholar] [CrossRef]
Figure 1. Uniaxial stress–strain curve of concrete [24].
Buildings 15 01844 g001
Figure 2. Damage assessment method for concrete components based on the uniaxial damage evolution parameter of concrete dc(t). (a) dc. (b) dt.
Buildings 15 01844 g002
Figure 3. Cross-sectional dimensions and reinforcement arrangements of the shear wall specimens (unit: mm). (a) Rectangular. (b) T-shaped. (c) L-shaped.
Buildings 15 01844 g003
Figure 4. Loading history.
Buildings 15 01844 g004
Figure 5. Material models. (a) Concrete compressive model. (b) Concrete tensile model. (c) Bilinear elastic-plastic model of steel bar.
Buildings 15 01844 g005
Figure 6. Comparison of the skeleton curves between the test and the simulation. (a) RCW-1. (b) RCW-T. (c) RCW-L.
Buildings 15 01844 g006
Figure 7. Concrete damage of RCW-1. (a) Crack point (Dt). (b) Crack point (Dc). (c) Yield point (Dt). (d) Yield point (Dc). (e) Peak point (Dt). (f) Peak point (Dc).
Buildings 15 01844 g007
Figure 8. M-dc curve of bottom unit of RCW-1. (a) Positive direction. (b) Negative direction.
Buildings 15 01844 g008
Figure 9. Concrete damage of RCW-T. (a) Crack point (Dt). (b) Crack point (Dc). (c) Yield point (Dt). (d) Yield point (Dc). (e) Peak point (Dt). (f) Peak point (Dc).
Buildings 15 01844 g009
Figure 10. M-dc curve of bottom unit of RCW-T. (a) Positive direction. (b) Negative direction.
Buildings 15 01844 g010
Figure 11. Concrete damage of RCW-L. (a) Crack point (Dt). (b) Crack point (Dc). (c) Yield point (Dt). (d) Yield point (Dc). (e) Peak point (Dt). (f) Peak point (Dc).
Buildings 15 01844 g011
Figure 12. M-dc curve of bottom unit of RCW-L. (a) Positive direction. (b) Negative direction.
Buildings 15 01844 g012
Figure 13. Step-by-step process for evaluating the damage grade using the proposed method.
Buildings 15 01844 g013
Table 1. The values of dt corresponding to different concrete strength grades.
Concrete Strength Gradesft,r (MPa)εt,r (10−6)αtεtu/εt,rdt,rdtu
C302.01951.252.510.300.86
C352.201001.532.260.300.85
C402.391041.802.100.300.83
C452.511071.952.020.300.83
C502.641102.191.930.300.82
C552.741122.361.870.310.82
C602.851152.551.820.310.81
C652.931162.691.790.310.81
C702.991182.811.760.320.81
C753.051192.911.740.320.80
C803.111203.031.720.320.80
Note: εtu is the concrete tensile strain corresponding to stress that is equal to 0.5ft,r in the tensile descending segment of Figure 1. dt,r and dtu are the uniaxial tensile damage evolution parameters of concrete corresponding to εt,r and εtu, respectively.
Table 2. The values of dc corresponding to different concrete strength grades.
Concrete Strength Gradesfc,r (MPa)εc,r (10−6)αcεc,u/εc,rdc,rdcu
C3020.114720.752.860.540.92
C3523.415310.962.730.510.91
C4026.815891.172.490.480.90
C4529.616341.342.320.460.88
C5032.416781.502.200.440.87
C5535.517271.682.090.420.86
C6038.517691.852.030.400.85
C6541.518082.021.970.370.84
C7044.518442.181.910.350.82
C7547.418842.341.900.330.82
C8050.219222.491.900.310.82
Note: εcu is the concrete compressive strain corresponding to stress that is equal to 0.5fc,r in the compressive descending segment of Figure 1. dc,r and dcu are the uniaxial compressive damage evolution parameters of concrete corresponding to εc,r and εcu, respectively.
Table 3. Damage assessment method for concrete components based on concrete compressive strain/compressive damage variable [21].
TypeDamage Grade
L1L2L3L4L5L6
Compressive damage variable≤0.01≤0.2≤0.5≤0.65≤0.8>0.8
Compressive strain≤0.5εc,r≤1.0εc,r≤1.5εc,r≤1.0εcu≤1.5εcu>1.5εcu
Table 4. Damage assessment method for concrete components based on dc(t).
Damage GradeMacro Descriptiondcdt
L1Non-damaged statedc,rdt,r
L2Slightly damaged state≤0.25dcu + 0.75dc,r≤0.25dtu + 0.75dt,r
L3Mildly damaged state≤0.50dcu + 0.50dc,r≤0.50dtu + 0.50dt,r
L4Moderately damaged state≤0.75dcu + 0.25dc,r≤0.75dtu + 0.25dt,r
L5Relatively severely damaged statedcudtu
L6Severely damaged state>dcu>dtu
Table 5. Damage grades of concrete components corresponding to the uniaxial tensile damage evolution parameter of concrete (dt).
Concrete Strength
Grades
Damage Grade
L1L2L3L4L5L6
C30≤0.30≤0.44≤0.58≤0.72≤0.86>0.86
C35≤0.30≤0.44≤0.58≤0.71≤0.85>0.85
C40≤0.30≤0.43≤0.57≤0.70≤0.83>0.83
C45≤0.30≤0.43≤0.57≤0.70≤0.83>0.83
C50≤0.30≤0.43≤0.56≤0.69≤0.82>0.82
C55≤0.31≤0.44≤0.57≤0.69≤0.82>0.82
C60≤0.31≤0.44≤0.56≤0.69≤0.81>0.81
C65≤0.31≤0.44≤0.56≤0.69≤0.81>0.81
C70≤0.32≤0.44≤0.57≤0.69≤0.81>0.81
C75≤0.32≤0.44≤0.56≤0.68≤0.80>0.80
C80≤0.32≤0.44≤0.56≤0.68≤0.80>0.80
Table 6. Damage grades of concrete components corresponding to the uniaxial compressive damage evolution parameter of concrete (dc).
Concrete Strength
Grades
Damage Grade
L1L2L3L4L5L6
C30≤0.54≤0.64≤0.73≤0.83≤0.92>0.92
C35≤0.51≤0.61≤0.71≤0.81≤0.91>0.91
C40≤0.48≤0.590.69≤0.80≤0.90>0.90
C45≤0.46≤0.57≤0.67≤0.78≤0.88>0.88
C50≤0.44≤0.55≤0.66≤0.76≤0.87>0.87
C55≤0.42≤0.53≤0.64≤0.75≤0.86>0.86
C60≤0.40≤0.51≤0.63≤0.74≤0.85>0.85
C65≤0.37≤0.49≤0.61≤0.72≤0.84>0.84
C70≤0.35≤0.47≤0.59≤0.70≤0.82>0.82
C75≤0.33≤0.45≤0.58≤0.70≤0.82>0.82
C80≤0.31≤0.44≤0.57≤0.69≤0.82>0.82
Table 7. Relationship between the tensile and compressive damage indices and the damage grades of concrete components.
Damage GradeMacro DescriptionDamage Index Dc(t)0
L1Non-damaged stateDc(t)0 = 0
L2Slightly damaged state0 < Dc(t)0 ≤ 0.2
L3Mildly damaged state0.2 < Dc(t)0 ≤ 0.4
L4Moderately damaged state0.4 < Dc(t)0 ≤ 0.6
L5Relatively severely damaged state0.6 < Dc(t)0 ≤ 0.8
L6Severely damaged stateDc(t)0 > 0.8
Table 8. Test results.
SpecimenLoading
Direction
CrackYieldPeakUltimate
Pcr (kN)Δcr (mm)Py (kN)Δy (mm)Pp (kN)Δp (mm)Pu (kN)Δu (mm)
RCW-1positive4106.5857314.3668628.8665045.70
negative3872.255977.2174630.3358050.03
RCW-Lpositive3262.70100917.58113023.8475145.78
negative3143.0586213.55101146.1084060.60
RCW-Tpositive2841.04124613.68141522.05101031.81
negative2760.809429.84107229.8492338.88
Note: Pcr, Py, Pp, and Pu are the crack load, yield load, peak load, and ultimate load, respectively. Δcr, Δy, Δp, and Δu are the crack displacement, yield displacement, peak displacement, and ultimate displacement, respectively. Py and Δy are determined using the equivalent energy method [37].
Table 9. Values of CDP model parameters.
ParameterValue
Dilation angle ψ30°
Eccentricity e0.1
Ratio of the initial biaxial compressive yield stress to the initial uniaxial compressive yield stress fb0/fc01.16
Ratio of the second stress invariant on the tensile meridian Kc0.667
Viscosity coefficient ν0.005
Table 10. Comparison between the test and simulation results.
Specimen Loading
Direction
LoadDisplacement
PpE
(kN)
PpS
(kN)
PpE/PpSΔuE
(mm)
ΔuS
(mm)
ΔuEuS
RCW-1positive6867371.0728.8625.530.88
negative7467691.0330.3326.270.87
RCW-Lpositive113010850.9623.8425.231.06
negative101111221.1146.1037.820.82
RCW-Tpositive141515211.0722.0524.201.10
negative107211401.0629.8427.560.92
Note: PpE and PpS are the peak loads of the test and simulation, respectively. ΔuE and ΔuS are the peak displacements of the test and simulation, respectively.
Table 11. Damage assessment of concrete shear wall components.
Damage Gradeεc (10−3)dcdtDc0
RCW-1crackvalue0.30.370.990
damage gradeL1L1L6L1
yieldvalue5.160.810.990.62
damage gradeL5L5L6L5
peakvalue900.980.990.96
damage gradeL6L6L6L6
RCW-Lcrackvalue1.1/0.930.88/0.830.990.76/0.66
damage gradeL2L5L6L5
yieldvalue3.6/2.10.980.990.96
damage gradeL4/L3L6L6L6
peakvalue27/200.980.990.96
damage gradeL6L6L6L6
RCW-Tcrackvalue0.8/0.20.82/0.430.990.64/L1
damage gradeL1L4/L2L6L5/L3
yieldvalue18/0.80.98/0.650.990.96/0.3
damage gradeL6/L1L6/L4L6L6/L3
peakvalue57/60.980.990.96
damage gradeL6L6L6L6
Note: If the data shown in the table are in the form of A/B, A represents the data of the bottom unit of the web plate, and B represents the data of the bottom unit of the flange. Dc0 indicates the compressive damage index.
Disclaimer/Publisher’s Note: The statements, opinions and data contained in all publications are solely those of the individual author(s) and contributor(s) and not of MDPI and/or the editor(s). MDPI and/or the editor(s) disclaim responsibility for any injury to people or property resulting from any ideas, methods, instructions or products referred to in the content.

