Article

Study on the Strength Characteristics and Microscopic Structure of Artificial Structural Loess

Shaanxi Key Laboratory of Safety and Durability of Concrete Structures, Xijing University, Xi’an 710123, China
*
Author to whom correspondence should be addressed.
Buildings 2025, 15(11), 1761; https://doi.org/10.3390/buildings15111761
Submission received: 22 April 2025 / Revised: 16 May 2025 / Accepted: 19 May 2025 / Published: 22 May 2025

Abstract

The structure, strength, and deformation characteristics of artificial structural loess can be manually controlled, which has significant advantages in scientific research on loess. By preparing and testing artificial structured loess, the natural properties of structured loess can be better investigated and studied. In this paper, the influence of varying moisture contents and additive dosages on artificial structured loess strength characteristics through triaxial shear tests were analyzed. The moisture content and additive dosage reflecting the structural properties of natural loess were obtained. Based on the microscopic test results, the mineral components, micromorphology, and pore characteristics of artificial structural loess were analyzed, and the mechanism of the structural evolution of loess under mechanical action was revealed. The results show that the minimum differences in the peak strength between W16-Y2.0C2.0 and undisturbed soil under confining pressures of 50, 100, and 200 kPa are 6.481 kPa, 7.676 kPa, and 4.912 kPa, respectively. The minimum differences in the cohesion and inner friction angle between W16-Y2.0C2.0 and undisturbed soil are 2 kPa and 0.2°, respectively, indicating that W16-Y2.0C2.0 is the optimal structural soil with a structural strength closest to that of undisturbed soil. Compared with the undisturbed loess, the content of calcite in the artificial structure loess increases from 9.8% to 11.2%, the proportion of plagioclase decreases from 20.5% to 17.4%, amphibole is consumed completely, and 2.1% of halite is generated. Furthermore, the pores of structured soil exhibit a three-peak distribution and are divided into four types, including micropores (≤0.02 μm), small pores (0.02~0.21 μm), medium pores (0.21~13.5 μm), and large pores (≥13.5 μm). When the pressure increases from 50 kPa to 200 kPa, micropores increase by 4.67%, small pores increase by 4.97%, medium pores decrease by 2.4%, and large pores decrease by 7.24%. The trend of pore structure changes in W16-Y2.0C2.0 is similar to that of undisturbed loess. The research results provide a reference for preparing and applying artificial structural loess.

1. Introduction

Loess is a Quaternary sediment located in arid and semiarid regions, widely distributed in Asia, Europe, Africa, North America, and South America [1,2,3,4,5,6]. Loess in nature has its special structural properties, including the geometric characteristics of soil particles, contact and connection characteristics, spatial arrangement characteristics, pore geometry, and water-filling characteristics [7,8,9], which give it high strength in its natural state. However, once immersed in water, the strength greatly decreases, causing engineering disasters such as foundation settlement and slope instability, which pose a serious threat to the safety of people’s lives and property. Therefore, investigating the macro- and micromechanisms of the mechanical properties of structural loess is of great significance.
Preparing and testing on artificial structural loess instead of undisturbed loess can economically facilitate and accurately investigate the mechanical and structural characteristics of loess [10,11,12,13,14,15,16]. To make the structure of simulated structural loess more similar to the natural loess structure, scholars have made a series of attempts. Xue et al. [17] prepared structural loess by adding a cementitious material composed of slag, white clay, and calcium carbide residue to the loess and found that the unbounded compressive strength of the loess was significantly improved, and the particles were bonded through the formation of hydration products and subsequent filling. Chang et al. [18] added phosphogypsum, cement, and lime to loess to evaluate its mechanical properties and found that the composite material with phosphogypsum and lime contents of 25% and 5%, respectively, and a cement slag ratio of 4:6 had the highest strength. Zhang et al. [19] added industrial salt, calcium oxide particles, and gypsum powder to loess to prepare artificial structural loess and found that the liquid limit and plastic limit of artificial loess were less than those of undisturbed loess, and the optimal w and ρd max were close to those of undisturbed loess. Some artificial structural soils simulated by the above methods can better reflect the structure and strength characteristics of natural loess. However, the changes in the basic physical properties of artificial structural loess can also have an obvious impact on its strength characteristics. Bao et al. [20] compared loess samples with different w and ρd and found that the changes in w and ρd have a significant impact on the shear strength parameters of the soil samples. Yan et al. [21] studied the effect of dry density on the static liquefaction of loess samples and found that the steady-state intensity of soil samples tends to increase in succession with the increase in ρd. Ma et al. [22] conducted permeability tests on four types of structural soils with an initial moisture content and found that when the initial moisture content was high, the uniformity of the samples prepared by the prewetting method was poorer than that of transfer wetting method. Nan et al. [23] studied soil samples with different initial w under different constraint pressures and found that the change in the shear behavior of the soil is related to the restriction pressure, initial w, and failure mode of the sample.
Some scholars have begun to study the microstructure and material composition of artificial structural loess. Li et al. [24] conducted a mercury injection test on compacted loess and found that compacted loess has the same pore and particle flocculation structure characteristics as undisturbed soil at a higher density. Jiang et al. [25] conducted microstructural research using MIP, SEM, and ESEM tests and found that the fracture of cemented bonds is influenced by stress paths and constraint pressures, which have an obvious impact on the strength and deformation behavior of soil. Yao et al. [26] conducted an SEM test on a sample and found that the influence of sample height on the uniformity of remolded loess mainly stems from the decrease in the compactness of the top-down samples, resulting in changes in the thickness of the coarse particle surface coating and the content of clay particles. Qi et al. [27] conducted applications of macroporosity, a pore-size distribution curve, and microstructures to remodeled soil samples with different P and w and found that with the increase in w, the macropore volume of the sample increases and the pore shape becomes thinner and longer. In summary, some progress has been made in the artificial preparation of structural loess. However, these studies mainly simulate the structural properties of undisturbed loess from a macro- or microperspective, and there is relatively little research on the inner interactions of the microstructure of simulated structural loess.
This study took loess in a construction foundation pit in Chang’an District, Xi’an City, Shaanxi Province, as the research object, and it conducted research on artificial structural loess with different moisture contents mixed with cement and salt. Based on triaxial shear tests, the impact rule of different moisture contents and additive dosages on loess strength characteristics was analyzed. Based on XRD and SEM tests, the mineral composition and microstructure differences between the optimal structured loess and the undisturbed loess were compared and analyzed. Based on MIP tests, the pore distribution characteristics and evolution rules under pressure of the optimal structural loess and the undisturbed loess were quantitatively analyzed, and the enhancement effect of pore structure evolution on mechanical properties was revealed by linking pore structure with shear strength indicators. The research results provide a reference for preparing and applying artificial structural loess.

2. Materials and Methods
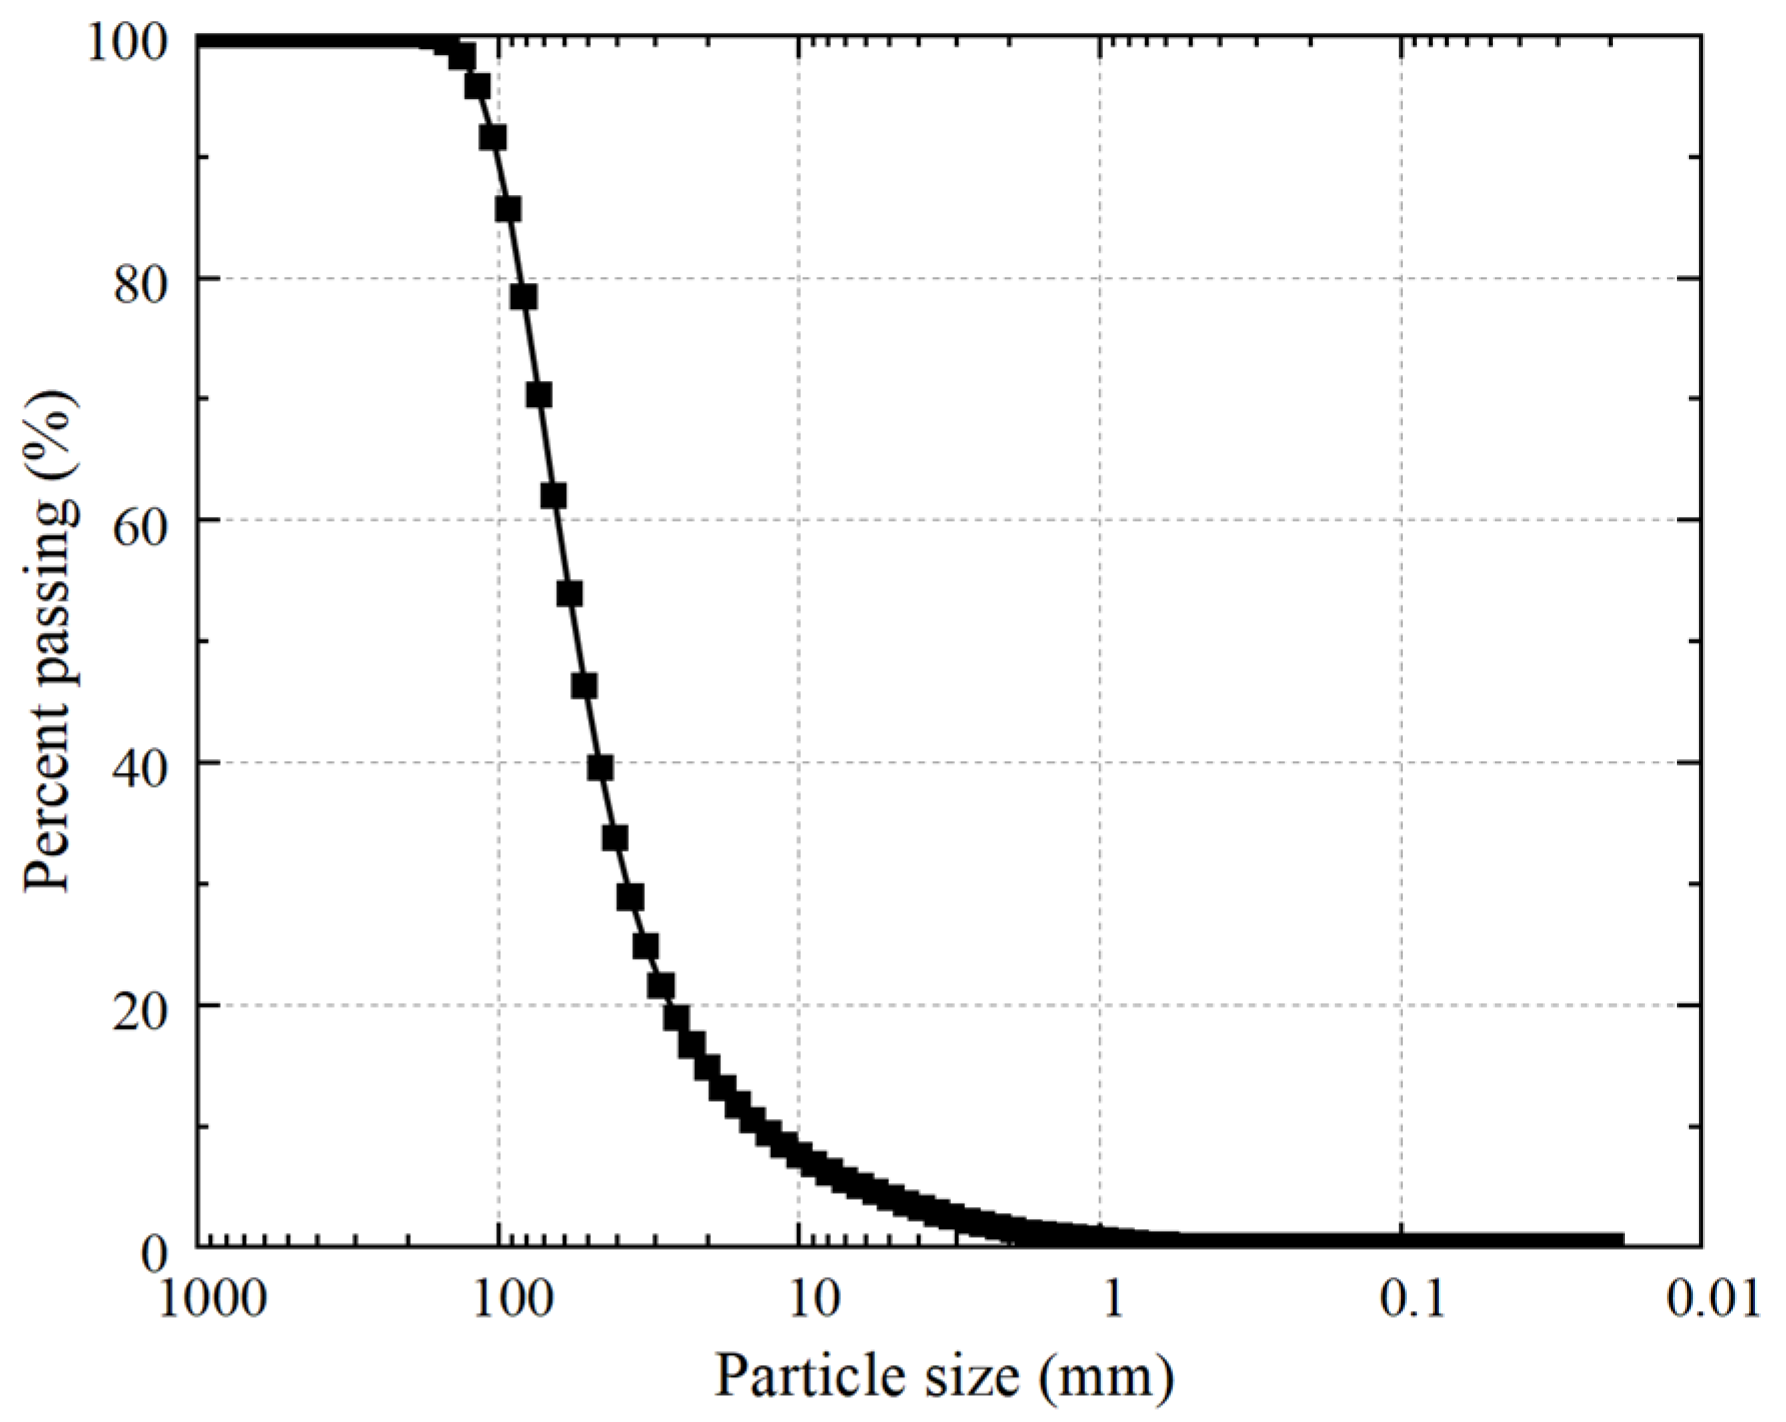
2.1. Test Materials

The loess sample used in this study was collected in a construction foundation pit in Chang’an District, Xi’an City, Shaanxi Province. The loess was taken from a depth of 2.0 m to 3.0 m, and the loess sample was yellowish-brown and uniform, as shown in Figure 1. When sampling, the loess sample was roughly cut into 40 cm × 40 cm × 40 cm and tightly wrapped in a black plastic bag and tape. The upper and lower parts of the sample were marked, and disturbances of the sample were strictly controlled during transportation before placing it in a laboratory without light. By the standard for geotechnical test methods (GB/T50123-2019) [28], the basic physical indicators of the loess samples, such as the dry density, moisture content, and specific gravity, were tested, as shown in Table 1. The grading curve was obtained as shown in Figure 2. The coefficient of uniformity Cu is 4.7, and the coefficient of curvature Cc is 1.7 for the loess.
The salt and cement used in this study were purchased on the market. The main ingredient of salt is NaCl, which is a neutral inorganic salt, and it comprises white cubic crystals or fine crystal powders. It is easy to dissolve in water or glycerin, difficult to dissolve in ethanol, and insoluble in hydrochloric acid. The quick-setting cement of P.O52.5 has the characteristics of high compressive strength, an early setting time, and good plasticity.

2.2. Sample Preparation

The sample preparation of the artificial structural loess was carried out by the compaction method. The collected soil samples were dried, crushed, and sieved through a 0.5 mm sieve for future use. To ensure the consistency and comparability of the experiment, the maximum dry density was selected as the standard for all loess samples, and a ring knife with a height of 100 mm and a diameter of 50 mm was chosen as the sample mold. Firstly, a certain amount of the dried and sieved soil sample was taken and divided into three groups. According to the mix proportion, salt with a content of 2% and cement with contents of 1.0%, 2.0%, and 4.0%, respectively, were weighed and uniformly mixed into the three groups of soil samples according to the mass ratio. Each group of the mixture was divided into three equal parts. The water was added to three groups of mixtures, adjusting the moisture content of each sample to 8%, 16%, and 24%, for a total of 9 samples. According to the standard for geotechnical test methods (GB/T 50123-2019) [28], the prepared samples were evenly placed in five layers into the ring knife. The quality of each layer of soil material was equal, while ensuring that the number of compaction times for each layer was the same. After pressing, the surface was scraped to ensure a better connection between the next layer and the previous layer until the last layer was filled. To fully exert the bonding effect of the additives in the loess, all the prepared loess samples were wrapped with plastic wrap and marked, placing them in a moisturizing dish to stand for more than 48 h. After achieving uniform moisture inside the loess sample, the sample was covered with plastic film for sealing and curing to prevent moisture evaporation. The preparation process is shown in Figure 3.

2.3. Test Method

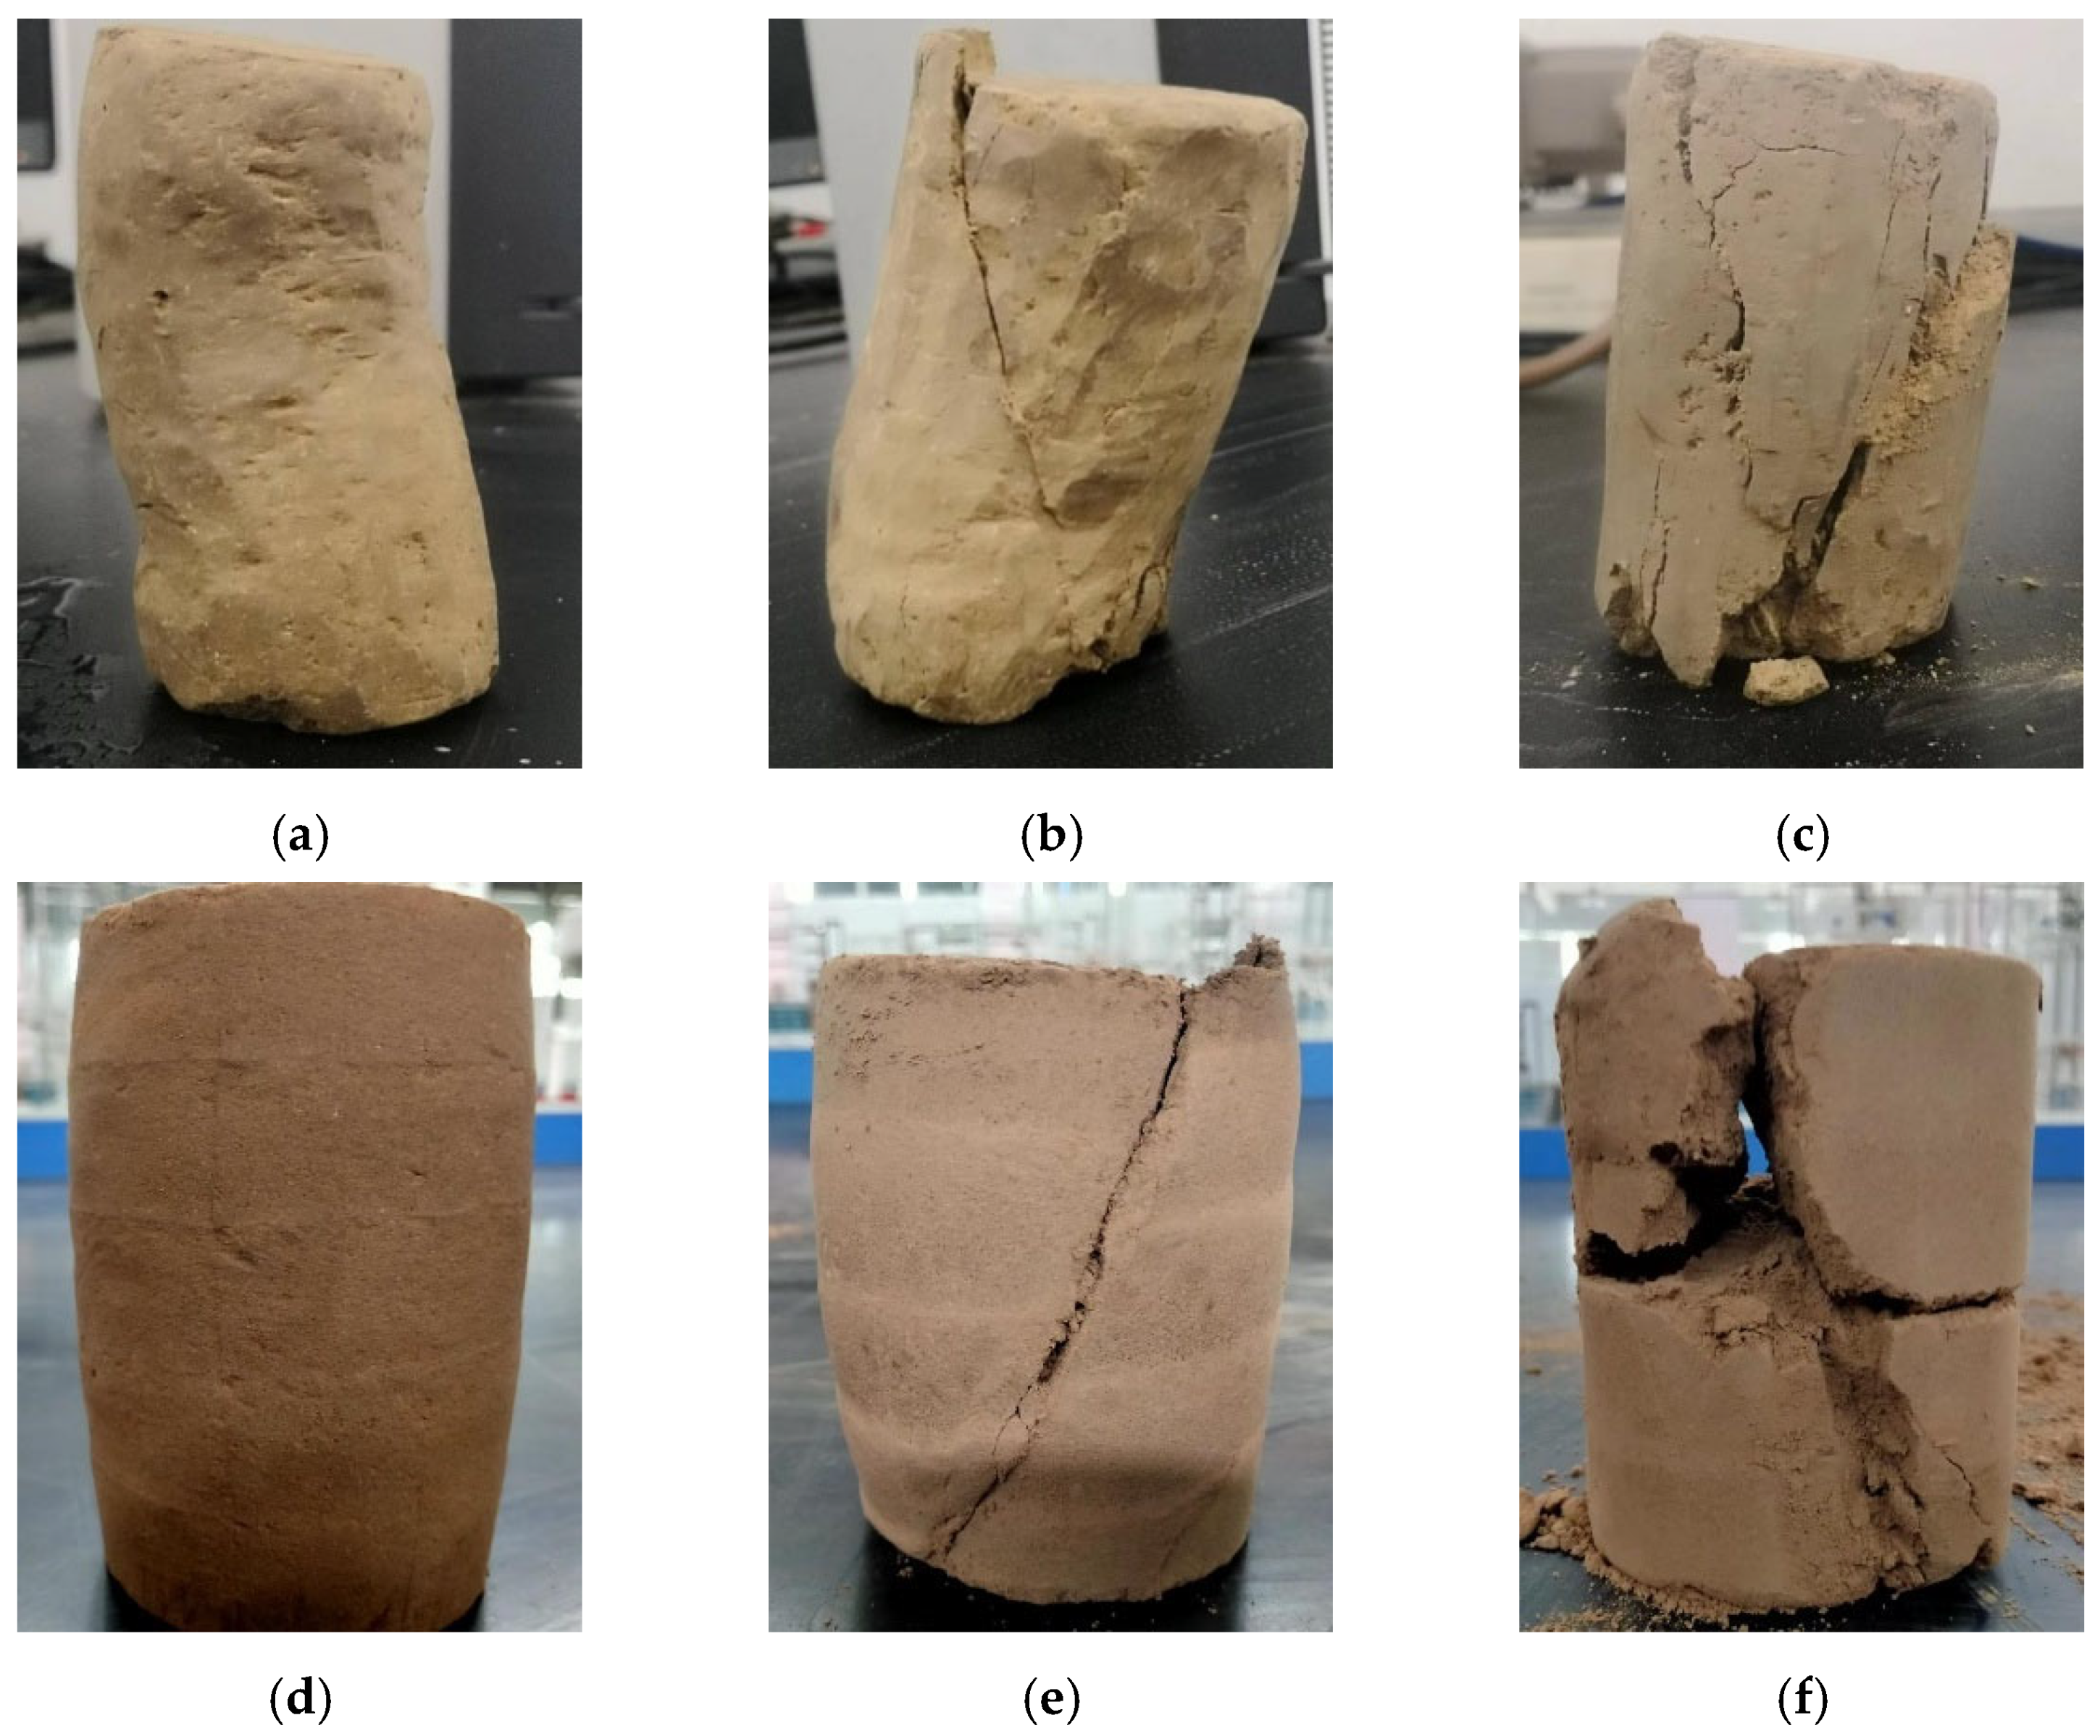
2.3.1. Triaxial Shear Test

According to the standard method for geotechnical engineering testing (GB/T 50123-2019) [28], the KTL-LDF50 soil static triaxial testing machine produced by Xi’an Kangtuoli Instrument Co., Ltd. (Xi’an, China) was used to conduct consolidated–undrained triaxial shear tests on undisturbed samples and various structural soil samples. A total of 28 sets of experiments were conducted using an undisturbed sample (A) as the control group, with salt (Y), cement (C), and the moisture content (W) as variables. Each group of experiments was set to repeat the experiment. Based on the relevant literature references, a salt content of 2%; cement contents of 1.0%, 2.0%, and 4.0%; and moisture contents of 8%, 16%, and 24% were selected. The test plan is depicted in Table 2. The triaxial shear rate was controlled to be 0.8 mm/min, and the confining pressure was adjusted to 50, 100, and 200 kPa during the experimental process. The influence of different moisture contents and additive dosages on the loess structural strength was analyzed. Using the structural strength of undisturbed soil as the mean, the standard deviation of each structural loess was compared, and the moisture content and addition amount of the structural loess with the smallest standard deviation were selected as the optimal structural loess.

2.3.2. Microscopic Test

According to the standard method for geotechnical engineering testing (GB/T 50123-2019) [28], the XRD instrument of D/MAX2500 manufactured by Rigaku Corporation, Tokyo, Japan, was used to conduct XRD tests on undisturbed loess and optimal structural loess. To determine the difference in the mineral composition between the optimal structural loess and undisturbed loess, two samples were ground to 200 mesh using agate mortar and dried continuously at 105 °C for 24 h, and then the ground powder was pressed into a sample rack for testing. The testing conditions were a Cu target, K α radiation, graphite monochromator filtering, a tube voltage of 40 kV, a tube current of 200 mA, a slit of DS/SS1°, an RS/RSM of 0.3 mm, a scanning speed of 4°/min, and a scanning range of 5°~75°. Subsequently, quantitative analysis was conducted on the two samples to investigate the effect of cement and salt addition on mineral phase transformation.
According to the standard method for geotechnical engineering testing (GB/T 50123-2019) [28], the scanning electron microscope of JSM-5600LV manufactured by JEOL, Ltd., Tokyo, Japan, was used to conduct an SEM test on the undisturbed loess and optimal structural loess. To determine the difference between the microstructure of the optimal structured loess and undisturbed loess, the two samples were naturally air-dried, solidified, cut, polished, and sprayed with gold. They were then loaded into a field-emission scanning electron microscope and analyzed and observed at two magnifications of 500 and 1500 times. Furthermore, the effect of adding cement and salt on the particle bonding mechanism was analyzed.
According to the standard method for geotechnical engineering testing (GB/T 50123-2019) [28], the fully automatic mercury intrusion porosimeter of Pore Master GT produced by Quantachrome Instrument, Ltd., Boynton Beach, FL, USA, was used to conduct the MIP test. To divide the size of the large pores, medium pores, small pores, and micropores of the sample, the optimal structural loess was naturally air-dried and trimmed into cylindrical rods with a dimension of 10 mm in diameter and 10 mm in height. The trimmed sample in the initial state was subjected to mercury intrusion porosimetry to analyze its pore characteristics. To quantitatively analyze the pore distribution characteristics and evolution laws under pressure of the optimal structural loess and undisturbed loess, low-pressure and high-pressure mercury injections were carried out on trimmed samples, and the data of the mercury injection amount changing with pressure were continuously monitored and recorded. During the experiment, the low-pressure stage was 0.1~50 kPa, mainly measuring the pore characteristics of large pores and some medium pores. The high-pressure stage was 50~200 MPa, mainly measuring the pore characteristics of small pores and micropores. Next, the relationship between the pore structure and shear strength index was established to elucidate the enhancement effect of pore structure evolution on the mechanical properties.

3. Results and Analysis

3.1. Analysis of Stress–Strain Curve

Figure 4 shows the stress–strain relationship curve corresponding to the undisturbed loess and each artificial structural loess under different pressures. It can be observed that the combined effect of the moisture content, pressure, and additive changes the stress–strain relationship of the artificial structural loess samples. Under different pressures, the stress–strain regular pattern of the structural loess with the same moisture content and cement dosage is similar. As the pressure increases, the curve has a significant upward trend. The primary cause for the situation is that the loess particles are squeezed and compressed, and a decrease in spacing accompanies the particle rearrangement. Macroscopically, it shows a slow increase in the axial strain, but the structure of the loess is wholly strengthened [29]. Under the same pressure, when the cement dosage remains constant, the sample curve gradually moves downward with an increasing moisture content. Its breaking strength is negatively correlated with the moisture content, and the types of each curve are very different. This is because as the moisture content increases, the water film on the surface of the loess particles gradually thickens, the contact points between the soil particles are fully lubricated, and the matrix suction between the particles is gradually lost [30]. Under the same moisture content, the sample curve increases with increasing cement dosage. Its breaking strength positively correlates with the cement dosage, and the overall trend between the curves is roughly similar. Structurally enhanced loess samples have higher bias and residual stresses, reflecting their better stability and resistance to deformation when subjected to shear stress [31]. The stress–strain curves exhibit strain softening for the structural loess with a moisture content of 8%. As the pressure increases, the corresponding strain at the curve’s inflection point slowly increases, indicating that the shear strength increases. For the structural loess with a moisture content of 16%, the curve gradually shifts from a weak strain softening to a stable strain with increasing pressure. For the structural loess with a moisture content of 24%, the curve gradually shifts from a stable strain to a weak strain softening with the increasing pressure. Compared with the other structural loess, the curves of W16-Y2.0C2.0 are more similar to A, which tend to overlap roughly.
The development process of different deformation strengths under a triaxial shear environment can lead to various failure modes of soil. Figure 5 shows the shear deformation failure modes of A and W16-Y2.0C2.0 in different confining pressures. It can be found from the figure that the shear failure of A includes bending, lateral expansion failure, shear band failure, and double-seam shear failure. The shear failure of W16-Y2.0C2.0 includes uniform compression, shear band, and fault failure. As the confining pressure increases, the overall deformation of the two samples becomes more significant, indicating that external pressure promotes the development of shear failure. It is consistent with the general laws of mechanics. When the confining pressure is 50 kPa, the failure modes of the two samples are similar. When the confining pressure is 100 kPa, the angle of the shear failure surface of the two samples is different, which is related to the inner structure of the sample. It is because W16-Y2.0C2.0 contains cement and salt, which can change the connection and arrangement of inner particles, thereby affecting the angle of shear failure surface formation [32]. When the confining pressure is 200 kPa, the degree of fragmentation of W16-Y2.0C2.0 is relatively severe. This is because a bonding structure is formed between the particles after adding cement to the sample. When damage occurs, some particles are pulled from the bonding matrix, resulting in more obvious fragmentation.

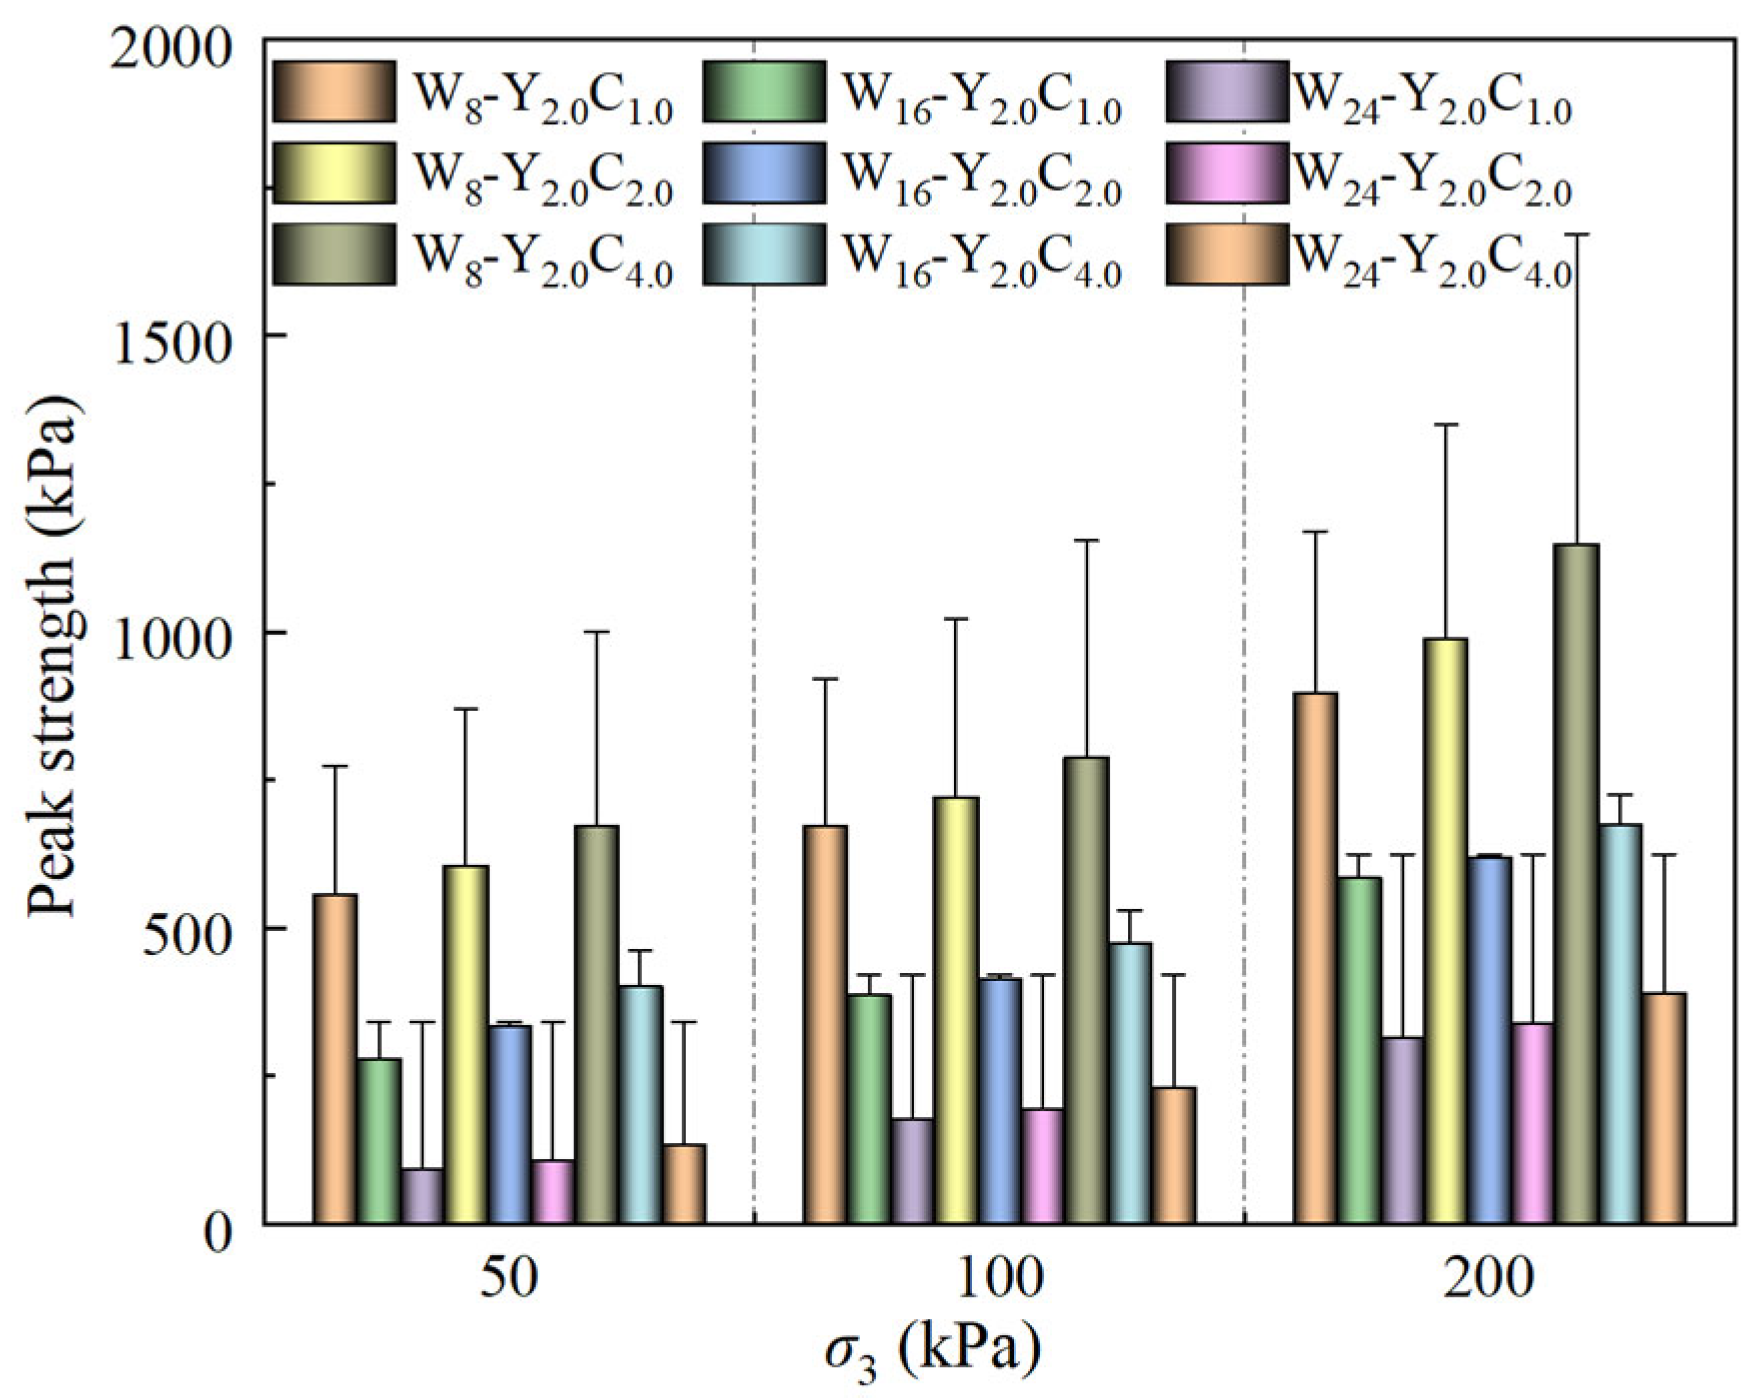
3.2. Analysis of Peak Strength Curve

Peak strength is the ultimate capacity of soil to resist shear failure [33]. When external forces are applied to the soil and the shear stress generated inside the soil reaches the limit, the soil slides relatively along a specific shear surface. Figure 6 shows a bar chart of the peak strength of each structural loess with error bars. It can be found from the figure that the peak strength shows an upward trend with increasing pressure. The peak strength gradually increases with the increasing cement dosage for the structural loess with the same moisture content. This is because adding cement to loess particles produces a hydration product that tightly wraps and connects the loess particles, forming a structure similar to that of skeleton cement. When subjected to shear forces, this structure can effectively transmit stress and inhibit the relative sliding of particles, significantly improving the shear strength of the soil [34]. The peak strength decreases with the increasing moisture content for the structural loess with the exact cement dosage. This phenomenon is because when the moisture content increases, the connection between particles is destroyed by water, and the soil structure becomes loose. Under the action of shear force, the relative slip and rearrangement of particles lead to a decrease in the shear strength of the soil. The standard deviation of the peak strength for each structural loess under three types of confining pressures is shown in Table 3. It can be seen that the standard deviation of the peak strength for W16-Y2.0C2.0 is the smallest under various confining pressures, with 50 kPa being 6.481, 100 kPa being 7.676, and 200 kPa being 4.912, indicating that the peak strength of W16-Y2.0C2.0 is closest to that of the undisturbed sample.

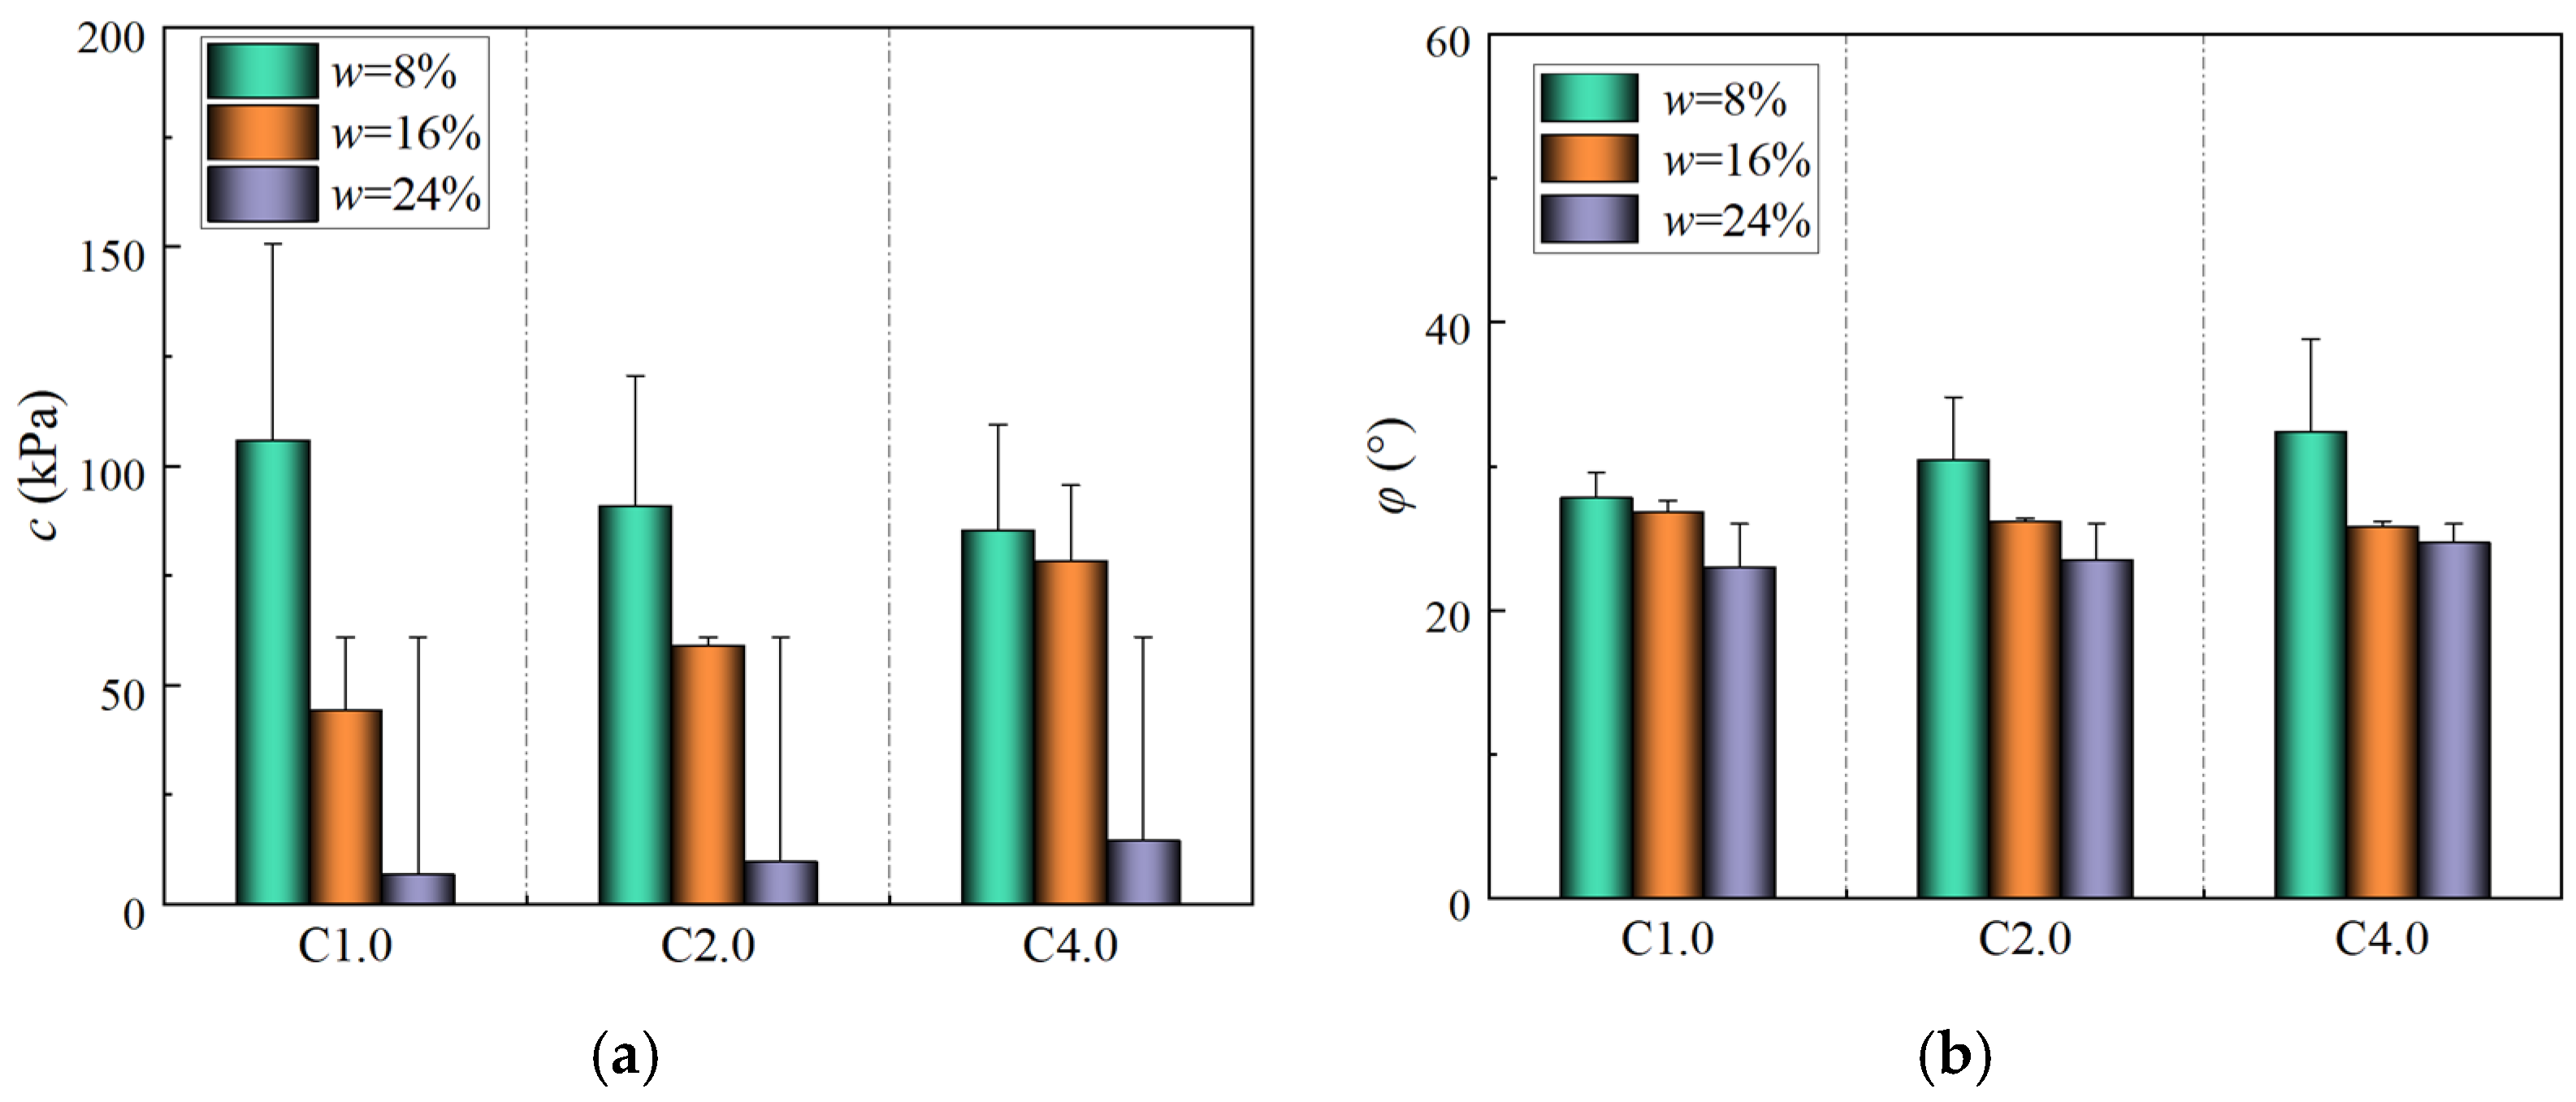
3.3. Analysis of Shear Strength Index

Cohesion and the inner friction angle are significant components of the shear strength of soil [35]. Figure 7 shows a bar chart of the shear strength index of the undisturbed loess and each structural loess. It can be observed from Figure 7a that for the structural loess with the exact cement dosage, the cohesion tends to decrease as the moisture content increases. This is because under a low moisture content, the cohesion of artificial structural loess mainly comes from the original cementitious substances and electrostatic attraction between soil particles. With the increase in the moisture content, water begins to hurt the loess’s cohesion. Excessive water dissolves some cemented substances, weakening the connection between particles, which results in a gradual decrease in the cohesion [36]. It can be observed from Figure 7b that for the structural loess with the exact cement dosage, the inner friction angles tend to decrease as the moisture content increases, and the reduction is quite apparent. This situation is because under a low moisture content, the water film between the particles is fragile, which does not affect the friction between the particles, and the inner friction angle is relatively stable. As the moisture content increases, the water film between particles becomes thicker, which plays a lubricating role, decreasing friction between the particles. At the same time, the loess particles undergo a certain degree of rearrangement, causing the initially tight structure to become loose and reducing the inner friction angle [37]. The standard deviation of the shear strength index for each type of structural loess is shown in Table 4. It can be seen that the minimum standard deviations of the cohesive inner friction angle are 2 kPa and 0.2°, respectively, corresponding to W16-Y2.0C2.0, indicating that the cohesive inner friction angle of W16-Y2.0C2.0 is the closest to that of the undisturbed sample. Based on the peak strength, cohesion, and inner friction angle, W16-Y2.0C2.0 is the optimal structural loess, and its structural strength is most similar to that of undisturbed loess.

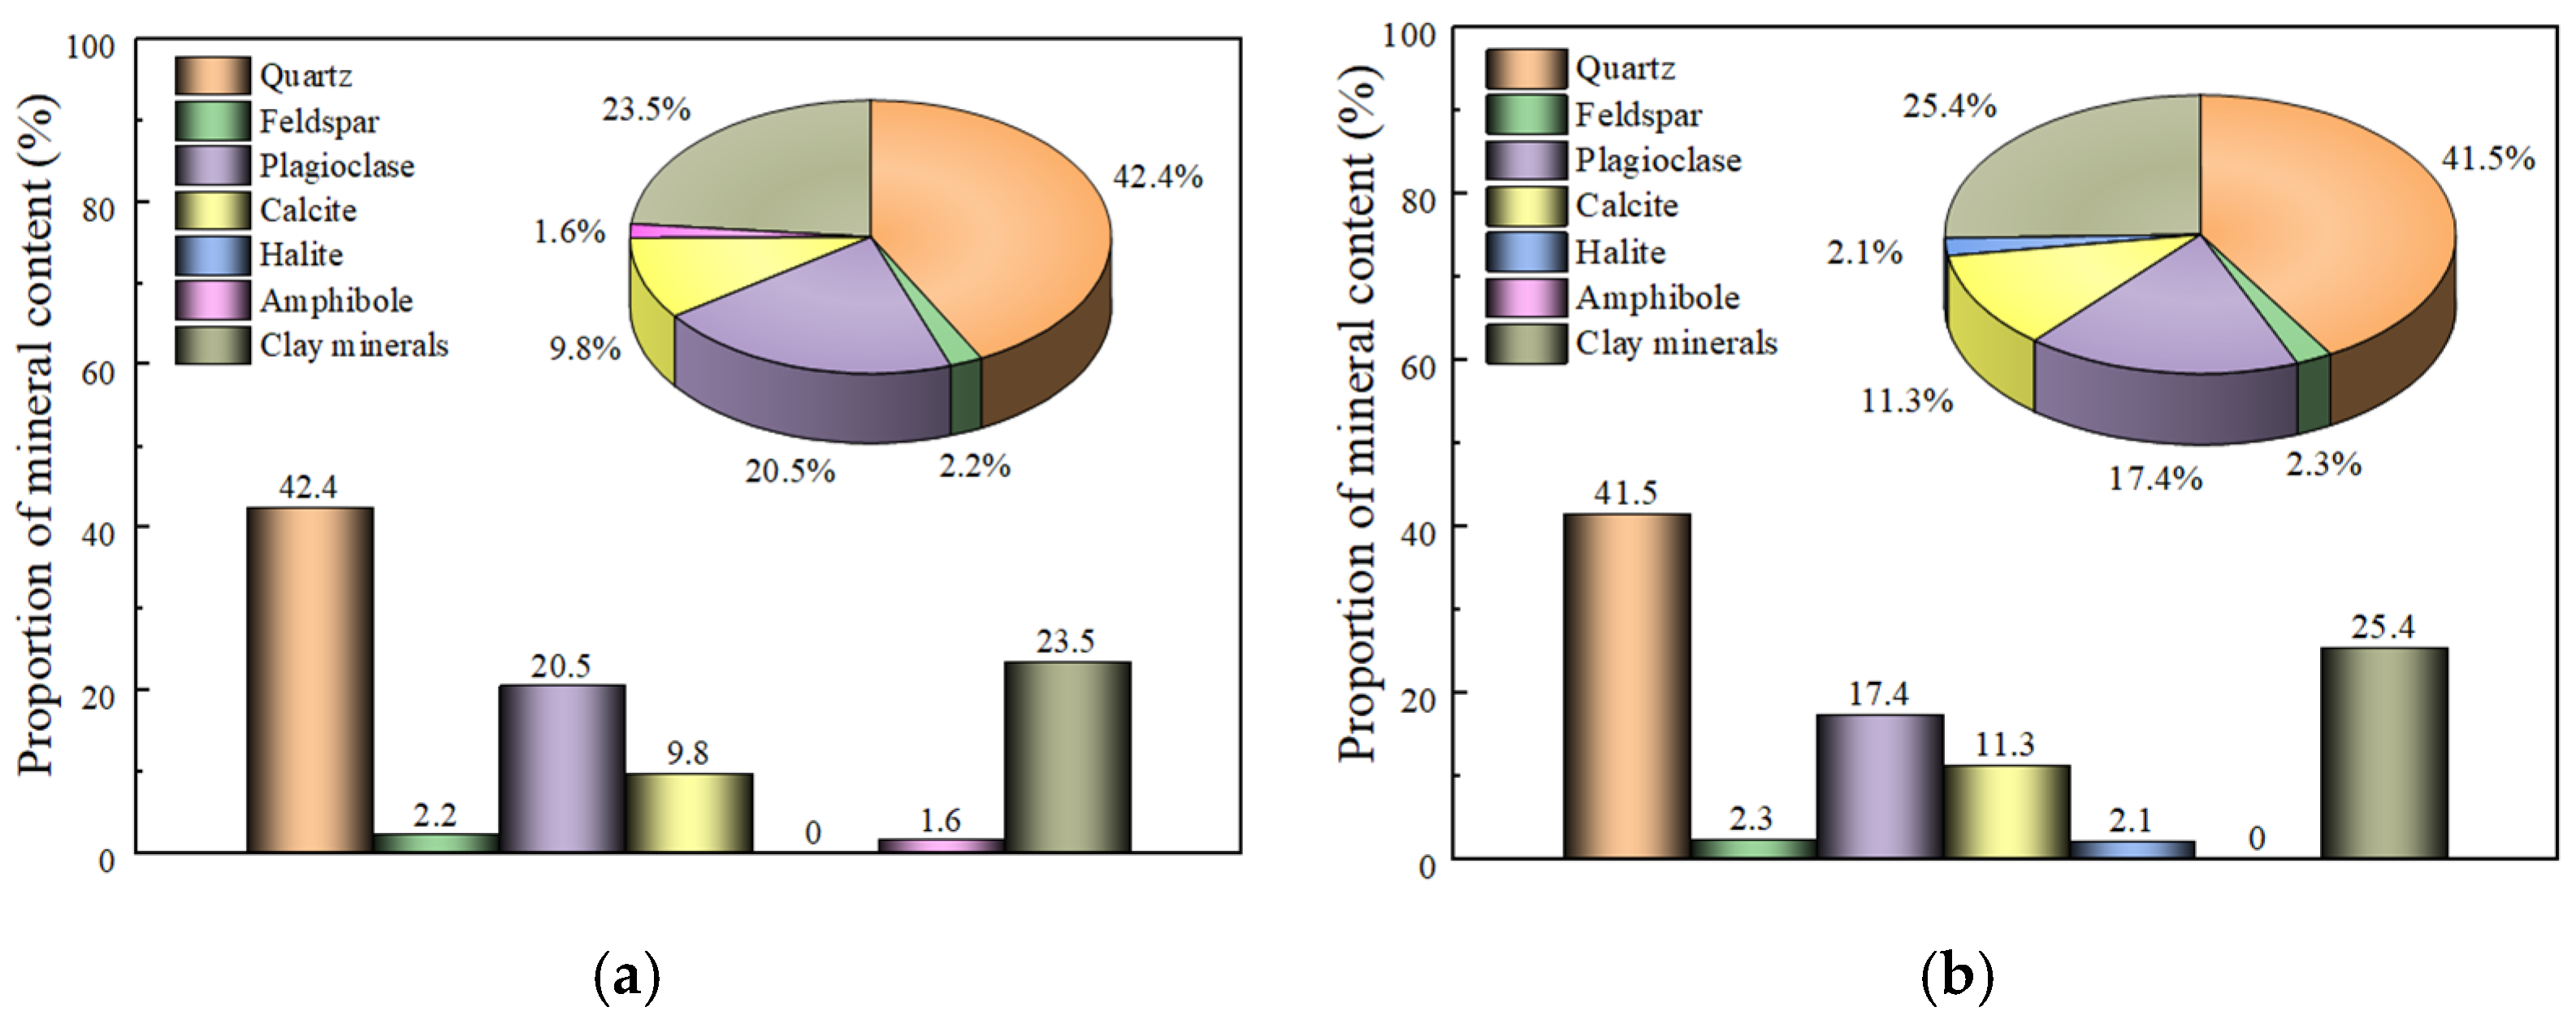
3.4. Analysis of Mineral Composition in Loess

Different minerals have unique crystal structures, which produce specific diffraction peak positions and intensities when X-ray diffraction is applied [38]. Figure 8 shows an X-ray diffraction pattern of undisturbed loess and W16-Y2.0C2.0. It can be observed from the figure that the scatter patterns of the two loess samples are roughly similar. The characteristic peak strength of quartz is relatively high, and its content is relatively large. The characteristic peak strength of calcite and stone salt is relatively low, and their content is relatively small. Quartz provides some skeleton support, which helps improve the strength and stiffness of the loess. Calcite participates in cementation to a certain extent, enhancing the integrity of the soil. The existence of halite affects the interaction between soil particles. Compared to undisturbed loess, the characteristic peaks of cement and salt are not displayed in the diffraction pattern of W16-Y2.0C2.0. This is because when cement is incorporated, the hydration products generated by cement and loess are relatively small in quantity and have complex forms, which interact with other minerals, masking their characteristic peaks. When salt is incorporated, the salt may exist in the pore water of the soil in an ion form, be adsorbed by the surface of clay minerals, or undergo chemical reactions with other substances in the soil to generate new compounds, resulting in the inability to detect the characteristic peaks of salt.
The relative content of various minerals in the soil is estimated based on the relationship between the characteristic peak strength and the mineral content. Figure 9 shows the proportion of the mineral content in undisturbed loess and W16-Y2.0C2.0. It can be observed from the figure that in A, the debris minerals are mainly quartz and plagioclase, with proportions of 42.4% and 20.5%, respectively. The carbonate minerals are mainly calcite, accounting for 9.8%. The clay minerals are mainly TCCM, accounting for 23.5%. In W16-Y2.0C2.0, the debris minerals are primarily quartz and plagioclase, with proportions of 41.5% and 17.4%, respectively. The carbonate minerals are mainly calcite, accounting for 11.3%. The clay minerals are mainly TCCM, accounting for 25.4%. The differences in the mineral content between A and W16-Y2.0C2.0 are obtained. The stone salt is undetected in A, and the amphibole is not in W16-Y2.0C2.0. This is because cement and salt react with substances such as amphibole in the soil, consuming the amphibole, and generating a certain amount of stone salt. In addition, the structure and performance of the soil are improved through physical filling, chemical bonding, and other behaviors, making the structural strength of W16-Y2.0C2.0 similar to that of A [39].

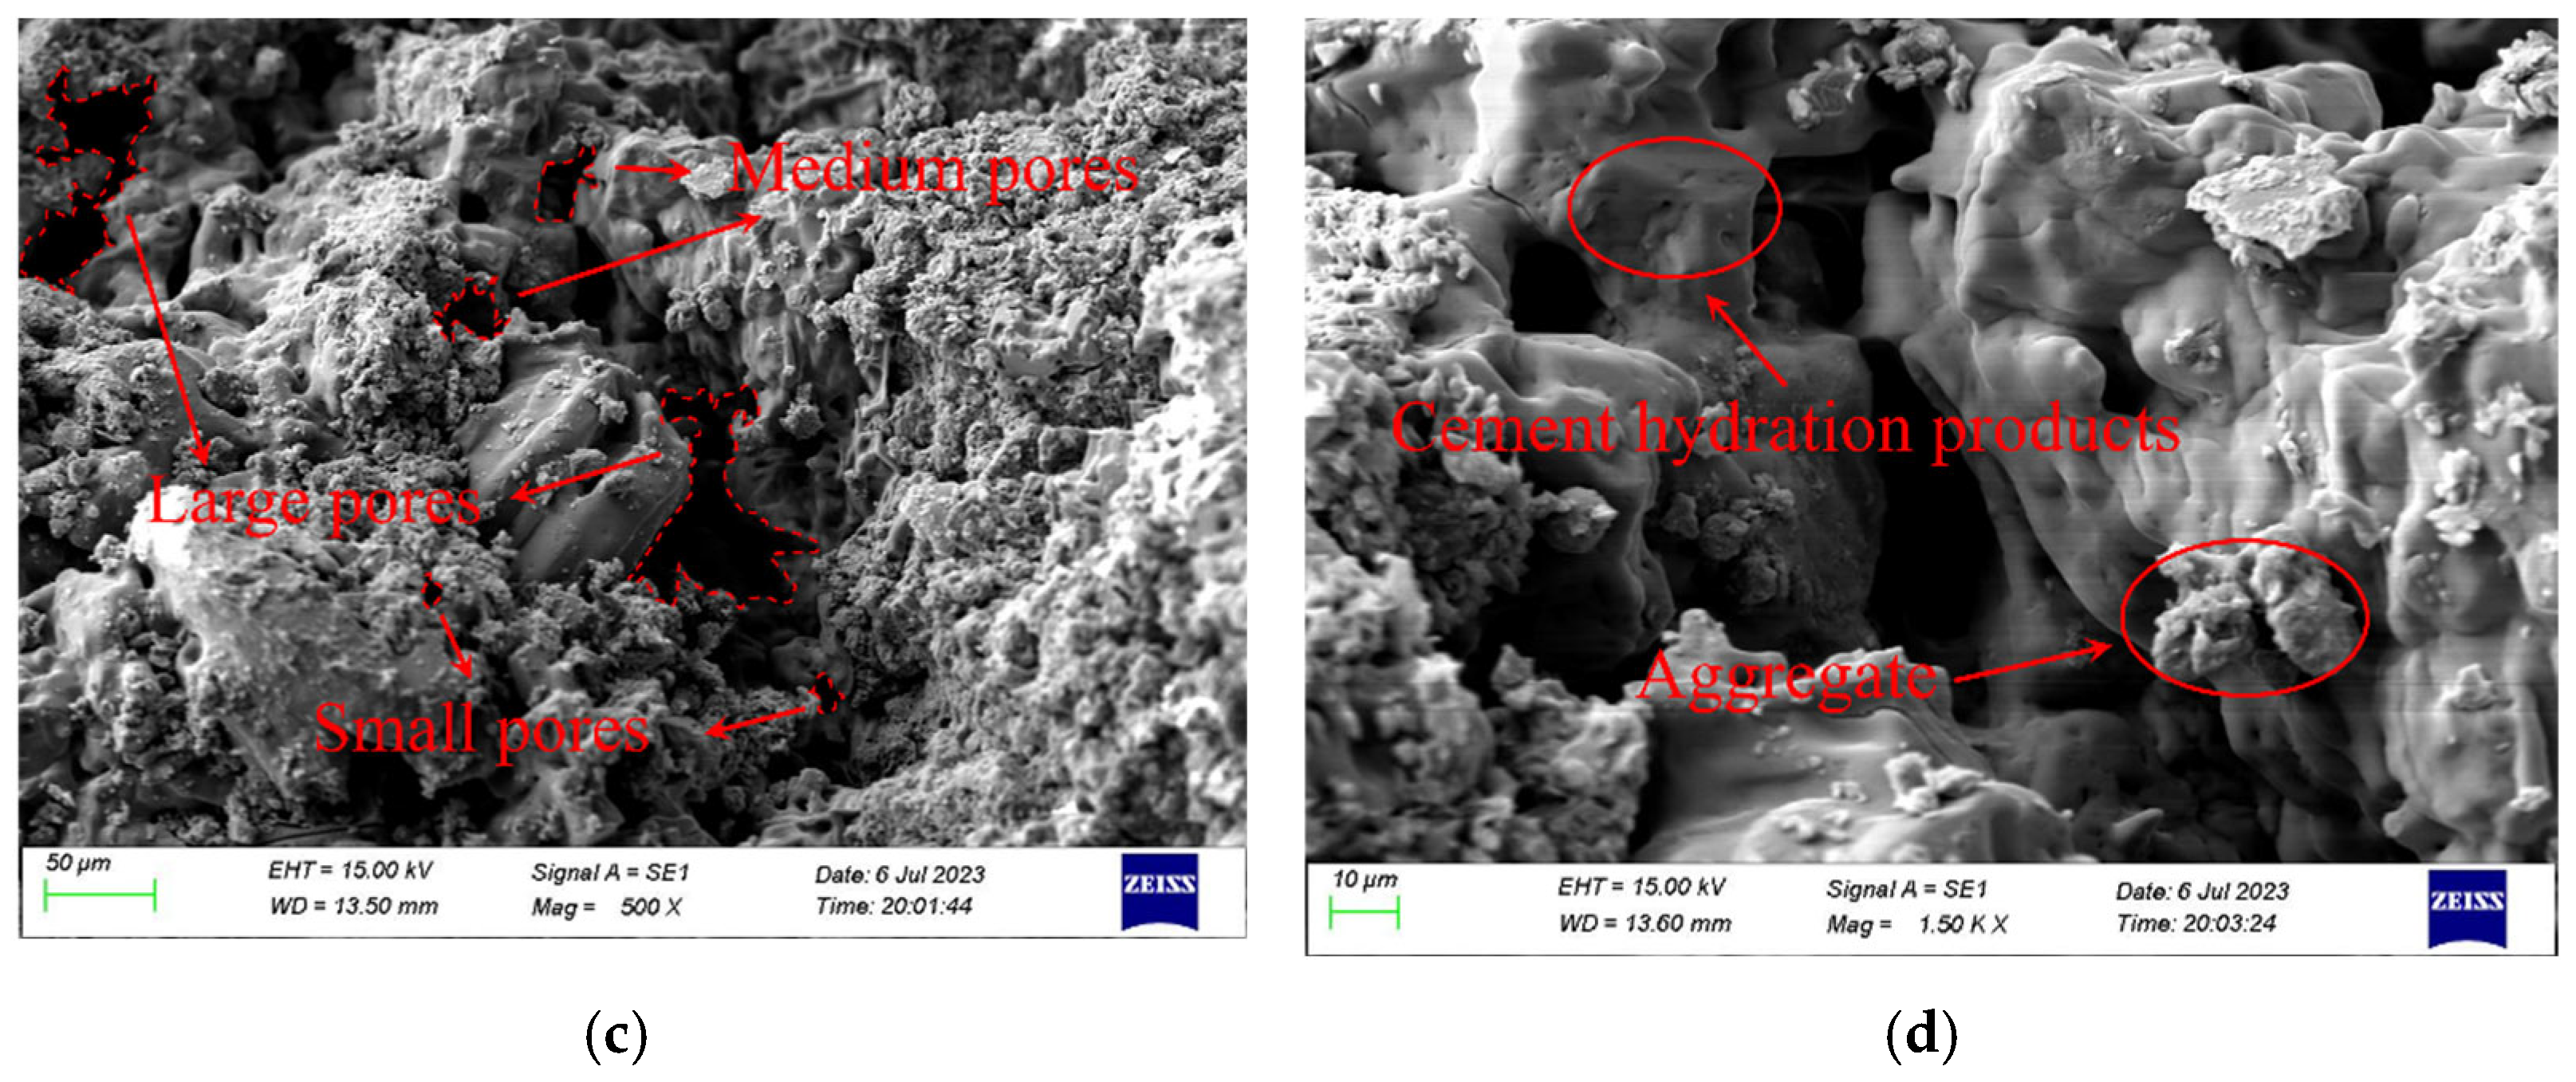
3.5. Analysis of Microstructure in Loess

The structural scales of the loess sample observed under different magnifications by SEM are distinct [40]. Figure 10 shows the scanning electron microscope images of A and W16-Y2.0C2.0, magnified 500 and 1500 times. It can be observed from the figure that the particle shape of A is diverse, mainly composed of powder particles, mostly angular or sub-angular, with a relatively rough surface. In W16-Y2.0C2.0, many aggregates and particles of different sizes can be scattered on the soil particles. Among them, larger particles are cement hydration products or incompletely dispersed cement particles, which play a specific skeleton support role in the soil. Smaller particles are a mixture of soil and salt particles, evenly distributed between and around larger particles. As the magnification increases to 1500 times, it can be seen that there are pores of different sizes inside the soil particles, with complex pore shapes such as narrow, circular, irregular polygons, etc. Compared to A, the contact between soil particles in W16-Y2.0C2.0 is relatively tight, with small particles embedded on the surface of large particles or filled in the gaps between large particles, showing strong interactions. There are many milky white cementing substances at the contact points of some particles [41], which cause clay materials to aggregate at the particle contact points, forming a clay film and increasing the area and cohesion of the contact points [42,43]. Some particles exhibit agglomeration, especially between small particles, which may be due to the increased electrostatic attraction or other forces between particles caused by the action of salt particles, resulting in particle aggregation [44], thus making W16-Y2.0C2.0 have similar structural strength and stability to the undisturbed loess.

3.6. Analysis of Pore Distribution in Loess

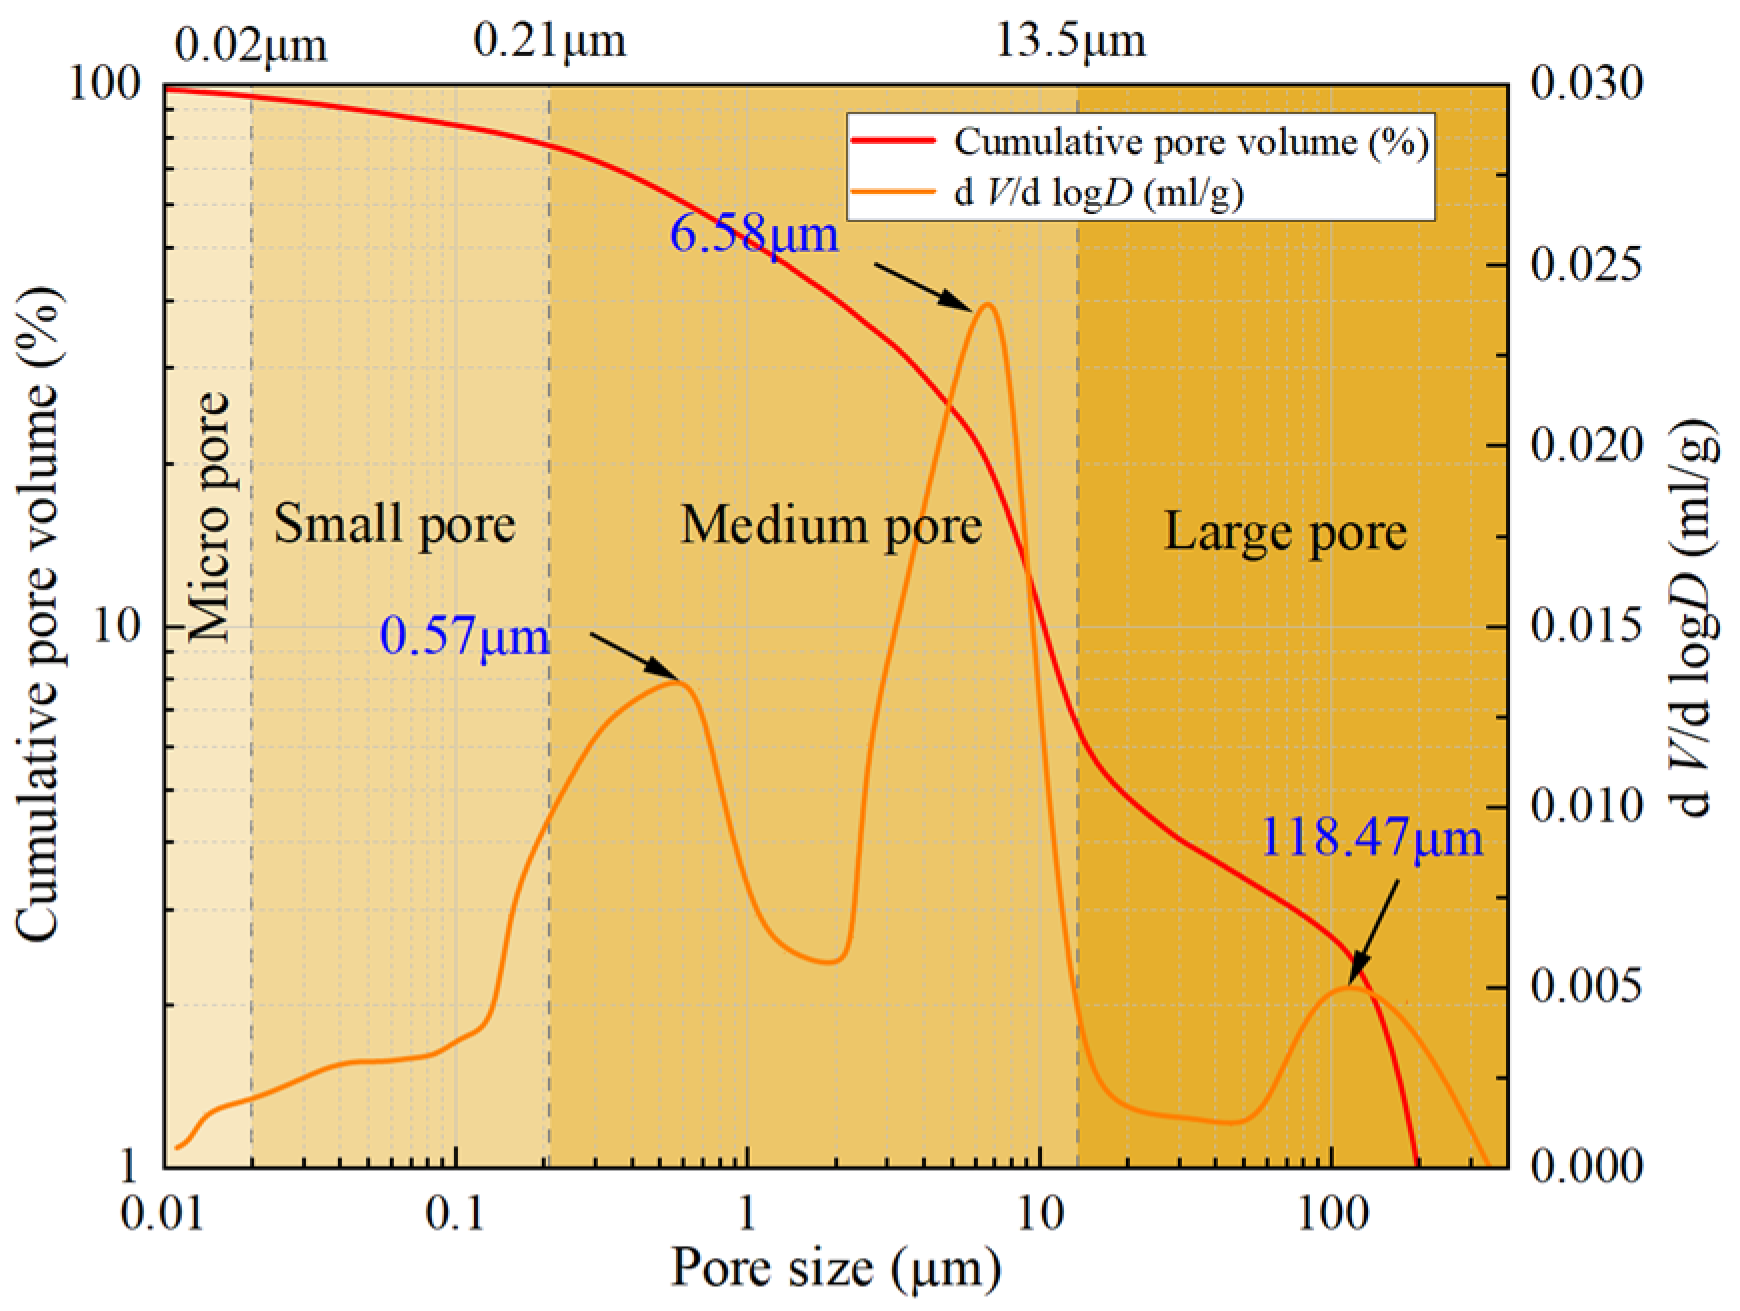
3.6.1. Pore Division of Structural Loess

By dividing the pore sizes of soil and determining the content of pores, the characteristics of pore distribution in loess can be obtained. Figure 11 shows the pore size distribution curve of W16-Y2.0C2.0 in the initial state. The curve has two Y-axes, with one representing the pore distribution density within a specific pore size range of a unit mass loess sample. The other represents the cumulative pore volume based on the volume fractal model [45,46,47], which is d V/d log D. It can be observed from the pore distribution density curve that there are three significant peaks on the curve. The first peak has a moderately high peak point, with a dominant pore size of around 0.57 μm. The second peak with a higher peak point, which is sharper and steeper, and the flat areas on both sides represent the intergranular pore group, including embedded pores, overhead pores, and secondary pores, with a dominant pore size of around 6.58 μm. The third peak with a lower peak point, which is relatively flat, is located in the large pore, with a dominant pore size of around 118.47 μm. It can be observed from the cumulative pore volume curve that the curve does not have a unique slope but exhibits a segmented linear feature. The three obvious turning points on the curve are 0.02 μm, 0.21 μm, and 13.5 μm, dividing the pore into four parts, and each section has a fixed slope. This indicates that the pores in each interval have self-similarity, that is, the pore size distribution of loess has multiple fractal characteristics. Therefore, the three dividing points can be used as the boundary pore size to distinguish similar pores in each interval [48]. The corresponding sections are named micropores (≤0.02 μm), small pores (0.02~0.21 μm), medium pores (0.21~13.5 μm), and large pores (≥13.5 μm) according to their relative pore size. The four pores have their corresponding material structure characteristics and formation mechanisms in natural deposition loess. Micropores correspond to intragranular pores, small pores correspond to embedded pores, medium pores correspond to elevated pores, and large pores correspond to a small number of large-sized elevated pores and visible secondary pores.

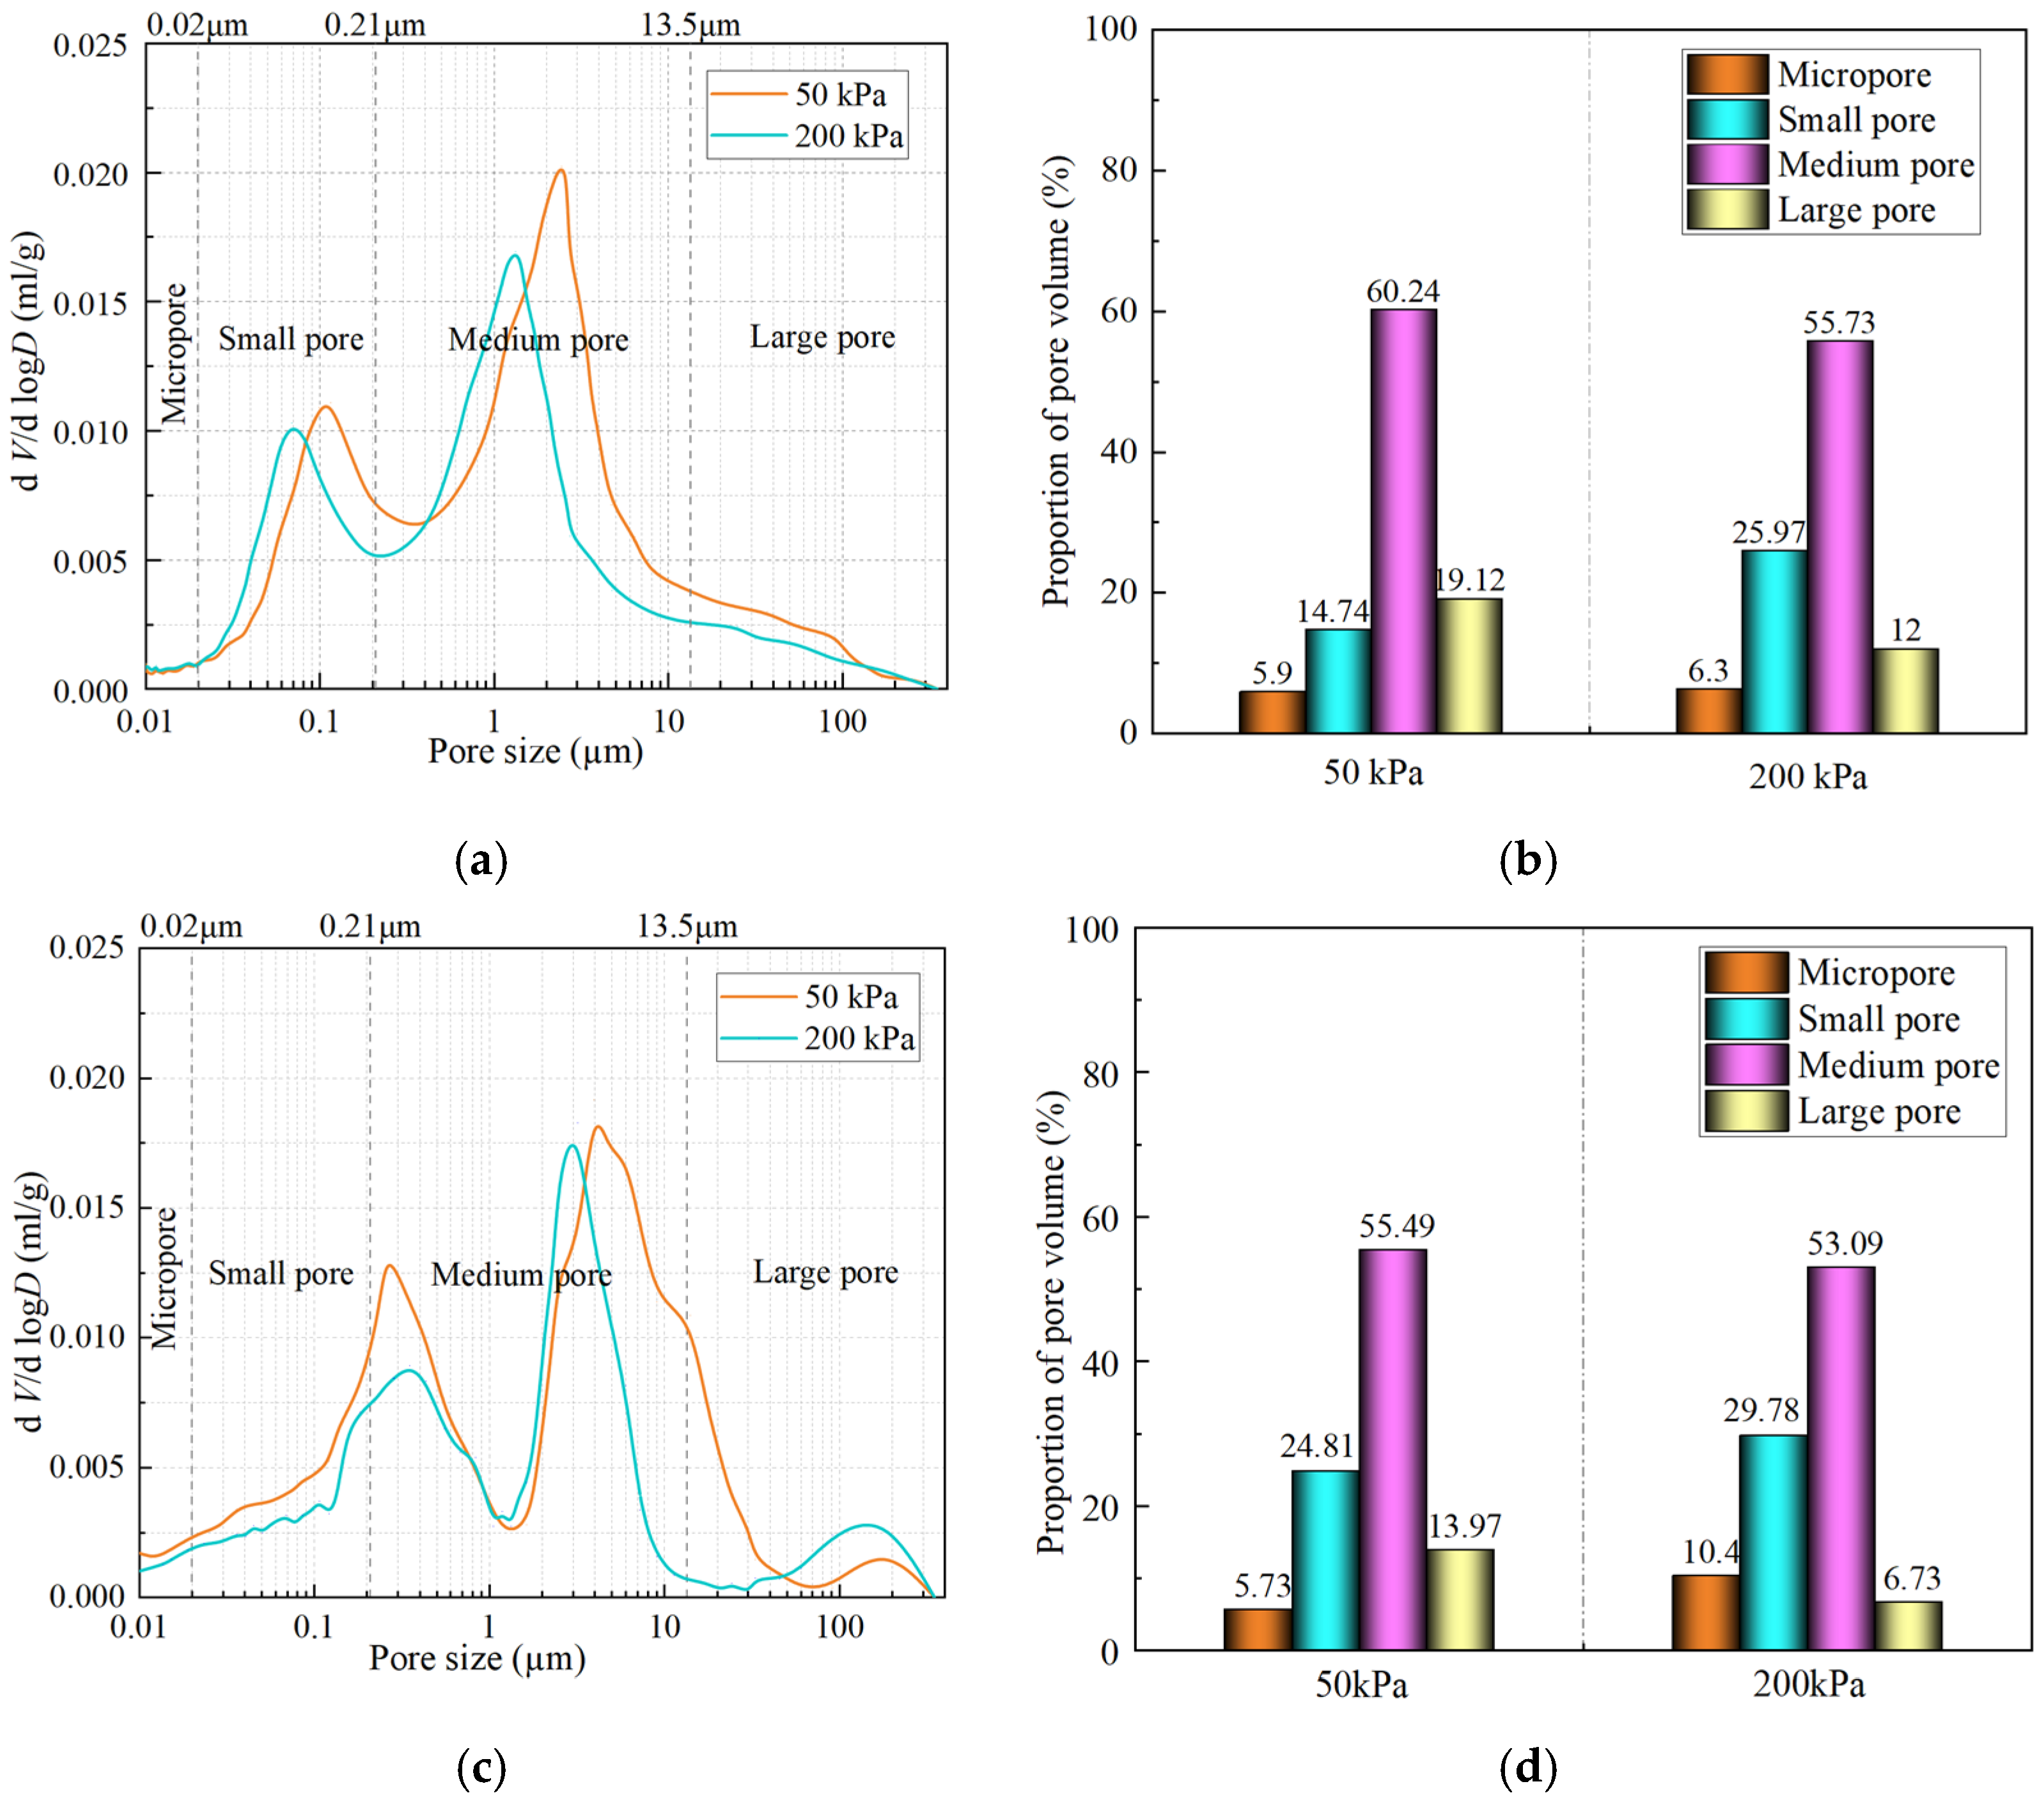
3.6.2. Quantitative Analysis of Pore Distribution Characteristics

Figure 12 shows the pore distribution characteristic curve of A and W16-Y2.0C2.0 under different pressures. It can be observed from Figure 12 that the sample pores exhibit a bimodal distribution of intragranular pores and interparticle pores for A. Under a pressure of 50 kPa, the pore size corresponding to the first peak is 0.01 μm, and the pore size of the second peak is approximately 6.58 μm. As the pressure increases, the aperture corresponding to the peak point moves towards a smaller aperture direction, and the position of the peak point also decreases. At 50 kPa, the proportions of small, medium, and large pores in A are 14.74%, 60.24%, and 19.12%, respectively, with a relatively small proportion of micropores. At 200 kPa, the corresponding proportions become 25.97%, 55.73%, and 12%, with no significant difference in micropores. Small pores increase by 11.23%, medium pores decrease by 4.51%, and large pores decrease by 7.12%. This indicates that the increase in pressure causes particles to squeeze each other, increasing the effective stress and compression of originally larger pores, leading to changes in pore structure. For W16-Y2.0C2.0, the pores of the sample exhibit a three-peak distribution of intragranular pores and intergranular pores. At 50 kPa, the pore size corresponding to the first peak is 0.35 μm, the second peak is 3.94 μm, and the third peak is approximately 180.25 μm. The overall slope of the curve is relatively gentle, indicating that the distribution of pores with different pore sizes is relatively uniform at this time. When the pressure rises to 200 kPa, a steep peak appears in the range of medium pores, and the peak value of the curve in the range of large pores relatively increases, indicating that under higher pressure, the soil is compressed, resulting in an increase in the number and relatively concentrated distribution of large and medium pores. This is due to the rearrangement and compression of particles under higher pressure, causing some smaller pores to merge and form large and medium pores, or the originally blocked large and medium pores to be opened [42]. When the pressure is 50 kPa, the proportions of micropores, small pores, medium pores, and large pores in W16-Y2.0C2.0 are 5.73%, 24.81%, 55.49%, and 13.97%, respectively. When the pressure increases to 200 kPa, the corresponding proportions change to 10.4%, 29.78%, 53.09%, and 6.73%. Among them, micropores increased by 4.67%, small pores increased by 4.97%, medium pores decreased by 2.4%, and large pores decreased by 7.24%. The standard deviation of the pore volume proportion for W16-Y2.0C2.0 under different pressures is shown in Table 5. It can be found that the trend of pore structure changes in W16-Y2.0C2.0 under pressure is similar to that of A. Still, there are differences in the specific proportion, related to the artificial addition of cement and salt, changing the connection and arrangement of soil particles.

3.6.3. Analysis of Macro- and Microcorrelation

Figure 13 shows the correlation between the structural strength and porosity of A and W16-Y2.0C2.0 under different pressures. It can be observed that under two different pressures, the structural strength of W16-Y2.0C2.0 is similar to that of the undisturbed loess, but there is a certain difference in the microstructure. At 50 kPa, the reduction in large pores and the increase in small pores to some extent increase the inner friction angle of soil particles. At the same time, the particle skeleton formed by the bonding effect of cement and salt makes the soil more stable, compensates for the influence caused by the difference in the microstructure, and makes its structural strength close to that of the undisturbed loess. As the pressure increases, larger pores are destroyed and micropores are increased. Through the particle rearrangement and physical support of cement, the collapse of pores is effectively suppressed, maintaining higher structural stability.

4. Conclusions

By conducting a three-axis shear test, the influence of different moisture contents and additive dosages on soil strength characteristics is analyzed, and the comparison is preferably suitable for reflecting the structural properties of the natural loess and additive dosages. Through XRD, SEM, and MIP tests, the mineral components, microstructure, and pore characteristics of the artificial structural loess were analyzed, and the reaction mechanism after the mixture of cement, salt, and soil was revealed. The main conclusions are as follows:
  • The combined effect of the moisture content, pressure, and additive changes the stress–strain relationship of the artificial structural loess. Under the same pressure, when the cement dosage remains constant, the curve of the sample gradually moves downward with the increasing moisture content, and its breaking strength is negatively correlated with the moisture content. Under the same moisture content, the curve of the sample gradually increases with the increasing cement dosage, and its breaking strength shows a positive correlation with the cement dosage.
  • The standard deviation of the peak strength for W16-Y2.0C2.0 is the smallest under various confining pressures, with 50 kPa being 6.481, 100 kPa being 7.676, and 200 kPa being 4.912. The minimum standard deviations of the cohesive inner friction angle are 2 kPa and 0.2°, respectively, corresponding to W16-Y2.0C2.0, indicating that the cohesive inner friction angle of W16-Y2.0C2.0 is the closest to that of the undisturbed sample. W16-Y2.0C2.0 is the optimal structural loess, and its structural strength is most similar to that of the undisturbed loess.
  • The scatter patterns of the undisturbed loess and W16-Y2.0C2.0 are roughly similar. The characteristic peaks of cement and salt are not displayed in the diffraction pattern of W16-Y2.0C2.0. In addition, further quantitative analysis found that the differences in the mineral content between A and W16-Y2.0C2.0 are obtained. The stone salt is not detected in A, and the amphibole is not detected in W16-Y2.0C2.0.
  • There exist many white cementing substances at the particle contact point of W16-Y2.0C2.0, which cause clay material to aggregate at the particle contact point, increasing the area and cohesion of the contact point. Some particles exhibit agglomeration, especially between small particles, which may be due to the increased electrostatic attraction or other forces between particles caused by the action of salt particles, resulting in particle aggregation, thus making the soil sample have similar structural strength and stability to those of the undisturbed soil.
  • The pore distribution curve of the structural loess W16-Y2.0C2.0 has three peaks and is divided into four types of pores, including micropores (≤0.02 μm), small pores (0.02~0.21 μm), medium pores (0.21~13.5 μm), and large pores (≥13.5 μm). When the pressure increases from 50 kPa to 200 kPa, micropores increase by 4.67%, small pores increase by 4.97%, medium pores decrease by 2.4%, and large pores decrease by 7.24%. The trend of pore structure changes in W16-Y2.0C2.0 under pressure is similar to that of A.
  • This study is based on laboratory standard conditions, without considering complex environmental factors such as wet–dry cycles, freeze–thaw effects, and dynamic loads that may exist in actual engineering. In the future, research will be conducted on the strength degradation mechanism of artificial structural loess under wet–dry cycles, freeze–thaw cycles, and chemical erosion. Although W16-Y2.0C2.0 exhibits strength characteristics similar to those of the undisturbed loess in the laboratory, considering the heterogeneity of the soil on site, fluctuations in moisture content, and dynamic changes in load, it is necessary to verify its universality.

Author Contributions

Conceptualization, Y.Z. and G.L.; methodology, G.L. and Y.Z.; writing—original draft preparation, S.G. and J.Q.; writing—review and editing, J.Q. and M.S.; funding acquisition, Y.Z. All authors have read and agreed to the published version of the manuscript.

Funding

This study was supported by the Shaanxi Provincial Department of Education Service Local Special Research Program Project (22JE018, 23JE018, 23JE019), the Open Research Fund of the Yangtze River Academy of Sciences (CKWV20231170/KY), and the Young Talent Fund of Association for Science and Technology in Shaanxi (20220719).

Data Availability Statement

Data are contained within the article.

Conflicts of Interest

The authors declare no conflicts of interest.

References

  1. Li, Y.; Shi, W.; Aydin, A.; Beroya-Eitner, M.A.; Gao, G. Loess genesis and worldwide distribution. Earth-Sci. Rev. 2020, 201, 102947. [Google Scholar] [CrossRef]
  2. Crouvi, O.; Sun, J.; Rousseau, D.D.; Muhs, D.R.; Zárate, M.; Marx, S. Loess Records. Ref. Mod. Earth Syst. Environ. Sci. 2024. [Google Scholar] [CrossRef]
  3. Li, G.; Yan, Z.; Song, Y.; Fitzsimmons, K.E.; Yi, S.; Kang, S.; Chen, F. A comprehensive dataset of luminescence chronologies and environmental proxy indices of loess-paleosol deposits across Asia. NPJ Clim. Atmos. Sci. 2024, 7, 7. [Google Scholar] [CrossRef]
  4. Wang, L.; Liu, Q.; Li, X.A.; Qin, B.; Hong, B.; Shi, J. Effect of nanosilica on the hydrological properties of loess and the microscopic mechanism. Sci. Rep. 2024, 14, 13692. [Google Scholar] [CrossRef]
  5. Lone, A.M.; Sharma, S.; Achyuthan, H.; Shukla, A.D.; Shah, R.A.; Sangode, S.J.; AA, F. Climatic implications of late Holocene loess and intervening paleosols, Southern Zanskar range, northwestern Himalaya. Phys. Geogr. 2023, 44, 287–306. [Google Scholar] [CrossRef]
  6. Neina, D.; Mureithi, S.M.; Van Ranst, E. Soil System Status and Issues in the Global South. In Sustainable Soil Systems in Global South; Springer Nature: New York, NY, USA, 2024; pp. 83–112. [Google Scholar]
  7. Li, G.Y.; Zhan, L.T.; Hu, Z.; Chen, Y.M. Effects of particle gradation and geometry on the pore characteristics and water retention curves of granular soils: A combined DEM and PNM investigation. Granul. Matter 2021, 23, 9. [Google Scholar] [CrossRef]
  8. Schlüter, S.; Sammartino, S.; Koestel, J. Exploring the relationship between soil structure and soil functions via pore-scale imaging. Geoderma 2020, 370, 114370. [Google Scholar] [CrossRef]
  9. Cui, C.; Liang, Z.; Xu, C.; Xin, Y.; Wang, B. Analytical solution for horizontal vibration of end-bearing single pile in radially heterogeneous saturated soil. Appl. Math. Model. 2023, 116, 65–83. [Google Scholar] [CrossRef]
  10. Yan, X.; Xu, Q.; Deng, M.; Sun, Y.; He, X.; Dong, S.; Zhou, Y. Investigation on the solidification effect and mechanism of loess utilizing magnesium oxysulfate cement as a curing agent. Sci. Total Environ. 2024, 951, 175214. [Google Scholar] [CrossRef]
  11. Scheuermann Filho, H.C.; Venson, G.I.; Centofante, R.; Festugato, L. Discussion of “Analysis and Optimization of Tensile Strength for Loess Stabilized by Calcium Carbide Residue”. J. Mater. Civ. Eng. 2025, 37, 07024009. [Google Scholar] [CrossRef]
  12. Chen, H.; Li, H.; Jiang, Y.; Yu, Q.; Yao, M.; Shan, W. Feasibility study on artificial preparation of structured loess. Geosci. Lett. 2022, 9, 21. [Google Scholar] [CrossRef]
  13. Guo, S.; Zhang, H.; Bi, Y.; Zhang, J. Mechanical experiment and microstructural characteristics of water glass solidified loess. Bull. Eng. Geol. Environ. 2024, 83, 441. [Google Scholar] [CrossRef]
  14. Cui, C.; Qi, Y.; Meng, K.; You, Z.; Liang, Z.; Xu, C. A new analytical solution for horizontal vibration of floating pile in saturated soil based on FSSP method. Soil Dyn. Earthq. Eng. 2024, 187, 108960. [Google Scholar] [CrossRef]
  15. Chen, C.L.; Juan, F.; Luo, A.Z.; Shao, S.J. Study of Artificial Structural Loess under the True Triaxial Tests. Adv. Mat. Res. 2013, 671, 343–348. [Google Scholar] [CrossRef]
  16. Zuo, L.; Lyu, B.; Xu, L.; Li, L. The influence of salt contents on the compressibility of remolded loess soils. Bull. Eng. Geol. Environ. 2022, 81, 185. [Google Scholar] [CrossRef]
  17. Xue, Z.; Zhang, Y.; Luo, J.; Yan, C.; Emmanuel, M.; Jia, X. Analysis of compressive strength, durability properties, and micromechanisms of solidified loess using industrial solid waste: Slag–white mud–calcium carbide residue. J. Build. Eng. 2024, 84, 108511. [Google Scholar] [CrossRef]
  18. Chang, J.; Li, J.; Wang, Y.; Zhang, H. Mechanical characteristics and microstructural changes in phosphogypsum-cement-lime composite modified loess. Case Stud. Constr. Mater. 2024, 21, e03881. [Google Scholar] [CrossRef]
  19. Zhang, Y.; Song, Z.; Chen, H.; Ruan, L.; He, S. Experimental study on collapsible and structural characteristics of artificially prepared loess material. Sci. Rep. 2023, 13, 4113. [Google Scholar] [CrossRef]
  20. Bao, L.; Wei, F. Macroscopic and microscopic analysis of the effects of moisture content and dry density on the strength of loess. Sci. Prog. 2024, 107, 00368504241261592. [Google Scholar] [CrossRef]
  21. Yan, R.; Huang, Q.; Peng, J.; Li, R.; Chen, L.; Zhang, Y. Influence of physical properties and shear rate on static liquefaction of saturated loess. Eng. Geol. 2024, 341, 107699. [Google Scholar] [CrossRef]
  22. Ma, J.; Qiu, Y.; Gao, Y.; An, Y.; Duan, Z.; Li, S. Effects of Sample Preparation Methods on Permeability and Microstructure of Remolded Loess. Water 2023, 15, 3469. [Google Scholar] [CrossRef]
  23. Nan, J.; Peng, J.; Zhu, F.; Ma, P.; Liu, R.; Leng, Y.; Meng, Z. Shear behavior and microstructural variation in loess from the Yan’an area, China. Eng. Geol. 2021, 280, 105964. [Google Scholar] [CrossRef]
  24. Li, Z.; Qi, Z.; Qi, S.; Zhang, L.; Hou, X. Microstructural changes and micro–macro-relationships of an intact, compacted and remolded loess for land-creation project from the Loess Plateau. Environ. Earth Sci. 2021, 80, 593. [Google Scholar] [CrossRef]
  25. Jiang, M.; Zhang, F.; Hu, H.; Cui, Y.; Peng, J. Structural characterization of natural loess and remolded loess under triaxial tests. Eng. Geol. 2014, 181, 249–260. [Google Scholar] [CrossRef]
  26. Yao, W.; Li, X.A.; Zhang, N.; Ren, Y.; Shi, J.; Zhang, C.; Hao, Z. A feasible method for evaluating the uniformity of remolded loess samples with shear strength. Buildings 2023, 13, 145. [Google Scholar] [CrossRef]
  27. Qi, Z.; Li, Z. The influence of overburden stress and molding water content on the microstructure of remolded loess. Sustainability 2023, 15, 12401. [Google Scholar] [CrossRef]
  28. GB/T 50123-2019; Standard for Geotechnical Testing Method. Construction Ministry of PRC: Beijing, China, 2019.
  29. Zhang, Y.; Zhang, Z.; Hu, W.; Zhang, Y.; Shi, G.; Wang, Y. Shear Strength of Loess in the Yili Region and Corresponding Degradation Mechanisms under Different Cycling Modes. Water 2023, 15, 3382. [Google Scholar] [CrossRef]
  30. Shah, S.S.A.; Turrakheil, K.S.; Naveed, M. Impact of Wetting and Drying Cycles on the Hydromechanical Properties of Soil and Implications on Slope Stability. Atmosphere 2024, 15, 1368. [Google Scholar] [CrossRef]
  31. Haeri, S.M.; Khosravi, A.; Garakani, A.A.; Ghazizadeh, S. Effect of soil structure and disturbance on hydromechanical behavior of collapsible loessial soils. Int. J. Geomech. 2017, 17, 04016021. [Google Scholar] [CrossRef]
  32. Chen, Y.; Dong, M.; Cheng, C.; Han, J.; Zhao, Y.; Jia, P. Experimental and analytical study on the bearing capacity of caisson foundation subjected to V-H combined load. Mar. Georesour. Geotechnol. 2025, 1–13. [Google Scholar] [CrossRef]
  33. Yang, M.; Cen, N.; Wang, Z.; Huang, B.; Lin, J.; Jiang, F.; Zhang, Y. Study of the Shear Strength Model of Unsaturated Soil in the Benggang Area of Southern China. Water 2024, 16, 3528. [Google Scholar] [CrossRef]
  34. Liu, L.; Yao, Y.; Zhang, L.; Wang, X. Study on the mechanical properties of modified rammed earth and the correlation of influencing factors. J. Clean. Prod. 2022, 374, 134042. [Google Scholar] [CrossRef]
  35. Stockton, E.; Leshchinsky, B.A.; Olsen, M.J.; Evans, T.M. Influence of both anisotropic friction and cohesion on the formation of tension cracks and stability of slopes. Eng. Geol. 2019, 249, 31–44. [Google Scholar] [CrossRef]
  36. Ravindran, S.; Gratchev, I. Effect of water content on apparent cohesion of soils from landslide sites. Geotechnics 2022, 2, 385–394. [Google Scholar] [CrossRef]
  37. Prokes, R.; Jezerska, L.; Gelnar, D.; Zegzulka, J.; Zidek, M. Inner friction and flowability of clay powder depend on particle moisture, size and normal stress. Powder Technol. 2024, 446, 120184. [Google Scholar] [CrossRef]
  38. Moretti, L.; Natali, S.; Tiberi, A.; D’Andrea, A. Proposal for a methodology based on xrd and sem-eds to monitor effects of lime-treatment on clayey soils. Appl. Sci. 2020, 10, 2569. [Google Scholar] [CrossRef]
  39. Barman, D.; Dash, S.K. Stabilization of expansive soils using chemical additives: A review. J. Rock Mech. Geotech. Eng. 2022, 14, 1319–1342. [Google Scholar] [CrossRef]
  40. Wei, Y.Z.; Yao, Z.H.; Chong, X.L.; Zhang, J.H.; Zhang, J. Microstructure of unsaturated loess and its influence on strength characteristics. Sci. Rep. 2022, 12, 1502. [Google Scholar] [CrossRef]
  41. Jaffar, S.T.A.; Chen, X.; Bao, X.; Raja, M.N.A.; Abdoun, T.; El-Sekelly, W. Data-driven intelligent modeling of unconfined compressive strength of heavy metal-contaminated soil. J. Rock Mech. Geotech. Eng. 2025, 17, 1801–1815. [Google Scholar] [CrossRef]
  42. Yu, C.; He, C.B.; Li, Z.; Li, Y.A.; Li, Y.; Sun, Y.L.; Wu, Y.Q. Disintegration characteristics and mechanism of red clay improved by steel slag powder. Constr. Build. Mater. 2024, 444, 137873. [Google Scholar] [CrossRef]
  43. Chen, Y.; Zhang, R.; Zi, J.; Han, J.; Liu, K. Evaluation of the treatment variables on the shear strength of loess treated by microbial induced carbonate precipitation. J. Mt. Sci. 2025, 22, 1075–1086. [Google Scholar] [CrossRef]
  44. Shrestha, S.; Wang, B.; Dutta, P. Nanoparticle processing: Understanding and controlling aggregation. Adv. Colloid Interface Sci. 2020, 279, 102162. [Google Scholar] [CrossRef] [PubMed]
  45. Zhao, X.; Cui, Y.; Zhang, R.; Tian, G.; Satyanaga, A.; Zhai, Q. Experimental investigation of the collapsibility of loess subjected to water invasion. Bull. Eng. Geol. Environ. 2024, 83, 33. [Google Scholar] [CrossRef]
  46. Basham, M.R.; Cerato, A.B.; Tabet, W.E. Using Fractal Geometry Theory to Quantify Pore Structure Evolution and Particle Morphology of Stabilized Kaolinite. J. Mater. Civ. Eng. 2024, 36, 04024247. [Google Scholar] [CrossRef]
  47. Xu, P.; Qian, H.; Chen, J.; Wang, L.; Abliz, X.; He, X.; Liu, Y. New insights into microstructure evolution mechanism of compacted loess and its engineering implications. Bull. Eng. Geol. Environ. 2023, 82, 36. [Google Scholar] [CrossRef]
  48. Zhang, J.; Jia, M.; Jiang, T.; Kato, S.; Sun, D.A.; Gao, Y.; Yang, Z. Dynamic deformation characteristics and microscopic analysis of xanthan gum-treated silty soil during wetting process. J. Rock Mech. Geotech. Eng. 2025, 17, 1149–1162. [Google Scholar] [CrossRef]
Figure 1. Sample collection point.
Buildings 15 01761 g001
Figure 2. Grading curve of undisturbed loess.
Buildings 15 01761 g002
Figure 3. Sample preparation process chart.
Buildings 15 01761 g003
Figure 4. Stress–strain relationship curve of loess sample: (a) σ3 = 50 kPa; (b) σ3 = 100 kPa; (c) σ3 = 200 kPa.
Buildings 15 01761 g004
Figure 5. Shear deformation failure modes: (a) A: σ3 = 50 kPa; (b) A: σ3 = 100 kPa; (c) A: σ3 = 200 kPa; (d) W16-Y2.0C2.0: σ3 = 50 kPa; (e) W16-Y2.0C2.0: σ3 = 100 kPa; (f) W16-Y2.0C2.0: σ3 = 200 kPa.
Buildings 15 01761 g005
Figure 6. Bar chart of peak strength of loess samples with error bars.
Buildings 15 01761 g006
Figure 7. Bar chart of shear strength index of loess samples with error bars: (a) c and (b) φ.
Buildings 15 01761 g007
Figure 8. X-ray scatter pattern of A and W16-Y2.0C2.0.
Buildings 15 01761 g008
Figure 9. Proportion of mineral content in A and W16-Y2.0C2.0: (a) A and (b) W16-Y2.0C2.0.
Buildings 15 01761 g009
Figure 10. SEM image of A and W16-Y2.0C2.0 in different magnifications: (a) A: ×500; (b) A: ×1500; (c) W16-Y2.0C2.0: ×500; (d) W16-Y2.0C2.0: ×1500.
Buildings 15 01761 g010aBuildings 15 01761 g010b
Figure 11. Pore distribution characteristic curve of W16-Y2.0C2.0 in initial state.
Buildings 15 01761 g011
Figure 12. Pore distribution characteristic curve of A and W16-Y2.0C2.0 under different pressures: (a) pore distribution density; (b) A: proportion of pore volume; (c) A: pore distribution density; (d) A: proportion of pore volume.
Buildings 15 01761 g012
Figure 13. Correlation of A and W16-Y2.0C2.0 under different pressures: (a) 50 kPa; (b) 200 kPa.
Buildings 15 01761 g013
Table 1. Basic physical properties of the loess sample.
Specific Gravity
Gs
Natural Density
ρ (g/cm3)
Natural Moisture Content
w (%)
Dry Density
ρd (g/cm3)
Maximum Dry Density
ρd max (g/cm3)
Atterberg Limits (%)Void Ratio
e
Minimum Void Ratio
emin
Maximum Void Ratio
emax
Relative Density
Dr
(%)
wp
(%)
wL
(%)
2.701.6915.241.471.5121.4534.590.830.720.9142.11
Table 2. Triaxial shear test scheme for loess.
Test MethodSample TypeSample NameTarget Moisture Content
w1 (%)
Salt Content
(%)
Cement Content
(%)
Confining Pressure
(kPa)
CUUndisturbed loessA15.24//50, 100, 200
Artificial structural loessW8-Y2.0C1.0821
W8-Y2.0C2.02
W8-Y2.0C4.04
W16-Y2.0C1.0161
W16-Y2.0C2.02
W16-Y2.0C4.04
W24-Y2.0C1.0241
W24-Y2.0C2.02
W24-Y2.0C4.04
Where A is the undisturbed sample, C is the cement dosage, Y is the salt dosage, and W is the target moisture content.
Table 3. Standard deviation of structural loess under three types of confining pressures.
Sample TypeSample NameStandard Deviation
σf
50 kPa100 kPa200 kPa
Undisturbed loessA000
Artificial structural loessW8-Y2.0C1.0216.315250.336272.729
W8-Y2.0C2.0264.439300.243362.943
W8-Y2.0C4.0329.803366.657523.901
W16-Y2.0C1.061.84834.15539.646
W16-Y2.0C2.06.4817.6764.912
W16-Y2.0C4.060.38454.20850.369
W24-Y2.0C1.0248.556242.621309.983
W24-Y2.0C2.0232.994225.367285.138
W24-Y2.0C4.0207.362189.434233.853
Table 4. Standard deviation of the shear strength index for each type of structural loess.
Sample TypeSample NameStandard Deviation
σf
c (kPa)φ (°)
Undisturbed loessA00
Artificial structural loessW8-Y2.0C1.044.81.8
W8-Y2.0C2.016.70.8
W8-Y2.0C4.054.23
W16-Y2.0C1.029.84.4
W16-Y2.0C2.020.2
W16-Y2.0C4.051.32.5
W24-Y2.0C1.024.26.4
W24-Y2.0C2.017.30.4
W24-Y2.0C4.046.51.3
Table 5. Standard deviation of pore volume proportion for W16-Y2.0C2.0 compared to A.
Sample NamePressure
(kPa)
Standard Deviation
σf
MicroporesSmall PoresMedium PoresMedium Pores
W16-Y2.0C2.0500.1710.074.755.15
2004.13.812.645.27
Disclaimer/Publisher’s Note: The statements, opinions and data contained in all publications are solely those of the individual author(s) and contributor(s) and not of MDPI and/or the editor(s). MDPI and/or the editor(s) disclaim responsibility for any injury to people or property resulting from any ideas, methods, instructions or products referred to in the content.

