1. Introduction
Thermal energy is of significant importance both environmentally and economically in many sectors and is key to closing the time gap between energy supply and demand. Heat demand is an important factor in most sectors of industry. Efficient and sustainable solutions can be developed by using the sun and recycling heat [
1]. Today, in order to prevent energy loss, meeting cooling requirements and thermal management in heat transfer processes contributes to renewable and recyclable processes. Cooling equipment, solar collectors, heat exchangers, distribution transformers, and other high heat flow devices support thermal management [
2,
3,
4]. It is necessary to focus on thermal radiation effects in various engineering and industrial processes, especially in the design of reliable materials. Devices for nuclear power plants, gas turbines, aircraft, missiles, satellites, and spacecraft should be thermally analyzed and arranged to the appropriate level [
5,
6,
7].
The conservation and analysis of thermal energy is of critical importance for the use of cooling–heating systems in buildings [
8]. The thermography method has long been used to detect malfunctions in electrical equipment as well as changes in different building features such as roofs, ceilings, and walls [
9,
10,
11]. Precautions can be taken by mapping buildings with thermal imaging. Thermal regulations must be made to prevent damage to the materials, resources, and health of the occupants inside the buildings [
12]. There are some physical properties that should be taken into account in thermographic studies of buildings consisting of different materials or equipment. In addition to spectral parameters such as conductivity, specific heat, diffusivity, thermal transmittance, and reflectance, attention should be paid to volumetric mass and physiological thermal properties [
13,
14,
15]. Infrared thermography, which includes thermal properties, is a remote-sensing, non-destructive imaging technique that analyses heat losses. Infrared thermography is an efficient tool used in the context of rapid periodic inspections to detect moisture and other temperature-related features including damaged thermal insulation in walls, roofs, thermal bridges, or air leaks [
16,
17,
18]. There are studies in the literature that use thermal imaging based on thermal analysis of buildings. Thermal analyses have been carried out in areas such as monitoring and protection of historical buildings [
19,
20], control and evaluation of drainage systems [
21], thermal flow analyses [
22], building diagnosis and material inspection [
23,
24], thermal documentation and mapping of masonry structures [
25,
26,
27], and material characterization [
28,
29]. Advanced materials and technologies in climate-responsive envelopes can improve thermal comfort under environmental constraints, increasing sustainability [
30]. The materials applied in building envelopes should be selected according to the characteristics of the climate zone and provide advantages in terms of U-values [
31].
When the building-specific studies were examined, Song et al. [
32] reviewed the methods and experimental results in the literature and field measurement studies to determine the actual U-value of a building envelope. The existing methods used to calculate the U-value for effective evaluation of the building envelope were compared and future research directions were emphasized. Zhang et al. [
33] focused on the thermal performance assessment of building envelopes by unmanned aerial vehicles equipped with infrared thermography. Bibliometric analysis was conducted by questioning the current research status of unmanned aerial vehicles in fast and accurate analysis of building envelope thermal performance. Moctezuma-Sánchez et al. [
34] developed a thermal model to estimate the internal temperature of rural houses in Mexico. Heat transfer over roofs was measured using air thermography and validated with the developed software. Verbeke and Audenaert [
35] presented the effect of thermal comfort and energy use for space heating and cooling systems on the thermal inertia of buildings. Some practical applications that exploit the effect of thermal inertia in the design and operation of HVAC systems are reviewed and a discussion is made on inconsistencies in simulation results. Zomorodian et al. [
36] made an overview of thermal comfort area research carried out in educational buildings in the last fifty years. Field study methodologies including objective and subjective research, climate zone, training phase, and applied thermal comfort approach parameters were examined. Martínez-Molina et al. [
37] summarized the different methods and techniques used worldwide in different building functions to improve thermal comfort performance in historical buildings. It has been observed that, especially since the last two centuries, the thermal comfort of residences, religious buildings, and museums in the historical building class has been mainly examined. In addition, it was stated that most studies were conducted in Italy, Europe. Katunsky et al. [
38] aimed to find and develop a practical method for analysis and calculation of thermal energy consumption and savings in buildings. Calculations and dynamic simulations were made for the energy required for heating an industrial building in Kosice, Slovakia. Heat consumers within the building, including all machines and occupants, have been found to be important in evaluating the energy required for heating. In addition, according to simulation results, it has been determined that lighting, heat recovery, and door opening automation can significantly reduce heating energy consumption. Barbhuiya and Barbhuiya [
39] investigated how the ventilation strategy of a typical educational building in the United Kingdom affects energy consumption and the extent to which this changes the thermal comfort of building occupants. Simulations and data obtained from monitoring indoor temperature and lighting levels have shown that sufficient thermal comfort is not provided in second-floor offices during winter months.
As stated by Al-Shatnawi et al. [
30], there is a research gap on building envelope design in changing climate conditions and cold climate regions. There are very few literature studies on this topic in 2024 compared to other years. Based on the studies in the literature, the number of studies using infrared thermography and thermal simulation together is also limited. As climate zones gain more importance, building envelopes are also updated in direct proportion. For this reason, this study aims to fill the research gap in the literature and be a reference for future studies. In the context of building envelopes, educational buildings have an important position in the world. Educational buildings should be designed spatially in order for students to learn effectively. For this reason, thermal analyses must be ensured in these buildings. The fact that students spend more time in school than in any building other than their homes emphasizes the importance of providing indoor and outdoor thermal conditions. In recent years, the importance of building energy use has increased, and U-values of building envelopes are one of the main indicators for estimating building energy consumption. In this regard, a thermal situation analysis of the building envelope of the Atatürk University Faculty of Architecture and Design in the city of Erzurum, located in a cold climate region where the effects of the winter season last for a long time, was conducted. Within the framework of the infrared thermography method, a surface temperature determination of the exterior of the faculty, interior education sections, and entrances was created with the IFOV calculator using the Testo 872 thermal camera. After a situation analysis was conducted on the building envelope of the faculty, the thermal simulation phase was performed. The two façade designs used in the building were simulated with the SolidWorks 2022 program and evaluated with comparative analyses within the scope of U-values. As a result, situation and simulation analyses in terms of thermal efficiency, examinations of the educational building, and precautions that can be taken are presented. In the conclusion section, discussions were made between the building sections in line with the values obtained from the thermal analysis and inferences were made for the architectural design.
2. Materials and Methods
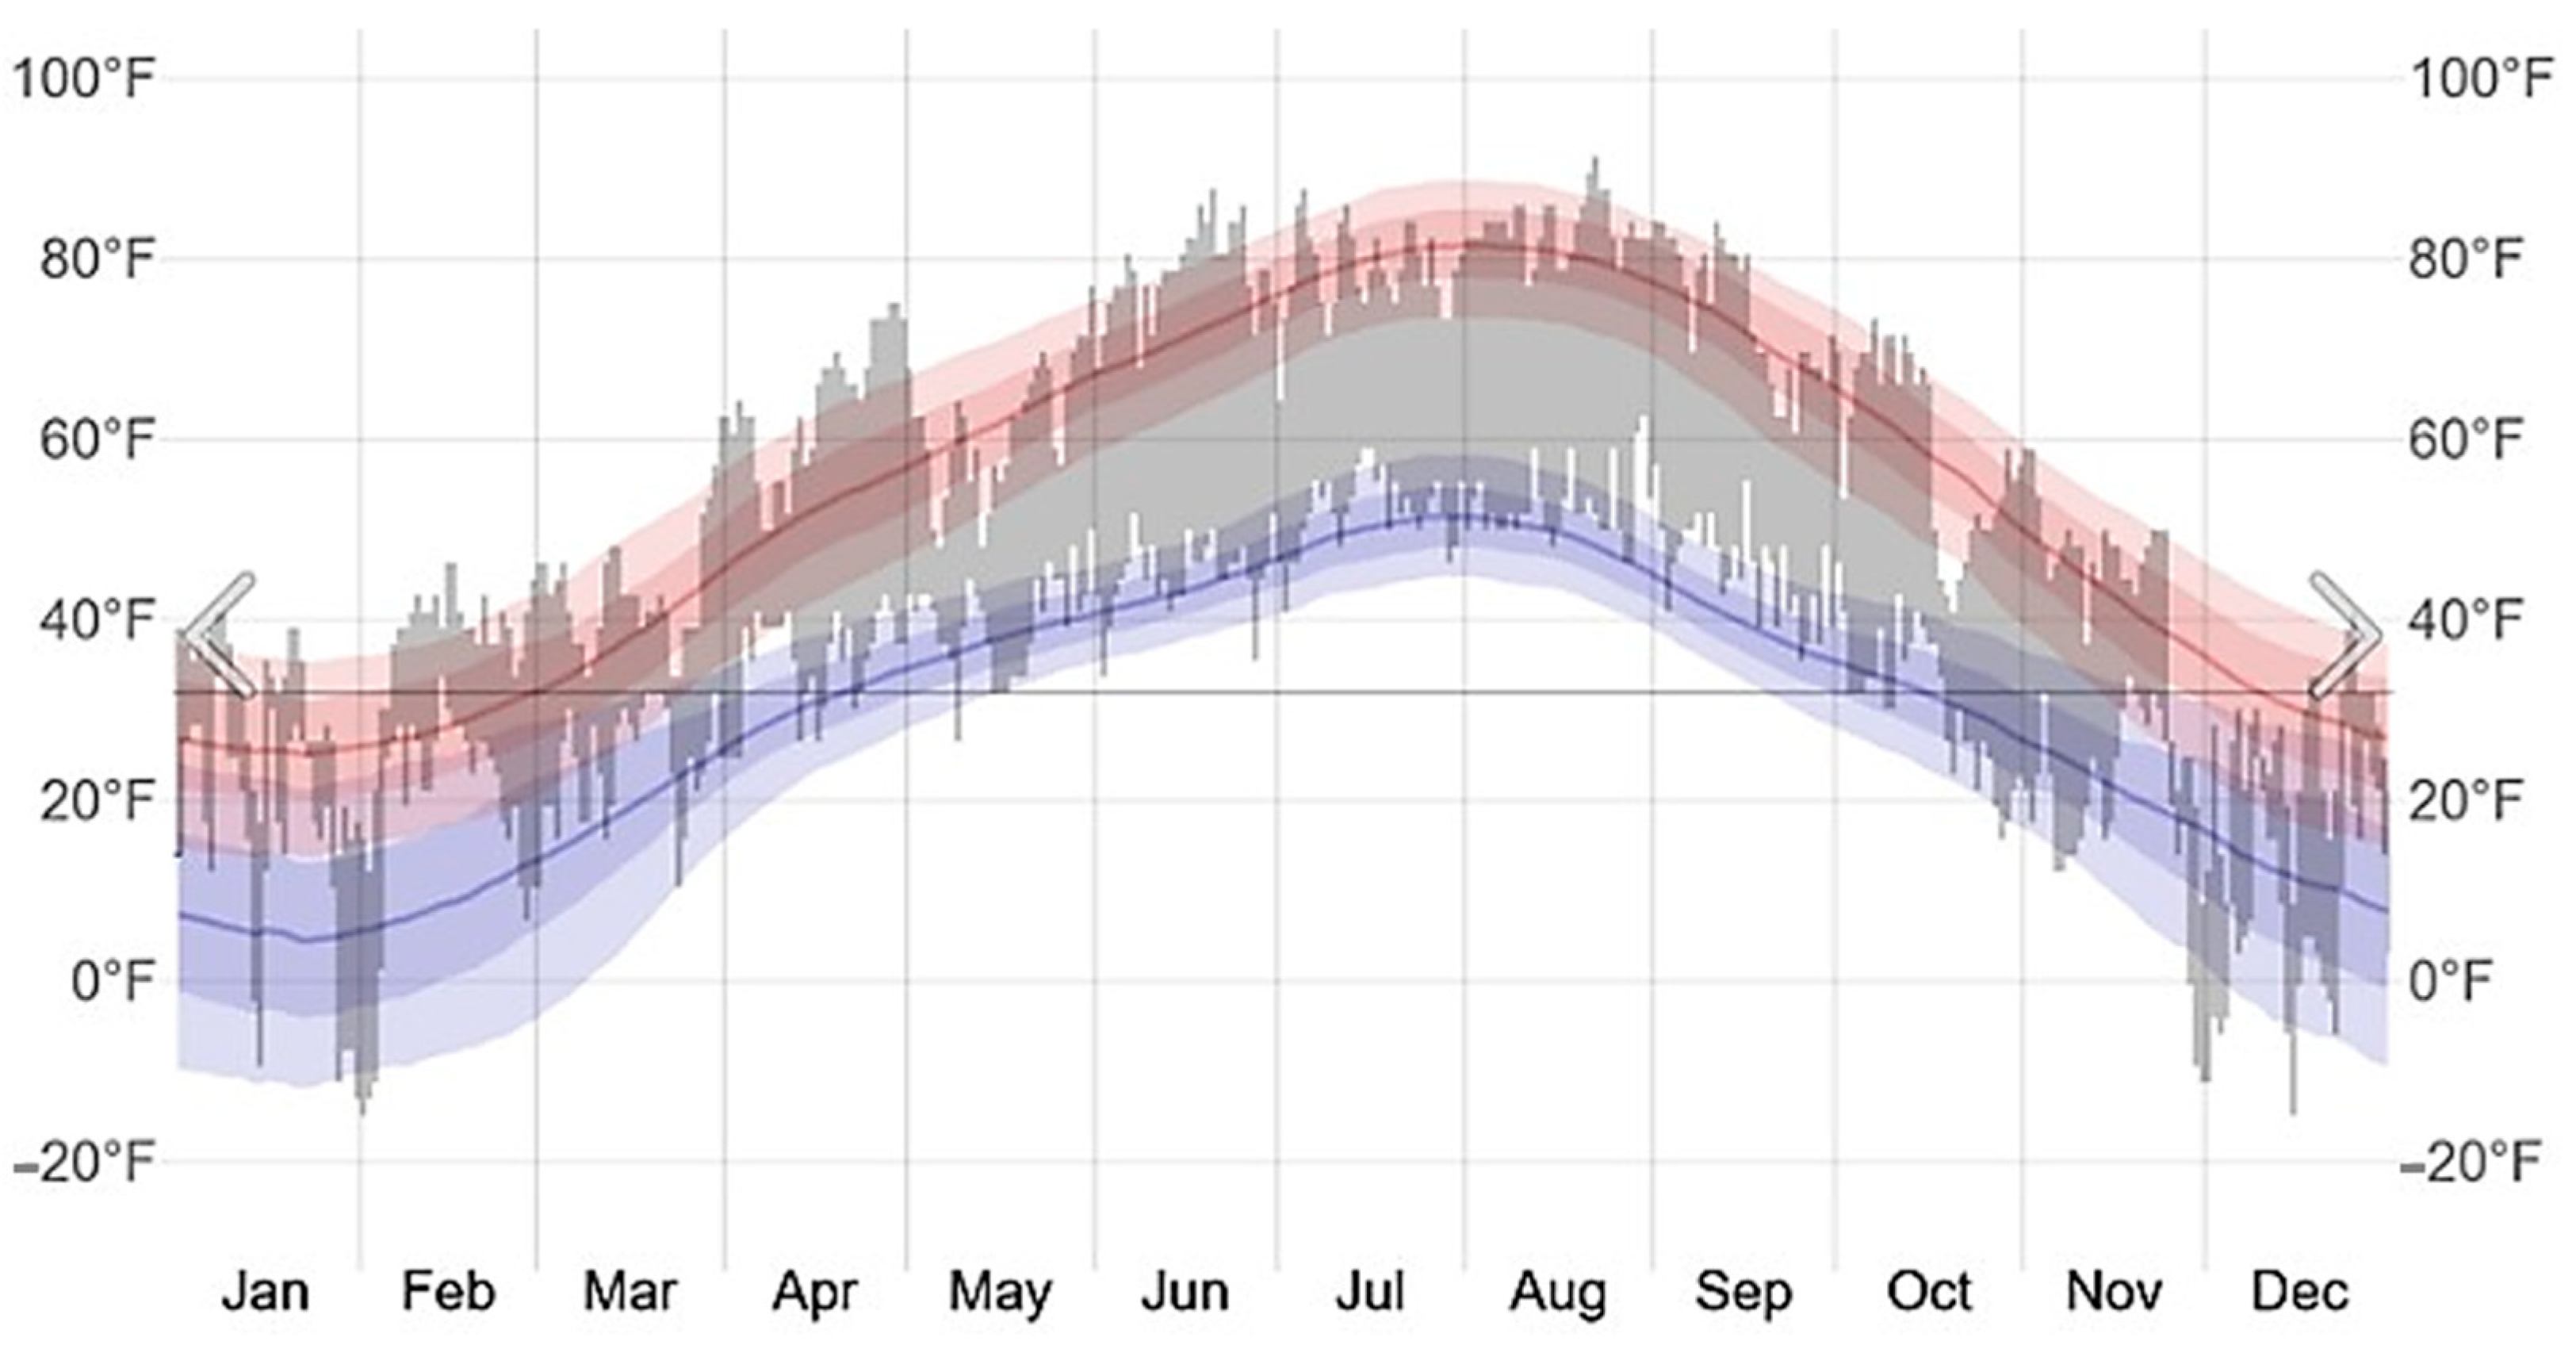
Erzurum is a province within the borders of the Eastern Anatolia Region of Türkiye, located on the 39.89° north parallel and 41.23° east meridian. Erzurum, which is the fourth largest province in Türkiye in terms of surface area, has the highest altitude, and is one of the coldest provinces. The city, where the effects of the harsh continental climate are experienced for a long time, is covered with snow for almost 2–3 months of the year. Winter months are cold and snowy while summer months are hot and dry.
Figure 1 presents information about the temperature values of Erzurum for 2024 [
40]. The fact that precipitation in the winter season is in the form of snow and that the snow remains on the ground for a long time offers suitable conditions for winter tourism [
41]. Erzurum has a suitable potential in terms of thermal analysis as it is a winter city. In this context, thermal analyses were conducted at the Faculty of Architecture and Design on the Atatürk University campus in Erzurum city center.
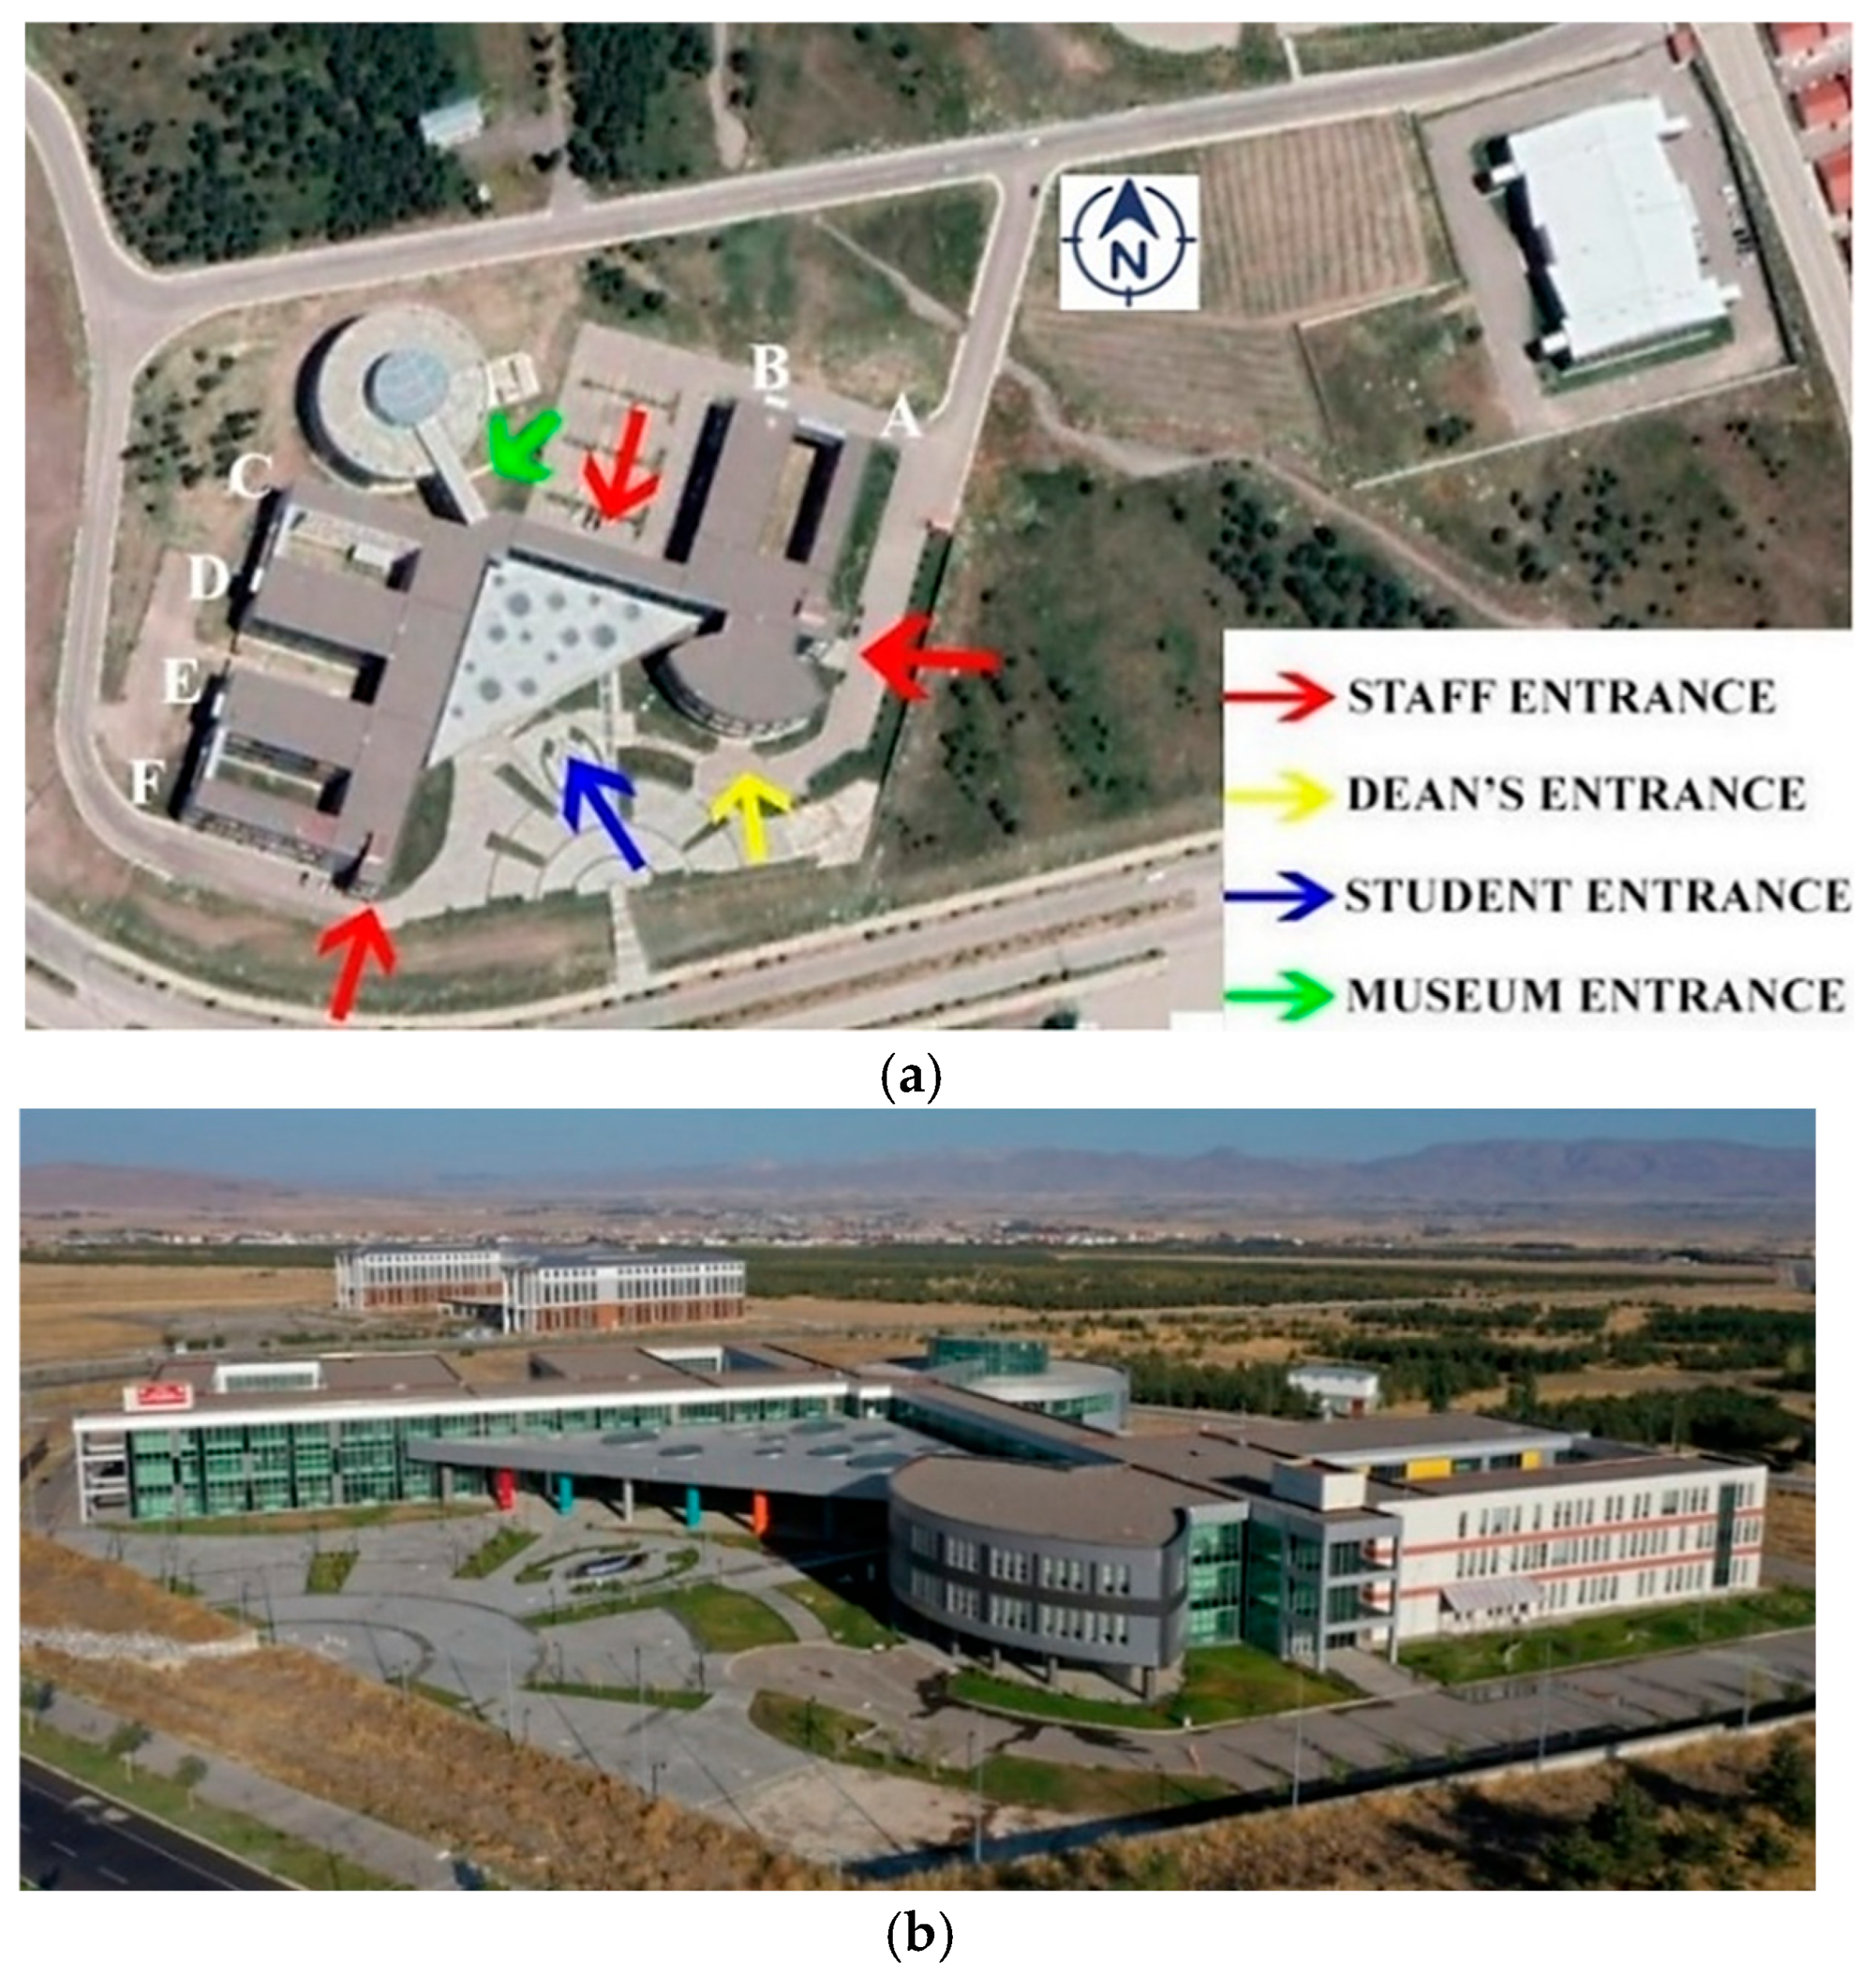
The faculty building, which has a total construction area of 29,000 m
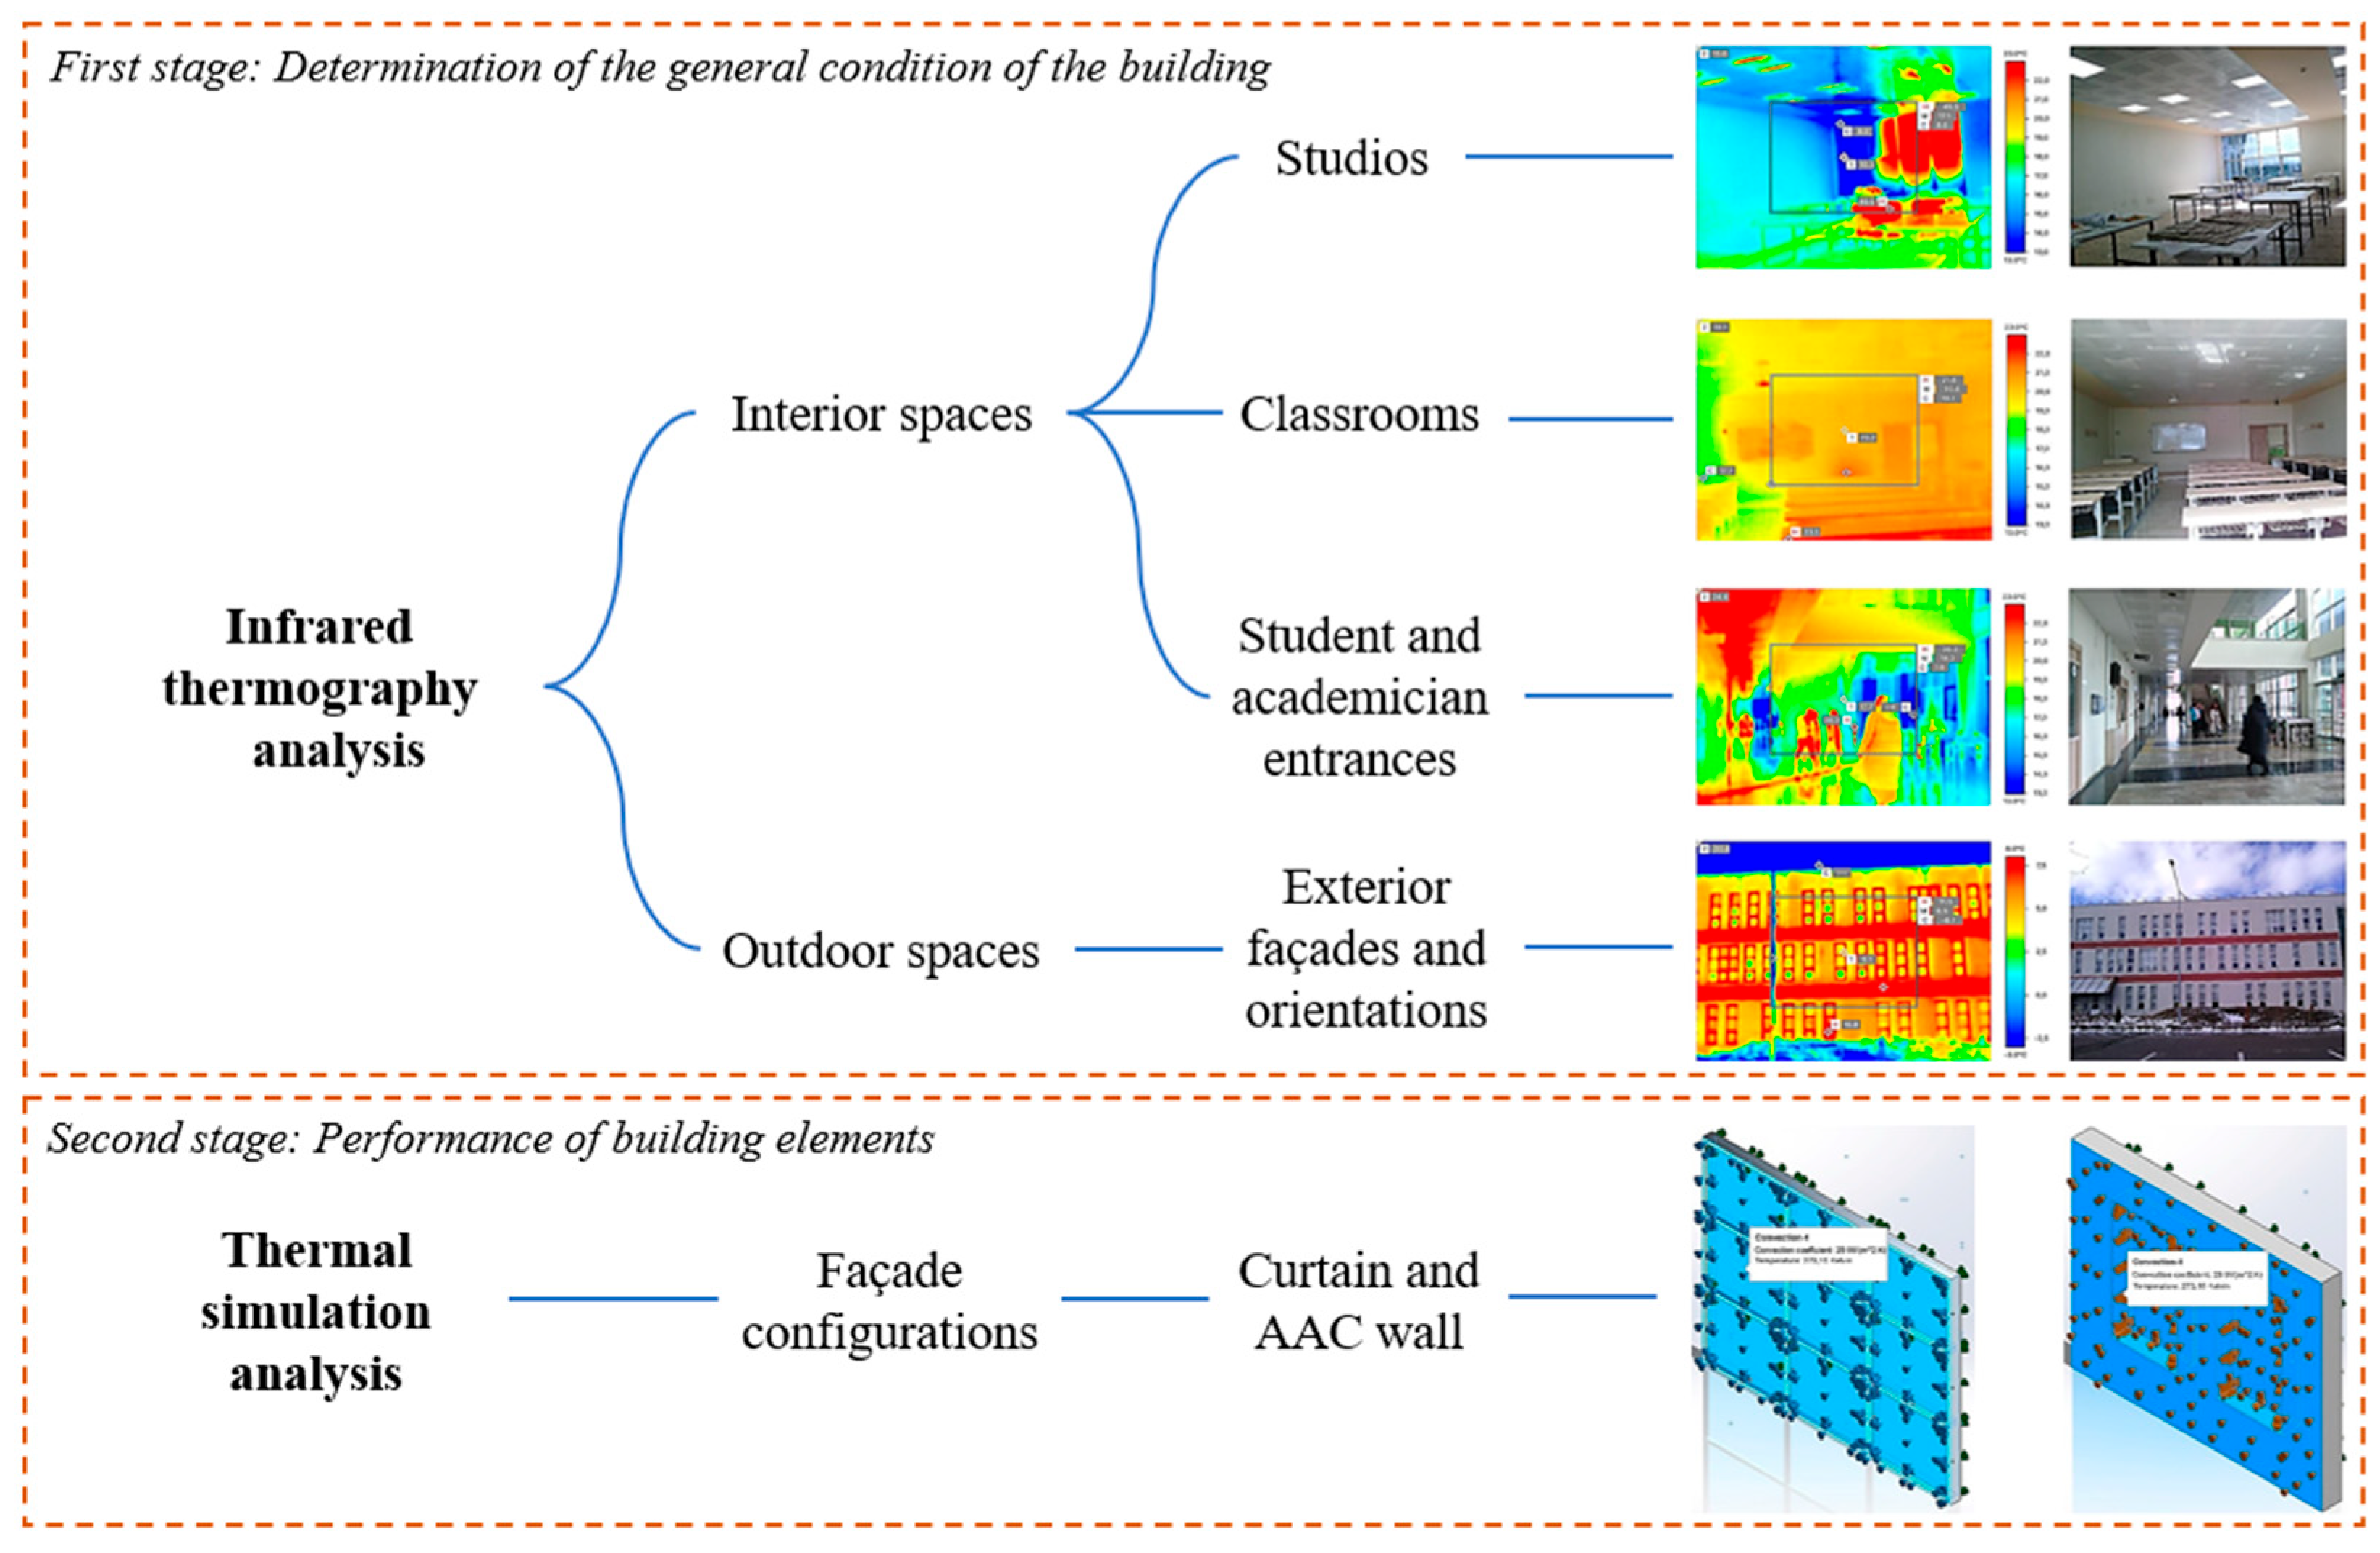
2, includes the departments of architecture, interior architecture, city and regional planning, and landscape architecture. In addition to the Dean’s Office block, there are three offices and three education blocks in the faculty building. In addition, the conference hall building, with a circular plan and integrated into the faculty via a bridge, is now used as a biodiversity and science museum. In terms of architectural design, the faculty building is planned with a block system and connections between blocks are provided with bridges, and there are different façade configurations and interior arrangements. Curtain wall systems and strip windows were used as façade configurations. In the interior arrangements, student and academician entrances are planned at separate points. The deanery block and the conference hall have a circular form. The 3 office blocks and 3 education blocks designed in connection with the L-shaped transportation spine have a rectangular form. While the office blocks serve as academician rooms, the education blocks, which contain studio and classroom spaces, are designed as two design studios on the lower two floors and six theoretical classrooms on the top floors. While the conference hall, transportation spine, and classroom blocks have a curtain wall system, the deanery block and office blocks are designed as units with small strip windows. The steps applied in the faculty building and the flow chart of the study are given in
Figure 2.
The reason for choosing this building for analysis is that it is located in a cold climate region and has different façade layouts. Façade diversity also plays an active role in thermal performance. In addition, the number of studies using infrared thermography and thermal simulation analyses together in educational buildings is limited. The temperature map of the studios and classrooms was analyzed in detail with infrared thermography and inputs were provided for thermal simulation. In this context, floor, wall, and ceiling structural elements were checked. Thermal simulation was also performed for the façades and it was reviewed whether the building envelope was suitable for the cold climate region. In this direction, the originality of the study comes to the fore.
In the study, firstly, an analysis was conducted on the interior and exterior of the educational building. This analysis aims to analyze the current situation. Data were scanned about hot or cold regions using the infrared thermography technique. In the second stage, two separate façade models were created based on the information obtained. These models are shaped according to two separate façades in the faculty. In this step, thermal analysis was performed through the SolidWorks 2022 simulation program.
Within the scope of this study, to make an efficient analysis, thermal analyses were conducted in education sections facing different directions, having different façade systems located on different floors and of different sizes (
Figure 3). Blocks B, D, and E serve as educational classrooms in the faculty. Blocks B and D are oriented to the south façade, which has the best solar potential, while Block E is positioned to the north façade, which has the least solar potential due to the symmetrical design. In order to analyze the thermal performance of educational spaces, blocks D and E, which are oriented to two different façades, were selected to be evaluated.
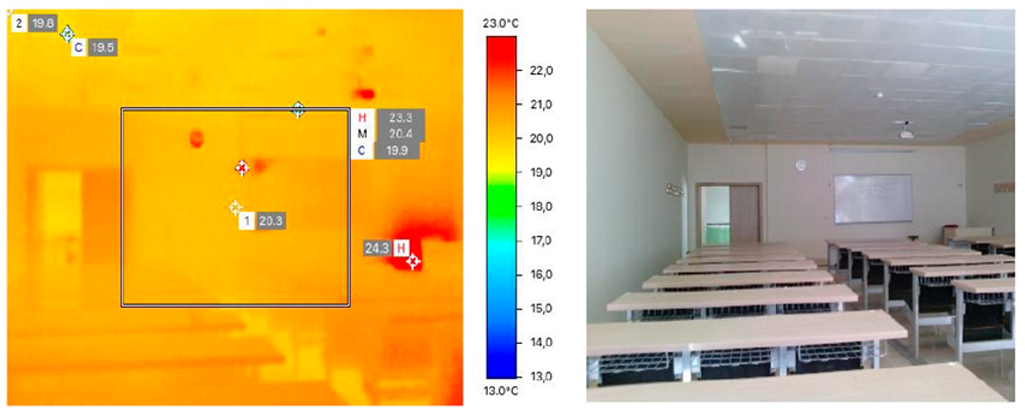
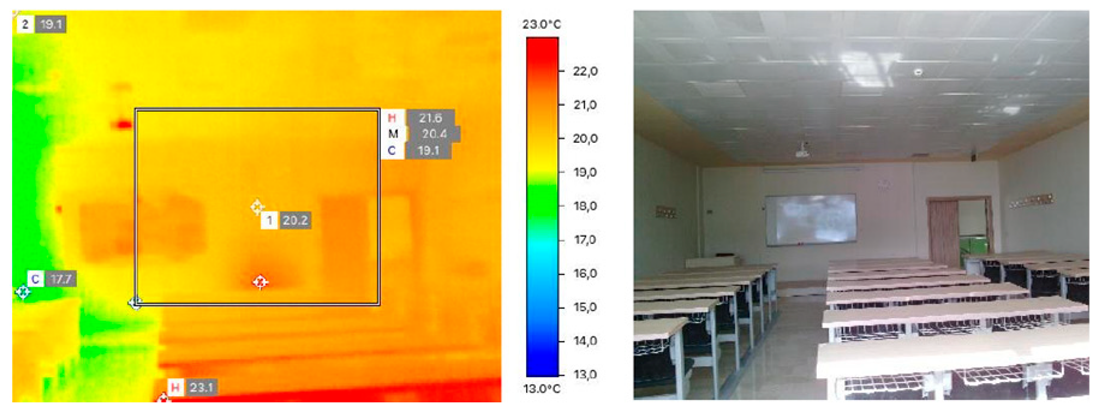
The temperature map of Atatürk University Faculty of Architecture and Design was created using a thermal camera. In this direction, Testo 872 thermal camera was used in the context of infrared thermography. The technical specifications of this camera are given in
Table 1. Thermal analysis of indoor and outdoor spaces was performed with the IFOV calculator on the thermal camera. The camera’s emissivity value, which is the ability to characterize an object’s ability to emit infrared light, is 0.95. Considering that thermal efficiency analysis is more effective in winter, all thermal shootings were conducted on 23 February 2024. To make an effective assessment, the time interval between 13:00 and 14:30 was selected. When taking measurements with the thermal camera, attention was paid to framing open areas (windows and doors) and structural elements of walls, floors, and ceilings. Regarding the measurement time, to obtain accurate results, the difference between the interior and exterior temperatures should be at least 15 °C and should be during the hours when the building is heated. During the measurement time intervals, the interior temperature varied between 20 and 26 °C, while the exterior temperature was −6 °C. In this direction, the time intervals when thermal measurements were made are ideal. In addition, since different materials were used on the exterior surface of the building, measurements were made at noon in order to understand the solar gains of the materials.
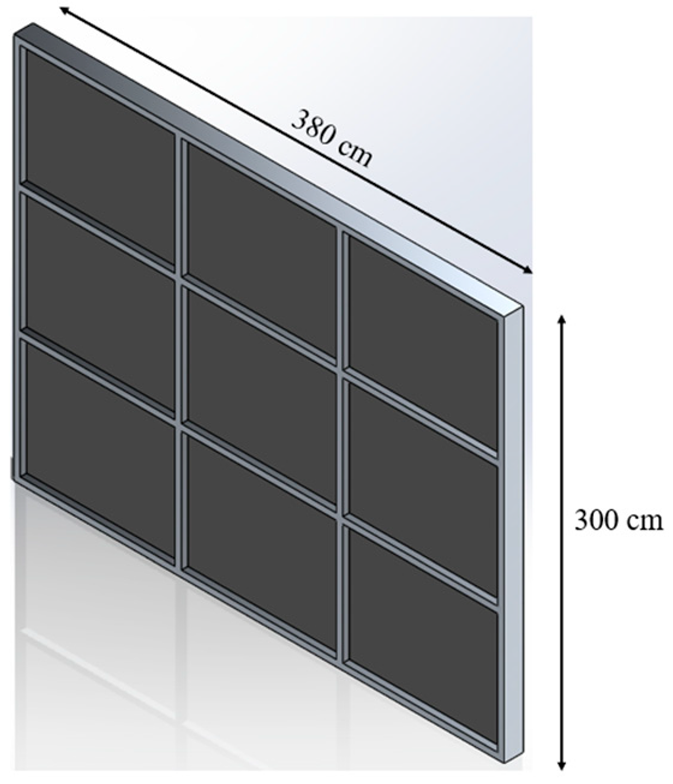
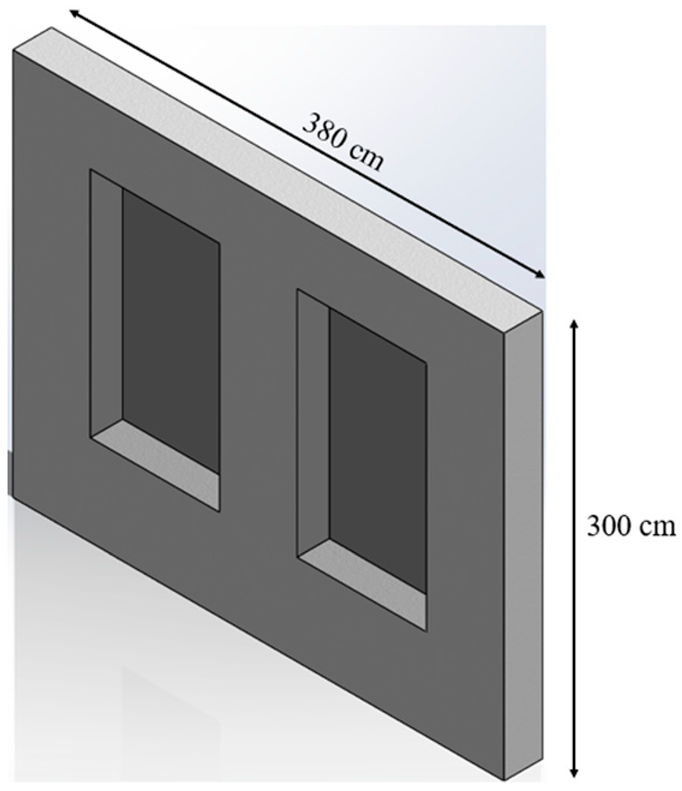
Following the evaluation with a thermal camera, two separate façade layouts in the building were modeled and simulated. The simulation models used in thermal analysis were preferred because they are the most frequently used façade layouts in the building. The width and height of the two separate façades were kept constant and the same. The appearance of curtain and AAC wall models and the building materials used in these models are shown in
Table 2. Thermal insulated glass and aluminum profile were used in the curtain wall model, and thermal insulated glass and aerated concrete building materials were used in the AAC wall model. Since double-glazed glass was used in the structure, double-glazed glass was also applied in the thermal simulation. The technical specifications of these materials are given in
Table 2.
The modeled façade layouts were simulated and analyzed in the thermal simulation module of the SolidWorks 2022 program. In the analysis of façade layouts, due to the boundless nature of the environment, conduction and convection heat transfer, which are the prominent heat exchange mechanisms between the interior and exterior façade surfaces, were used. The reliability of the study was increased by making analytical verifications. In this direction, manual calculations were made with heat transfer equations. Equation (1) takes into account the temperature changes by defining the three-dimensional heat conduction in the x, y, and z directions. In this equation, T is the temperature as a function of x, y, z, and time t. α is the thermal diffusivity of the material. To calculate the U-values of the façade sections, the thermal resistance of each material layer was taken into account. The thermal resistance (R
T) of a material is the ratio of its thickness (d) to its thermal conductivity (k). This resistance measures how well a material conducts heat. Equation (2) quantifies the thermal conductivity, which is the ability of an object to transfer thermal energy when there is a temperature difference. High U-values are associated with high heat flow, and the U-value (heat transmittance) is inversely proportional to the total thermal resistance (R
T) of the façade cross-section (Equation (3)). Lower U-values indicate higher thermal resistance, which translates into reduced heat flux, emphasizing minimized heat flow through a system, as shown in Equation (4). These formulated relationships serve as a foundation for understanding the complexities of heat transfer by conduction.
3. Findings
3.1. Interior Analysis
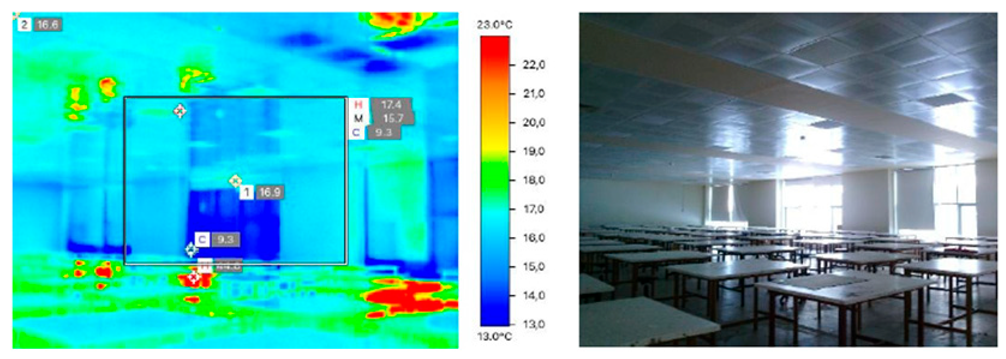
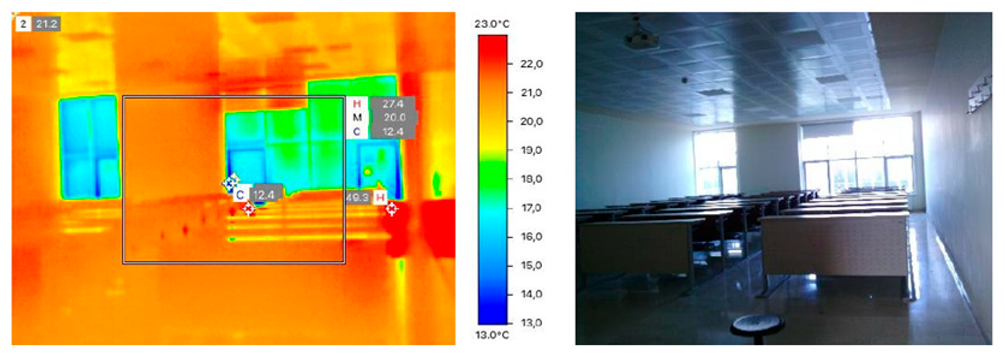
City and regional planning department studios and classrooms are located in D block. D-101, located on the ground floor, and D-202, located on the first floor, are used as the design studios of the city and regional planning department. Design studios are large open spaces where drawing tables are located and practical training is provided. D-305 and D-306, located on the top floor, are the theoretical classrooms of the department, which are smaller spaces compared to the studios, with fixed seating arrangements, where theoretical education is given. Thermal measurements were made in the studios and classrooms of the city and regional planning department between 13:55 and 14:05 Türkiye time. Thermal analysis values of the education departments in block D are given in
Table 3. In the infrared thermography analysis conducted indoors, measurements were made with a thermal camera three times for each space. By taking the average of the measurements, the reliability of the numerical values was increased and the deviation rate was minimized.
Considering the thermal values of the analyzed educational spaces, the following can be concluded:
In terms of glass surface temperature, D-306 classroom is 25.5% warmer than D-101, 14.1% warmer than D-202, and 2.7% warmer than D-305.
Within exterior wall temperature, studio D-202 is 33.4% warmer than D-101, 5.1% warmer than D-306, and 4.1% warmer than D-305.
In the interior wall temperature parameter, it was observed that the D-305 classroom was 15.7% warmer than D-202, 15.2% warmer than D-101, and 0.5% warmer than D-306.
In terms of slab temperature, classroom D-305 is 3.4% warmer than D-101, 2.4% warmer than D-202, and 1.5% warmer than D-306.
In terms of ceiling temperature, classroom D-305 was 12.8% warmer than D-101, 1.5% warmer than D-202, and 1% warmer than D-306.
Block D is oriented towards the south façade, which has the highest solar potential. As the height increased from the D-101 studio on the ground floor to the D-306 classroom on the second floor, the temperature on the glass surfaces also increased. Similarly, in general, as one moves from the ground floor to the upper floors, an increase in the temperature values of exterior and interior walls, slabs, and ceilings has been observed. The faculty has radiators heated by natural gas as a heat source. In this context, since the spaces closest to the heat center in the basement are on the ground floor, the heat source temperature values in terms of installation reached their highest values in the studios on the ground floor. Thermal analysis views of city and regional planning studios and classrooms are shown in
Table 4.
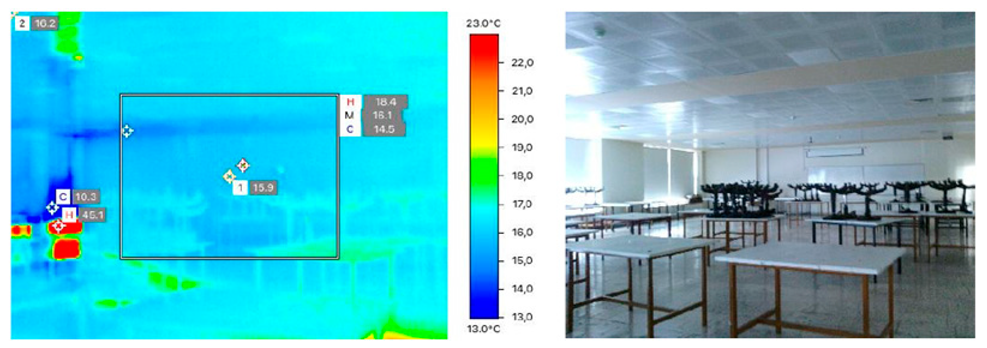
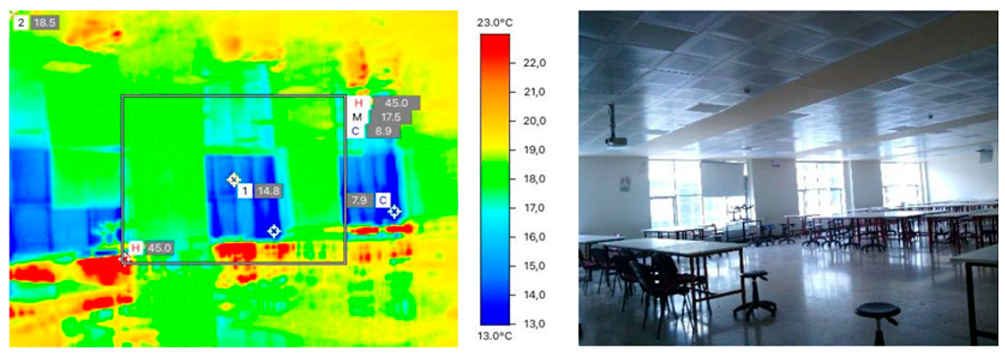
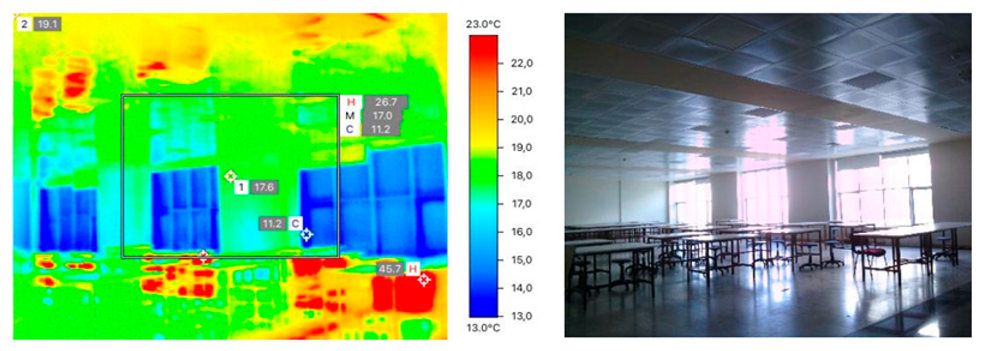
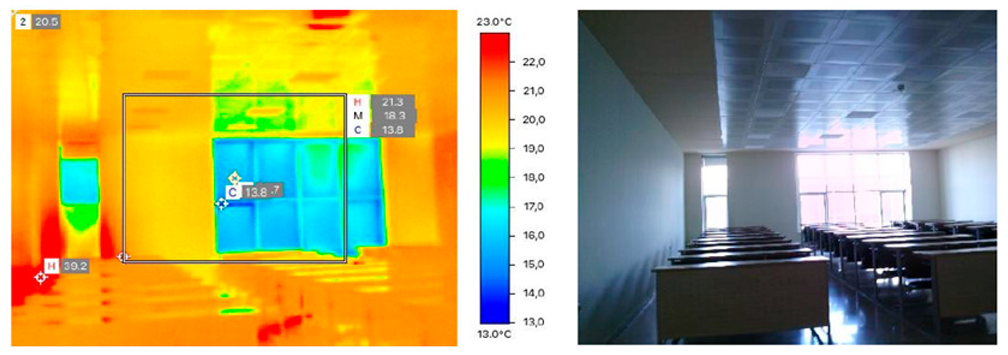
Block E, where the architecture department studios and classrooms are located, is oriented to the north façade. E-101 and E-102, located on the ground floor, and E-201 and E-202, located on the first floor, are architecture studios and places where applied training is given. E-301, E-302, and E-305, located on the 2nd floor, are architecture classrooms and spaces where theoretical education is given. Thermal measurements were made in the design studios and theoretical classrooms of the Department of Architecture between 14:10 and 14:30 Türkiye time. Thermal analysis values of the educational units in block E are given in
Table 5.
Considering the thermal values of the analyzed educational spaces, the following can be concluded:
In terms of glass surface temperature, E-305 classroom is 48.5% warmer than E-102, 42.7% warmer than E-202, 32.6% warmer than E-101, 18.8% warmer than E-201, 10.1% warmer than E-302, and 0.7% warmer than E-302.
Within the external wall temperature, E-301 classroom is 25.5% warmer compared to E-102, 17.5% warmer compared to E-101, 12% warmer compared to E-202, 10% warmer compared to E-201, 8.5% warmer compared to E-305, and 5.5% warmer compared to E-302.
According to the internal wall temperature parameter, E-301 classroom was 26.7% warmer compared to E-102, 22.5% warmer compared to E-101, 20.2% warmer compared to E-202, 14.2% warmer compared to E-201, 5.5% warmer compared to E-305, and 4.1% warmer compared to E-302.
In terms of slab temperature, E-201 studio is 21.3% warmer compared to E-102, 18.9% warmer compared to E-202, 16.1% warmer compared to E-302, 15.7% warmer compared to E-305, 14.9% warmer compared to E-301, and 10.4% warmer compared to E-101.
In terms of ceiling temperature, E-301 classroom was 23.5% warmer than E-102, 18.8% warmer than E-101, 16% warmer than E-202, 12.7% warmer than E-201, and 3.3% warmer than E-302 and E-305 classrooms.
Block E is oriented to the north façade, which has the least solar potential. In general, it has been determined that as the floor height increases from the E-101 studio on the ground floor to the E-305 classroom on the second floor, the temperature on the glass surface also increases. It was determined that the temperature values were higher in the studios closer to the interior of the building (E-101, E-201) than in the studios closer to the exterior (E-102, E-202). In addition, it was observed that the temperature values were higher in the classrooms closer to the interior of the building (E-301) than in the classrooms closer to the exterior (E-302, E-305). As the upper floors were reached from the ground floor, an increase was also observed in the external–internal wall, slab, and ceiling temperature values in general. Since the spaces closest to the heat center in the basement are on the ground floor, the heat source temperature values in terms of installation reached their highest values in the studios on the ground floor. The maximum temperature value of the heat source in E-301 classroom is due to the vertical heat installation pipes located close to this classroom. Thermal analysis views of architecture studios and classrooms are seen in
Table 6.
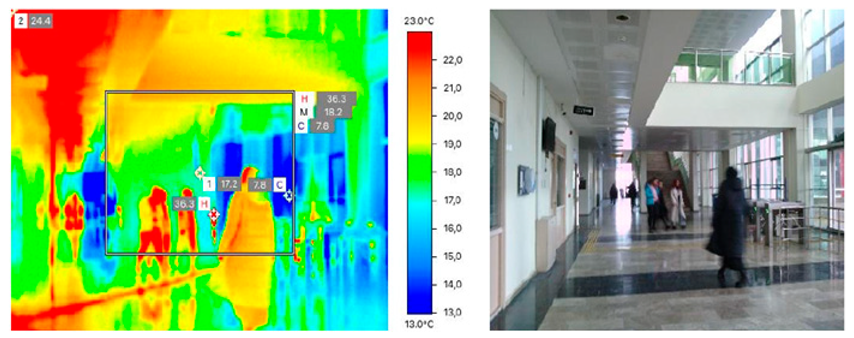
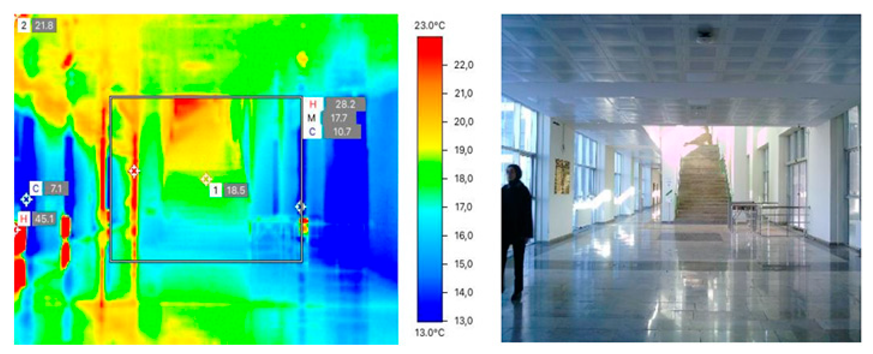
The student entrance in the southeast direction (G-SE), the academician entrance in the south (G-AE1), and the student entrance in the north (G-AE2) on the ground floor were also imaged with a thermal camera. The data of three separate entrances are shown in
Table 7. Thermal measurements were made at the entrance of students and academicians between 13:50 and 14:30 Türkiye time. Within the scope of thermal values obtained from building entrances, the following can be concluded:
In terms of glass surface temperature, the G-AE1 entrance was 48.5% warmer compared to G-AE2, and 32.6% warmer compared to G-SE.
Within the external wall temperature, the G-AE1 entrance was 19.7% warmer compared to G-AE2, and 10.4% warmer compared to G-SE.
In the internal wall temperature parameter, it was found that the G-AE1 entrance was 20% warmer compared to G-SE and 14.8% warmer compared to G-AE2.
In terms of slab temperature, the G-AE1 entrance was 17.5% warmer compared to G-AE2, and 10.4% warmer compared to G-SE.
In terms of ceiling temperature, the G-SE entrance was 4.8% warmer than G-AE1 and 1.6% warmer than G-AE2.
G-AE1 entrance has the highest temperature values in almost all parameters because it is positioned towards the south façade. The lowest glass surface and exterior wall temperature values were measured at the G-AE2 entrance as it was positioned towards the north façade. Since the G-SE entrance is a complete curtain wall and is directly exposed to sunlight, the ceiling and heat source temperatures are high. Thermal analysis views of G-SE, G-AE1, and G-AE2 entrances are shown in
Table 8.
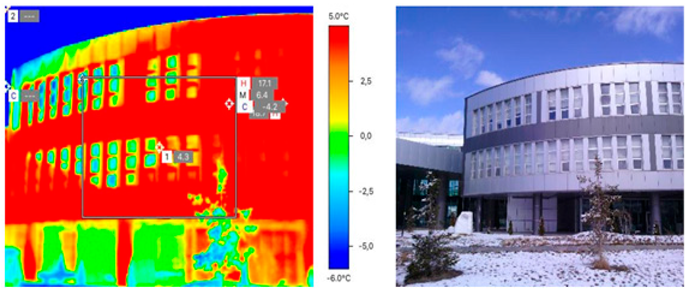
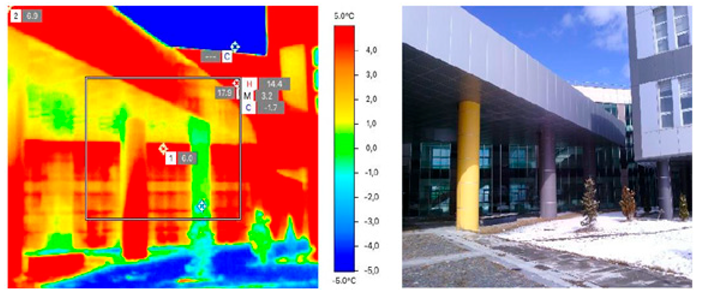
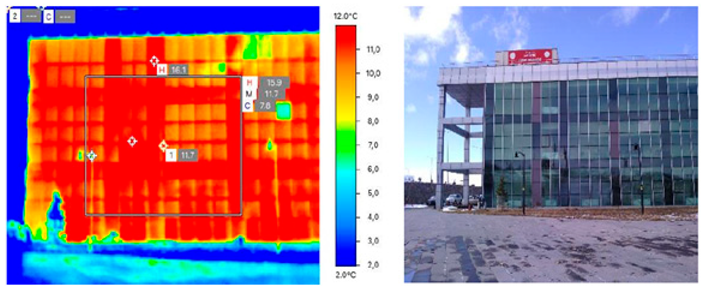
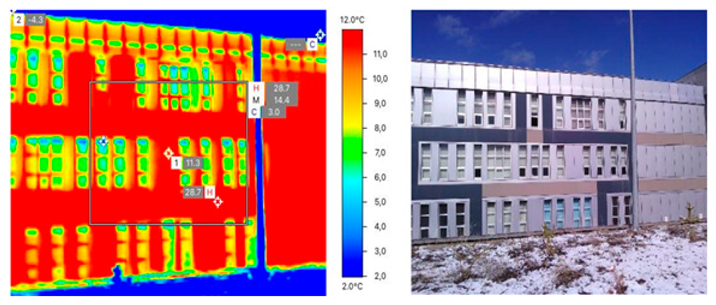
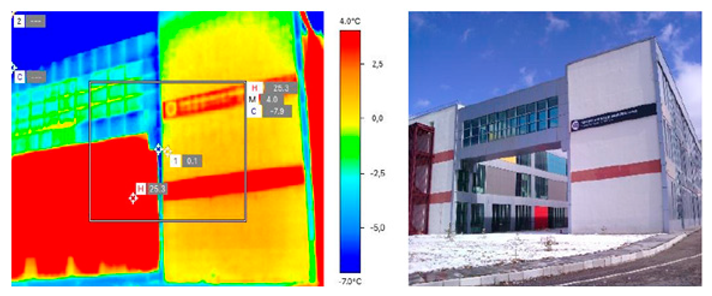
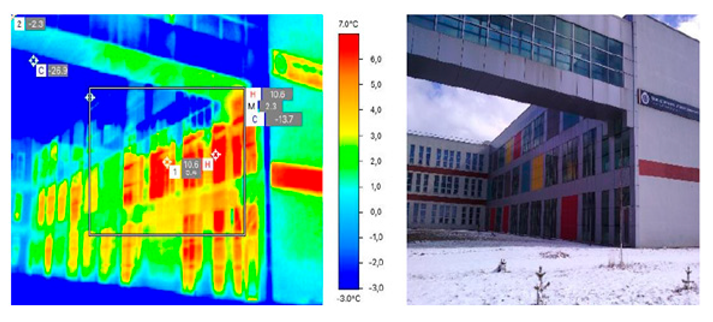
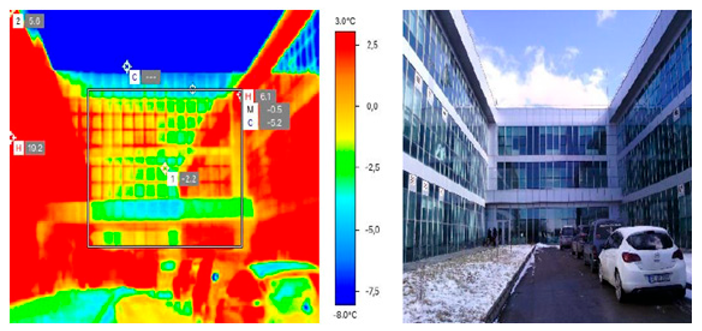
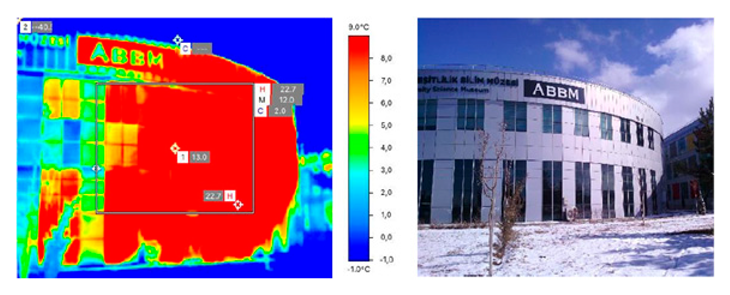
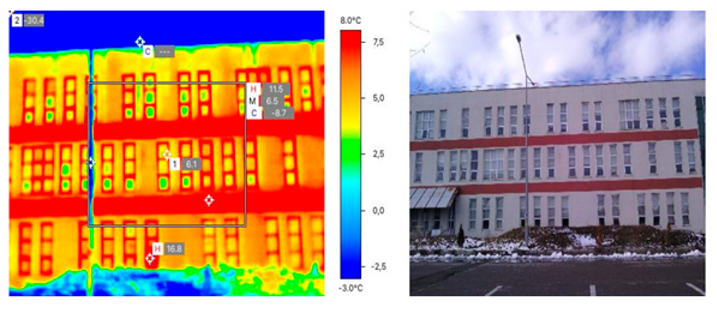
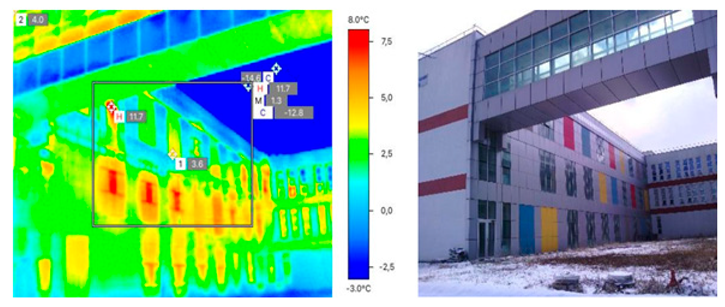
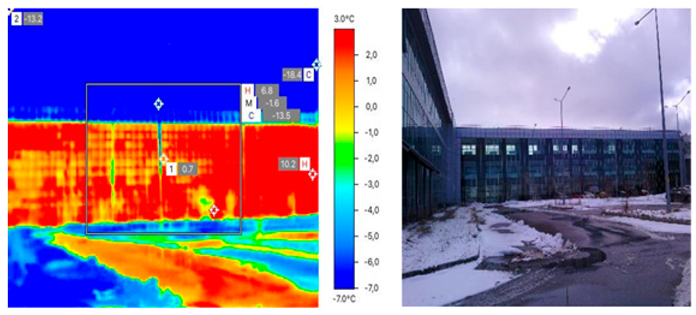
3.2. Outdoor Analysis
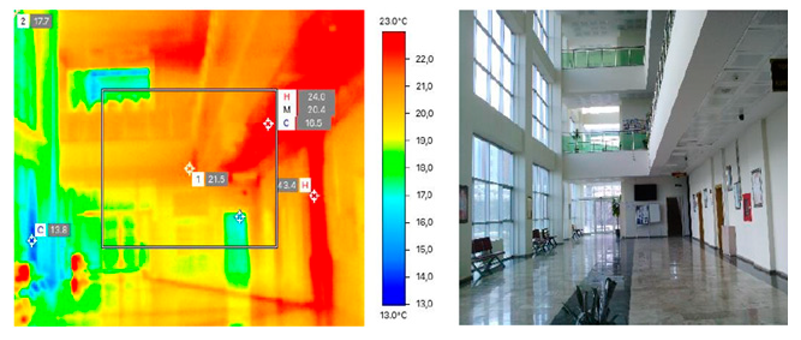
Thermal analysis of the exterior was carried out at noon between 13:15 and 13:50 Türkiye time. The outer part of the large triangular canopy, located on the south façade of the faculty and covering the student entrances, was measured as 6 °C and the inner part as 3.7 °C. Although it is located on the south façade, there is a difference of 2.3 °C between the inner and outer parts of the canopy. This situation shows the negative thermal effect of spreading the canopy over a wide area. It has been determined that the thermal temperature on these façades is high as a result of the use of radiators as a heat source in the interior parts of the exterior curtain wall sections. The temperature was higher in building sections where there were no windows and only wall and façade coverings. In this regard, it has been concluded that wall and façade coverings retain heat, while windows cause heat losses. In addition, it has been determined that white or almost white façades reflect the sun’s rays and have lower temperatures, while black or dark façade coverings absorb the sun’s rays and increase the temperature on the surface. Views of outdoor façades are given in
Table 9. In the infrared thermography analysis conducted outdoors, measurements were made with a thermal camera three times for each façade. By taking the average of the measurements, the reliability of the numerical values was increased and the deviation rate was minimized.
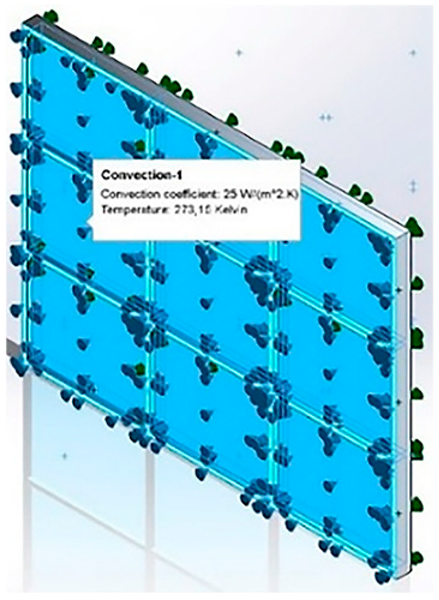
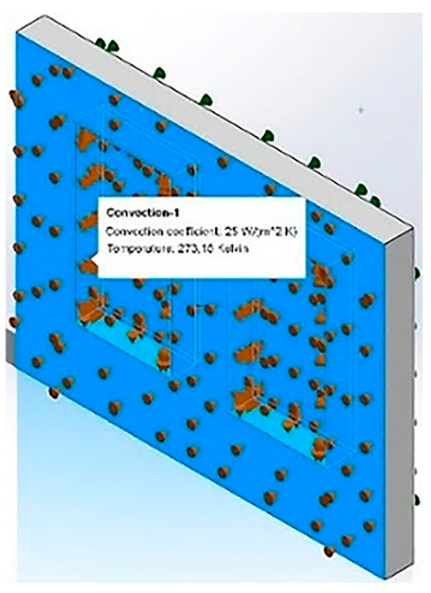
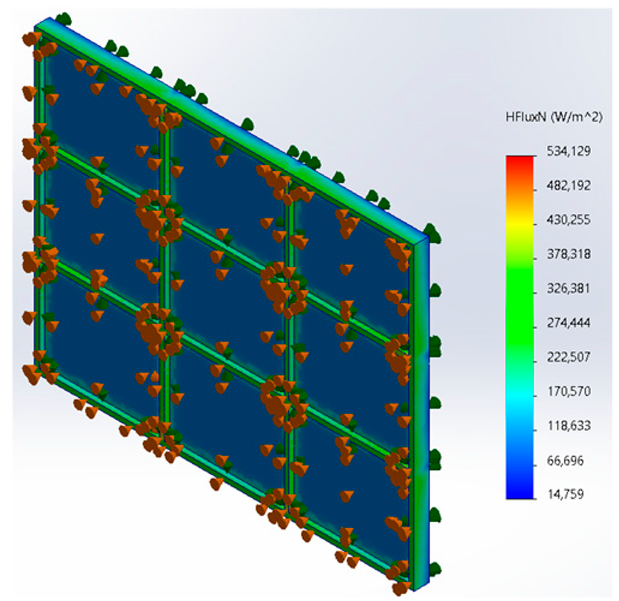
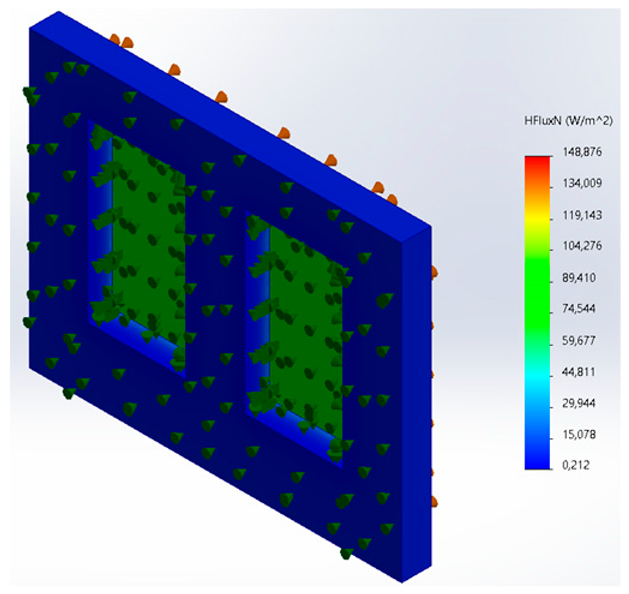
4. Thermal Simulation Analysis
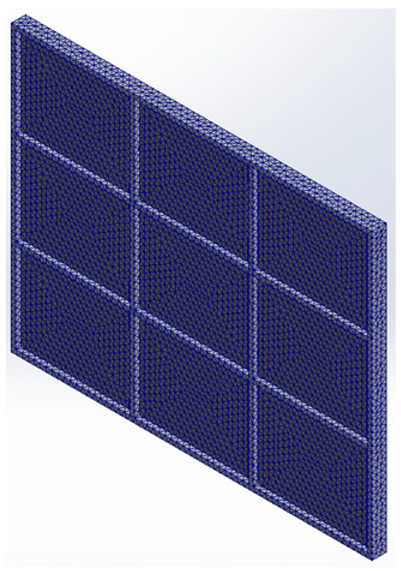
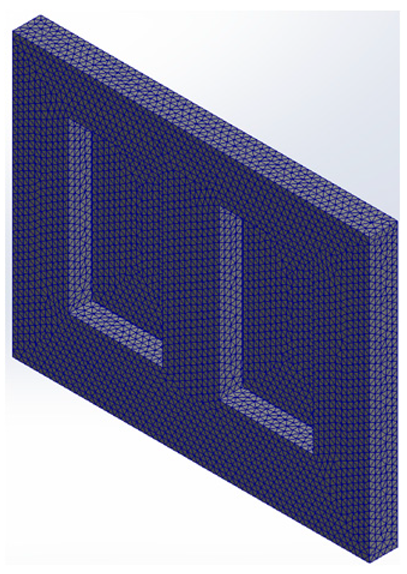
After the findings, using infrared thermography and the determinations of indoor and outdoor conditions, the simulation phase was started. At this stage, first models were created and material definitions were made. The mesh density has been maximized in order to ensure efficient analysis values of two separate models designed in the SolidWorks 2022 program. Maximum mesh sizes are set specific to the models. Increasing the mesh states to the highest values increased the accuracy and validity of the simulation by ensuring that the system operated at an optimum level.
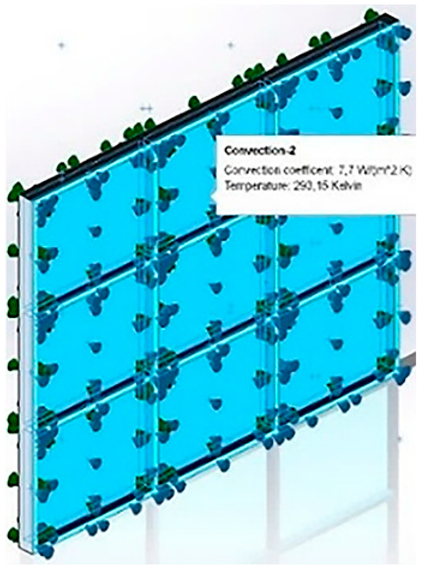
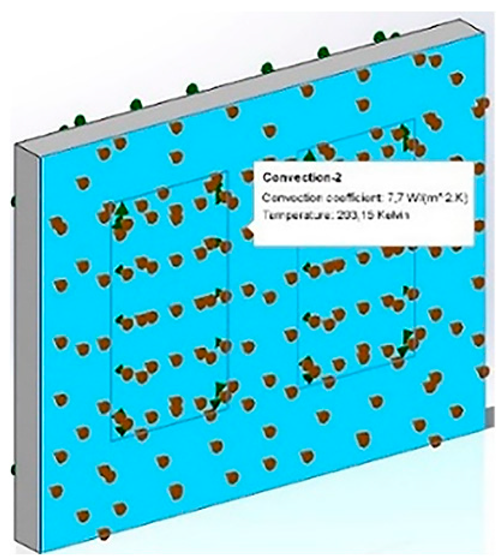
Conduction and convection thermal loads were applied in the models. Accordingly, temperature transitions and heat permeability were adjusted in the simulation. Steady state conditions and heat transfer were achieved as a result of a constant heat flow. Outdoor temperature (cold side) is 273.15 K and external heat transfer coefficient is 25 W/m
2.K, indoor temperature (hot side) is 293.15 K, and internal heat transfer coefficient is 7.7 W/m
2.K was taken as [
45]. The models meet the requirements of the EN ISO 10211 standard [
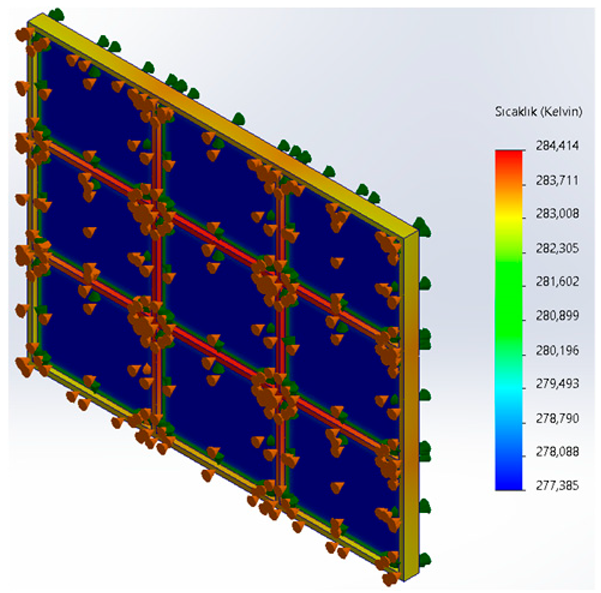
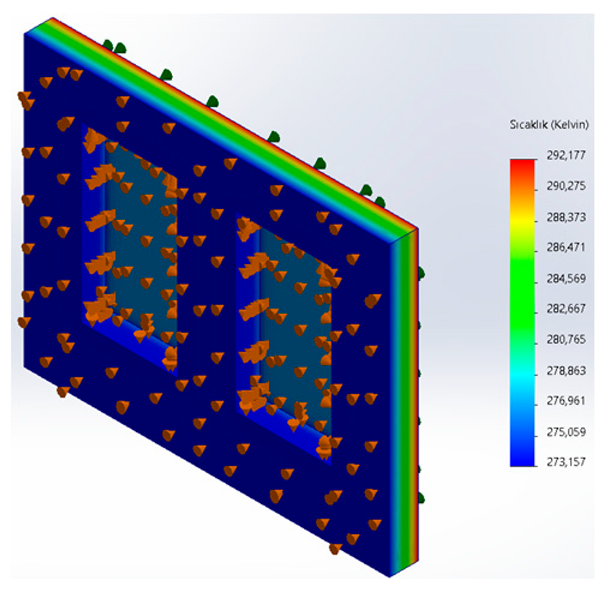
46]. After material assignments and thermal loads were added, the simulation was performed. After the simulation, the average heat flow through all surfaces in the façade sections was determined and used in further calculations. The result was divided by the temperature difference set as 20 K and the U-value was obtained according to Equation (5). H
fAVG is the average heat flow (W/m
2) and
T is the temperature difference (Δ
T). The appearance of thermal loads in the models and the views obtained as a result of the simulation are given in
Table 10. Temperature and heat flow results are presented in graphs. In the AAC wall model, the number of nodes is higher depending on the thickness of the wall. The fact that the simulation results are between the values of the entered thermal loads proves the accuracy of the analysis.
5. Discussion
When a comparative thermal analysis is made between interior spaces, the place with the highest temperature values of glass surfaces is the D-306 classroom (upper floor). This means that the temperature on the upper floors increases compared to the ground floors. According to the external wall temperature values, the place with the highest value is the D-202 studio (middle floor). Considering that the glass surfaces and external walls face the same (south) façade, directly proportional results were obtained from the analyses. Sections D-202 and D-306 are located on the 1st and 2nd floors, respectively, and are located on the same vertical alignment. In this regard, the results obtained from these sections showed that the thermal effect was at the highest level in the same vertical axis in D block. In addition, it was observed that D block, facing the south façade, gave better thermal results than E block, facing the north. Based on the data obtained, the following can be concluded:
In terms of glass surfaces, D-306 classroom has a difference of 2.7% compared to D-305, which has the closest performance, and 61.4% difference compared to E-102, which has the furthest performance. It was predicted that the reason why classrooms are warmer than studios in glass surface temperatures measured from the interior is due to parameters such as the wider window widths of the studios, the areas of the classrooms being smaller than the studios, and the presence of fewer windows in the classrooms.
In terms of external walls, studio D-202 has a difference of 4.1% compared to D-305, which performs closest to it, and 33.4% compared to D-101, which performs furthest from it.
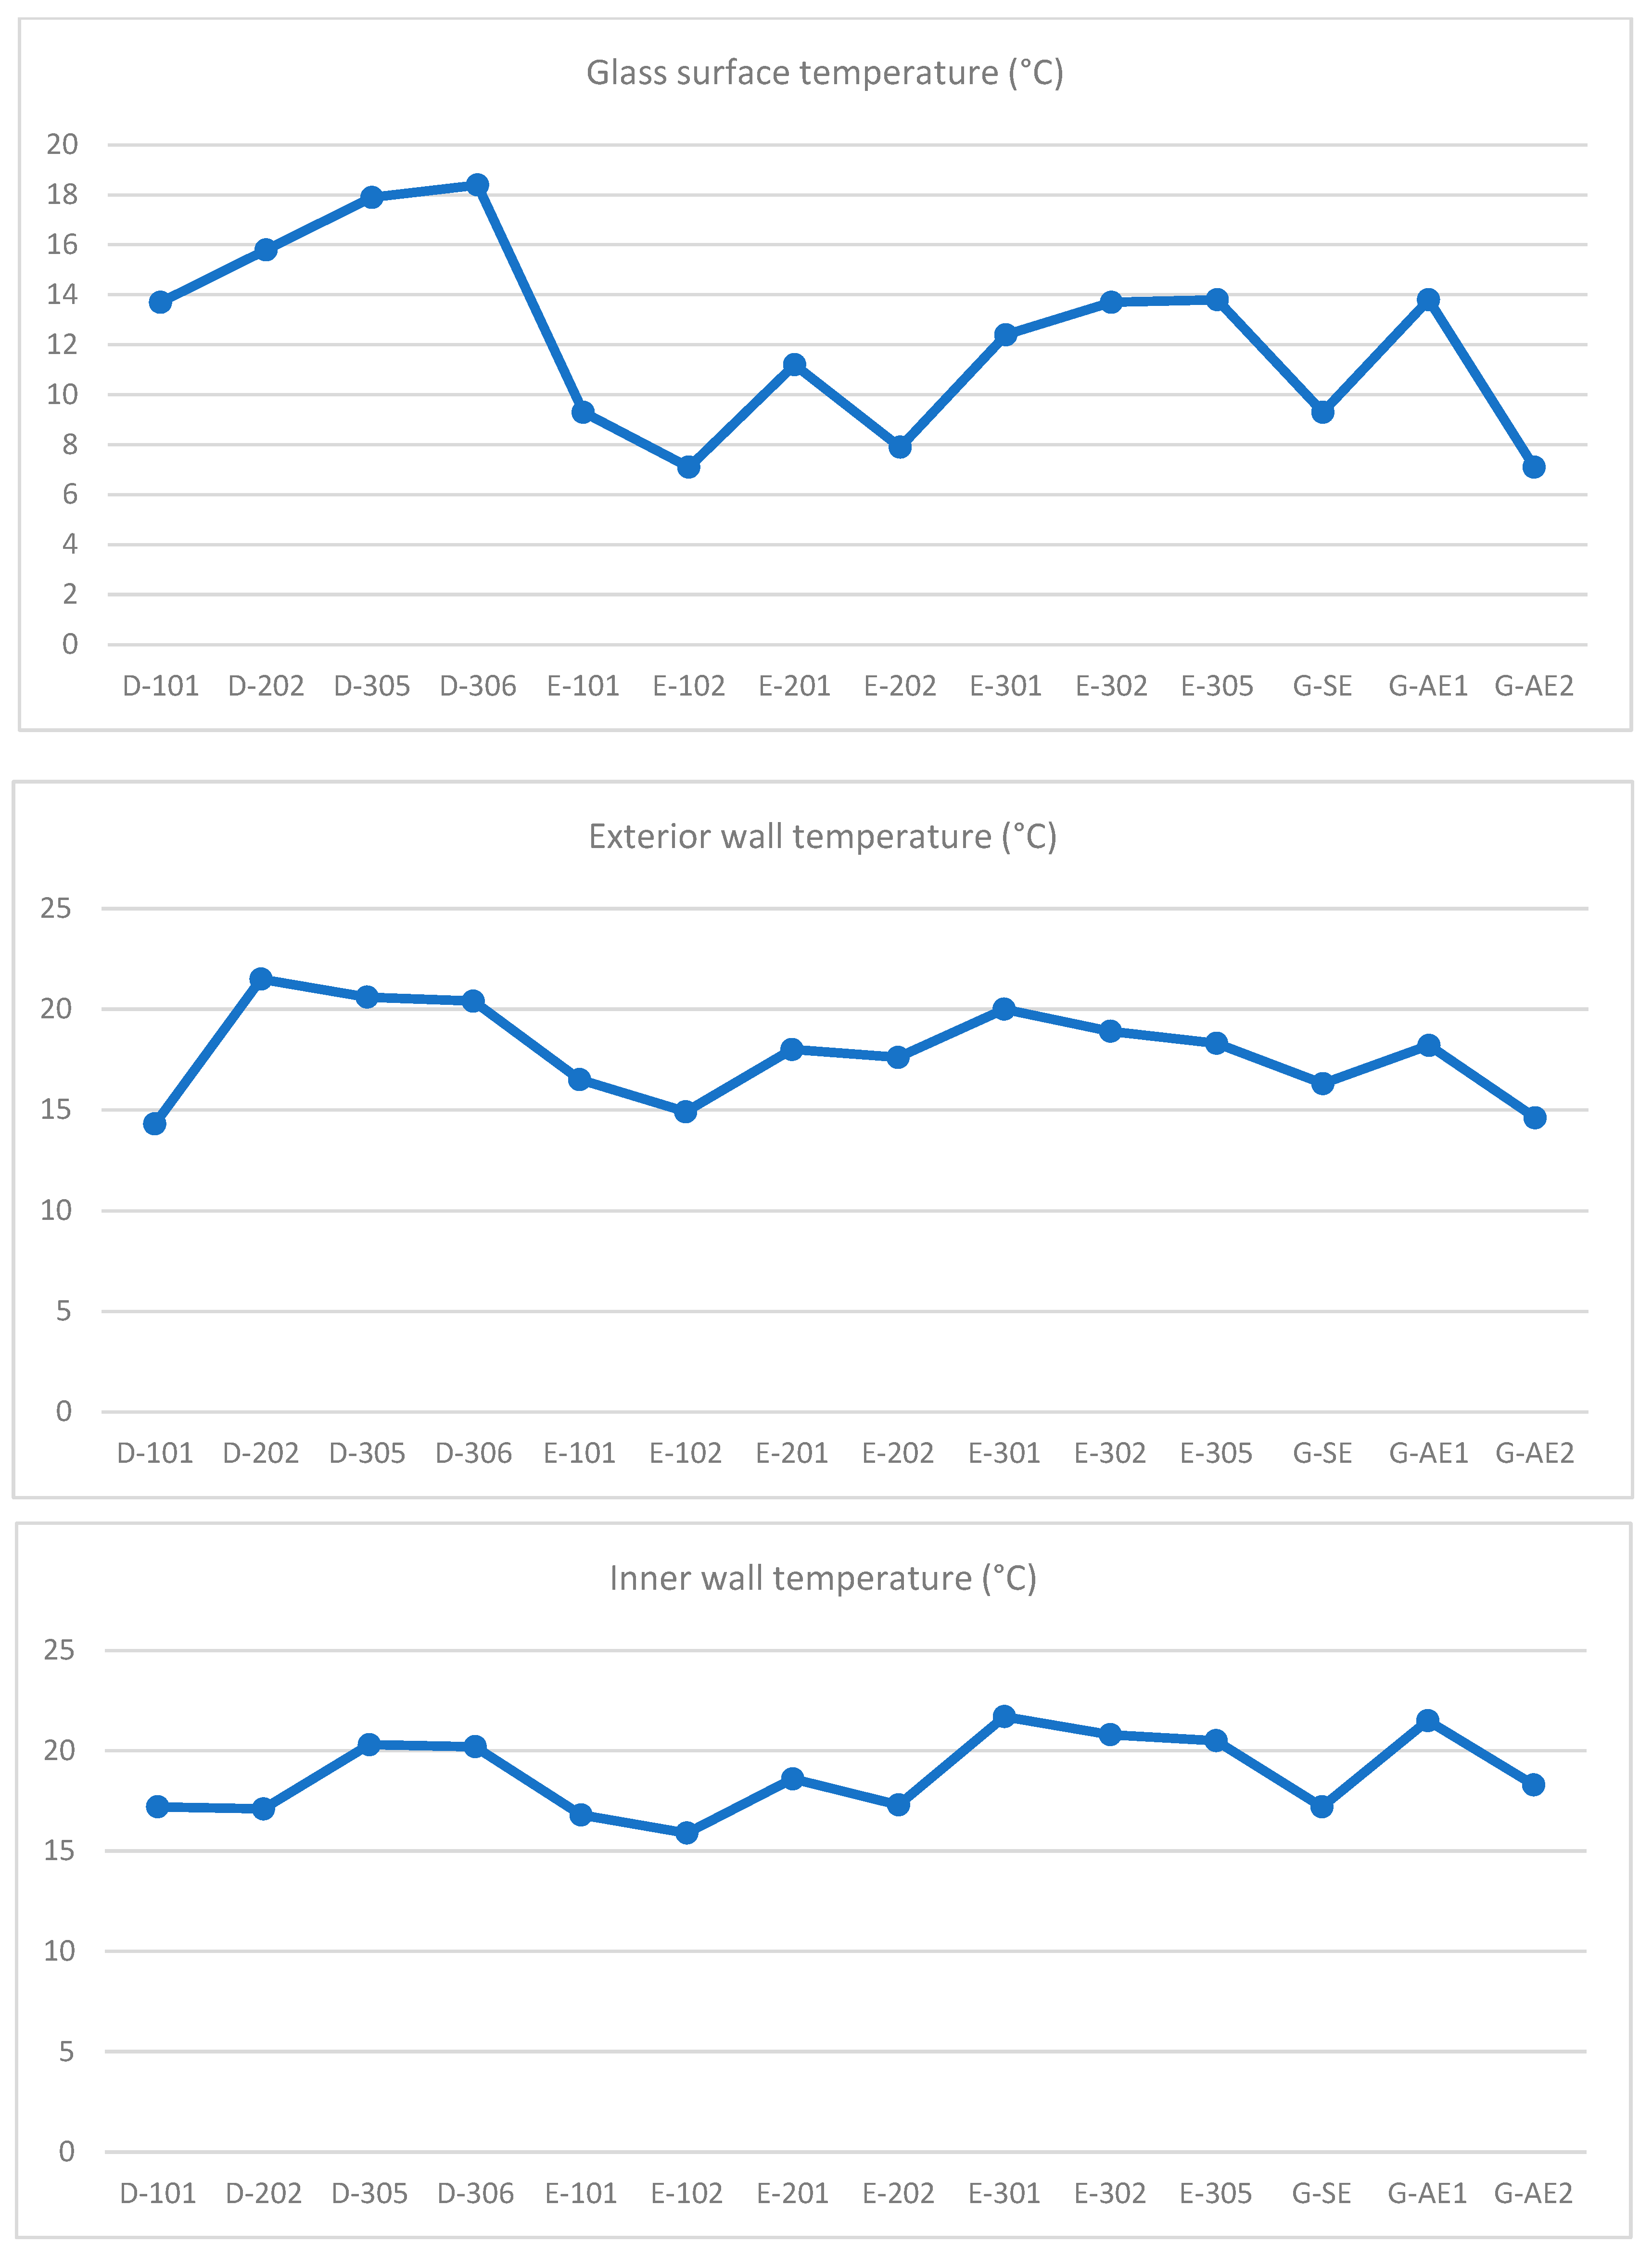
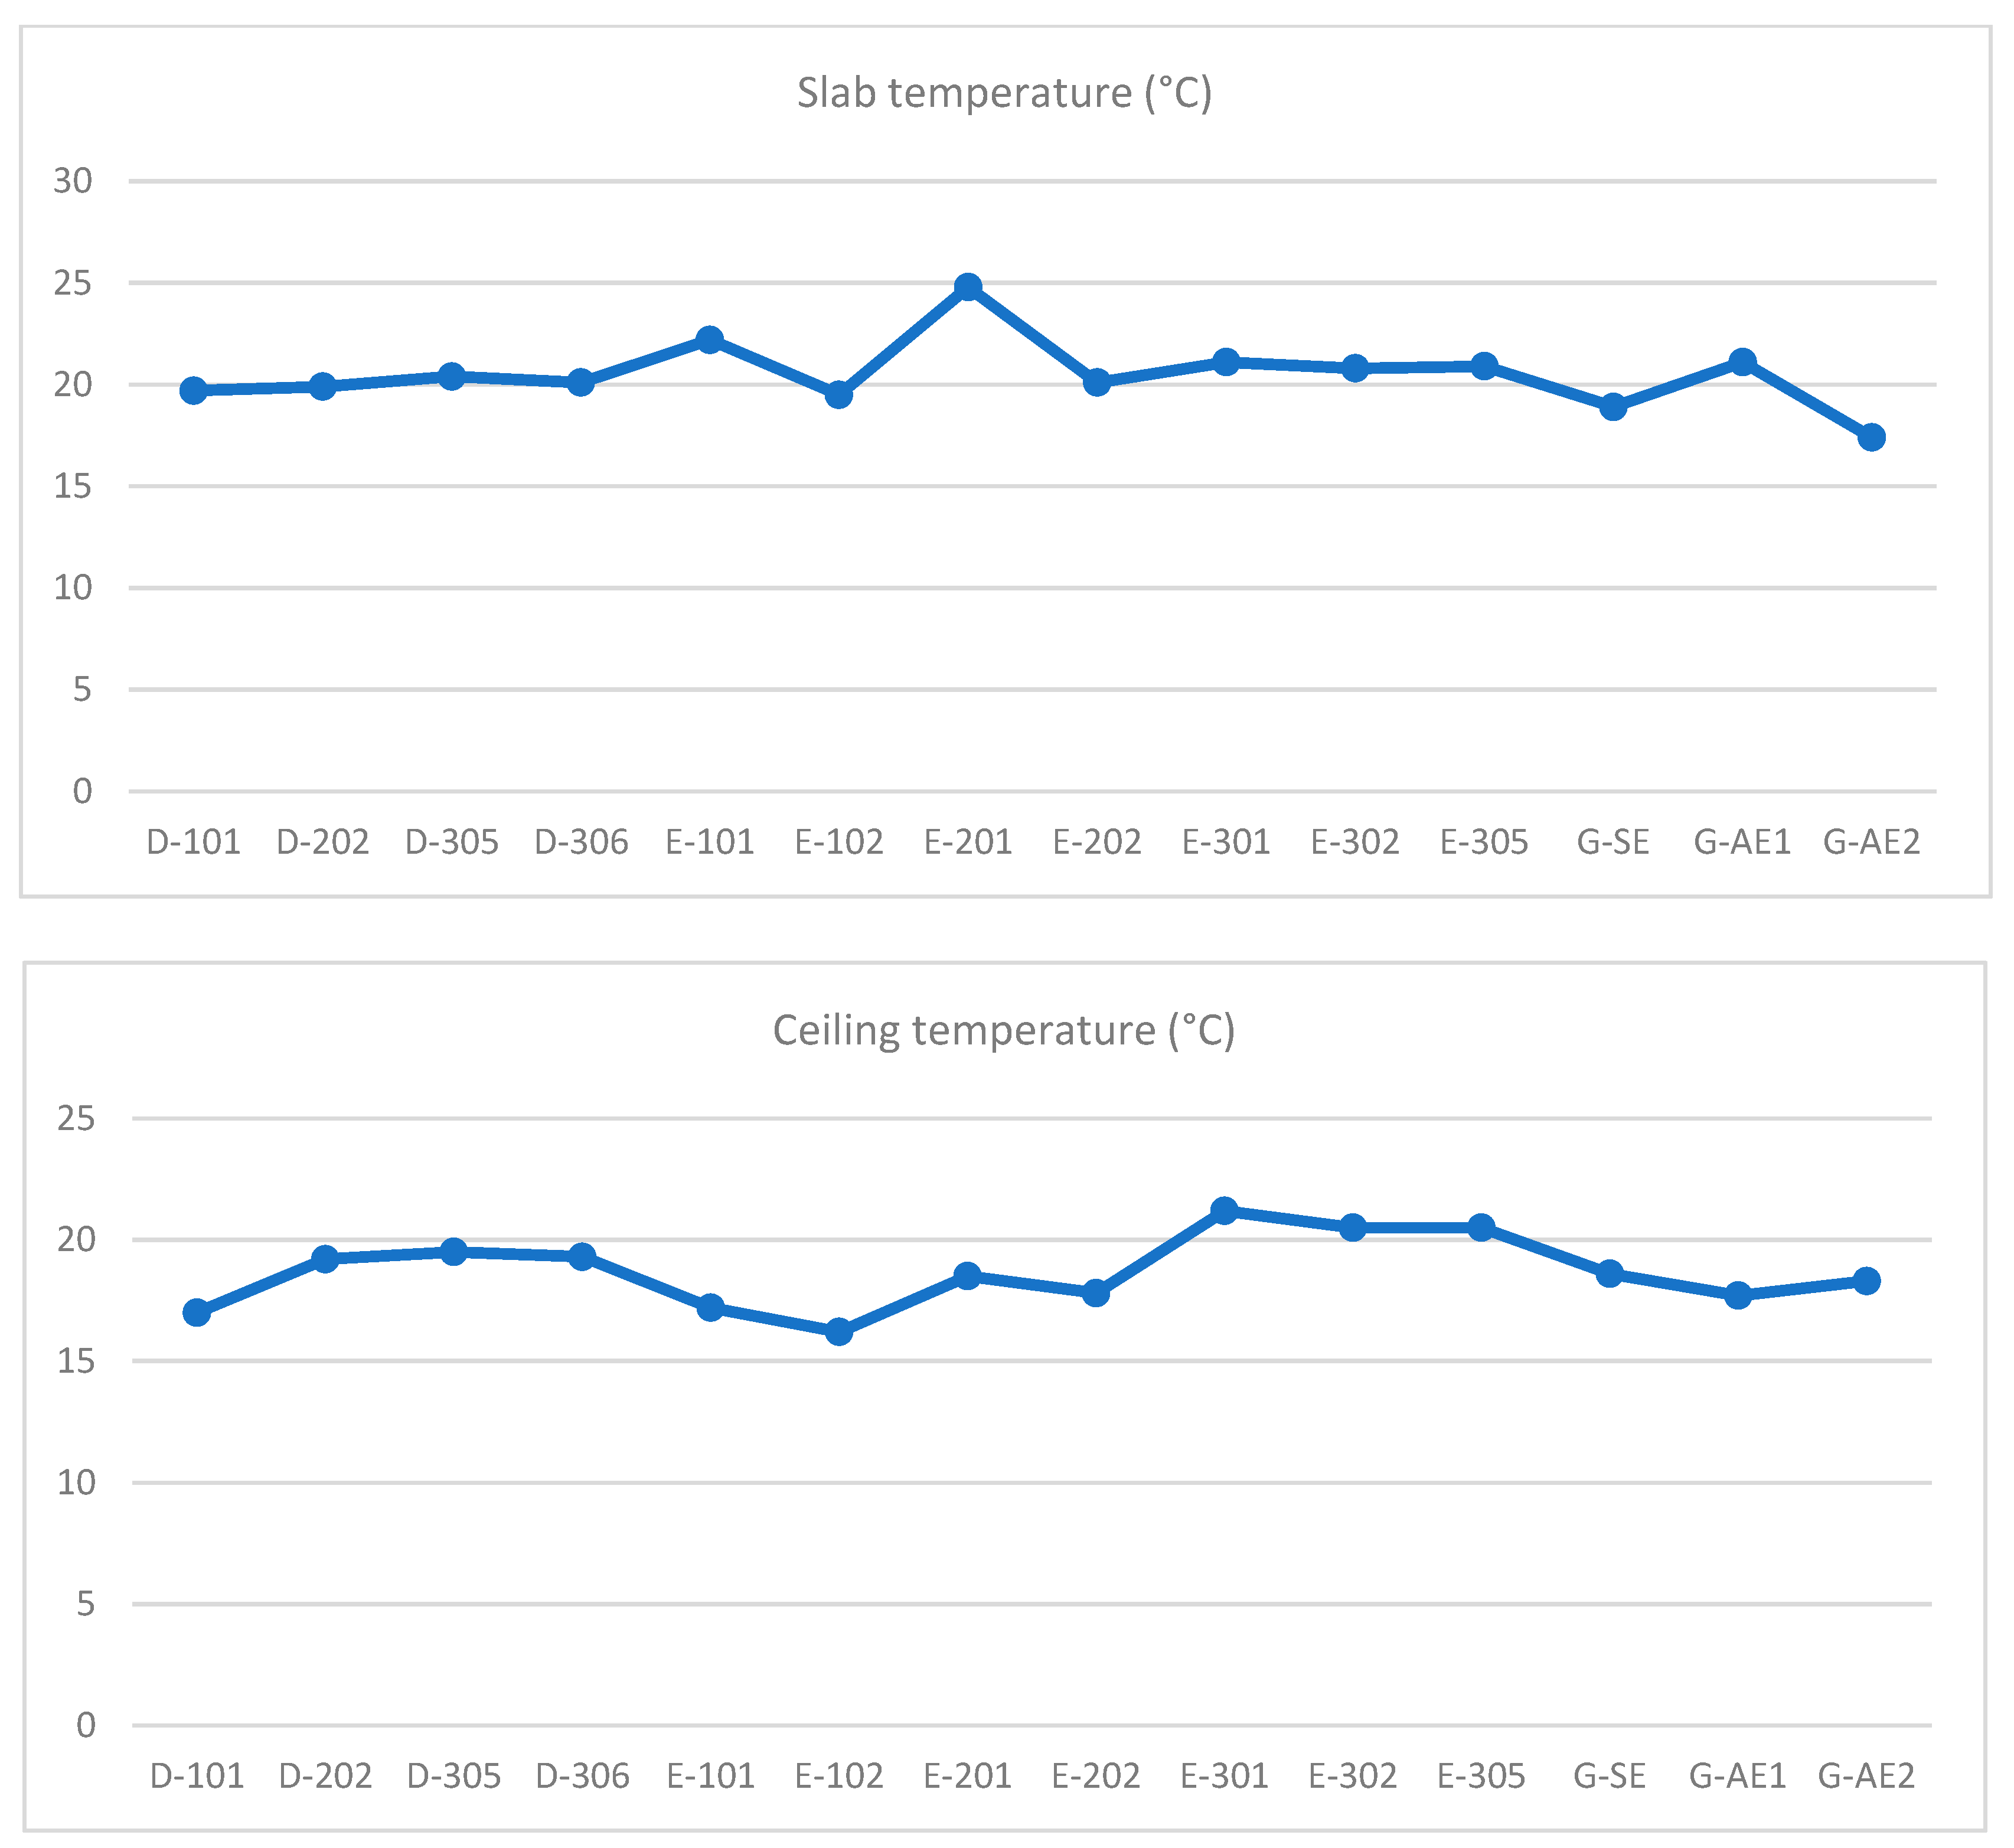
Interior wall, slab, and ceiling structural elements are the determining elements of a space. In terms of thermal effects, directly proportional results were obtained from these elements in the light of numerical data. According to interior wall temperatures, the place with the highest value is the E-301 classroom. Since the interior walls of this classroom, located on the 2nd floor, are located far from the exterior, it was predicted that the temperature value would be high. In terms of slab temperature, the best results were seen in studio E-201, located on the middle floor. According to the ceiling temperature, the room with optimum values is the E-301 class on the upper floor. The fact that E-201 and E-301 spaces are located on the 1st and 2nd floors, respectively, and are planned on the same vertical axis, shows that the thermal effect is at the optimum level at this point. The building parts where thermal analysis is clearly effective are glass surfaces and interior walls. In this context, numerical data of the analyzed building sections are shown in
Figure 4. According to thermal analysis values, the following can be concluded:
Within the scope of interior walls, E-301 classroom has a difference of 0.9% compared to the G-AE1 entrance, which shows the closest performance, and 26.7% difference compared to E-102, which shows the furthest performance. The interior wall temperature of the classroom is high due to its low square meter area and small windows. Since the G-AE1 entrance is located on the south side, it was observed that the interior wall temperature was high. The interior wall temperatures of the E-102 studio are low due to parameters such as its large square meter area, location on the ground floor, and many windows.
In terms of slabs, the E-201 studio has a 10.4% difference compared to the E-101 studio, which performs closest to it, and a 29.8% difference compared to the G-AE2 entrance, which performs the furthest from it. Since the G-AE2 entrance is located on the north side, the slab temperature is at the lowest level.
In terms of ceilings, E-301 classroom has a 3.3% difference compared to E-302 and E-305 classrooms, which perform closest to it, and a 23.5% difference compared to E-102 studio, which performs furthest from it.
High temperatures in classrooms and studios that are close to the heating center in the basement, heat sources and vertical heating installation pipes, and low temperatures in classrooms and studios that are farther away are important factors affecting thermal comfort in the educational environment. For effective thermal comfort of educational spaces, the heating systems in the building should have an equal approach to each educational section. In this direction, installation solutions should be developed and insulation and HVAC improvements should be made.
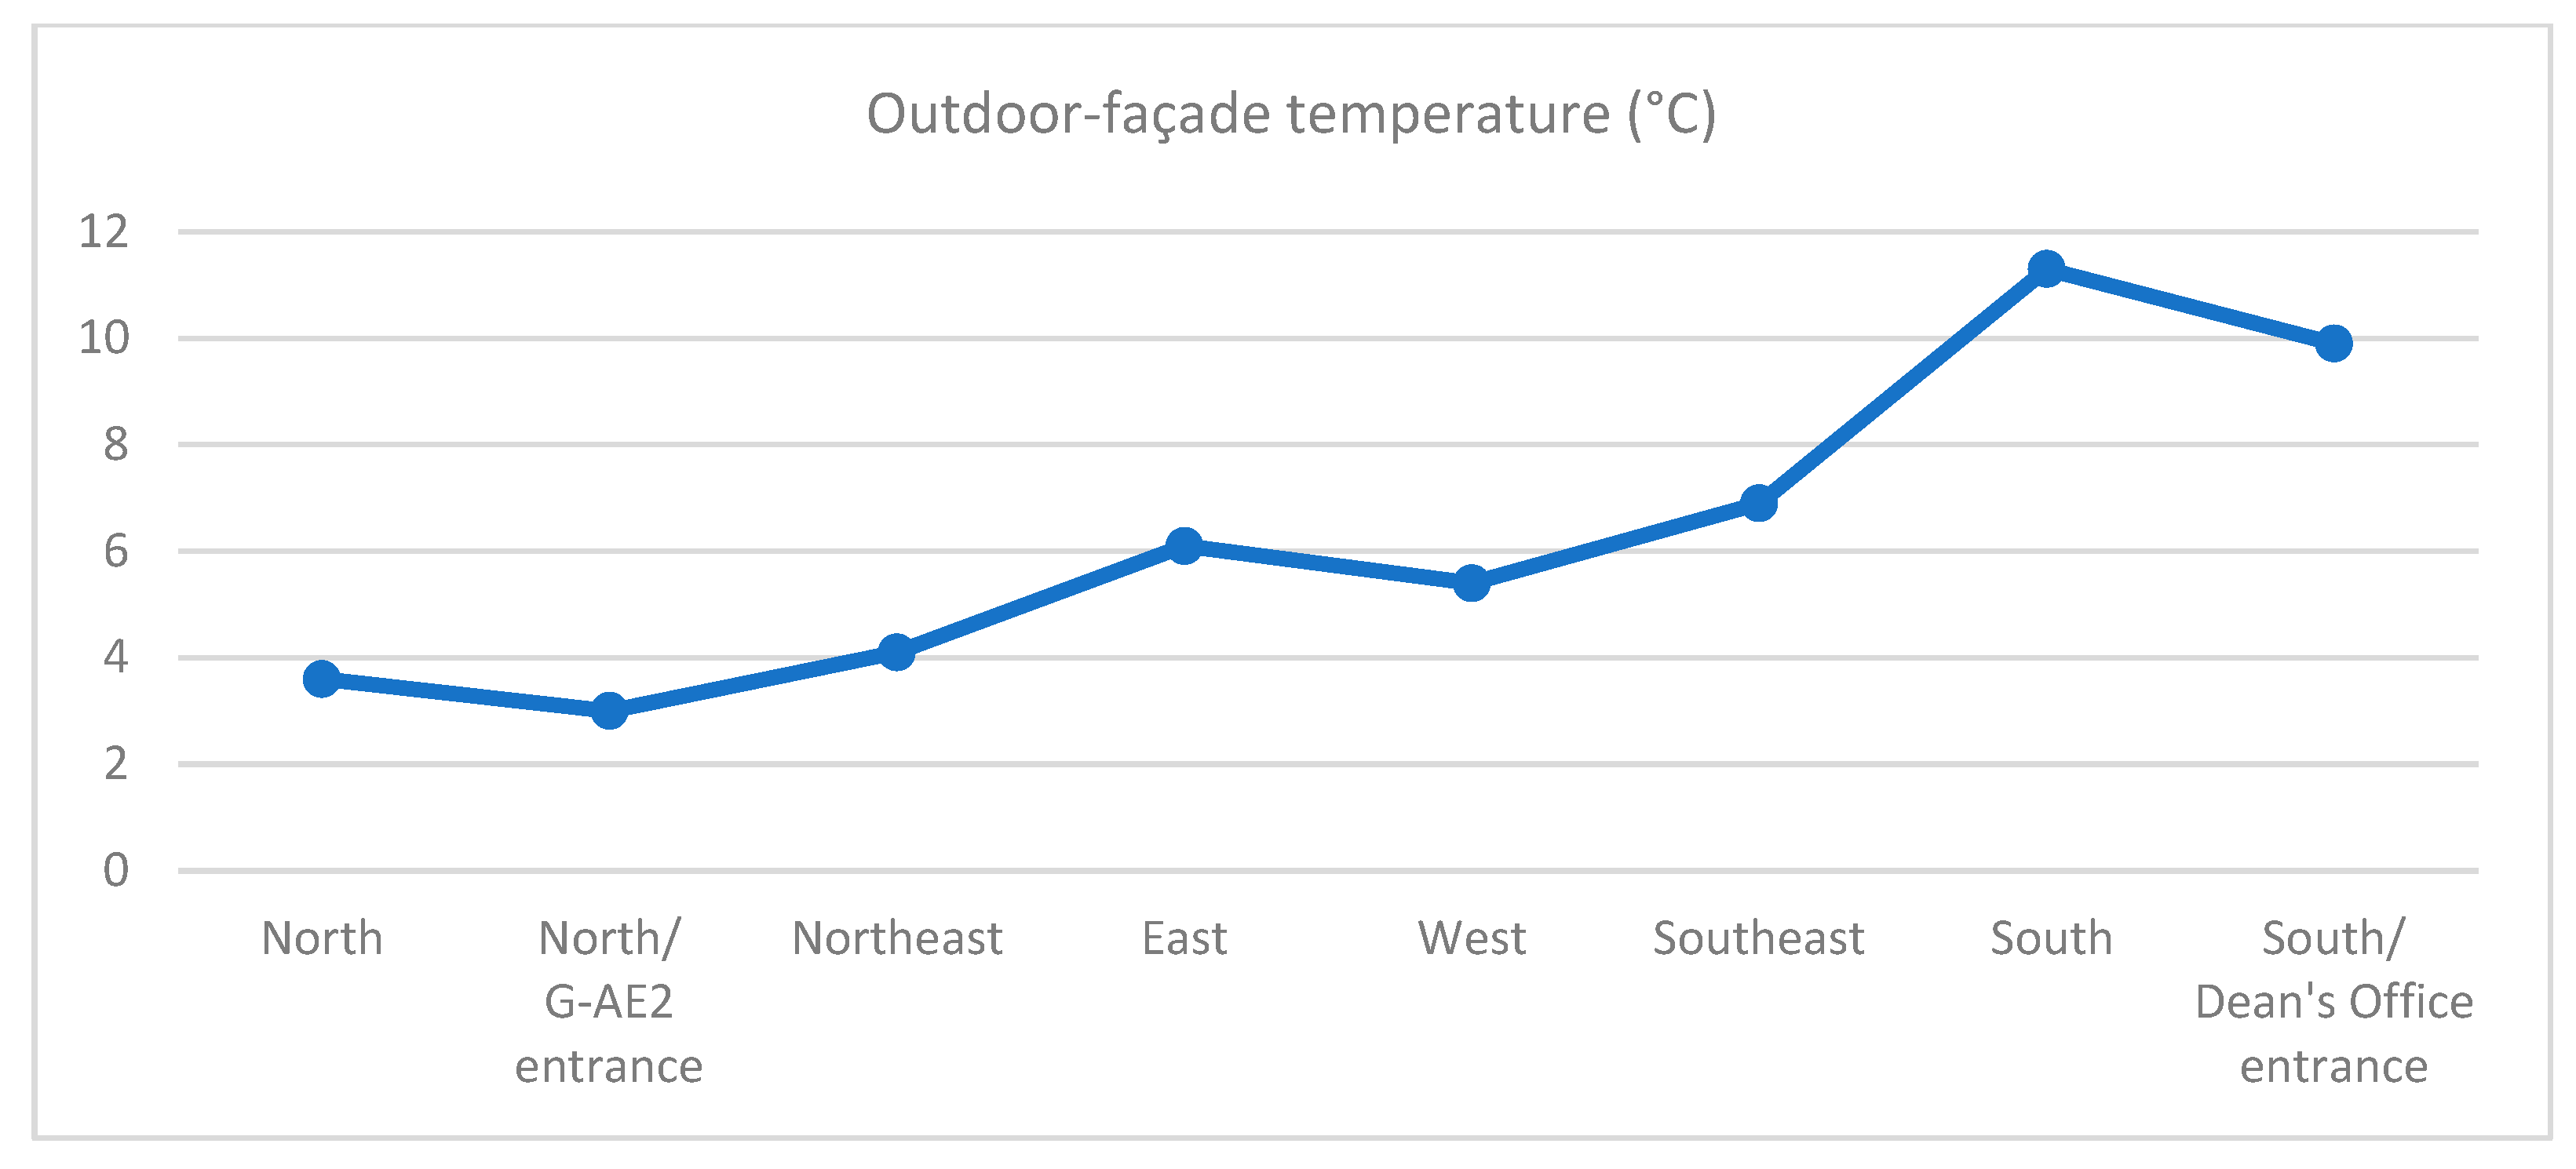
When looking at the analysis of outdoor spaces, the temperature values on the south façade were highest, while the lowest surface temperature values were recorded on the north side, where the G-AE2 entrance is located (
Figure 5). There is a G-SE entrance in the building section where the southeast façade is located. In the section where this entrance is located, there is a top cover system with triangular geometry. In the thermal measurements made at different points of the top cover system, it was determined that the temperature values decreased even though it was on the south façade compared to the winter months. In this regard, it has been concluded that the top cover system is disadvantageous in winter and advantageous in summer because it provides a shaded area. When the section with the entrance to the deanery on the south façade is examined, a console of approximately three meters was found on the upper floors. According to thermal analysis, the temperature values in the area under the console section on the ground floor are lower compared to the upper floors. Based on this, it was concluded that the number of consoles should not be excessive, taking into account the climate of Erzurum province.
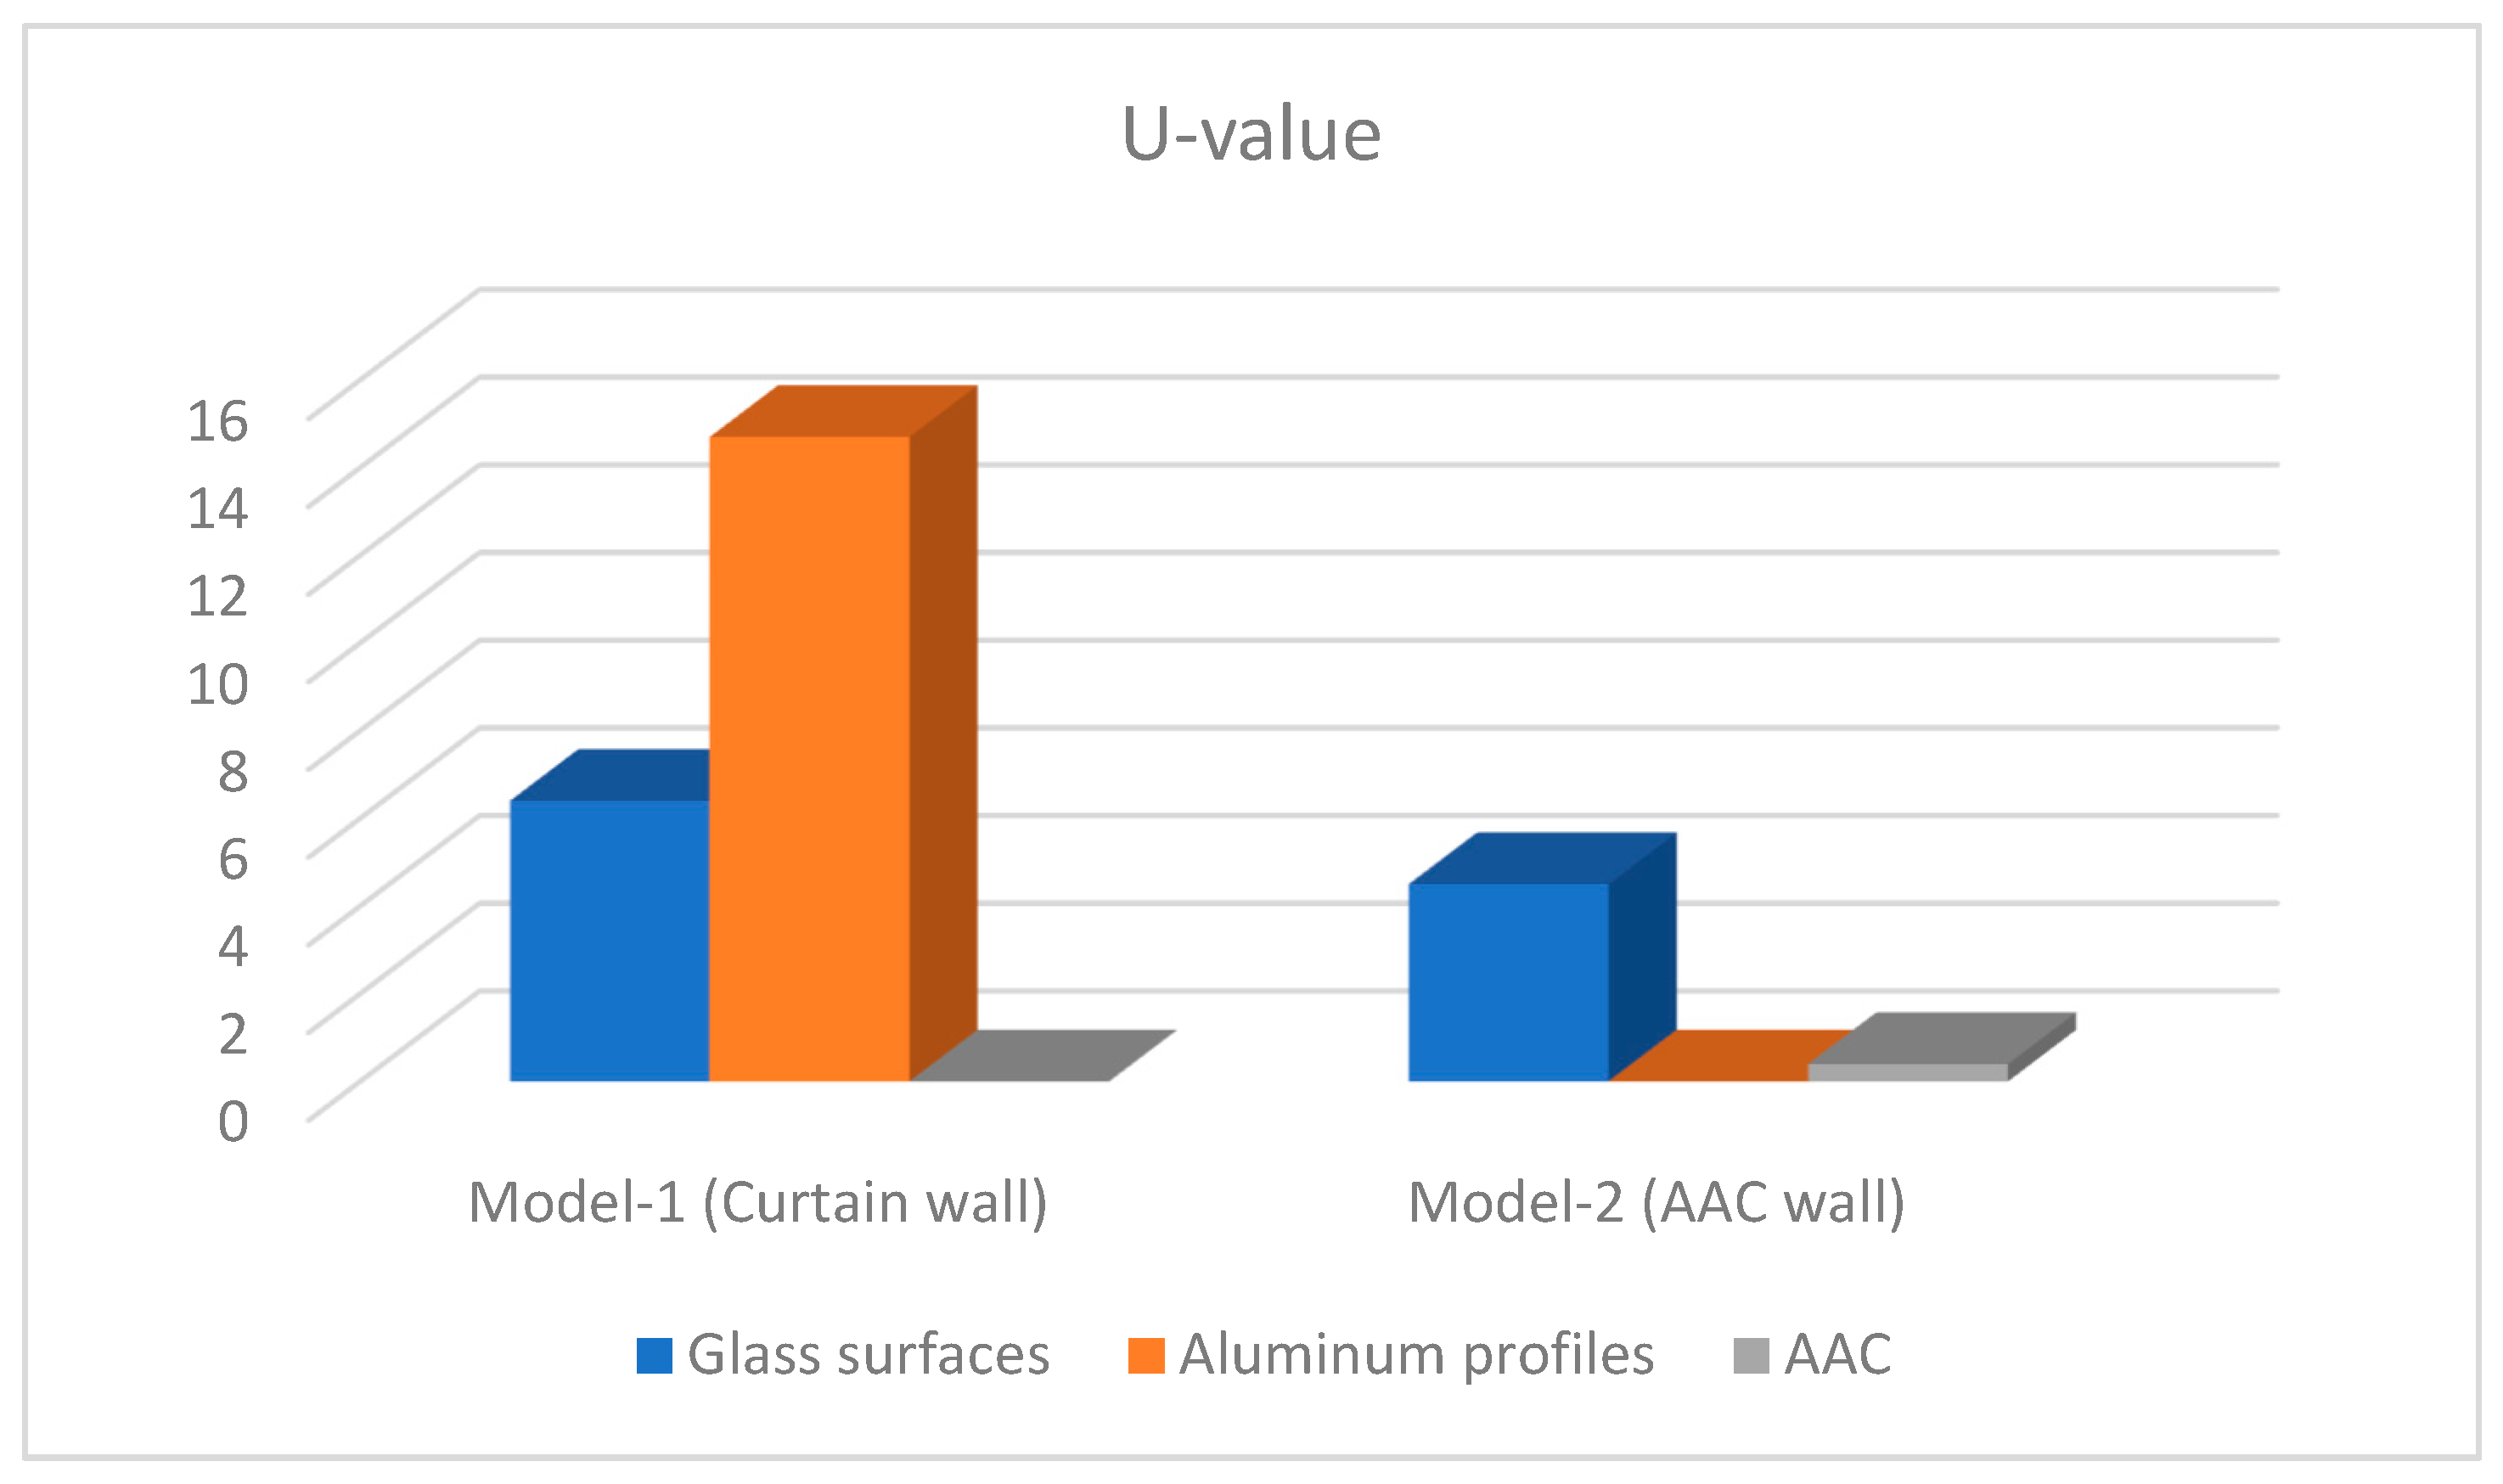
Looking at the results obtained with the simulation program, the U (heat transmittance) values of the curtain and AAC wall models were found. Data on U-values are given in
Figure 6. According to the analysis results, the following can be concluded:
The glass surfaces used in the AAC wall model had a 39.6% advantage in terms of U-value compared to the glass surfaces in the curtain wall model.
In terms of building materials, since aluminum has a high thermal conductivity, it has a 68% disadvantage compared to glass and a 94% disadvantage compared to AAC in terms of U-value in models.
According to the total U-values of two different façade designs, it was found that AAC wall provides 316% better thermal behavior than curtain wall.
The use of thermally insulated glass panels reduces the U-value. In addition, aluminum profiles have high thermal conductivity. In the AAC wall model, the low heat permeability value of AAC showed that this wall could be used on the north façade of the faculty. Glass was used in both wall models. When the U-values of the glass are examined, they are found to be lower in the AAC wall model. Based on this, it can be said that AAC shows better results than the curtain wall model. Considering the orientations of the faculty, curtain walls can be used in hot regions (south façade) and AAC walls can be used in both hot (south) and cold regions (north façade).
In the study, analyses were conducted on the education building in the cold climate region. However, when compared to the hot climate region, insulation and door–window opening rates on the façade and interior, transparent-opaque surfaces and thermal transmittance could differ. However, heating–cooling systems, plumbing solutions, and annual energy consumption values will also vary [
47,
48,
49]. Since the U-value standards of the building envelope in cold climate regions differ from the values in hot climate regions, the wall, floor, and ceiling layers and thicknesses will also differ from each other.
6. Conclusions
In this study, evaluations were made by performing a situation analysis of Atatürk University Faculty of Architecture and Design in Erzurum, which is located in the cold climate region and one of the coldest provinces of Türkiye. Then, evaluations were made by thermal analysis of two different façade designs in the faculty. Observations were made in February using the infrared thermography technique with a Testo 872 thermal camera. To make an effective assessment of the cold climate region, the analysis was conducted in the winter. Due to the temperature difference between day and night in Erzurum, measurements were made at noon. There is a research gap in building envelope design in changing climate conditions and cold climate regions. There are very few literature studies on this topic in 2024 compared to other years. Based on the studies in the literature, the number of studies using infrared thermography and thermal simulation together is also limited. As climate zones gain more importance, building envelopes are also updated in direct proportion. For this reason, this study aims to fill the research gap in the literature and be a reference for future studies. In the context of building envelopes, educational buildings have an important position in the world.
The effect of the external climate on the internal climate of a building depends on the characteristics of the building through which heat conduction is achieved, such as insulation, thermal mass, and window area resulting from the architectural design. As a result of the analysis made in interior spaces, when looking at glass surfaces, the education area with the lowest thermal comfort is studios. Arrangements should be made for architectural design that will increase thermal efficiency in studios. In this context, high thermal capacity glass applications can be made to achieve better heat insulation on glass surfaces. In addition, the comfort level can be increased by making improvements in the equipment of the heat source. When looking at the external wall temperatures, it was determined that the D-101 studio (ground floor) had the lowest value. In order to improve the thermal efficiency of the studio, additional insulation can be made by examining the insulation application on the external wall. Looking at the interior wall temperatures, it was observed that the E-102 studio (ground floor) was low. Insulation application on the interior walls of the studio should be reviewed. According to the temperatures of the slabs, G-AE2 entrance showed the worst performance. The granite application used in the flooring can be inspected and, if necessary, removed and a new heat-sensitive coating material can be considered. Alternatively, it may be preferable to use a wind curtain at this entrance. The space with the lowest thermal efficiency in terms of ceiling temperature is the E-102 studio on the ground floor. The problem should be resolved by looking at the suspended ceiling application of the studio. At this point, the suspended ceiling panels can be replaced. On the exterior façades, directly proportional and consistent results were obtained from the analyses according to the orientation of the building. On façades where thermal efficiency is desired to be increased, the window system can be reviewed, interior walls can be insulated, or insulated coating can be applied on exterior walls.
Based on the data obtained from the literature and the information obtained by infrared thermography, the building envelope is at an important point in thermal analysis. By analyzing two different façade designs in the building envelope, the design that can be used according to the orientation of the building was determined. In addition, the thermal efficiencies of two different façade configurations were calculated according to their U-values. It has been determined that the curtain wall design is suitable for the southern façades where the sun angle is vertical, and the AAC wall design is suitable for all façades of the faculty due to the low U-value.
To reduce natural convection heat transfer, a thin layer of low-emissivity material can be placed on the glass sheet. In this direction, a low-E coating applied to the glass surface will reduce heat loss by reflecting harmful ultraviolet and infrared rays from the sun. In addition, the U-value can be significantly reduced with double or triple glazing systems on glass façades. As another solution, filling argon or krypton gas between the glass blocks will also reduce heat transmission. In order to minimize the thermal conductivity of aluminum, it is necessary to improve the connection details in aluminum and glass joints and to use thermal break and multi-chamber aluminum profiles. As a result, within the scope of the study, a thermal efficiency analysis of an educational building located in a cold climate region was prepared, problem areas were identified, and solution suggestions to eliminate these problems were discussed.
While the current status of the building was tested experimentally with infrared thermography, the façade layouts were also examined with simulation. The fact that the façade layouts could not be tested experimentally constitutes the limitation of the study. As a continuation of the study, it is envisaged that the façade layouts will be manufactured and tested in the climate chamber. The infrared thermography and simulation method used can be applied to different building types, but it should be applied according to environmental boundary conditions. Accordingly, analysis outputs will differ in hot and cold climate regions. Considering Türkiye’s geographical location, preparing the ground for alternative energy sources by integrating the energy obtained from thermal comfort into multiple applications in different areas will provide significant gains for future studies.


