

Numerical Analysis on the Effect of Geometric Parameters of Reverse Fault on Tunnel Mechanical Response


Abstract
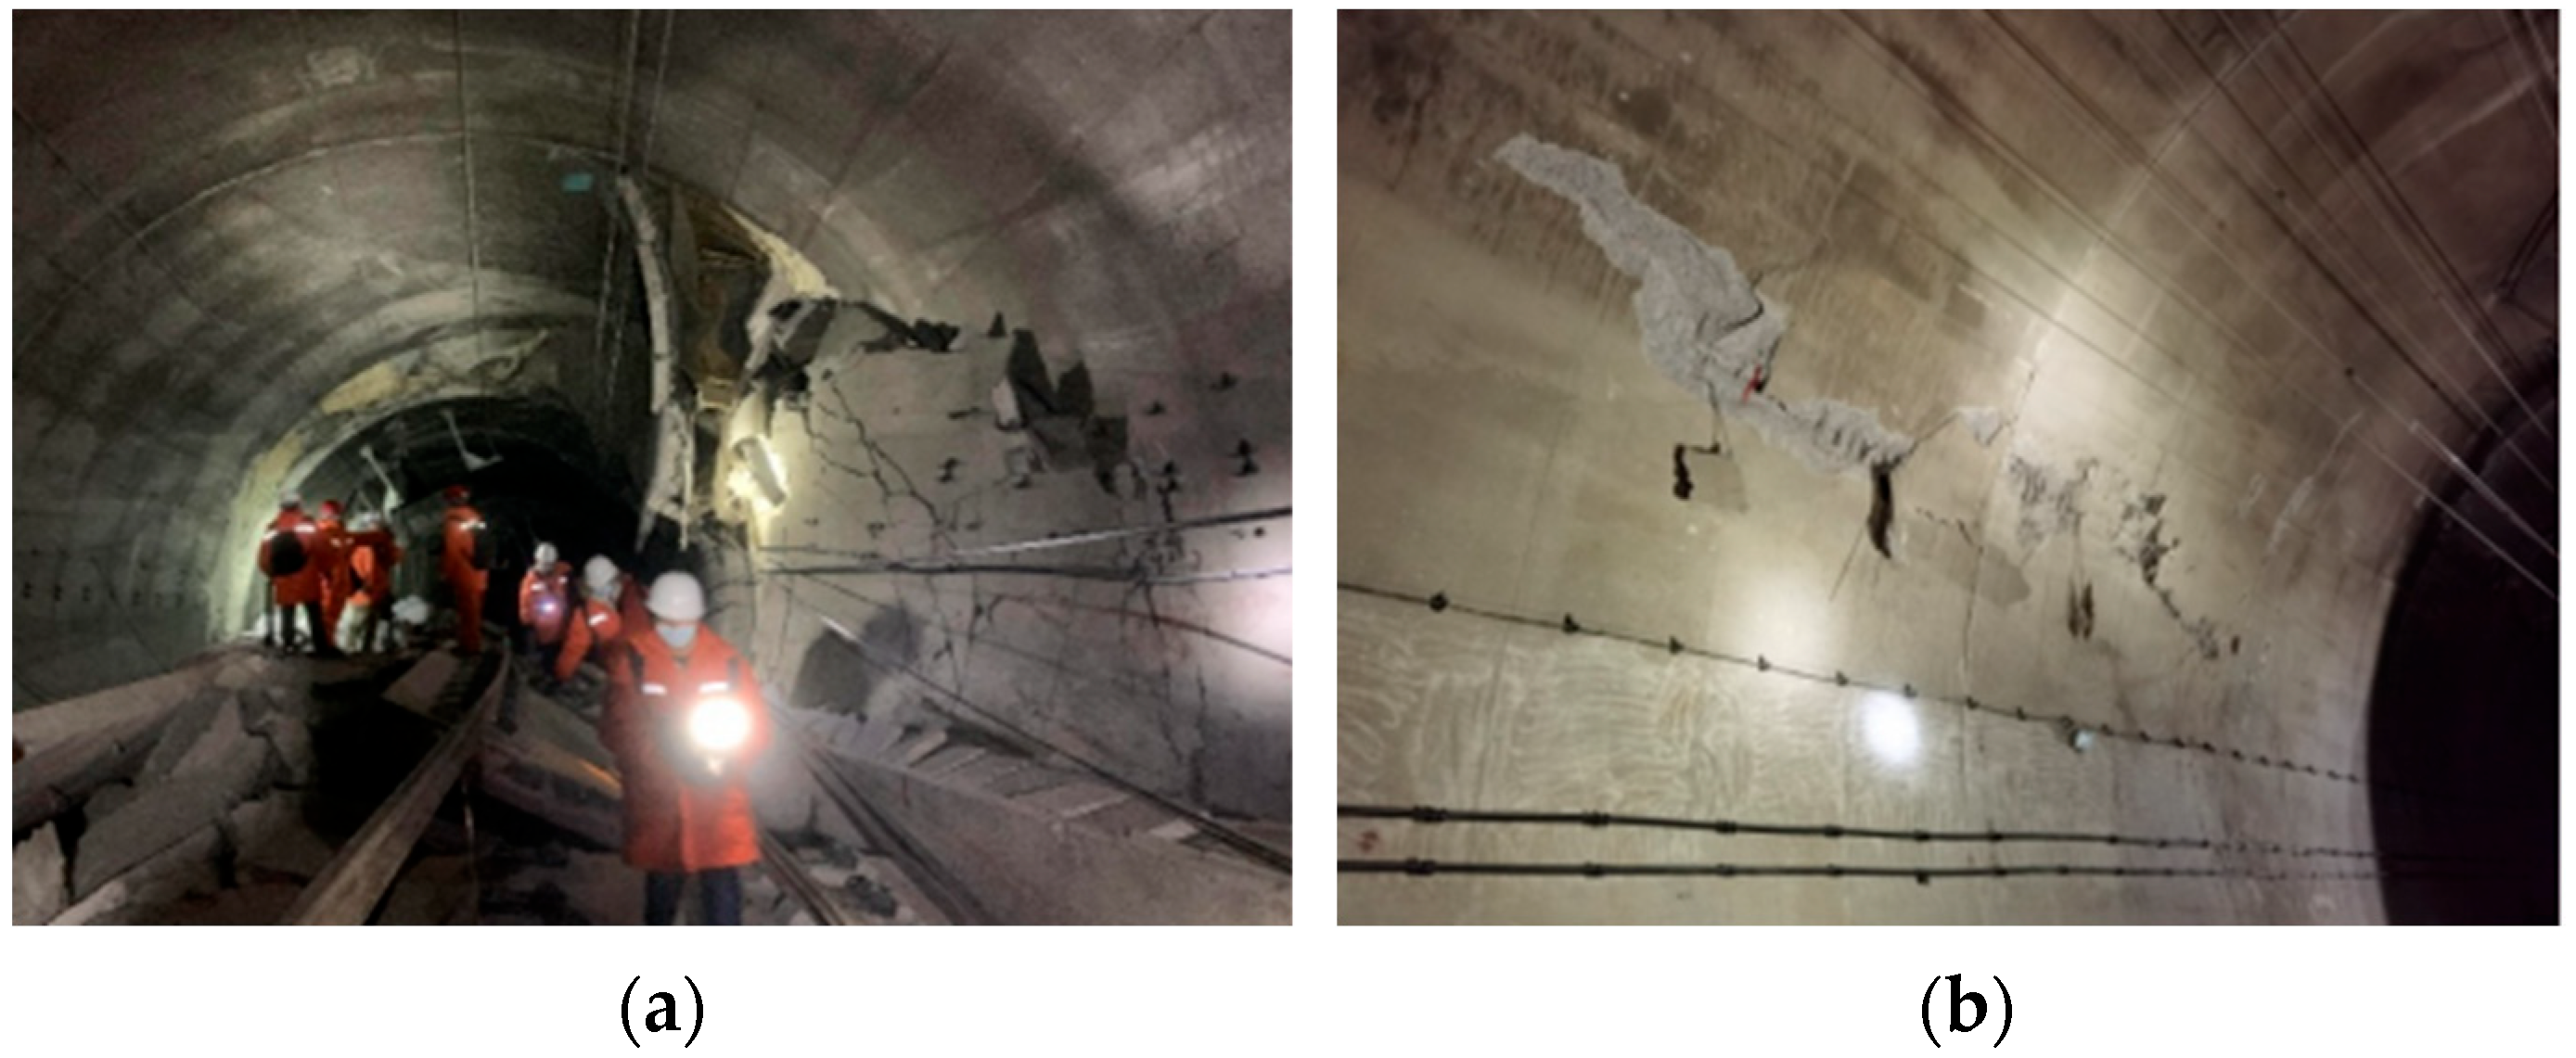
1. Introduction
2. Methodology
2.1. Numerical Modeling
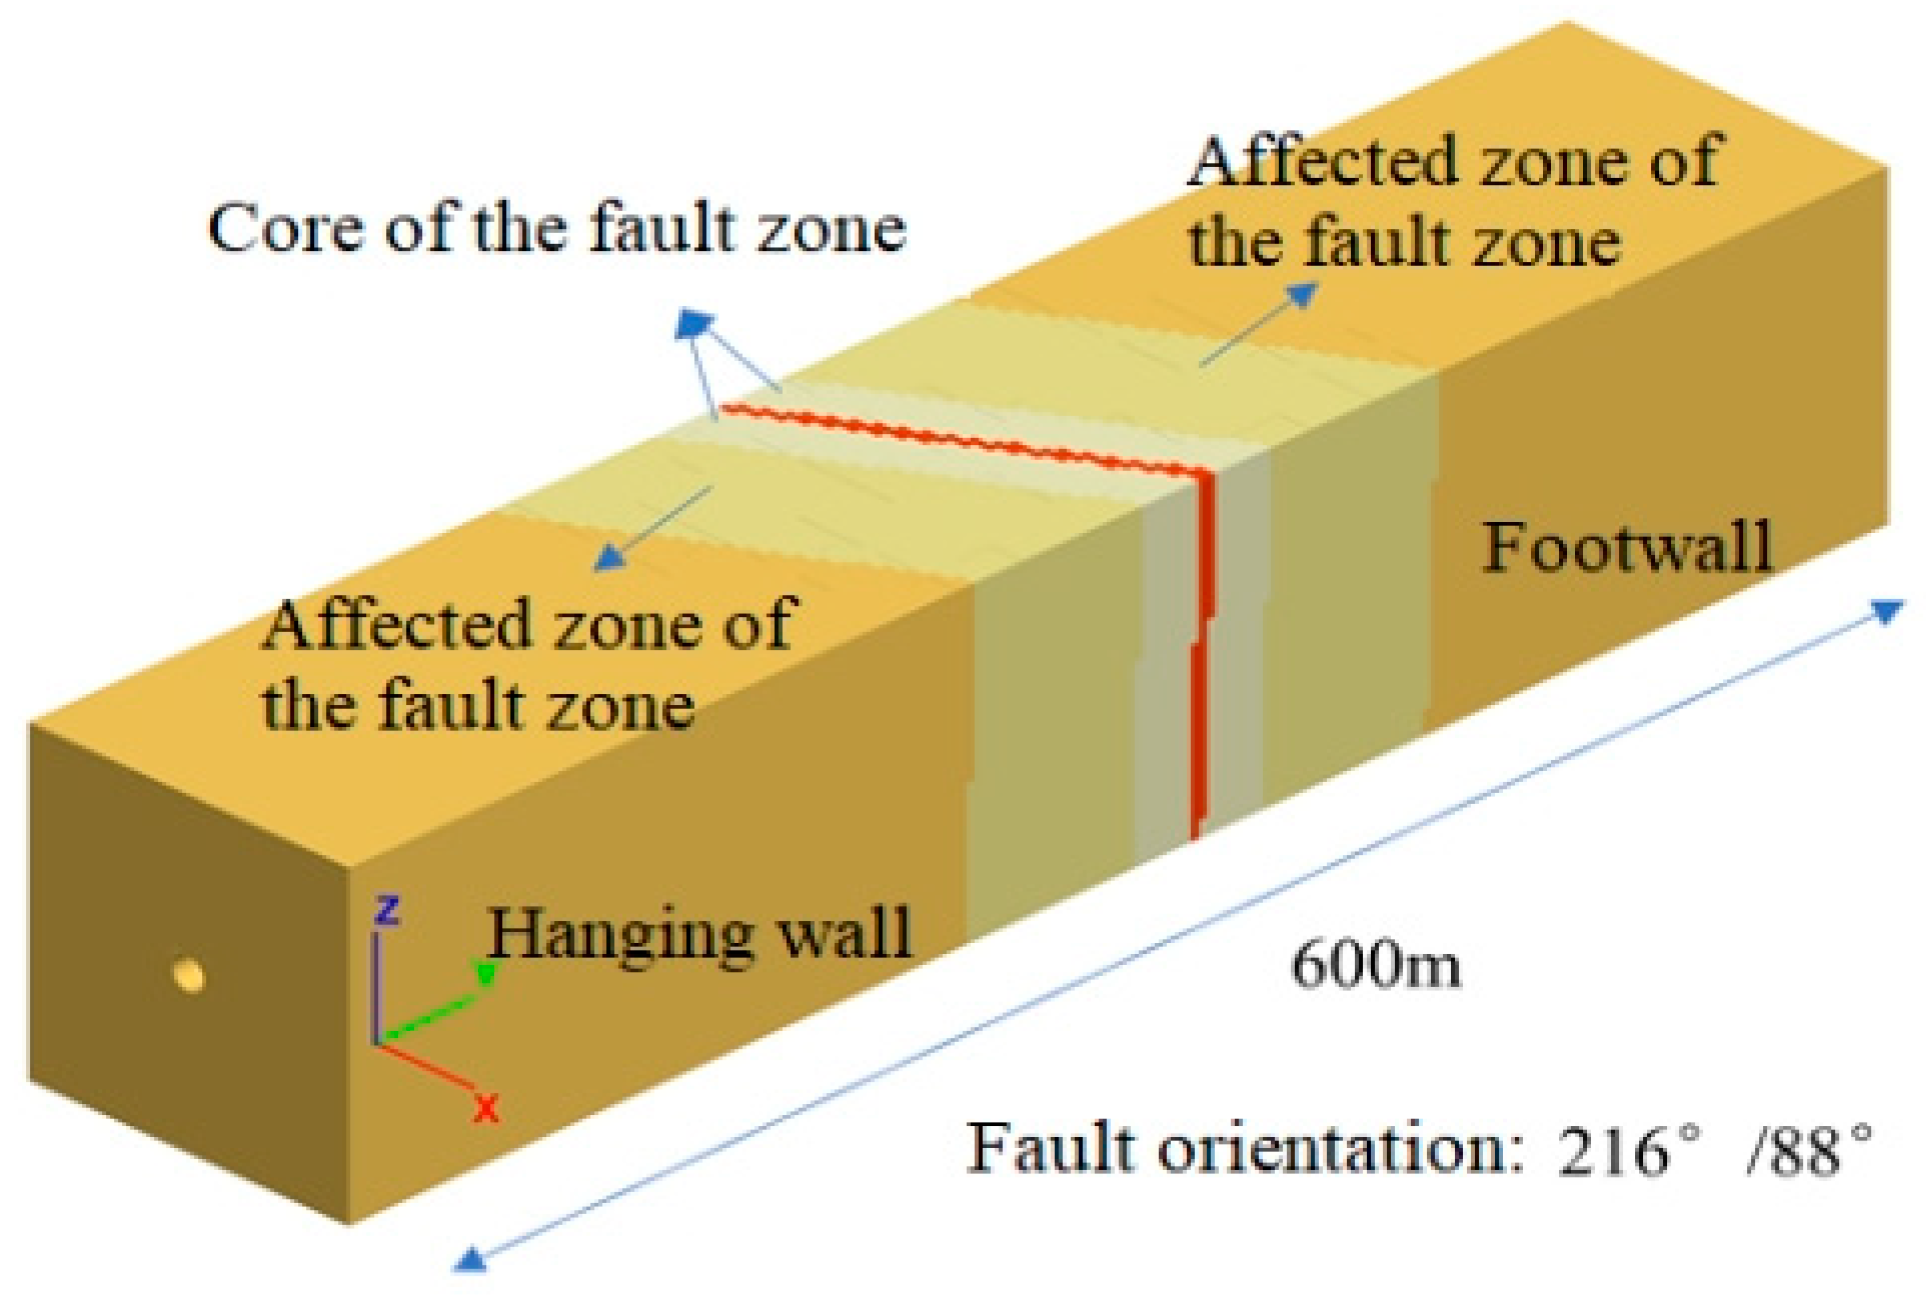
2.2. Characterization of Geometric Parameter Variation in Fault Zones
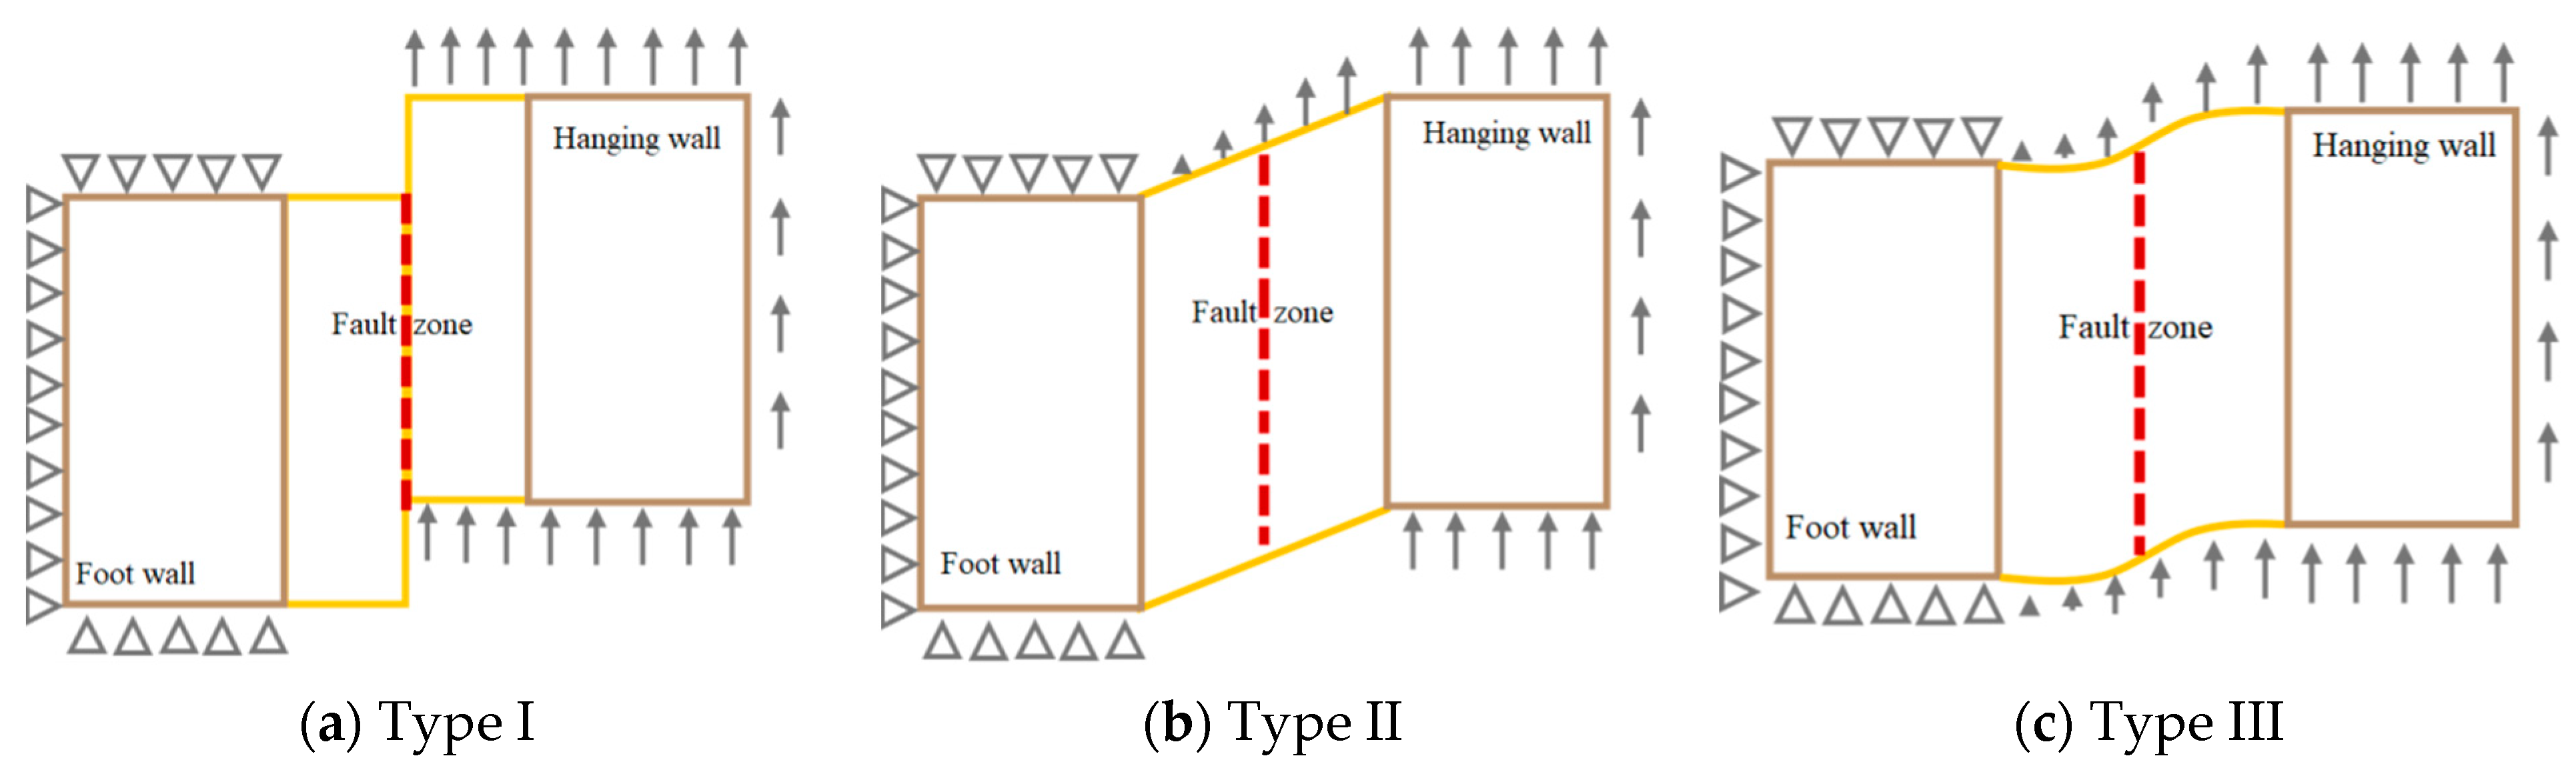
2.3. Boundary Condition
3. Impact Analysis of Deformation Patterns Caused by Reverse Fault Displacement
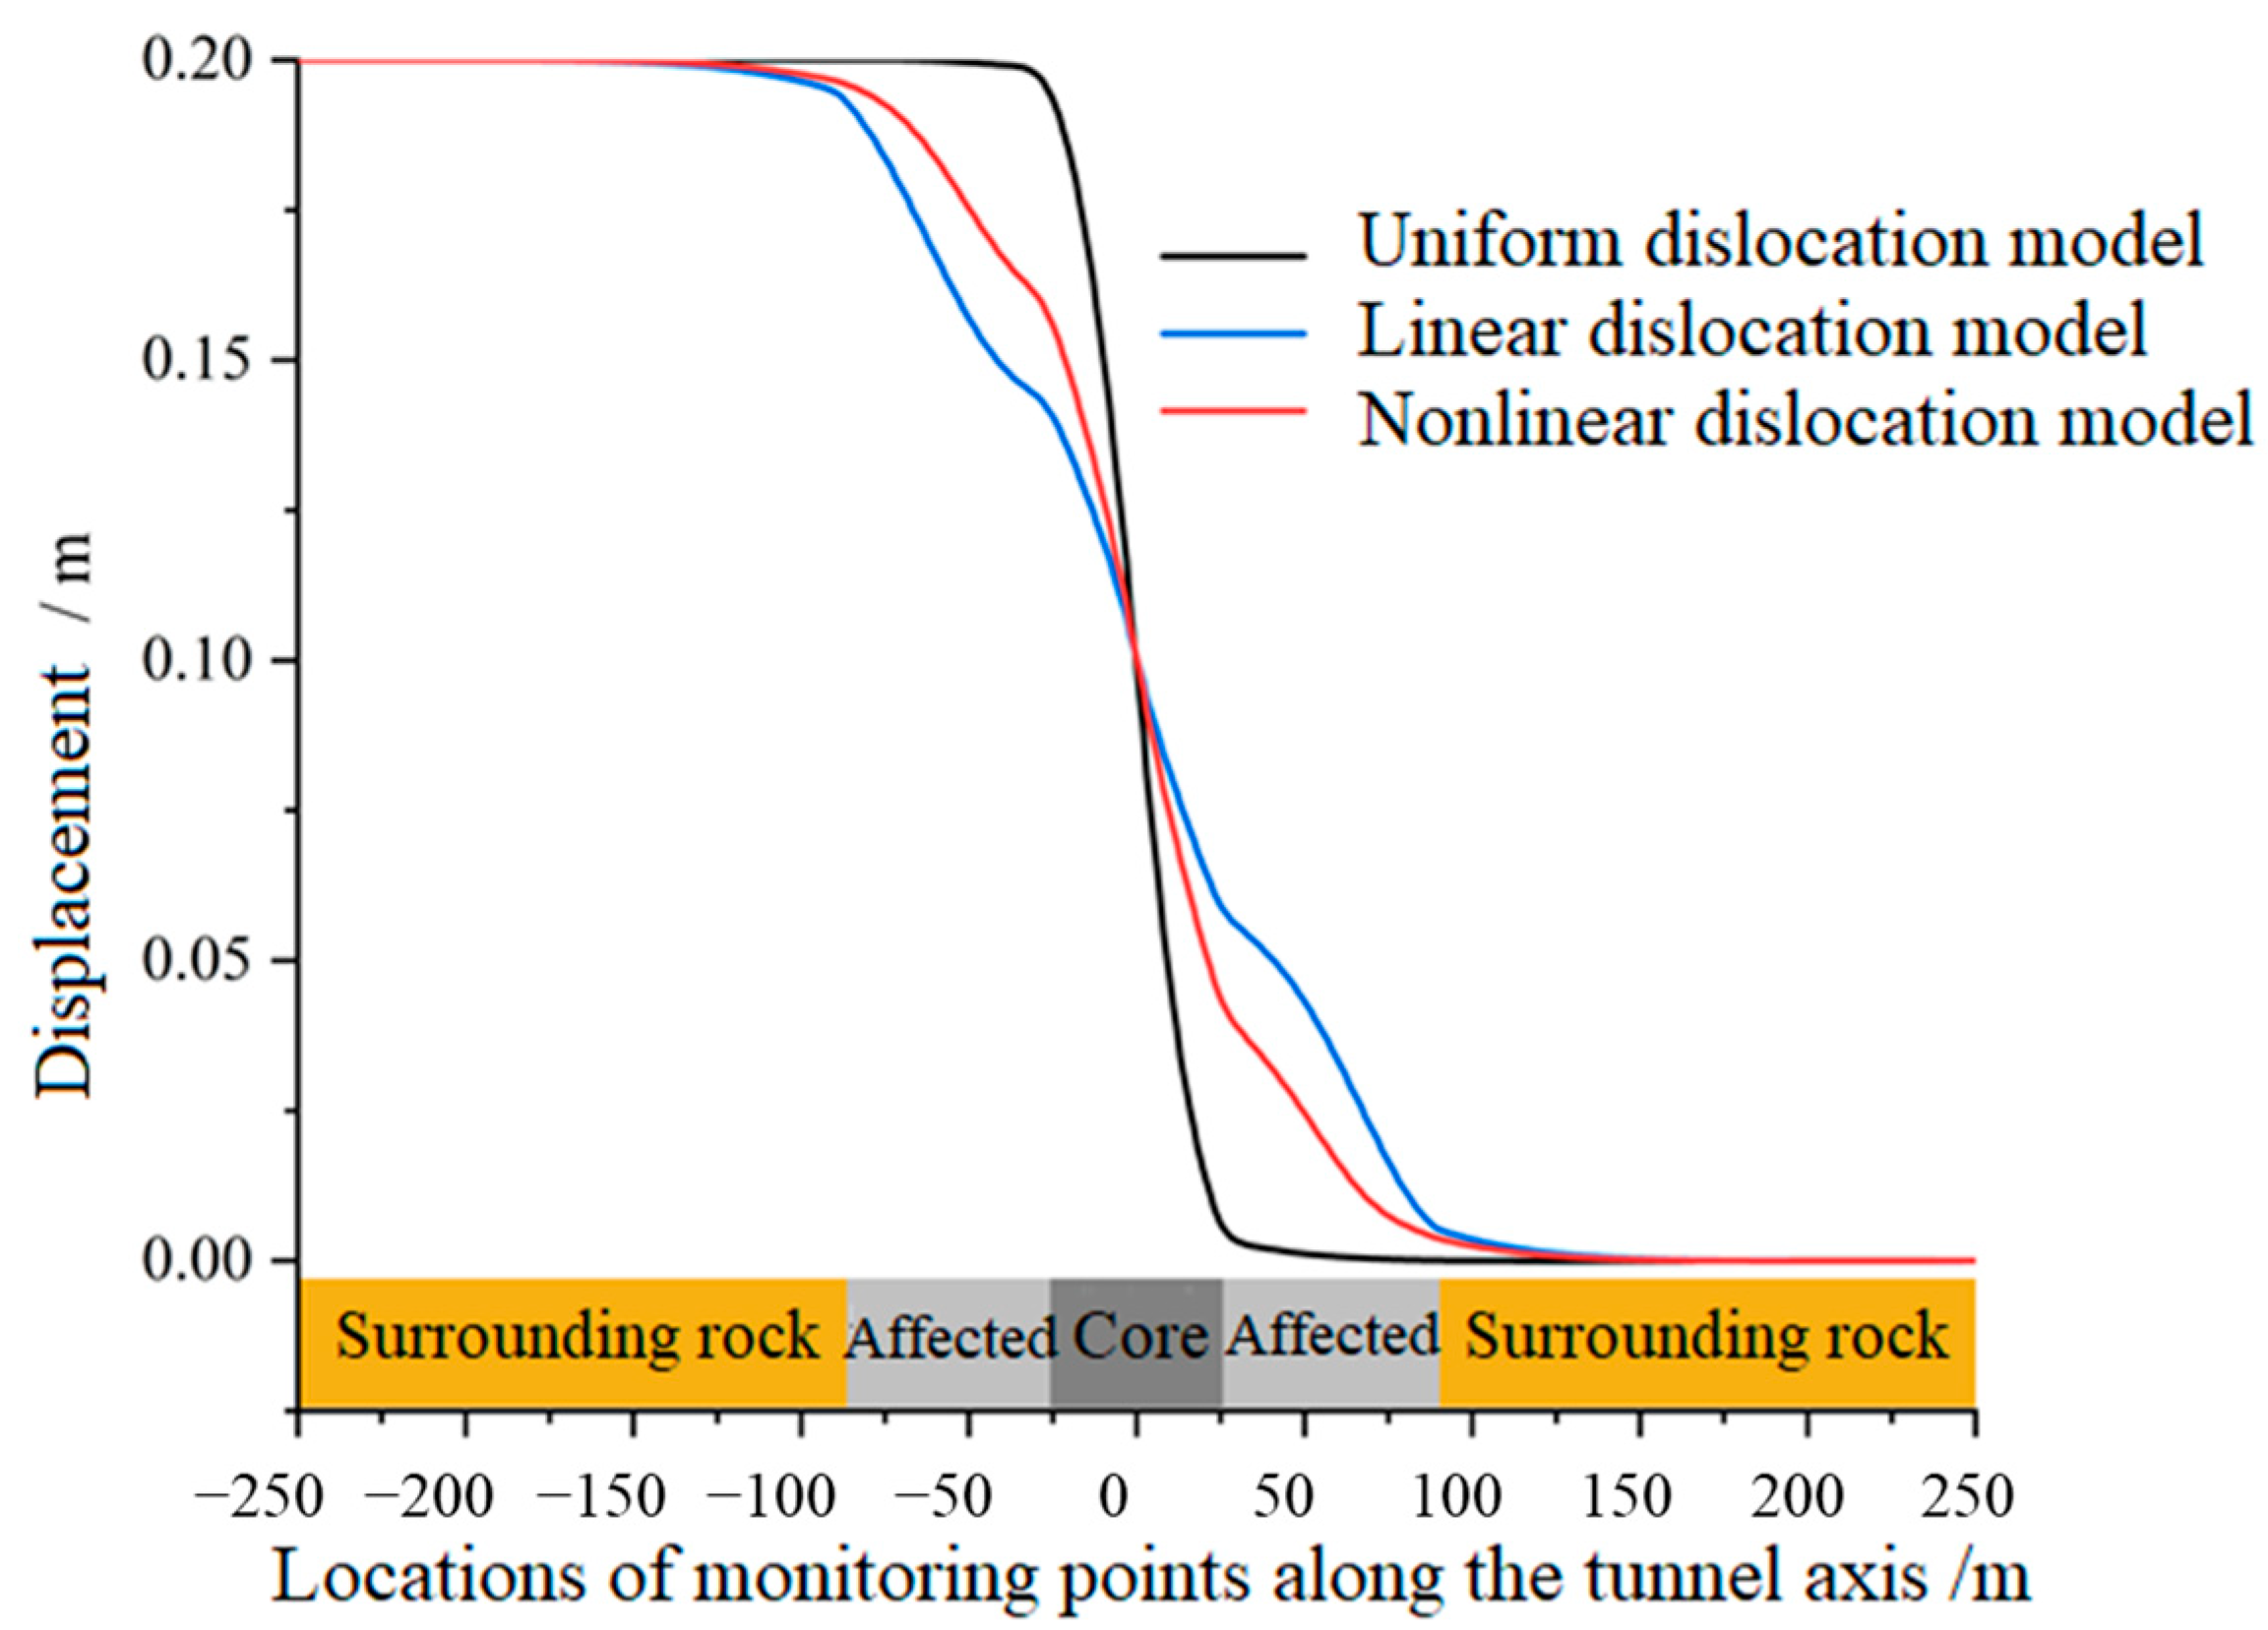
3.1. Lining Deformation Response
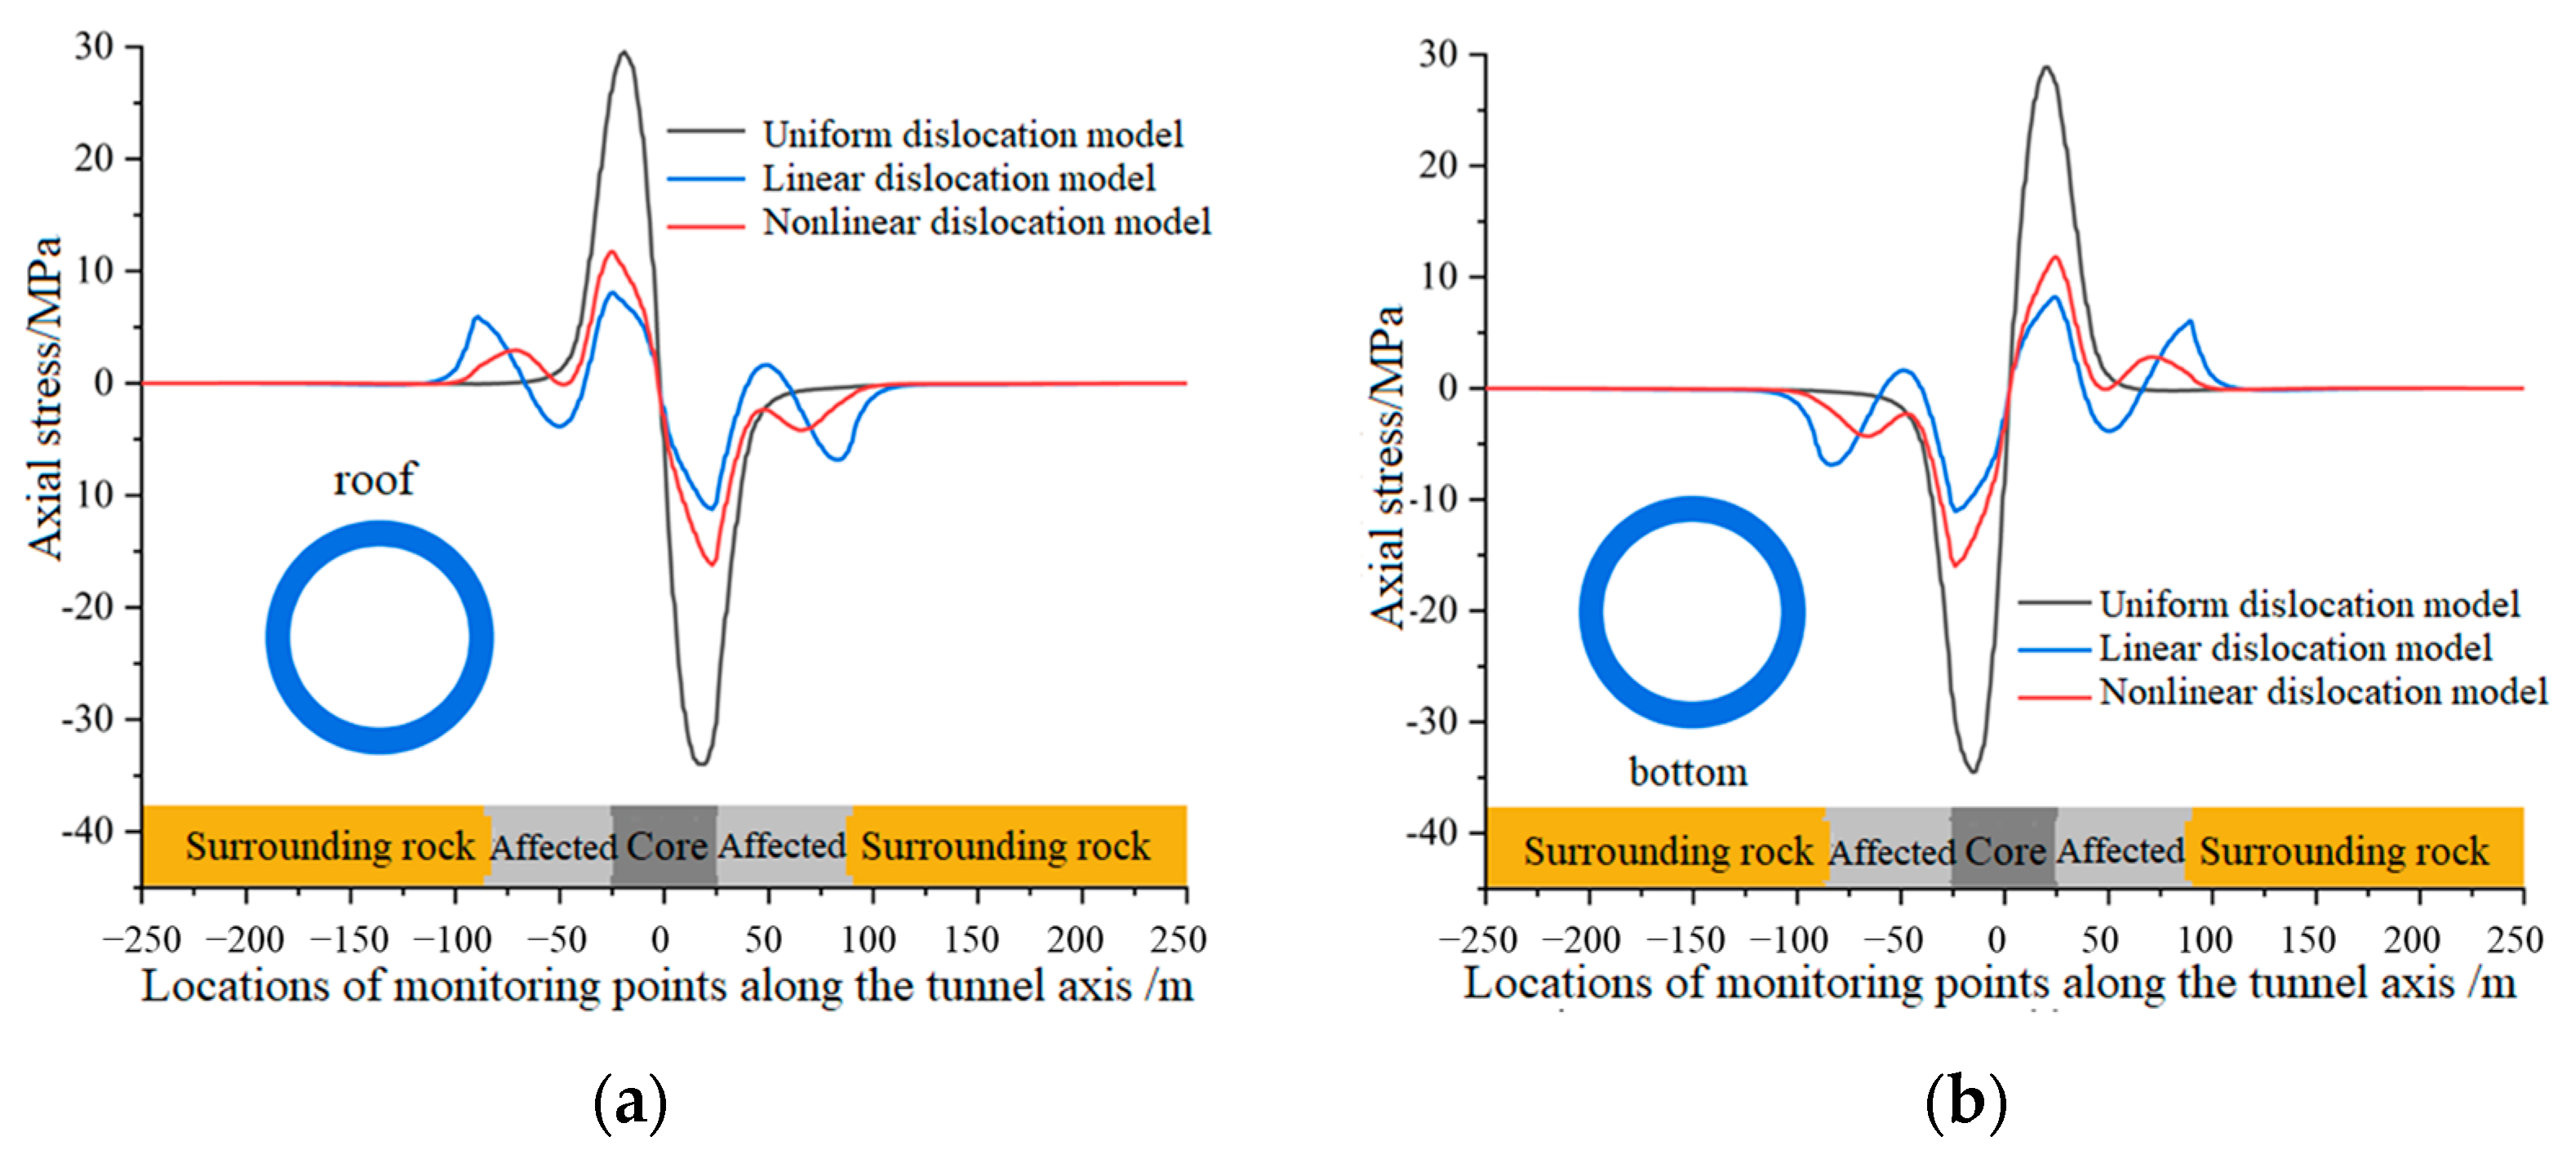
3.2. Axial Tensile and Compressive Stress Analysis of Lining
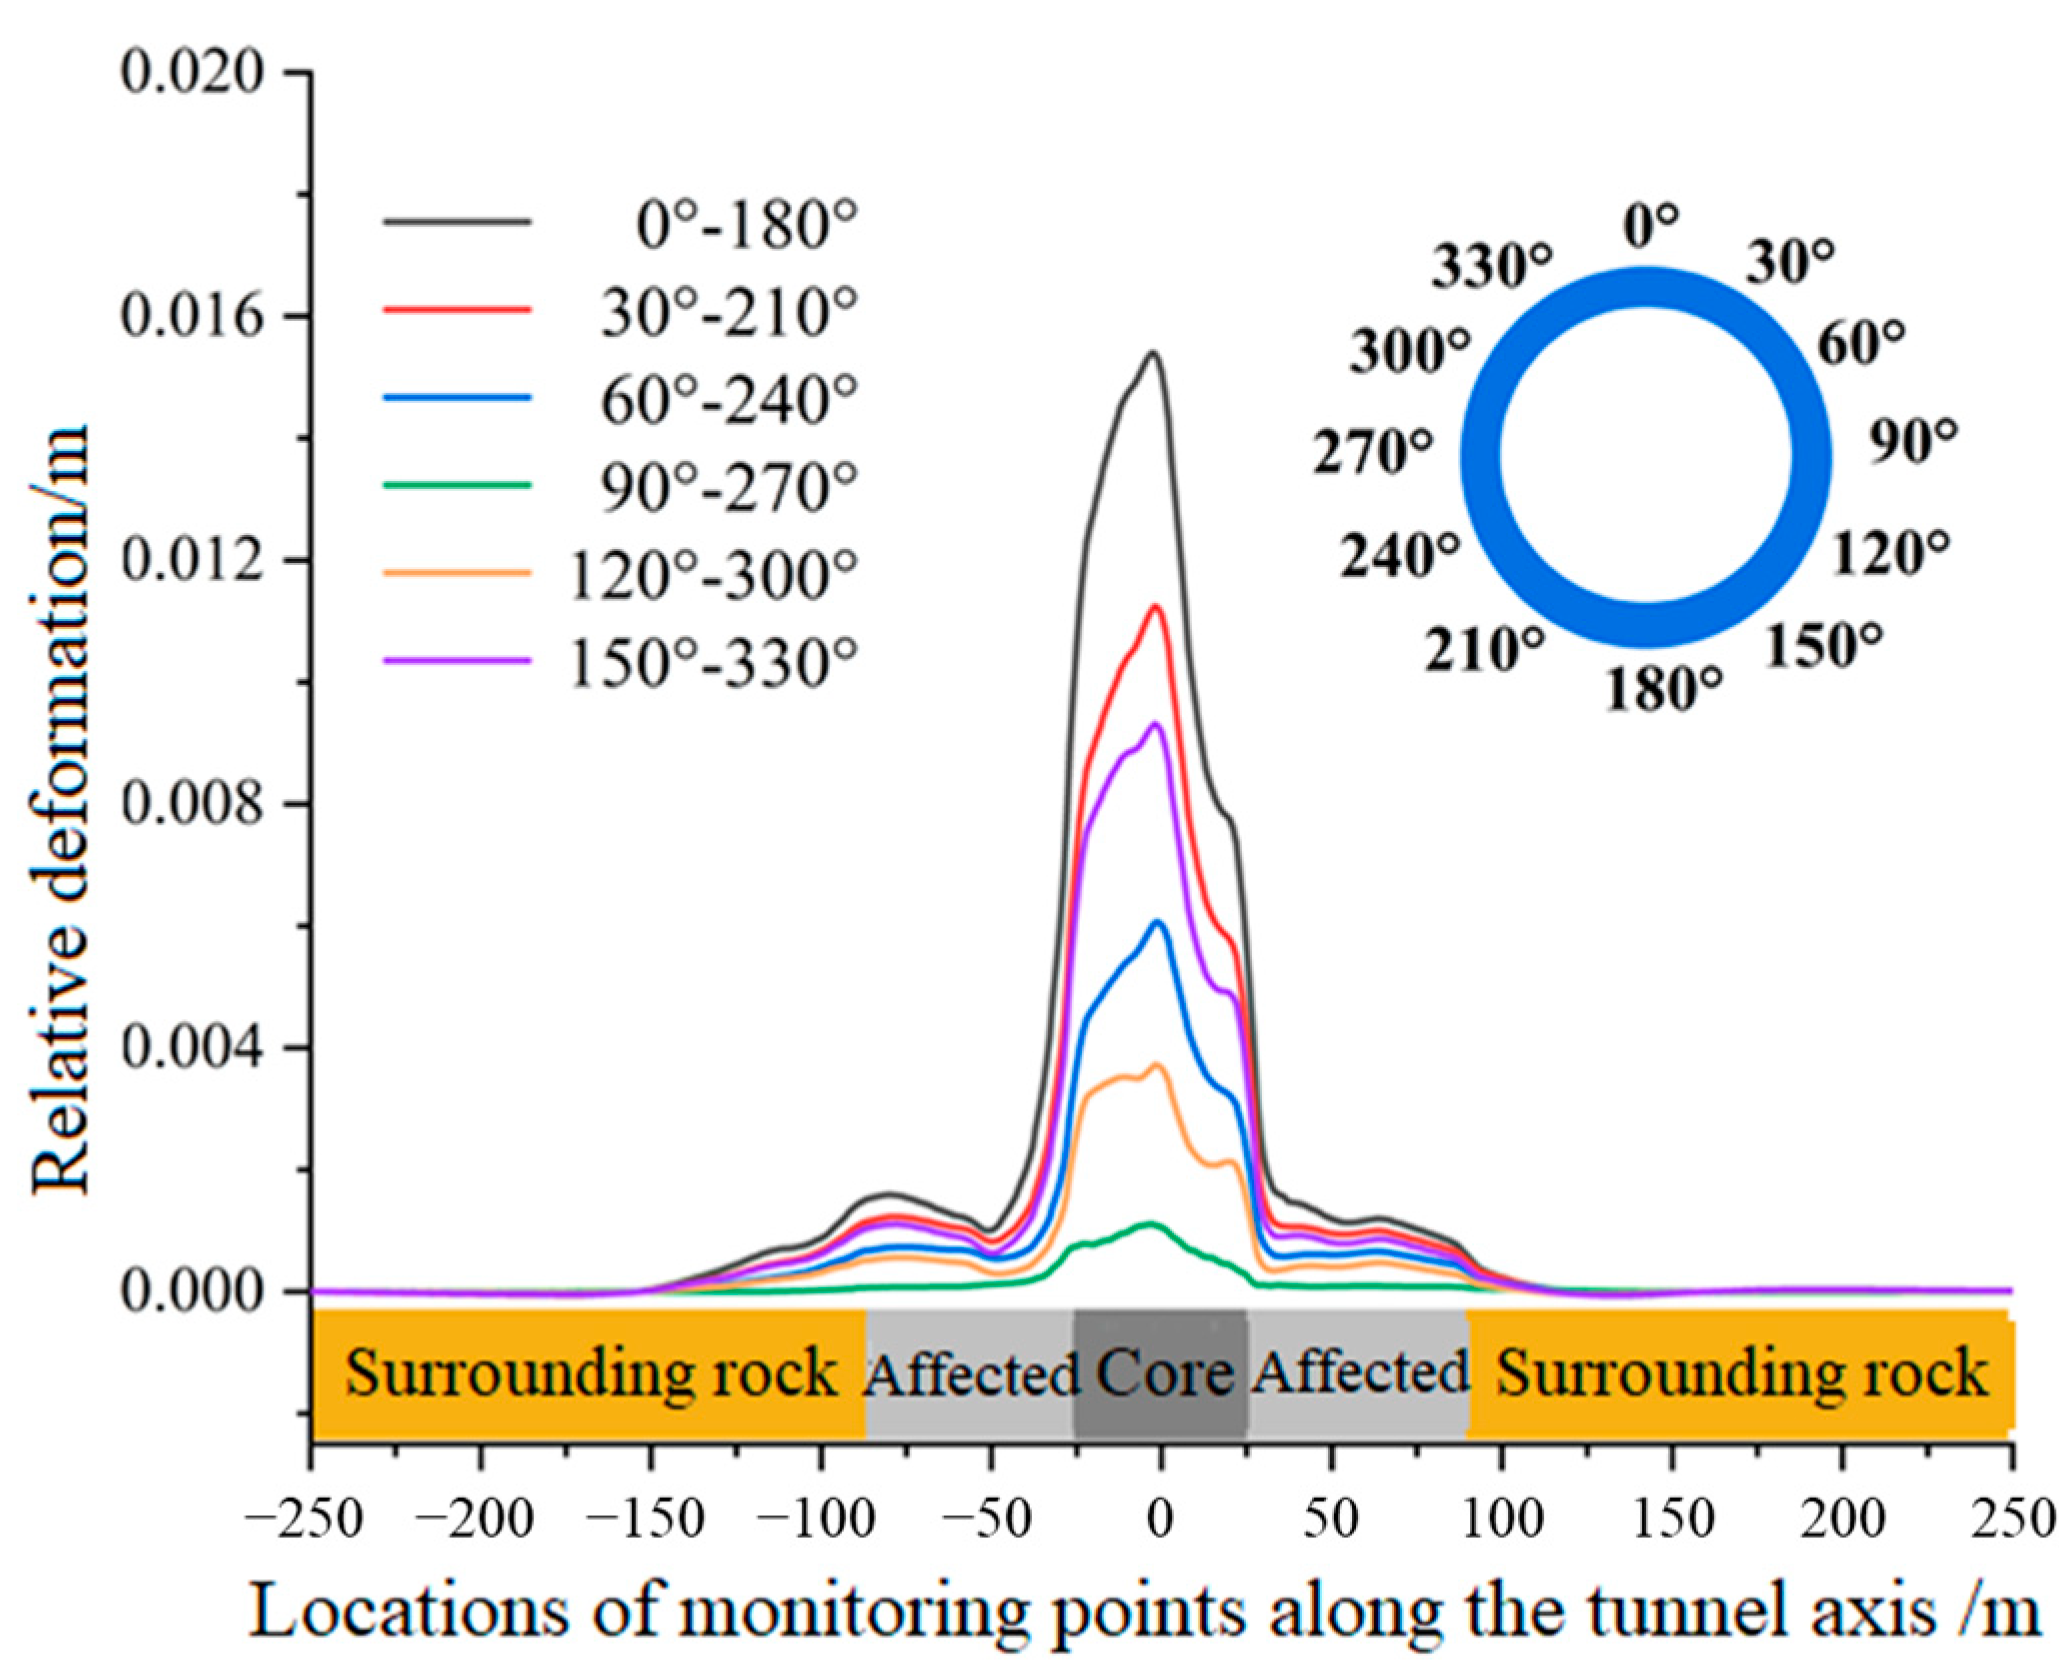
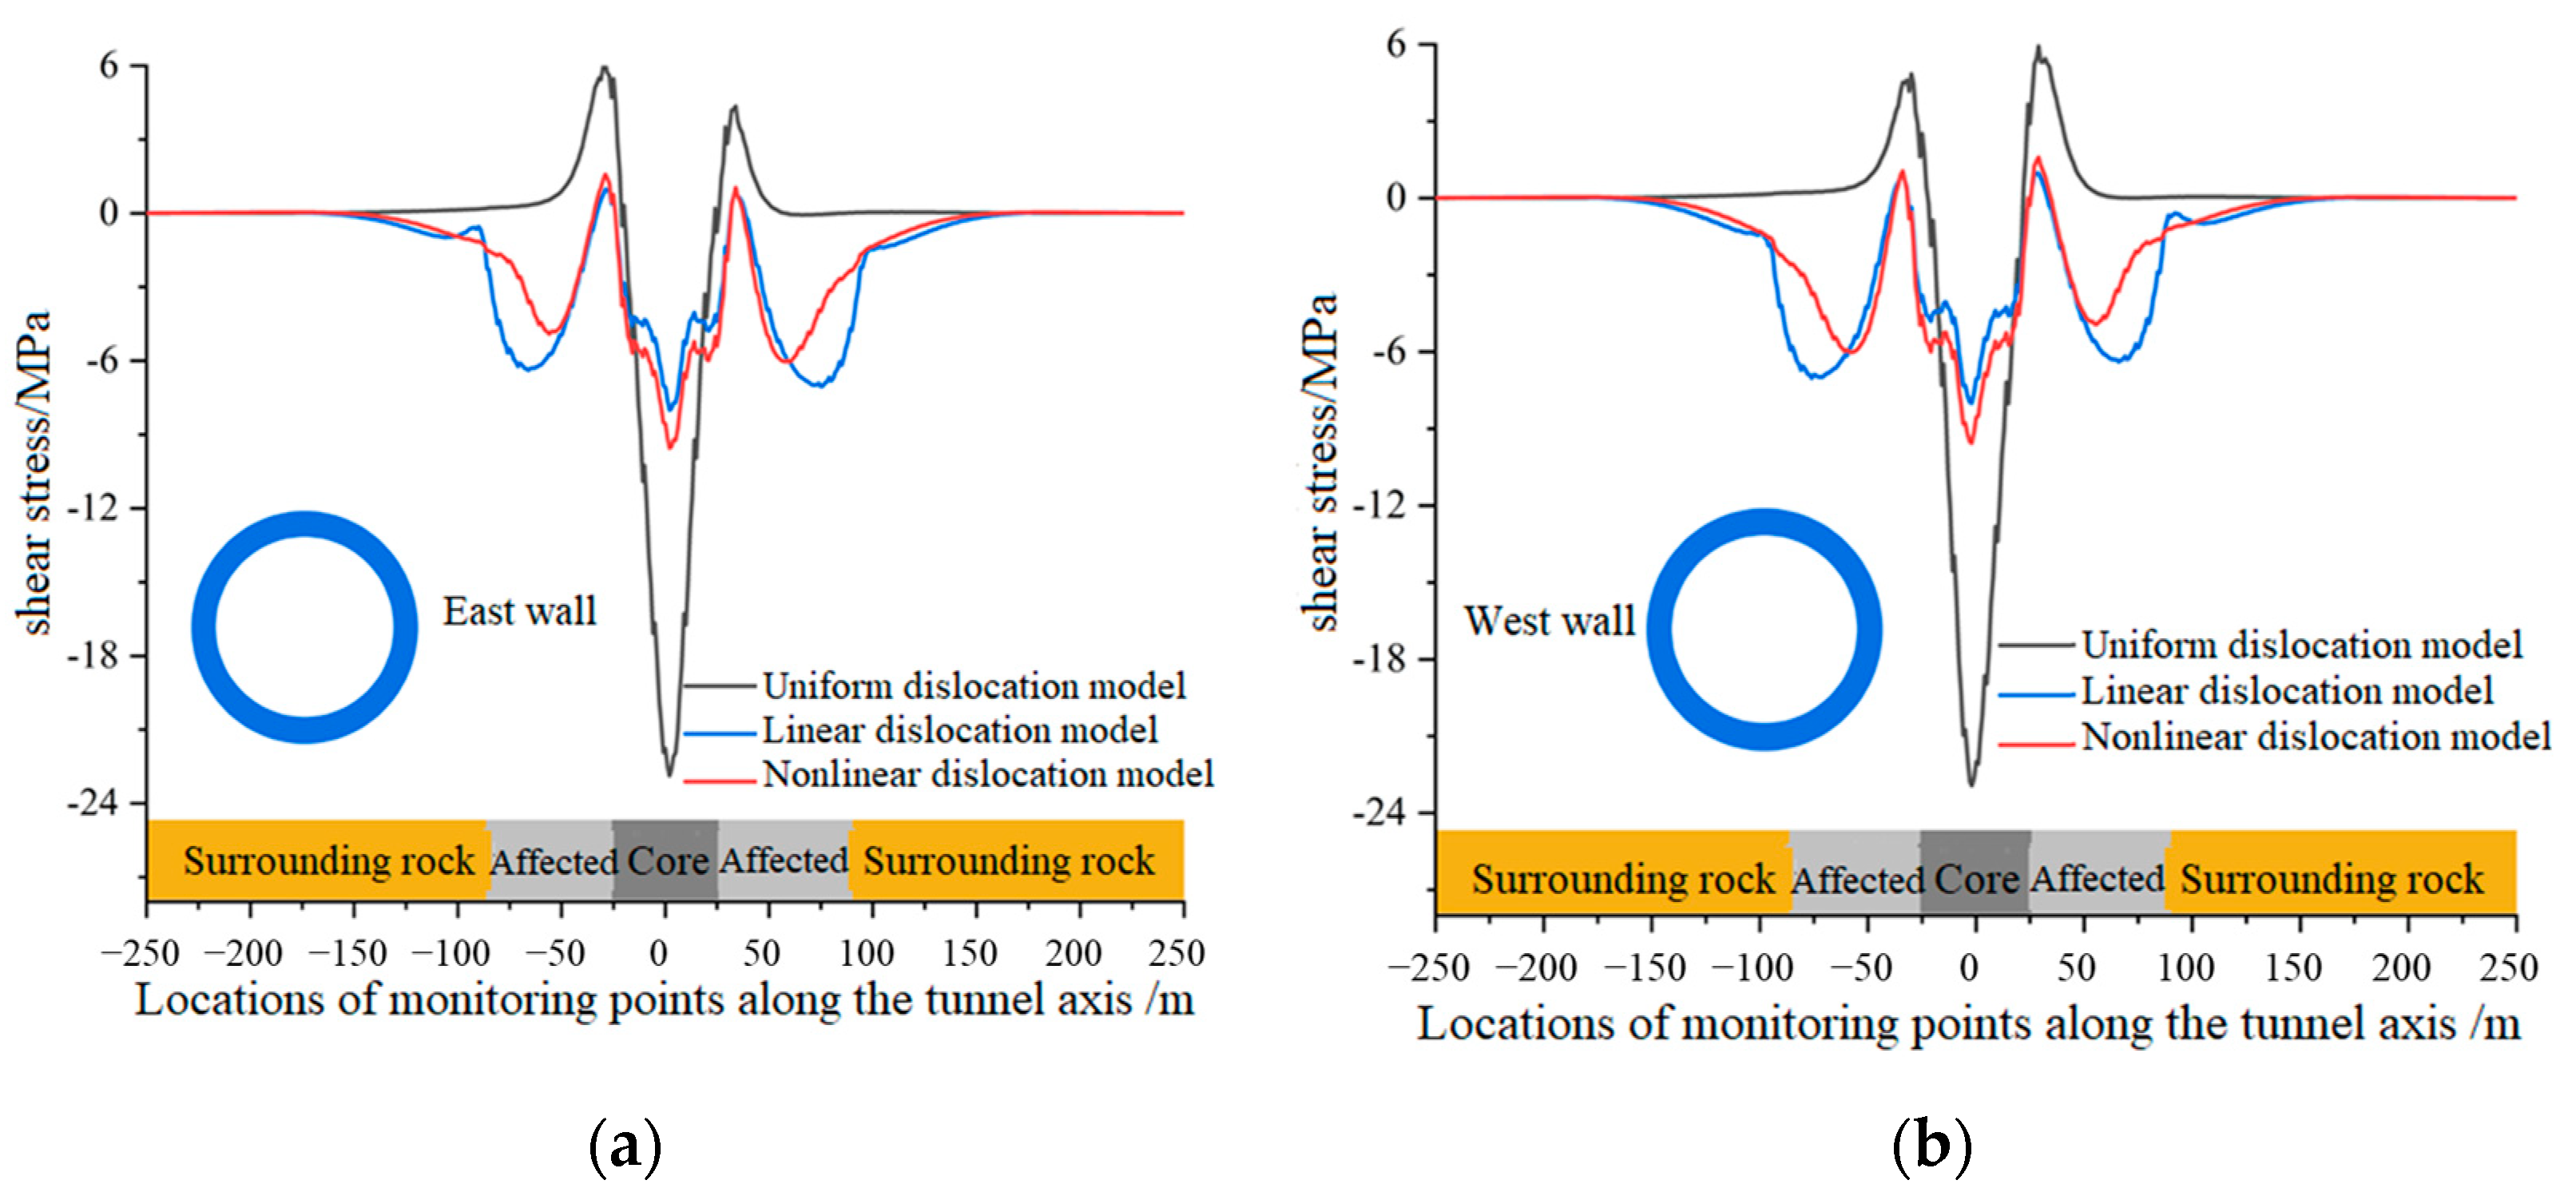
3.3. Analysis of Vertical Shear Stress of Lining
4. Fault Parameters Influence Analysis
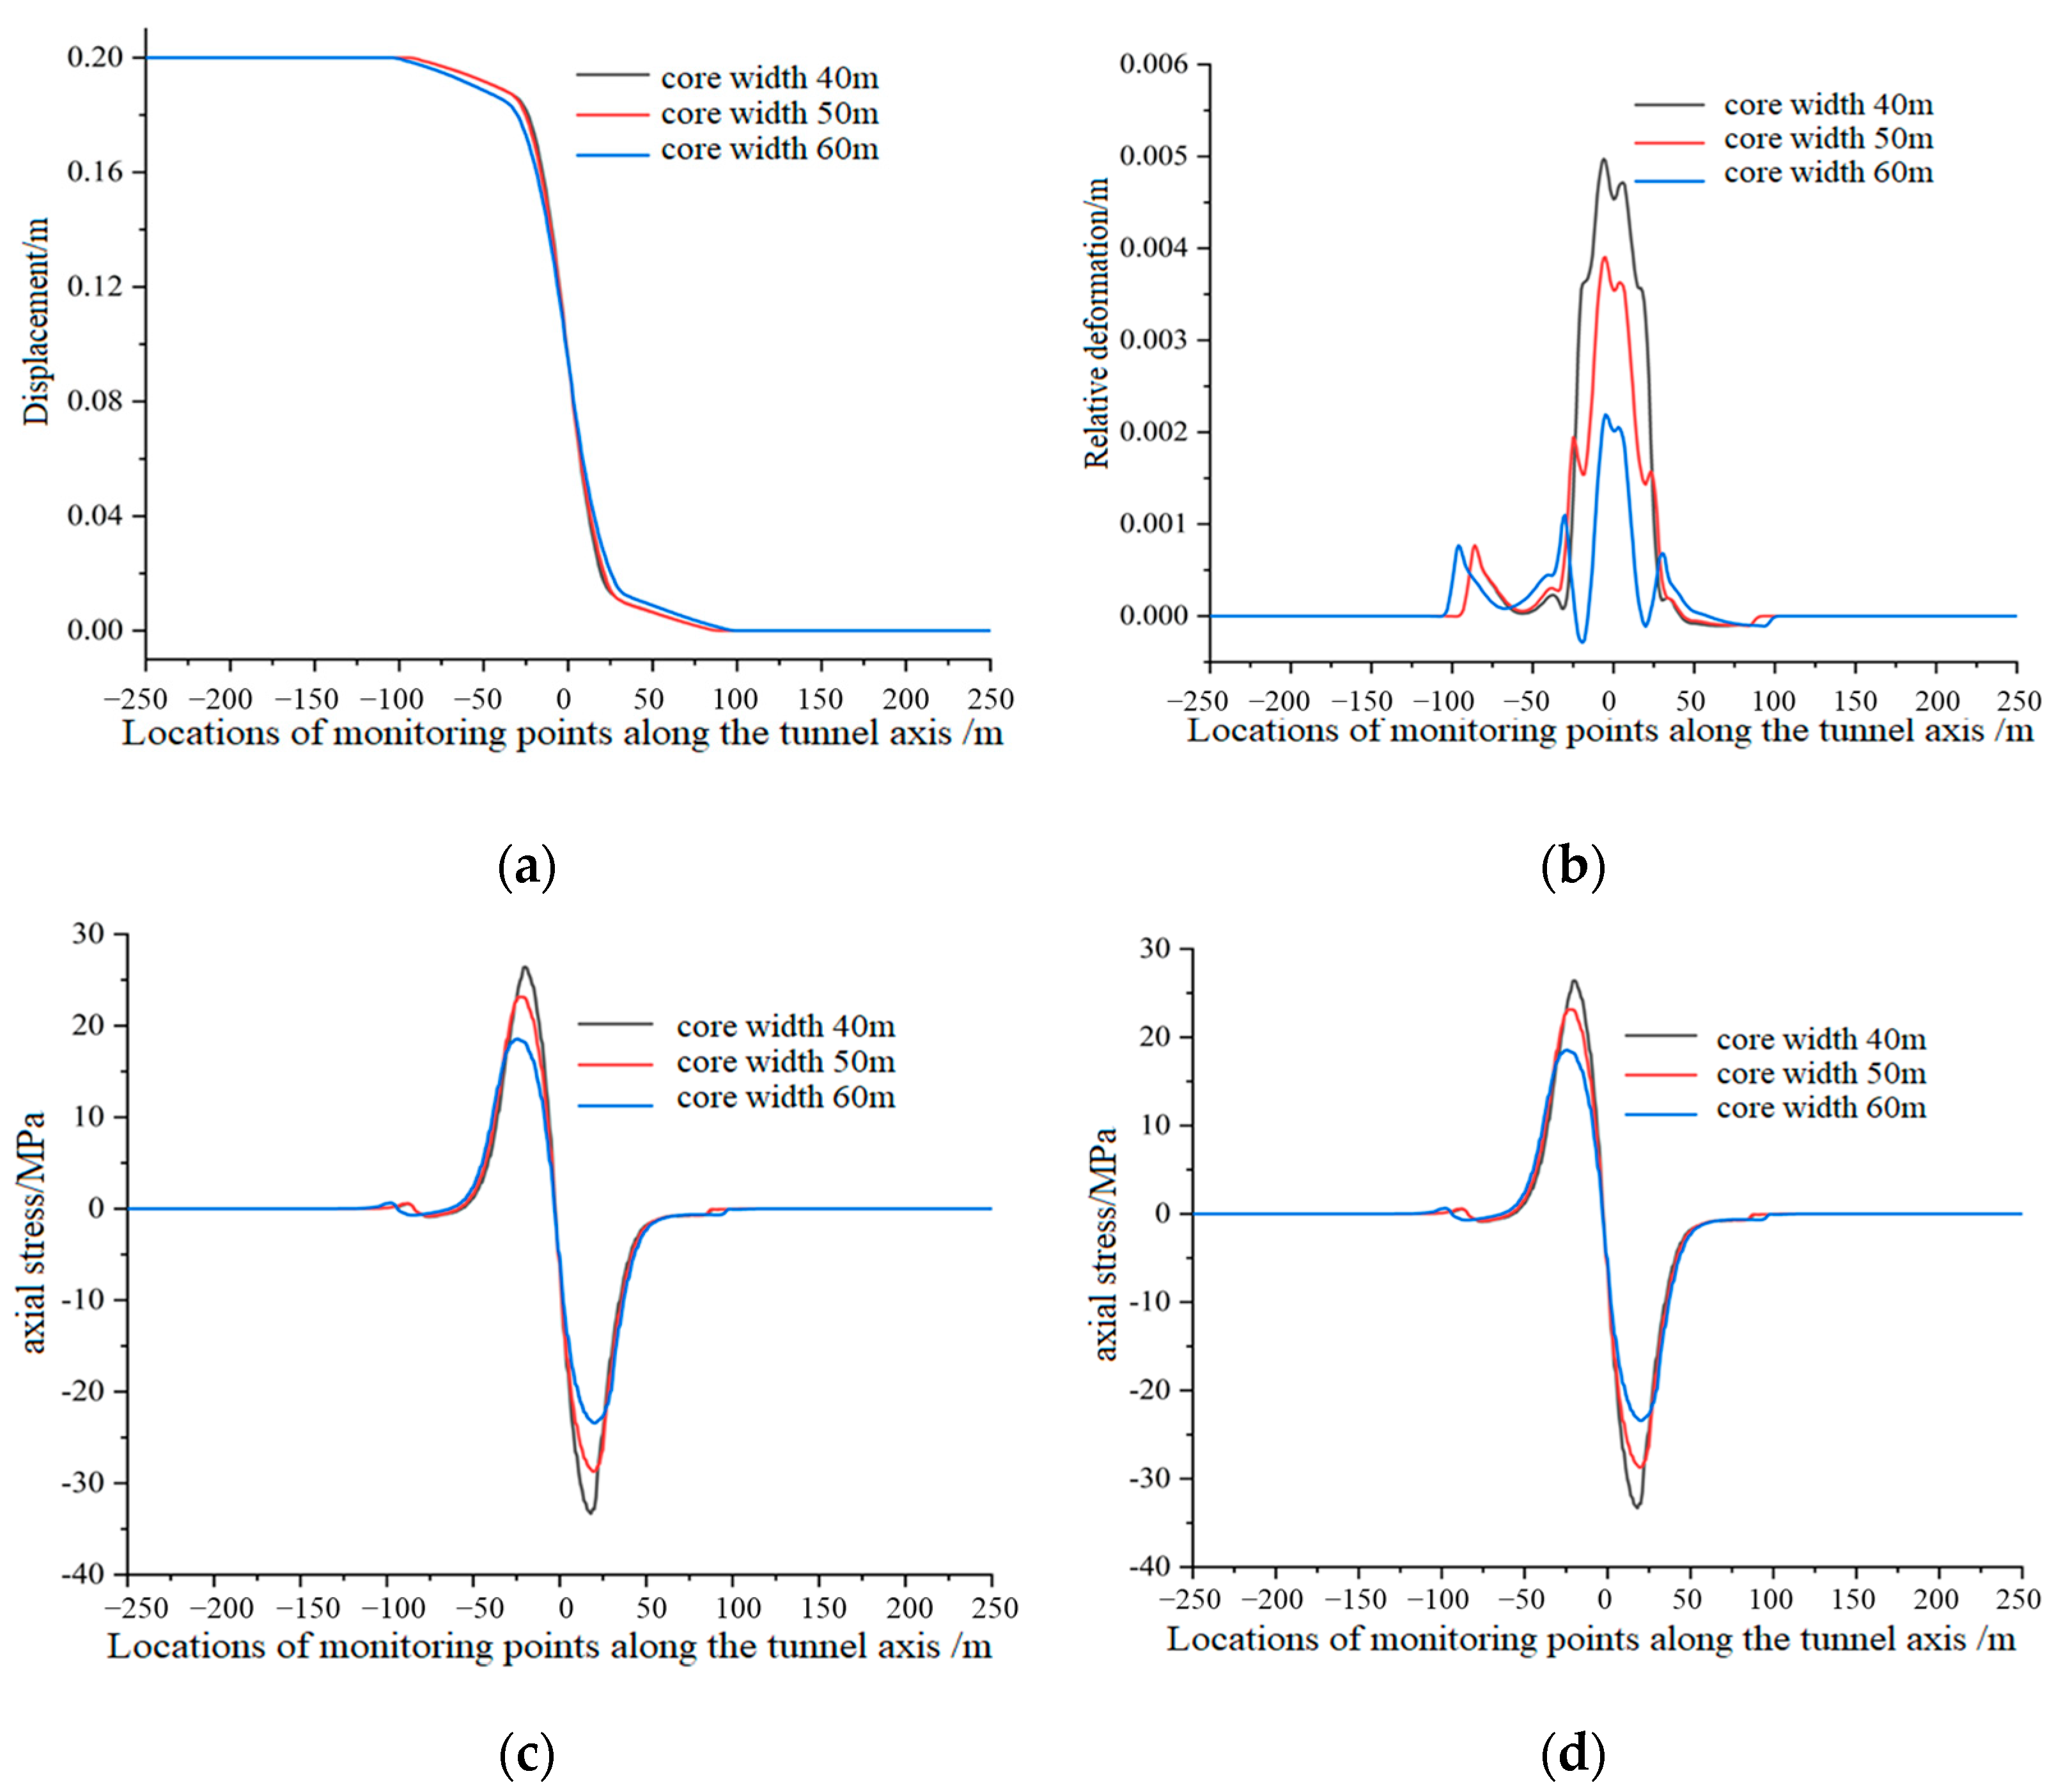
4.1. Fault Zone Core Width
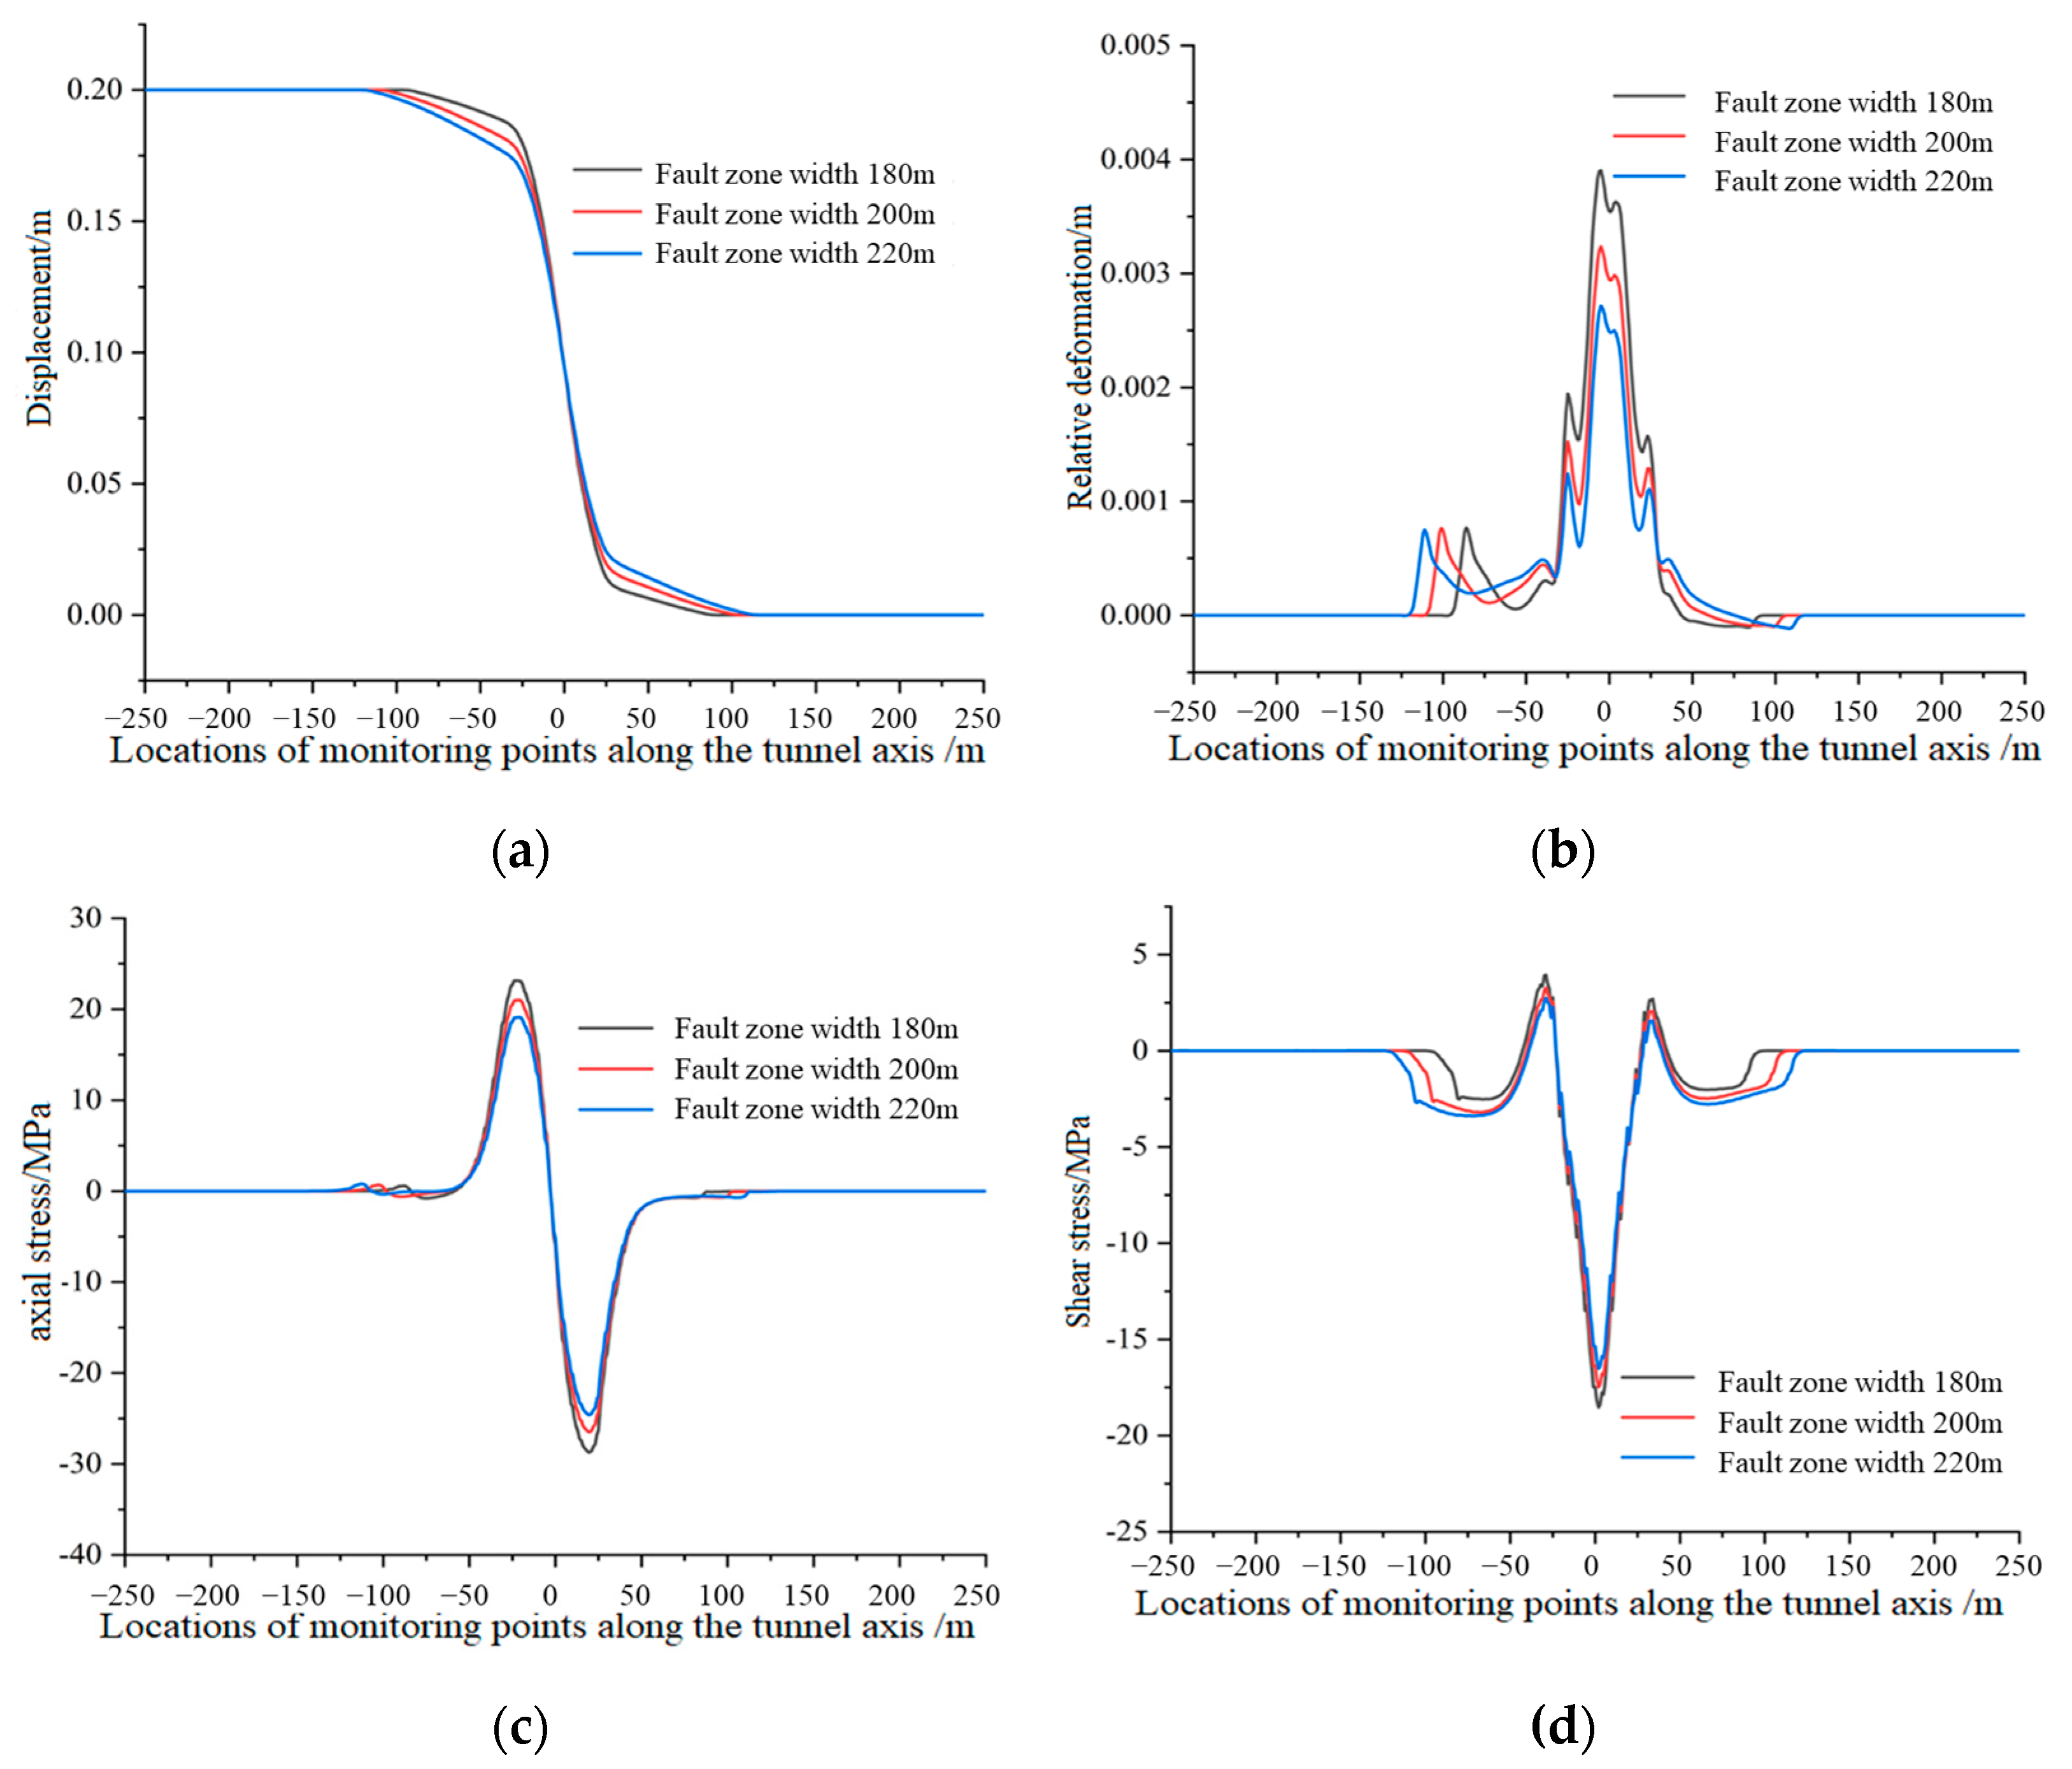
4.2. Total Width of Fault Zone
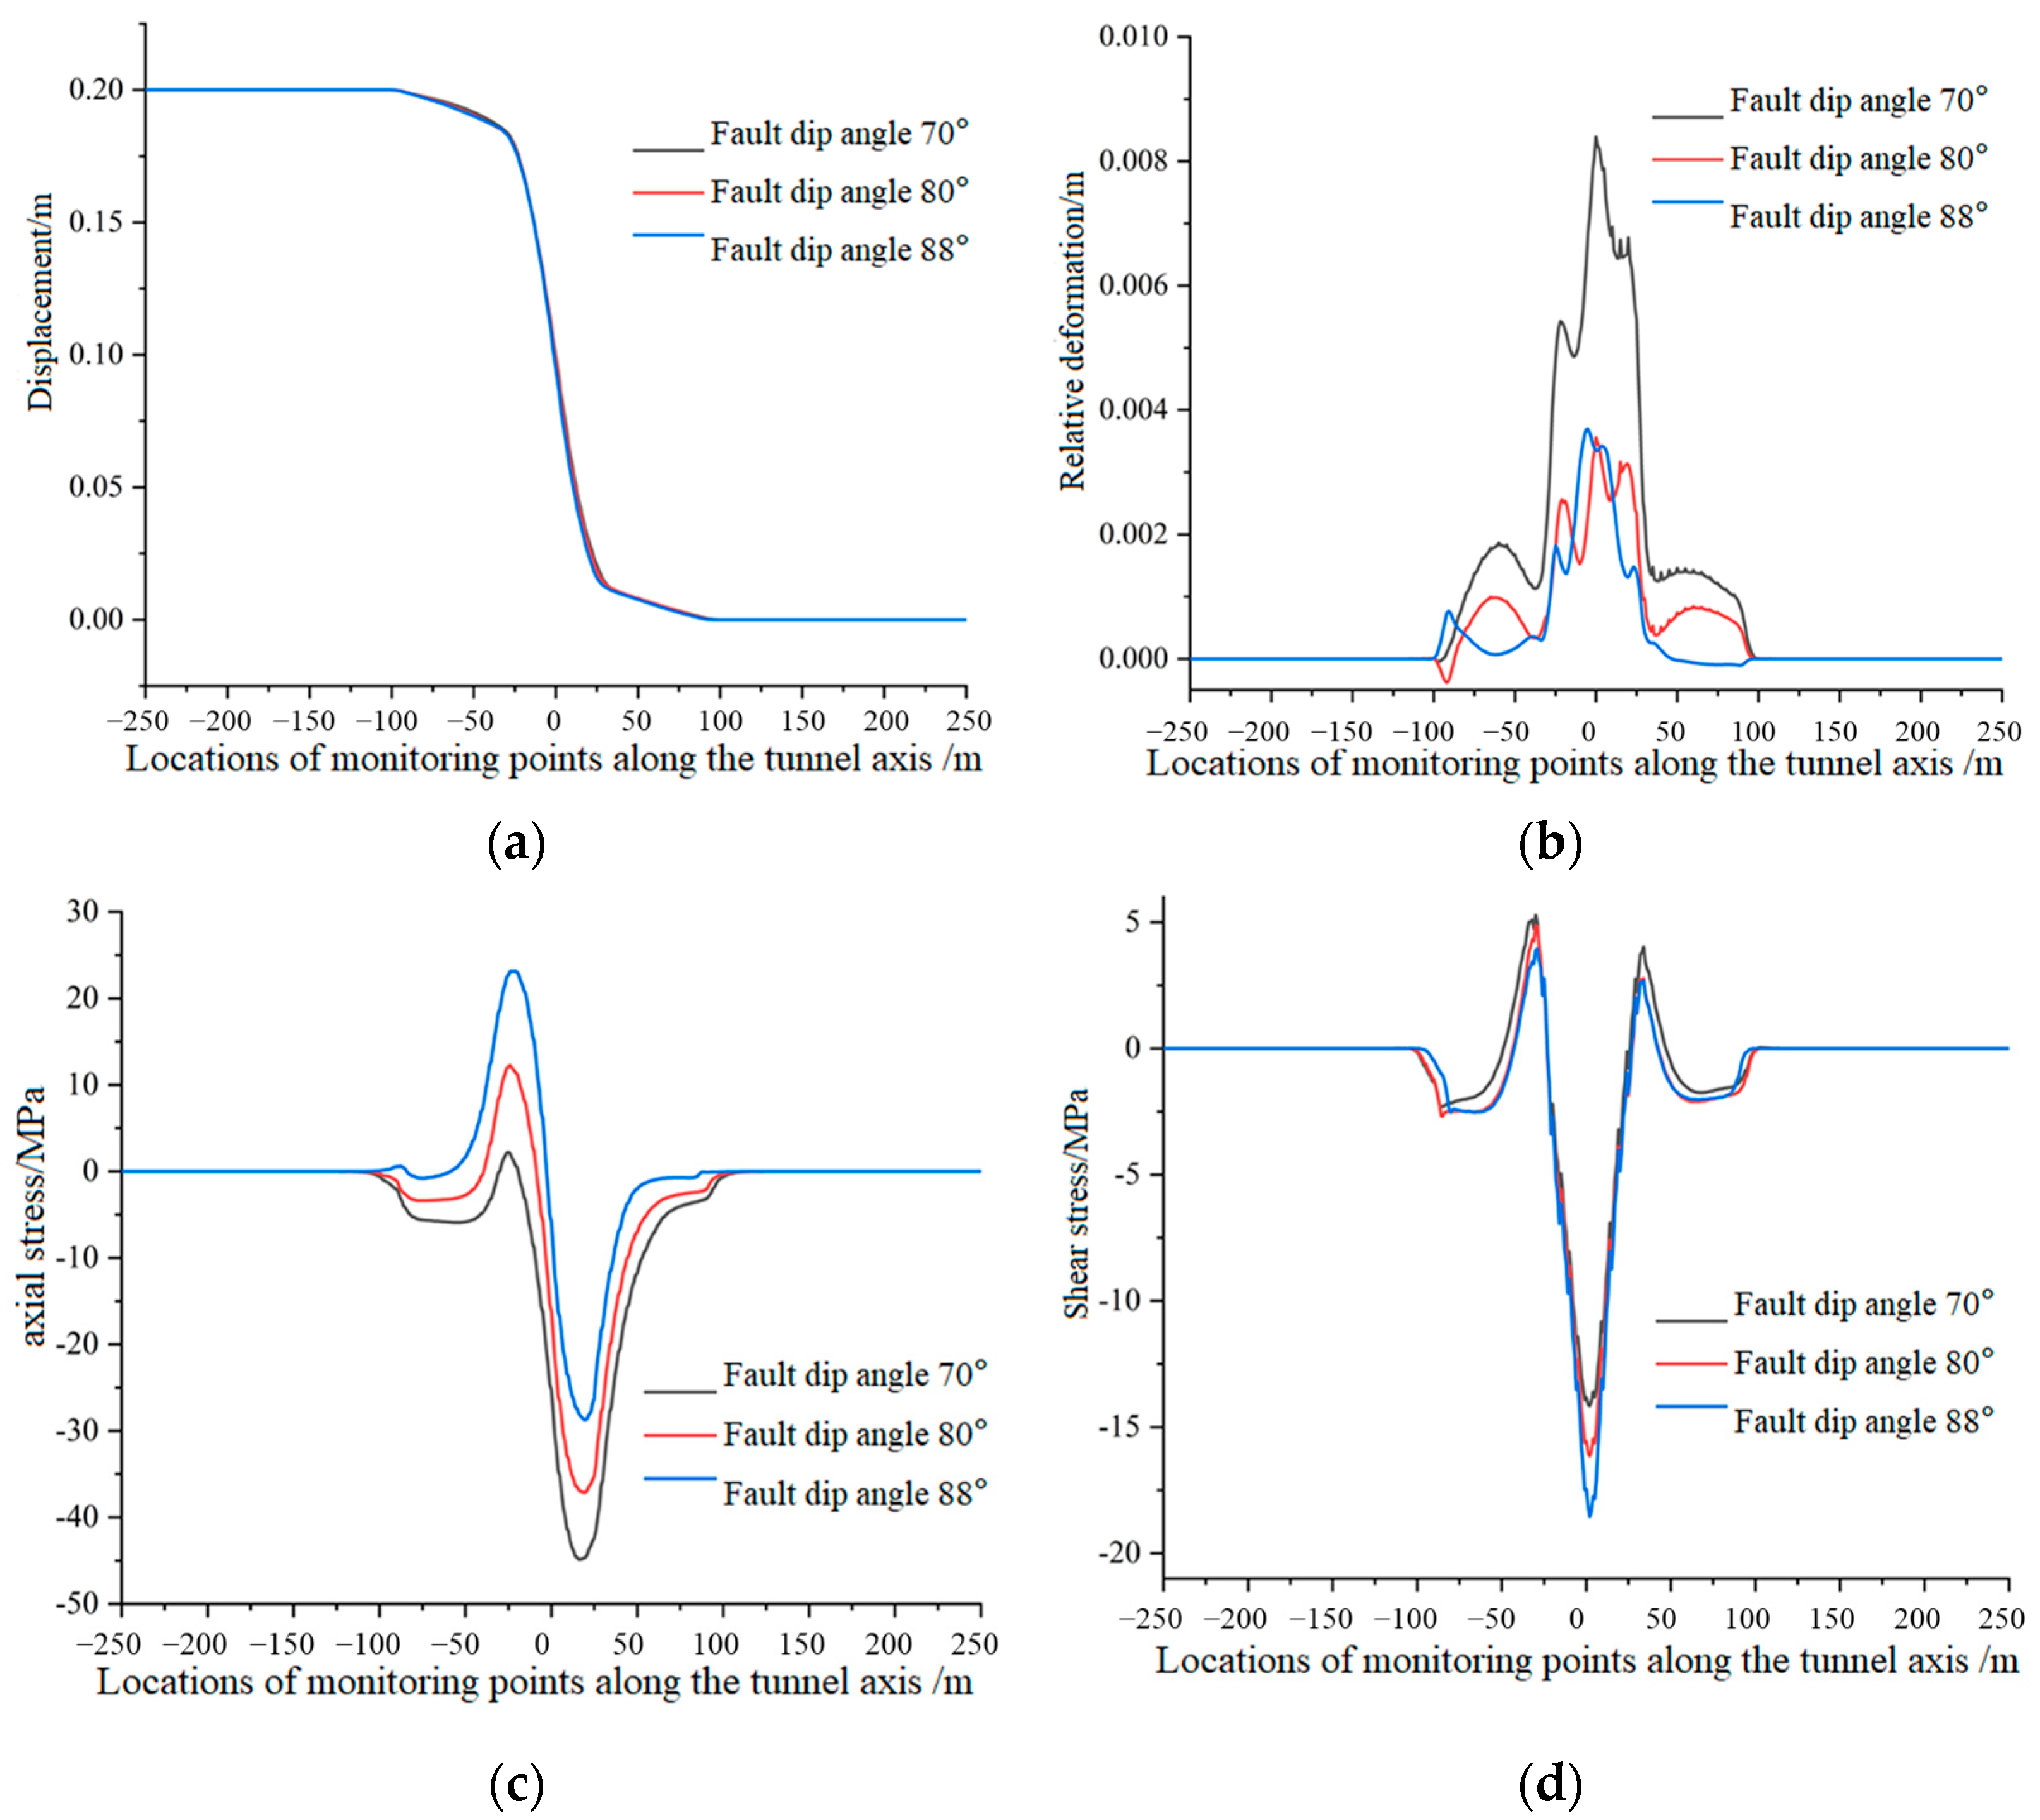
4.3. Fault Dip Angle
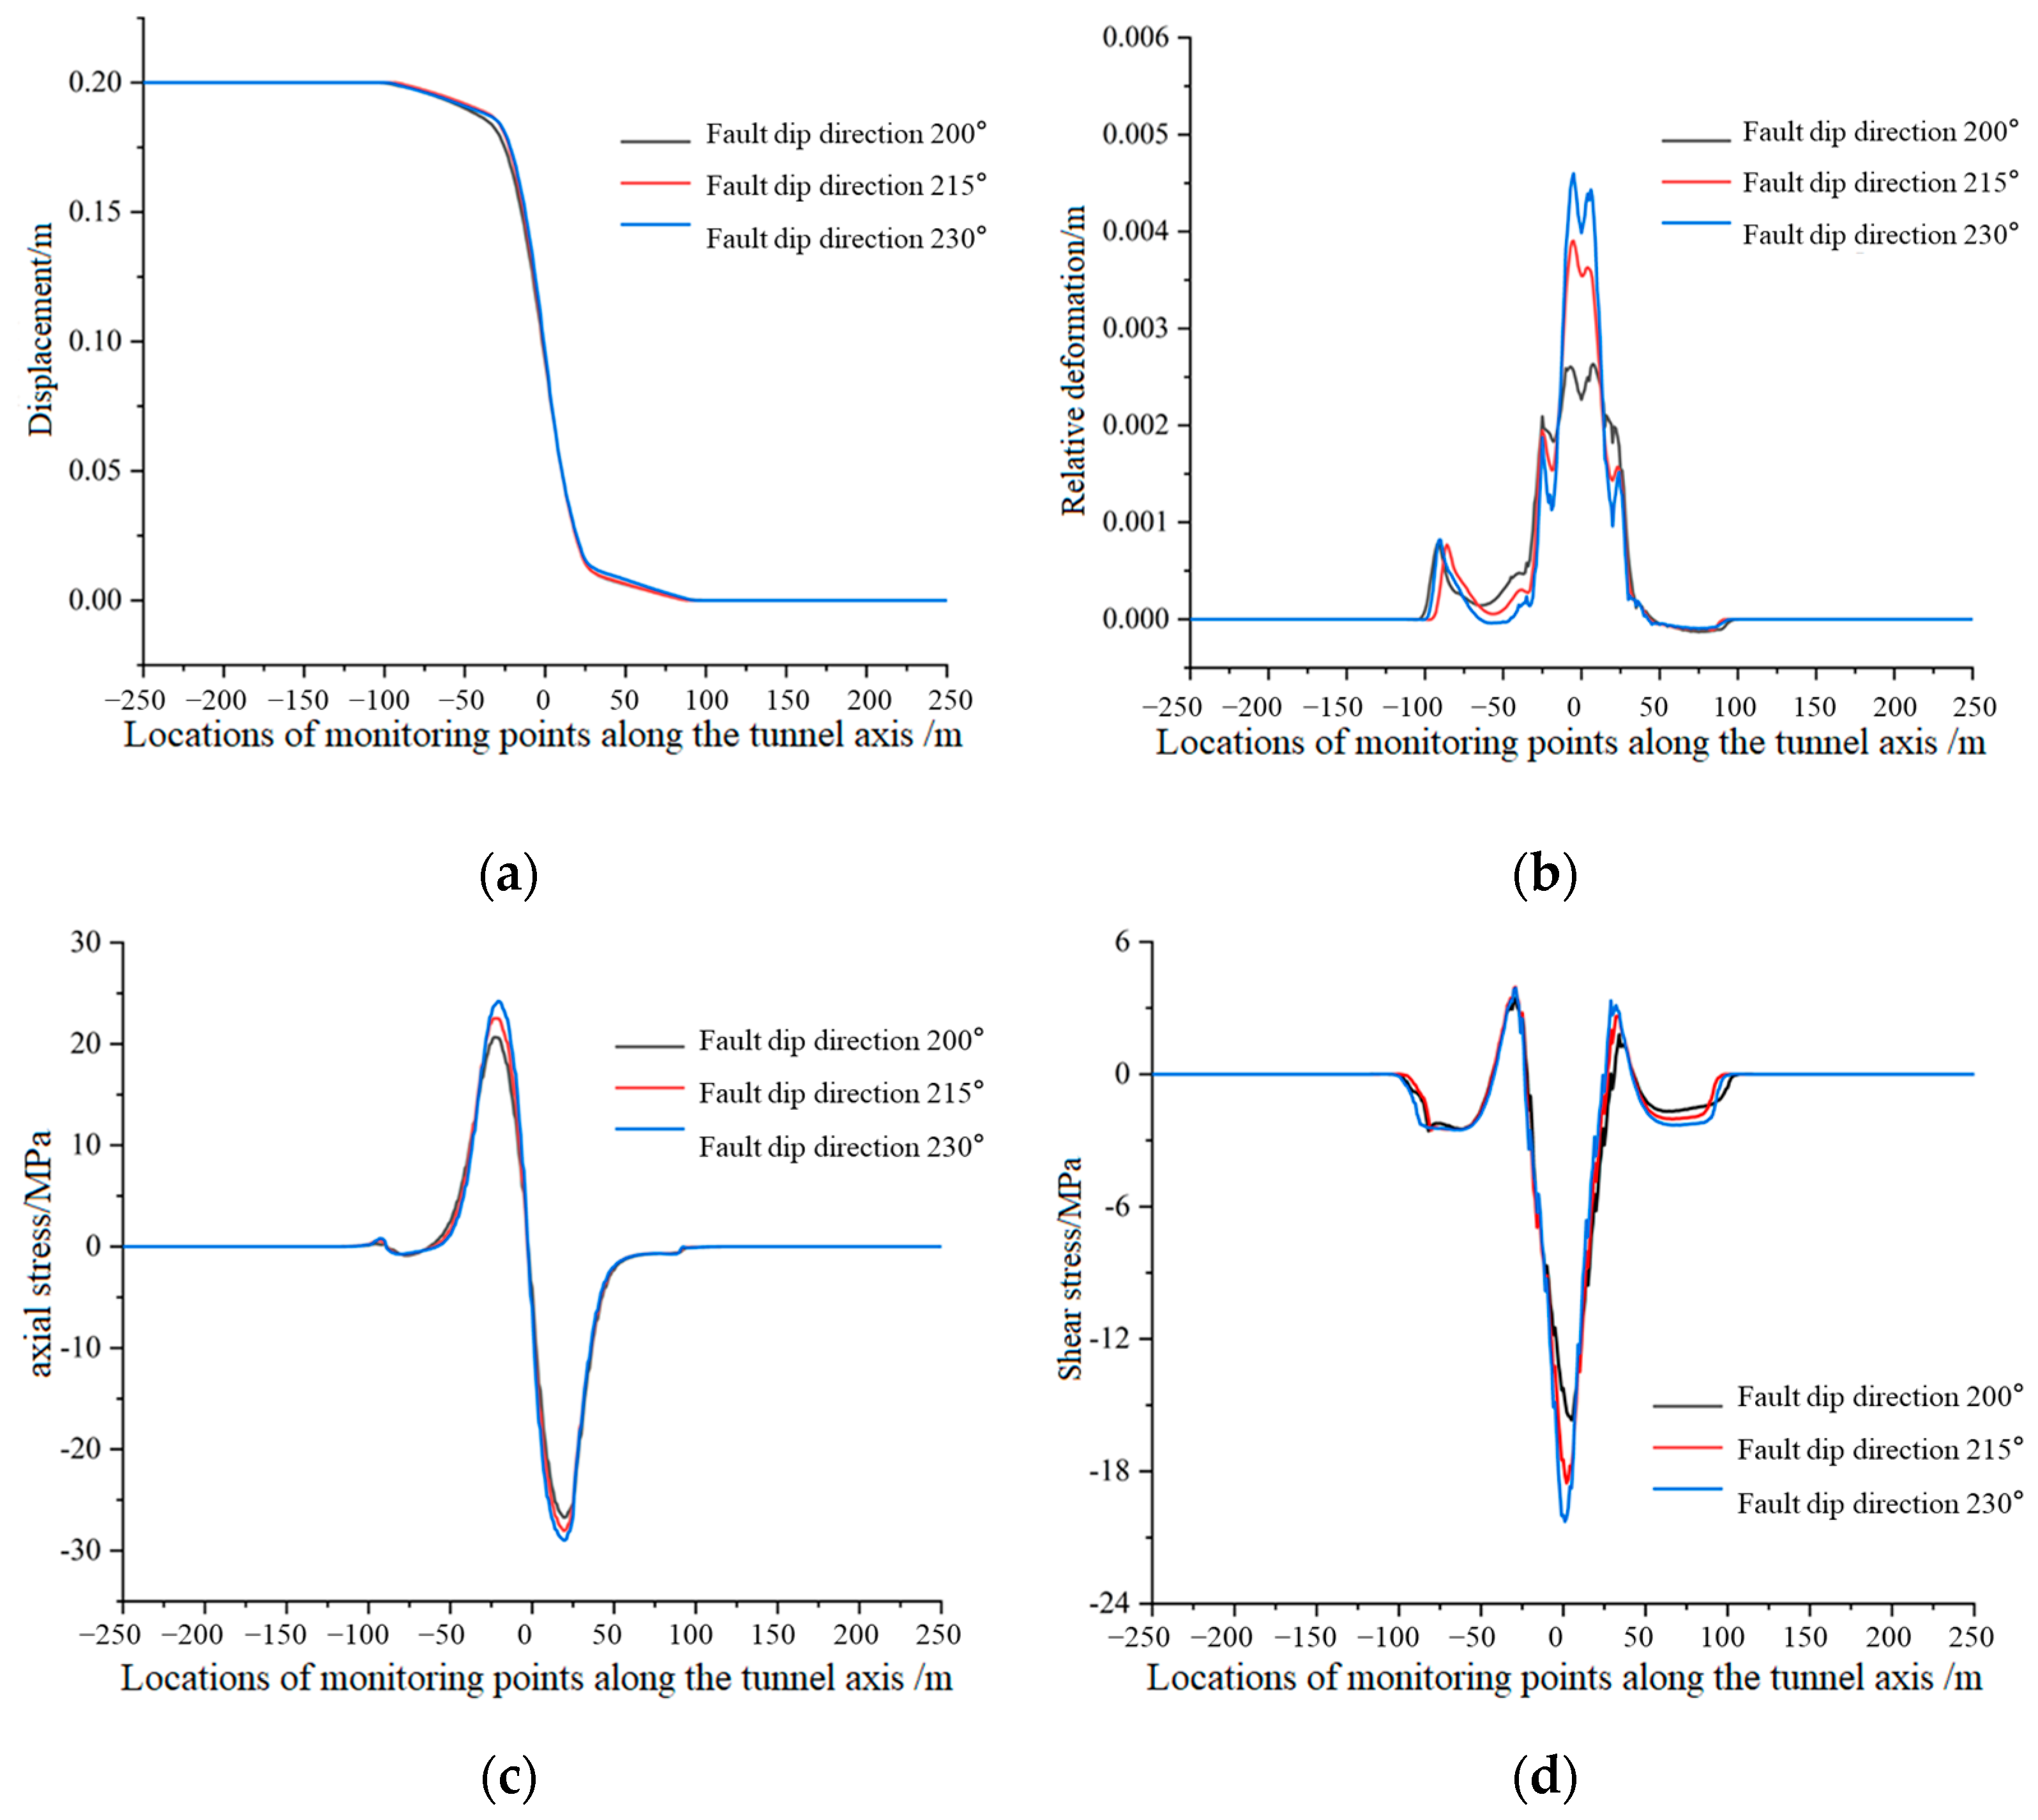
4.4. Fault Dip Direction
4.5. Discussion
5. Conclusions
- (1)
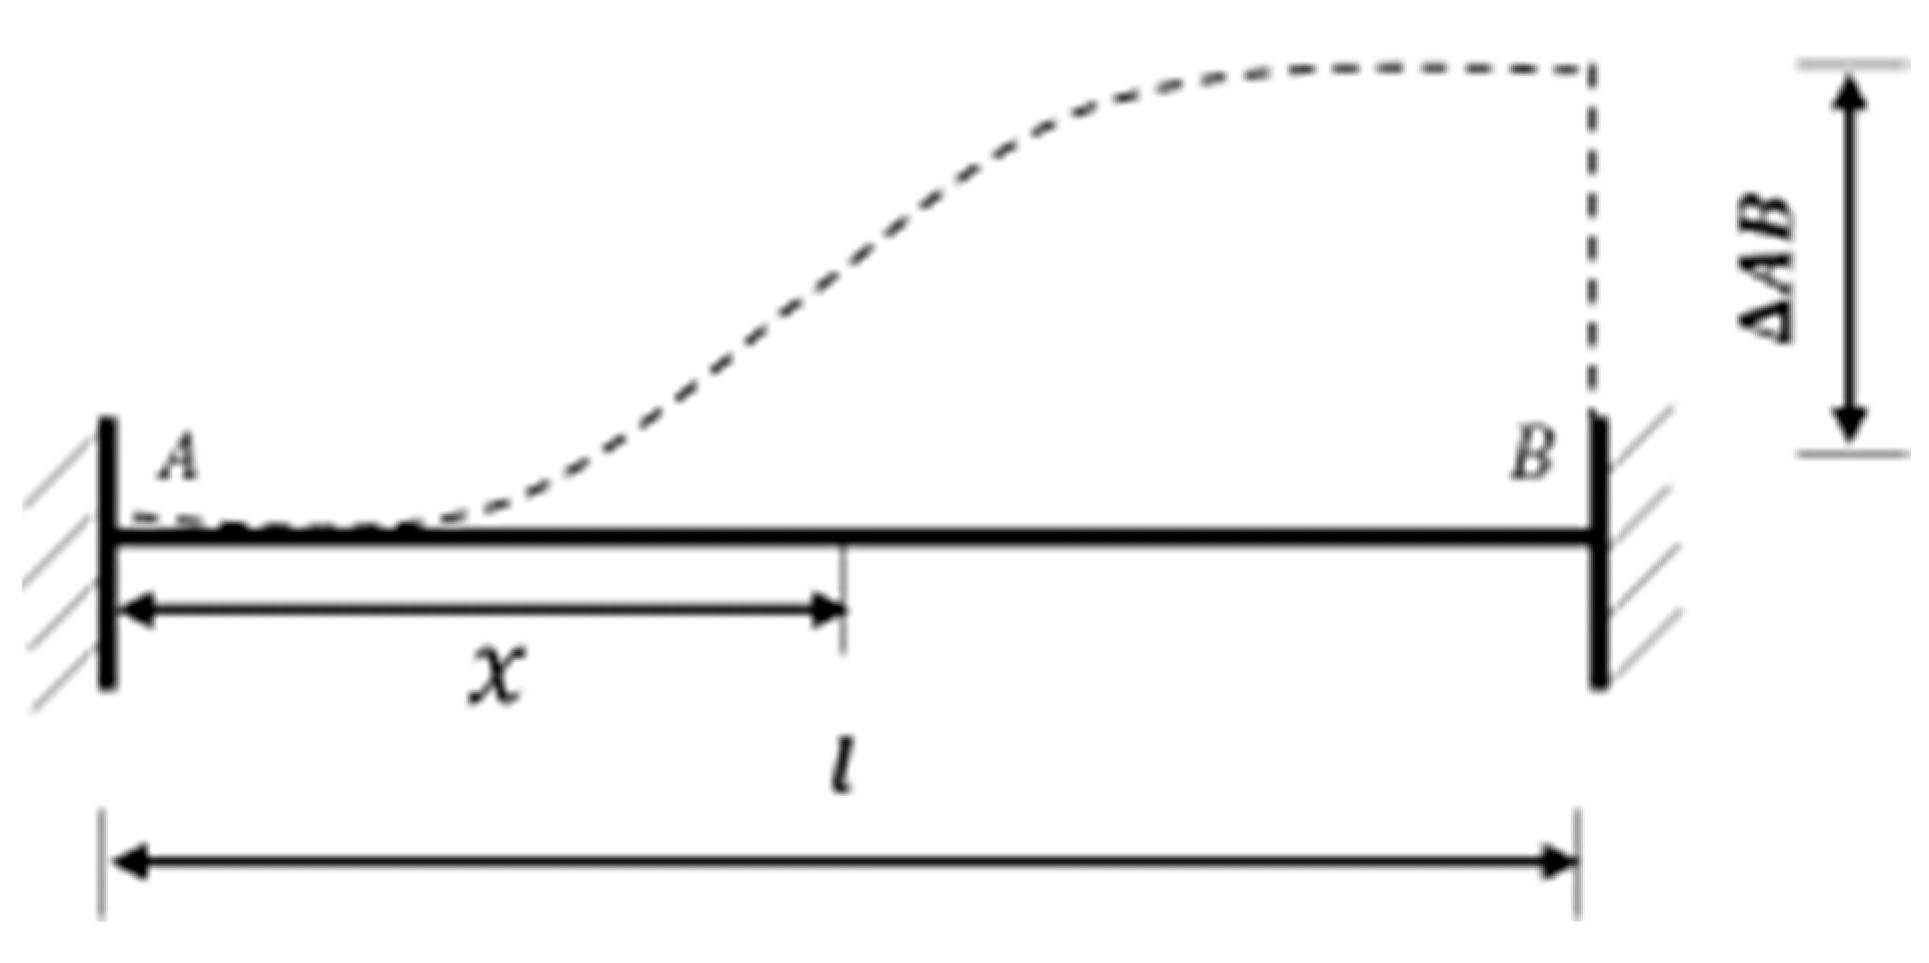
- Three fault dislocation deformation patterns (uniform, linear, nonlinear) were categorized, and their effects on tunnel lining deformation and stress were analyzed. The results show that although the distribution patterns of lining stress and deformation under different patterns are similar, the peak values and influence intensities differ. For example, the maximum relative deformation and shear stress of the lining occur at the rupture plane, while the maximum axial stress appears at the interface between soft and hard rock masses.
- (2)
- The influence of fault geometric parameters (core width, total zone width, dip angle, and dip direction) on the mechanical response of the tunnel linings was explored. Reducing the core width and the total zone width, or increasing the fault dip direction, intensifies the mechanical response. Decreasing the dip angle transitions the axial stress from tensile-compressive to compressive, reduces shear stress, and increases relative deformation intensity. Numerical evidence shows that a 33.3% reduction in core width increases relative deformation by 57.1%, highlighting the sensitivity of narrow fault cores to stress concentration.
- (3)
- This study provides a systematic analysis of reverse fault geometric parameters, filling a gap in the prior research tradition, which lacked comprehensive parameter sensitivity analysis. The classification of nonlinear deformation modes, considering complex fault internal structures, offers a more accurate prediction of stress distribution. These findings can guide tunnel design in active fault zones, such as reinforcing the interface between fault cores and influence zones and adjusting lining parameters based on the dip angle/direction.
- (4)
- Limitations include the focus on static creep slip without dynamic seismic loading or fluid pressure effects, and the simplified mechanical parameters of the surrounding rocks. Future research may integrate dynamic simulations and physical tests to explore coupled hydromechanical behaviors under seismic conditions. In addition to the geometric parameter changes of faults having an impact on the mechanical behavior of tunnels, the mechanical parameters of faults also have a significant influence on the mechanical behavior of tunnels. These works will be discussed in future studies.
Author Contributions
Funding
Data Availability Statement
Conflicts of Interest
References
- Zhang, X.P.; Jiang, Y.J.; Maegawa, K. Mountain tunnel under earthquake force: A review of possible causes of damages and restoration methods. J. Rock Mech. Geotech. Eng. 2020, 12, 414–426. [Google Scholar] [CrossRef]
- Asakura, T.; Sato, Y. Mountain tunnels damage in the 1995 Hyogoken-Nanbu earthquake. Q. Rep. RTRI 1998, 39, 9–16. Available online: https://www.zhangqiaokeyan.com/academic-journal-foreign_other_thesis/020417595042.html (accessed on 5 April 2025).
- Shen, Y.S.; Gao, B.; Yang, X.M.; Tao, S.J. Seismic damage mechanism and dynamic deformation characteristic analysis of mountain tunnel after Wenchuan earthquake. Eng. Geol. 2014, 180, 85–98. [Google Scholar] [CrossRef]
- Zhang, Y.F.; Yuan, K.; Zhou, W.J.; Fan, J.W. Study on structural deformation characteristics and surface crack distribution of girder tunnel across Lenglongling fault caused by Menyuan earthquake. Chin. J. Rock Mech. Eng. 2023, 42, 1055–1069. [Google Scholar] [CrossRef]
- Cui, Z.; Zhang, J.W.; Sheng, Q. Development and application of a model test device for active fault tunnels crossing complex fault under high in-situ stress environment. Chin. J. Rock Mech. Eng. 2023, 43, 1080–1095. [Google Scholar] [CrossRef]
- Liu, X.Z.; Wang, X.L.; Lin, L.L. Model experimental study on influence of normal fault with 60 dip angle stick-slip dislocation on mountain tunnel. China Civ. Eng. J. 2014, 47, 121–128. [Google Scholar] [CrossRef]
- Liu, X.Z.; Wang, X.L.; Lin, L.L. Model experiment on effect of normal fault with 75 dip angle stick-slip dislocation on highway tunnel. Chin. J. Rock Mech. Eng. 2013, 32, 1714–1720. Available online: https://rockmech.whrsm.ac.cn/CN/abstract/abstract28221.shtml (accessed on 4 April 2025).
- Zhou, G.; Sheng, Q.; Zhang, C.; Yan, T.; Cui, Z.; Li, J.; Wang, T. Study on action mechanism of anti-dislocation design parameters of a tunnel with flexible joint crossing strike-slip faults. Chin. J. Rock Mech. Eng. 2022, 41, 941–953. [Google Scholar] [CrossRef]
- Liu, X.Y.; Zhang, C.Q.; Shi, T.Y.; Zhou, H.; Hu, D.W.; Zhu, G.J.; Zhu, Y.; Wang, C. Experimental study of axis displacement mode of deep buried tunnel across active faults. Rock Soil Mech. 2021, 42, 1304–1312. [Google Scholar] [CrossRef]
- Sun, F.; Zhang, Z.; Qin, C. Research on influence upon tunnel structure of metro line 1 in Urumqi forced by normal fault dislocation. China Railw. Sci. 2019, 40, 54–63. Available online: http://zgtk.publish.founderss.cn/thesisDetails?columnId=2910057&Fpath=home&index=0&lang=zh (accessed on 5 April 2025).
- Yan, X.; Yu, H.T.; Chen, Z.W.; Jiang, W.; Li, T.T. A multiscale analysis of adjacent fault dislocation mechanism induced by tunnel excavation based on continuous-discrete coupling method. Tunn. Undergr. Space Technol. 2023, 140, 105263. [Google Scholar] [CrossRef]
- Zhang, S.Q.; Hou, S.J.; Jiang, C.B.; Cheng, H.; Jiang, Z.H.; Zhang, F.S. Numerical analysis of tunnel deformation under the slip of strike-slip fault. Mod. Tunn. Technol. 2020, 57, 418–424. [Google Scholar] [CrossRef]
- Gao, J.Q.; Wang, Q.Y.; Wang, R.; Yang, J.; Yang, Y.W. Model test study on the deformation and failure characteristics of mountain tunnel under a strike-slip fault dislocation. Structures 2024, 60, 105903. [Google Scholar] [CrossRef]
- Xiong, W.; Fan, W.; Peng, J.B.; Deng, L.S.; Yan, F.R. Numerical analysis of effect of normal fault activity on road mountain tunnel project. Chin. J. Rock Mech. Eng. 2010, 29, 2845–2852. Available online: https://rockmech.whrsm.ac.cn/CN/abstract/abstract19639.shtml (accessed on 5 April 2025).
- Kiani, M.; Akhlaghi, T.; Ghalandarzadeh, A. Experimental modeling of segmental shallow tunnels in alluvial affected by normal faults. Tunn. Undergr. Space Technol. 2016, 51, 108–119. [Google Scholar] [CrossRef]
- Xu, W.T.; Xu, H.C.; Shi, C.Z.; Wu, H.G.; Zhang, C.; Li, D.Z. Adaptation of multi-layer flexible stacked linings of pressure water transmission tunnels subjected to fault creep. Chin. J. Geotech. Eng. 2024, 46, 998–1007. [Google Scholar] [CrossRef]
- GB/T50218–2014; Standards Compilation Group of People’s Republic of China. Standard for Engineering Classification of Rock Masses. China Planning Press: Beijing, China, 2014.
- Wang, Z.; Zhong, Z.L.; Huang, J.Q.; Zhao, M.; Du, X.L. Deformation and damage evolution of critical cross sections of mountain tunnels under strike-slip fault movement. J. Build. Struct. 2020, 41, 425–433. [Google Scholar] [CrossRef]
- Wang, Z.; Zhong, Z.L.; Zhao, M.; Du, X.L.; Huang, J.Q. Simulation of normal fault rupture and its impact on mountain tunnels. Chin. J. Geotech. Eng. 2020, 42, 1876–1884. [Google Scholar] [CrossRef]
- Tang, L.Z.; Yu, L.; Wang, Y.S.; Wang, Z.H.; Wang, M.N. Numerical analysis on the effect of strike-slip fault dislocation on the structural safety of railway tunnels. Mod. Tunn. Technol. 2022, 59, 214–224. [Google Scholar] [CrossRef]
- Qi, B.X.; Wang, F.; Chen, J.L. Numerical simulation on structural response of tunnel passing through fault under the action of stick slip fault dislocation. Build. Struct. 2020, 50, 753–758. Available online: https://kns.cnki.net/kcms2/article/abstract?v=eo3P1e0toG7s0jQGeqIw6FNw_t-fhpieZ-o4CIKuNm8pR9yX9o_imfHyE8iUJmVH3luqgAr4BX8P8Lu8WBIa1VrRBIY5VxyXVMeYPzEb3CkgmZLTS3Of9M6FKT2qrH0ld_3RJJRnPnUxPJd-FnslOy9-0xIewZXlYQD5NV5lIg8VSsd7FrT1hLjBTPhnNqjt&uniplatform=NZKPT&language=CHS (accessed on 5 April 2025).


| Materials Name | Wall Rock Grade | Density (kg/m3) | Elastic Modulus (GPa) | Poisson’s Cohesion | Friction Ratio | Angle (°) |
|---|---|---|---|---|---|---|
| Hanging wall | III | 2600 | 6.0 | 0.29 | 3.0 | 37 |
| Affected zone | IV | 2250 | 4.3 | 0.31 | 0.5 | 31 |
| Core of fault zone | IV | 1650 | 1.0 | 0.35 | 0.2 | 23 |
| Lining | - | 2500 | 30.0 | 0.20 | 2.0 | 25 |
| Boundary Conditions Name | Model Composition | Rupture Surface Position | Fixed Area | Displacement Application | |
|---|---|---|---|---|---|
| Hanging Wall | Fault Zone | ||||
| Type I | Lining, hanging wall, footwall, and fracture zone | Center of the fracture zone | Footwall | Uniform displacement | / |
| Type II | Lining, hanging wall, footwall, and fracture zone | Center of the fracture zone | Footwall | Uniform displacement | Linear displacement |
| Type III | Lining, hanging wall, footwall, and fracture zone | Center of the fracture zone | Footwall | Uniform displacement | Nonlinear displacement |
Disclaimer/Publisher’s Note: The statements, opinions and data contained in all publications are solely those of the individual author(s) and contributor(s) and not of MDPI and/or the editor(s). MDPI and/or the editor(s) disclaim responsibility for any injury to people or property resulting from any ideas, methods, instructions or products referred to in the content. |
© 2025 by the authors. Licensee MDPI, Basel, Switzerland. This article is an open access article distributed under the terms and conditions of the Creative Commons Attribution (CC BY) license (https://creativecommons.org/licenses/by/4.0/).
Share and Cite
Zhang, Y.; Sun, X.; Di, S.; Cui, Z. Numerical Analysis on the Effect of Geometric Parameters of Reverse Fault on Tunnel Mechanical Response. Buildings 2025, 15, 1704. https://doi.org/10.3390/buildings15101704
Zhang Y, Sun X, Di S, Cui Z. Numerical Analysis on the Effect of Geometric Parameters of Reverse Fault on Tunnel Mechanical Response. Buildings. 2025; 15(10):1704. https://doi.org/10.3390/buildings15101704
Chicago/Turabian StyleZhang, Ying, Xin Sun, Shengjie Di, and Zhen Cui. 2025. "Numerical Analysis on the Effect of Geometric Parameters of Reverse Fault on Tunnel Mechanical Response" Buildings 15, no. 10: 1704. https://doi.org/10.3390/buildings15101704
APA StyleZhang, Y., Sun, X., Di, S., & Cui, Z. (2025). Numerical Analysis on the Effect of Geometric Parameters of Reverse Fault on Tunnel Mechanical Response. Buildings, 15(10), 1704. https://doi.org/10.3390/buildings15101704